Cambridge IGCSE Science - Combined 0653 — 2023 May/June Paper 6 · Variant 3
0653/63/M/J/23 · 4 questions · 40 marks · ≈45 min
The question paper and its mark scheme, free to read here and free to download. This is Cambridge’s own paper, exactly as it was sat.
Question paper16 pages



Mark scheme9 pages
Answers below. Sit the paper first if you are practising.
Questions as text
Q1 · A student investigates the effect of temperature on the growth of mushrooms
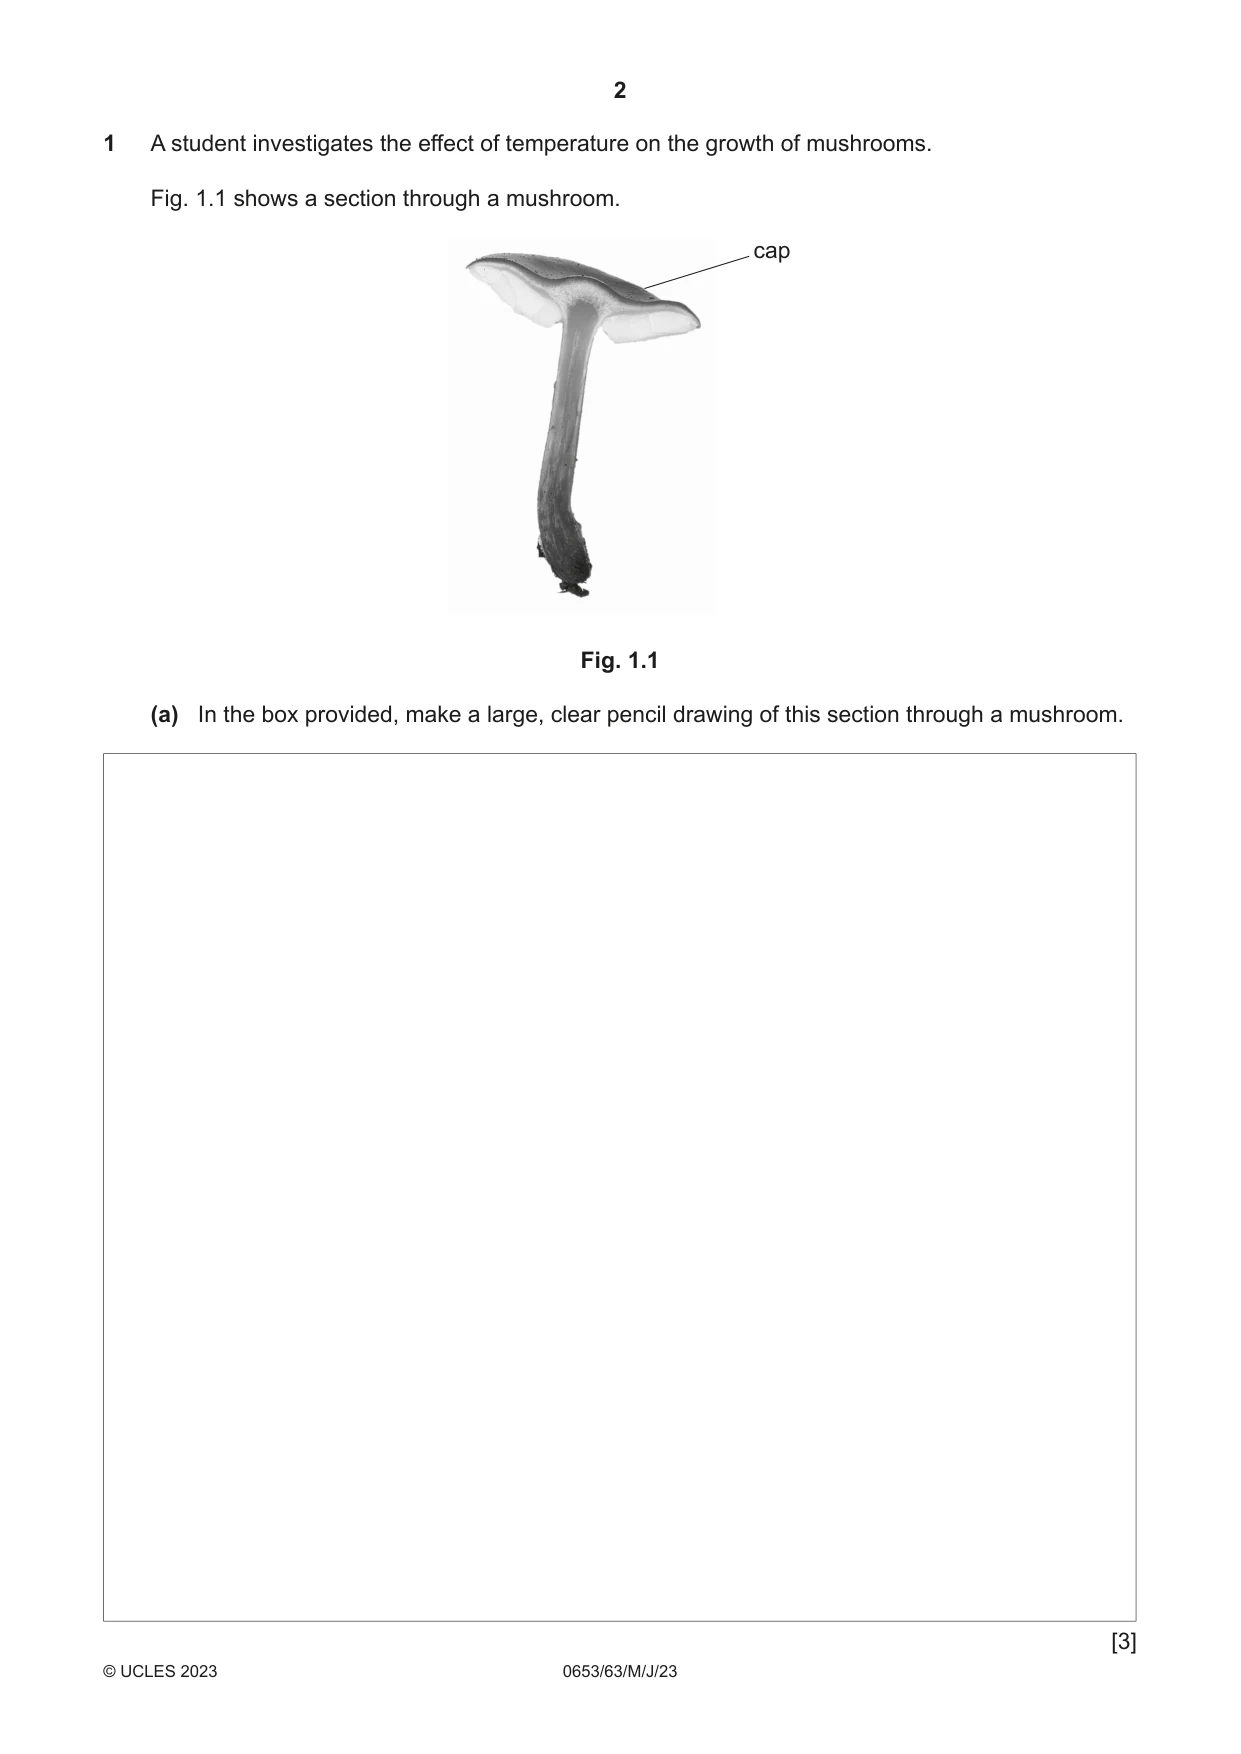
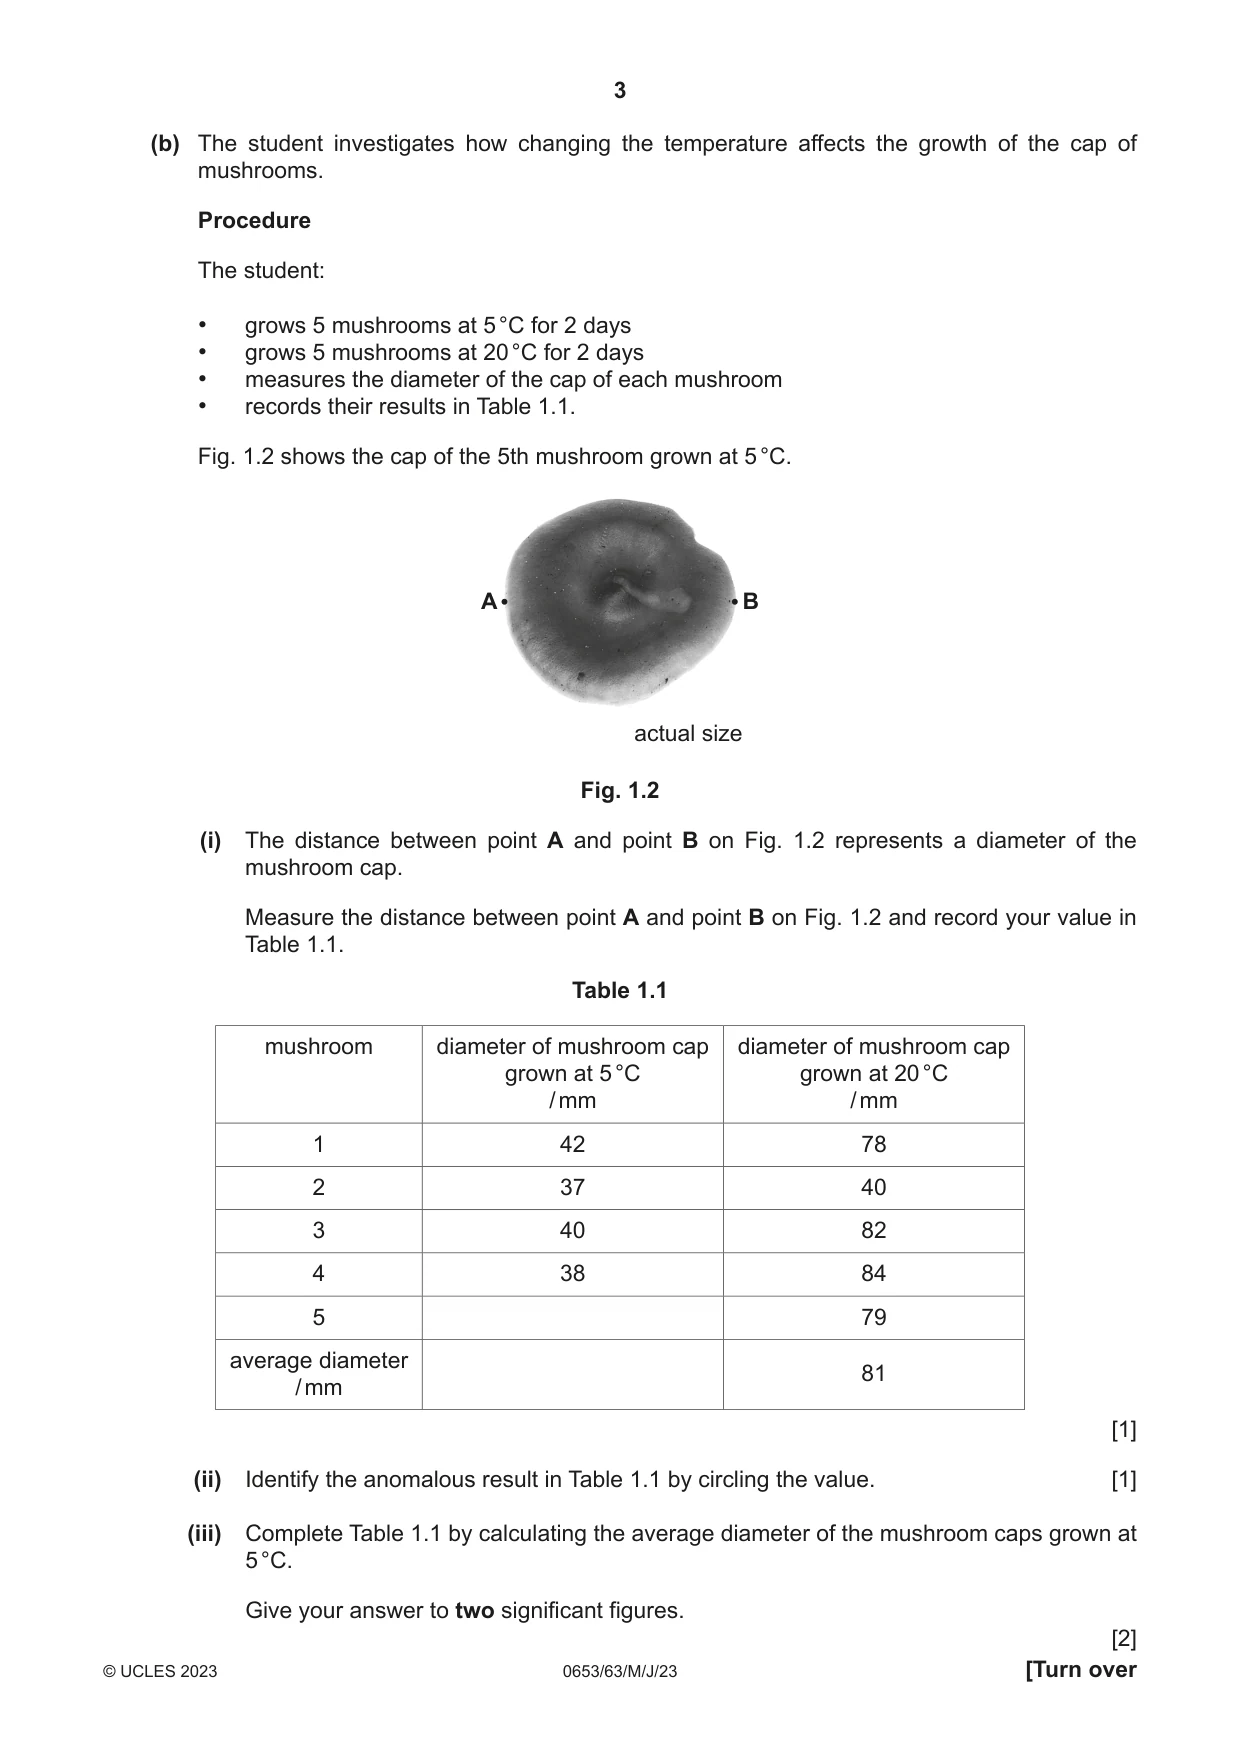
1 A student investigates the effect of temperature on the growth of mushrooms. Fig. 1.1 shows a section through a mushroom. cap Fig. 1.1 (a) In the box provided, make a large, clear pencil drawing of this section through a mushroom. [3] (b) The student investigates how changing the temperature affects the growth of the cap of mushrooms. Procedure The student: • grows 5 mushrooms at 5 °C for 2 days • grows 5 mushrooms at 20 °C for 2 days • measures the diameter of the cap of each mushroom • records their results in Table 1.1. Fig. 1.2 shows the cap of the 5th mushroom grown at 5 °C. A B actual size Fig. 1.2 (i) The distance between point A and point B on Fig. 1.2 represents a diameter of the mushroom cap. Measure the distance between point A and point B on Fig. 1.2 and record your value in Table 1.1. Table 1.1 mushroom diameter of mushroom cap diameter of mushroom cap grown at 5 °C grown at 20 °C / mm / mm 1 42 78 2 37 40 3 40 82 4 38 84 5 79 average diameter 81 / mm [1] (ii) Identify the anomalous result in Table 1.1 by circling the value. [1] (iii) Complete Table 1.1 by calculating the average diameter of the mushroom caps grown at 5 °C. Give your answer to two significant figures. [2] (iv) The student concludes that: “As the temperature increases to 30 °C, the mushroom caps will get larger.” Suggest why this conclusion is not correct. ........................................................................................................................................... ..................................................................................................................................... [1] (v) Identify one possible source of error when measuring the diameter of an actual mushroom cap. Suggest a method that reduces this error. error ................................................................................................................................... ........................................................................................................................................... improvement ..................................................................................................................... ........................................................................................................................................... [2] (vi) Describe one other way the investigation can be improved. ........................................................................................................................................... ..................................................................................................................................... [1] (c) Mushrooms grow best in slightly acidic soils. The student is given a sample of dry soil. Suggest how the pH of the soil sample is tested. ................................................................................................................................................... ................................................................................................................................................... ............................................................................................................................................. [2] [Total: 13]
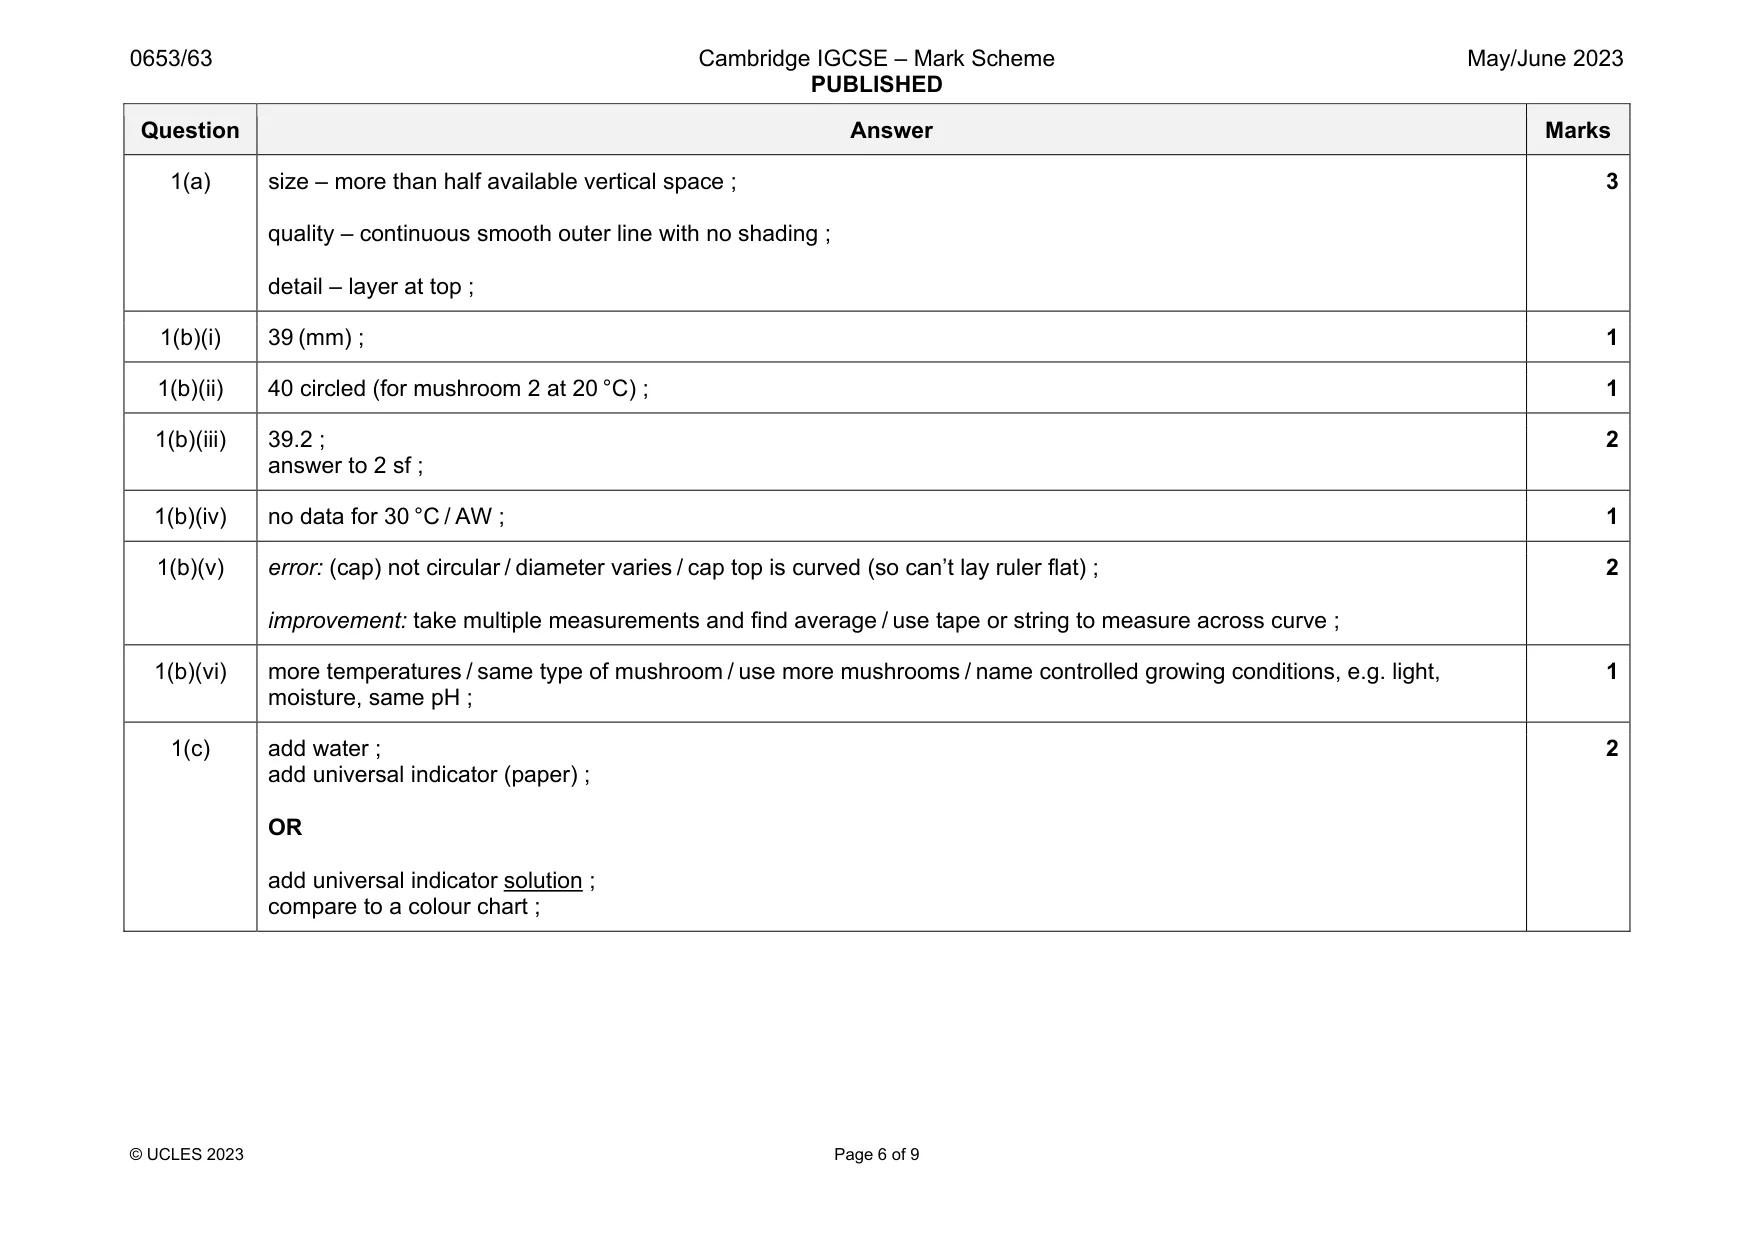
Mark scheme: 1(a) size – more than half available vertical space ; quality – continuous smooth outer line with no shading ; detail – layer at top ; 3 1(b)(i) 39 (mm) ; 1 1(b)(ii) 40 circled (for mushroom 2 at 20 °C) ; 1 1(b)(iii) 39.2 ; answer to 2 sf ; 2 1(b)(iv) no data for 30 °C / AW ; 1 1(b)(v) error: (cap) not circular / diameter varies / cap top is curved (so can’t lay ruler flat) ; improvement: take multiple measurements and find average / use tape or string to measure across curve ; 2 1(b)(vi) more temperatures / same type of mushroom / use more mushrooms / name controlled growing conditions, e.g. light, moisture, same pH ; 1 1(c) add water ; add universal indicator (paper) ; OR add universal indicator solution ; compare to a colour chart ; 2
Q2 · A student investigates a green solid H
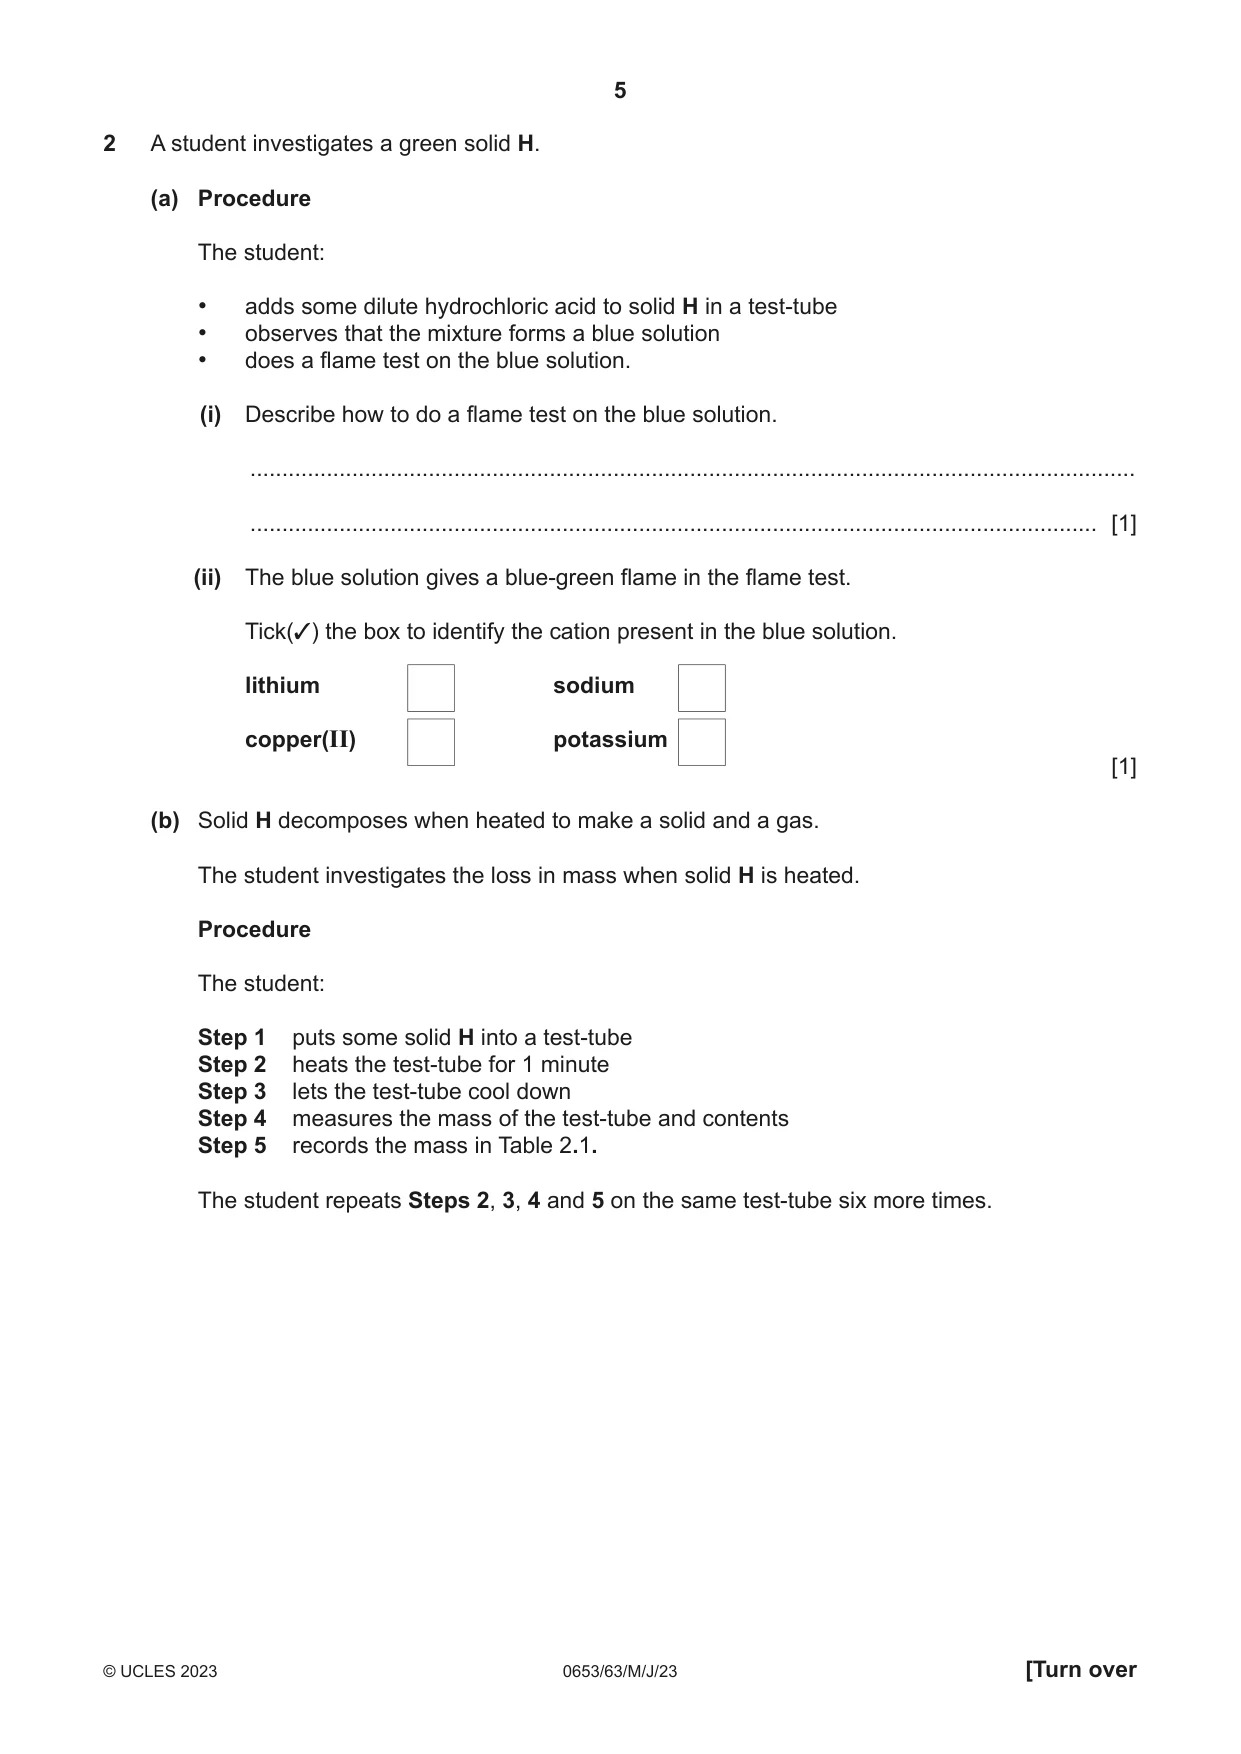
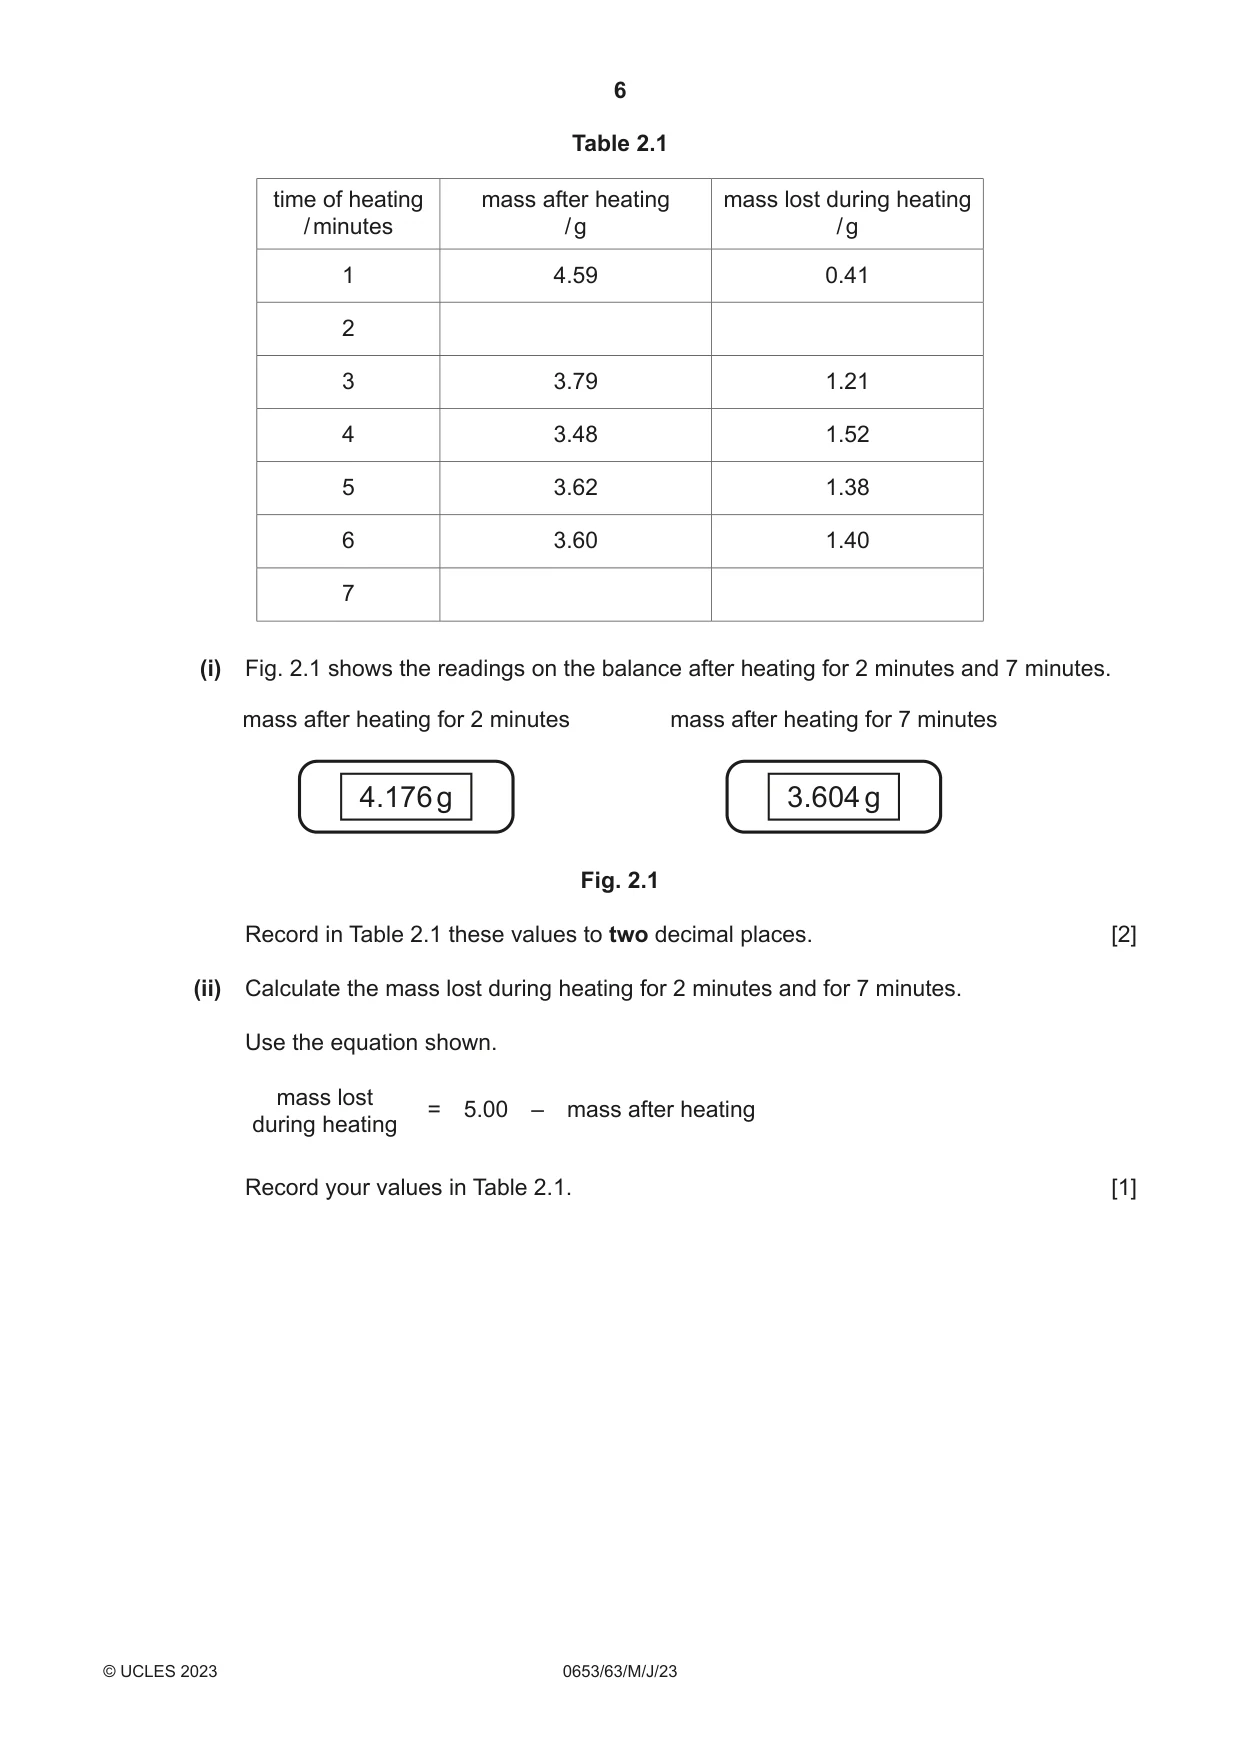
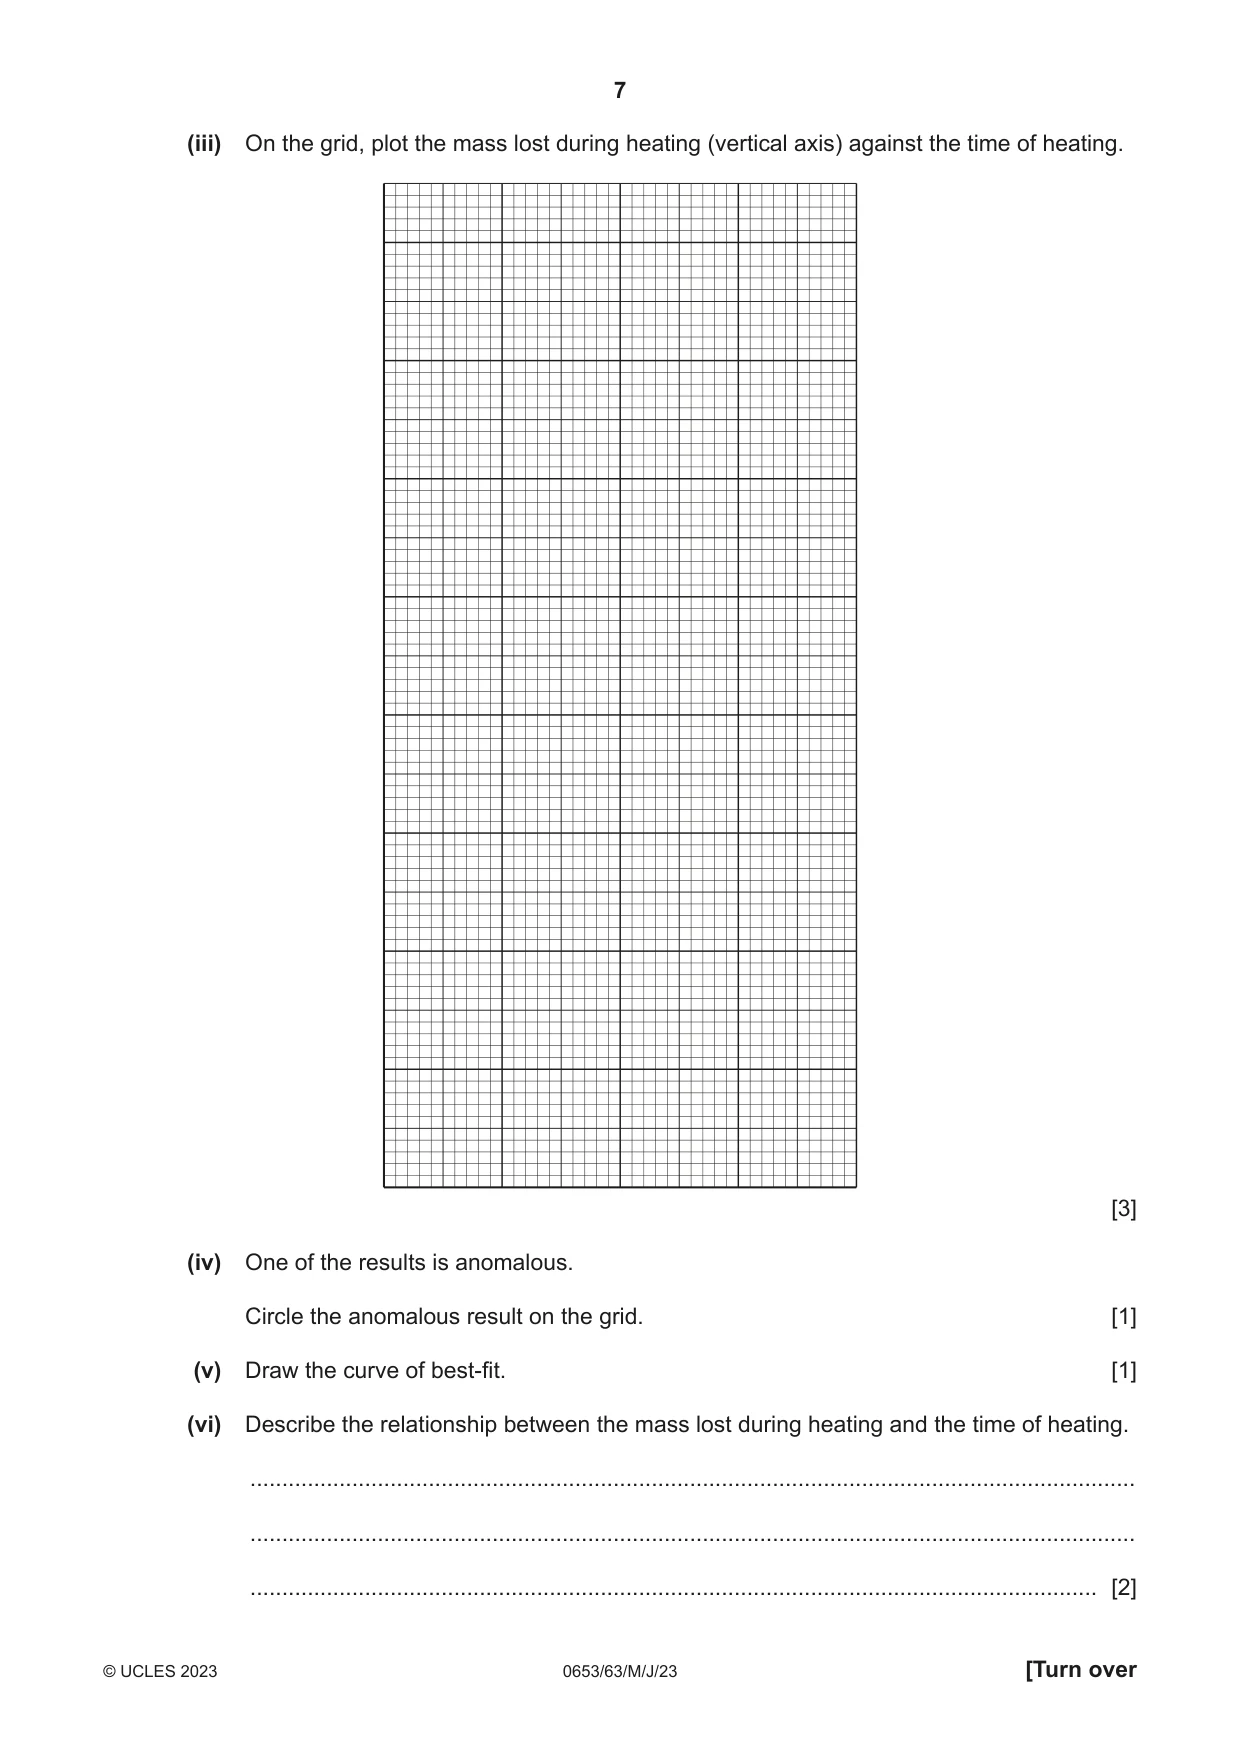
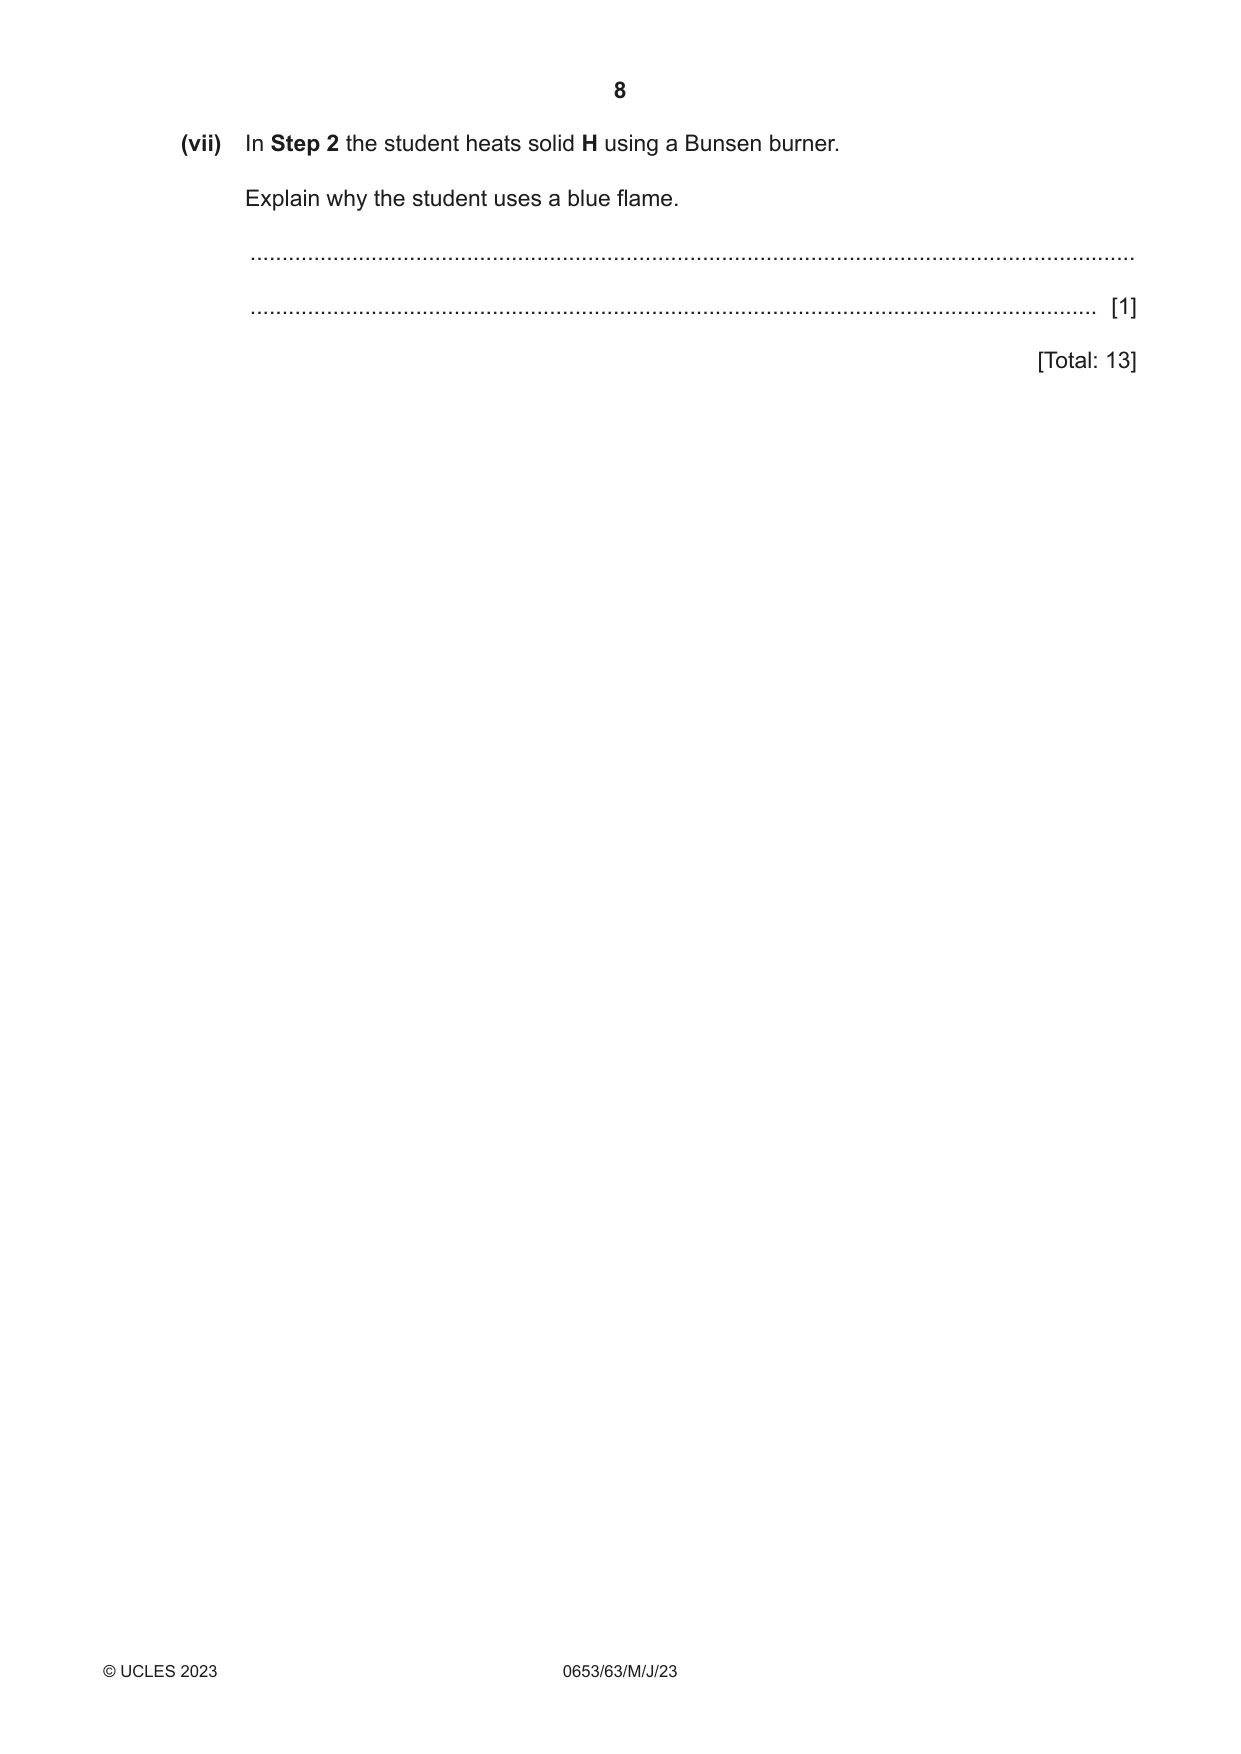
2 A student investigates a green solid H. (a) Procedure The student: • adds some dilute hydrochloric acid to solid H in a test-tube • observes that the mixture forms a blue solution • does a flame test on the blue solution. (i) Describe how to do a flame test on the blue solution. ........................................................................................................................................... ..................................................................................................................................... [1] (ii) The blue solution gives a blue-green flame in the flame test. Tick(✓) the box to identify the cation present in the blue solution. lithium sodium copper(II) potassium [1] (b) Solid H decomposes when heated to make a solid and a gas. The student investigates the loss in mass when solid H is heated. Procedure The student: Step 1 puts some solid H into a test-tube Step 2 heats the test-tube for 1 minute Step 3 lets the test-tube cool down Step 4 measures the mass of the test-tube and contents Step 5 records the mass in Table 2.1. The student repeats Steps 2, 3, 4 and 5 on the same test-tube six more times. Table 2.1 time of heating mass after heating mass lost during heating / minutes / g / g 1 4.59 0.41 2 3 3.79 1.21 4 3.48 1.52 5 3.62 1.38 6 3.60 1.40 7 (i) Fig. 2.1 shows the readings on the balance after heating for 2 minutes and 7 minutes. mass after heating for 2 minutes mass after heating for 7 minutes 4.176 g 3.604 g Fig. 2.1 Record in Table 2.1 these values to two decimal places. [2] (ii) Calculate the mass lost during heating for 2 minutes and for 7 minutes. Use the equation shown. mass lost = 5.00 – mass after heating during heating Record your values in Table 2.1. [1] (iii) On the grid, plot the mass lost during heating (vertical axis) against the time of heating. [3] (iv) One of the results is anomalous. Circle the anomalous result on the grid. [1] (v) Draw the curve of best-fit. [1] (vi) Describe the relationship between the mass lost during heating and the time of heating. ........................................................................................................................................... ........................................................................................................................................... ..................................................................................................................................... [2] (vii) In Step 2 the student heats solid H using a Bunsen burner. Explain why the student uses a blue flame. ........................................................................................................................................... ..................................................................................................................................... [1] [Total: 13]
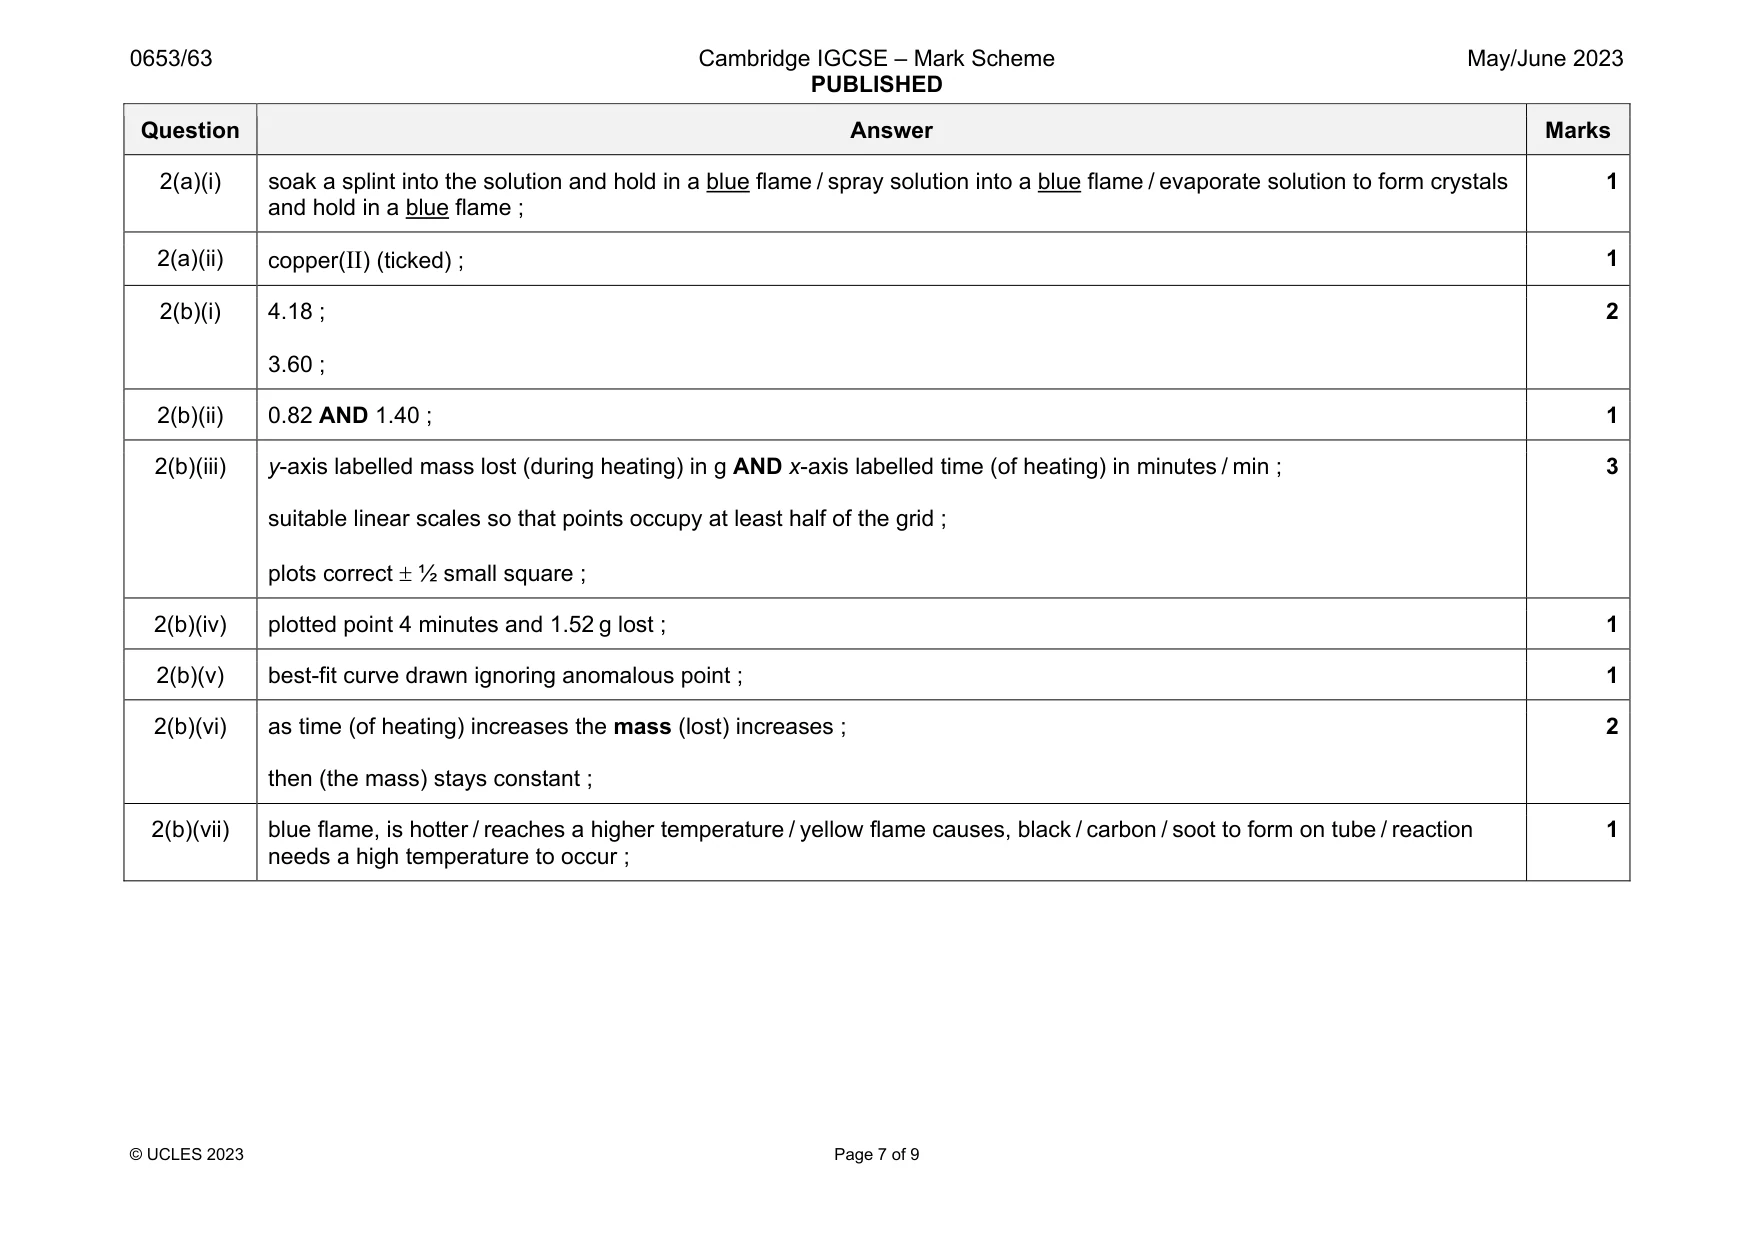
Mark scheme: 2(a)(i) soak a splint into the solution and hold in a blue flame / spray solution into a blue flame / evaporate solution to form crystals and hold in a blue flame ; 1 2(a)(ii) copper(II) (ticked) ; 1 2(b)(i) 4.18 ; 3.60 ; 2 2(b)(ii) 0.82 AND 1.40 ; 1 2(b)(iii) y-axis labelled mass lost (during heating) in g AND x-axis labelled time (of heating) in minutes / min ; suitable linear scales so that points occupy at least half of the grid ; plots correct ½ small square ; 3 2(b)(iv) plotted point 4 minutes and 1.52 g lost ; 1 2(b)(v) best-fit curve drawn ignoring anomalous point ; 1 2(b)(vi) as time (of heating) increases the mass (lost) increases ; then (the mass) stays constant ; 2 2(b)(vii) blue flame, is hotter / reaches a higher temperature / yellow flame causes, black / carbon / soot to form on tube / reaction needs a high temperature to occur ; 1
Q3 · A student investigates the period of oscillation of a spring when different loads are…
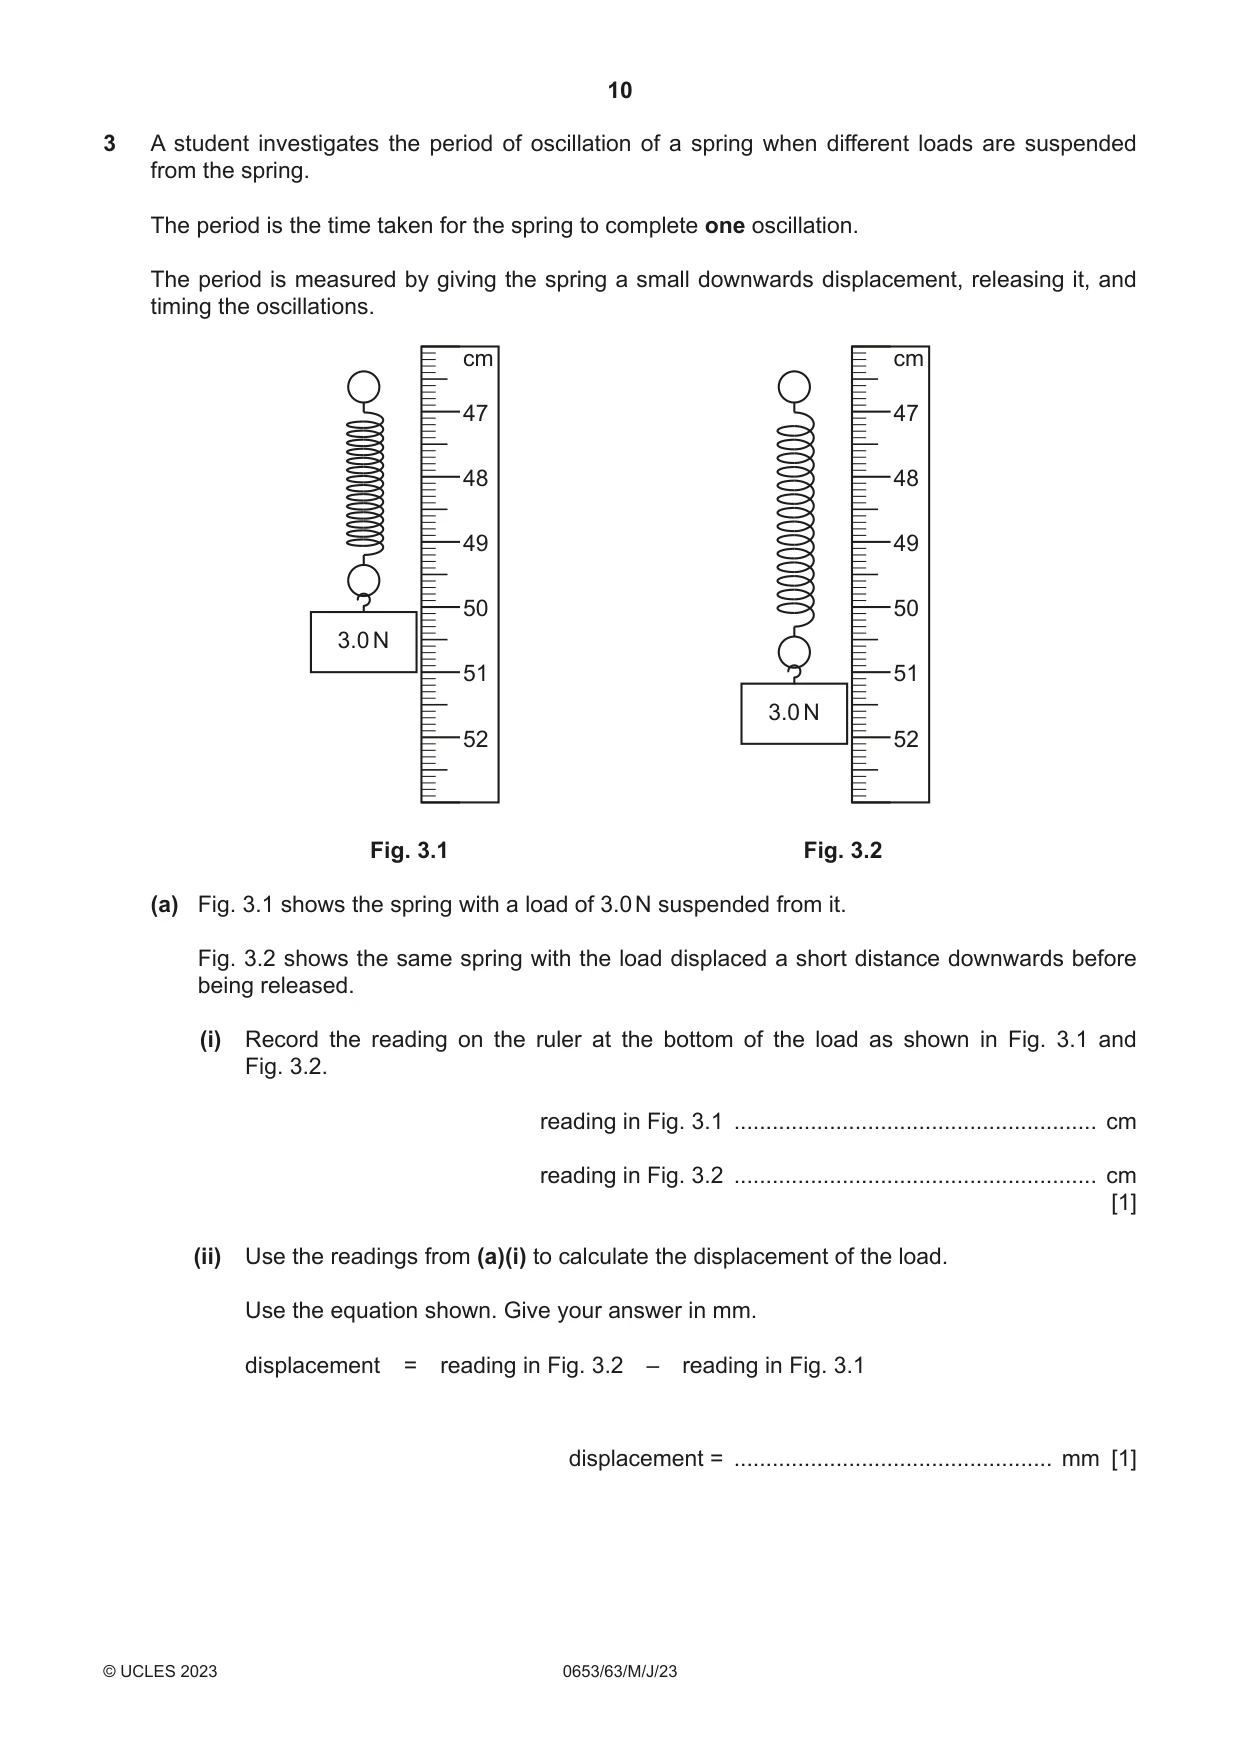
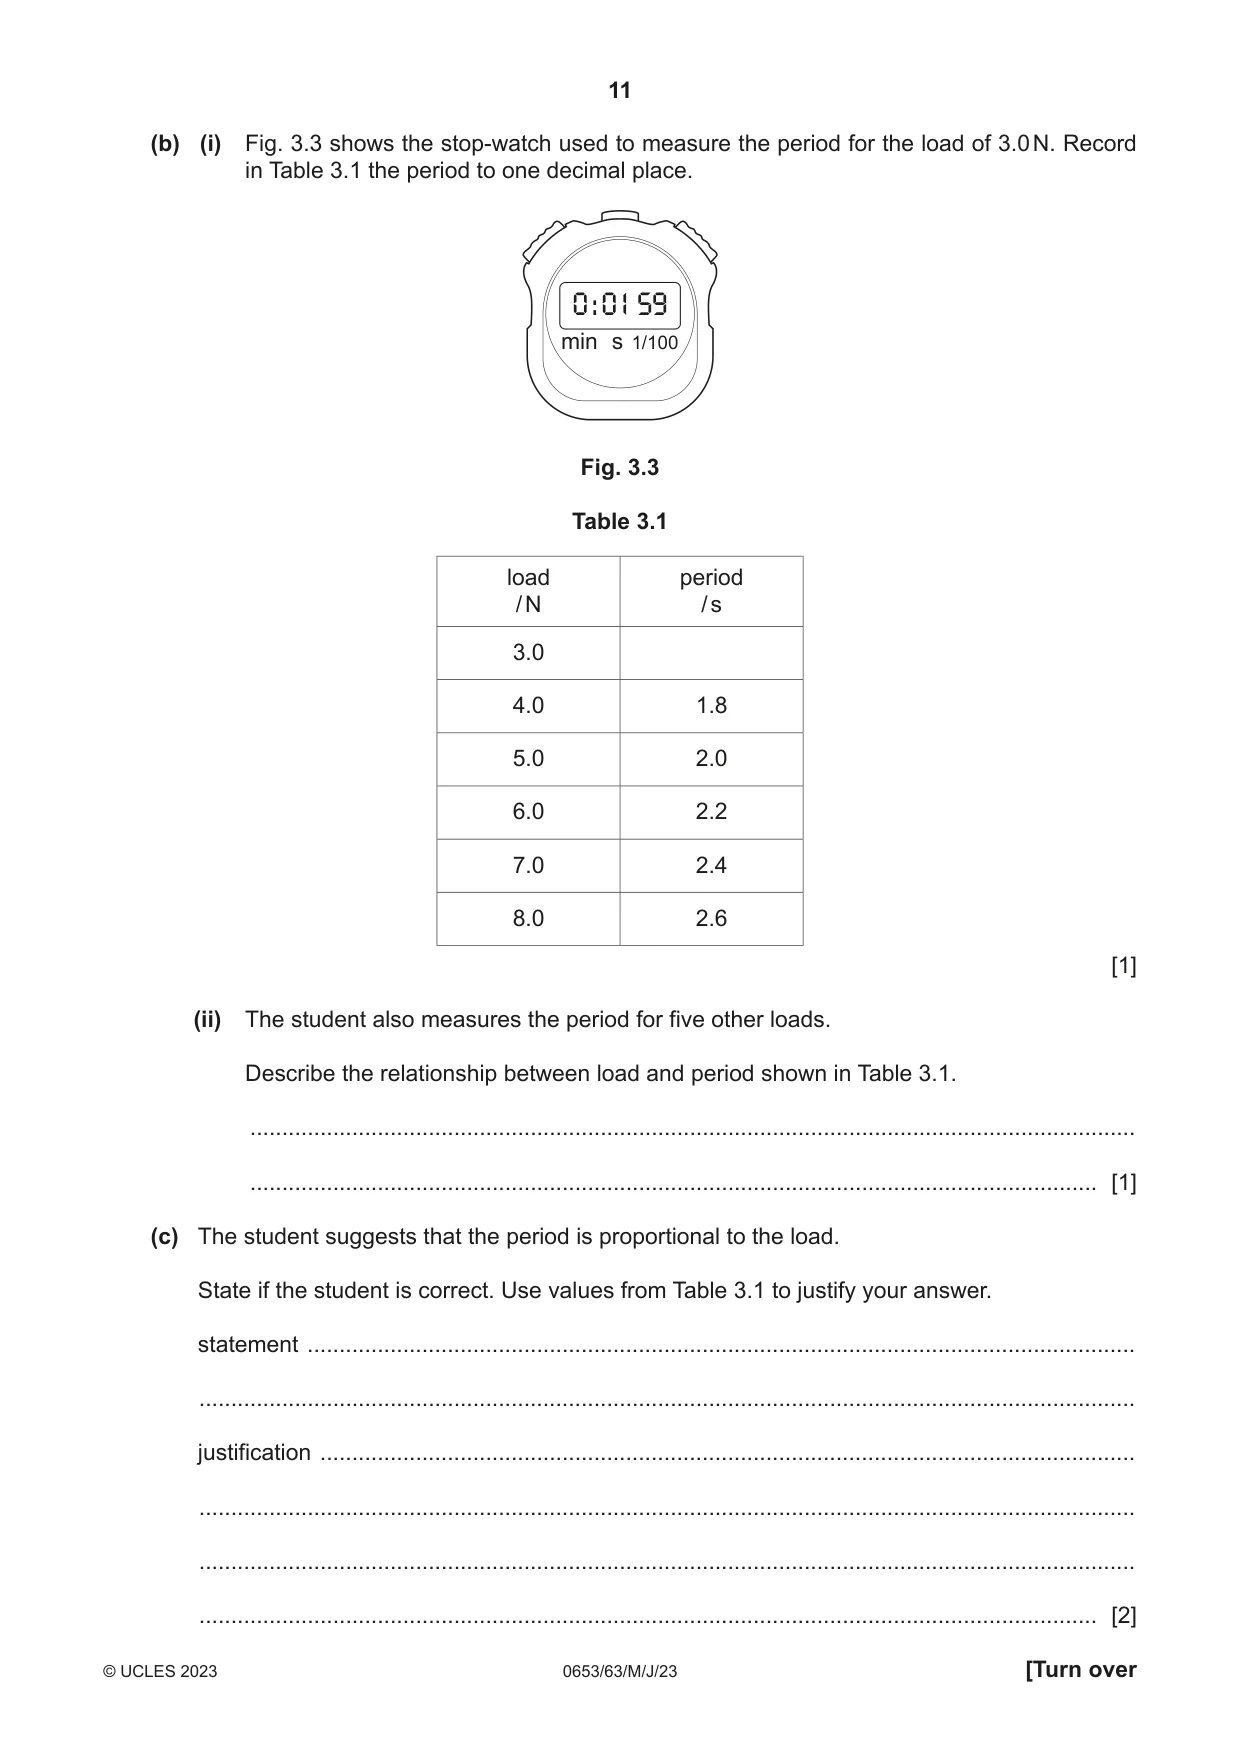
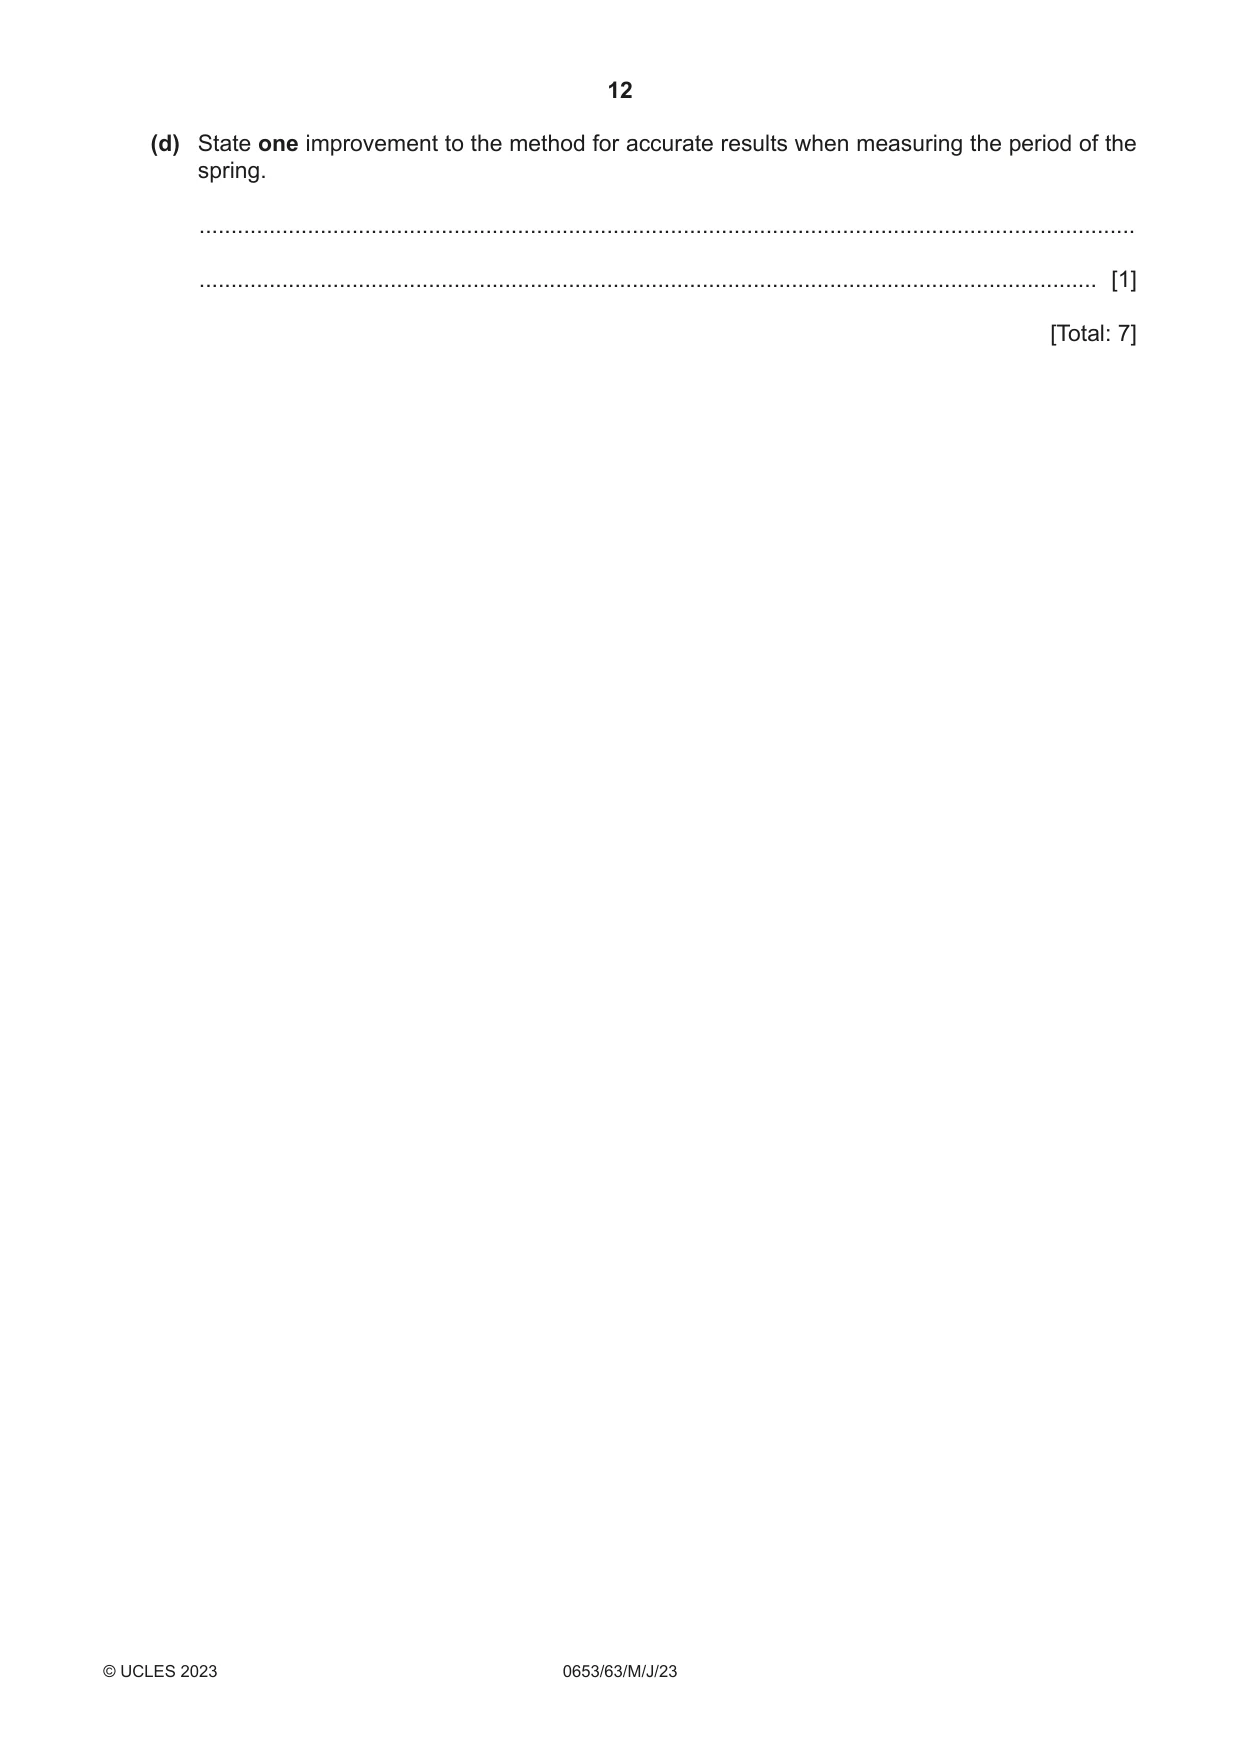
3 A student investigates the period of oscillation of a spring when different loads are suspended from the spring. The period is the time taken for the spring to complete one oscillation. The period is measured by giving the spring a small downwards displacement, releasing it, and timing the oscillations. cm cm 47 47 48 48 49 49 50 50 3.0 N 51 51 3.0 N 52 52 Fig. 3.1 Fig. 3.2 (a) Fig. 3.1 shows the spring with a load of 3.0 N suspended from it. Fig. 3.2 shows the same spring with the load displaced a short distance downwards before being released. (i) Record the reading on the ruler at the bottom of the load as shown in Fig. 3.1 and Fig. 3.2. reading in Fig. 3.1 ......................................................... cm reading in Fig. 3.2 ......................................................... cm [1] (ii) Use the readings from (a)(i) to calculate the displacement of the load. Use the equation shown. Give your answer in mm. displacement = reading in Fig. 3.2 – reading in Fig. 3.1 displacement = .................................................. mm [1] (b) (i) Fig. 3.3 shows the stop-watch used to measure the period for the load of 3.0 N. Record in Table 3.1 the period to one decimal place. 0 : 01 59 min s 1/100 Fig. 3.3 Table 3.1 load period / N / s 3.0 4.0 1.8 5.0 2.0 6.0 2.2 7.0 2.4 8.0 2.6 [1] (ii) The student also measures the period for five other loads. Describe the relationship between load and period shown in Table 3.1. ........................................................................................................................................... ..................................................................................................................................... [1] (c) The student suggests that the period is proportional to the load. State if the student is correct. Use values from Table 3.1 to justify your answer. statement .................................................................................................................................. ................................................................................................................................................... justification ................................................................................................................................ ................................................................................................................................................... ................................................................................................................................................... ............................................................................................................................................. [2] (d) State one improvement to the method for accurate results when measuring the period of the spring. ................................................................................................................................................... ............................................................................................................................................. [1] [Total: 7]
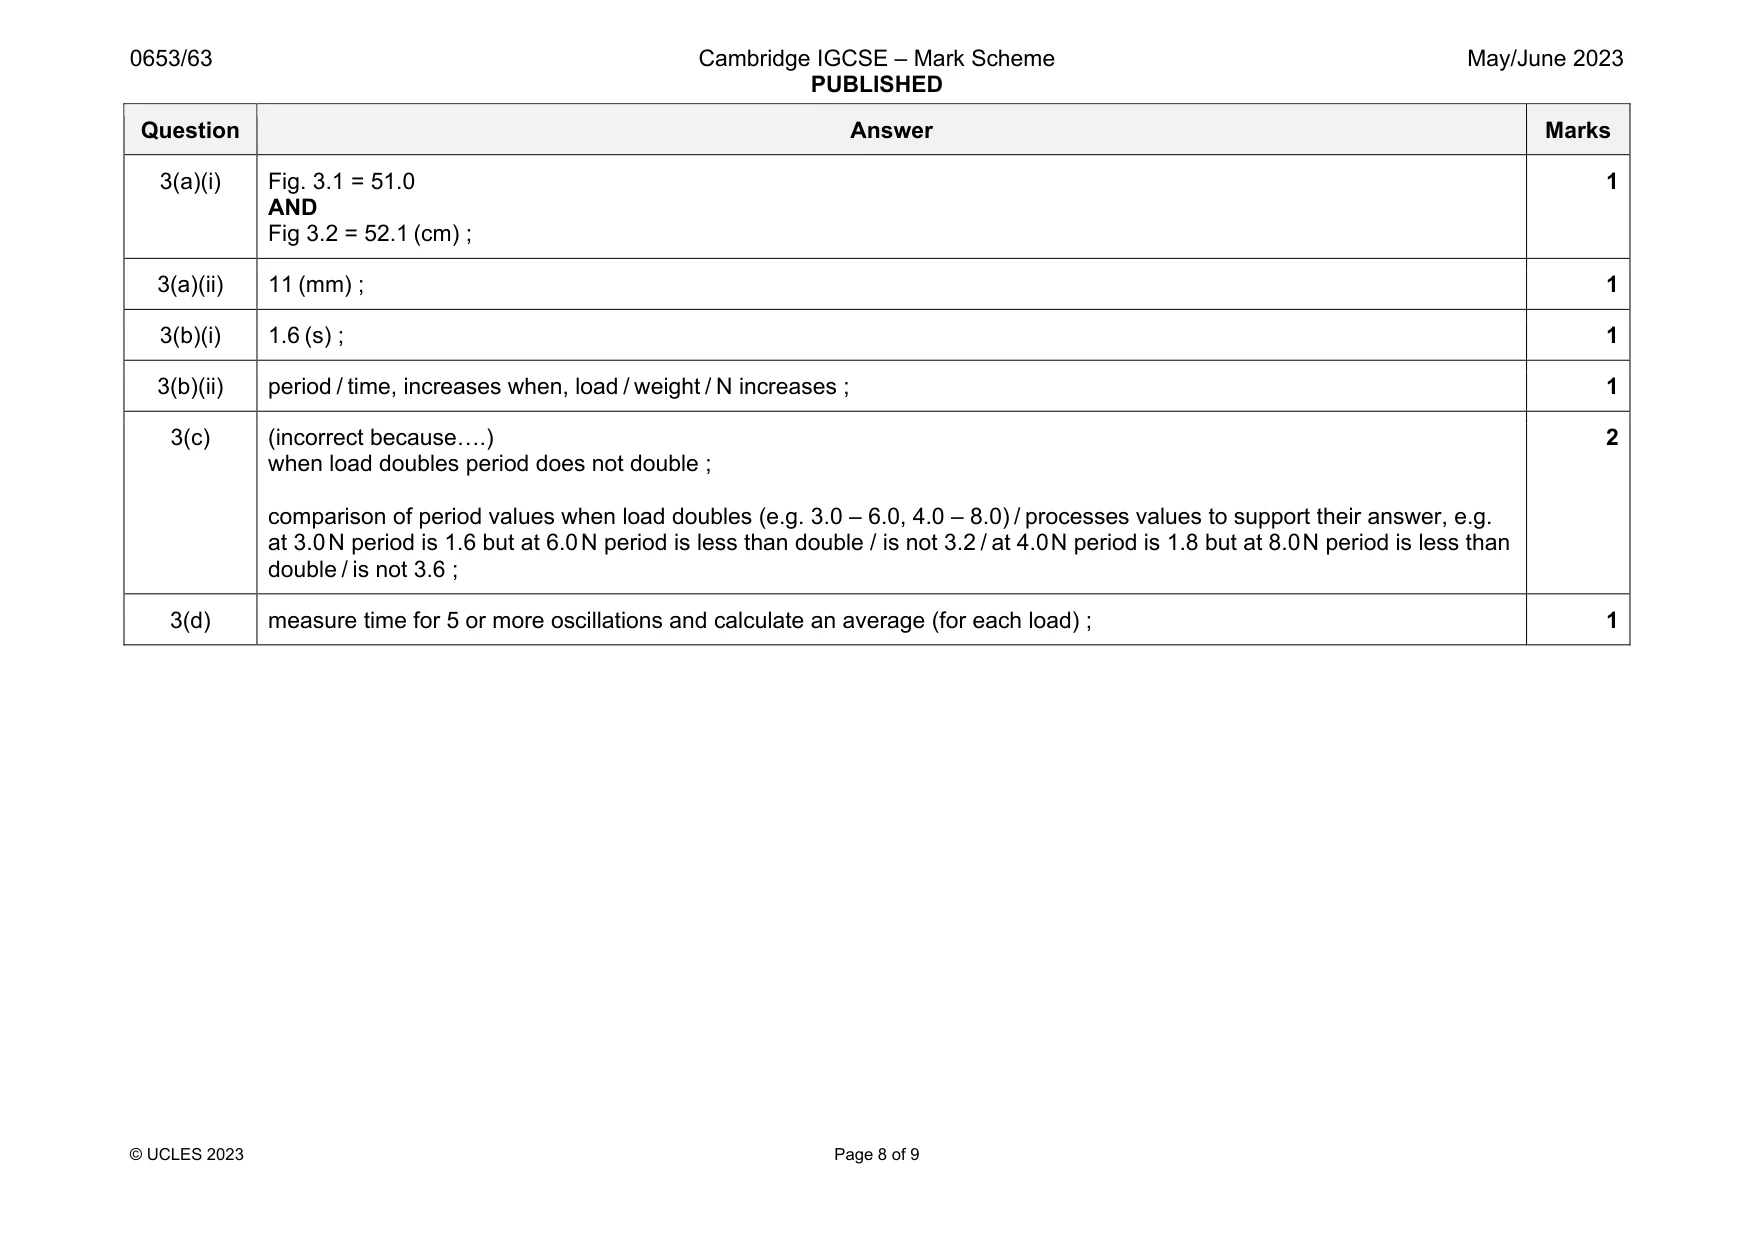
Mark scheme: 3(a)(i) Fig. 3.1 = 51.0 AND Fig 3.2 = 52.1 (cm) ; 1 3(a)(ii) 11 (mm) ; 1 3(b)(i) 1.6 (s) ; 1 3(b)(ii) period / time, increases when, load / weight / N increases ; 1 3(c) (incorrect because….) when load doubles period does not double ; comparison of period values when load doubles (e.g. 3.0 – 6.0, 4.0 – 8.0) / processes values to support their answer, e.g. at 3.0 N period is 1.6 but at 6.0 N period is less than double / is not 3.2 / at 4.0 N period is 1.8 but at 8.0 N period is less than double / is not 3.6 ; 2 3(d) measure time for 5 or more oscillations and calculate an average (for each load) ; 1
More questions on Physical quantities and measurement techniques
Q4 · A student rolls a toy car down a ramp of height h
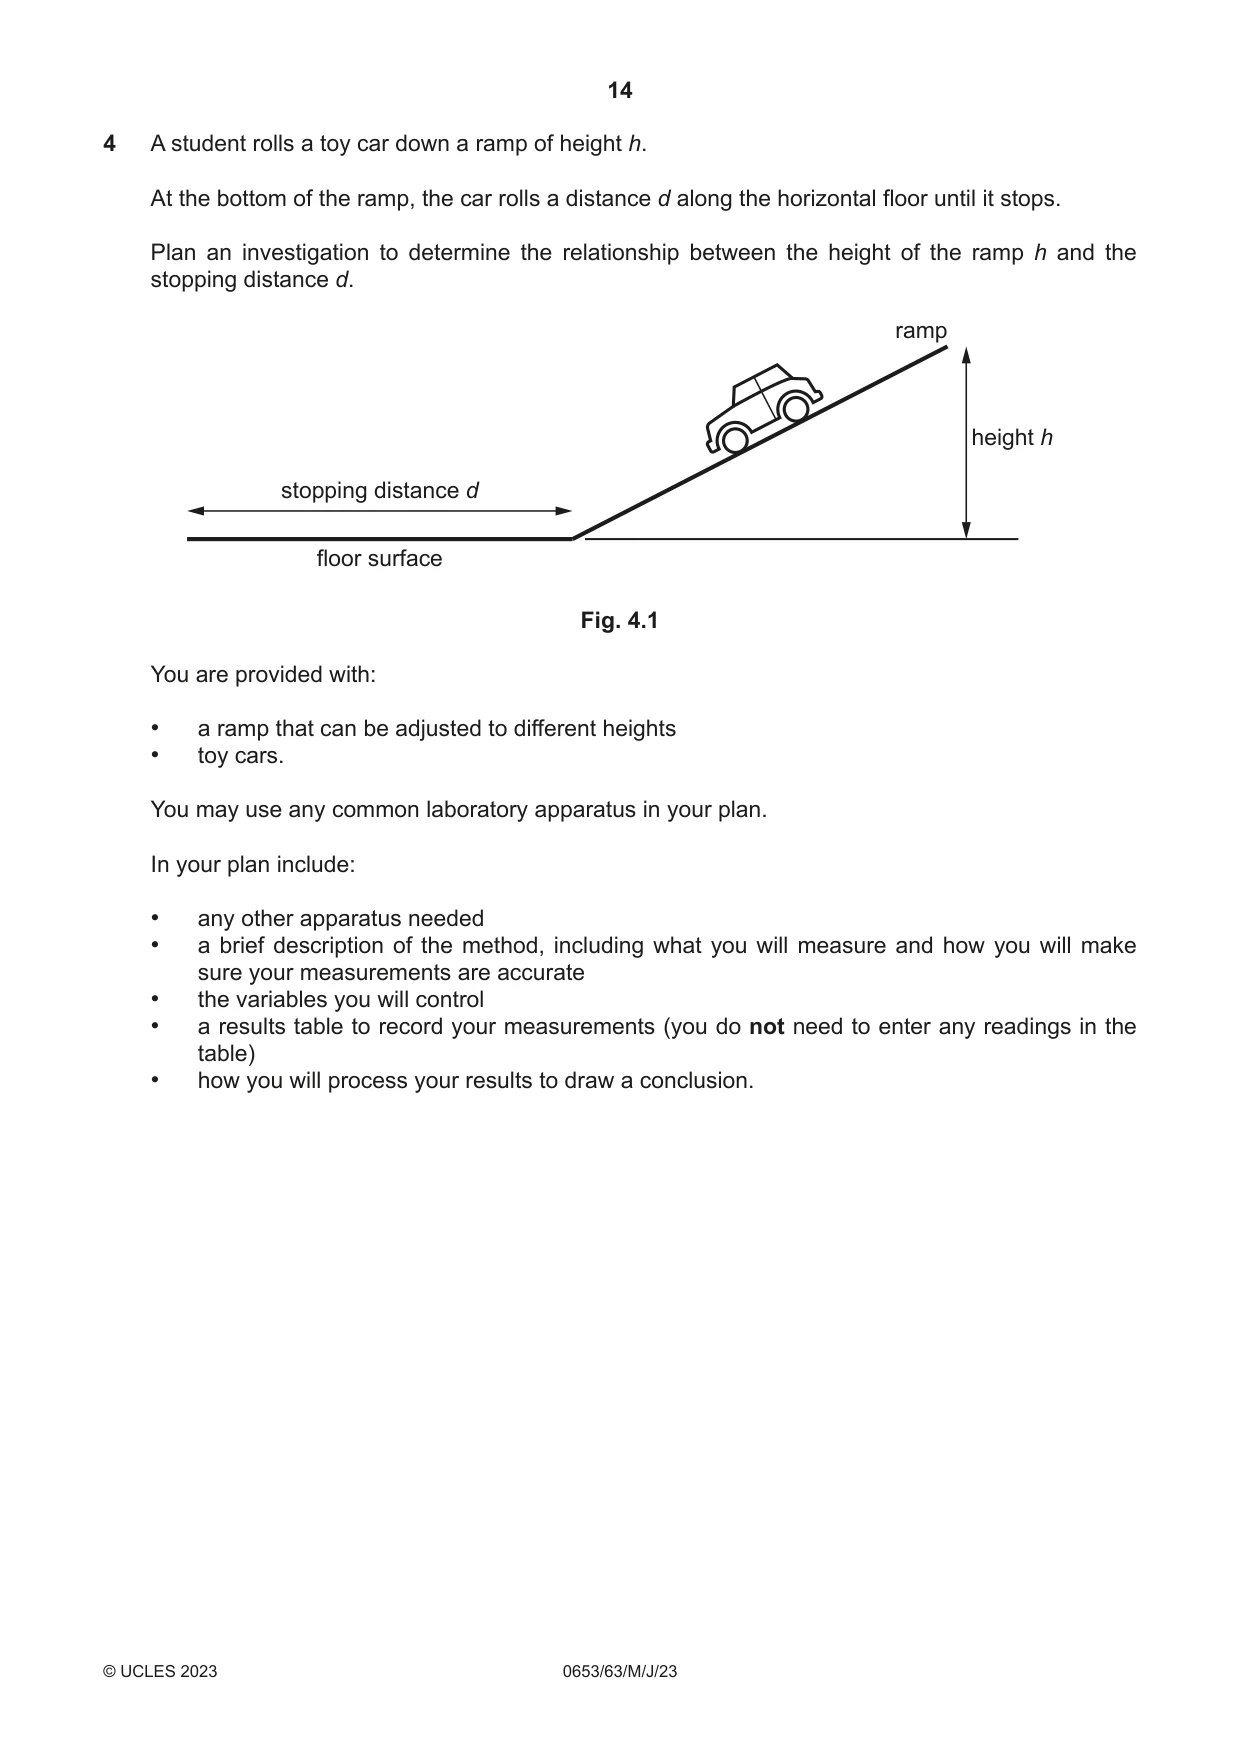
4 A student rolls a toy car down a ramp of height h. At the bottom of the ramp, the car rolls a distance d along the horizontal floor until it stops. Plan an investigation to determine the relationship between the height of the ramp h and the stopping distance d. ramp height h stopping distance d floor surface Fig. 4.1 You are provided with: • a ramp that can be adjusted to different heights • toy cars. You may use any common laboratory apparatus in your plan. In your plan include: • any other apparatus needed • a brief description of the method, including what you will measure and how you will make sure your measurements are accurate • the variables you will control • a results table to record your measurements (you do not need to enter any readings in the table) • how you will process your results to draw a conclusion. .......................................................................................................................................................... .......................................................................................................................................................... .......................................................................................................................................................... .......................................................................................................................................................... .......................................................................................................................................................... .......................................................................................................................................................... .......................................................................................................................................................... .......................................................................................................................................................... .......................................................................................................................................................... .......................................................................................................................................................... .......................................................................................................................................................... .......................................................................................................................................................... .......................................................................................................................................................... .................................................................................................................................................... [7]
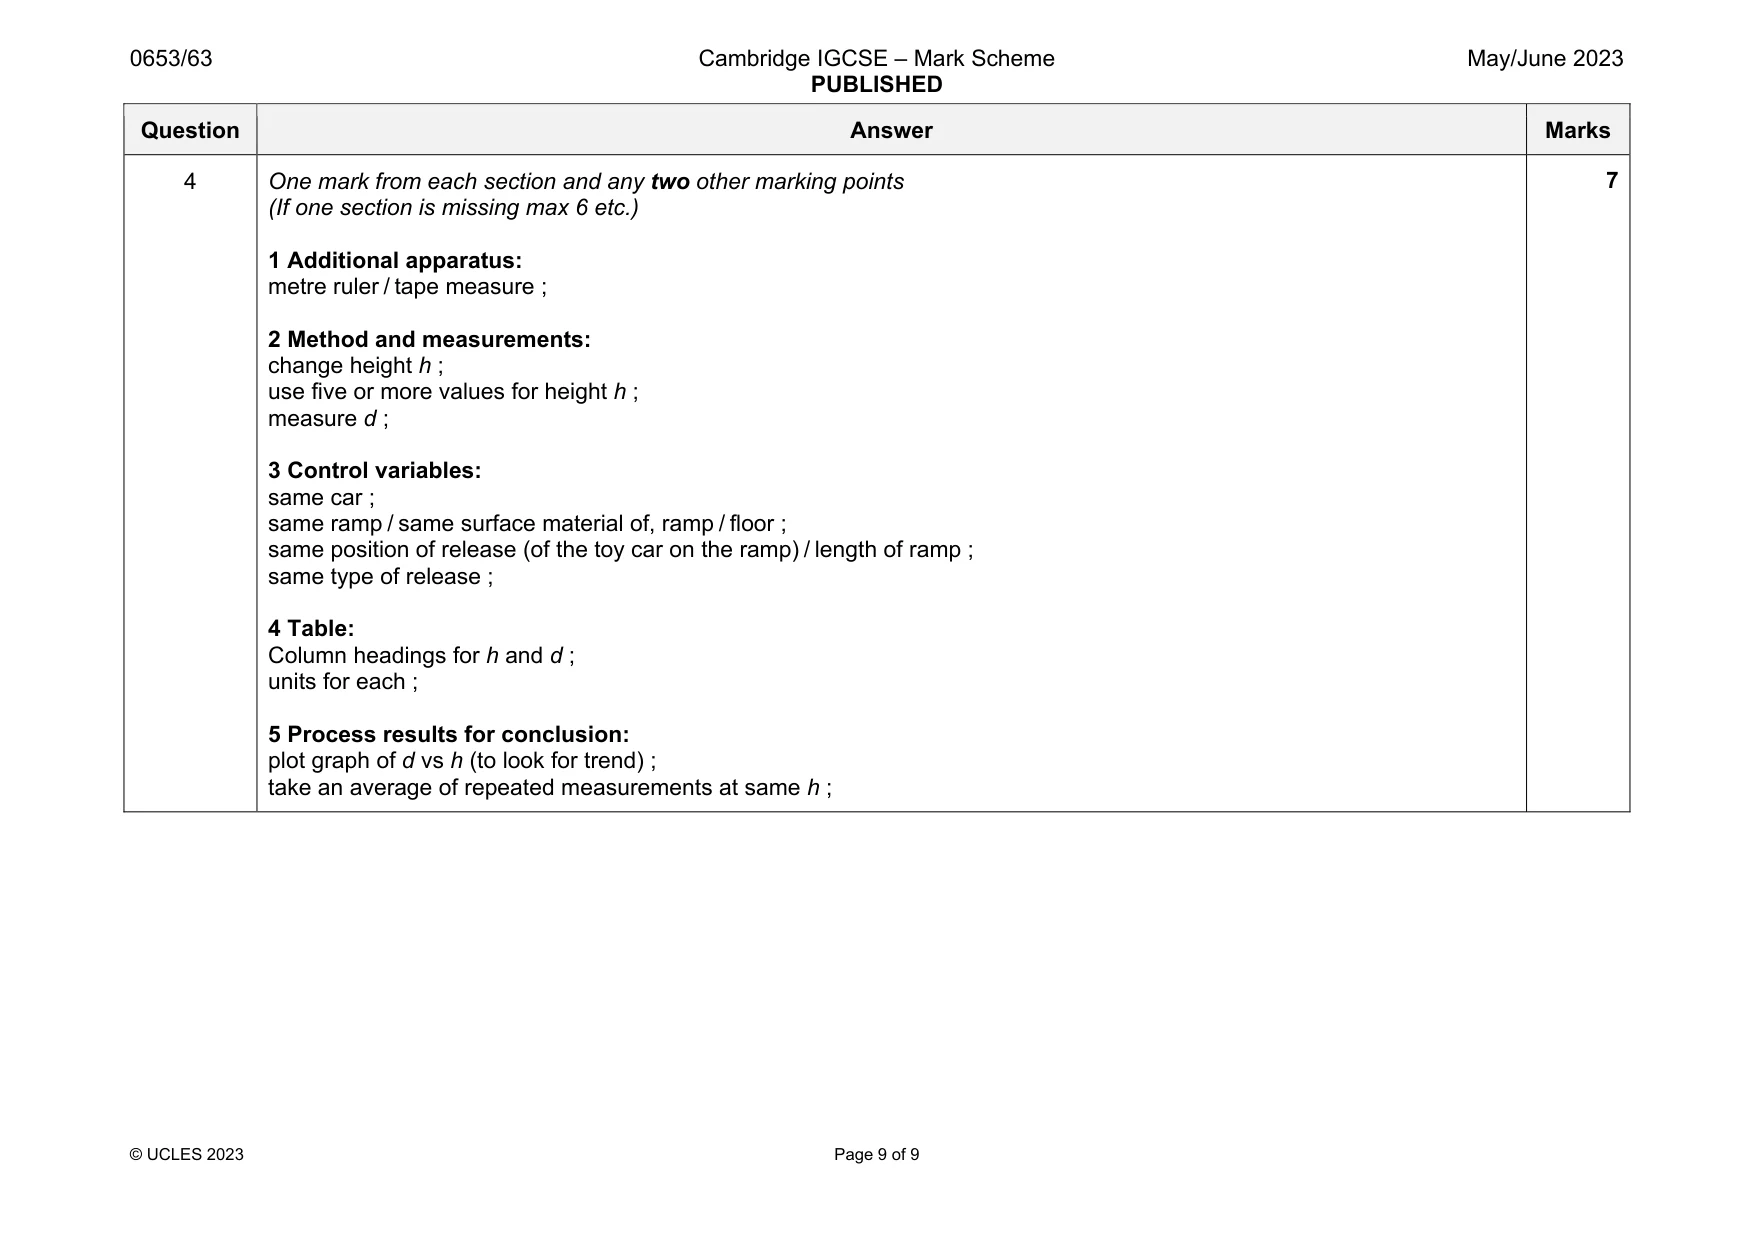
Mark scheme: 4 One mark from each section and any two other marking points (If one section is missing max 6 etc.) 1 Additional apparatus: metre ruler / tape measure ; 2 Method and measurements: change height h ; use five or more values for height h ; measure d ; 3 Control variables: same car ; same ramp / same surface material of, ramp / floor ; same position of release (of the toy car on the ramp) / length of ramp ; same type of release ; 4 Table: Column headings for h and d ; units for each ; 5 Process results for conclusion: plot graph of d vs h (to look for trend) ; take an average of repeated measurements at same h ;
What was in this paper
The subtopics covered by these 4 questions, and how many questions each got. Open one in a new tab to see every Cambridge question on it.
What you needed in this session
Cambridge’s own grade thresholds for 2023 May/June, Paper 6 · Variant 3. A higher threshold means an easier paper — the bar moves with how the cohort did.