Cambridge IGCSE Science - Combined 0653 — 2024 Oct/Nov Paper 6 · Variant 2
0653/62/O/N/24 · 4 questions · 40 marks · ≈45 min
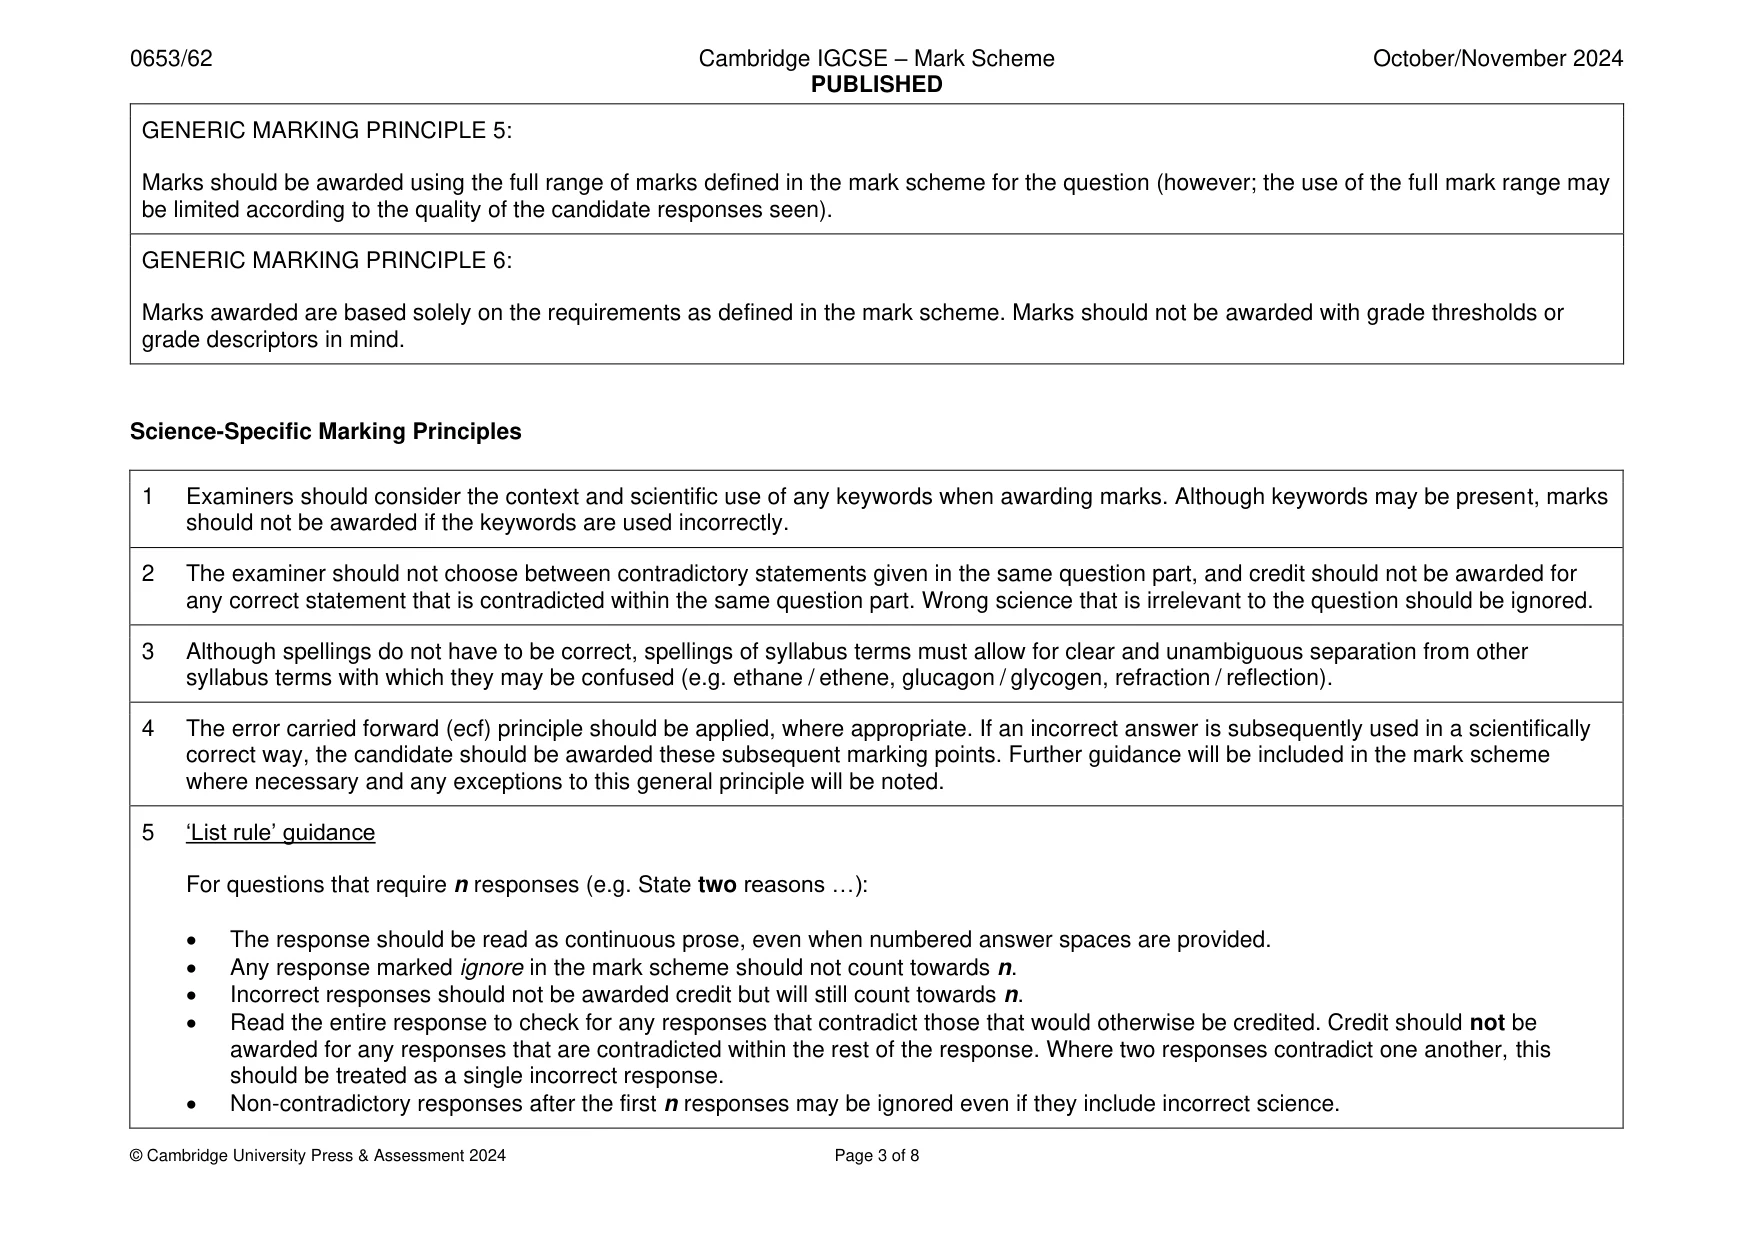
The question paper and its mark scheme, free to read here and free to download. This is Cambridge’s own paper, exactly as it was sat.
Question paper16 pages

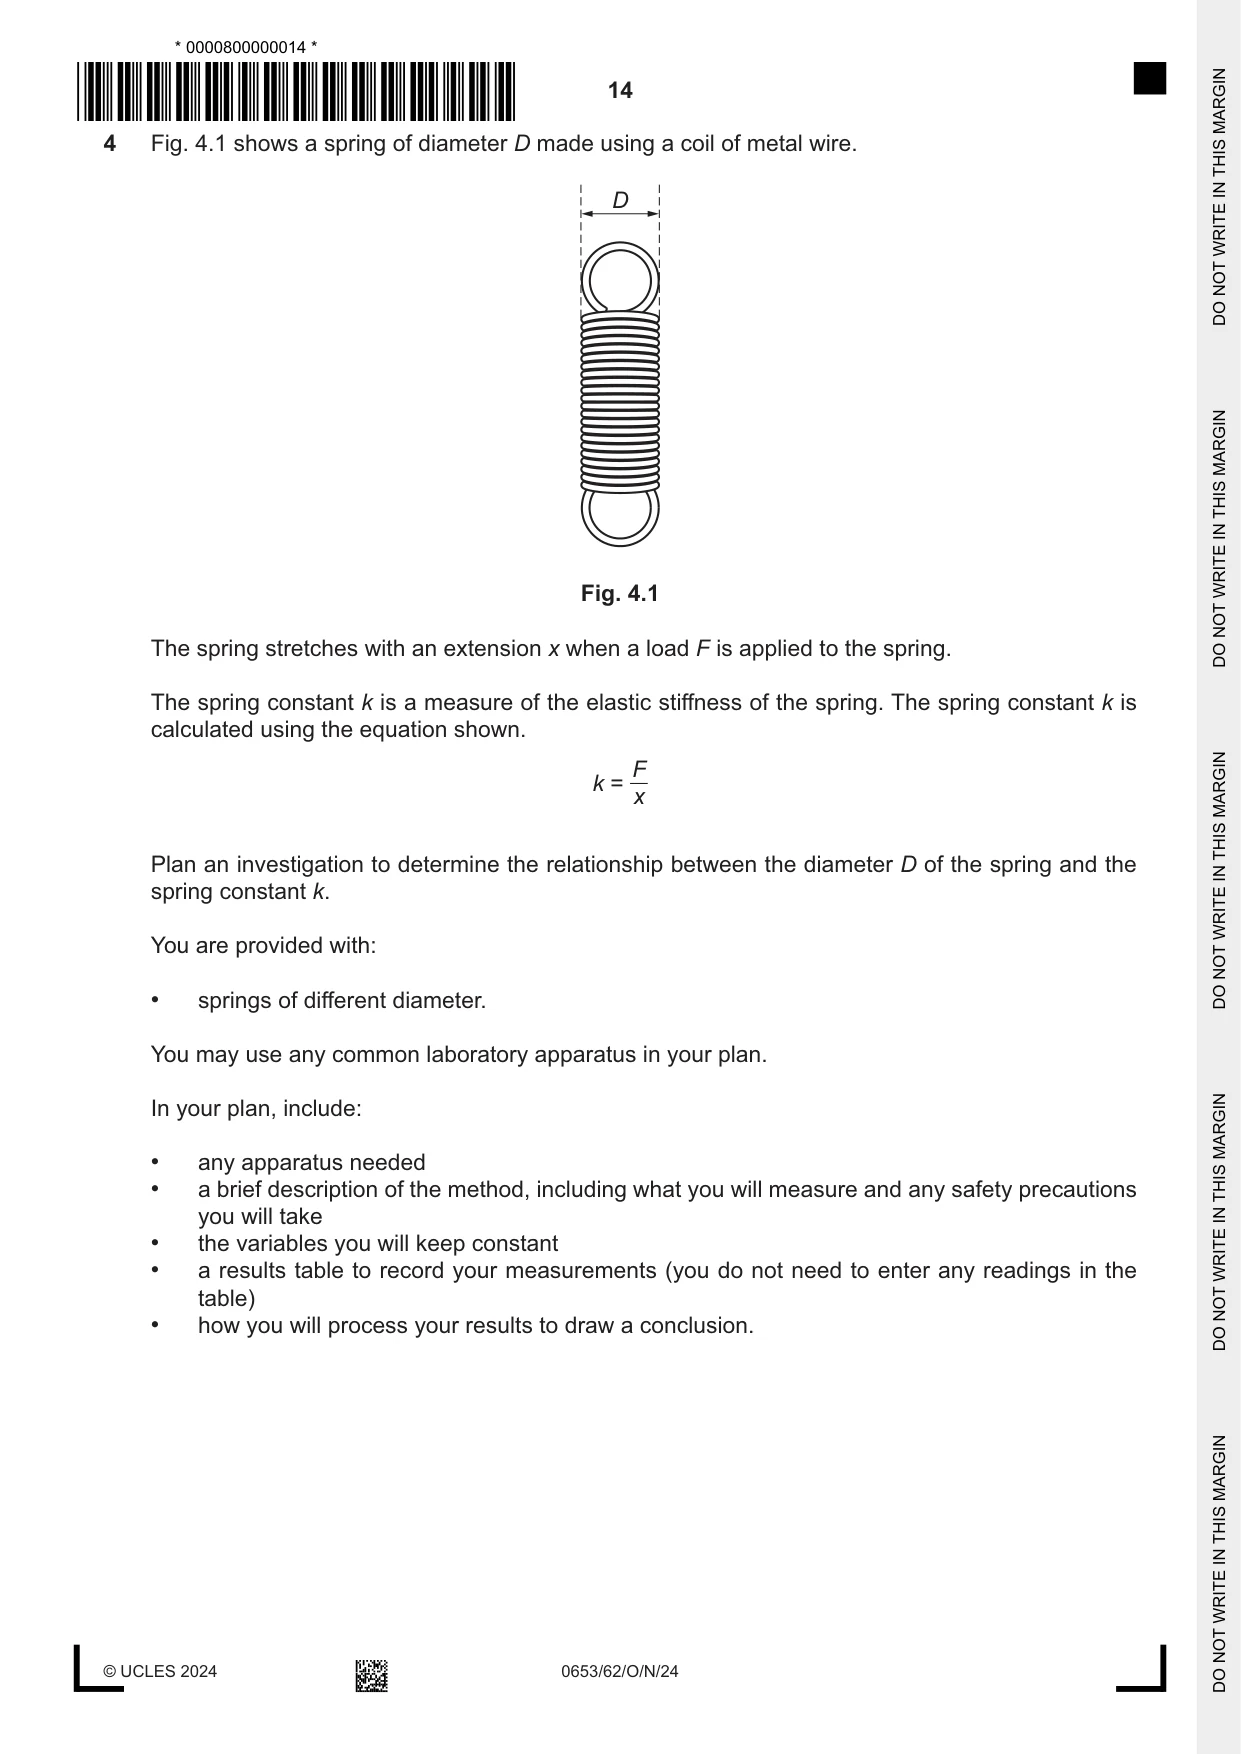

Mark scheme8 pages
Answers below. Sit the paper first if you are practising.
Questions as text
Q1 · A student uses the apparatus shown in Fig
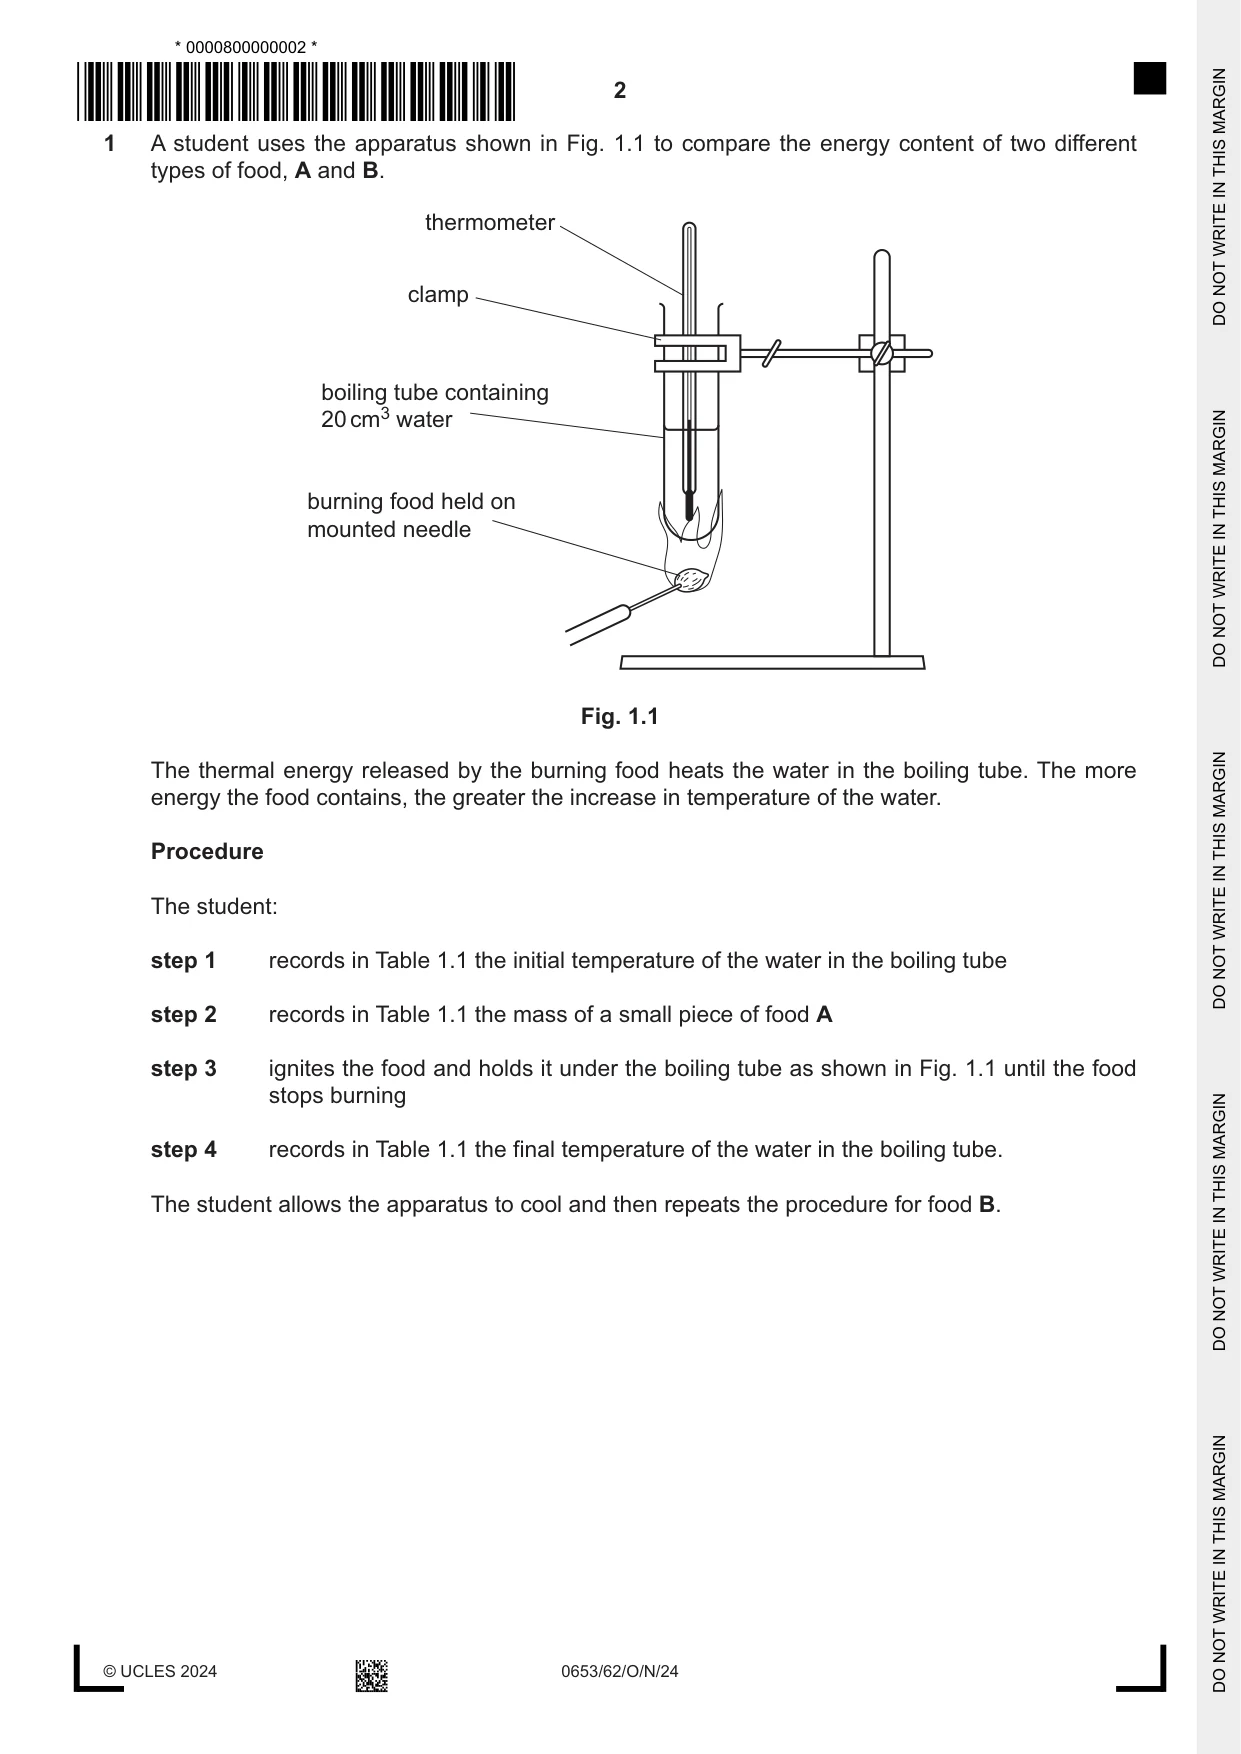
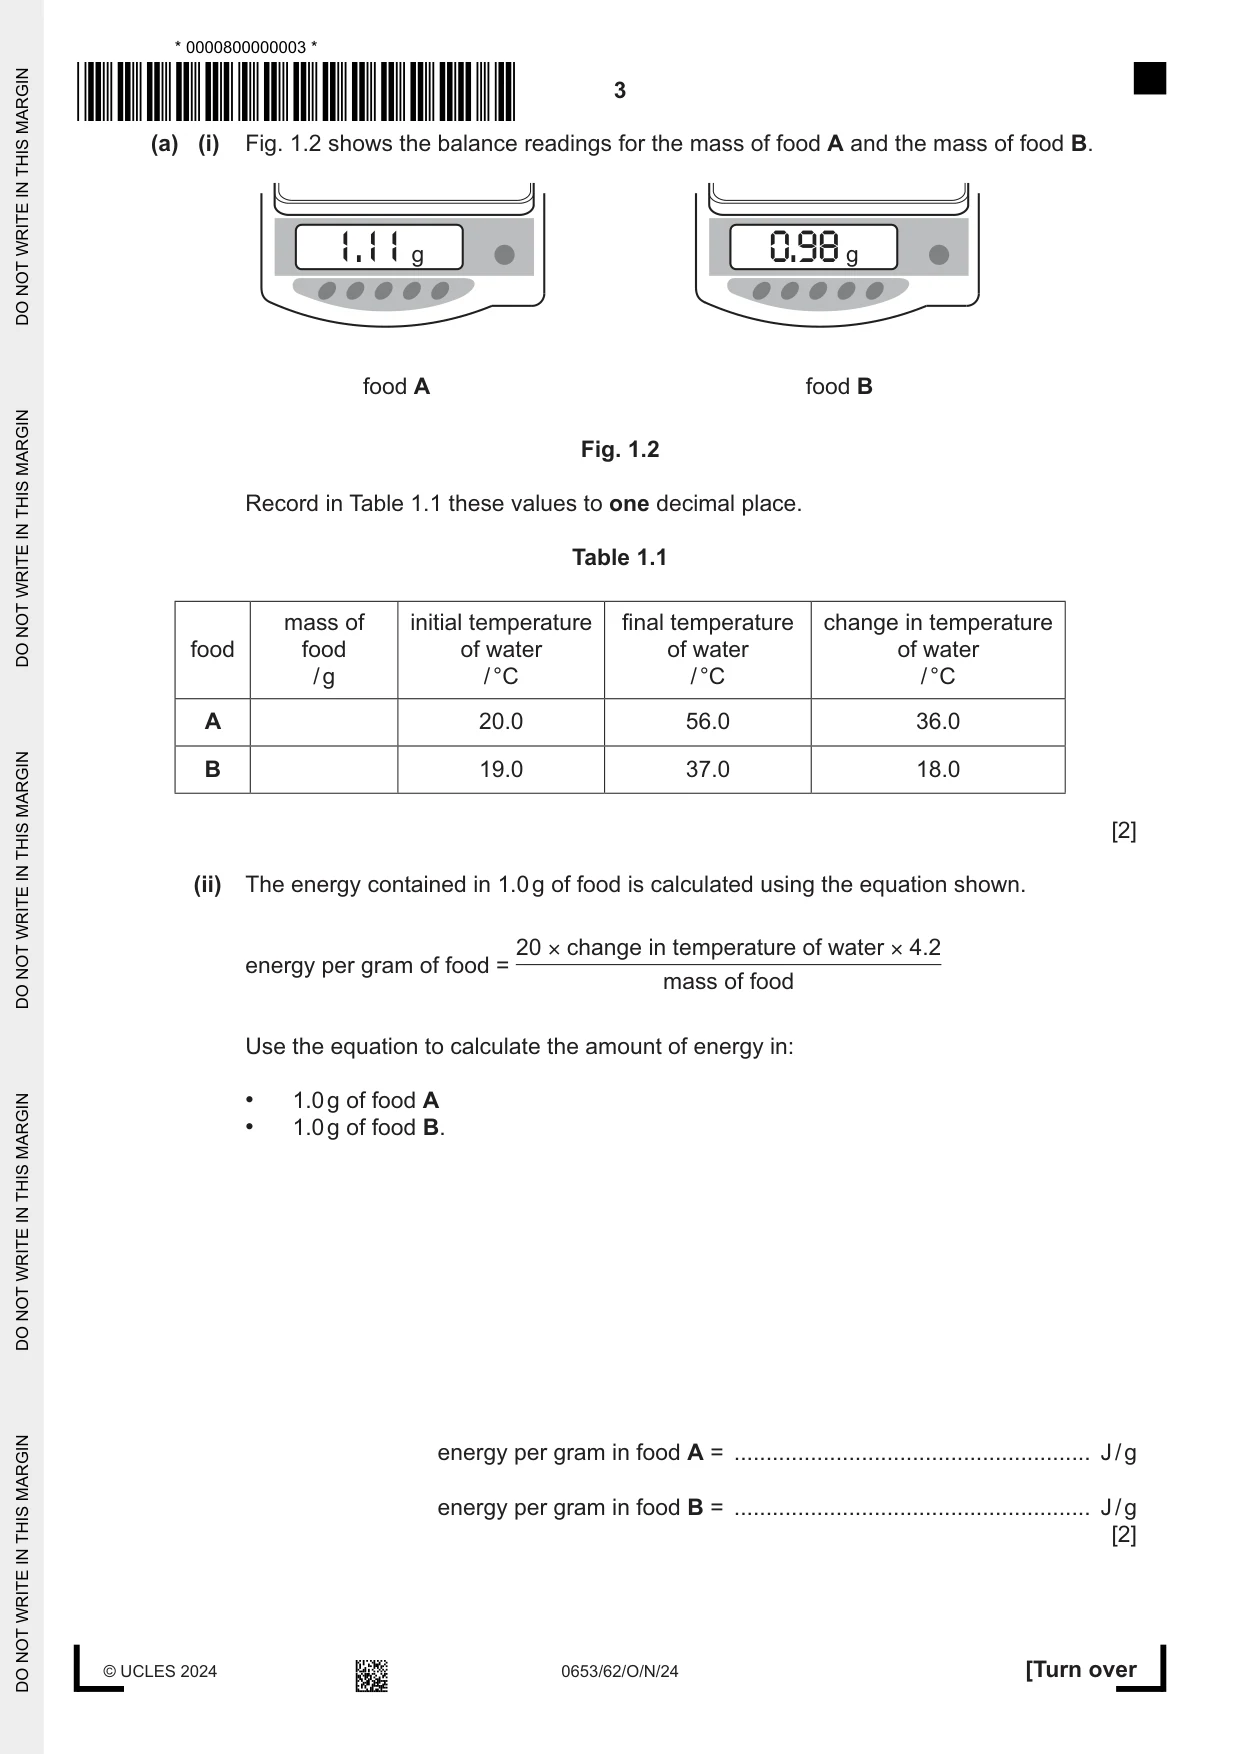
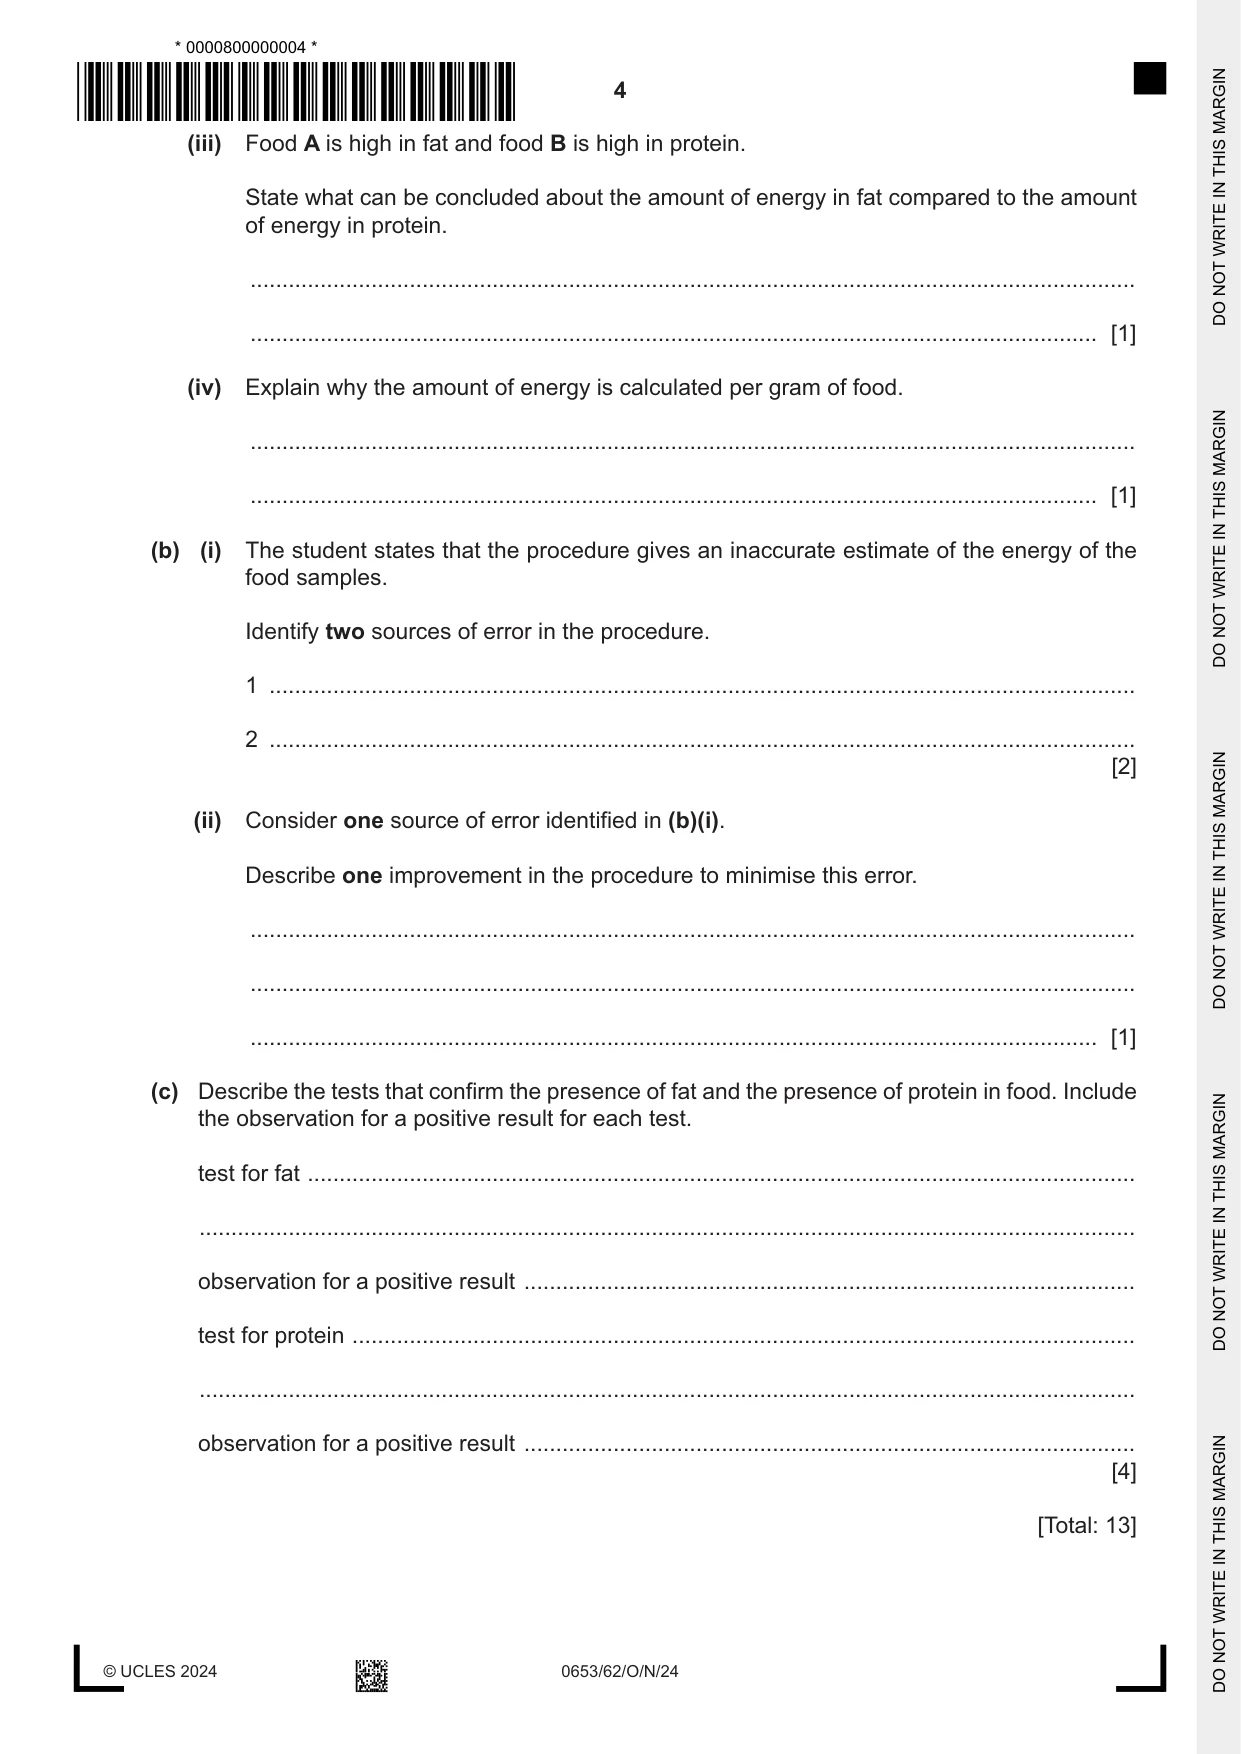
1 A student uses the apparatus shown in Fig. 1.1 to compare the energy content of two different types of food, A and B. thermometer clamp boiling tube containing 20 cm3 water burning food held on mounted needle Fig. 1.1 The thermal energy released by the burning food heats the water in the boiling tube. The more energy the food contains, the greater the increase in temperature of the water. Procedure The student: step 1 records in Table 1.1 the initial temperature of the water in the boiling tube step 2 records in Table 1.1 the mass of a small piece of food A step 3 ignites the food and holds it under the boiling tube as shown in Fig. 1.1 until the food stops burning step 4 records in Table 1.1 the final temperature of the water in the boiling tube. The student allows the apparatus to cool and then repeats the procedure for food B. (a) (i) Fig. 1.2 shows the balance readings for the mass of food A and the mass of food B. 1.11 g 0.98 g food A food B Fig. 1.2 Record in Table 1.1 these values to one decimal place. Table 1.1 mass of initial temperature final temperature change in temperature food food of water of water of water / g / °C / °C / °C A 20.0 56.0 36.0 B 19.0 37.0 18.0 [2] (ii) The energy contained in 1.0 g of food is calculated using the equation shown. 20 × change in temperature of water × 4.2 energy per gram of food = mass of food Use the equation to calculate the amount of energy in: • 1.0 g of food A • 1.0 g of food B. energy per gram in food A = ........................................................ J / g energy per gram in food B = ........................................................ J / g [2] (iii) Food A is high in fat and food B is high in protein. State what can be concluded about the amount of energy in fat compared to the amount of energy in protein. ........................................................................................................................................... ..................................................................................................................................... [1] (iv) Explain why the amount of energy is calculated per gram of food. ........................................................................................................................................... ..................................................................................................................................... [1] (b) (i) The student states that the procedure gives an inaccurate estimate of the energy of the food samples. Identify two sources of error in the procedure. 1 ........................................................................................................................................ 2 ........................................................................................................................................ [2] (ii) Consider one source of error identified in (b)(i). Describe one improvement in the procedure to minimise this error. ........................................................................................................................................... ........................................................................................................................................... ..................................................................................................................................... [1] (c) Describe the tests that confirm the presence of fat and the presence of protein in food. Include the observation for a positive result for each test. test for fat .................................................................................................................................. ................................................................................................................................................... observation for a positive result ................................................................................................ test for protein ........................................................................................................................... ................................................................................................................................................... observation for a positive result ................................................................................................ [4] [Total: 13]
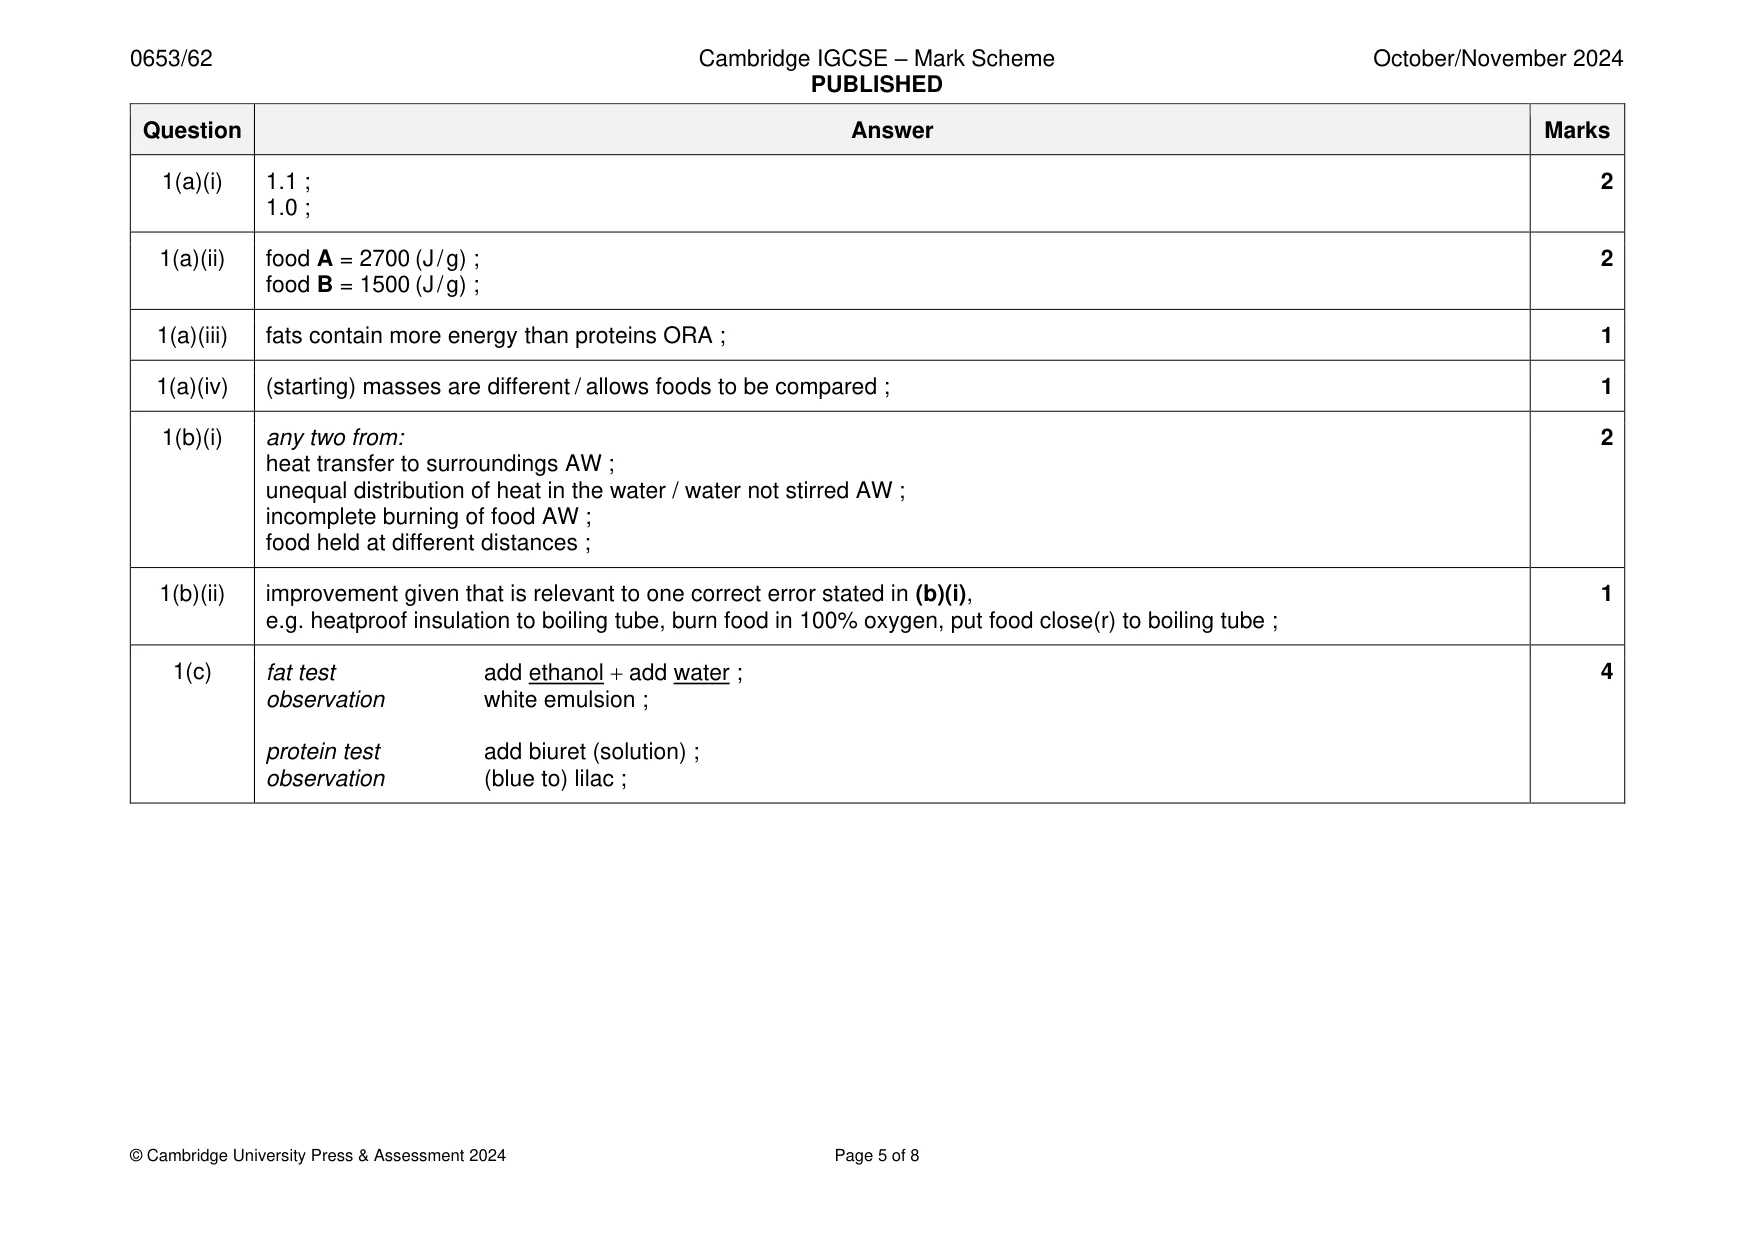
Mark scheme: Question Answer Marks 1(a)(i) 1.1 ; 2 1.0 ; 1(a)(ii) food A = 2700 (J / g) ; 2 food B = 1500 (J / g) ; 1(a)(iii) fats contain more energy than proteins ORA ; 1 1(a)(iv) (starting) masses are different / allows foods to be compared ; 1 1(b)(i) any two from: 2 heat transfer to surroundings AW ; unequal distribution of heat in the water / water not stirred AW ; incomplete burning of food AW ; food held at different distances ; 1(b)(ii) improvement given that is relevant to one correct error stated in (b)(i), 1 e.g. heatproof insulation to boiling tube, burn food in 100% oxygen, put food close(r) to boiling tube ; 1(c) fat test add ethanol + add water ; 4 observation white emulsion ; protein test add biuret (solution) ; observation (blue to) lilac ;
Q2 · A student investigates a white solid, H
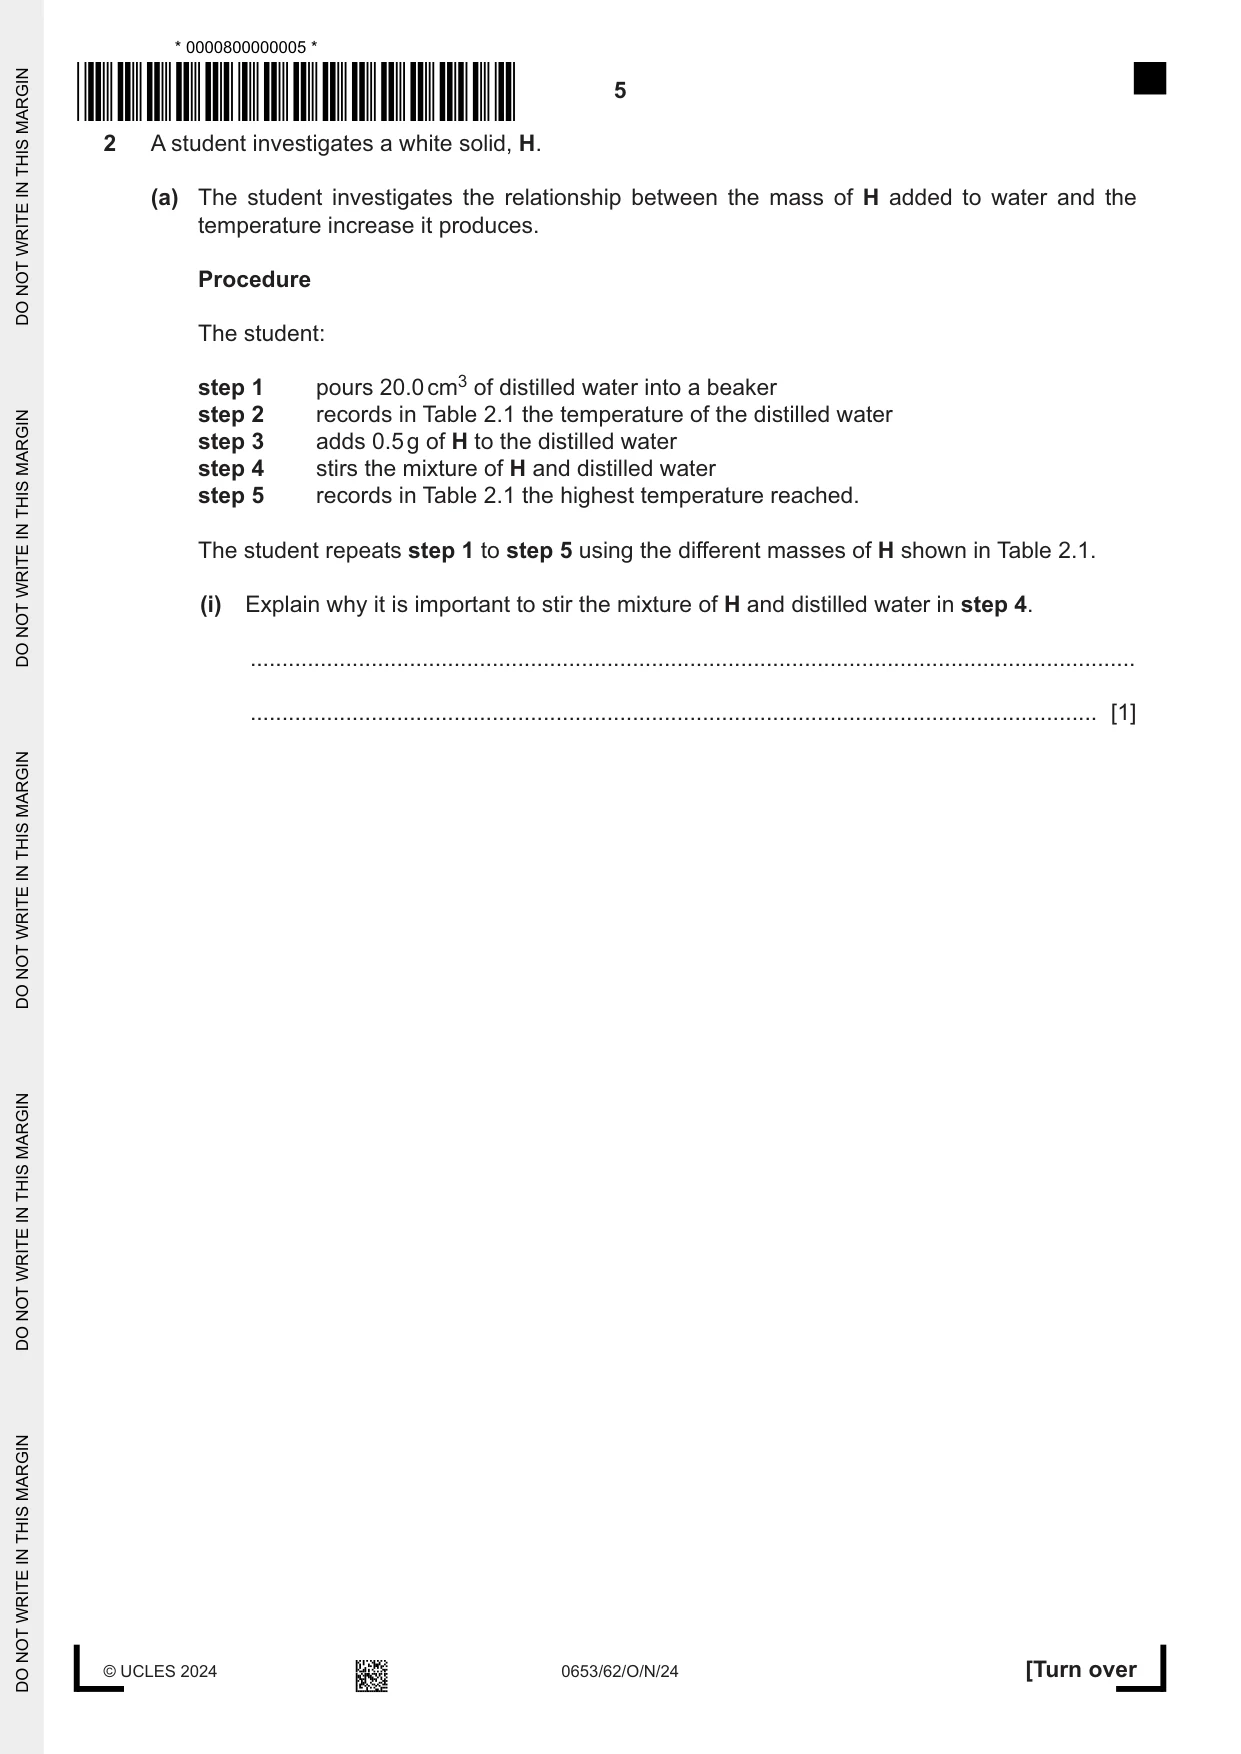
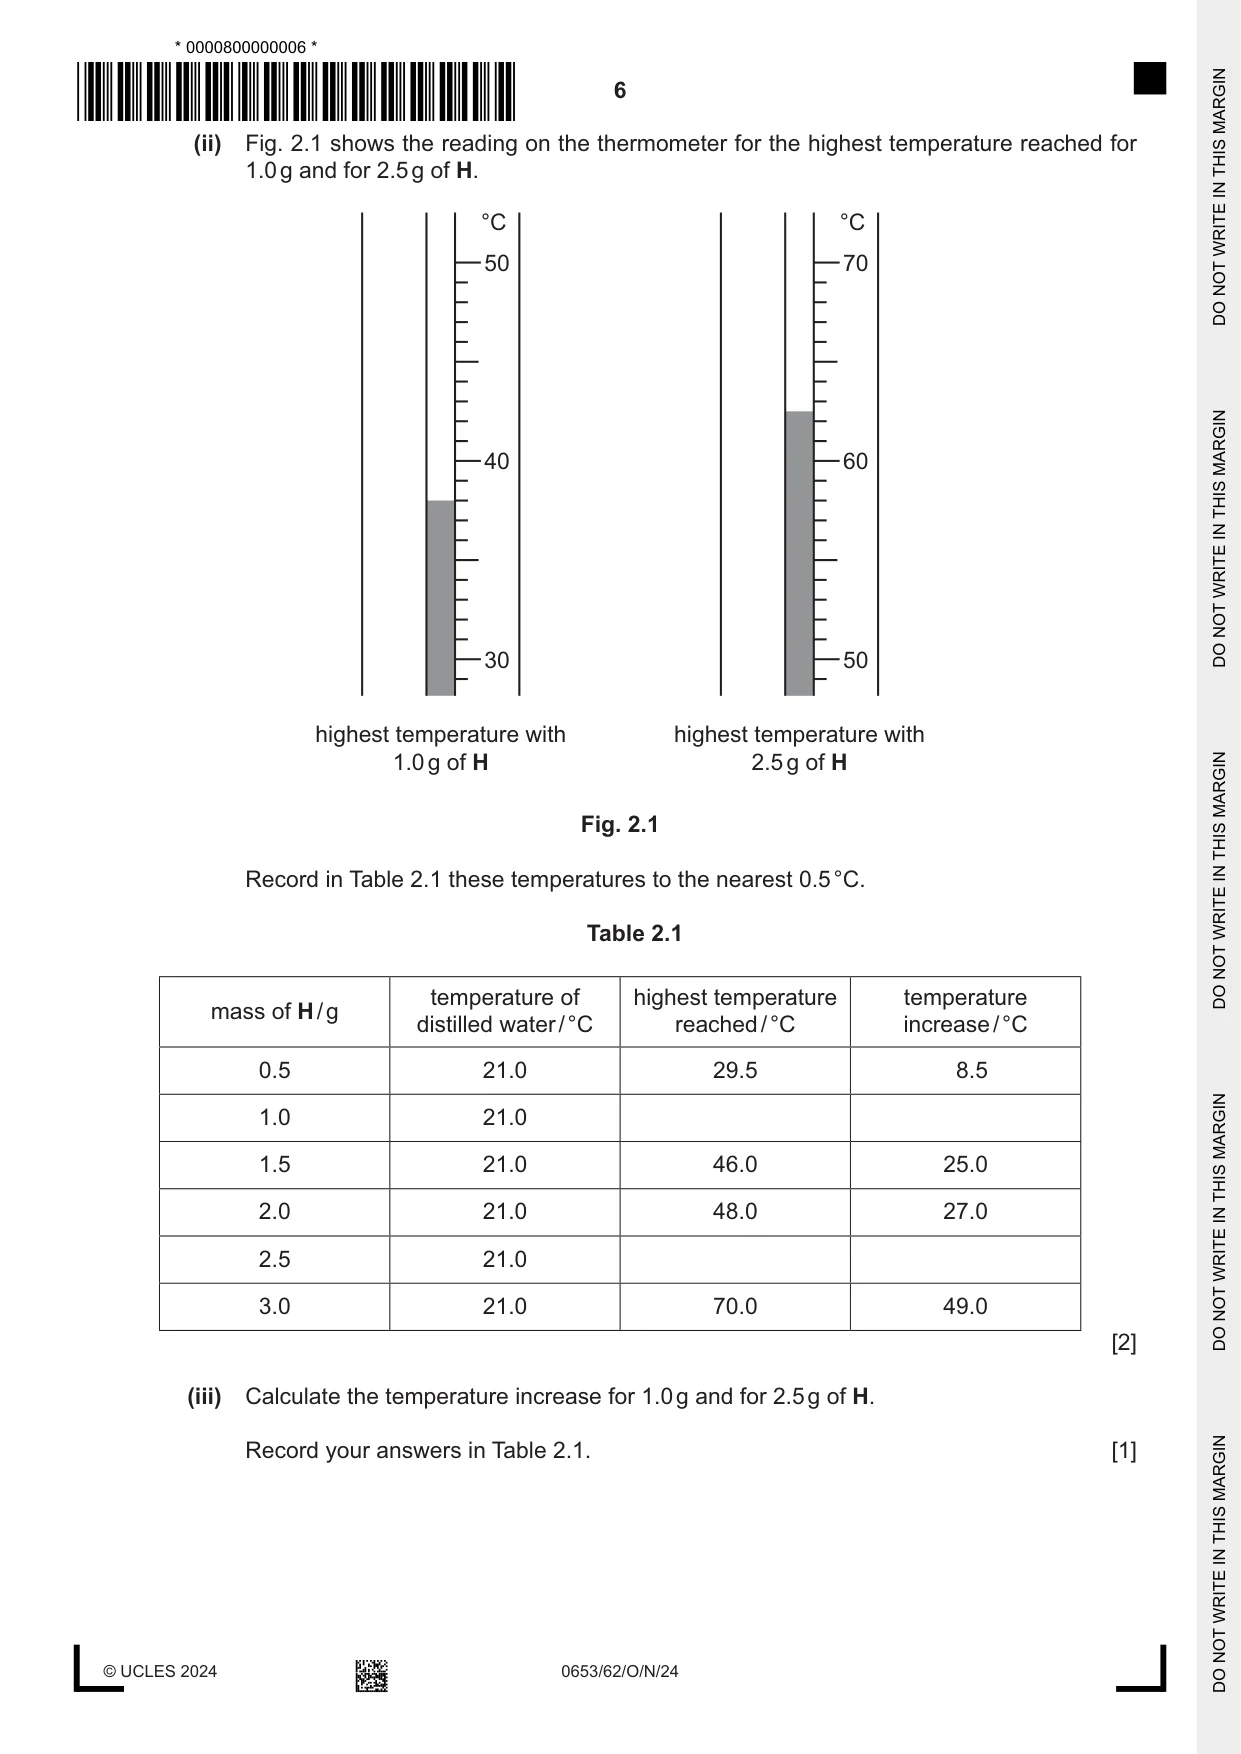
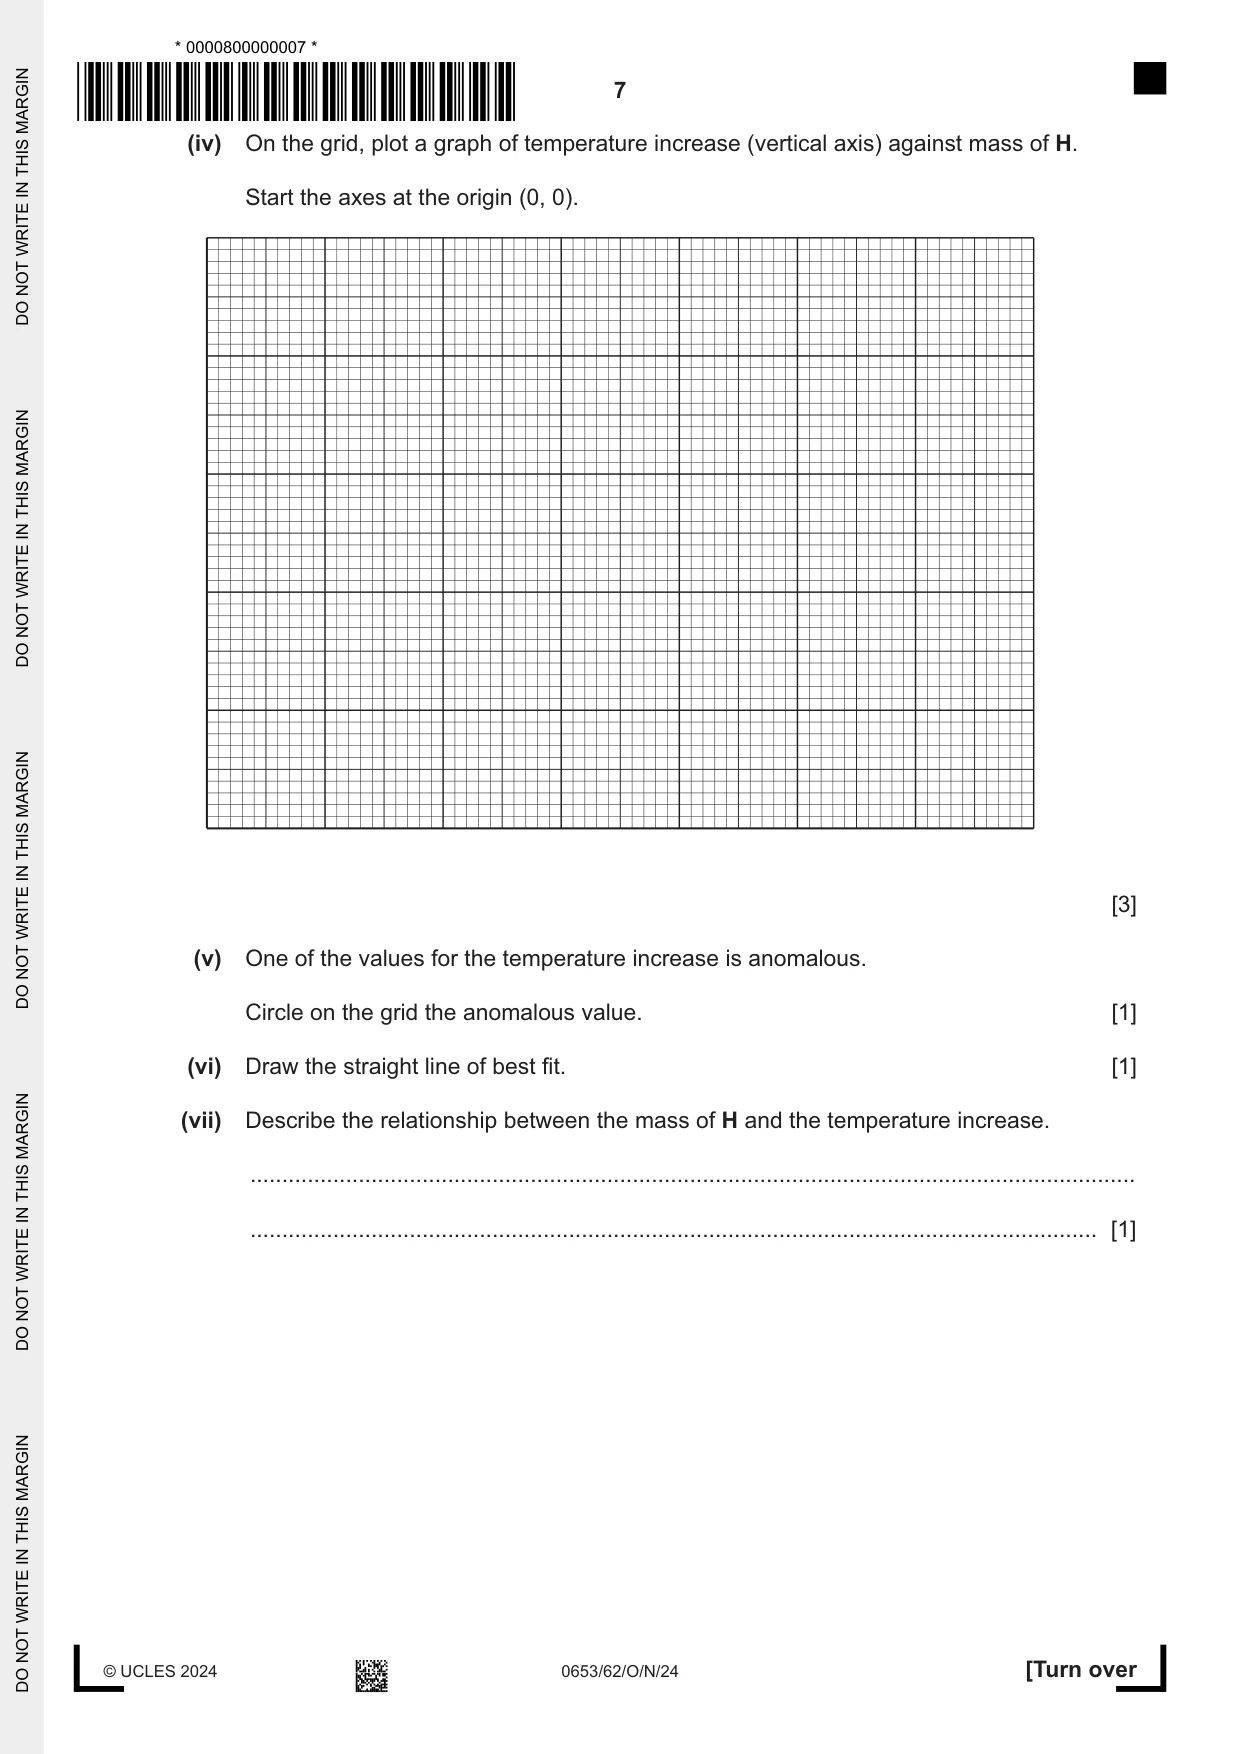
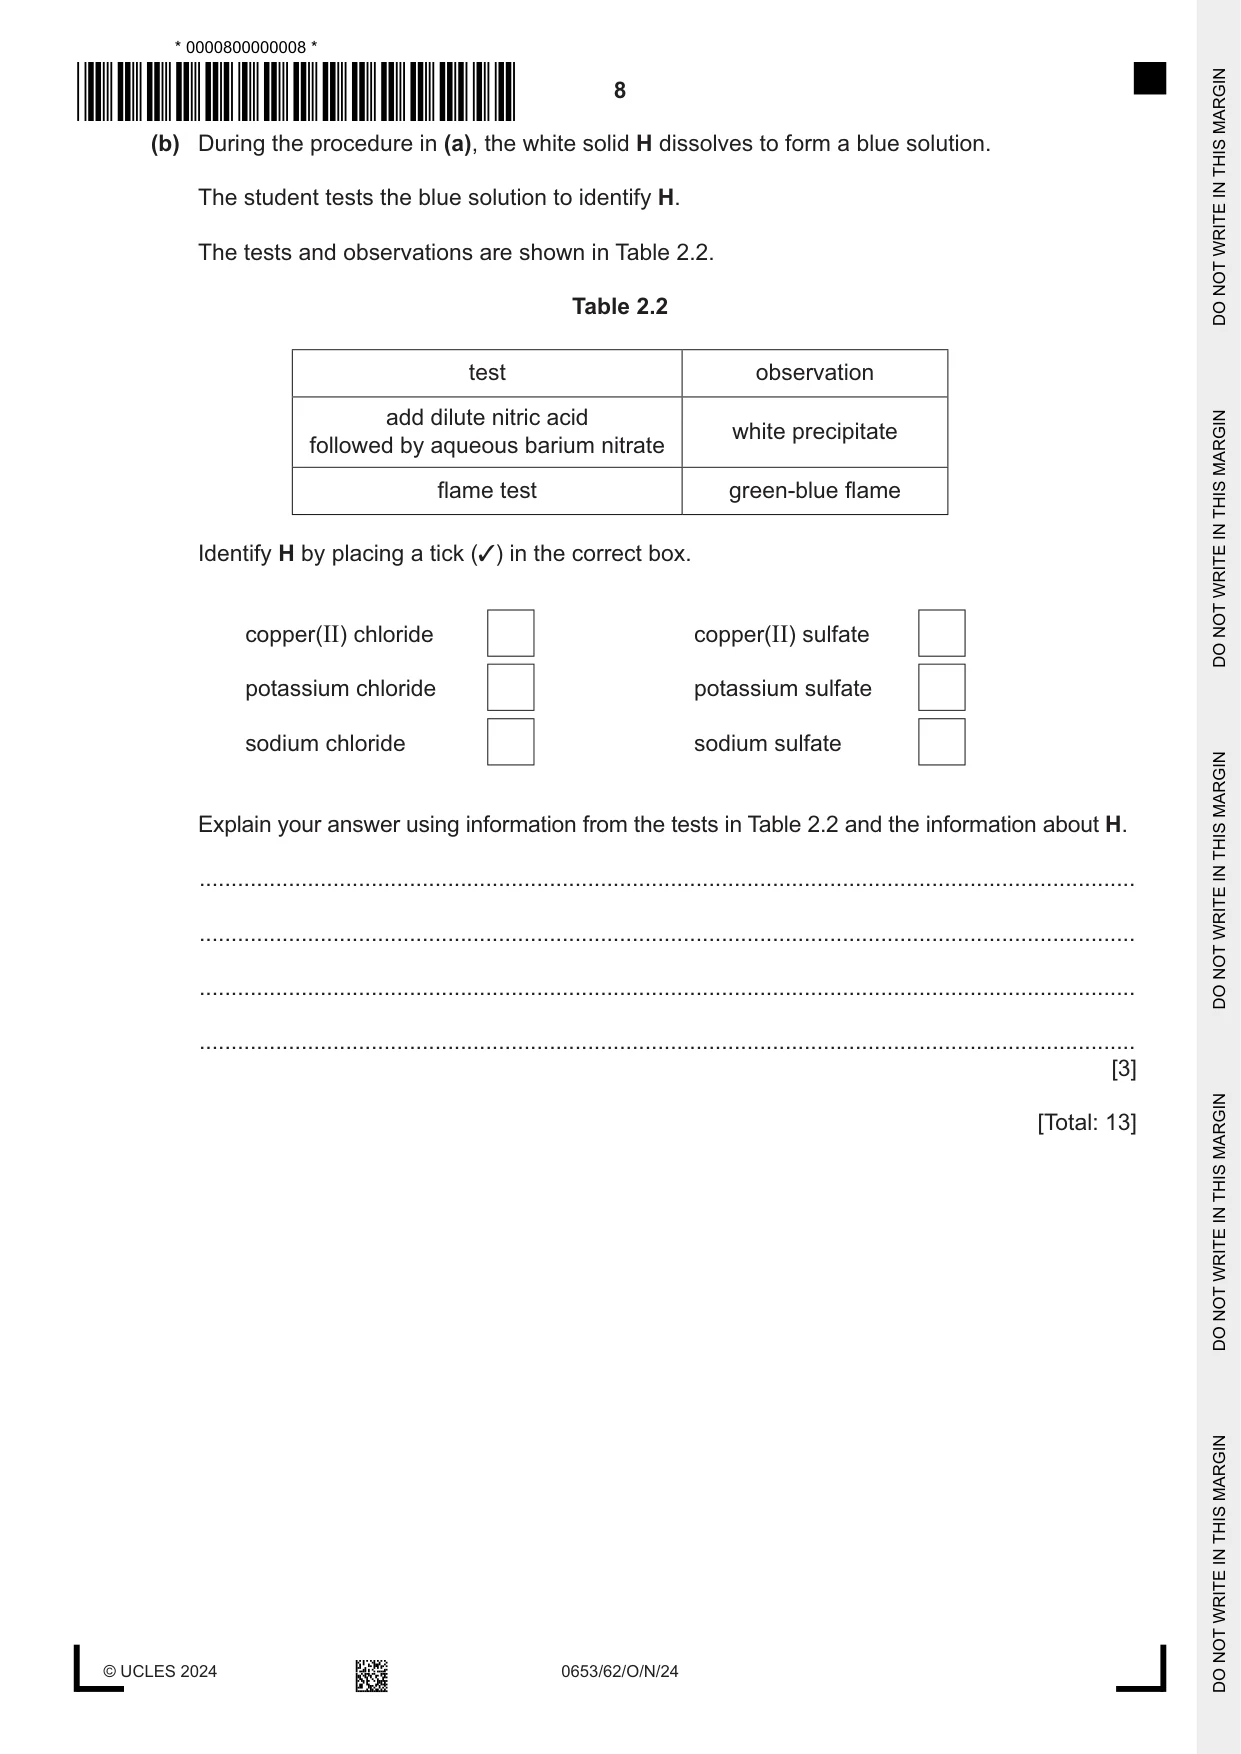
2 A student investigates a white solid, H. (a) The student investigates the relationship between the mass of H added to water and the temperature increase it produces. Procedure The student: step 1 pours 20.0 cm3 of distilled water into a beaker step 2 records in Table 2.1 the temperature of the distilled water step 3 adds 0.5 g of H to the distilled water step 4 stirs the mixture of H and distilled water step 5 records in Table 2.1 the highest temperature reached. The student repeats step 1 to step 5 using the different masses of H shown in Table 2.1. (i) Explain why it is important to stir the mixture of H and distilled water in step 4. ........................................................................................................................................... ..................................................................................................................................... [1] (ii) Fig. 2.1 shows the reading on the thermometer for the highest temperature reached for 1.0 g and for 2.5 g of H. °C °C 50 70 40 60 30 50 highest temperature with highest temperature with 1.0 g of H 2.5 g of H Fig. 2.1 Record in Table 2.1 these temperatures to the nearest 0.5 °C. Table 2.1 temperature of highest temperature temperature mass of H / g distilled water / °C reached / °C increase / °C 0.5 21.0 29.5 8.5 1.0 21.0 1.5 21.0 46.0 25.0 2.0 21.0 48.0 27.0 2.5 21.0 3.0 21.0 70.0 49.0 [2] (iii) Calculate the temperature increase for 1.0 g and for 2.5 g of H. Record your answers in Table 2.1. [1] (iv) On the grid, plot a graph of temperature increase (vertical axis) against mass of H. Start the axes at the origin (0, 0). [3] (v) One of the values for the temperature increase is anomalous. Circle on the grid the anomalous value. [1] (vi) Draw the straight line of best fit. [1] (vii) Describe the relationship between the mass of H and the temperature increase. ........................................................................................................................................... ..................................................................................................................................... [1] (b) During the procedure in (a), the white solid H dissolves to form a blue solution. The student tests the blue solution to identify H. The tests and observations are shown in Table 2.2. Table 2.2 test observation add dilute nitric acid white precipitate followed by aqueous barium nitrate flame test green-blue flame Identify H by placing a tick (3) in the correct box. copper(II) chloride copper(II) sulfate potassium chloride potassium sulfate sodium chloride sodium sulfate Explain your answer using information from the tests in Table 2.2 and the information about H. ................................................................................................................................................... ................................................................................................................................................... ................................................................................................................................................... ................................................................................................................................................... [3] [Total: 13]
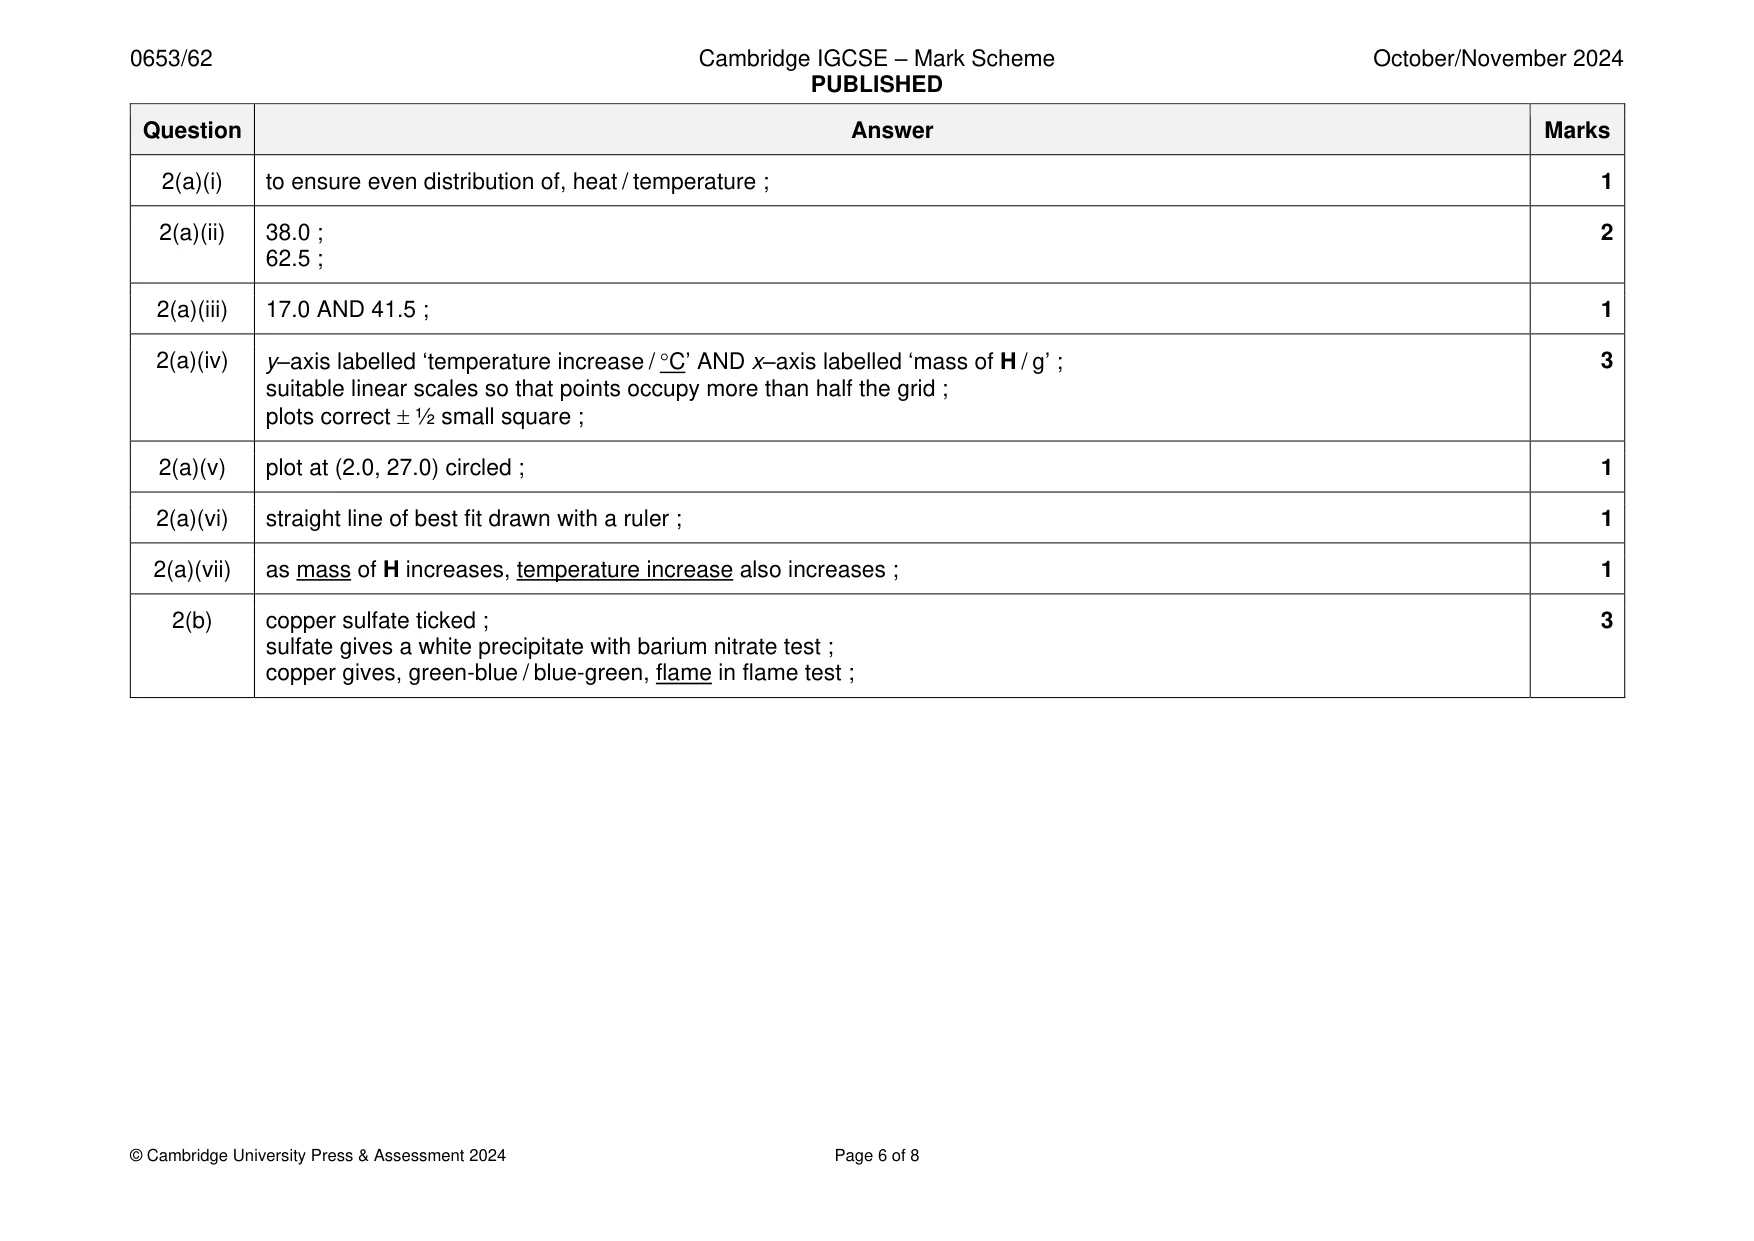
Mark scheme: 2(a)(i) to ensure even distribution of, heat / temperature ; 1 2(a)(ii) 38.0 ; 2 62.5 ; 2(a)(iii) 17.0 AND 41.5 ; 1 2(a)(iv) y–axis labelled ‘temperature increase / C’ AND x–axis labelled ‘mass of H / g’ ; 3 suitable linear scales so that points occupy more than half the grid ; plots correct ½ small square ; 2(a)(v) plot at (2.0, 27.0) circled ; 1 2(a)(vi) straight line of best fit drawn with a ruler ; 1 2(a)(vii) as mass of H increases, temperature increase also increases ; 1 2(b) copper sulfate ticked ; 3 sulfate gives a white precipitate with barium nitrate test ; copper gives, green-blue / blue-green, flame in flame test ;
Q3 · A student investigates the refraction of light through a semi-circular glass block
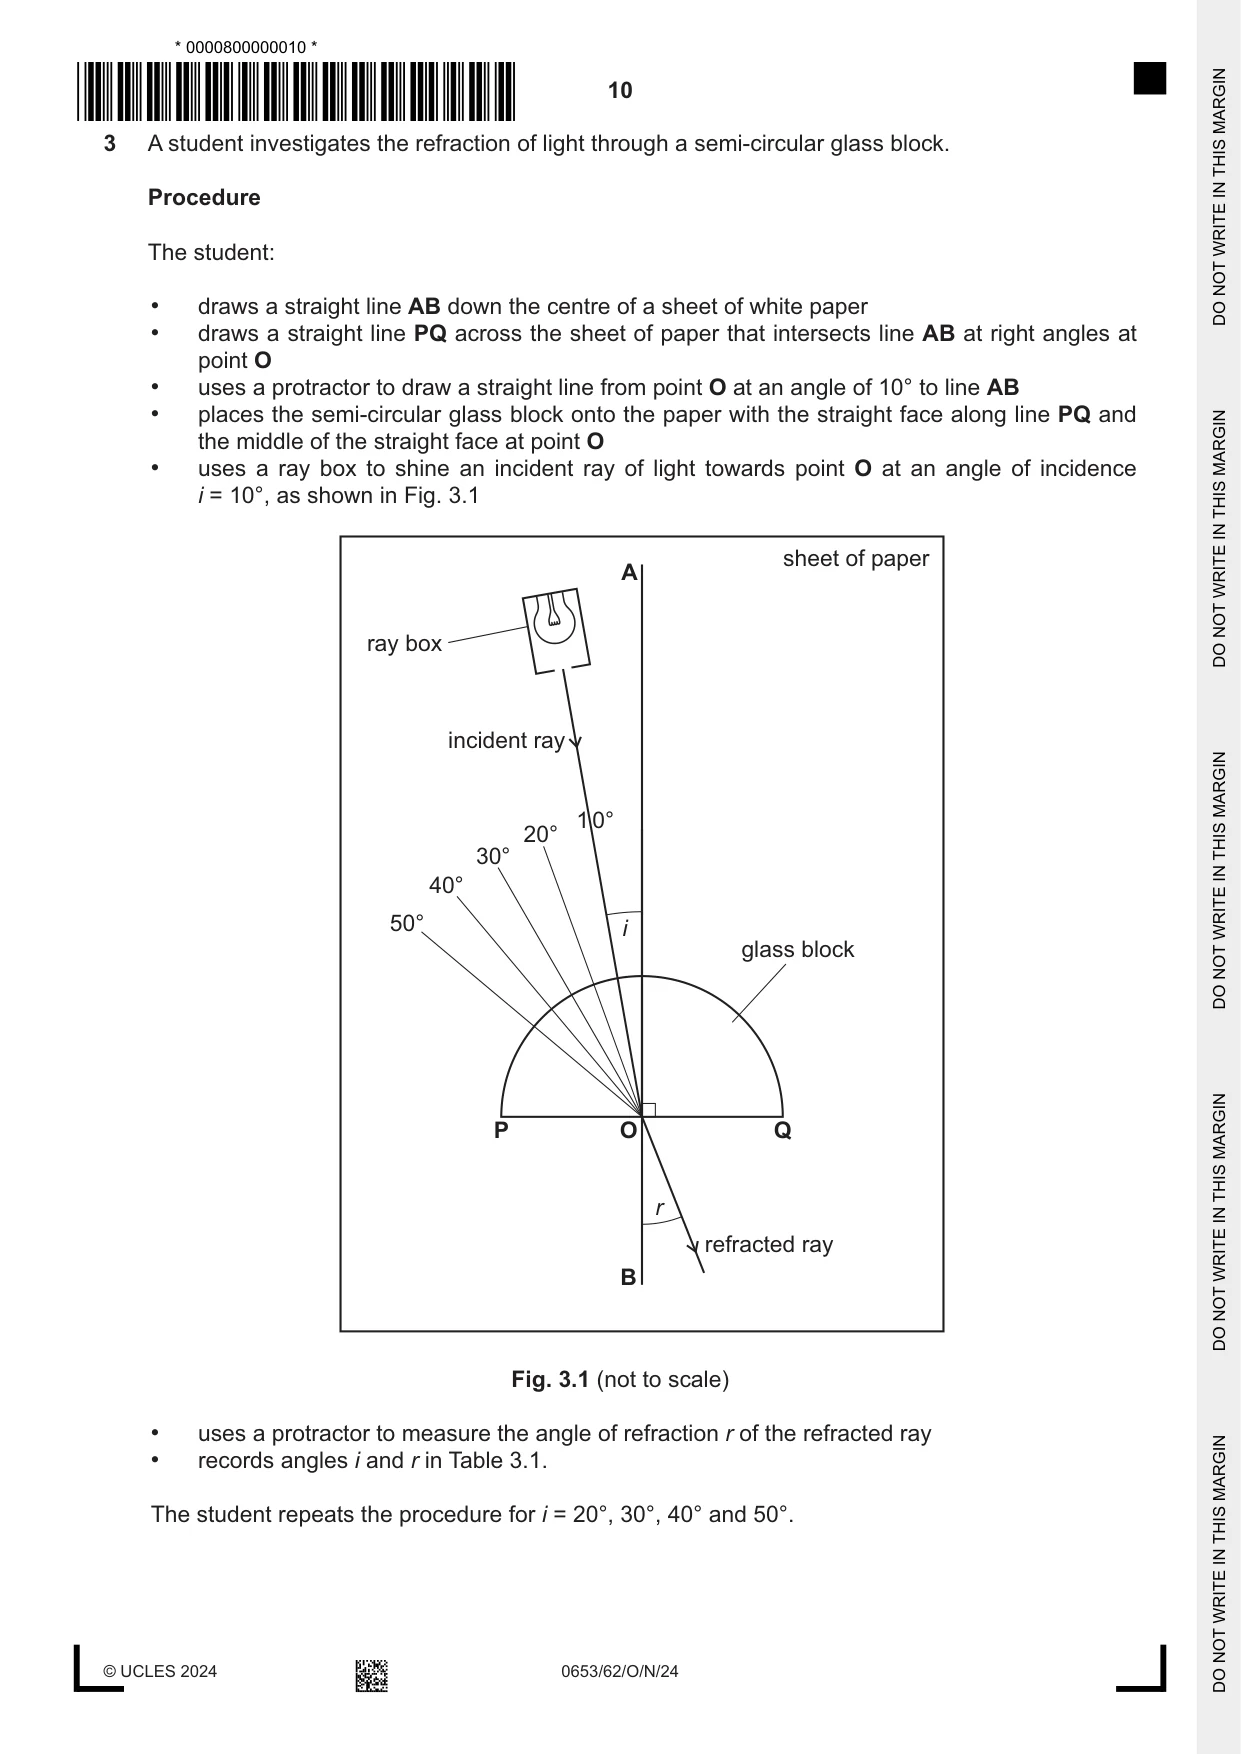
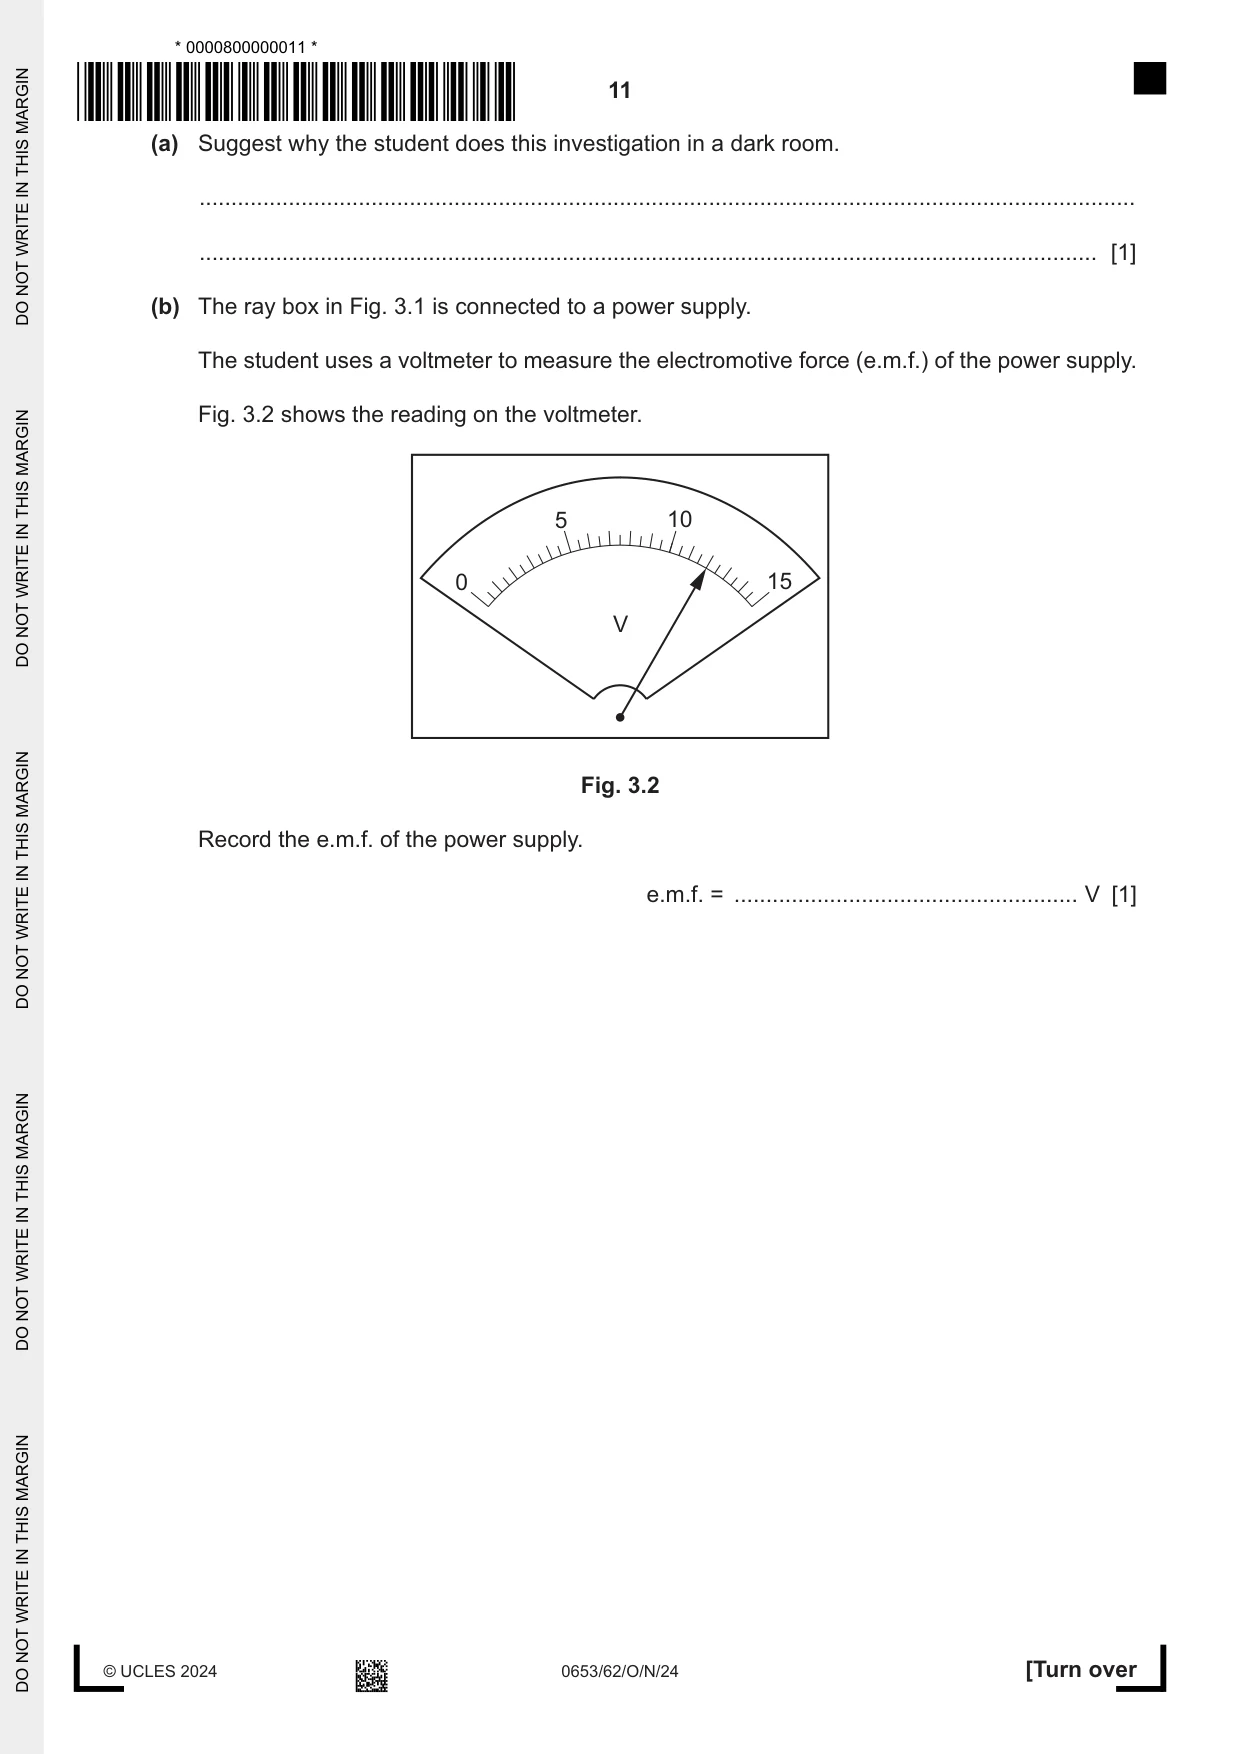
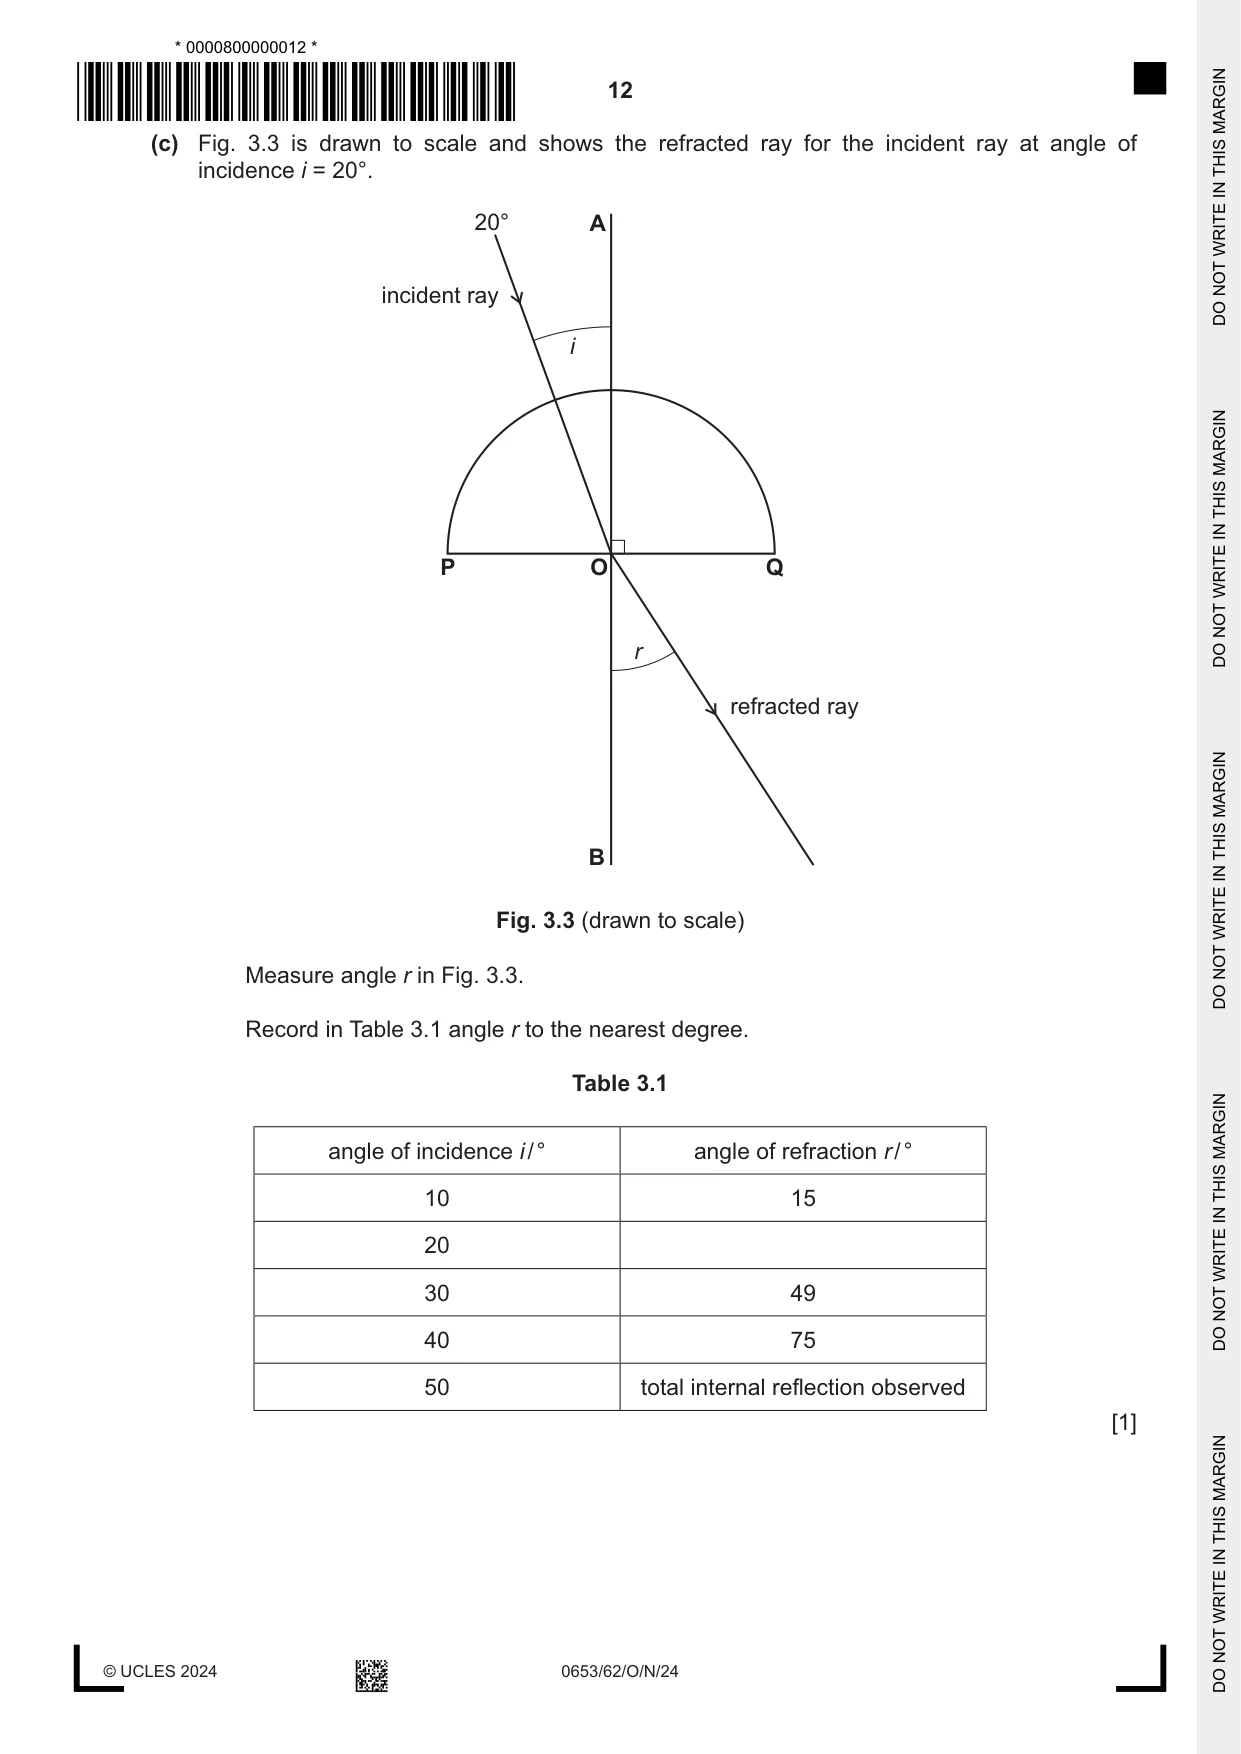
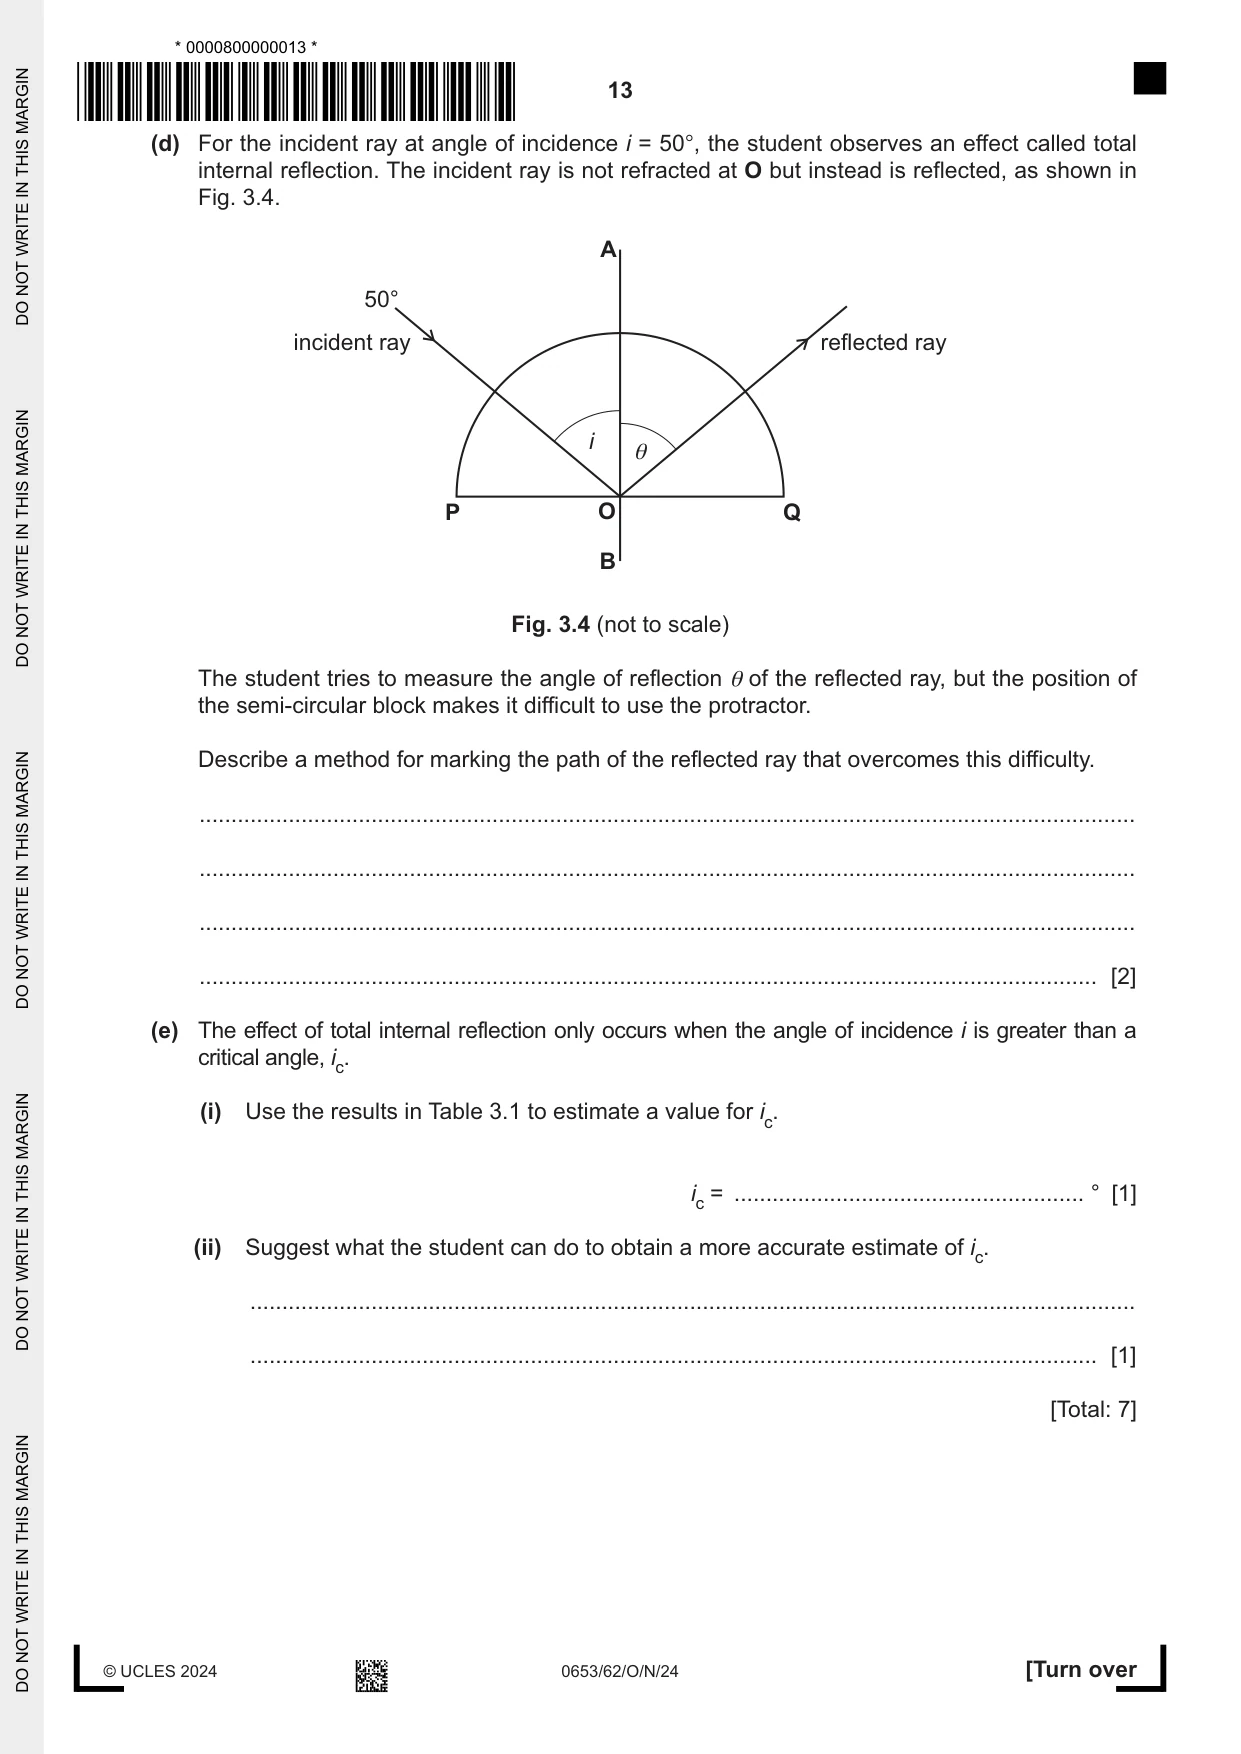
3 A student investigates the refraction of light through a semi-circular glass block. Procedure The student: • draws a straight line AB down the centre of a sheet of white paper • draws a straight line PQ across the sheet of paper that intersects line AB at right angles at point O • uses a protractor to draw a straight line from point O at an angle of 10° to line AB • places the semi-circular glass block onto the paper with the straight face along line PQ and the middle of the straight face at point O • uses a ray box to shine an incident ray of light towards point O at an angle of incidence i = 10°, as shown in Fig. 3.1 sheet of paper A ray box incident ray 1 0° 20° 30° 40° 50° i glass block P O Q r refracted ray B Fig. 3.1 (not to scale) • uses a protractor to measure the angle of refraction r of the refracted ray • records angles i and r in Table 3.1. The student repeats the procedure for i = 20°, 30°, 40° and 50°. (a) Suggest why the student does this investigation in a dark room. ................................................................................................................................................... ............................................................................................................................................. [1] (b) The ray box in Fig. 3.1 is connected to a power supply. The student uses a voltmeter to measure the electromotive force (e.m.f.) of the power supply. Fig. 3.2 shows the reading on the voltmeter. 5 10 0 15 V Fig. 3.2 Record the e.m.f. of the power supply. e.m.f. = ...................................................... V [1] (c) Fig. 3.3 is drawn to scale and shows the refracted ray for the incident ray at angle of incidence i = 20°. 20° A incident ray i P O Q r refracted ray B Fig. 3.3 (drawn to scale) Measure angle r in Fig. 3.3. Record in Table 3.1 angle r to the nearest degree. Table 3.1 angle of incidence i / ° angle of refraction r / ° 10 15 20 30 49 40 75 50 total internal reflection observed [1] (d) For the incident ray at angle of incidence i = 50°, the student observes an effect called total internal reflection. The incident ray is not refracted at O but instead is reflected, as shown in Fig. 3.4. A 50° incident ray reflected ray i θ P O Q B Fig. 3.4 (not to scale) The student tries to measure the angle of reflection θ of the reflected ray, but the position of the semi-circular block makes it difficult to use the protractor. Describe a method for marking the path of the reflected ray that overcomes this difficulty. ................................................................................................................................................... ................................................................................................................................................... ................................................................................................................................................... ............................................................................................................................................. [2] (e) The effect of total internal reflection only occurs when the angle of incidence i is greater than a critical angle, ic. (i) Use the results in Table 3.1 to estimate a value for ic. ic = ....................................................... ° [1] (ii) Suggest what the student can do to obtain a more accurate estimate of ic. ........................................................................................................................................... ..................................................................................................................................... [1] [Total: 7]
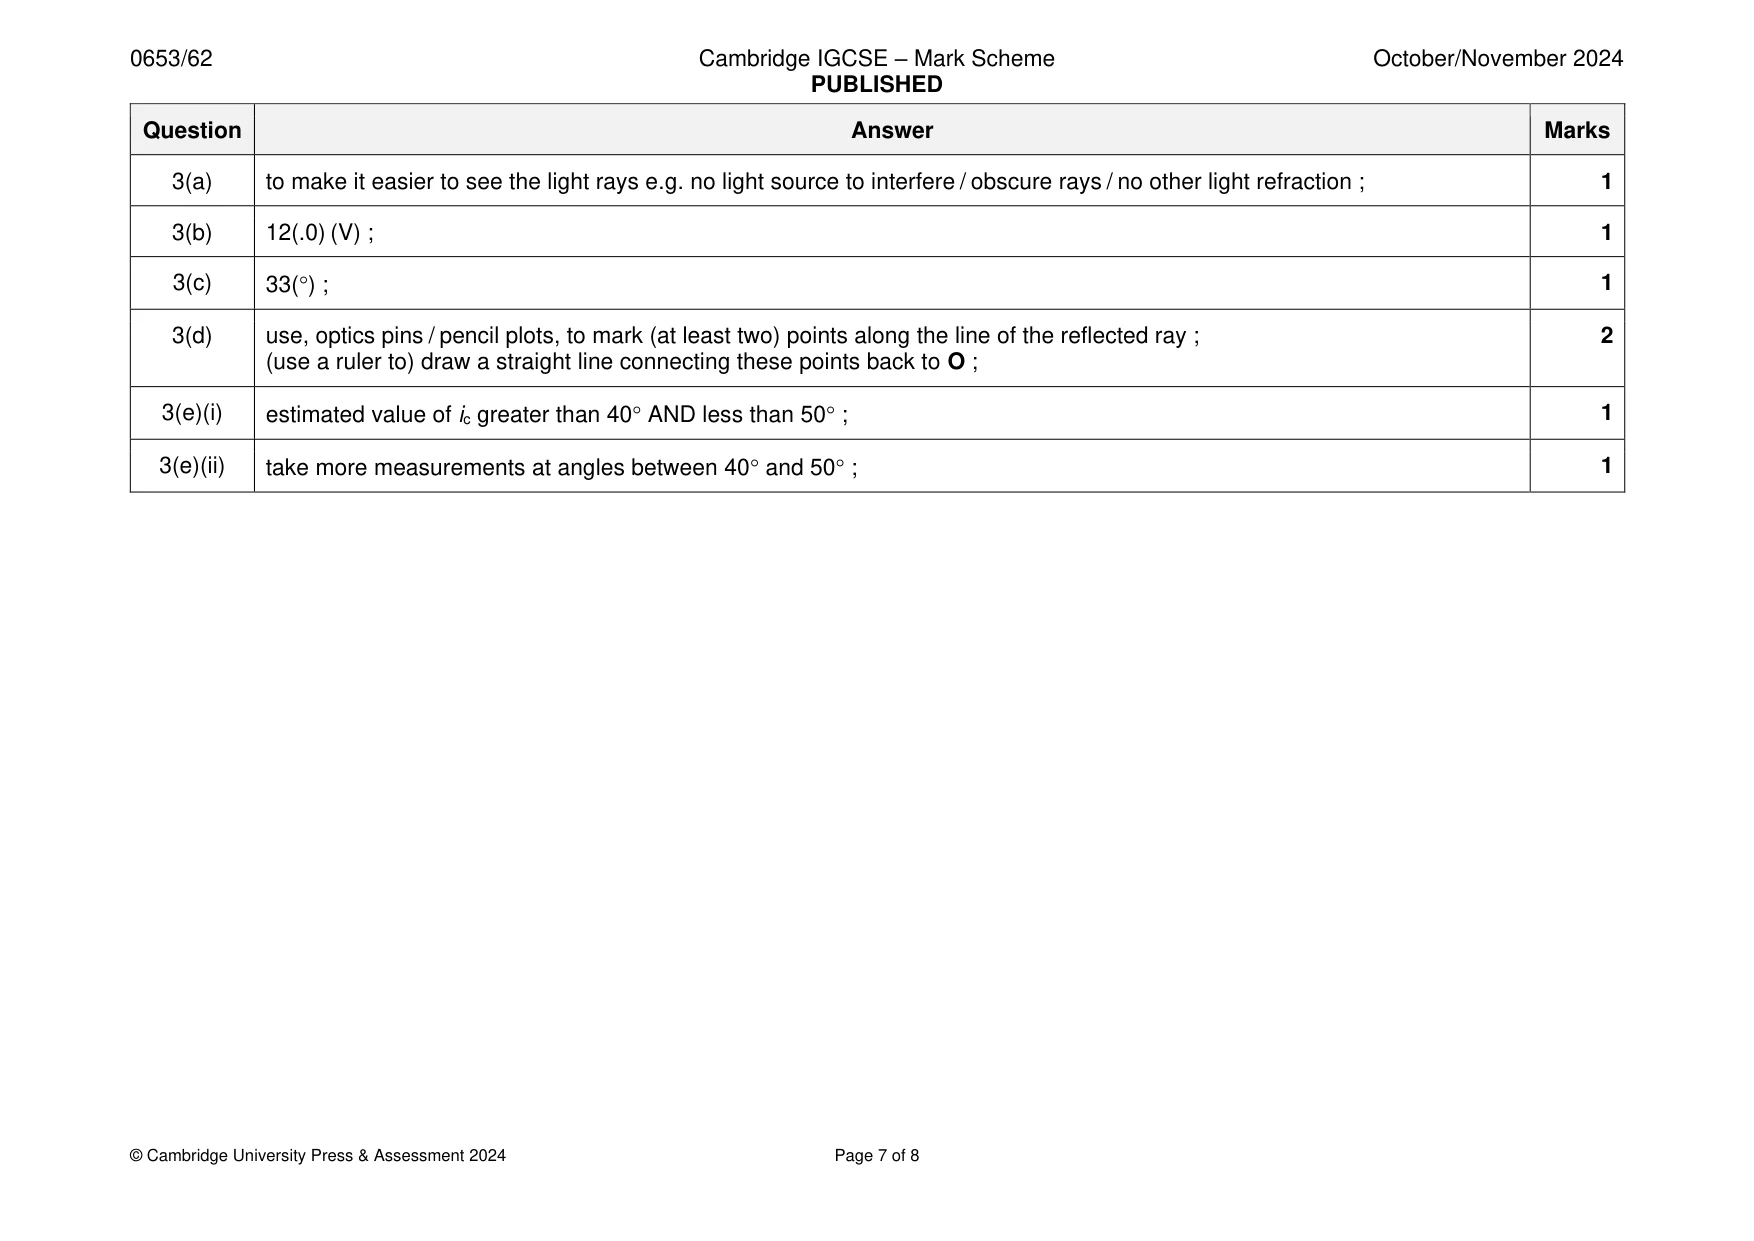
Mark scheme: 3(a) to make it easier to see the light rays e.g. no light source to interfere / obscure rays / no other light refraction ; 1 3(b) 12(.0) (V) ; 1 3(c) 33() ; 1 3(d) use, optics pins / pencil plots, to mark (at least two) points along the line of the reflected ray ; 2 (use a ruler to) draw a straight line connecting these points back to O ; 3(e)(i) estimated value of ic greater than 40 AND less than 50 ; 1 3(e)(ii) take more measurements at angles between 40 and 50 ; 1
Q4 · A spring of diameter D made using a coil of metal wire
4 Fig. 4.1 shows a spring of diameter D made using a coil of metal wire. D Fig. 4.1 The spring stretches with an extension x when a load F is applied to the spring. The spring constant k is a measure of the elastic stiffness of the spring. The spring constant k is calculated using the equation shown. F k = x Plan an investigation to determine the relationship between the diameter D of the spring and the spring constant k. You are provided with: • springs of different diameter. You may use any common laboratory apparatus in your plan. In your plan, include: • any apparatus needed • a brief description of the method, including what you will measure and any safety precautions you will take • the variables you will keep constant • a results table to record your measurements (you do not need to enter any readings in the table) • how you will process your results to draw a conclusion. .......................................................................................................................................................... .......................................................................................................................................................... .......................................................................................................................................................... .......................................................................................................................................................... .......................................................................................................................................................... .......................................................................................................................................................... .......................................................................................................................................................... .......................................................................................................................................................... .......................................................................................................................................................... .......................................................................................................................................................... .......................................................................................................................................................... .......................................................................................................................................................... .......................................................................................................................................................... .......................................................................................................................................................... .................................................................................................................................................... [7]
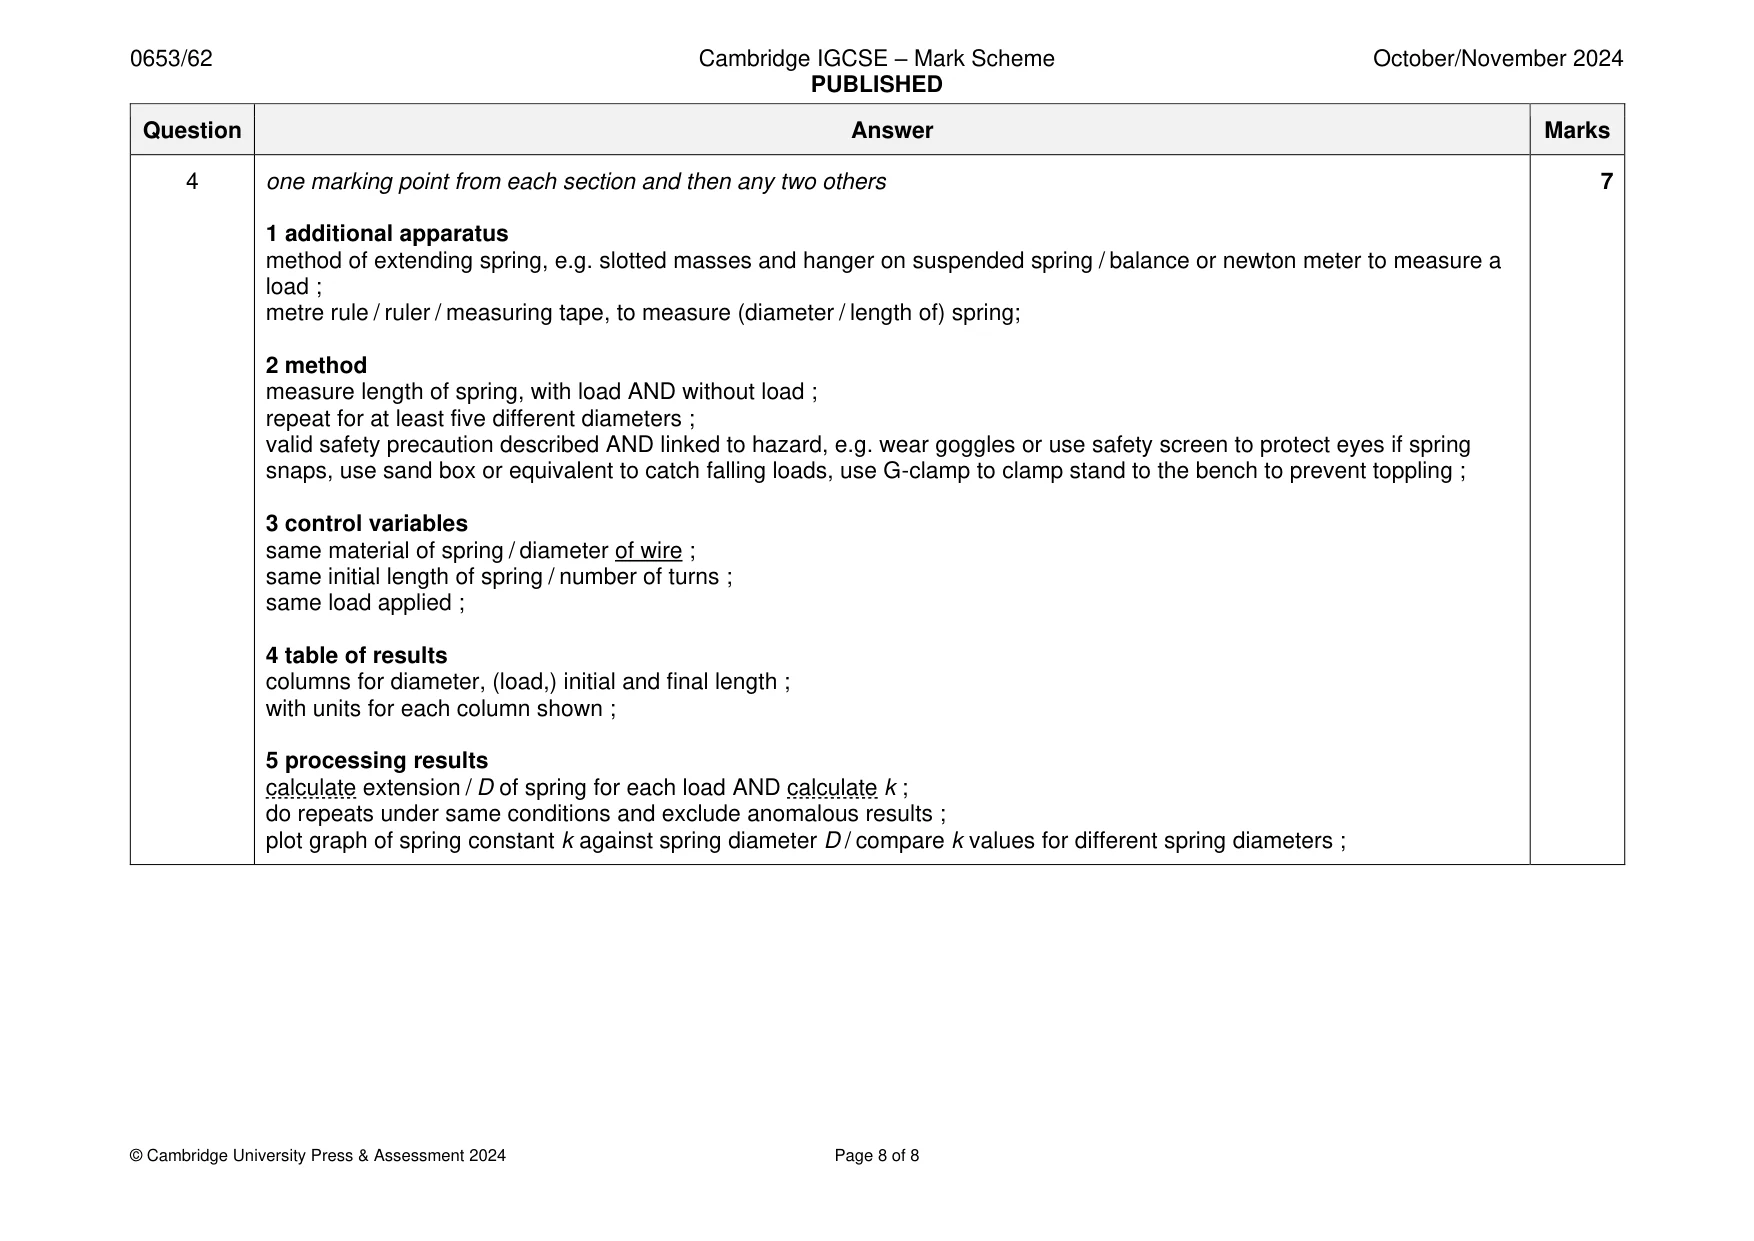
Mark scheme: 4 one marking point from each section and then any two others 7 1 additional apparatus method of extending spring, e.g. slotted masses and hanger on suspended spring / balance or newton meter to measure a load ; metre rule / ruler / measuring tape, to measure (diameter / length of) spring; 2 method measure length of spring, with load AND without load ; repeat for at least five different diameters ; valid safety precaution described AND linked to hazard, e.g. wear goggles or use safety screen to protect eyes if spring snaps, use sand box or equivalent to catch falling loads, use G-clamp to clamp stand to the bench to prevent toppling ; 3 control variables same material of spring / diameter of wire ; same initial length of spring / number of turns ; same load applied ; 4 table of results columns for diameter, (load,) initial and final length ; with units for each column shown ; 5 processing results calculate extension / D of spring for each load AND calculate k ; do repeats under same conditions and exclude anomalous results ; plot graph of spring constant k against spring diameter D / compare k values for different spring diameters ;
What was in this paper
The subtopics covered by these 4 questions, and how many questions each got. Open one in a new tab to see every Cambridge question on it.
What you needed in this session
Cambridge’s own grade thresholds for 2024 Oct/Nov, Paper 6 · Variant 2. A higher threshold means an easier paper — the bar moves with how the cohort did.