Cambridge IGCSE Science - Combined 0653 — 2023 Oct/Nov Paper 6 · Variant 2
0653/62/O/N/23 · 4 questions · 40 marks · ≈45 min
The question paper and its mark scheme, free to read here and free to download. This is Cambridge’s own paper, exactly as it was sat.
Question paper20 pages






Mark scheme8 pages
Answers below. Sit the paper first if you are practising.
Questions as text
Q1 · A student investigates the effect of exercise on the heart rate of a fit and healthy…
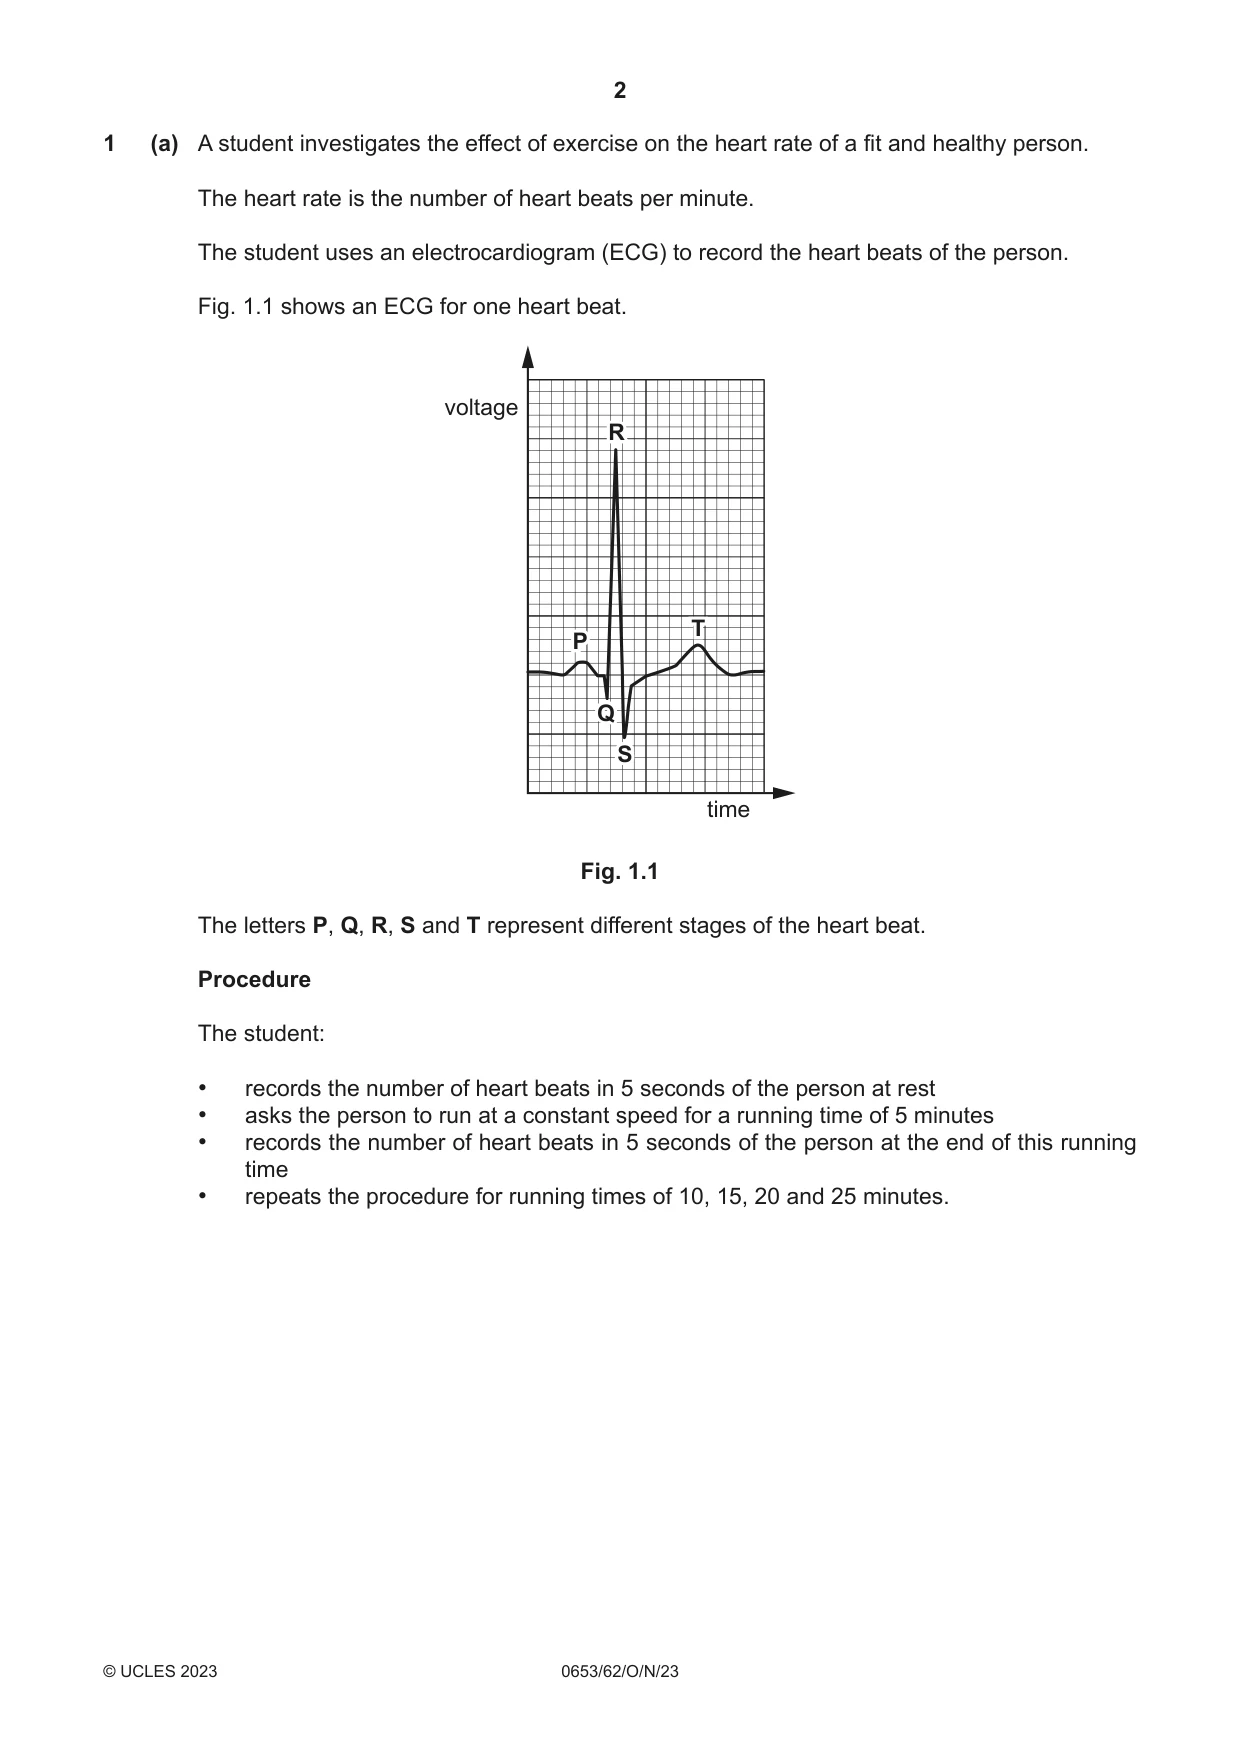
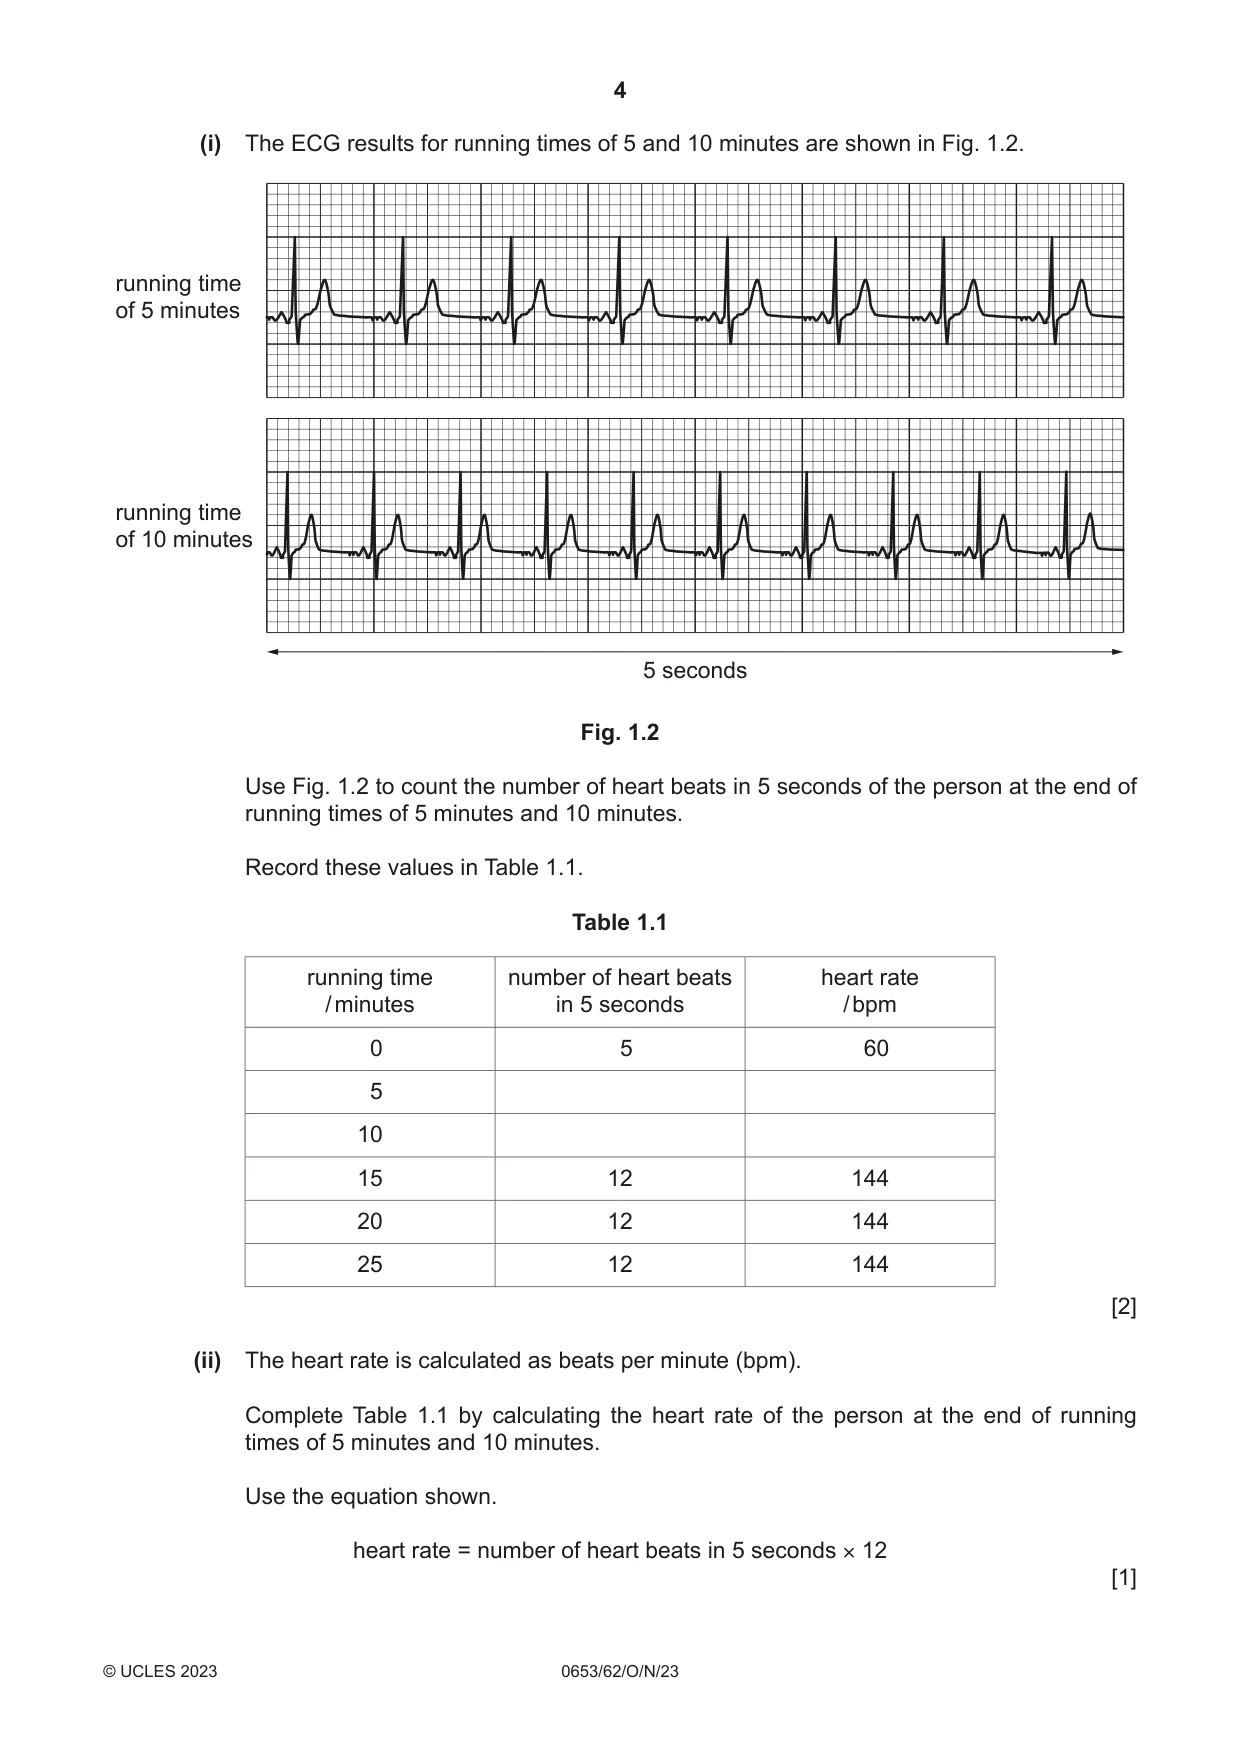
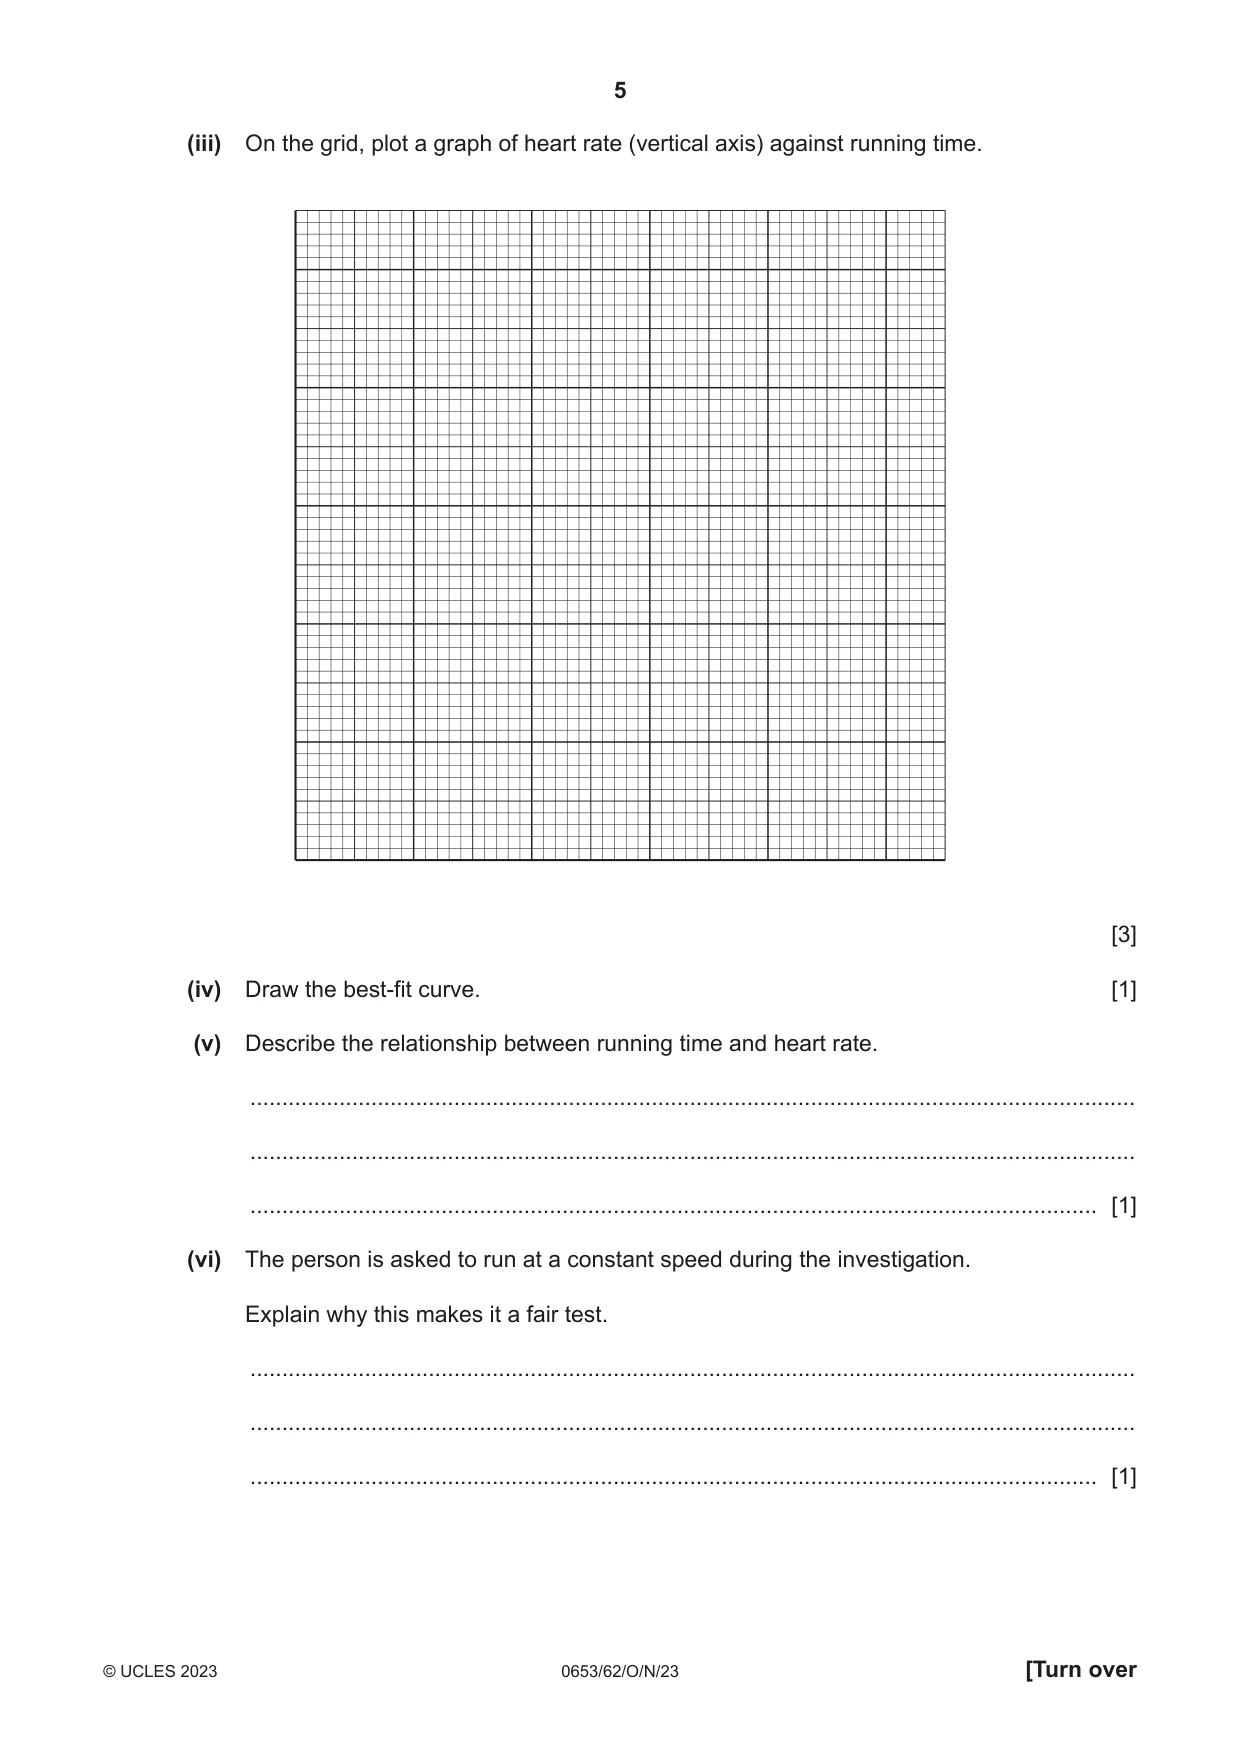
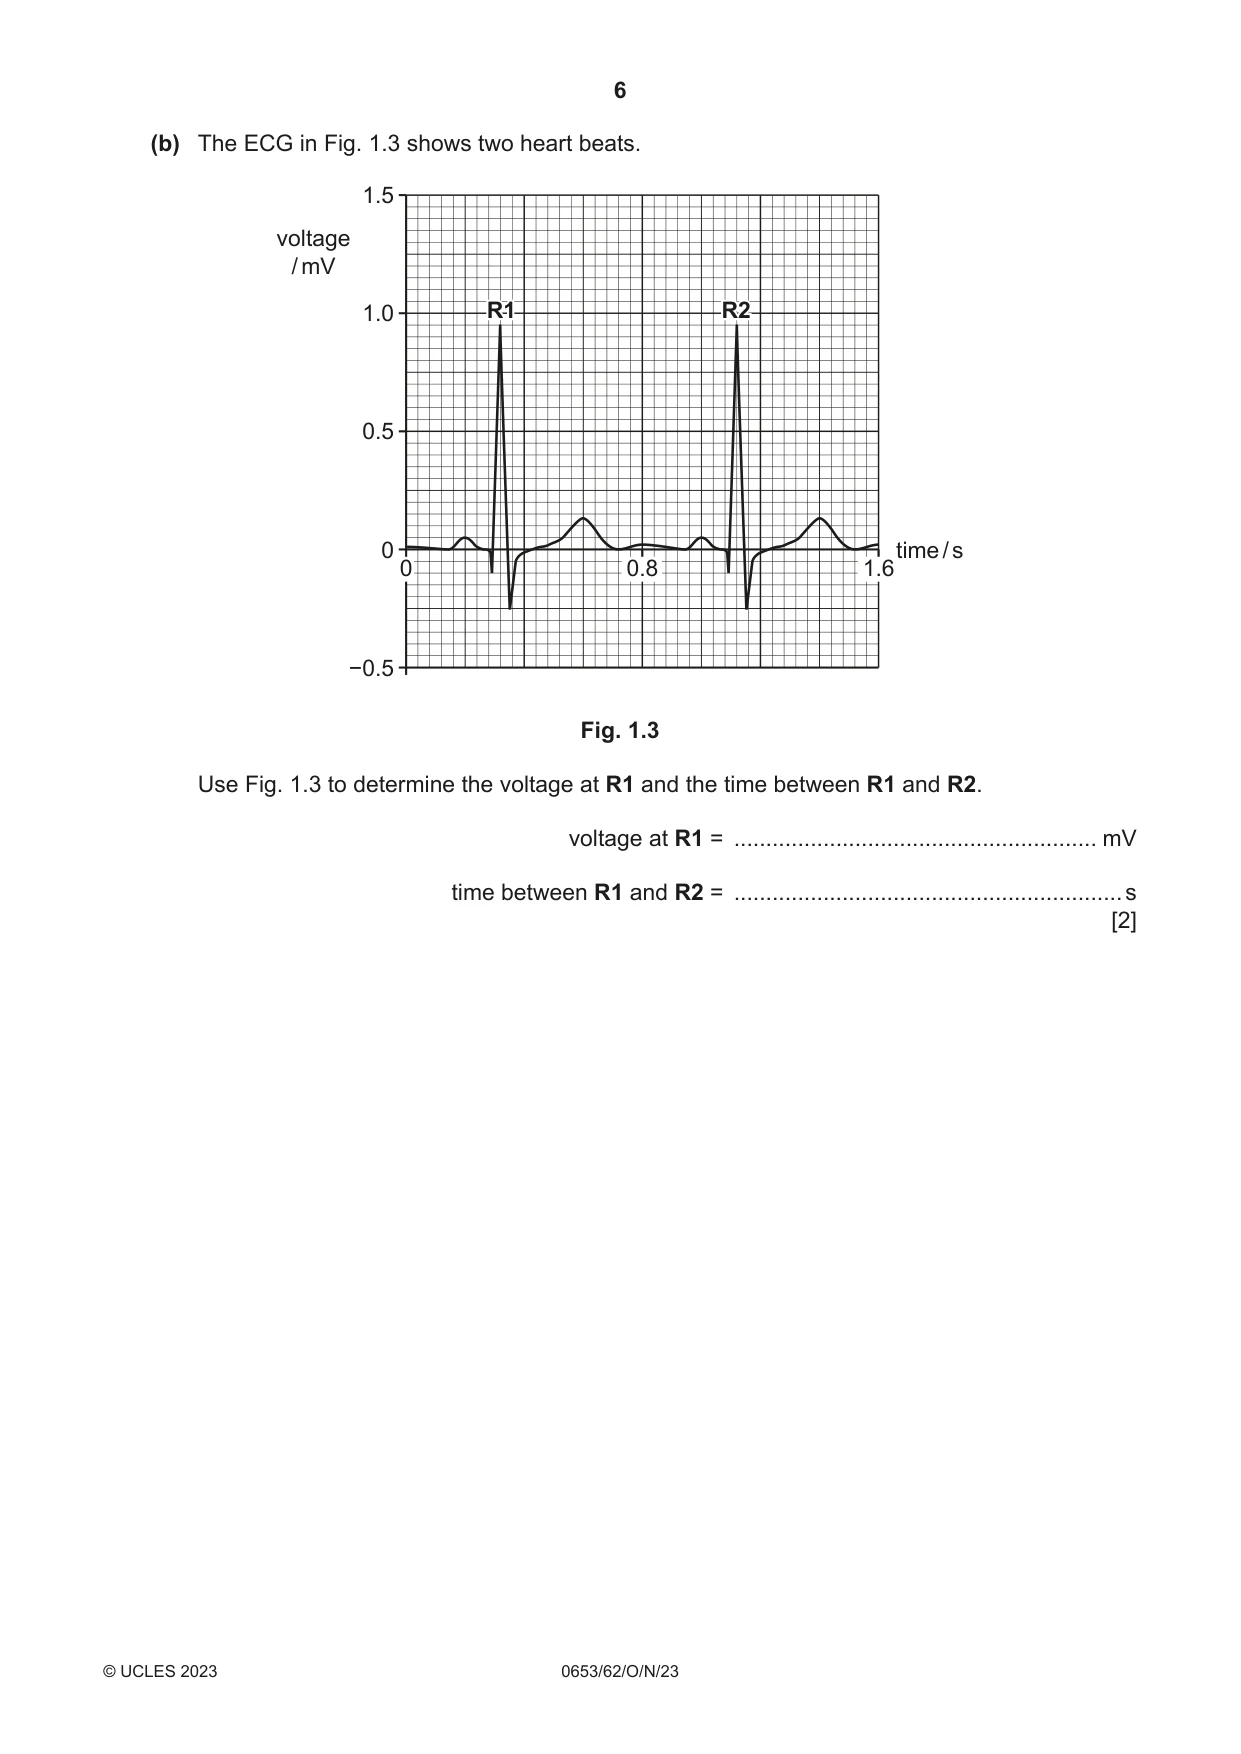
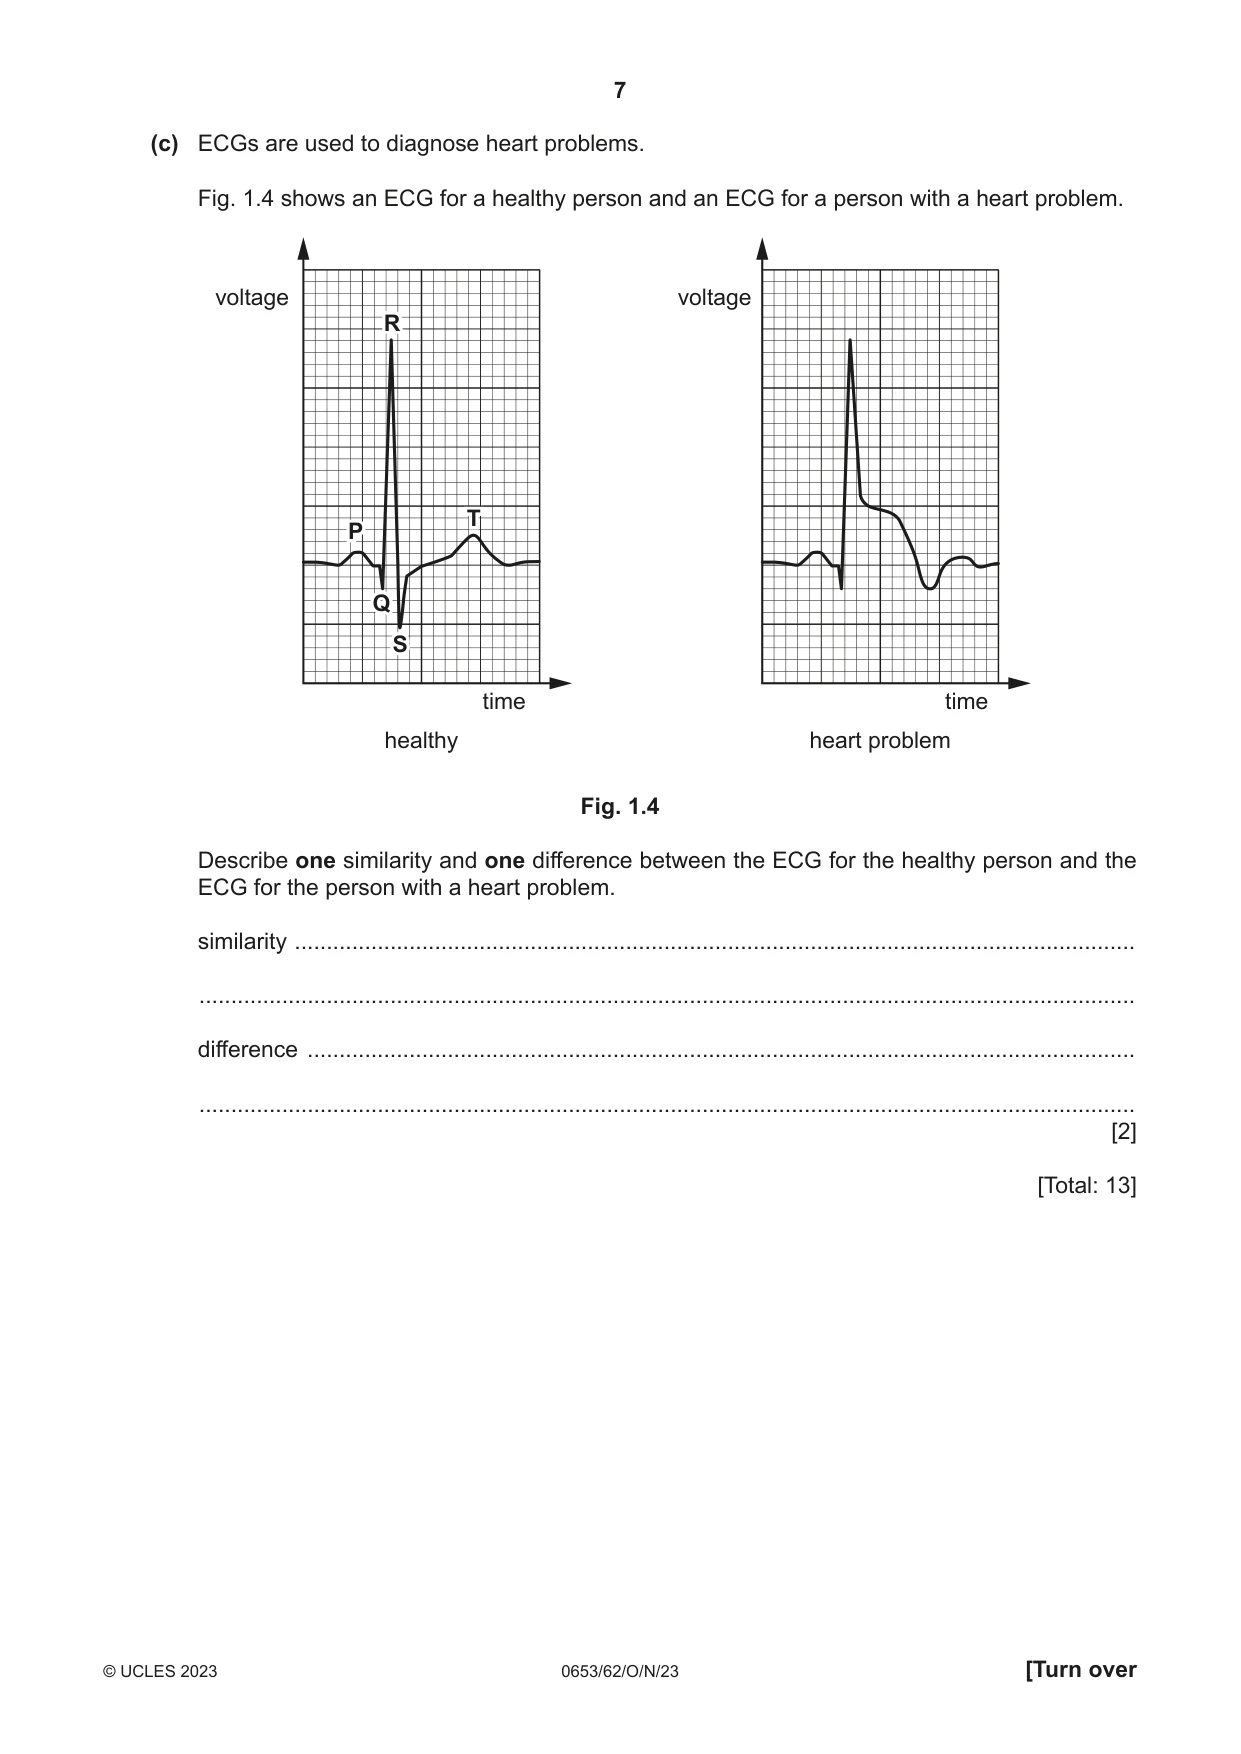
1 (a) A student investigates the effect of exercise on the heart rate of a fit and healthy person. The heart rate is the number of heart beats per minute. The student uses an electrocardiogram (ECG) to record the heart beats of the person. Fig. 1.1 shows an ECG for one heart beat. voltage R T P Q S time Fig. 1.1 The letters P, Q, R, S and T represent different stages of the heart beat. Procedure The student: • records the number of heart beats in 5 seconds of the person at rest • asks the person to run at a constant speed for a running time of 5 minutes • records the number of heart beats in 5 seconds of the person at the end of this running time • repeats the procedure for running times of 10, 15, 20 and 25 minutes. (i) The ECG results for running times of 5 and 10 minutes are shown in Fig. 1.2. running time of 5 minutes running time of 10 minutes 5 seconds Fig. 1.2 Use Fig. 1.2 to count the number of heart beats in 5 seconds of the person at the end of running times of 5 minutes and 10 minutes. Record these values in Table 1.1. Table 1.1 running time number of heart beats heart rate / minutes in 5 seconds / bpm 0 5 60 5 10 15 12 144 20 12 144 25 12 144 [2] (ii) The heart rate is calculated as beats per minute (bpm). Complete Table 1.1 by calculating the heart rate of the person at the end of running times of 5 minutes and 10 minutes. Use the equation shown. heart rate = number of heart beats in 5 seconds × 12 [1] (iii) On the grid, plot a graph of heart rate (vertical axis) against running time. [3] (iv) Draw the best‑fit curve. [1] (v) Describe the relationship between running time and heart rate. ........................................................................................................................................... ........................................................................................................................................... ..................................................................................................................................... [1] (vi) The person is asked to run at a constant speed during the investigation. Explain why this makes it a fair test. ........................................................................................................................................... ........................................................................................................................................... ..................................................................................................................................... [1] (b) The ECG in Fig. 1.3 shows two heart beats. 1.5 voltage / mV 1.0 R1R1 R2R2 0.5 0 time / s 0 0.8 1.6 −0.5 Fig. 1.3 Use Fig. 1.3 to determine the voltage at R1 and the time between R1 and R2. voltage at R1 = ......................................................... mV time between R1 and R2 = ............................................................. s [2] (c) ECGs are used to diagnose heart problems. Fig. 1.4 shows an ECG for a healthy person and an ECG for a person with a heart problem. voltagevoltage voltagevoltage R T P Q S timetime timetime healthyhealthy heartheart problemproblem Fig. 1.4 Describe one similarity and one difference between the ECG for the healthy person and the ECG for the person with a heart problem. similarity .................................................................................................................................... ................................................................................................................................................... difference .................................................................................................................................. ................................................................................................................................................... [2] [Total: 13]
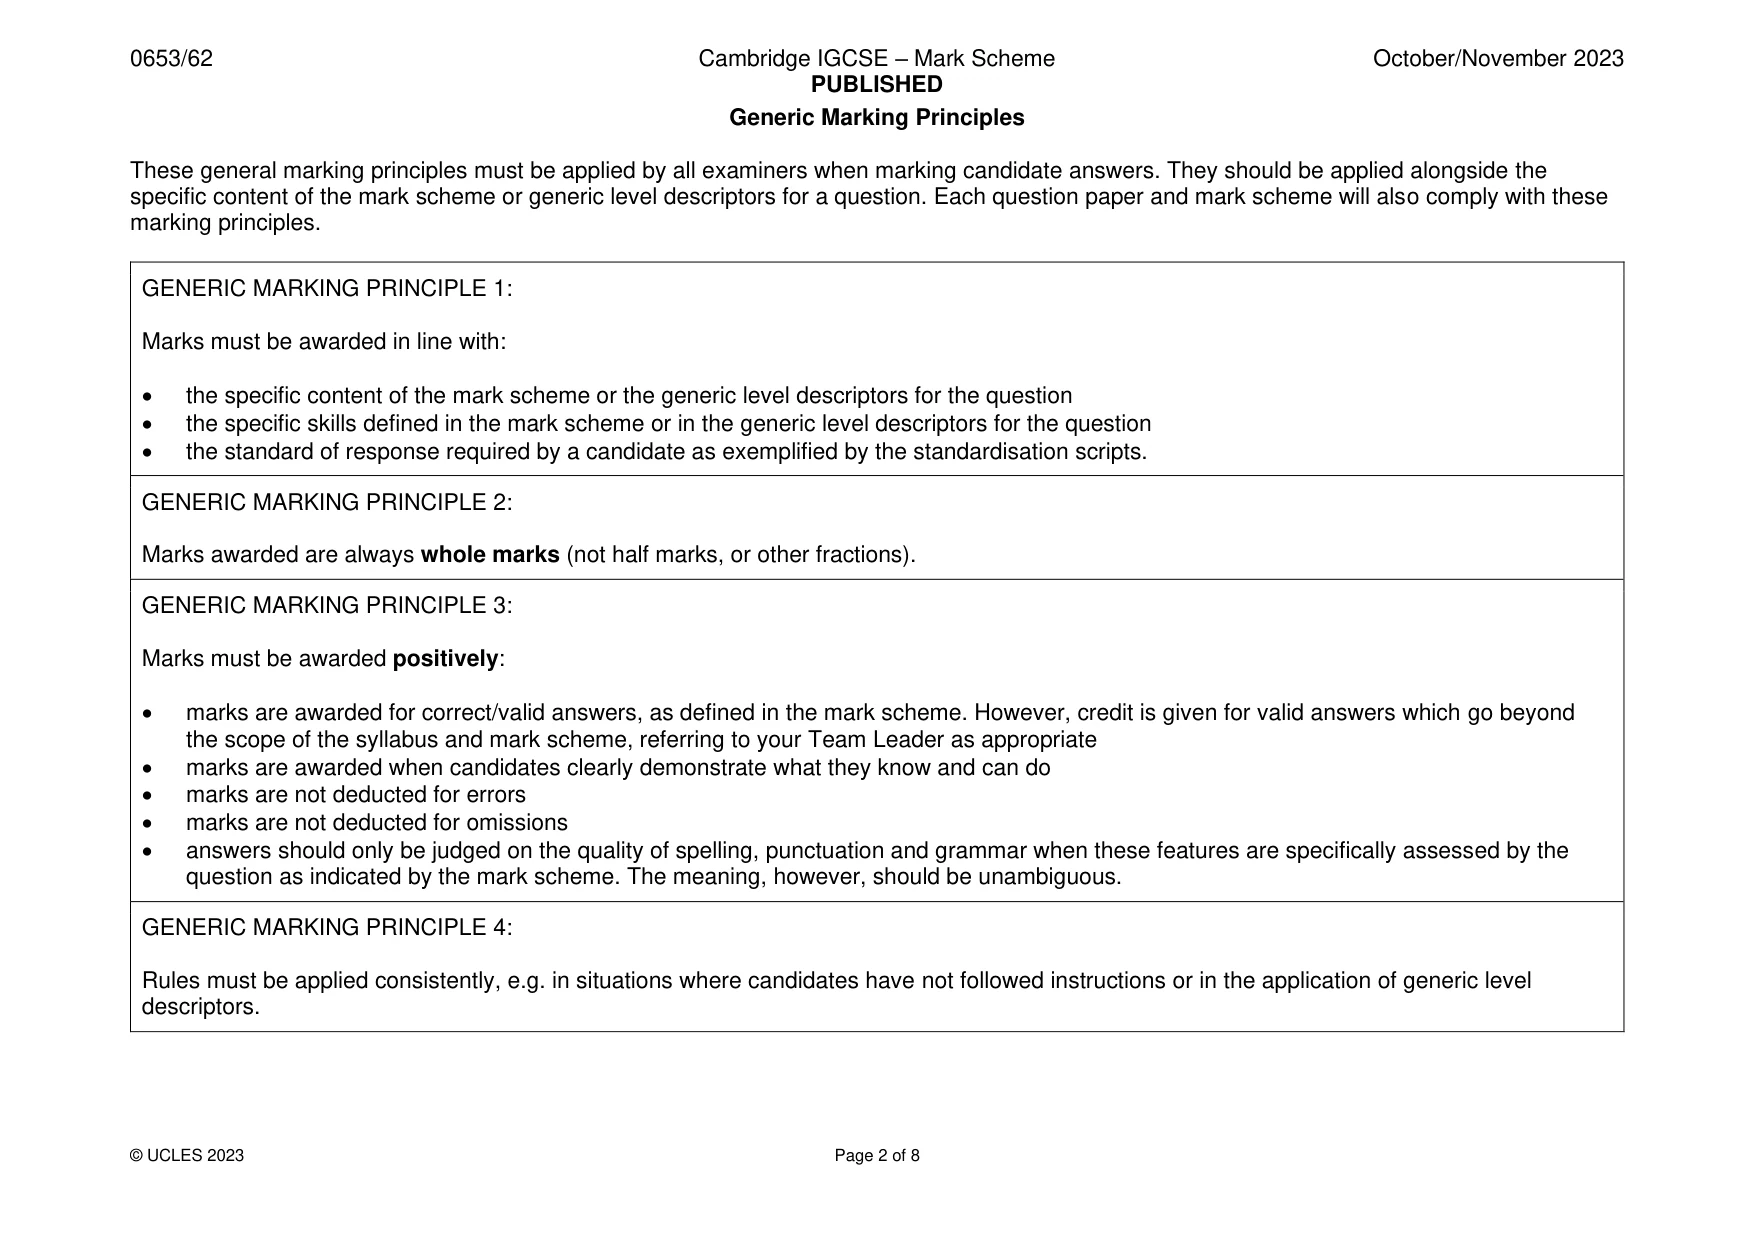
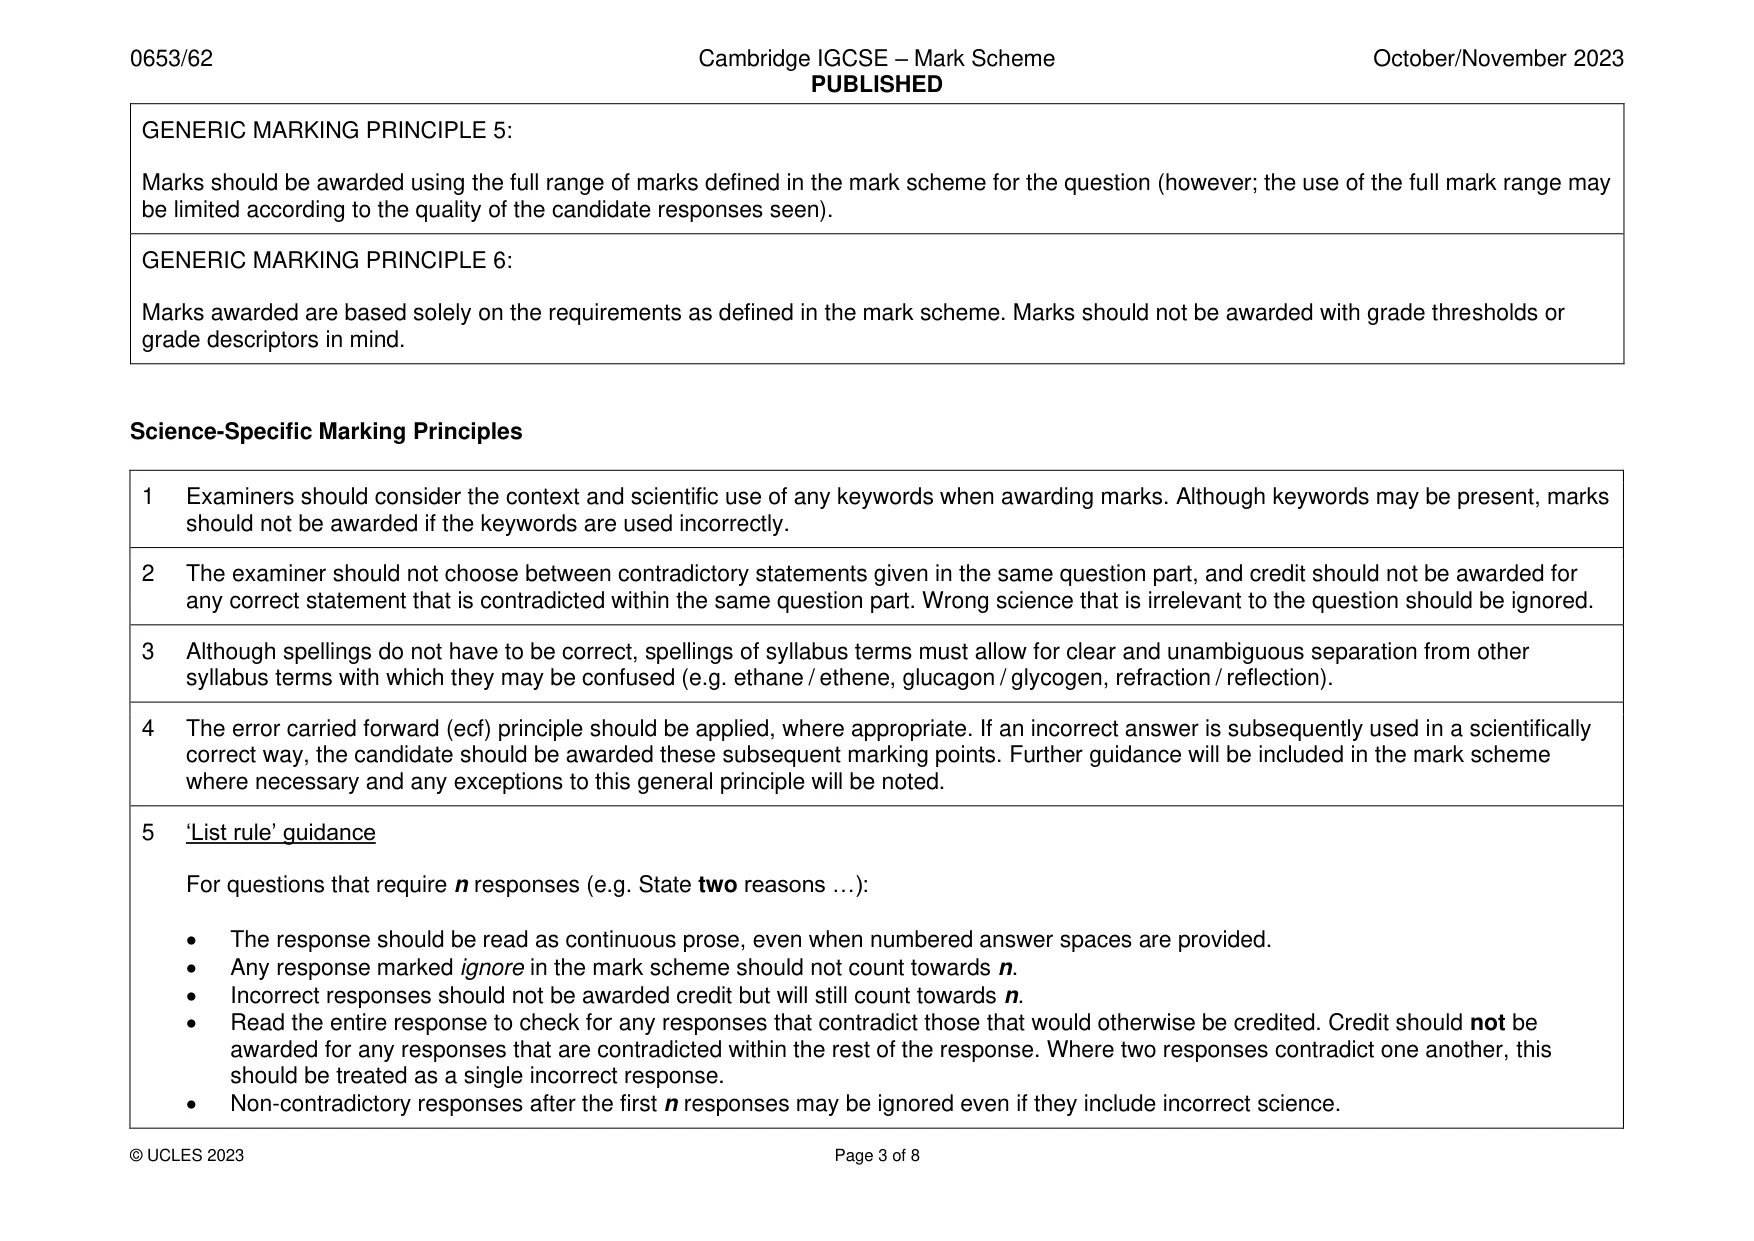
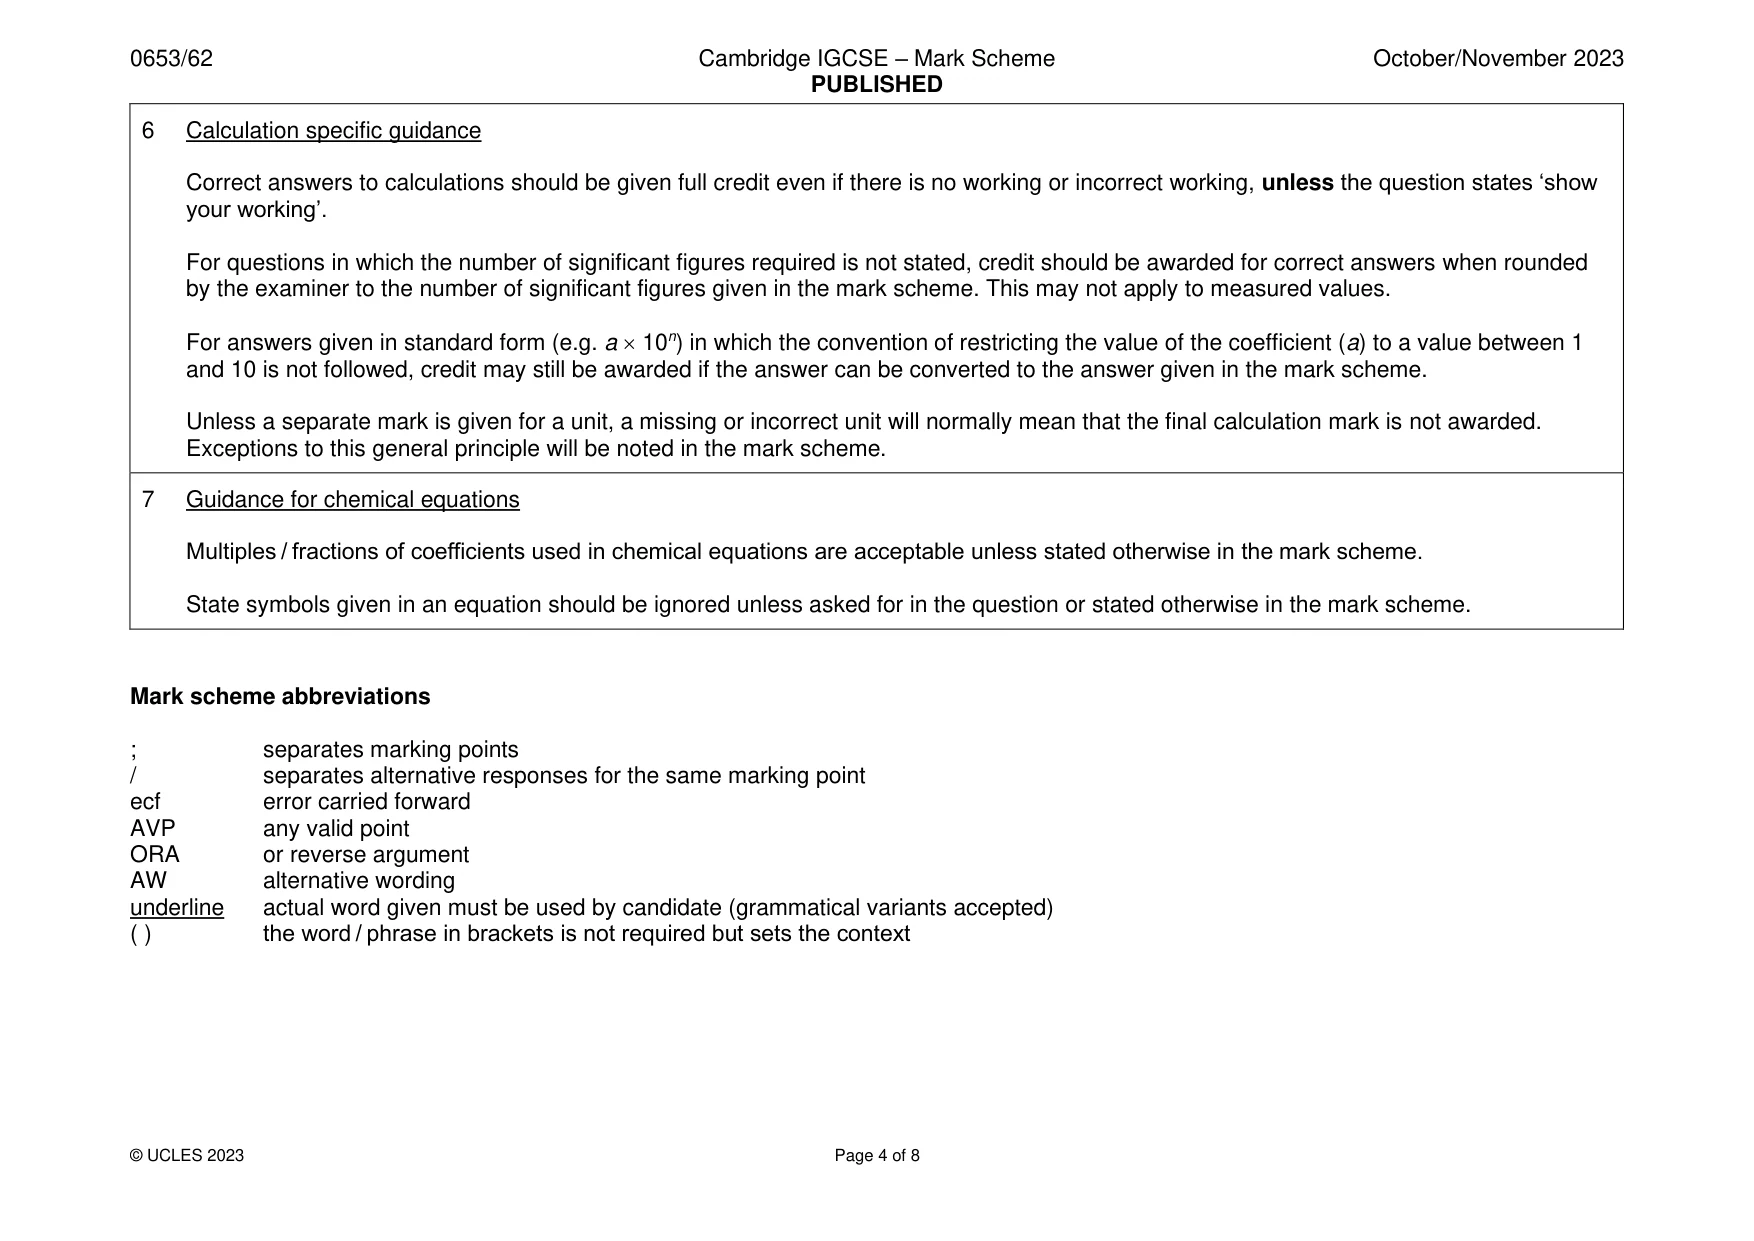
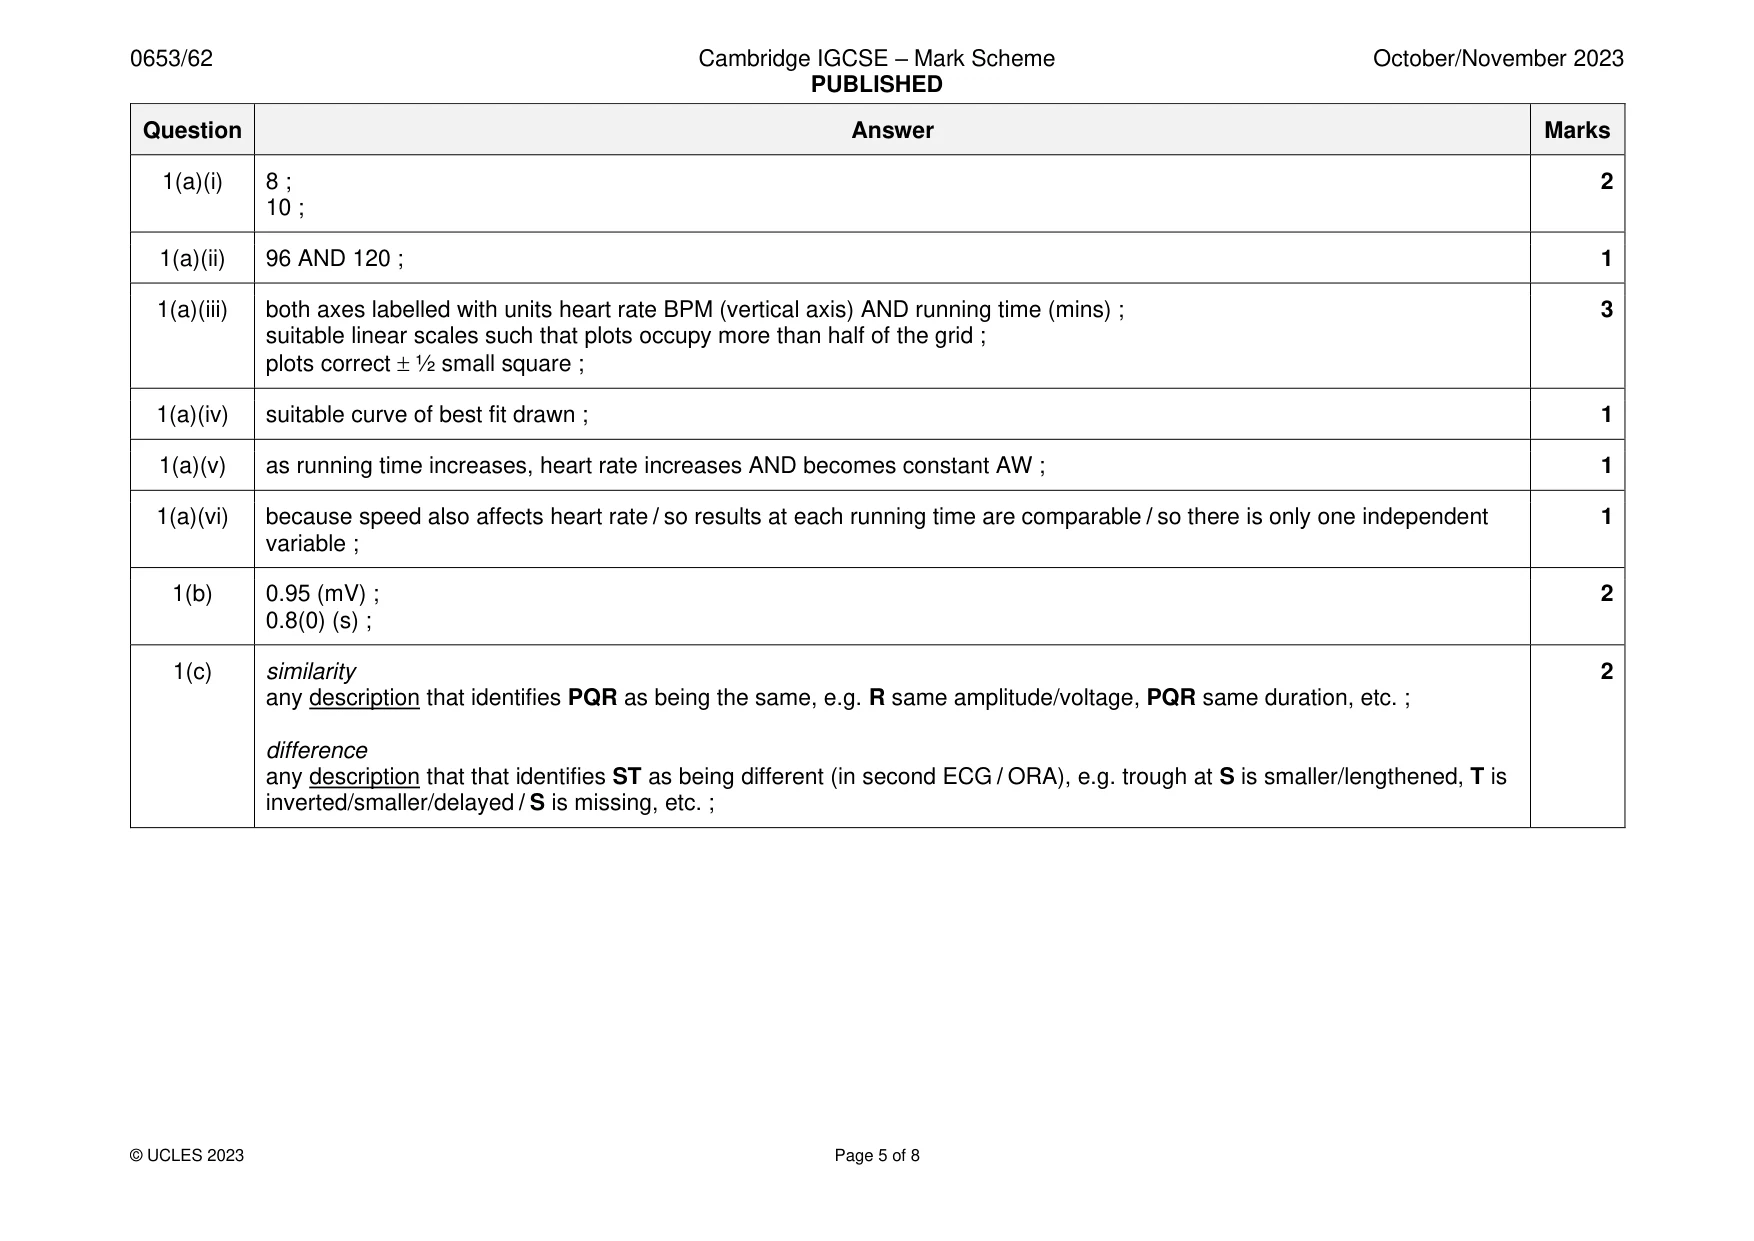
Mark scheme: Question Answer Marks 1(a)(i) 8 ; 2 10 ; 1(a)(ii) 96 AND 120 ; 1 1(a)(iii) both axes labelled with units heart rate BPM (vertical axis) AND running time (mins) ; 3 suitable linear scales such that plots occupy more than half of the grid ; plots correct ½ small square ; 1(a)(iv) suitable curve of best fit drawn ; 1 1(a)(v) as running time increases, heart rate increases AND becomes constant AW ; 1 1(a)(vi) because speed also affects heart rate / so results at each running time are comparable / so there is only one independent 1 variable ; 1(b) 0.95 (mV) ; 2 0.8(0) (s) ; 1(c) similarity 2 any description that identifies PQR as being the same, e.g. R same amplitude/voltage, PQR same duration, etc. ; difference any description that that identifies ST as being different (in second ECG / ORA), e.g. trough at S is smaller/lengthened, T is inverted/smaller/delayed / S is missing, etc. ;
Q2 · A student investigates the reaction between iron and a dilute acid
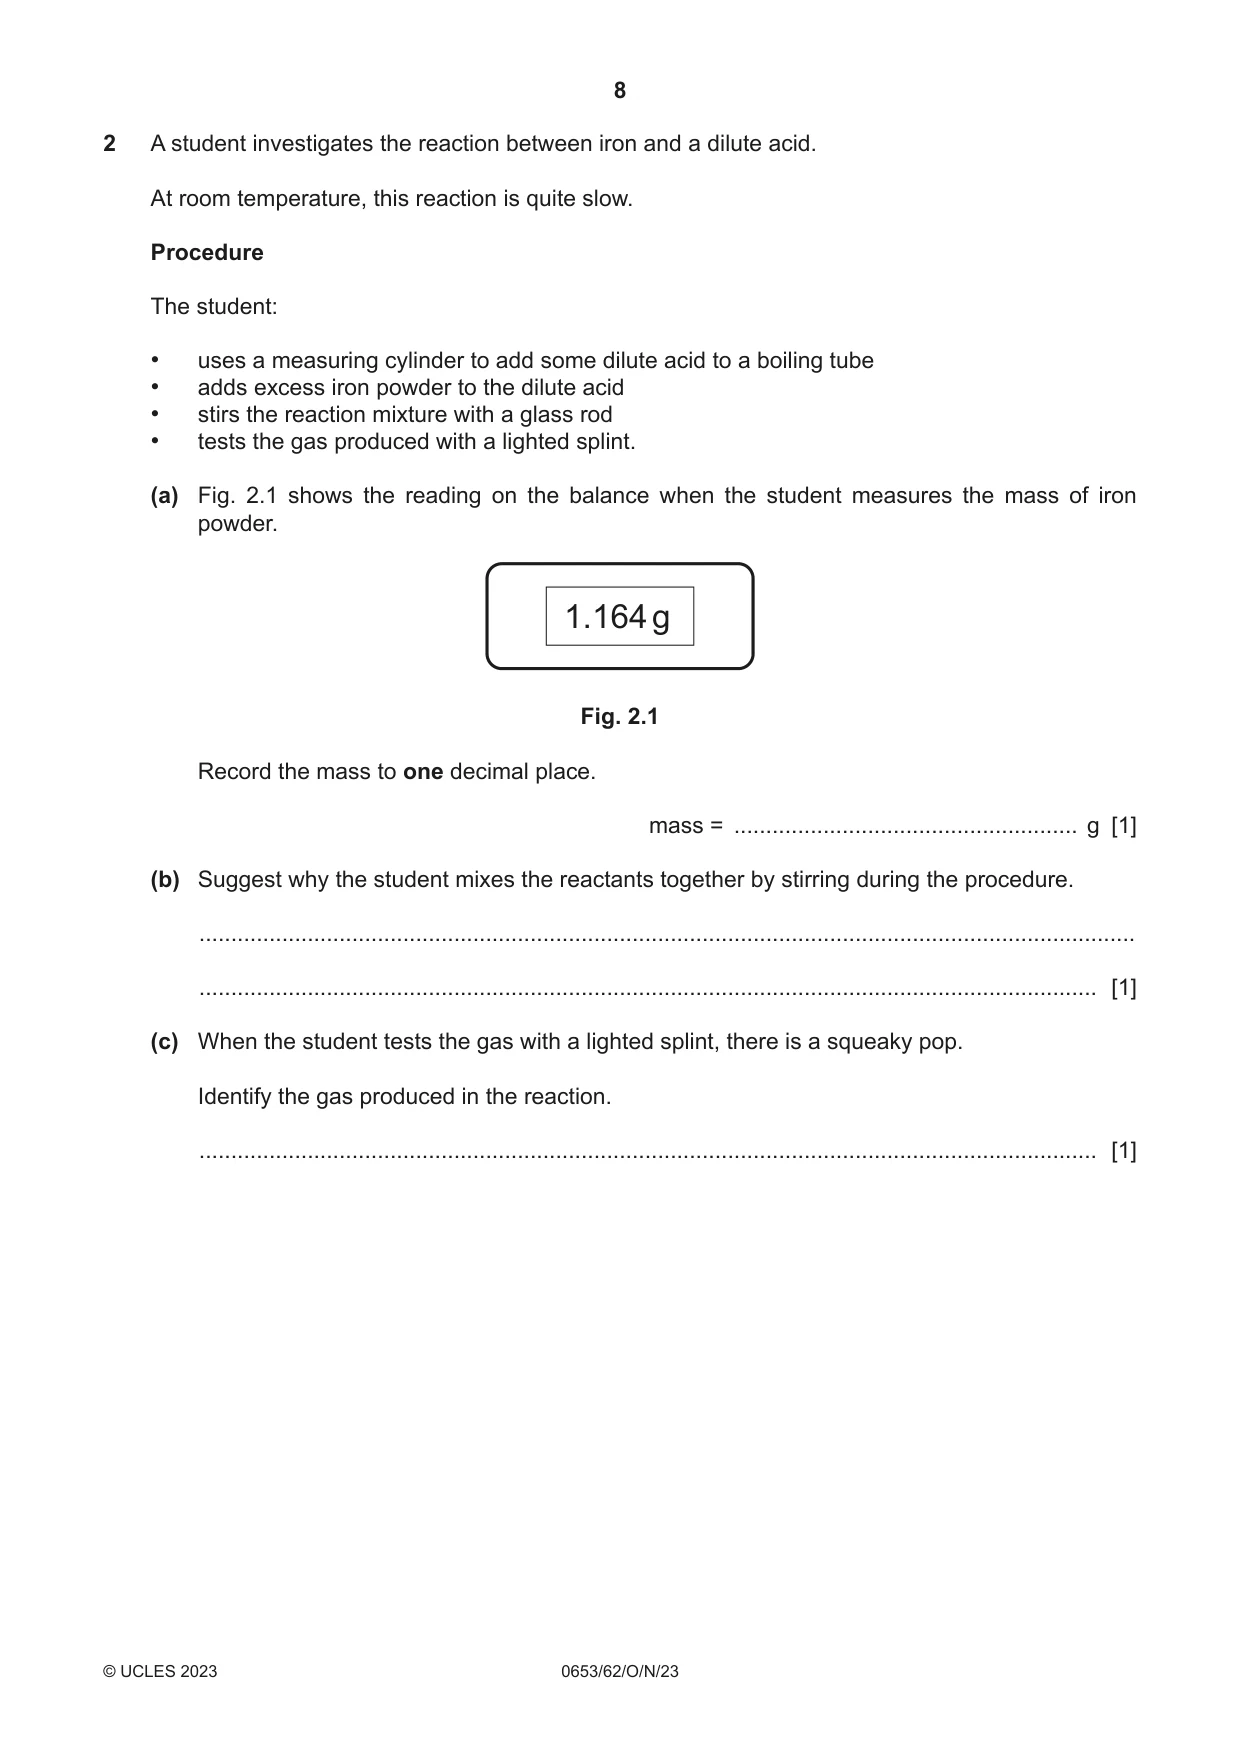
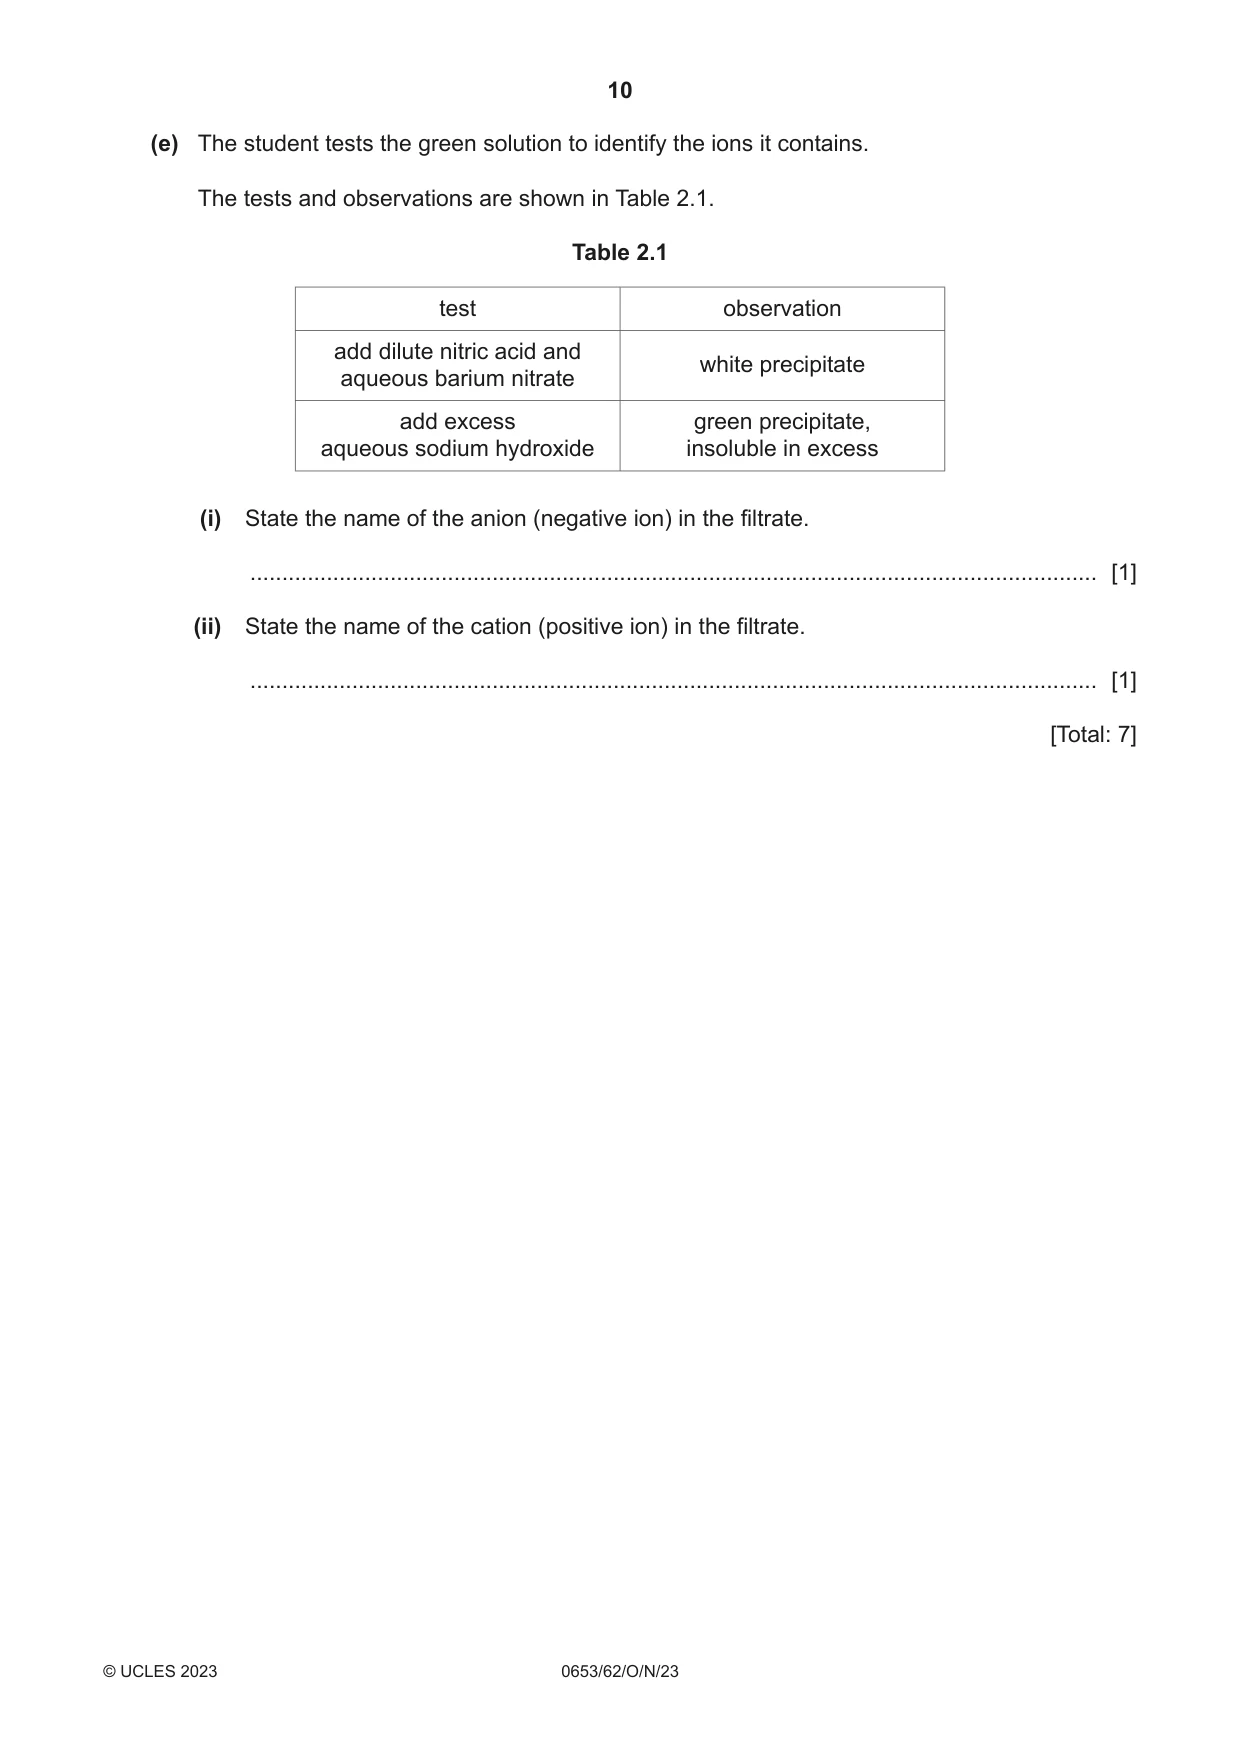
2 A student investigates the reaction between iron and a dilute acid. At room temperature, this reaction is quite slow. Procedure The student: • uses a measuring cylinder to add some dilute acid to a boiling tube • adds excess iron powder to the dilute acid • stirs the reaction mixture with a glass rod • tests the gas produced with a lighted splint. (a) Fig. 2.1 shows the reading on the balance when the student measures the mass of iron powder. 1.164 g Fig. 2.1 Record the mass to one decimal place. mass = ...................................................... g [1] (b) Suggest why the student mixes the reactants together by stirring during the procedure. ................................................................................................................................................... ............................................................................................................................................. [1] (c) When the student tests the gas with a lighted splint, there is a squeaky pop. Identify the gas produced in the reaction. ............................................................................................................................................. [1] (d) The reaction also produces a green solution. The student separates the green solution from the excess iron in the reaction mixture. Draw a labelled diagram of the assembled apparatus that the student uses. Label the residue and the filtrate. [2] (e) The student tests the green solution to identify the ions it contains. The tests and observations are shown in Table 2.1. Table 2.1 test observation add dilute nitric acid and white precipitate aqueous barium nitrate add excess green precipitate, aqueous sodium hydroxide insoluble in excess (i) State the name of the anion (negative ion) in the filtrate. ..................................................................................................................................... [1] (ii) State the name of the cation (positive ion) in the filtrate. ..................................................................................................................................... [1] [Total: 7]
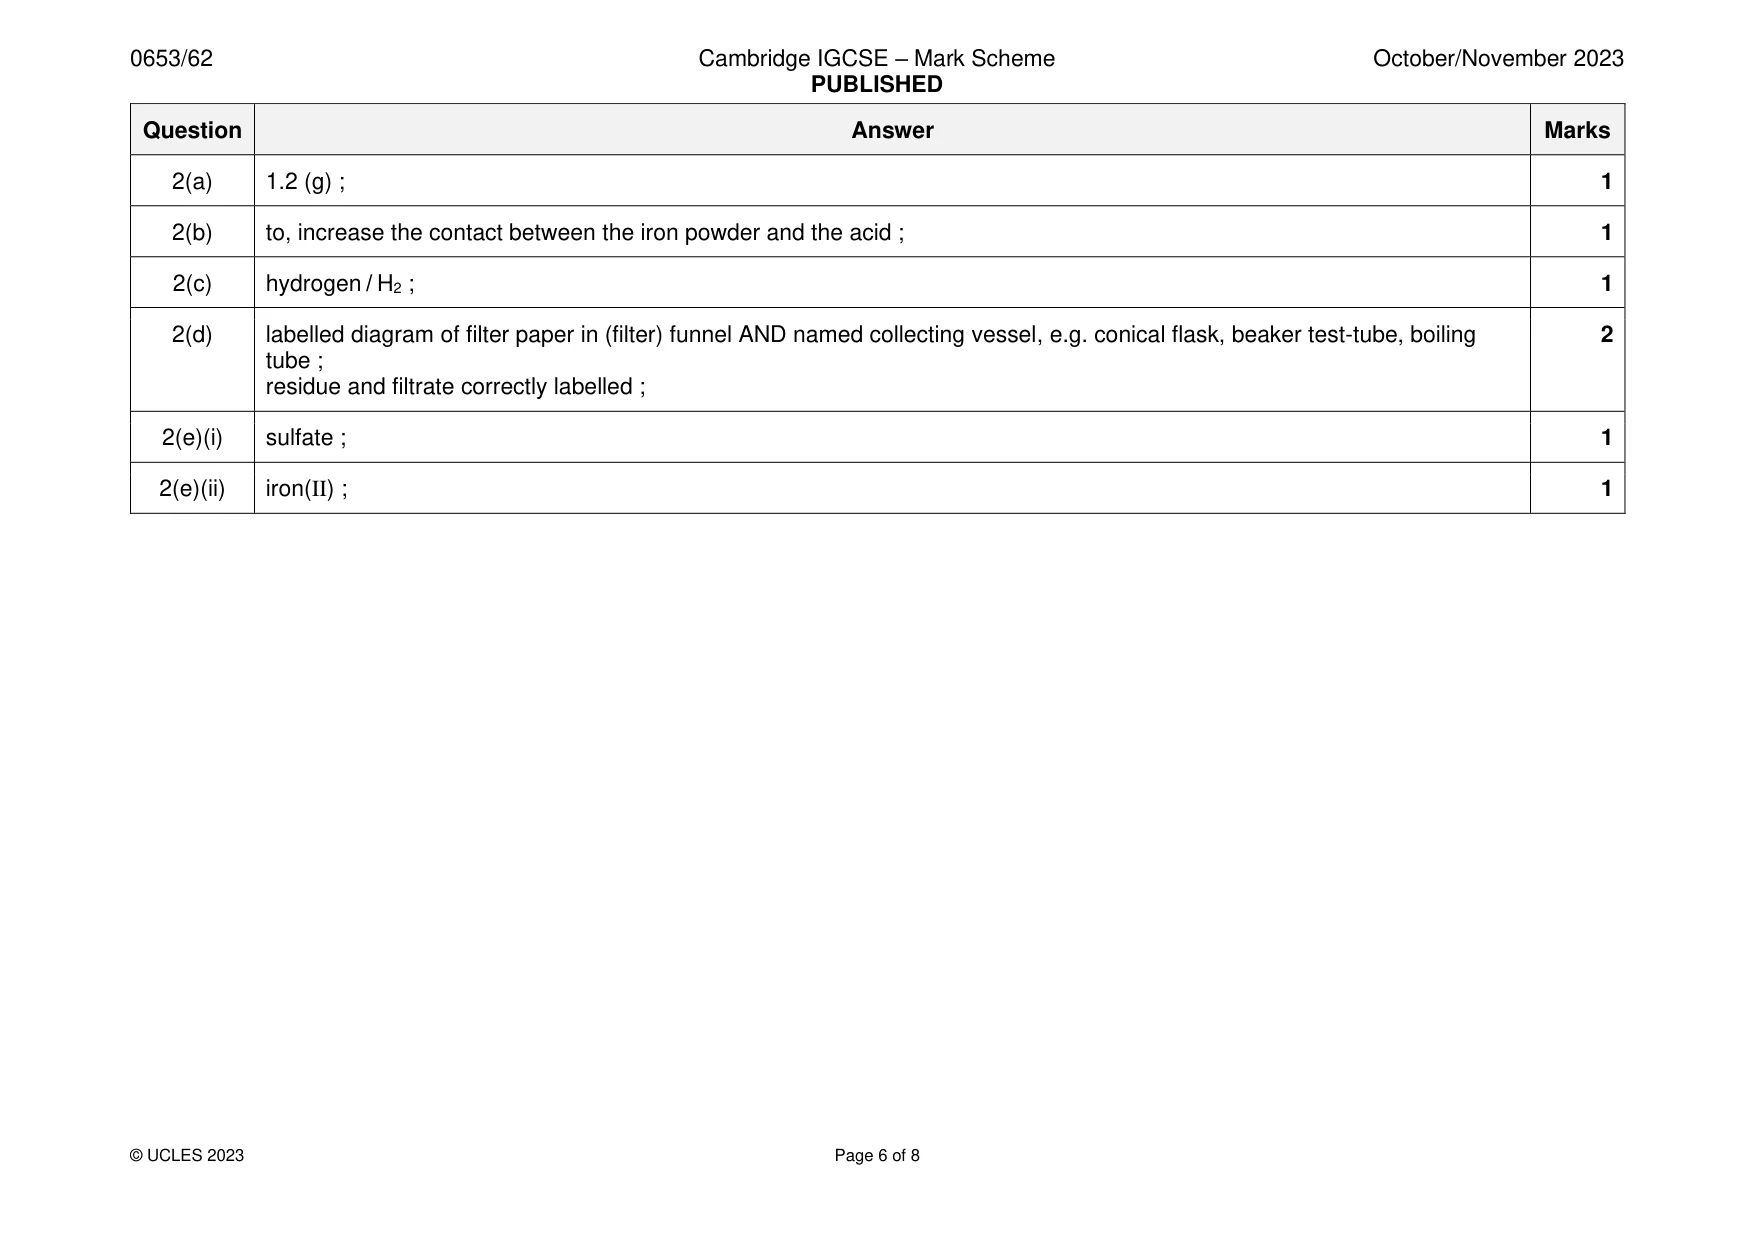
Mark scheme: 2(a) 1.2 (g) ; 1 2(b) to, increase the contact between the iron powder and the acid ; 1 2(c) hydrogen / H2 ; 1 2(d) labelled diagram of filter paper in (filter) funnel AND named collecting vessel, e.g. conical flask, beaker test-tube, boiling 2 tube ; residue and filtrate correctly labelled ; 2(e)(i) sulfate ; 1 2(e)(ii) iron(II) ; 1
Q3 · Citric acid reacts with aqueous sodium hydroxide as shown in the word equation
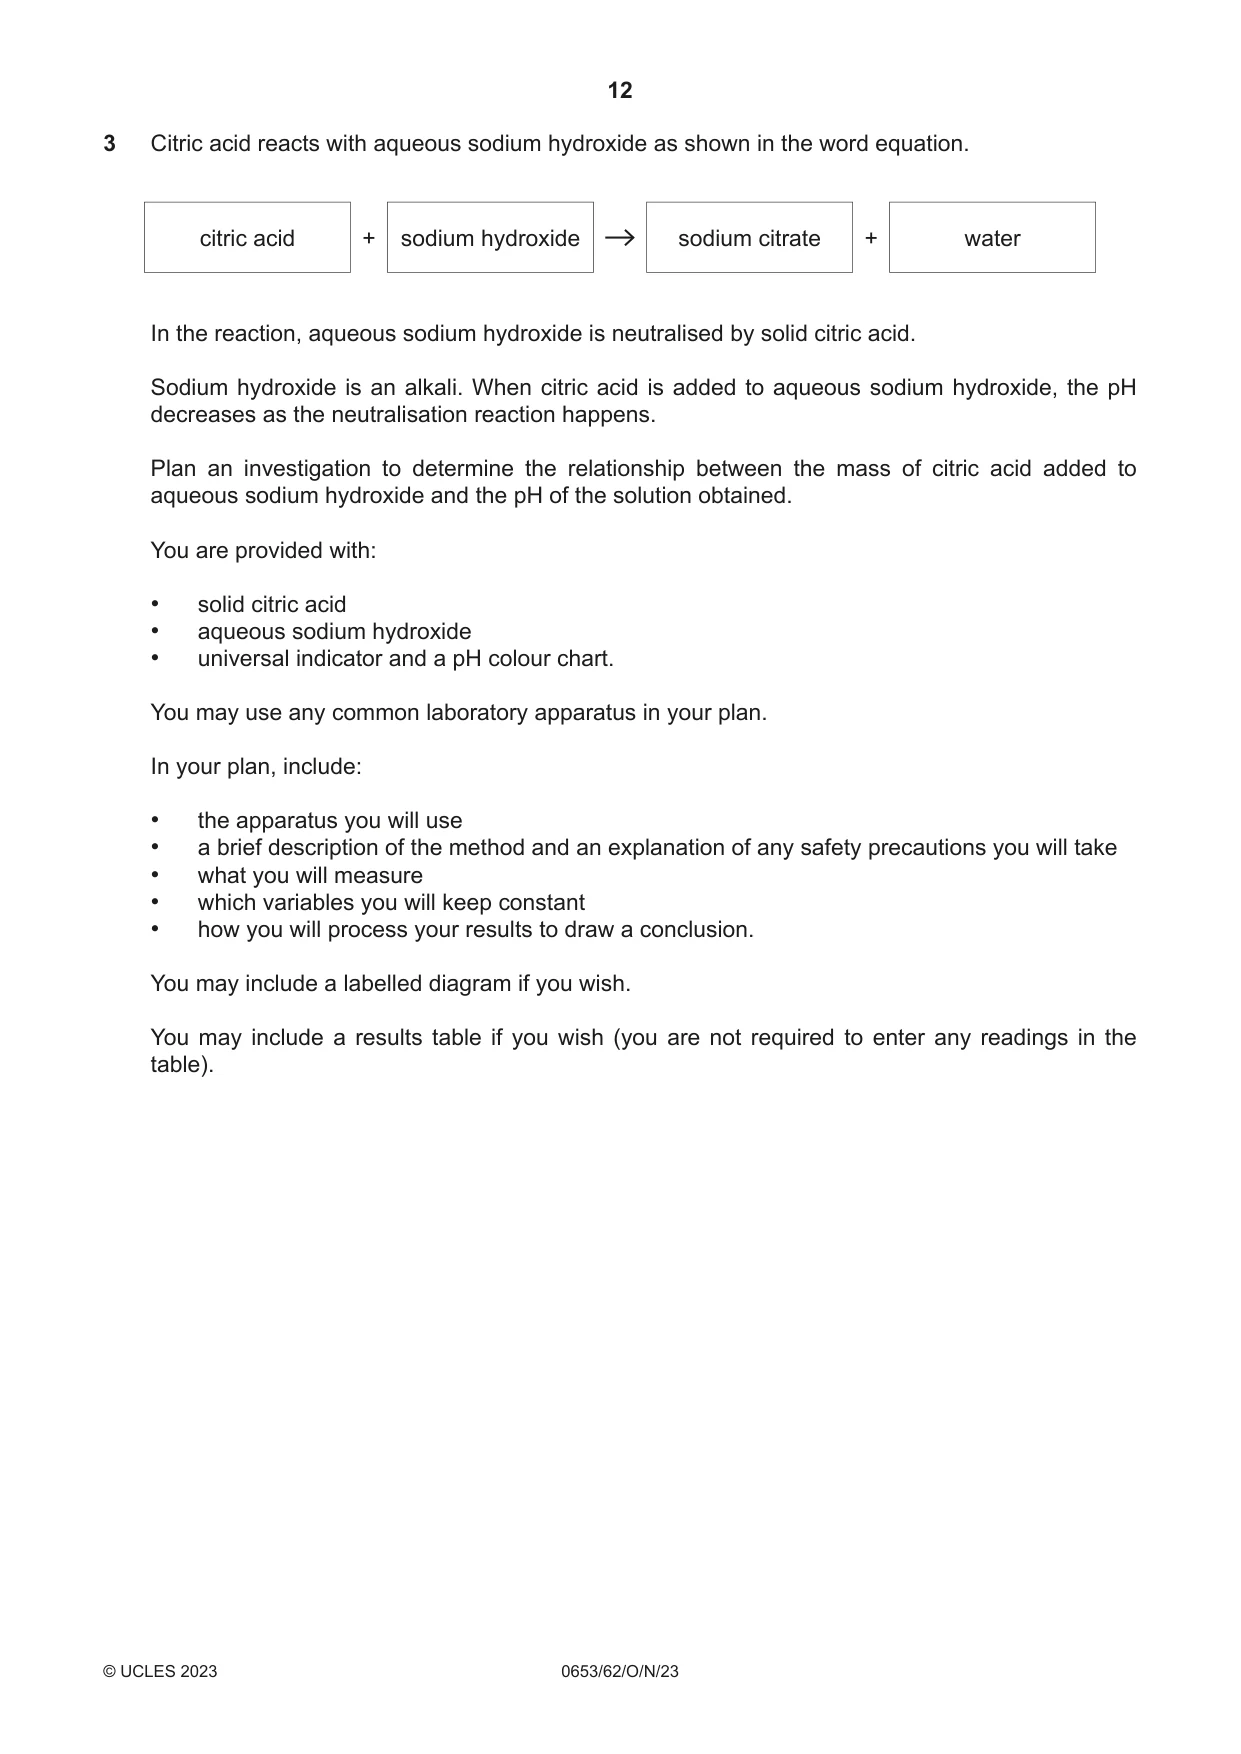
3 Citric acid reacts with aqueous sodium hydroxide as shown in the word equation. citric acid + sodium hydroxide sodium citrate + water In the reaction, aqueous sodium hydroxide is neutralised by solid citric acid. Sodium hydroxide is an alkali. When citric acid is added to aqueous sodium hydroxide, the pH decreases as the neutralisation reaction happens. Plan an investigation to determine the relationship between the mass of citric acid added to aqueous sodium hydroxide and the pH of the solution obtained. You are provided with: • solid citric acid • aqueous sodium hydroxide • universal indicator and a pH colour chart. You may use any common laboratory apparatus in your plan. In your plan, include: • the apparatus you will use • a brief description of the method and an explanation of any safety precautions you will take • what you will measure • which variables you will keep constant • how you will process your results to draw a conclusion. You may include a labelled diagram if you wish. You may include a results table if you wish (you are not required to enter any readings in the table). .......................................................................................................................................................... .......................................................................................................................................................... .......................................................................................................................................................... .......................................................................................................................................................... .......................................................................................................................................................... .......................................................................................................................................................... .......................................................................................................................................................... .......................................................................................................................................................... .......................................................................................................................................................... .......................................................................................................................................................... .......................................................................................................................................................... .......................................................................................................................................................... .......................................................................................................................................................... .......................................................................................................................................................... .......................................................................................................................................................... .................................................................................................................................................... [7]
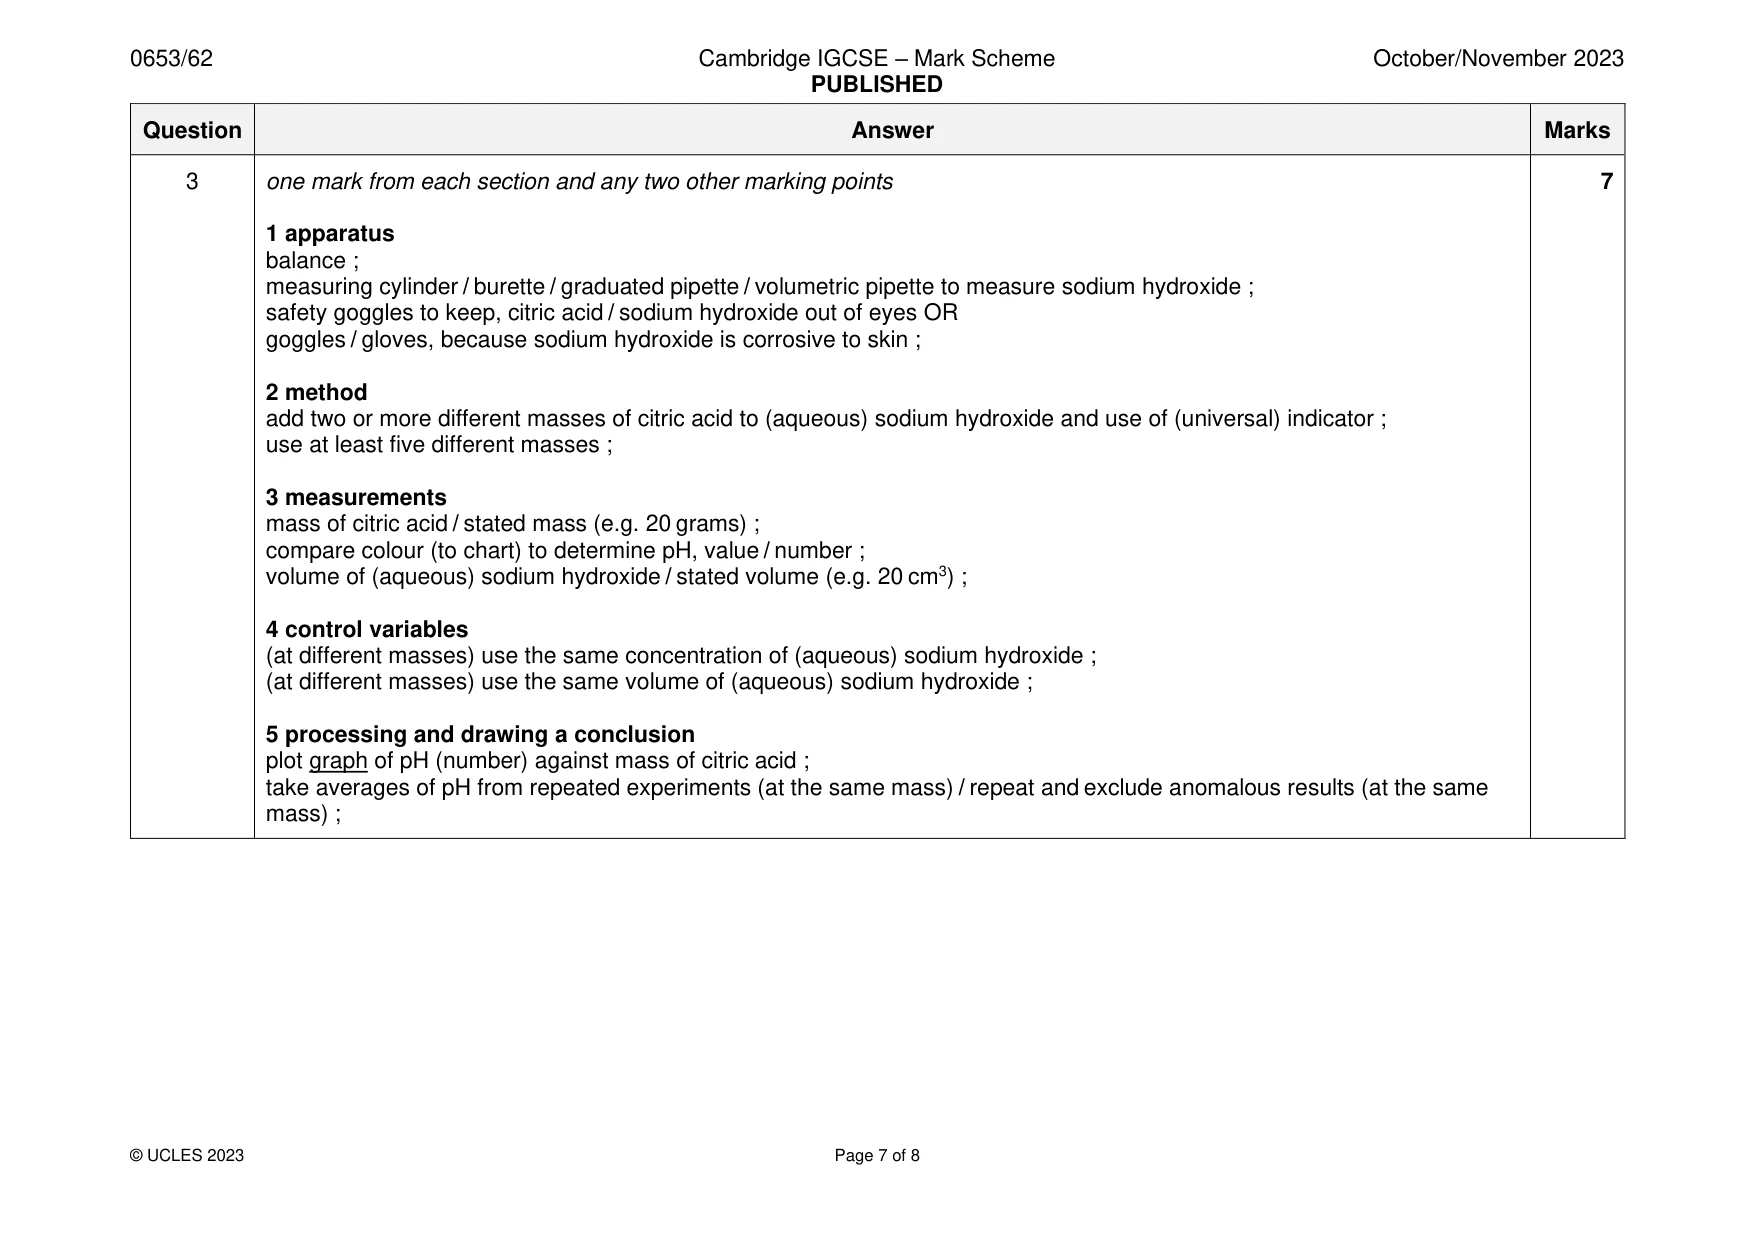
Mark scheme: 3 one mark from each section and any two other marking points 7 1 apparatus balance ; measuring cylinder / burette / graduated pipette / volumetric pipette to measure sodium hydroxide ; safety goggles to keep, citric acid / sodium hydroxide out of eyes OR goggles / gloves, because sodium hydroxide is corrosive to skin ; 2 method add two or more different masses of citric acid to (aqueous) sodium hydroxide and use of (universal) indicator ; use at least five different masses ; 3 measurements mass of citric acid / stated mass (e.g. 20 grams) ; compare colour (to chart) to determine pH, value / number ; volume of (aqueous) sodium hydroxide / stated volume (e.g. 20 cm3) ; 4 control variables (at different masses) use the same concentration of (aqueous) sodium hydroxide ; (at different masses) use the same volume of (aqueous) sodium hydroxide ; 5 processing and drawing a conclusion plot graph of pH (number) against mass of citric acid ; take averages of pH from repeated experiments (at the same mass) / repeat and exclude anomalous results (at the same mass) ;
Q4 · A student compares the conducting properties of metal and glass
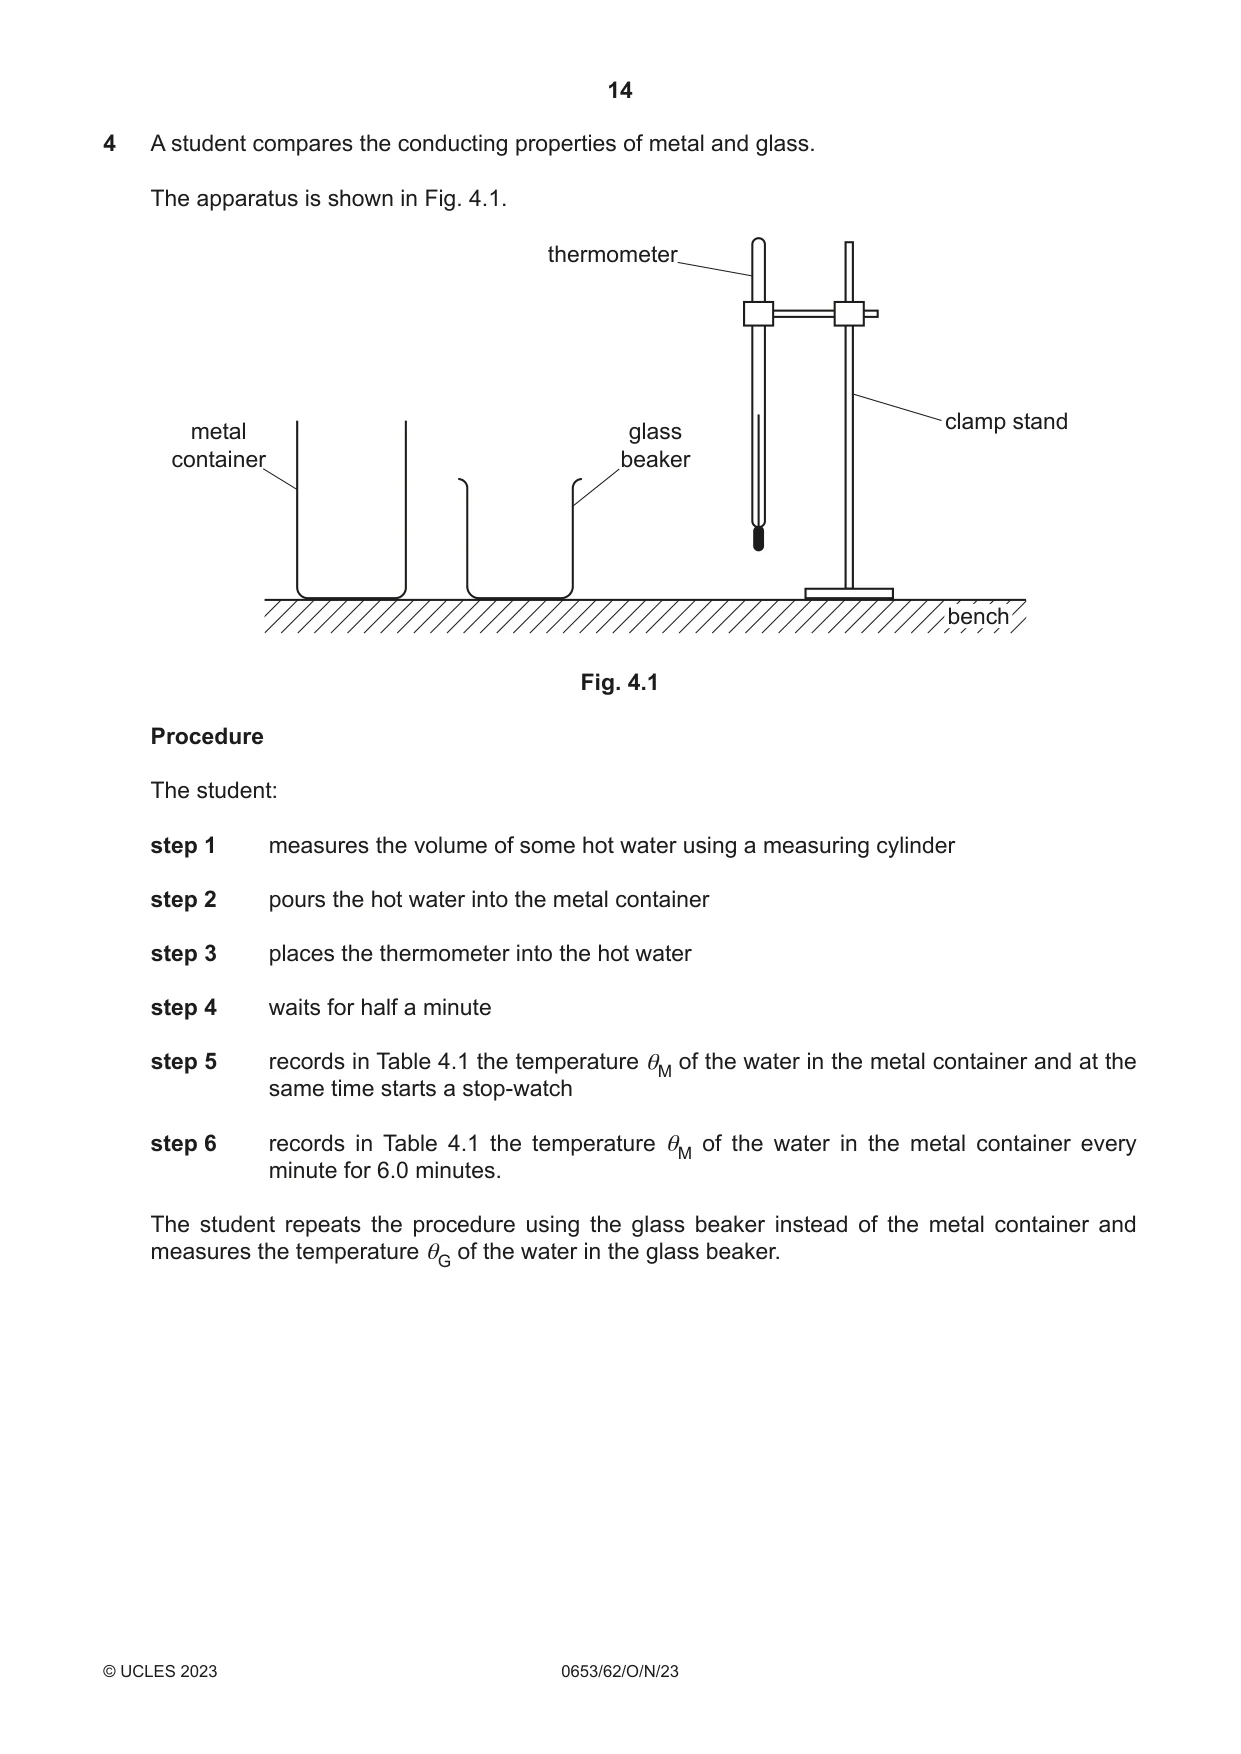
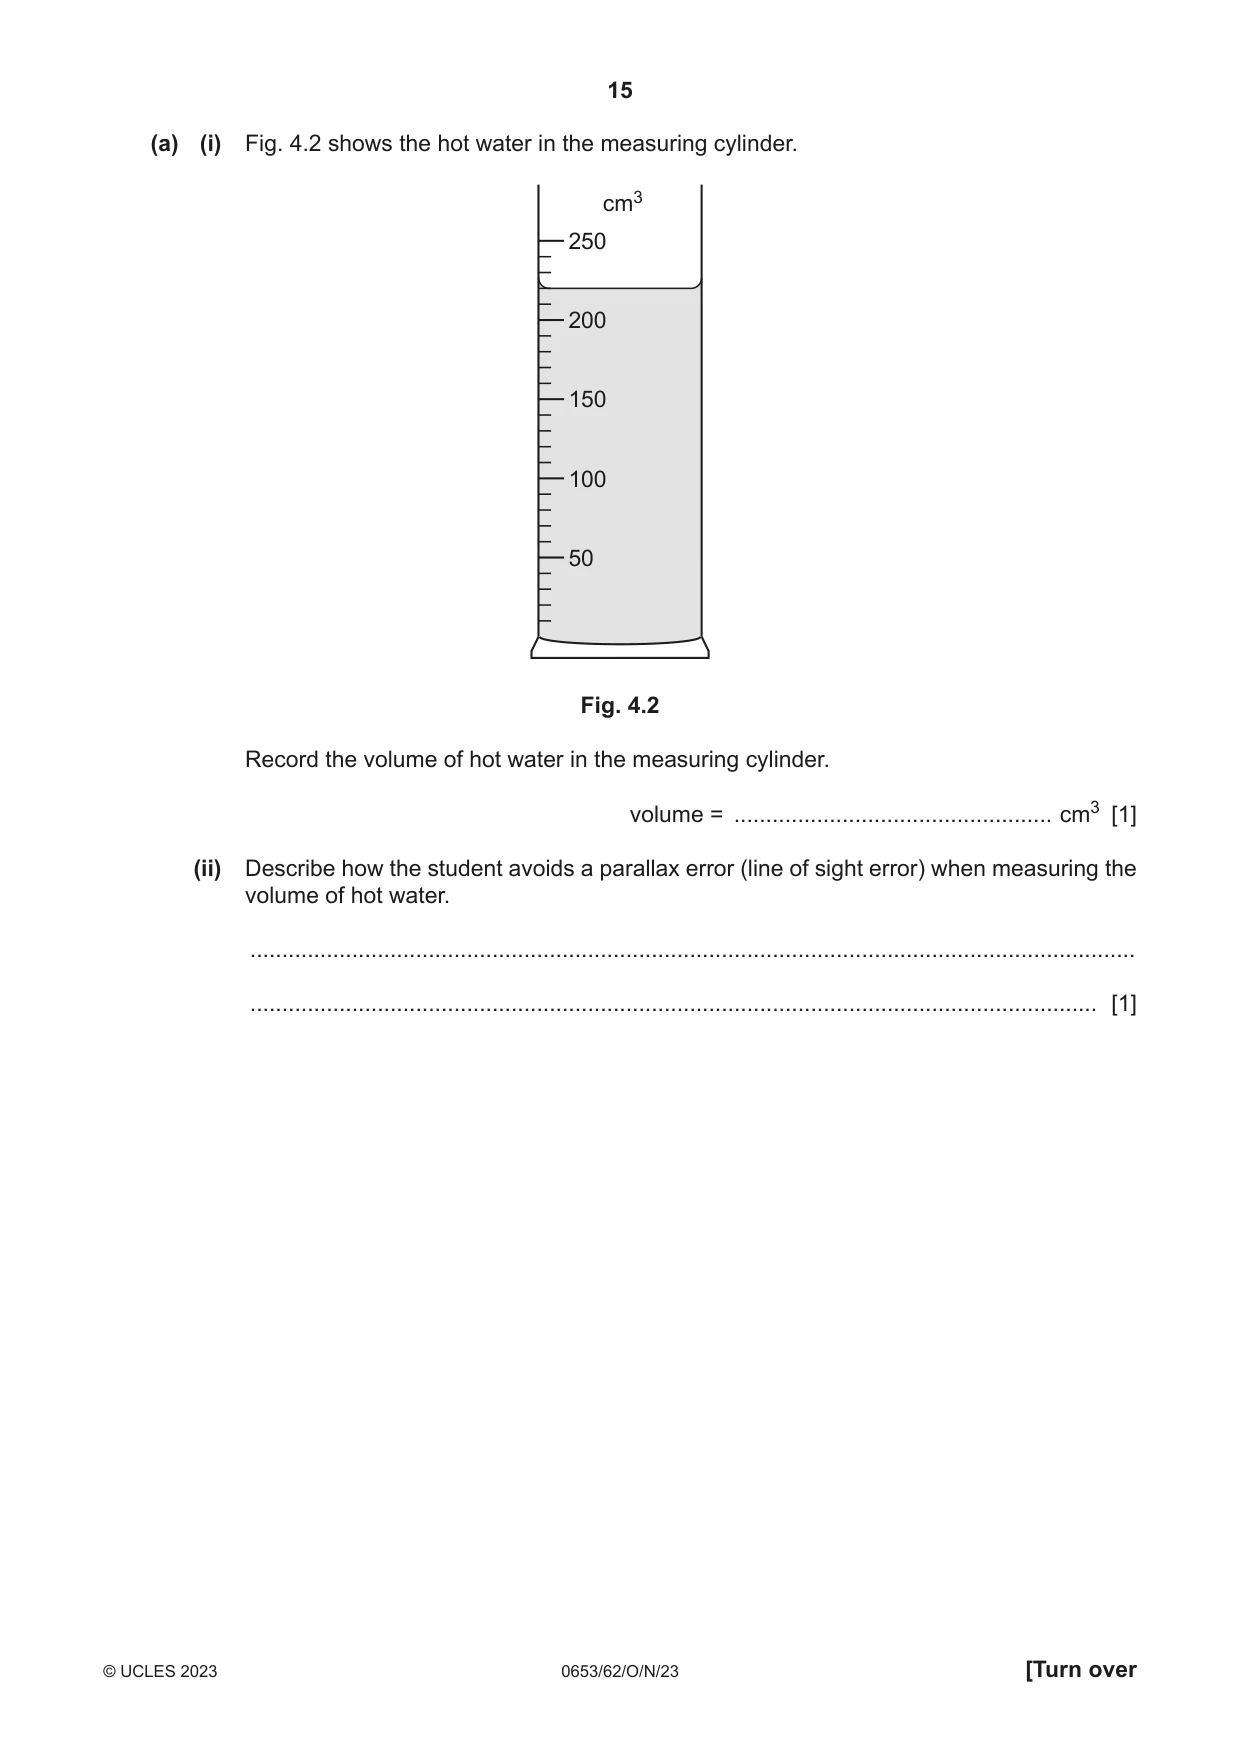
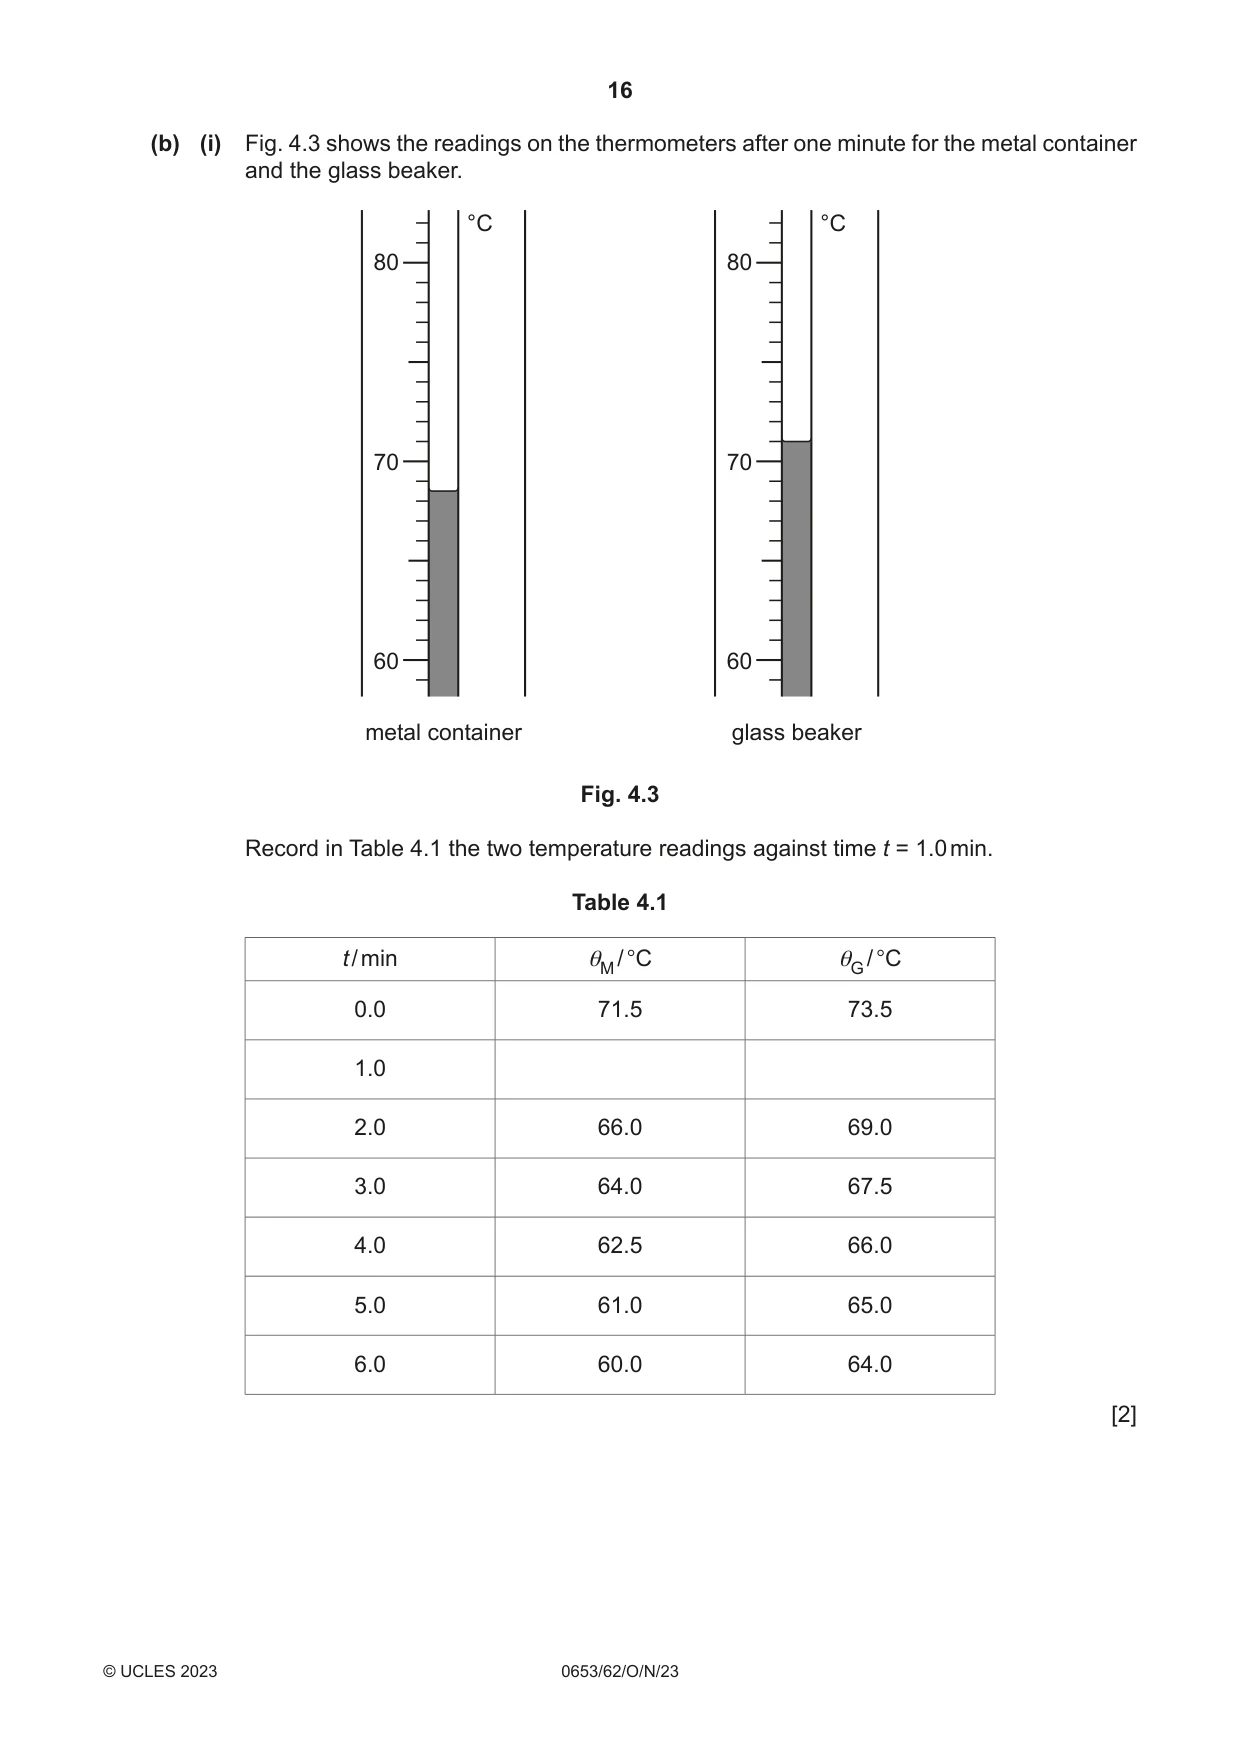
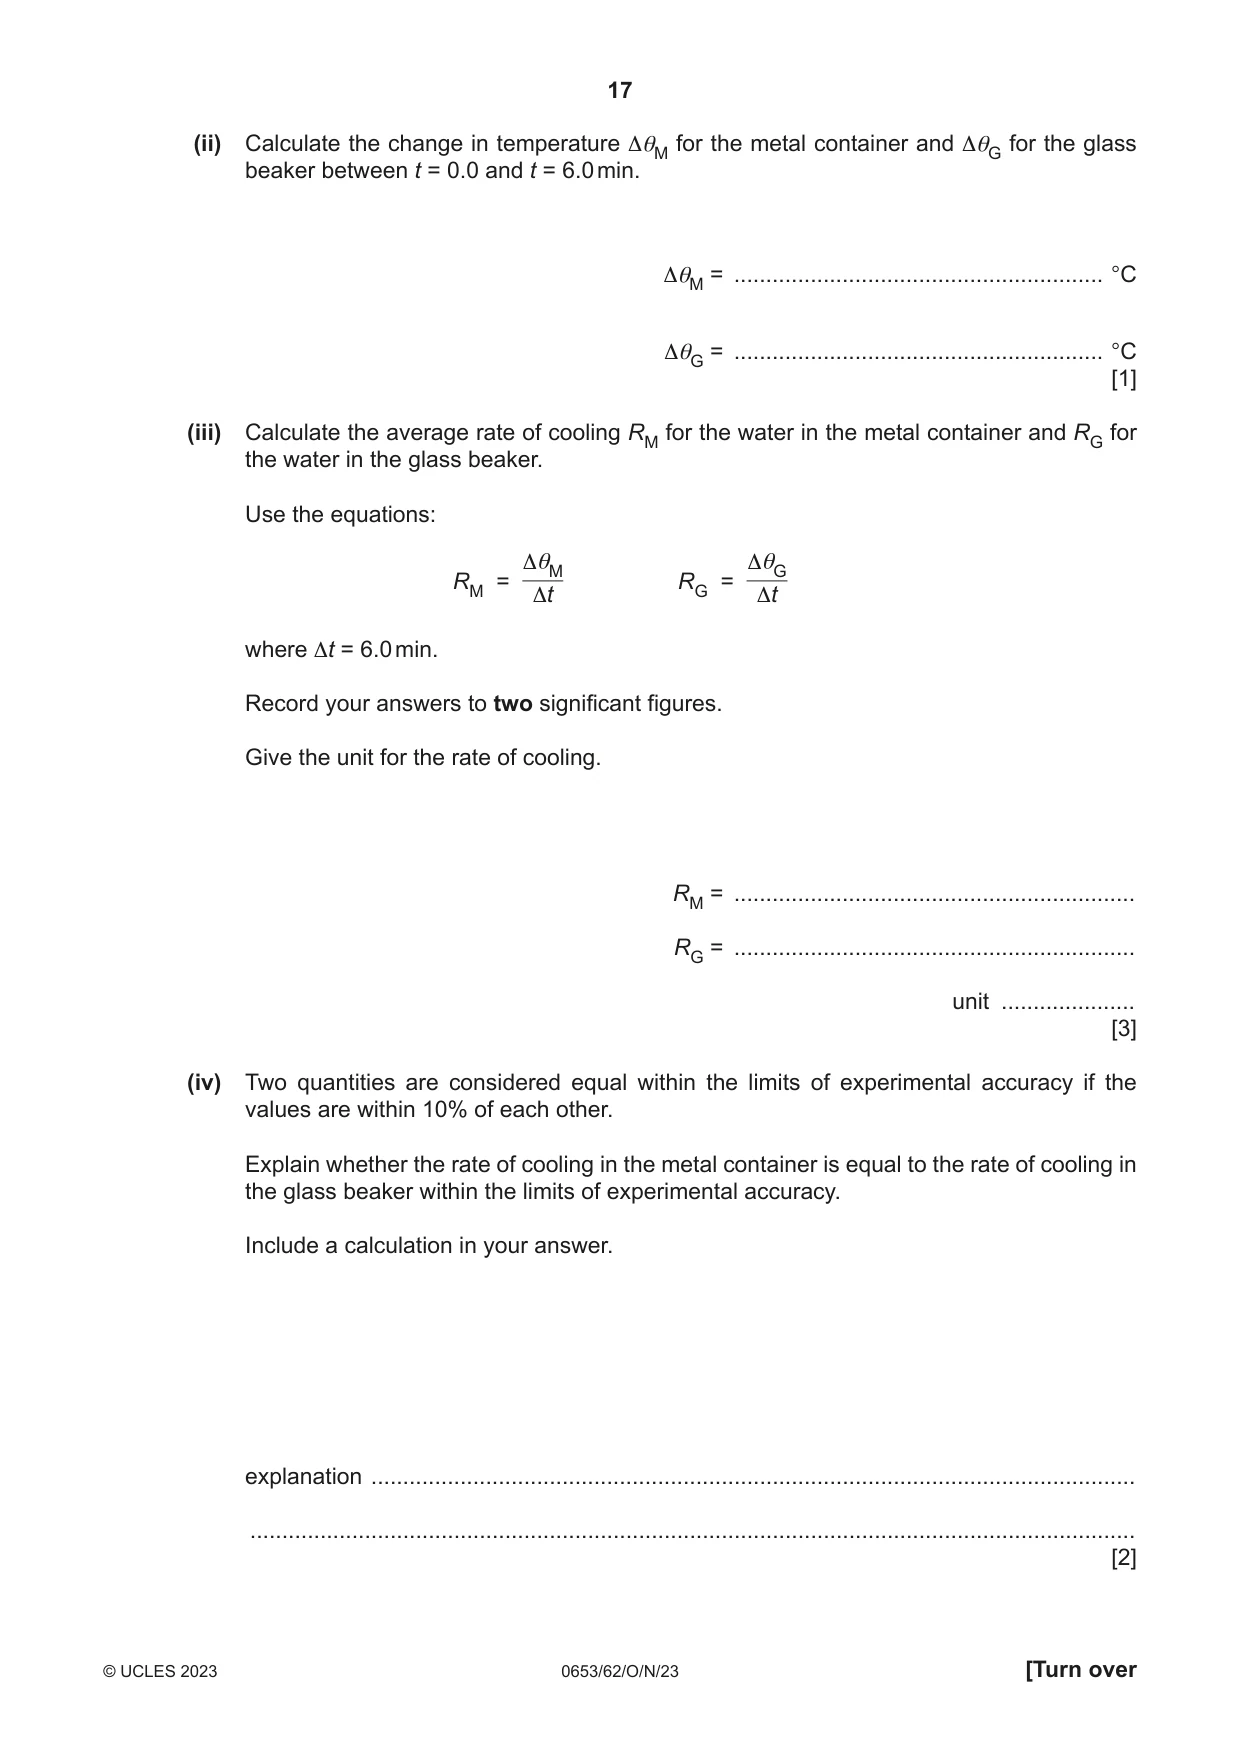
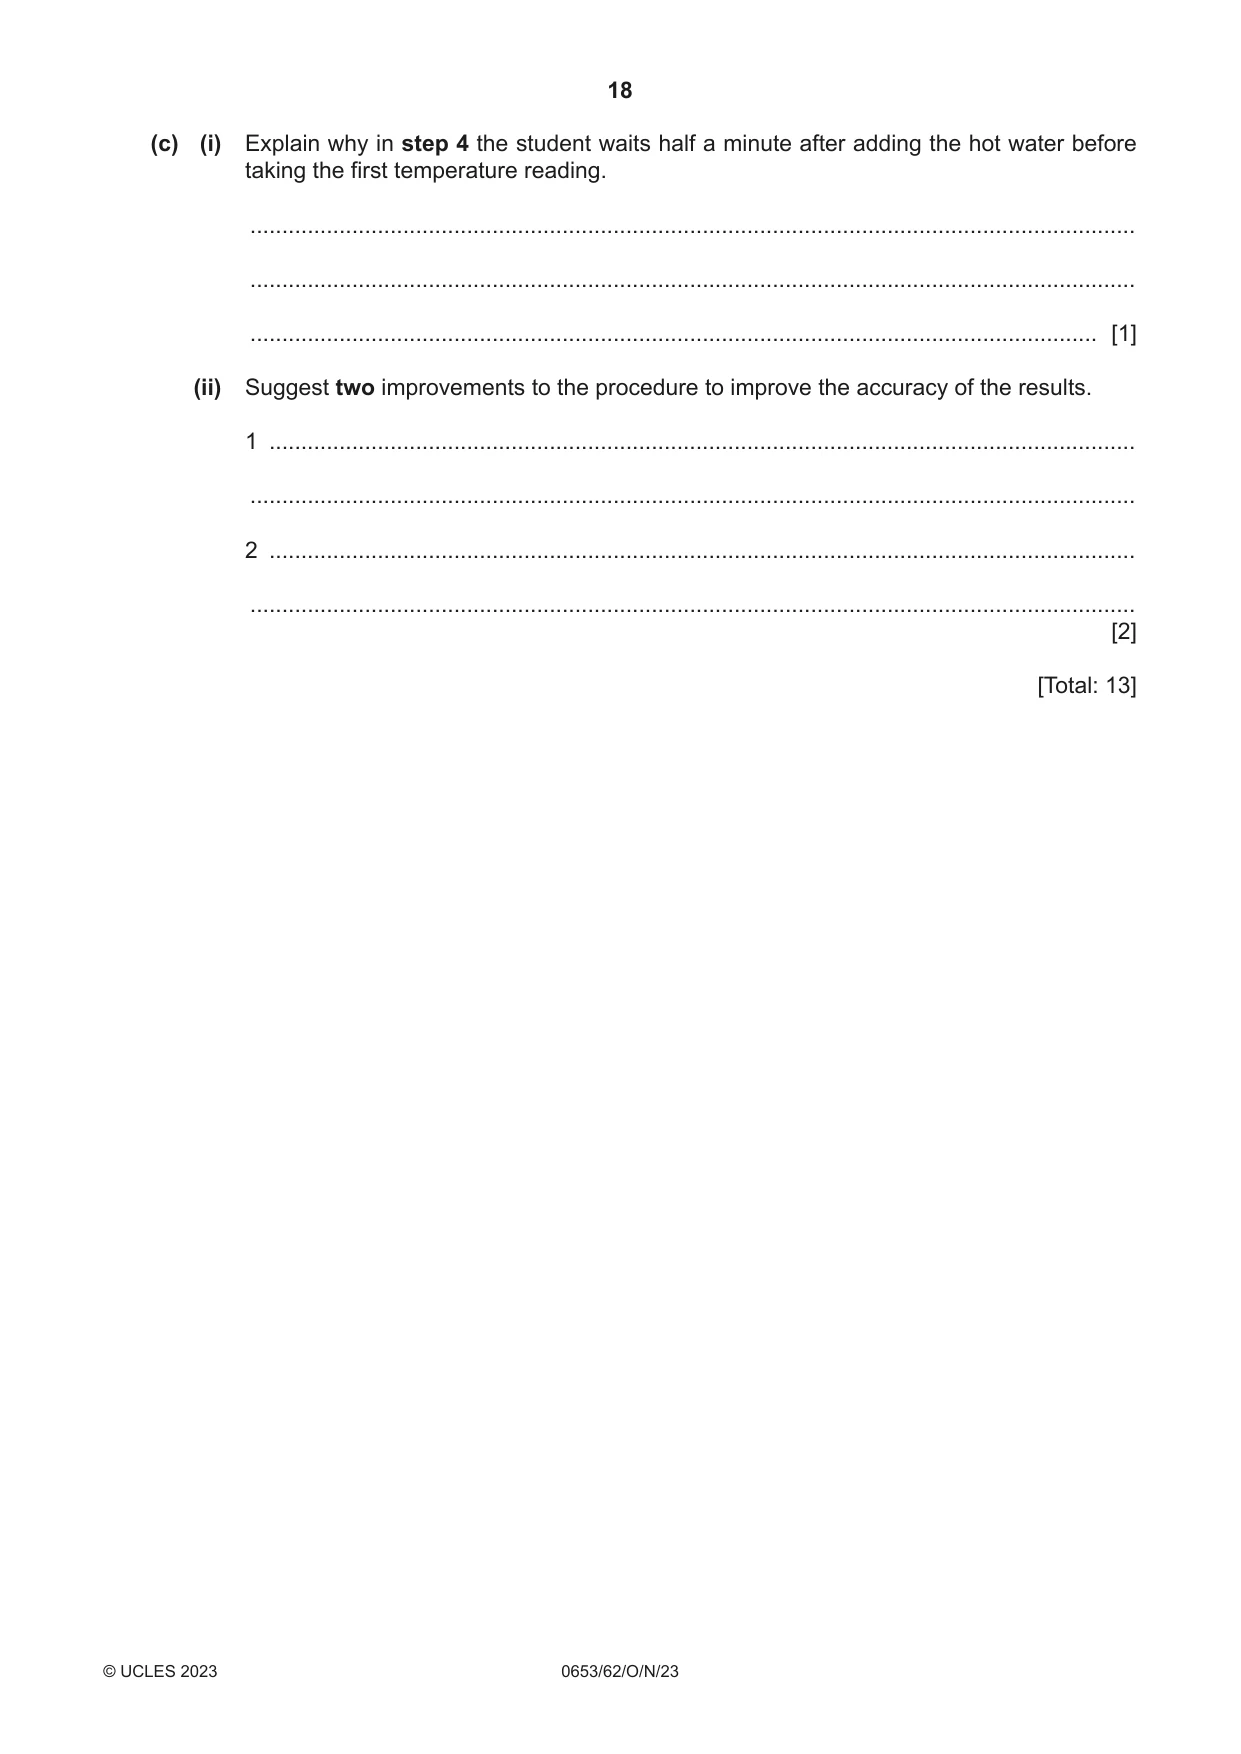
4 A student compares the conducting properties of metal and glass. The apparatus is shown in Fig. 4.1. thermometer clamp stand metal glass container beaker bench Fig. 4.1 Procedure The student: step 1 measures the volume of some hot water using a measuring cylinder step 2 pours the hot water into the metal container step 3 places the thermometer into the hot water step 4 waits for half a minute step 5 records in Table 4.1 the temperature θM of the water in the metal container and at the same time starts a stop‑watch step 6 records in Table 4.1 the temperature θM of the water in the metal container every minute for 6.0 minutes. The student repeats the procedure using the glass beaker instead of the metal container and measures the temperature θG of the water in the glass beaker. (a) (i) Fig. 4.2 shows the hot water in the measuring cylinder. cm3 250 200 150 100 50 Fig. 4.2 Record the volume of hot water in the measuring cylinder. volume = .................................................. cm3 [1] (ii) Describe how the student avoids a parallax error (line of sight error) when measuring the volume of hot water. ........................................................................................................................................... ..................................................................................................................................... [1] (b) (i) Fig. 4.3 shows the readings on the thermometers after one minute for the metal container and the glass beaker. °C °C 80 80 70 70 60 60 metal container glass beaker Fig. 4.3 Record in Table 4.1 the two temperature readings against time t = 1.0 min. Table 4.1 t / min θM / °C θG / °C 0.0 71.5 73.5 1.0 2.0 66.0 69.0 3.0 64.0 67.5 4.0 62.5 66.0 5.0 61.0 65.0 6.0 60.0 64.0 [2]
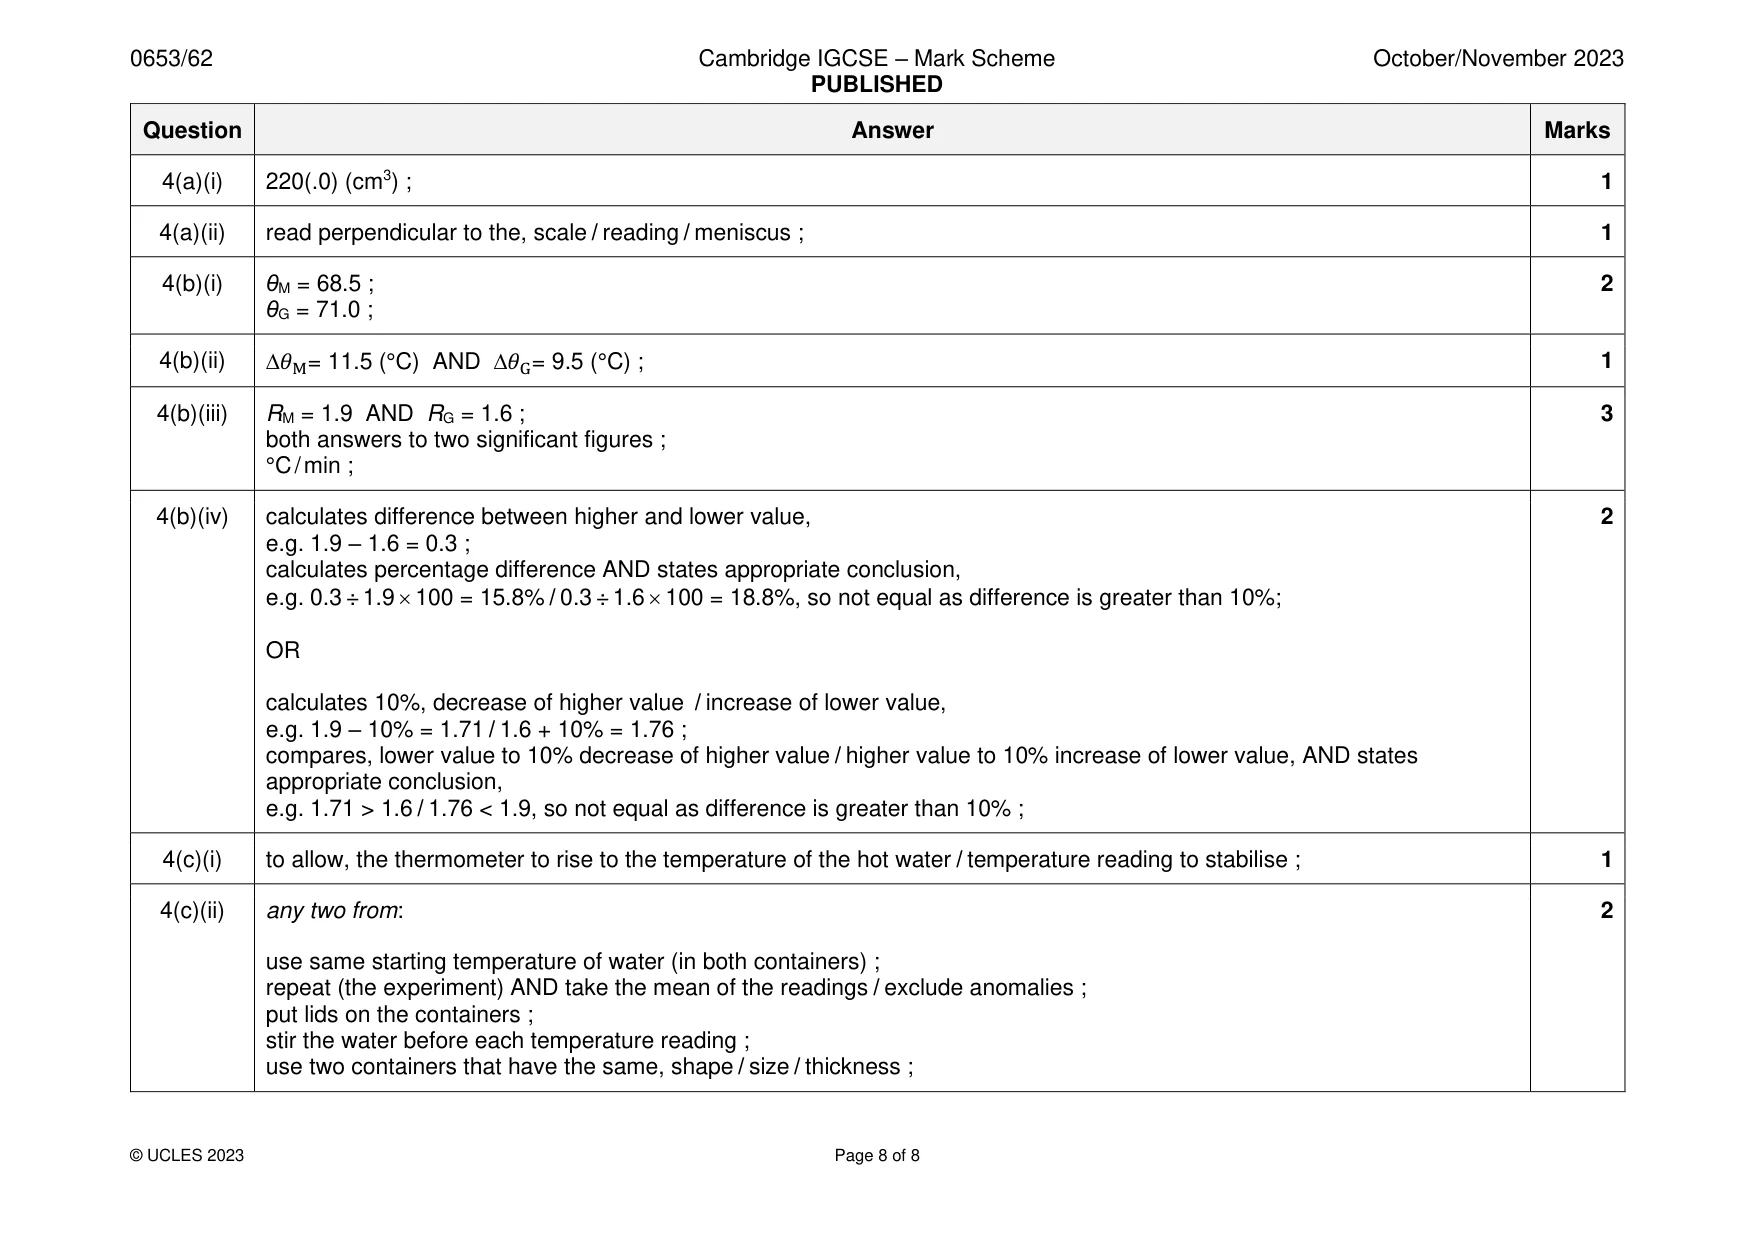
Mark scheme: 4(a)(i) 220(.0) (cm3) ; 1 4(a)(ii) read perpendicular to the, scale / reading / meniscus ; 1 4(b)(i) θM = 68.5 ; 2 θG = 71.0 ; 4(b)(ii) 𝜃M= 11.5 (°C) AND 𝜃G= 9.5 (°C) ; 1 4(b)(iii) RM = 1.9 AND RG = 1.6 ; 3 both answers to two significant figures ; °C / min ; 4(b)(iv) calculates difference between higher and lower value, 2 e.g. 1.9 – 1.6 = 0.3 ; calculates percentage difference AND states appropriate conclusion, e.g. 0.3 ÷ 1.9 100 = 15.8% / 0.3 ÷ 1.6 100 = 18.8%, so not equal as difference is greater than 10%; OR calculates 10%, decrease of higher value / increase of lower value, e.g. 1.9 – 10% = 1.71 / 1.6 + 10% = 1.76 ; compares, lower value to 10% decrease of higher value / higher value to 10% increase of lower value, AND states appropriate conclusion, e.g. 1.71 > 1.6 / 1.76 < 1.9, so not equal as difference is greater than 10% ; 4(c)(i) to allow, the thermometer to rise to the temperature of the hot water / temperature reading to stabilise ; 1 4(c)(ii) any two from: 2 use same starting temperature of water (in both containers) ; repeat (the experiment) AND take the mean of the readings / exclude anomalies ; put lids on the containers ; stir the water before each temperature reading ; use two containers that have the same, shape / size / thickness ;
More questions on Physical quantities and measurement techniques
What was in this paper
The subtopics covered by these 4 questions, and how many questions each got. Open one in a new tab to see every Cambridge question on it.
What you needed in this session
Cambridge’s own grade thresholds for 2023 Oct/Nov, Paper 6 · Variant 2. A higher threshold means an easier paper — the bar moves with how the cohort did.