Cambridge IGCSE Science - Combined 0653 — 2023 Oct/Nov Paper 4 · Variant 1
0653/41/O/N/23 · 9 questions · 80 marks · ≈90 min
The question paper and its mark scheme, free to read here and free to download. This is Cambridge’s own paper, exactly as it was sat.
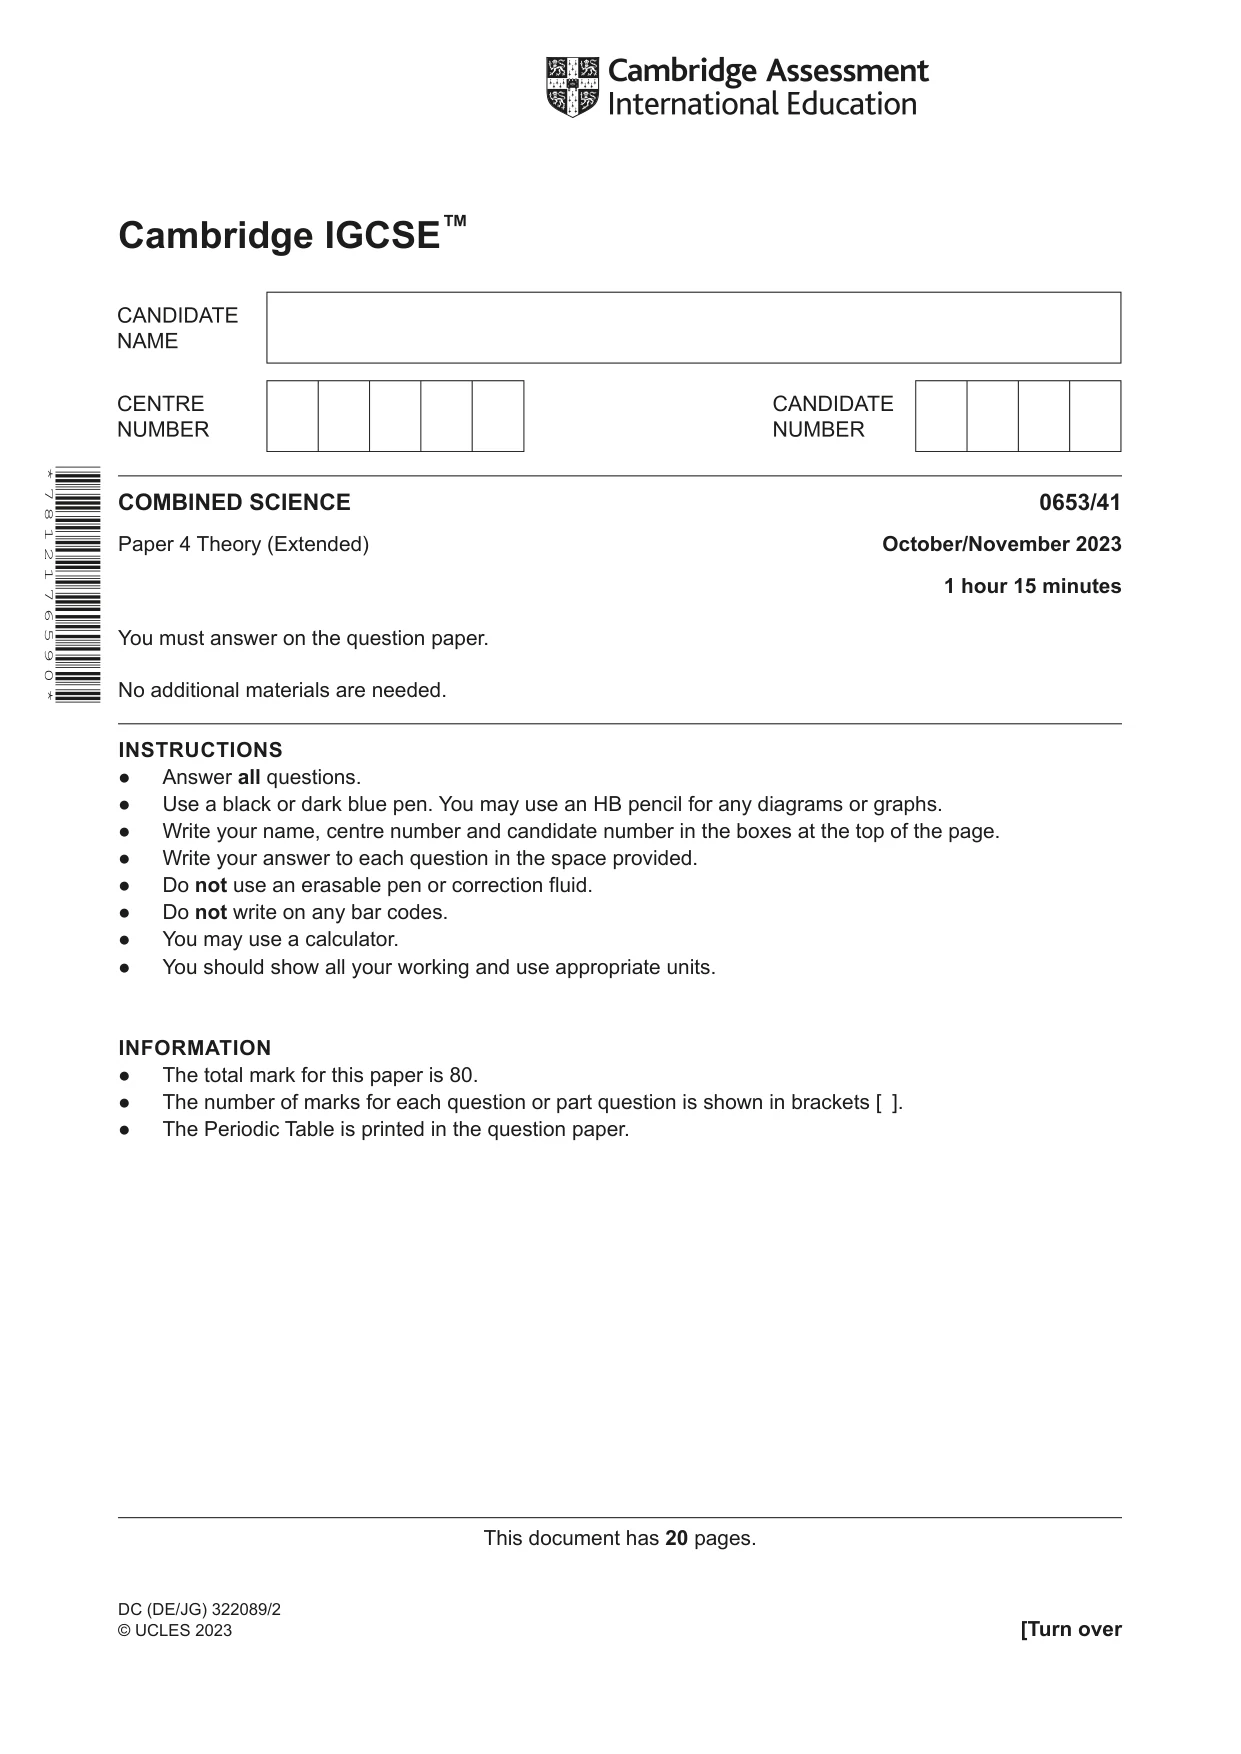
Question paper20 pages
Mark scheme11 pages
Answers below. Sit the paper first if you are practising.
Questions as text
Q1 · The human alimentary canal and some associated organs
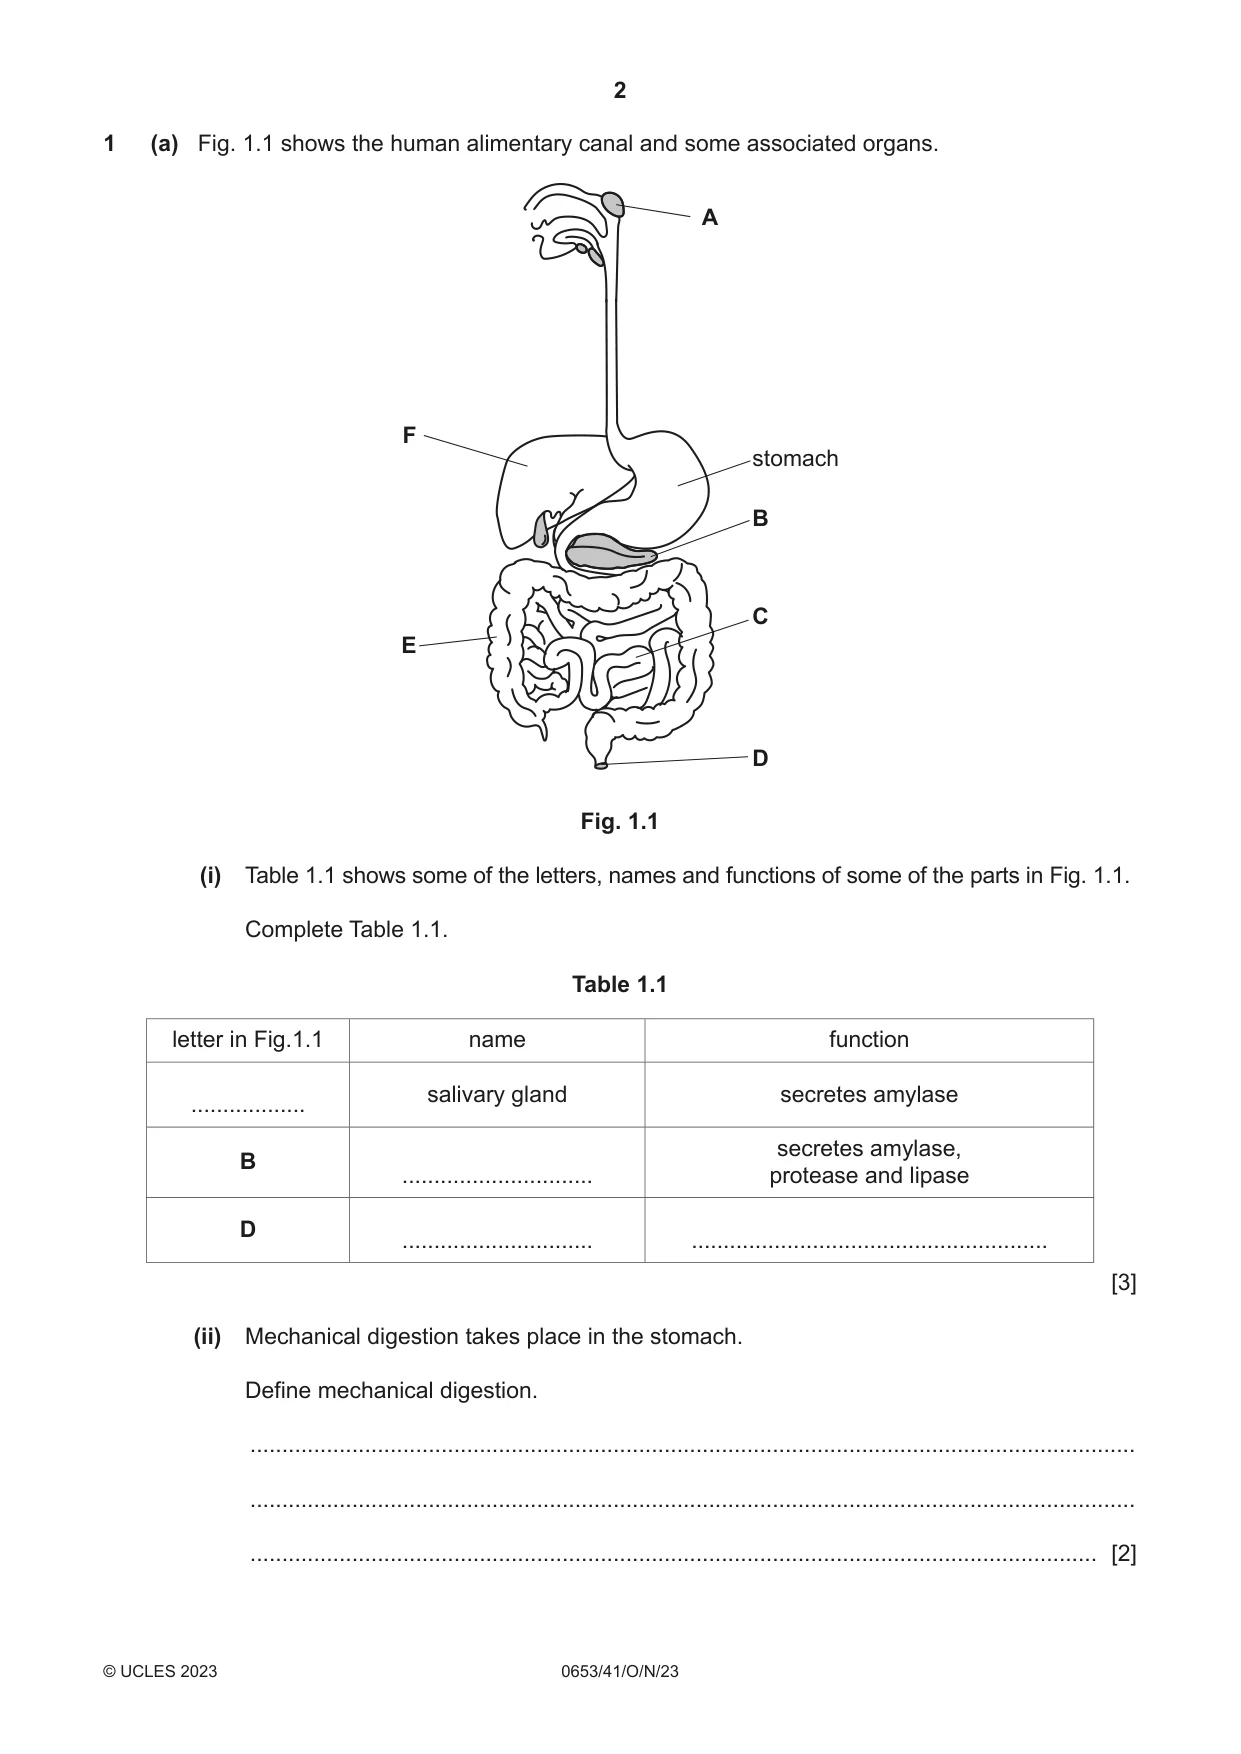
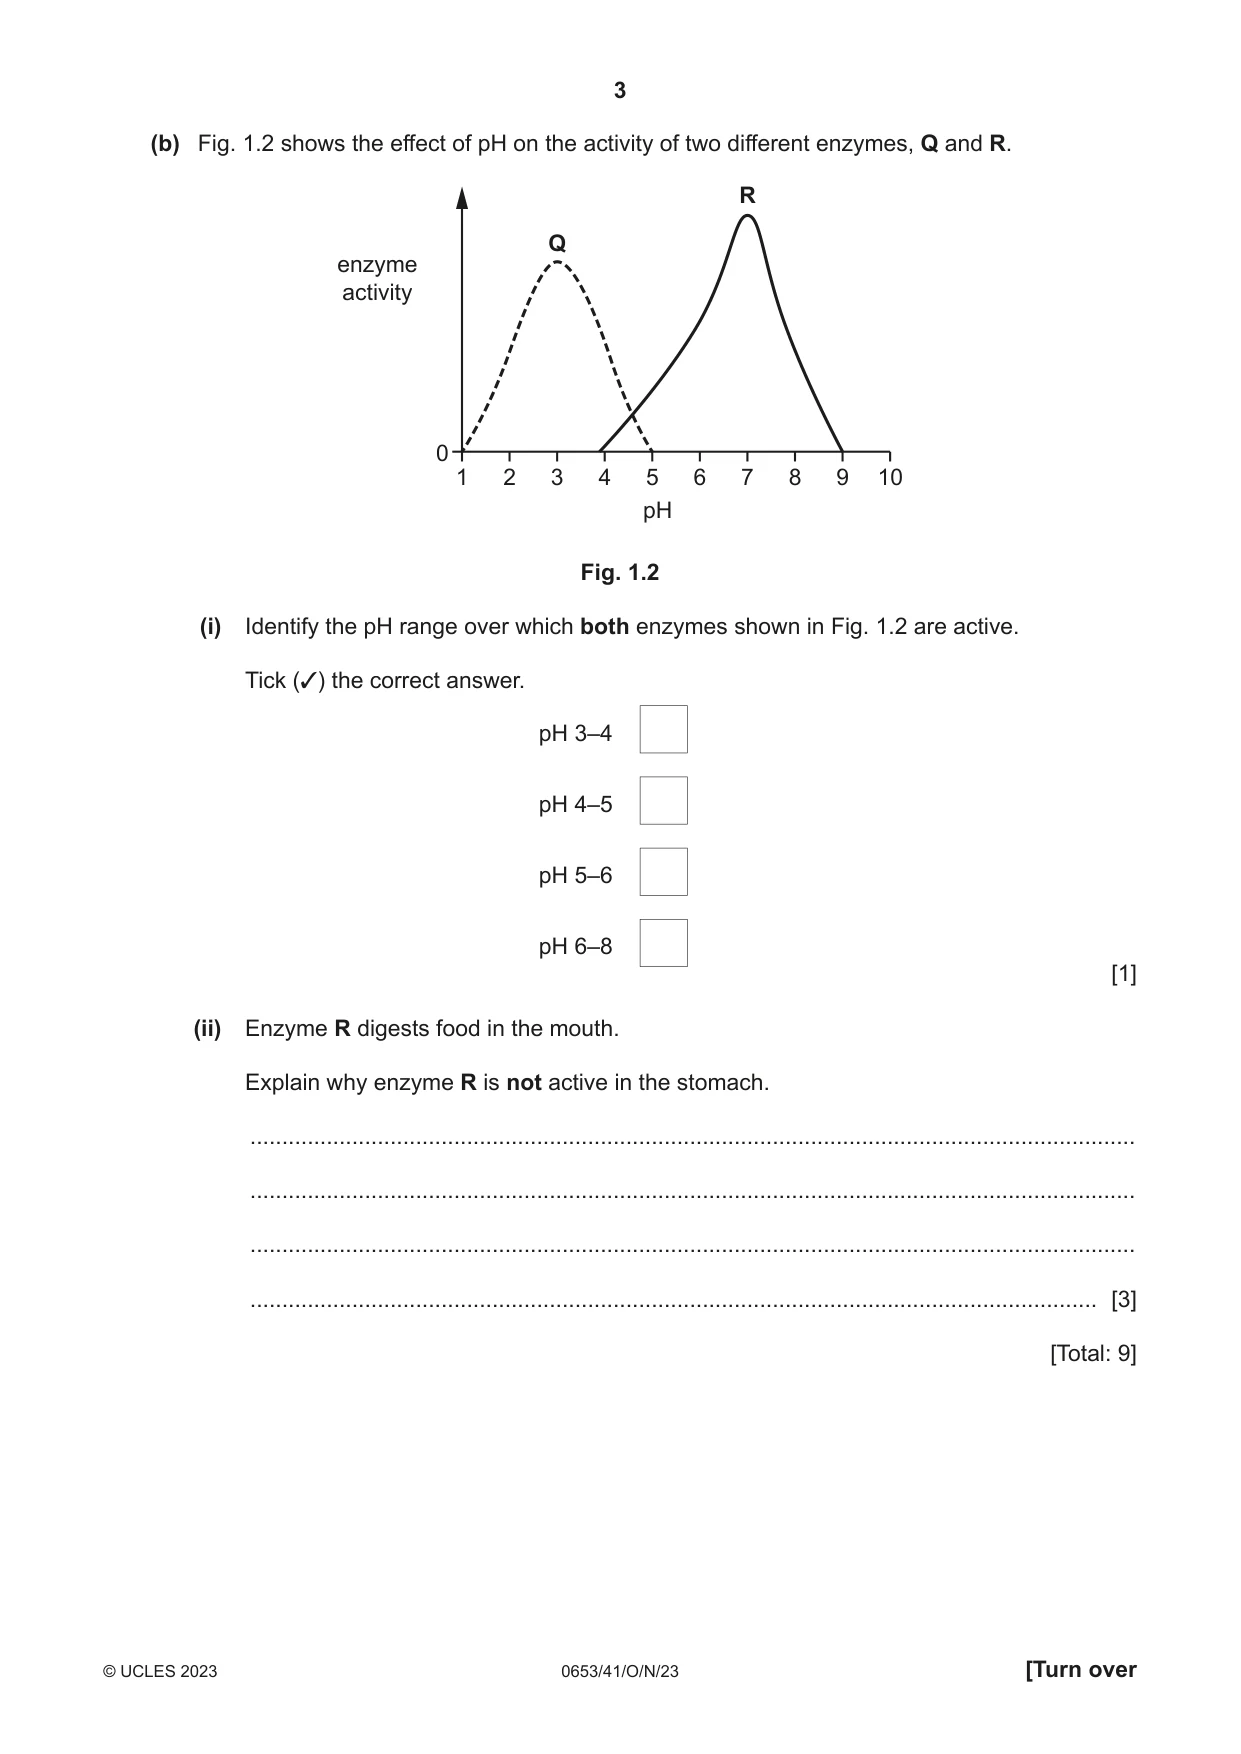
1 (a) Fig. 1.1 shows the human alimentary canal and some associated organs. A F stomach B C E D Fig. 1.1 (i) Table 1.1 shows some of the letters, names and functions of some of the parts in Fig. 1.1. Complete Table 1.1. Table 1.1 letter in Fig.1.1 name function salivary gland secretes amylase .................. secretes amylase, B .............................. protease and lipase D .............................. ........................................................ [3] (ii) Mechanical digestion takes place in the stomach. Define mechanical digestion. ........................................................................................................................................... ........................................................................................................................................... ..................................................................................................................................... [2] (b) Fig. 1.2 shows the effect of pH on the activity of two different enzymes, Q and R. R Q enzyme activity 0 1 2 3 4 5 6 7 8 9 10 pH Fig. 1.2 (i) Identify the pH range over which both enzymes shown in Fig. 1.2 are active. Tick (✓) the correct answer. pH 3–4 pH 4–5 pH 5–6 pH 6–8 [1] (ii) Enzyme R digests food in the mouth. Explain why enzyme R is not active in the stomach. ........................................................................................................................................... ........................................................................................................................................... ........................................................................................................................................... ..................................................................................................................................... [3] [Total: 9]
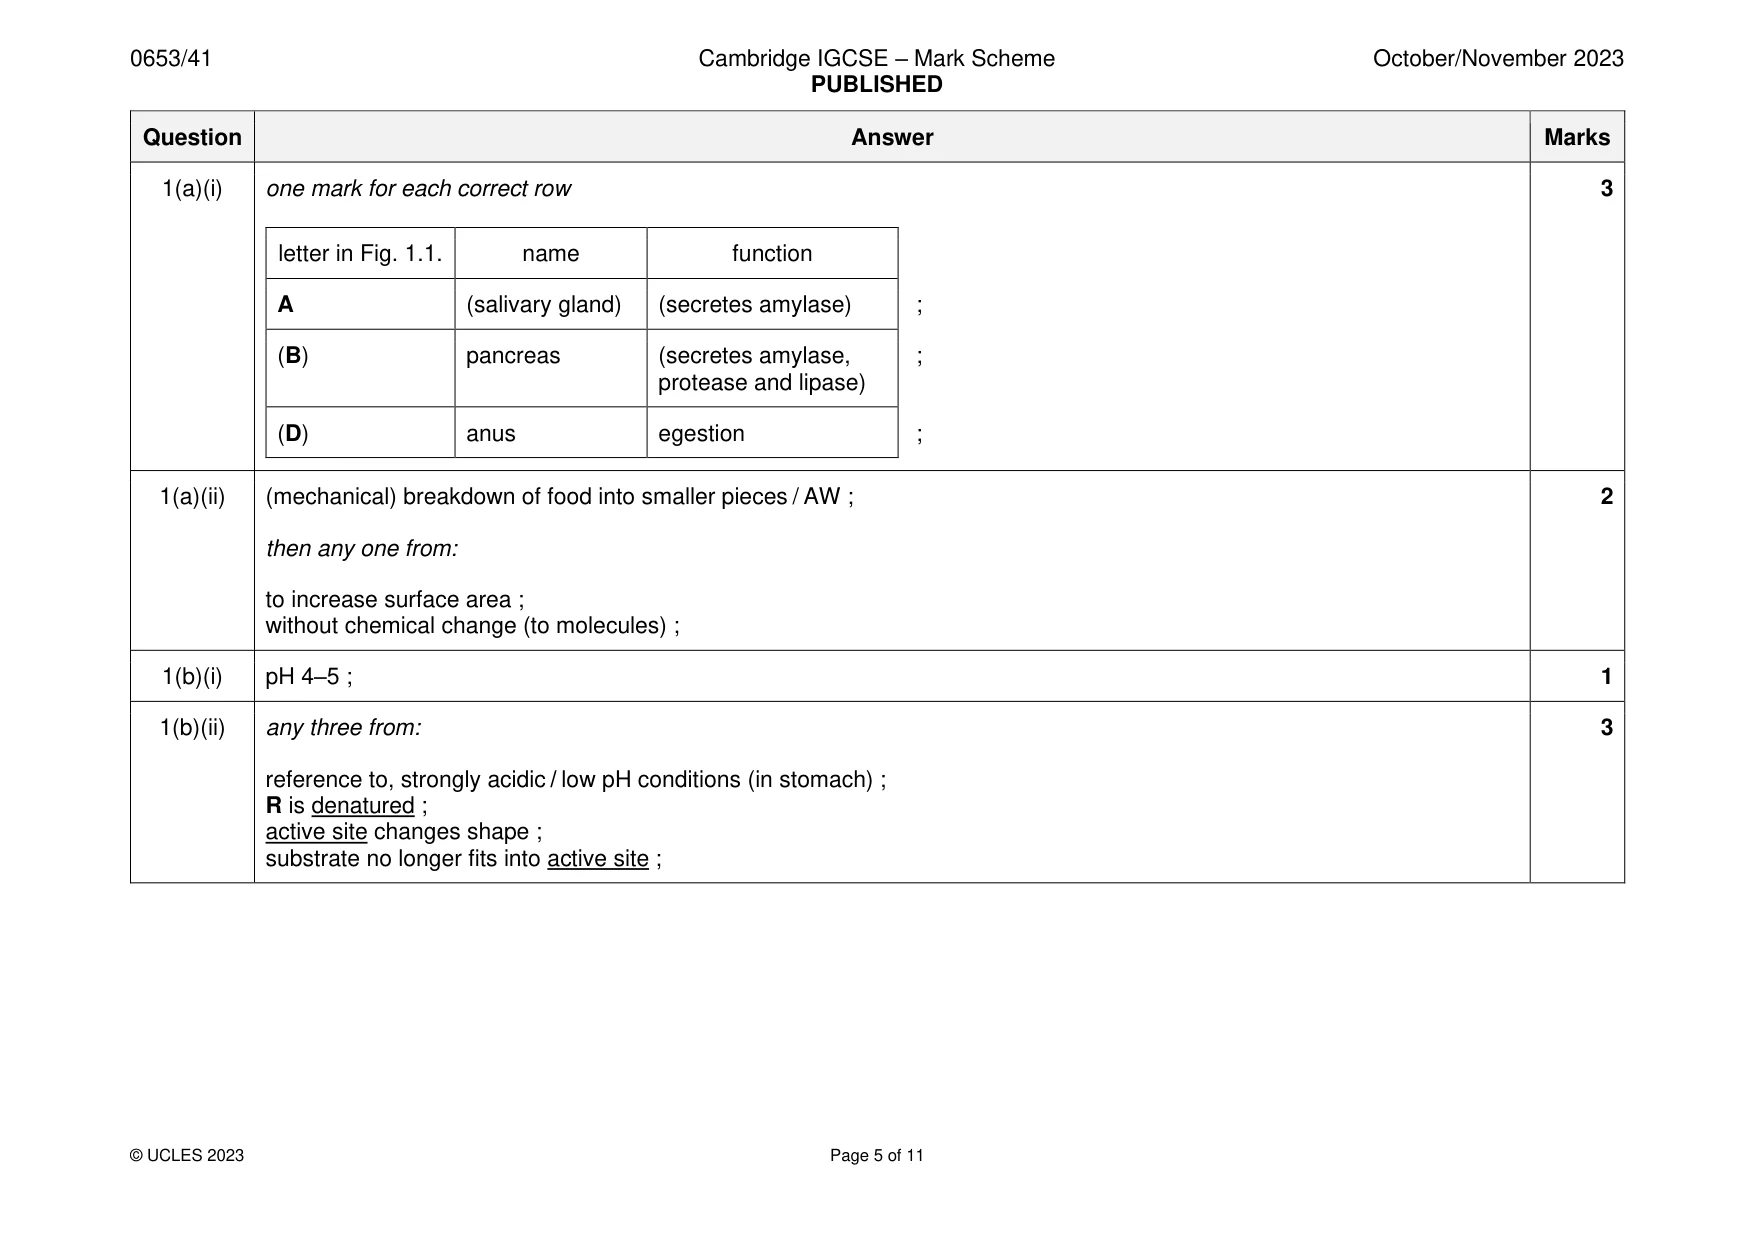
Mark scheme: Question Answer Marks 1(a)(i) one mark for each correct row 3 letter in Fig. 1.1. name function A (salivary gland) (secretes amylase) ; (B) pancreas (secretes amylase, ; protease and lipase) (D) anus egestion ; 1(a)(ii) (mechanical) breakdown of food into smaller pieces / AW ; 2 then any one from: to increase surface area ; without chemical change (to molecules) ; 1(b)(i) pH 4–5 ; 1 1(b)(ii) any three from: 3 reference to, strongly acidic / low pH conditions (in stomach) ; R is denatured ; active site changes shape ; substrate no longer fits into active site ;
Q2 · A student uses inert electrodes to investigate the electrolysis of lead(II) bromide, as…
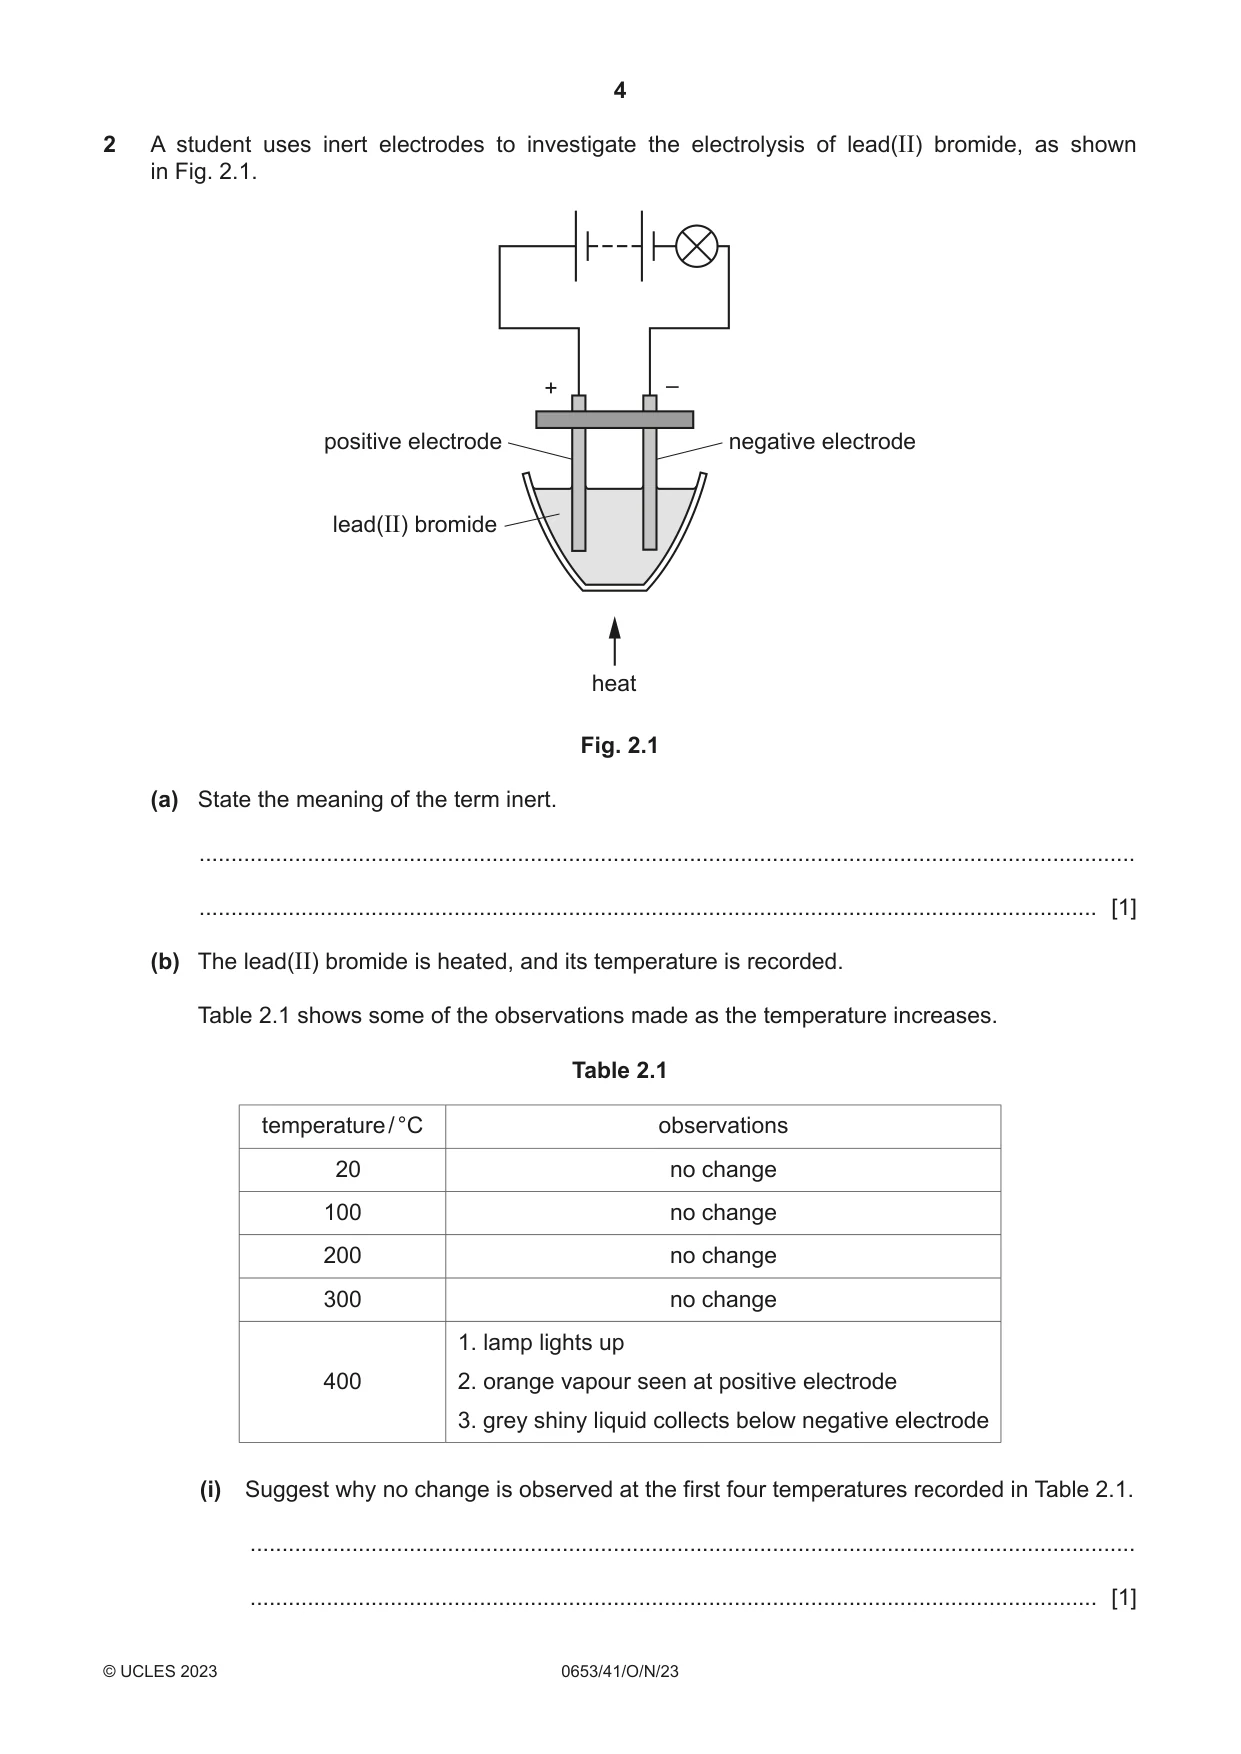
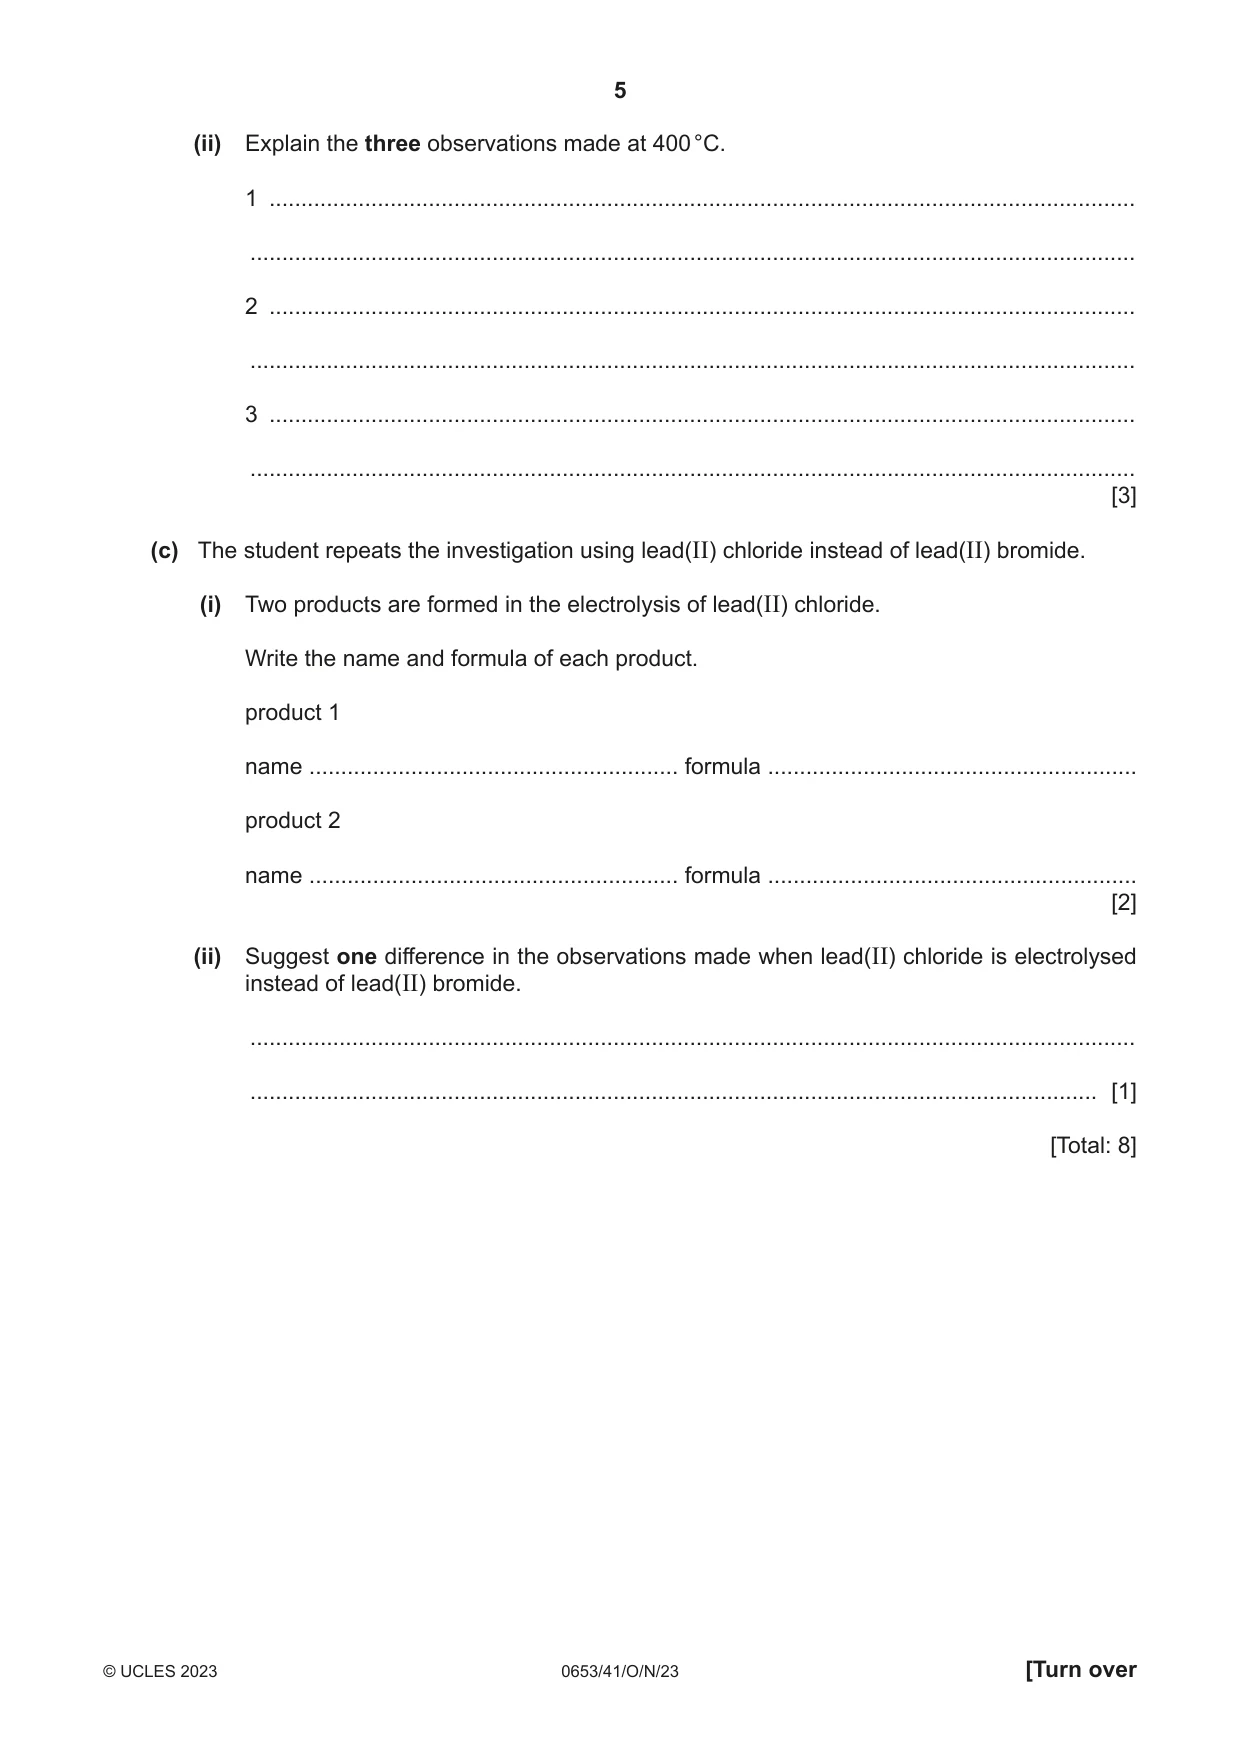
2 A student uses inert electrodes to investigate the electrolysis of lead(II) bromide, as shown in Fig. 2.1. + – positive electrode negative electrode lead(II) bromide heat Fig. 2.1 (a) State the meaning of the term inert. ................................................................................................................................................... ............................................................................................................................................. [1] (b) The lead(II) bromide is heated, and its temperature is recorded. Table 2.1 shows some of the observations made as the temperature increases. Table 2.1 temperature / °C observations 20 no change 100 no change 200 no change 300 no change 1. lamp lights up 400 2. orange vapour seen at positive electrode 3. grey shiny liquid collects below negative electrode (i) Suggest why no change is observed at the first four temperatures recorded in Table 2.1. ........................................................................................................................................... ..................................................................................................................................... [1] (ii) Explain the three observations made at 400 °C. 1 ........................................................................................................................................ ........................................................................................................................................... 2 ........................................................................................................................................ ........................................................................................................................................... 3 ........................................................................................................................................ ........................................................................................................................................... [3] (c) The student repeats the investigation using lead(II) chloride instead of lead(II) bromide. (i) Two products are formed in the electrolysis of lead(II) chloride. Write the name and formula of each product. product 1 name .......................................................... formula .......................................................... product 2 name .......................................................... formula .......................................................... [2] (ii) Suggest one difference in the observations made when lead(II) chloride is electrolysed instead of lead(II) bromide. ........................................................................................................................................... ..................................................................................................................................... [1] [Total: 8]
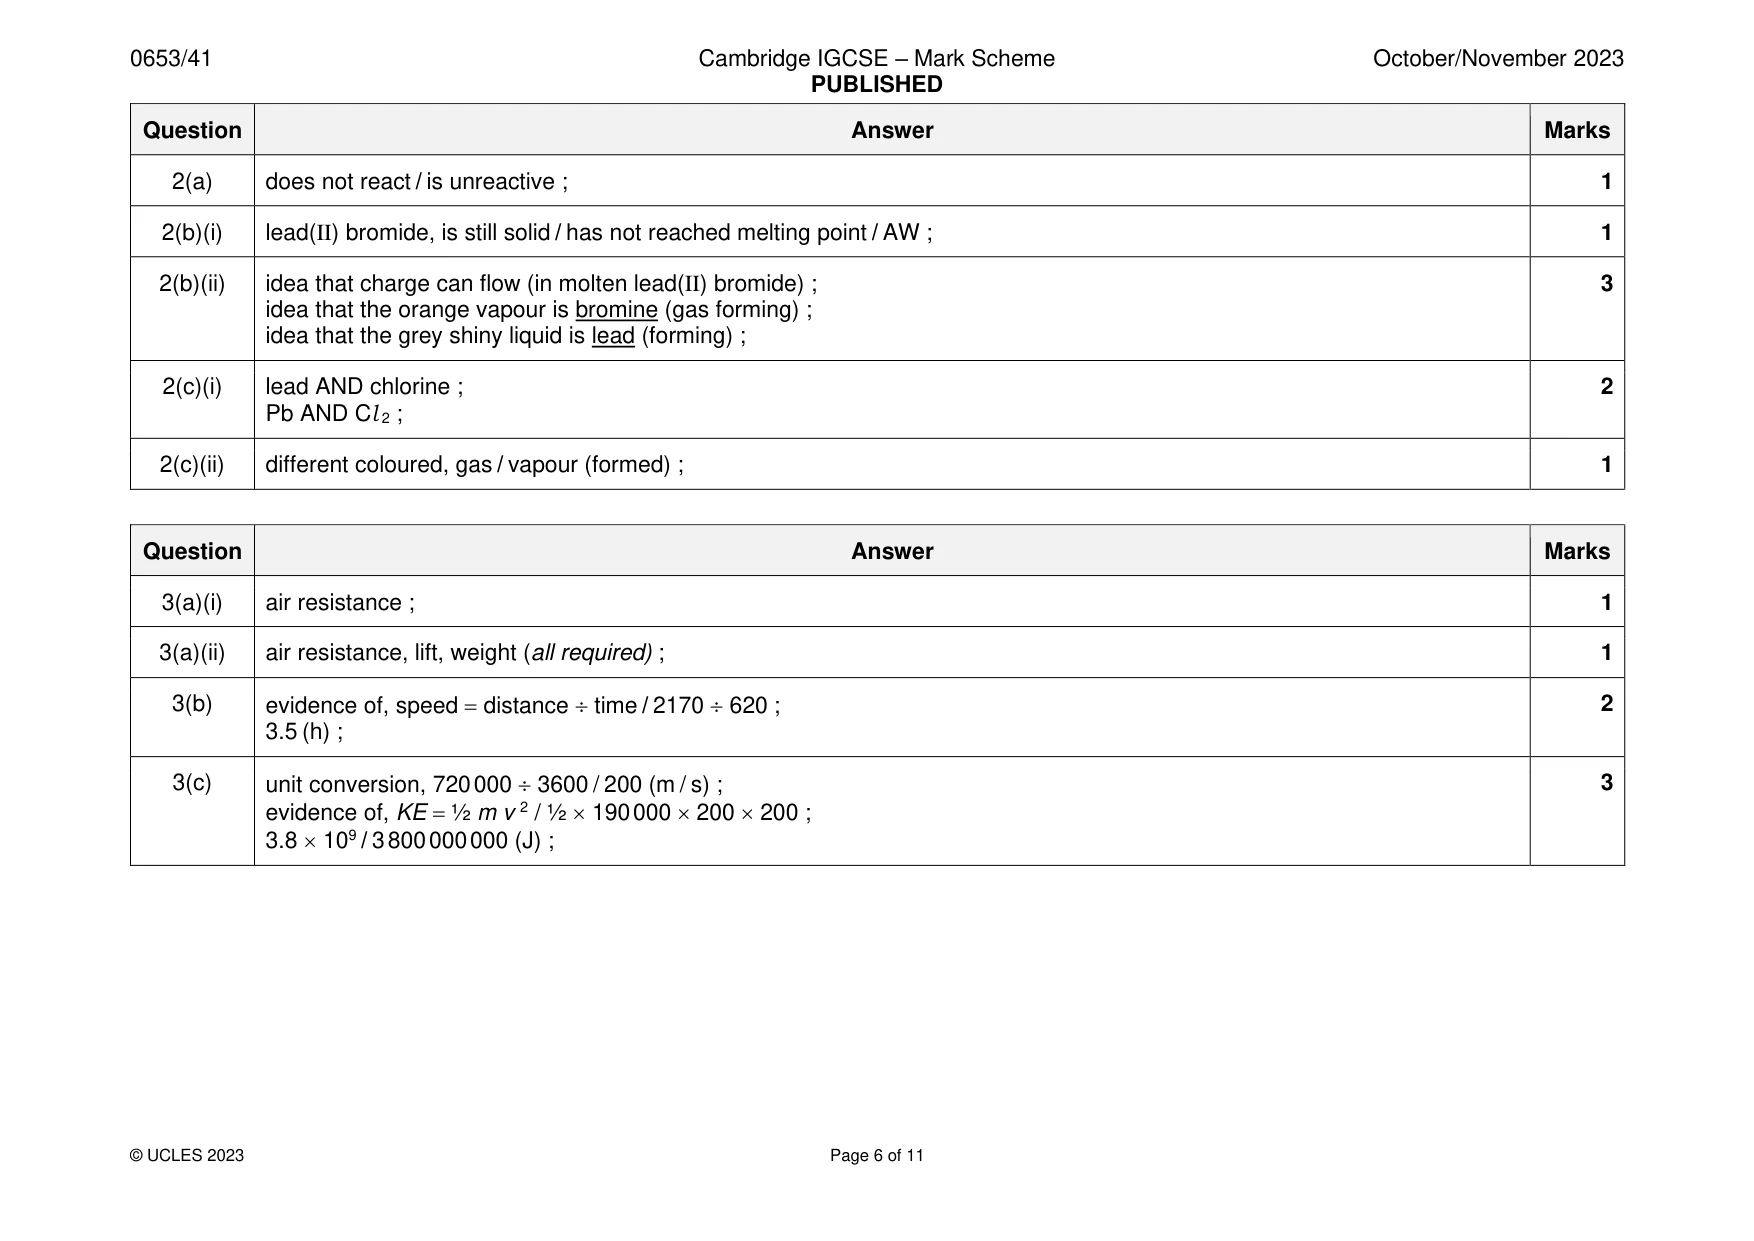
Mark scheme: 2(a) does not react / is unreactive ; 1 2(b)(i) lead(II) bromide, is still solid / has not reached melting point / AW ; 1 2(b)(ii) idea that charge can flow (in molten lead(II) bromide) ; 3 idea that the orange vapour is bromine (gas forming) ; idea that the grey shiny liquid is lead (forming) ; 2(c)(i) lead AND chlorine ; 2 Pb AND Cl 2 ; 2(c)(ii) different coloured, gas / vapour (formed) ; 1
Q3 · The names of the forces acting on an aircraft flying at a constant speed and at a…
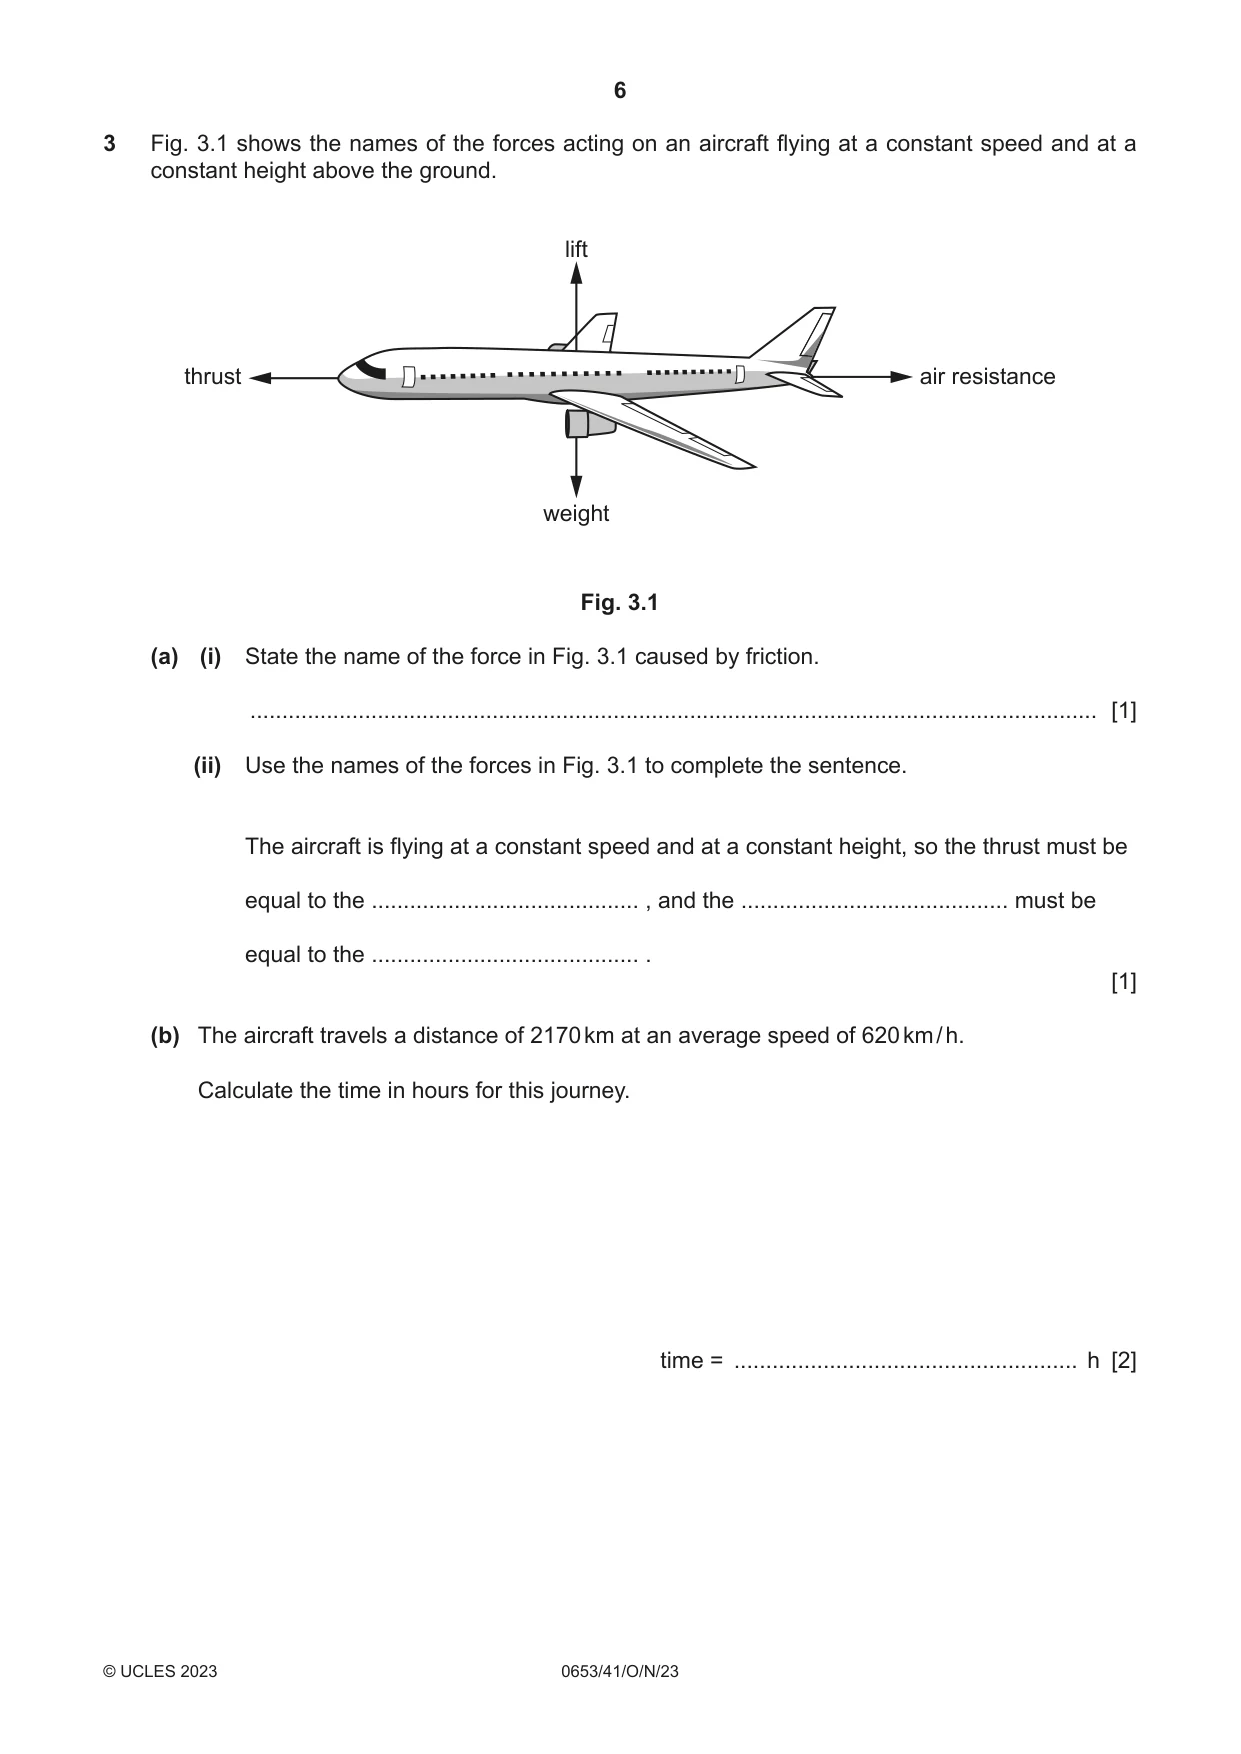
3 Fig. 3.1 shows the names of the forces acting on an aircraft flying at a constant speed and at a constant height above the ground. lift thrust air resistance weight Fig. 3.1 (a) (i) State the name of the force in Fig. 3.1 caused by friction. ..................................................................................................................................... [1] (ii) Use the names of the forces in Fig. 3.1 to complete the sentence. The aircraft is flying at a constant speed and at a constant height, so the thrust must be equal to the .......................................... , and the .......................................... must be equal to the .......................................... . [1] (b) The aircraft travels a distance of 2170 km at an average speed of 620 km / h. Calculate the time in hours for this journey. time = ...................................................... h [2] (c) The aircraft has a mass of 190 000 kg. The maximum speed of the aircraft is 720 km / h. Calculate the kinetic energy of the aircraft at maximum speed. kinetic energy = ...................................................... J [3] [Total: 7]
Mark scheme: 3(a)(i) air resistance ; 1 3(a)(ii) air resistance, lift, weight (all required) ; 1 3(b) evidence of, speed = distance time / 2170 620 ; 2 3.5 (h) ; 3(c) unit conversion, 720 000 3600 / 200 (m / s) ; 3 evidence of, KE = ½ m v 2 / ½ 190 000 200 200 ; 3.8 109 / 3 800 000 000 (J) ;
Q4 · Part of the breathing system in humans
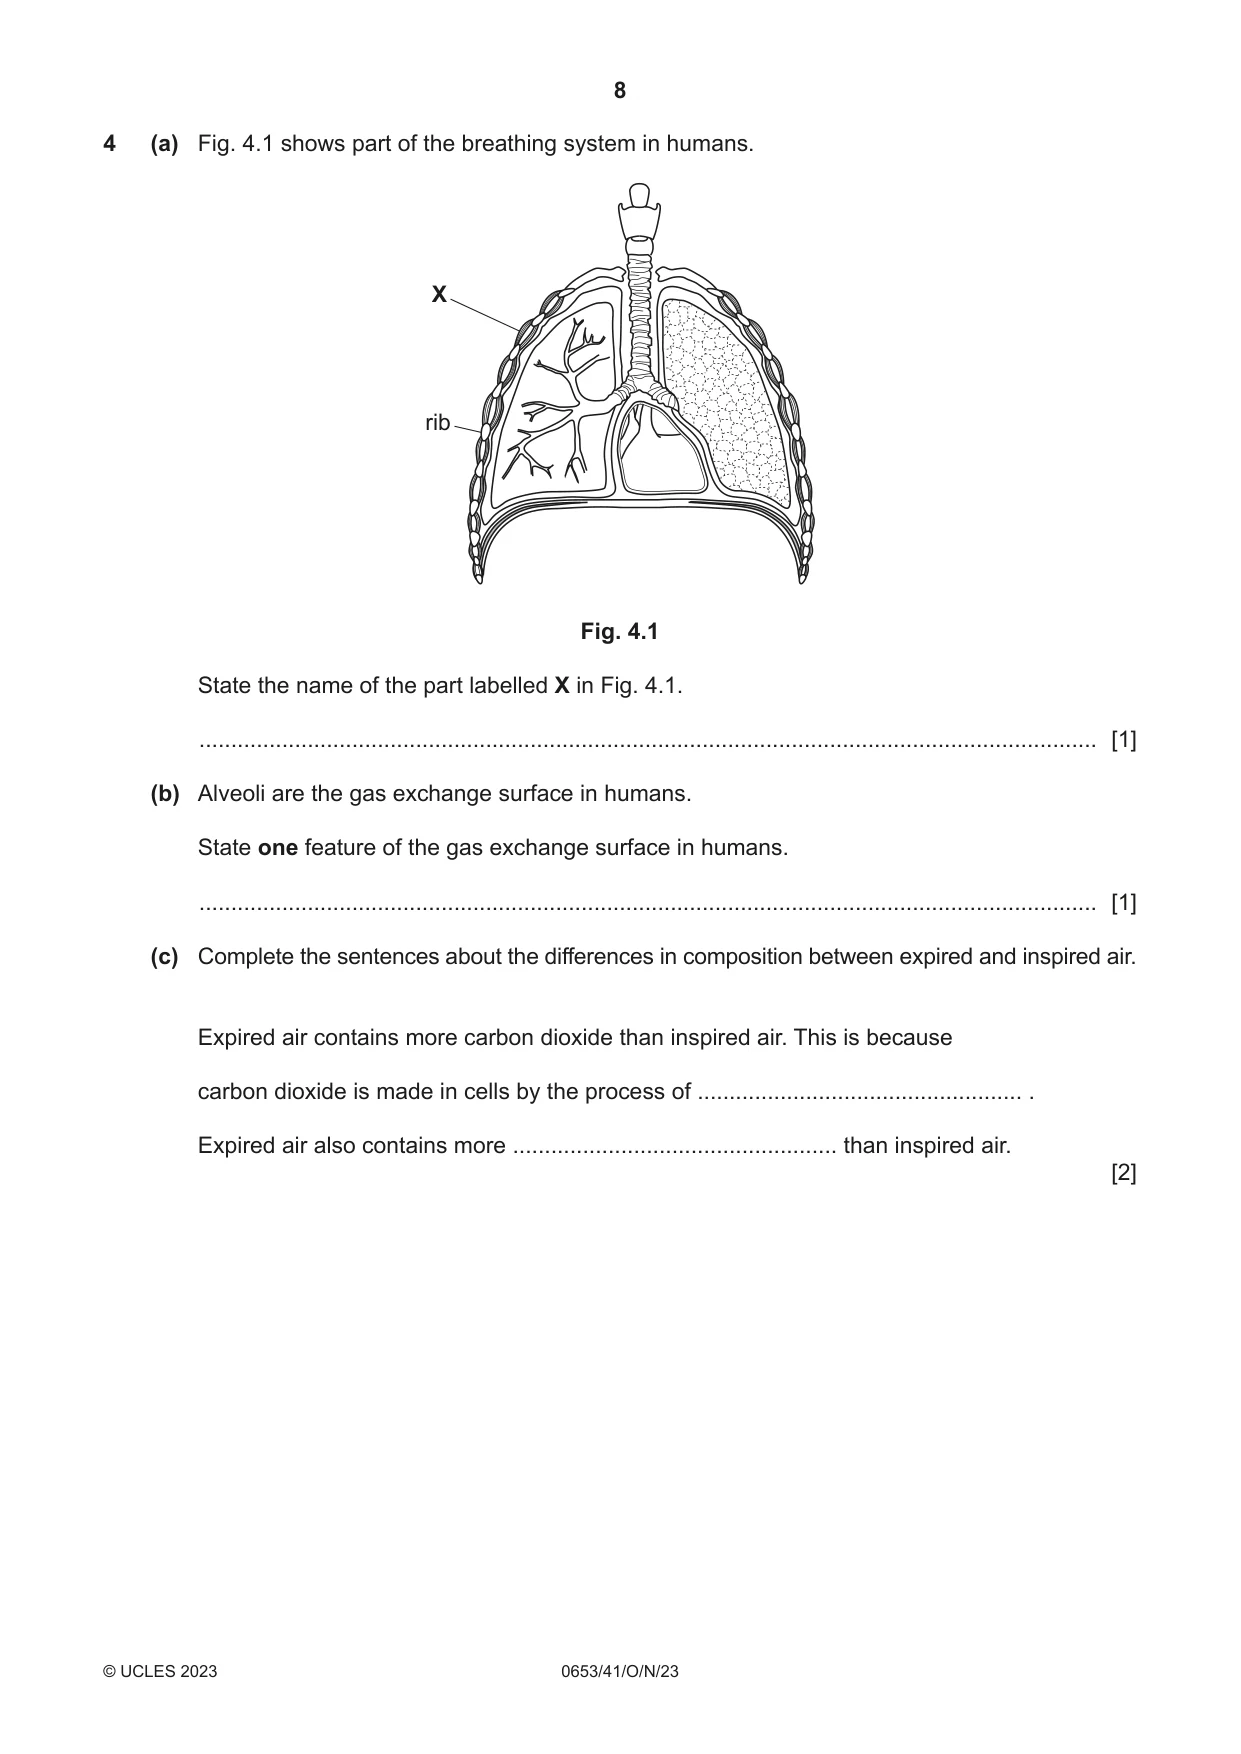
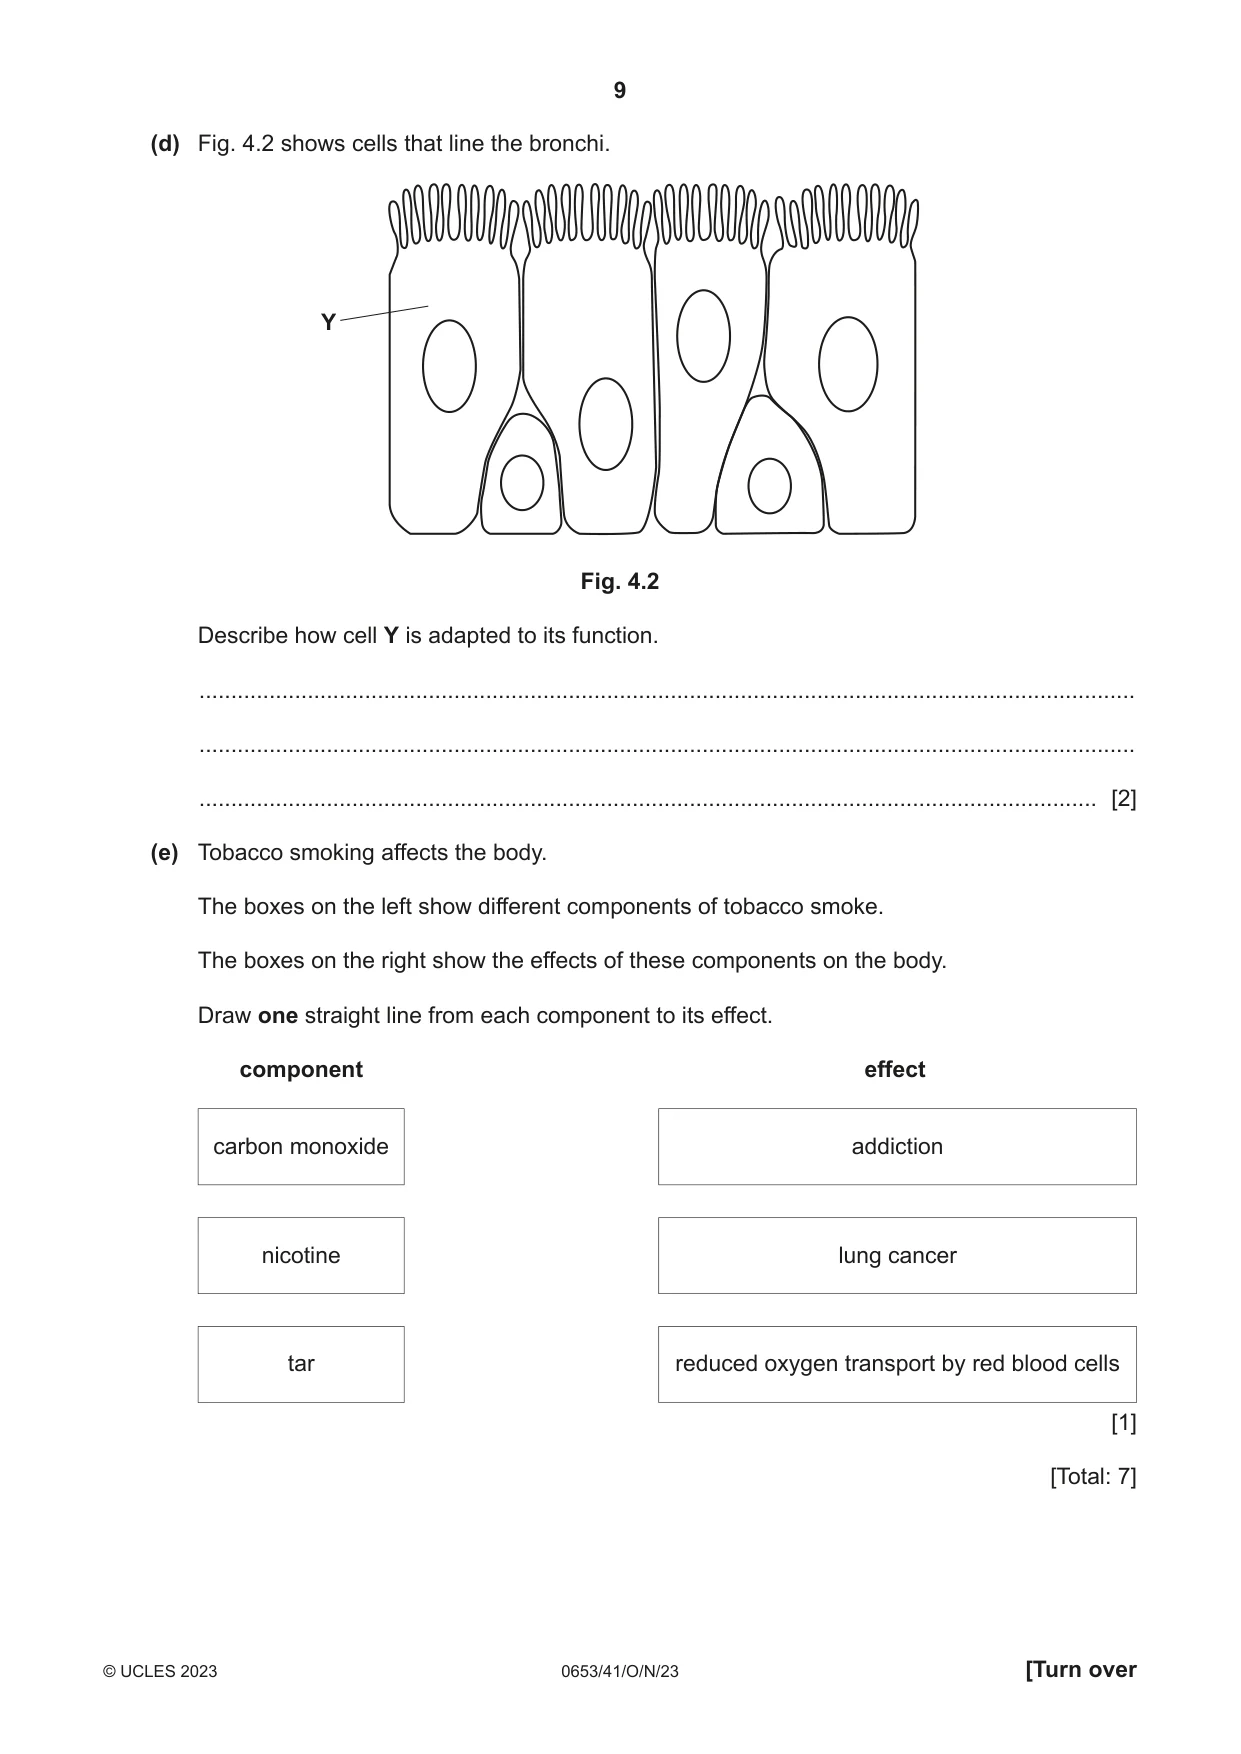
4 (a) Fig. 4.1 shows part of the breathing system in humans. X rib Fig. 4.1 State the name of the part labelled X in Fig. 4.1. ............................................................................................................................................. [1] (b) Alveoli are the gas exchange surface in humans. State one feature of the gas exchange surface in humans. ............................................................................................................................................. [1] (c) Complete the sentences about the differences in composition between expired and inspired air. Expired air contains more carbon dioxide than inspired air. This is because carbon dioxide is made in cells by the process of ................................................... . Expired air also contains more ................................................... than inspired air. [2] (d) Fig. 4.2 shows cells that line the bronchi. Y Fig. 4.2 Describe how cell Y is adapted to its function. ................................................................................................................................................... ................................................................................................................................................... ............................................................................................................................................. [2] (e) Tobacco smoking affects the body. The boxes on the left show different components of tobacco smoke. The boxes on the right show the effects of these components on the body. Draw one straight line from each component to its effect. component effect carbon monoxide addiction nicotine lung cancer tar reduced oxygen transport by red blood cells [1] [Total: 7]
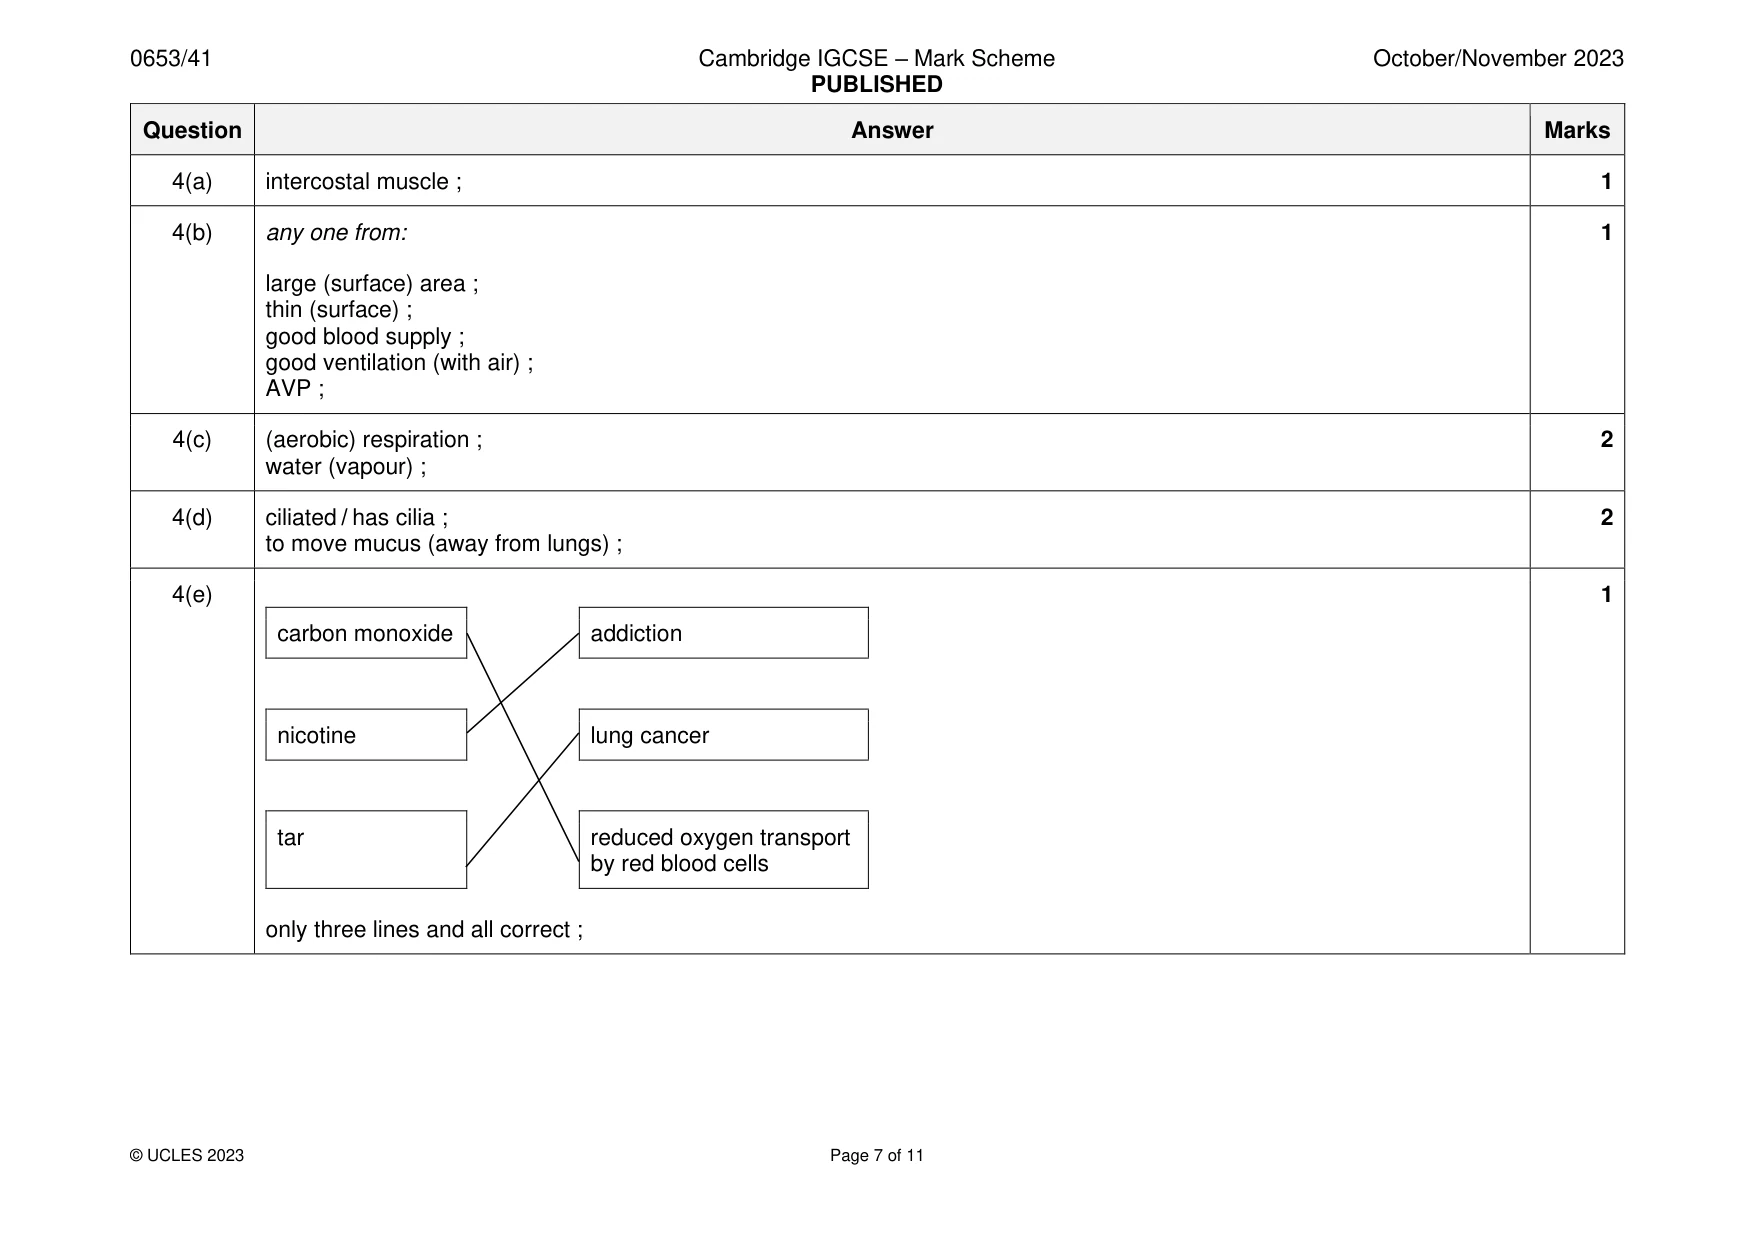
Mark scheme: 4(a) intercostal muscle ; 1 4(b) any one from: 1 large (surface) area ; thin (surface) ; good blood supply ; good ventilation (with air) ; AVP ; 4(c) (aerobic) respiration ; 2 water (vapour) ; 4(d) ciliated / has cilia ; 2 to move mucus (away from lungs) ; 4(e) 1 carbon monoxide addiction nicotine lung cancer tar reduced oxygen transport by red blood cells only three lines and all correct ;
Q5 · A student does five experiments to investigate the reaction between zinc granules and…
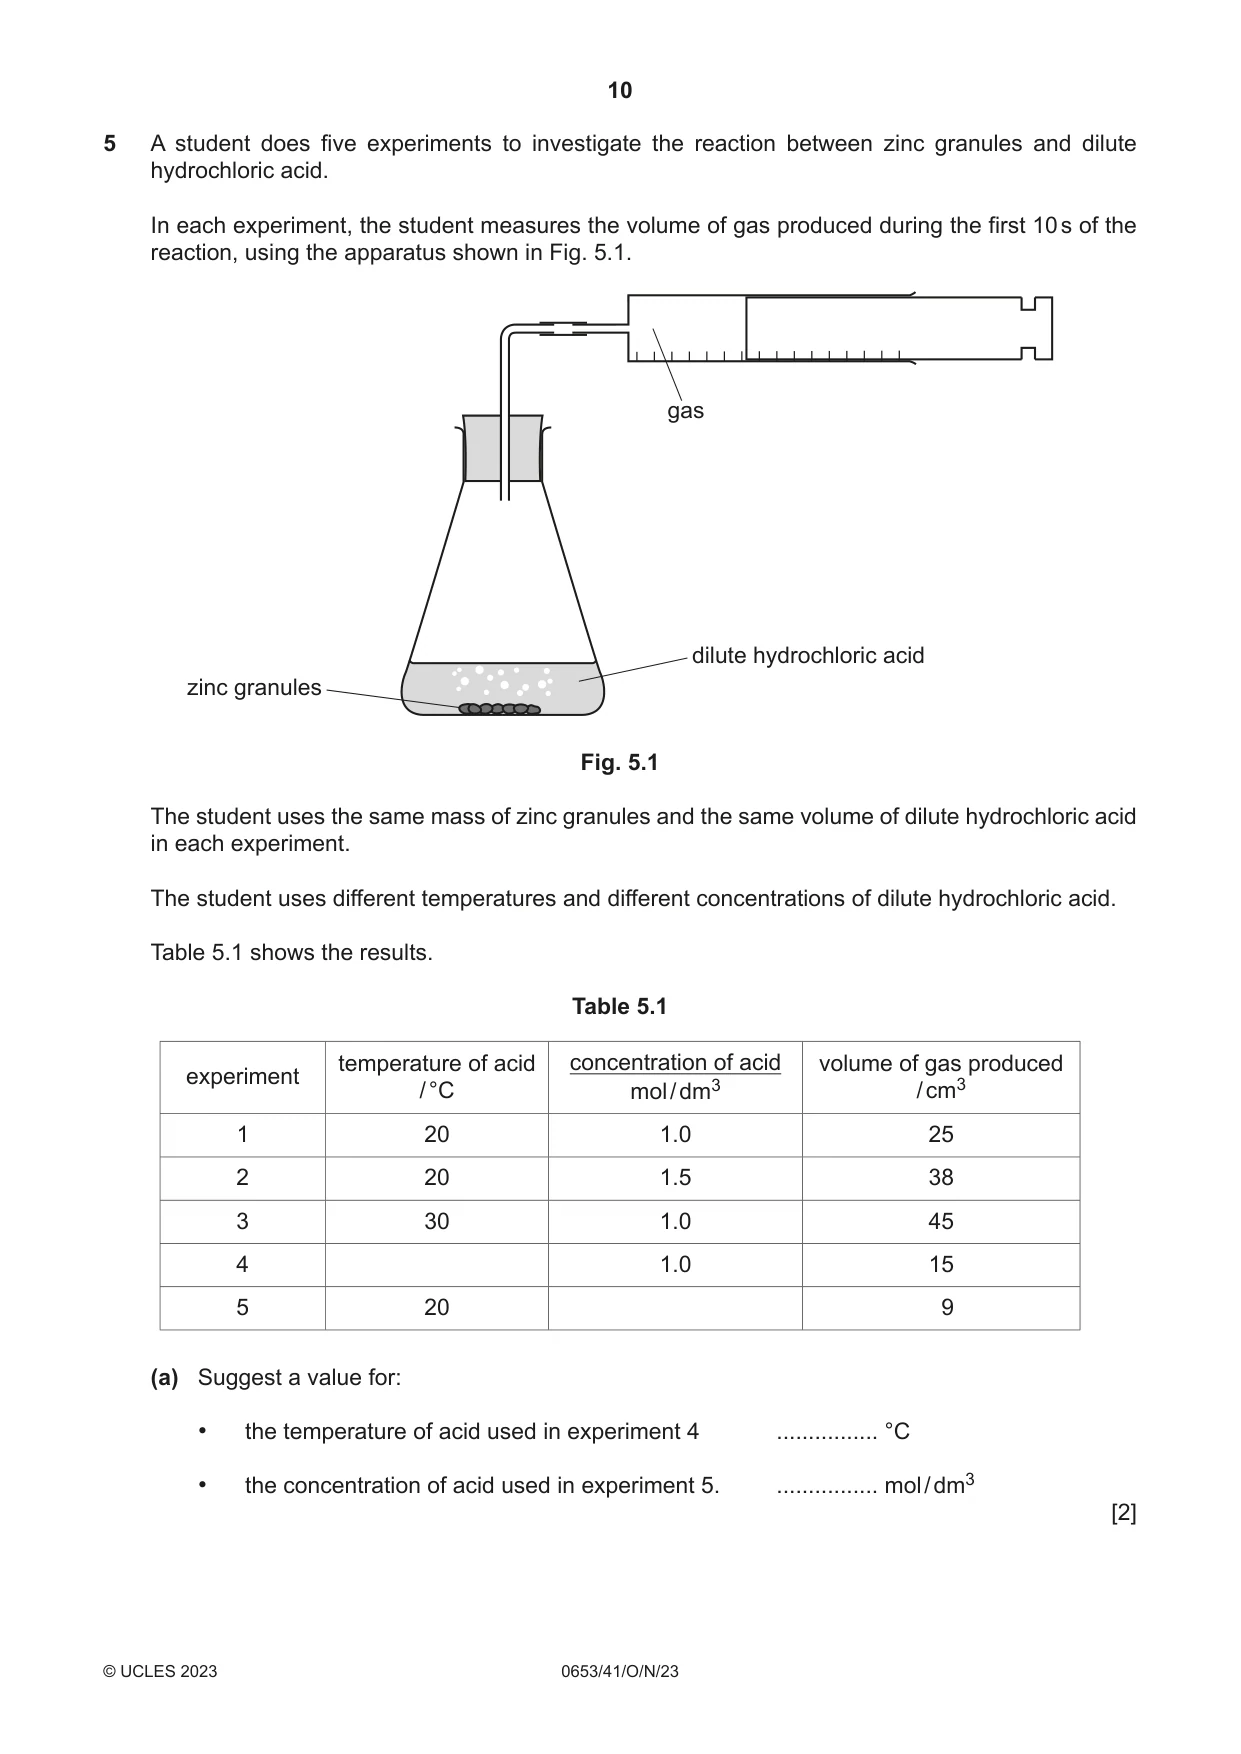
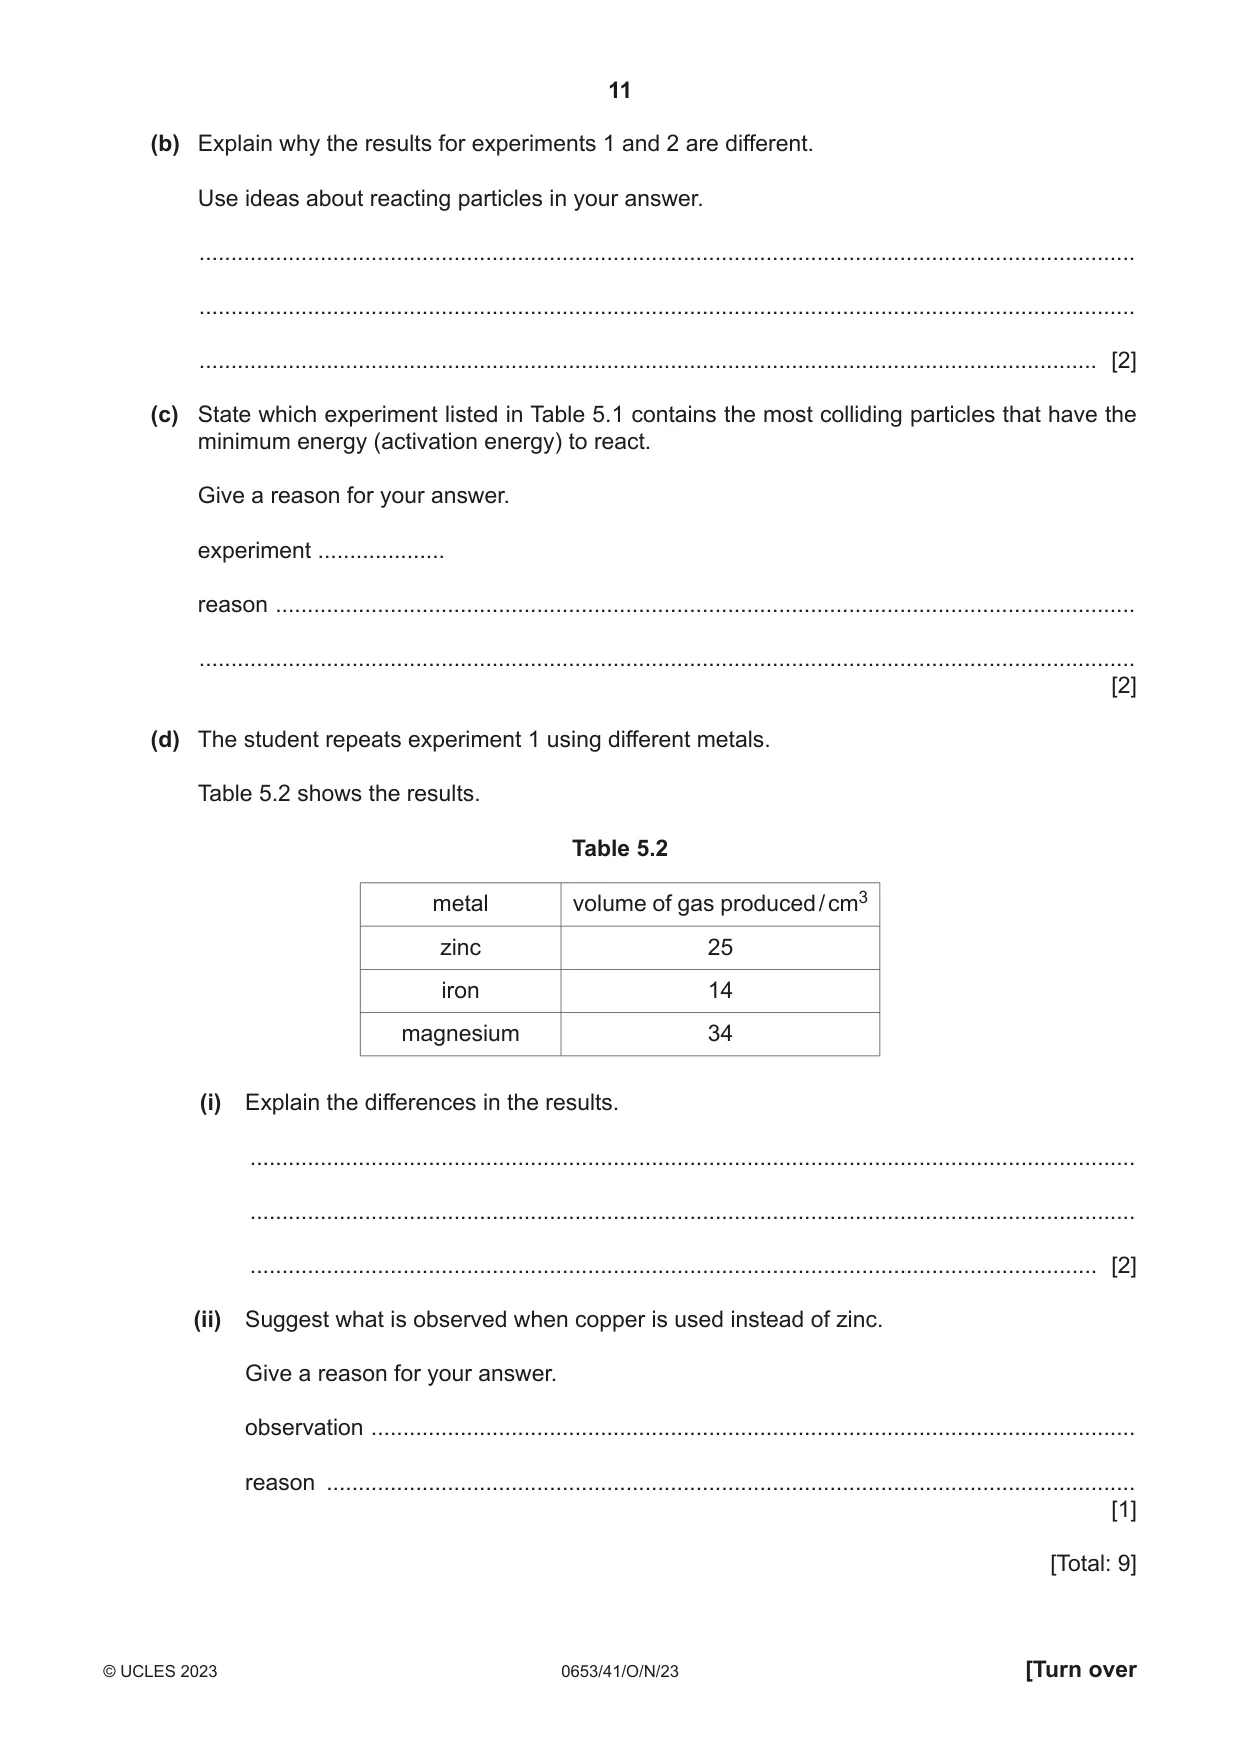
5 A student does five experiments to investigate the reaction between zinc granules and dilute hydrochloric acid. In each experiment, the student measures the volume of gas produced during the first 10 s of the reaction, using the apparatus shown in Fig. 5.1. gas dilute hydrochloric acid zinc granules Fig. 5.1 The student uses the same mass of zinc granules and the same volume of dilute hydrochloric acid in each experiment. The student uses different temperatures and different concentrations of dilute hydrochloric acid. Table 5.1 shows the results. Table 5.1 temperature of acid concentration of acid volume of gas produced experiment / °C mol / dm3 / cm3 1 20 1.0 25 2 20 1.5 38 3 30 1.0 45 4 1.0 15 5 20 9 (a) Suggest a value for: • the temperature of acid used in experiment 4 ................ °C • the concentration of acid used in experiment 5. ................ mol / dm3 [2] (b) Explain why the results for experiments 1 and 2 are different. Use ideas about reacting particles in your answer. ................................................................................................................................................... ................................................................................................................................................... ............................................................................................................................................. [2] (c) State which experiment listed in Table 5.1 contains the most colliding particles that have the minimum energy (activation energy) to react. Give a reason for your answer. experiment .................... reason ....................................................................................................................................... ................................................................................................................................................... [2] (d) The student repeats experiment 1 using different metals. Table 5.2 shows the results. Table 5.2 metal volume of gas produced / cm3 zinc 25 iron 14 magnesium 34 (i) Explain the differences in the results. ........................................................................................................................................... ........................................................................................................................................... ..................................................................................................................................... [2] (ii) Suggest what is observed when copper is used instead of zinc. Give a reason for your answer. observation ........................................................................................................................ reason ............................................................................................................................... [1] [Total: 9]
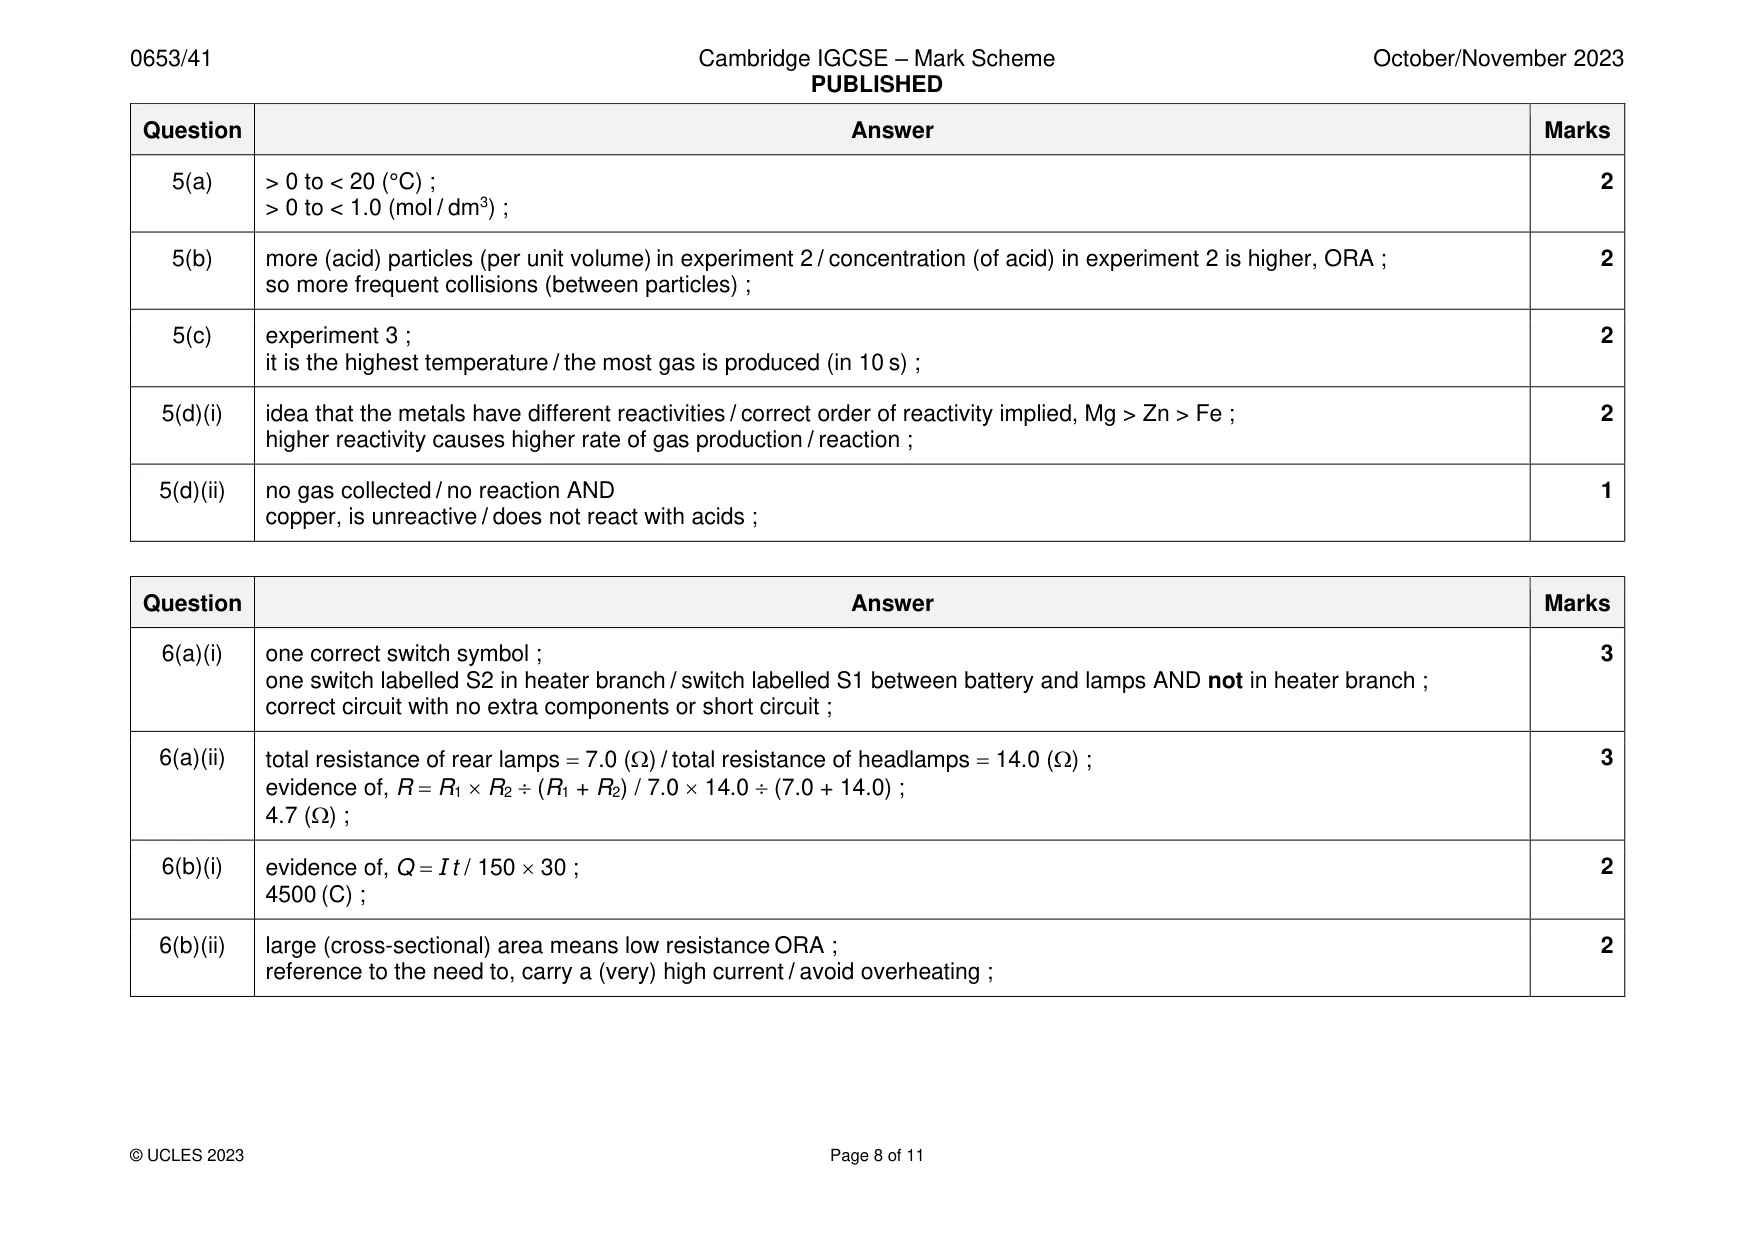
Mark scheme: 5(a) > 0 to < 20 (°C) ; 2 > 0 to < 1.0 (mol / dm3) ; 5(b) more (acid) particles (per unit volume) in experiment 2 / concentration (of acid) in experiment 2 is higher, ORA ; 2 so more frequent collisions (between particles) ; 5(c) experiment 3 ; 2 it is the highest temperature / the most gas is produced (in 10 s) ; 5(d)(i) idea that the metals have different reactivities / correct order of reactivity implied, Mg > Zn > Fe ; 2 higher reactivity causes higher rate of gas production / reaction ; 5(d)(ii) no gas collected / no reaction AND 1 copper, is unreactive / does not react with acids ;
Q6 · An incomplete circuit diagram for the heater, two headlamps and two rear lamps in a car
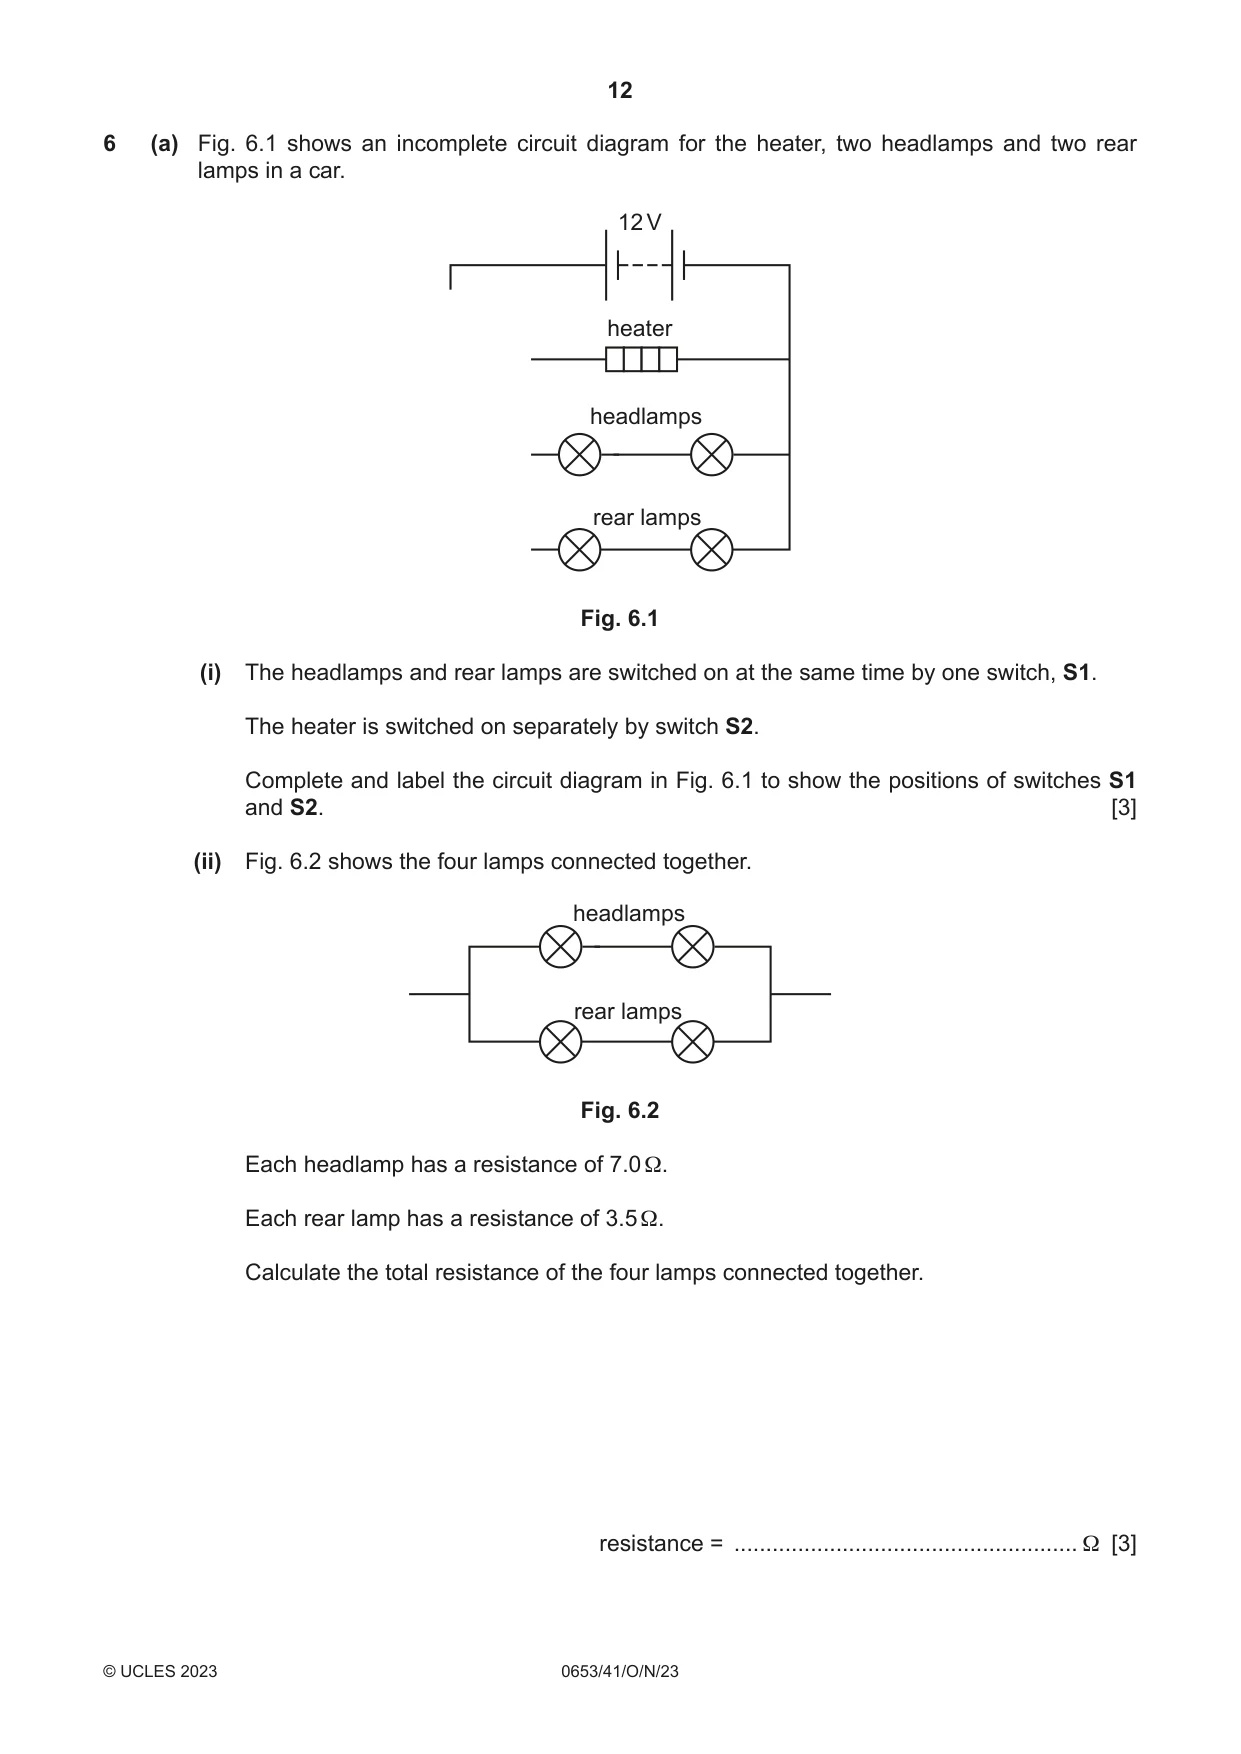
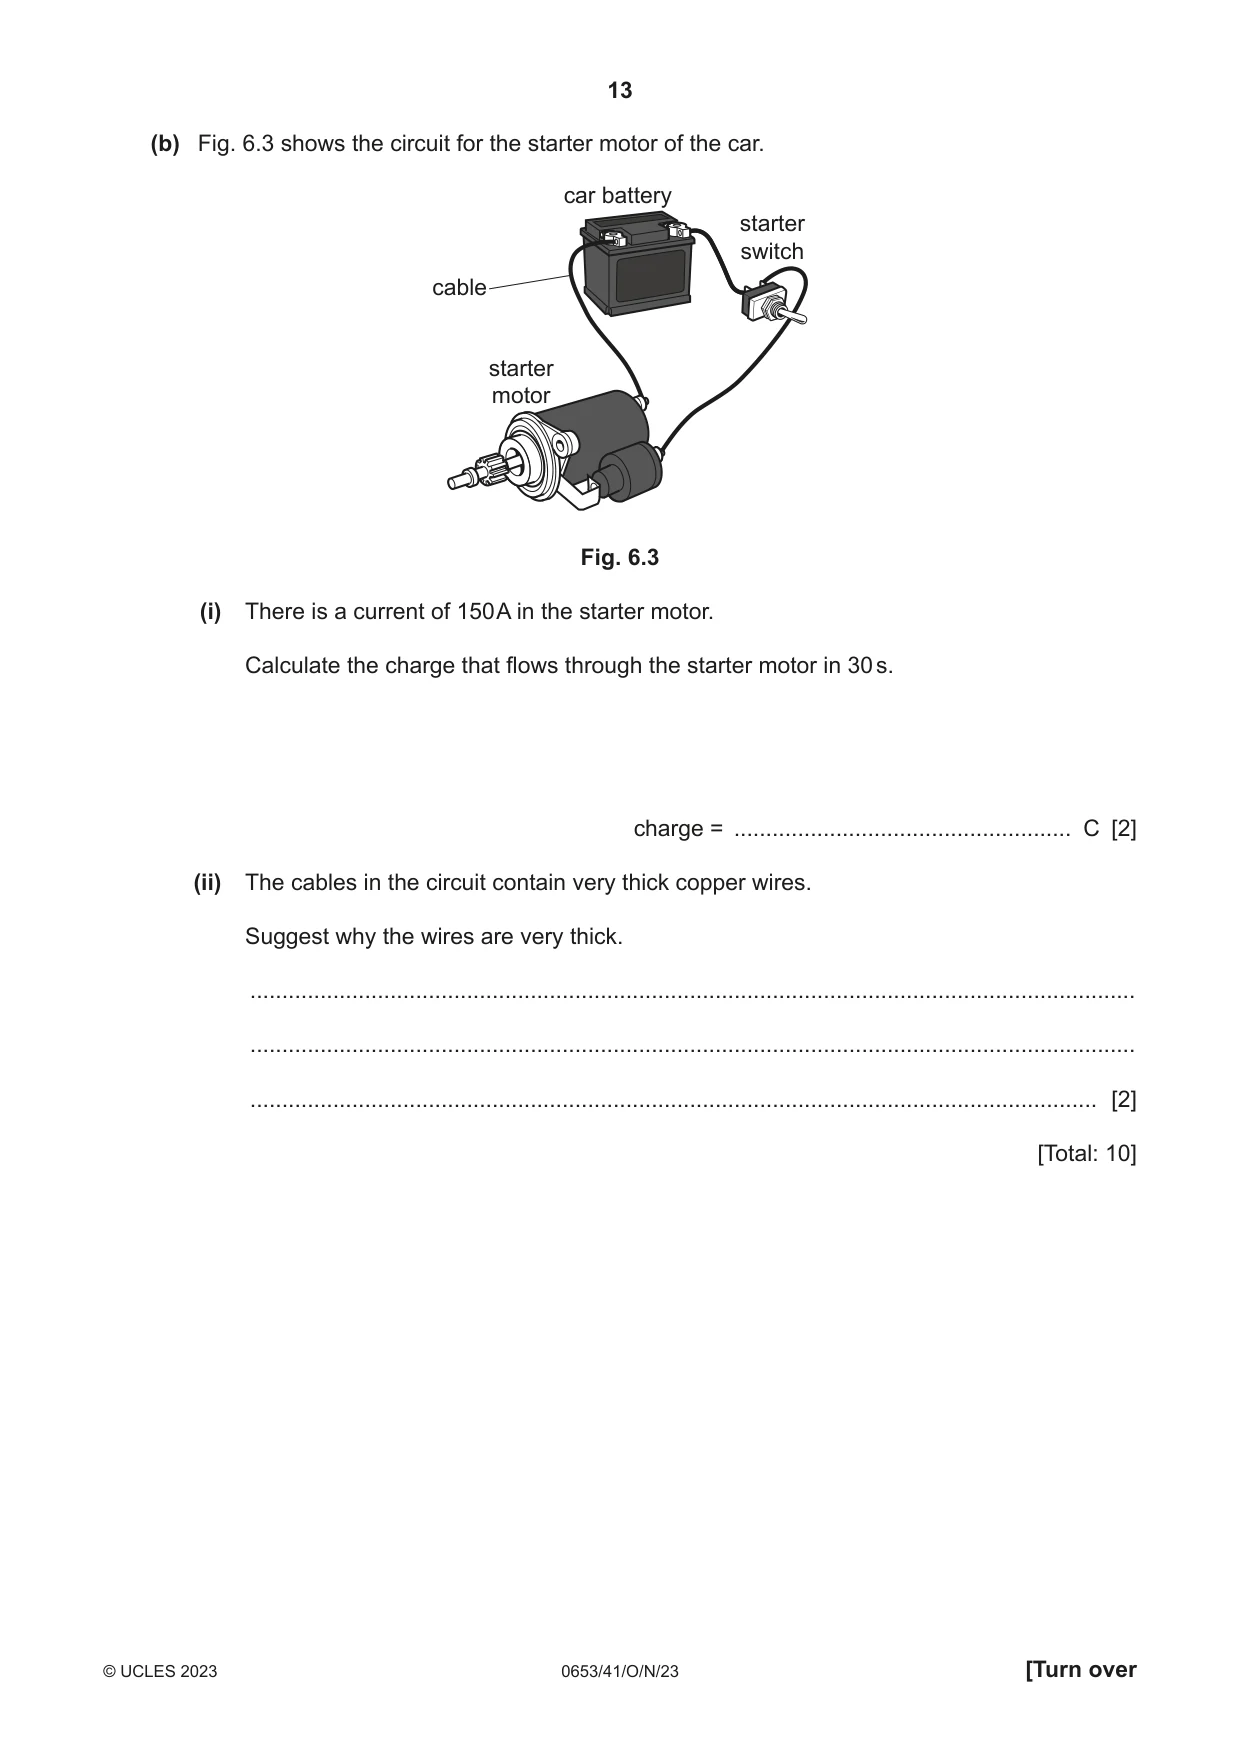
6 (a) Fig. 6.1 shows an incomplete circuit diagram for the heater, two headlamps and two rear lamps in a car. 12 V heater headlamps rear lamps Fig. 6.1 (i) The headlamps and rear lamps are switched on at the same time by one switch, S1. The heater is switched on separately by switch S2. Complete and label the circuit diagram in Fig. 6.1 to show the positions of switches S1 and S2. [3] (ii) Fig. 6.2 shows the four lamps connected together. headlamps rear lamps Fig. 6.2 Each headlamp has a resistance of 7.0 Ω. Each rear lamp has a resistance of 3.5 Ω. Calculate the total resistance of the four lamps connected together. resistance = ...................................................... Ω [3] (b) Fig. 6.3 shows the circuit for the starter motor of the car. car battery starter switch cable starter motor Fig. 6.3 (i) There is a current of 150 A in the starter motor. Calculate the charge that flows through the starter motor in 30 s. charge = ..................................................... C [2] (ii) The cables in the circuit contain very thick copper wires. Suggest why the wires are very thick. ........................................................................................................................................... ........................................................................................................................................... ..................................................................................................................................... [2] [Total: 10]
Mark scheme: 6(a)(i) one correct switch symbol ; 3 one switch labelled S2 in heater branch / switch labelled S1 between battery and lamps AND not in heater branch ; correct circuit with no extra components or short circuit ; 6(a)(ii) total resistance of rear lamps = 7.0 () / total resistance of headlamps = 14.0 () ; 3 evidence of, R = R1 R2 (R1 + R2) / 7.0 14.0 (7.0 + 14.0) ; 4.7 () ; 6(b)(i) evidence of, Q = I t / 150 30 ; 2 4500 (C) ; 6(b)(ii) large (cross-sectional) area means low resistance ORA ; 2 reference to the need to, carry a (very) high current / avoid overheating ;
Question 7
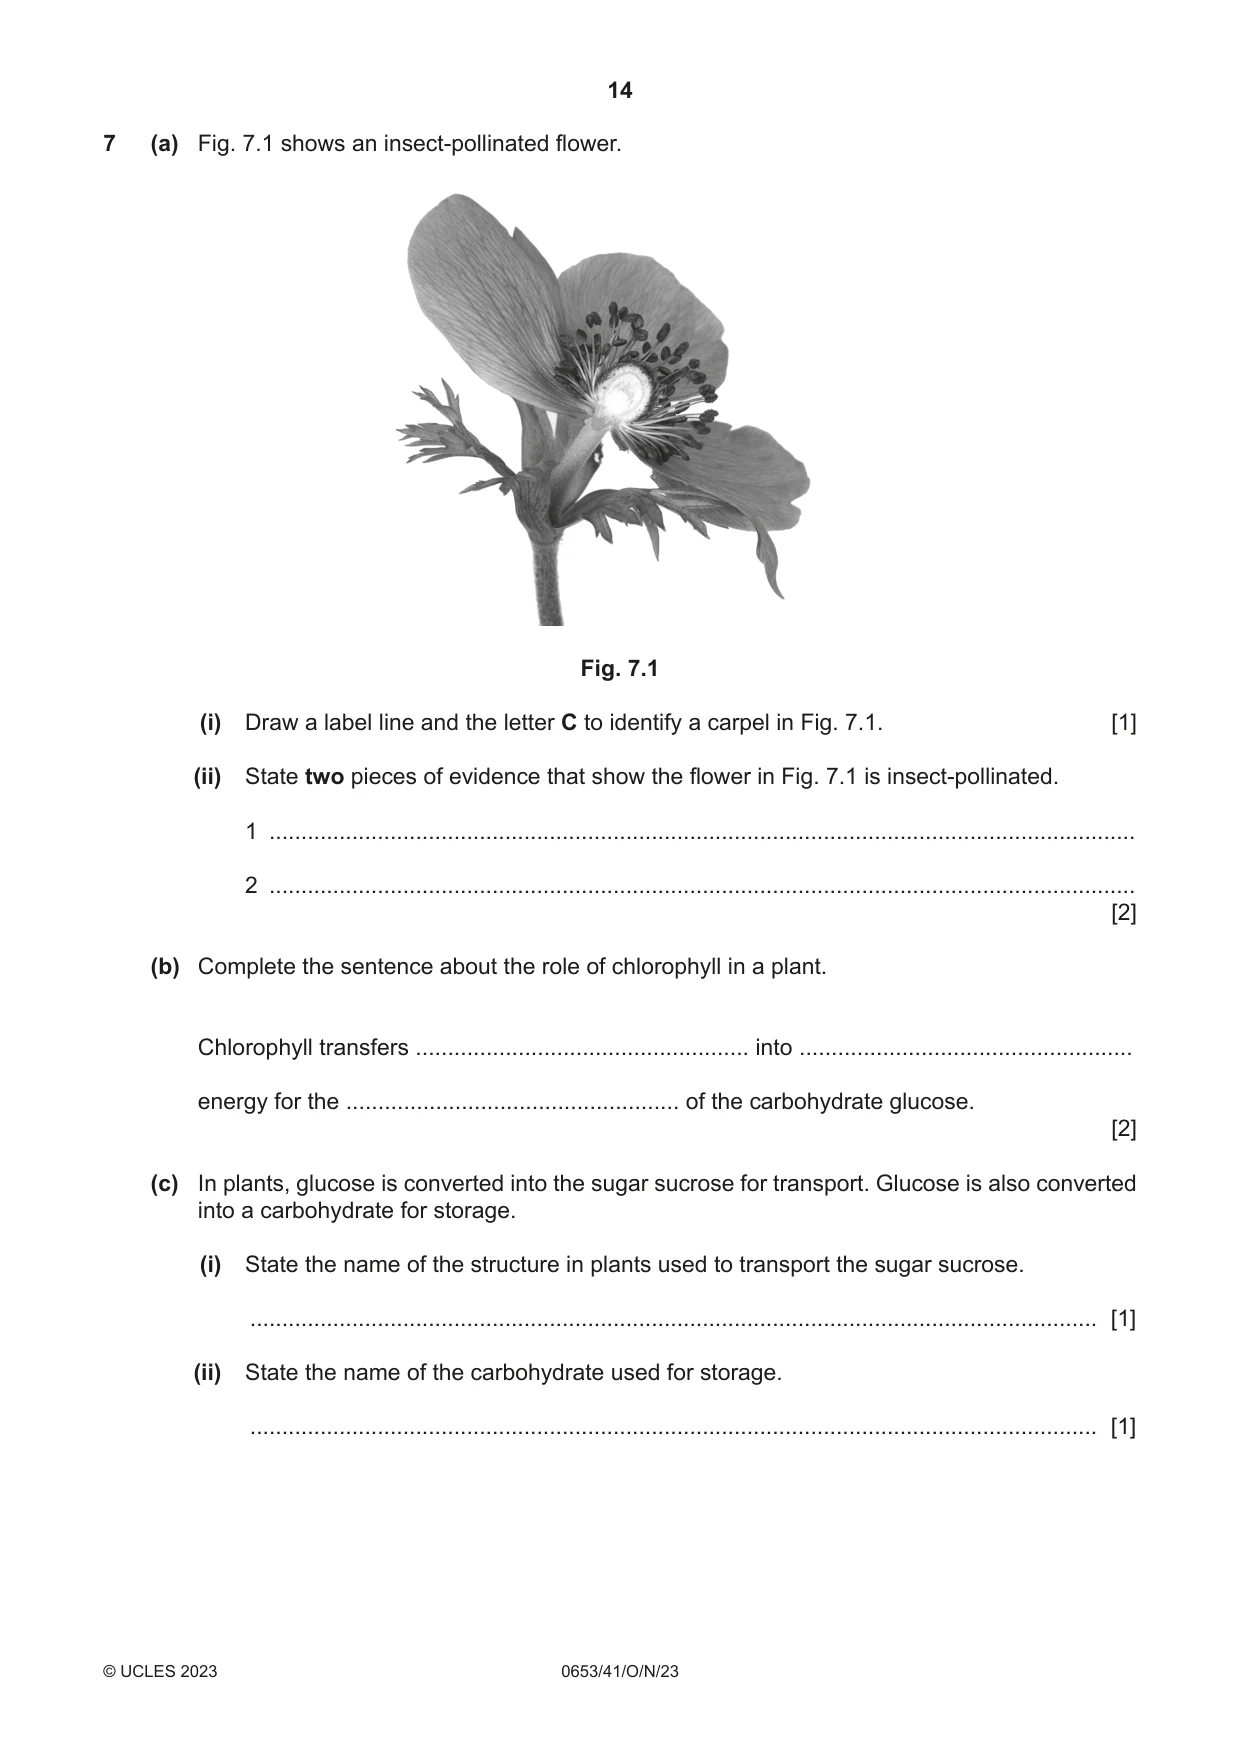
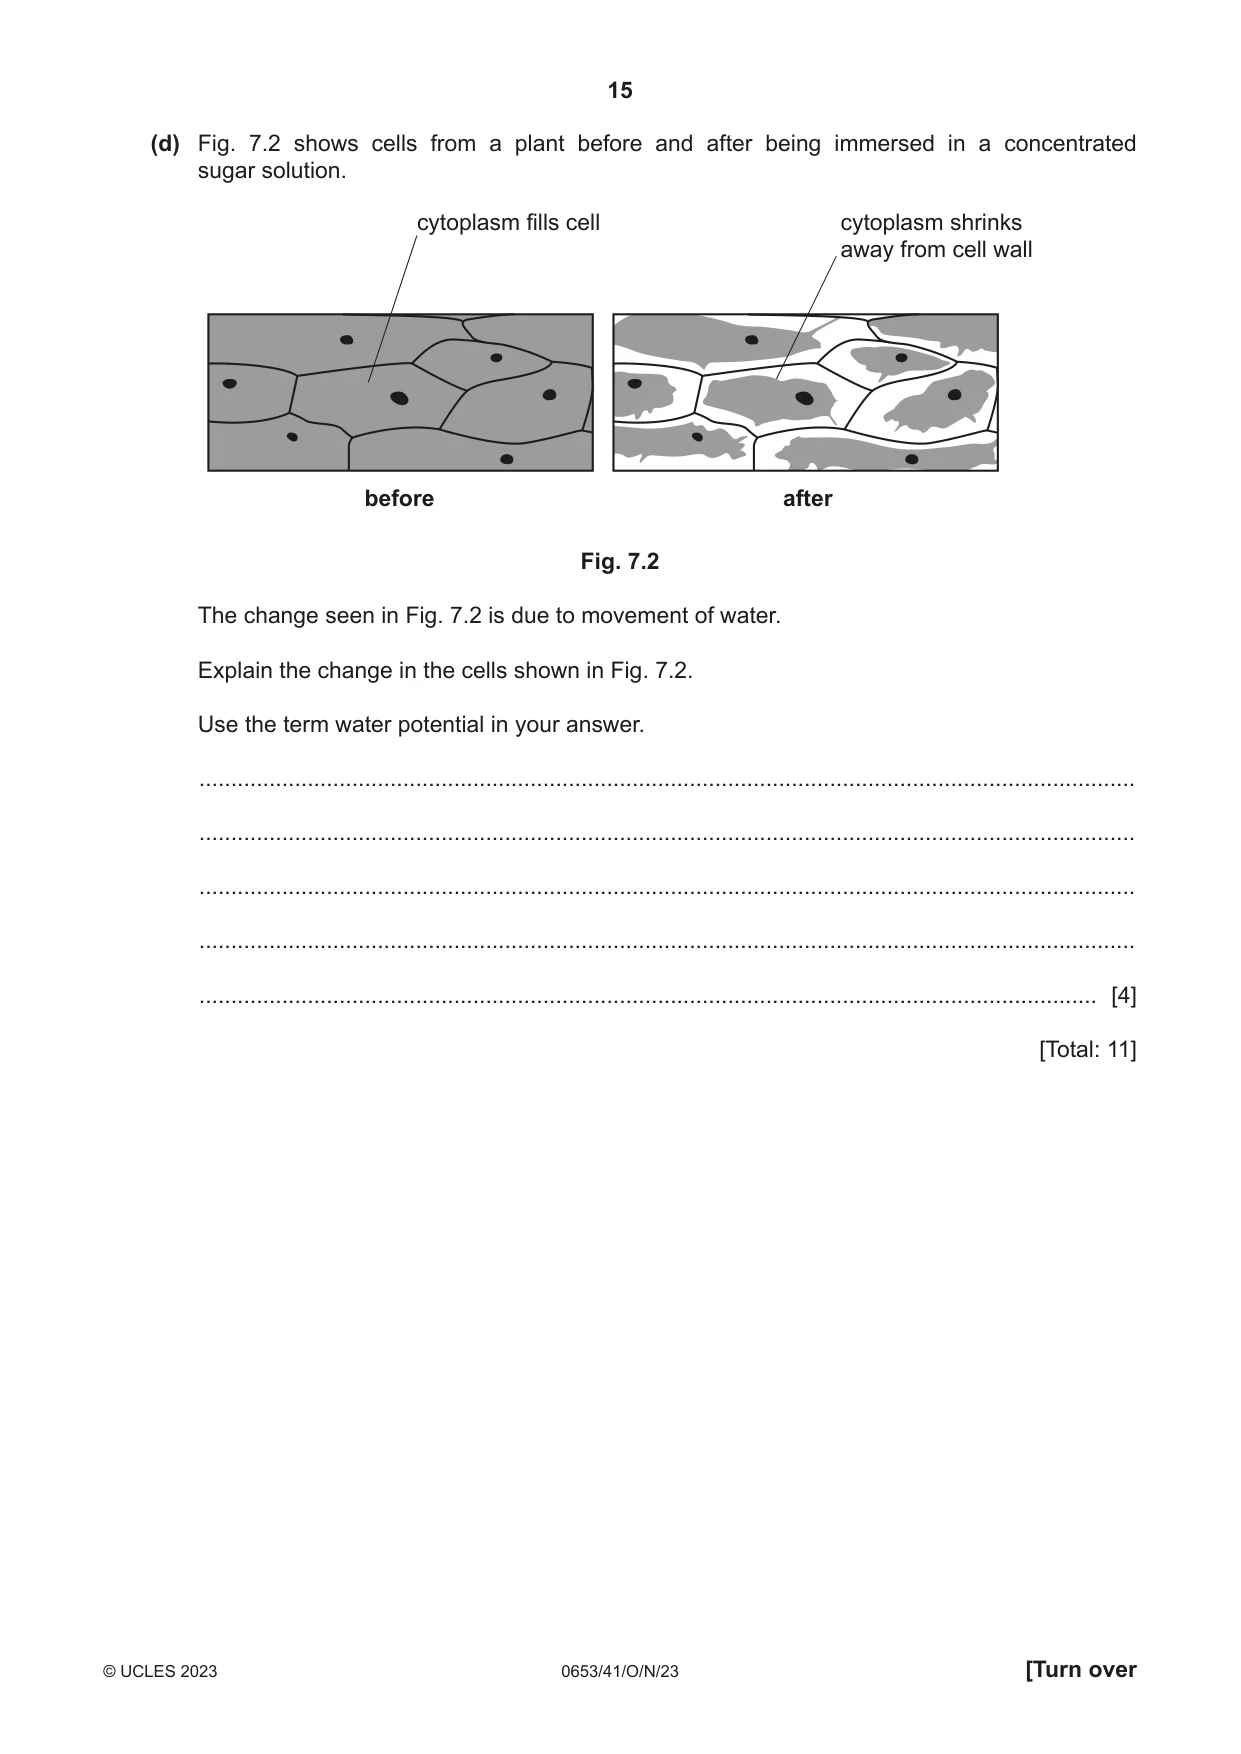
7 (a) Fig. 7.1 shows an insect-pollinated flower. Fig. 7.1 (i) Draw a label line and the letter C to identify a carpel in Fig. 7.1. [1] (ii) State two pieces of evidence that show the flower in Fig. 7.1 is insect-pollinated. 1 ........................................................................................................................................ 2 ........................................................................................................................................ [2] (b) Complete the sentence about the role of chlorophyll in a plant. Chlorophyll transfers .................................................... into .................................................... energy for the .................................................... of the carbohydrate glucose. [2] (c) In plants, glucose is converted into the sugar sucrose for transport. Glucose is also converted into a carbohydrate for storage. (i) State the name of the structure in plants used to transport the sugar sucrose. ..................................................................................................................................... [1] (ii) State the name of the carbohydrate used for storage. ..................................................................................................................................... [1] (d) Fig. 7.2 shows cells from a plant before and after being immersed in a concentrated sugar solution. cytoplasm fills cell cytoplasm shrinks away from cell wall before after Fig. 7.2 The change seen in Fig. 7.2 is due to movement of water. Explain the change in the cells shown in Fig. 7.2. Use the term water potential in your answer. ................................................................................................................................................... ................................................................................................................................................... ................................................................................................................................................... ................................................................................................................................................... ............................................................................................................................................. [4] [Total: 11]
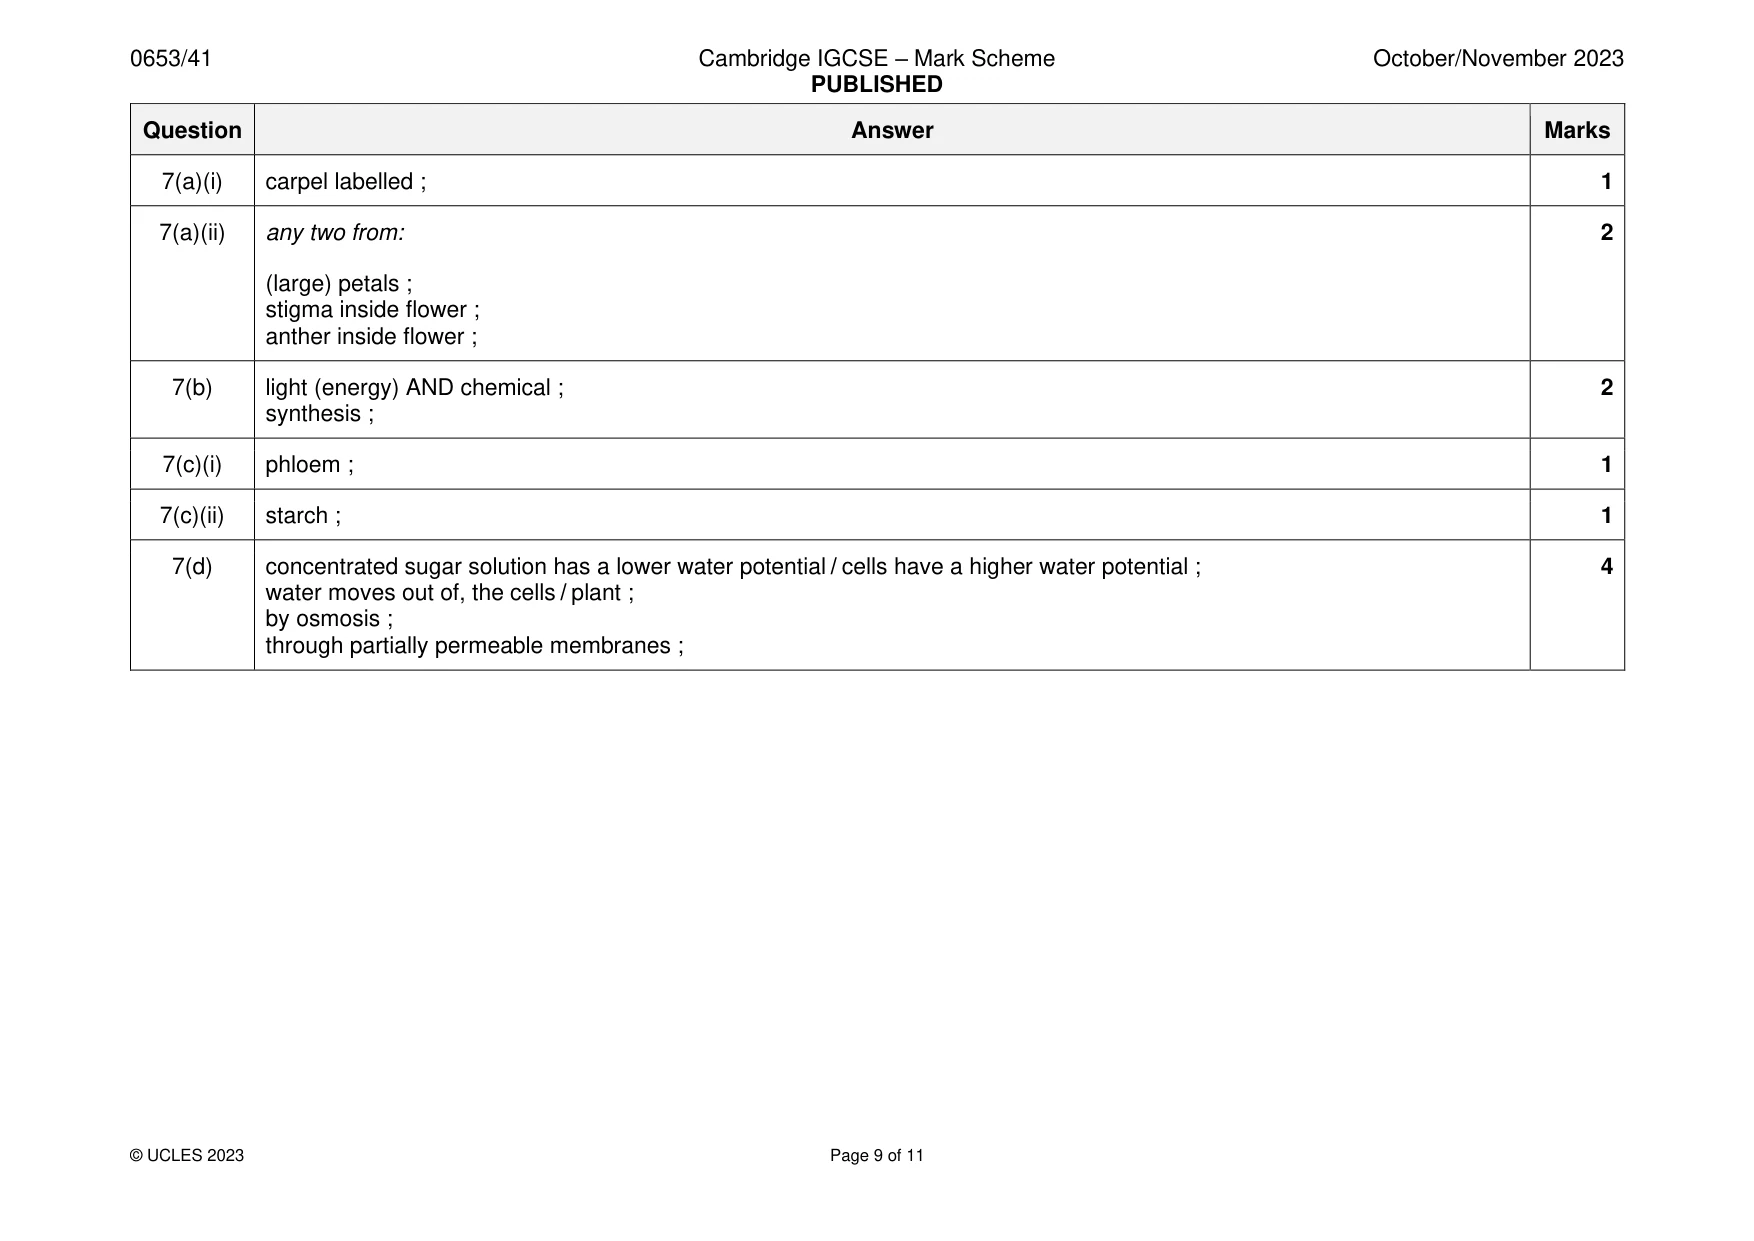
Mark scheme: 7(a)(i) carpel labelled ; 1 7(a)(ii) any two from: 2 (large) petals ; stigma inside flower ; anther inside flower ; 7(b) light (energy) AND chemical ; 2 synthesis ; 7(c)(i) phloem ; 1 7(c)(ii) starch ; 1 7(d) concentrated sugar solution has a lower water potential / cells have a higher water potential ; 4 water moves out of, the cells / plant ; by osmosis ; through partially permeable membranes ;
Q8 · Information on the percentage composition of the atmosphere of the planet Mars
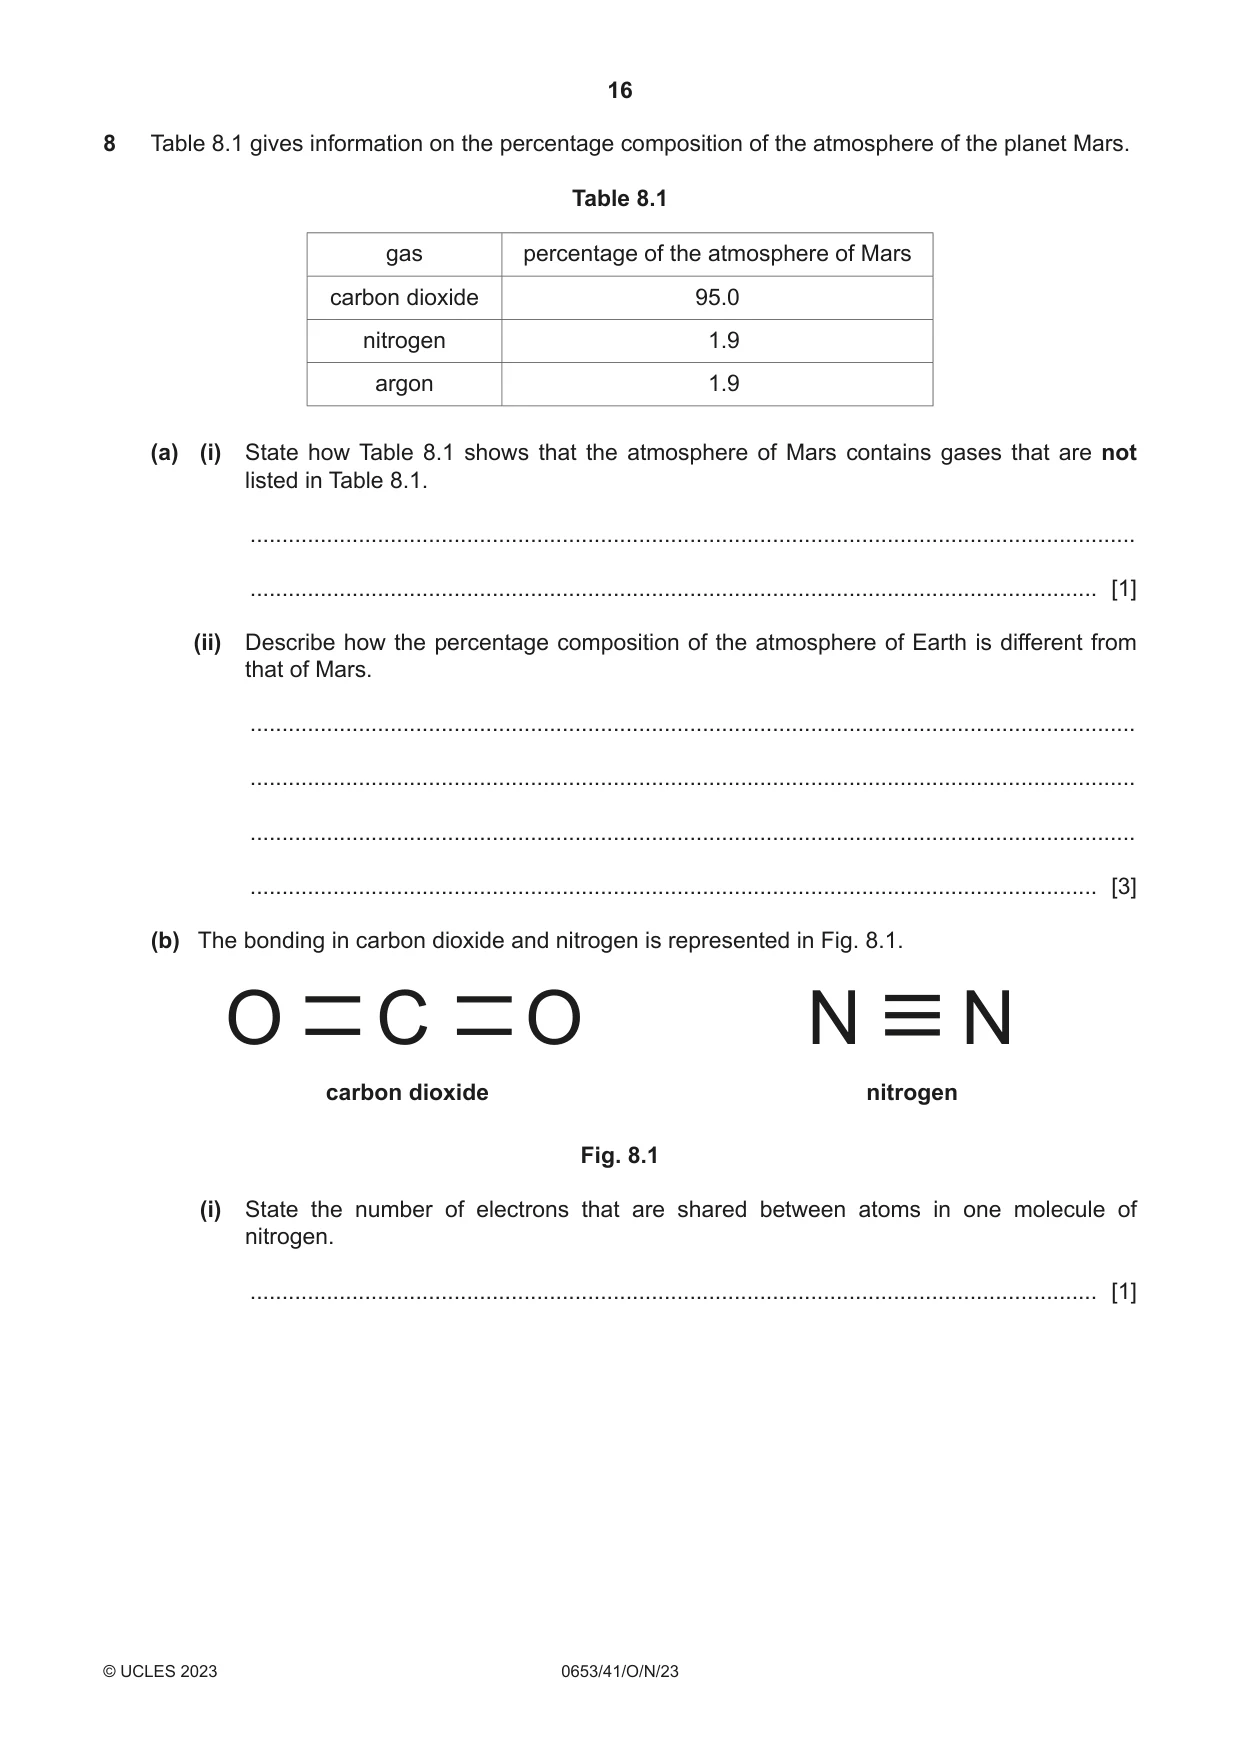
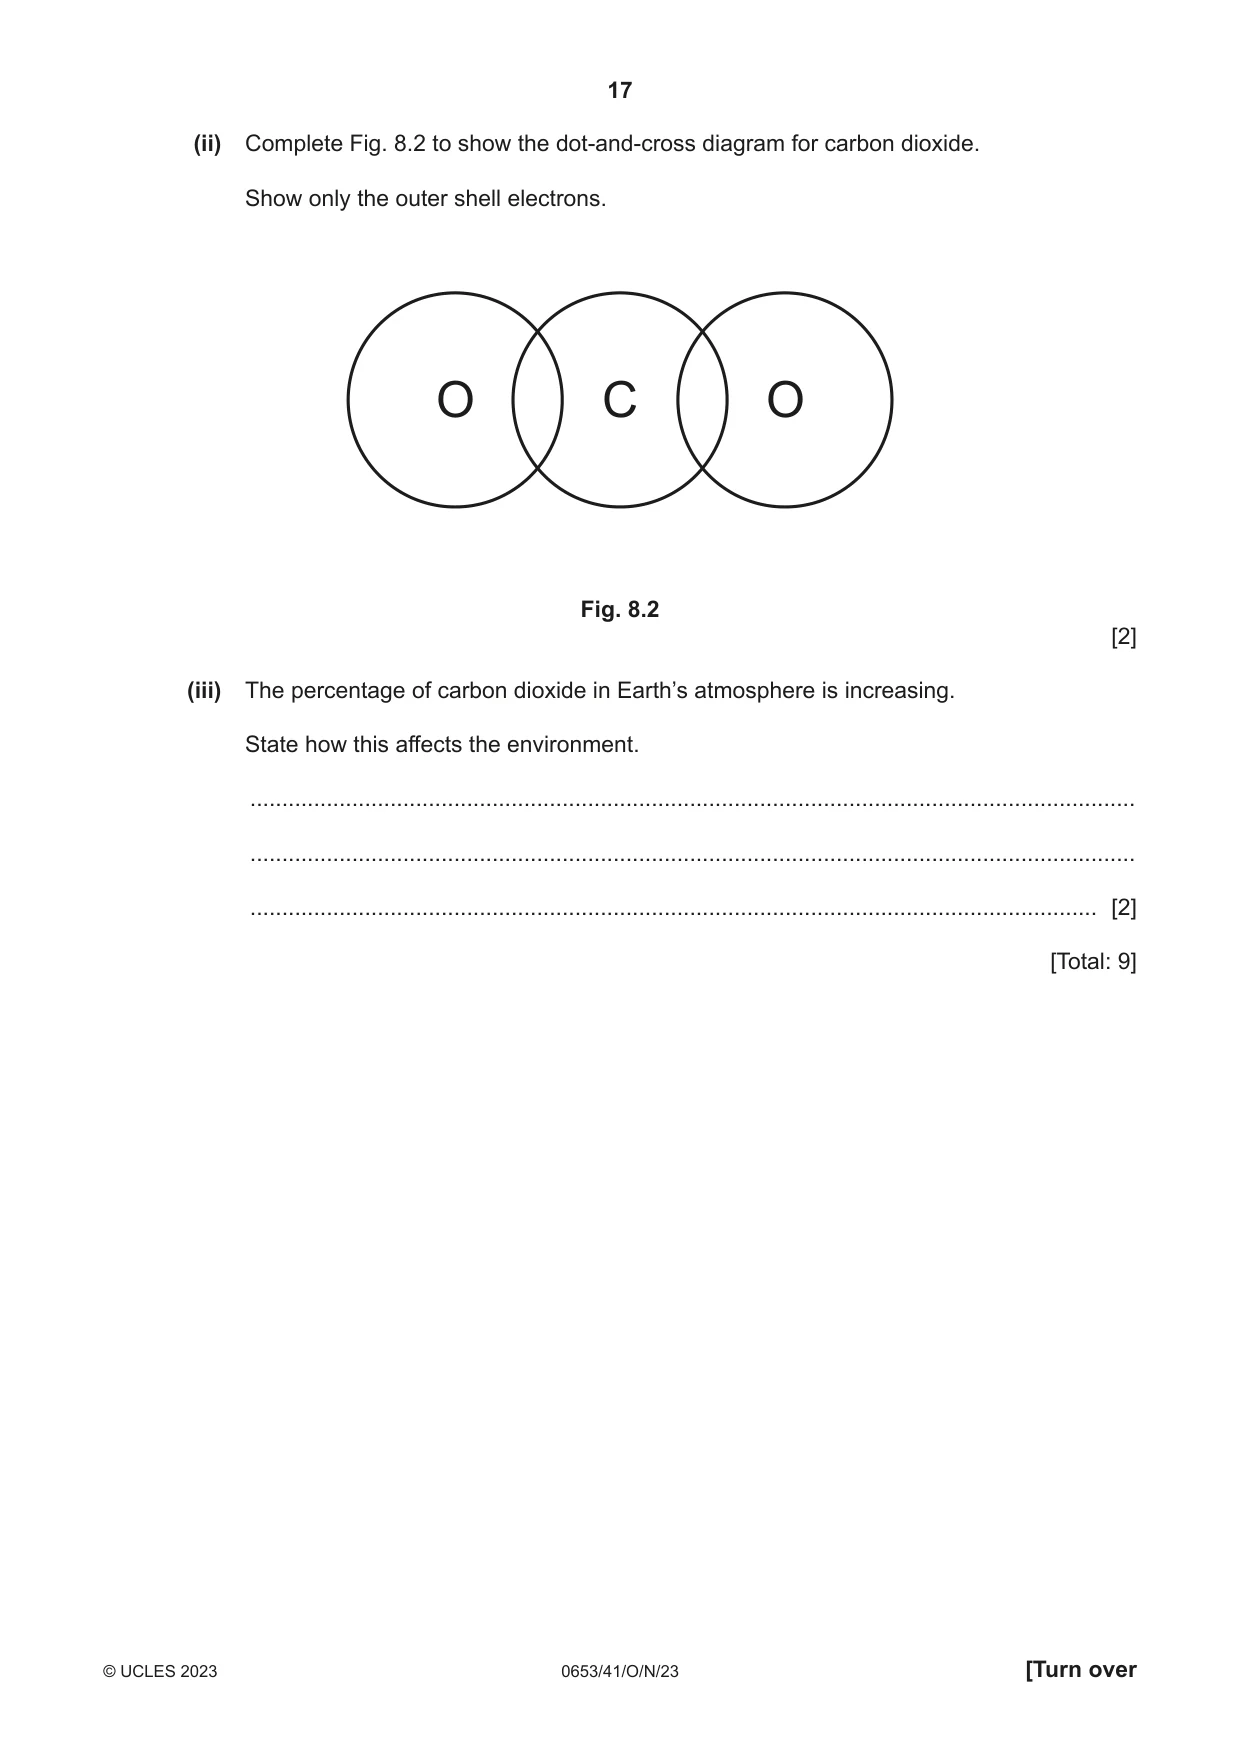
8 Table 8.1 gives information on the percentage composition of the atmosphere of the planet Mars. Table 8.1 gas percentage of the atmosphere of Mars carbon dioxide 95.0 nitrogen 1.9 argon 1.9 (a) (i) State how Table 8.1 shows that the atmosphere of Mars contains gases that are not listed in Table 8.1. ........................................................................................................................................... ..................................................................................................................................... [1] (ii) Describe how the percentage composition of the atmosphere of Earth is different from that of Mars. ........................................................................................................................................... ........................................................................................................................................... ........................................................................................................................................... ..................................................................................................................................... [3] (b) The bonding in carbon dioxide and nitrogen is represented in Fig. 8.1. O C O N N carbon dioxide nitrogen Fig. 8.1 (i) State the number of electrons that are shared between atoms in one molecule of nitrogen. ..................................................................................................................................... [1] (ii) Complete Fig. 8.2 to show the dot-and-cross diagram for carbon dioxide. Show only the outer shell electrons. O C O Fig. 8.2 [2] (iii) The percentage of carbon dioxide in Earth’s atmosphere is increasing. State how this affects the environment. ........................................................................................................................................... ........................................................................................................................................... ..................................................................................................................................... [2] [Total: 9]
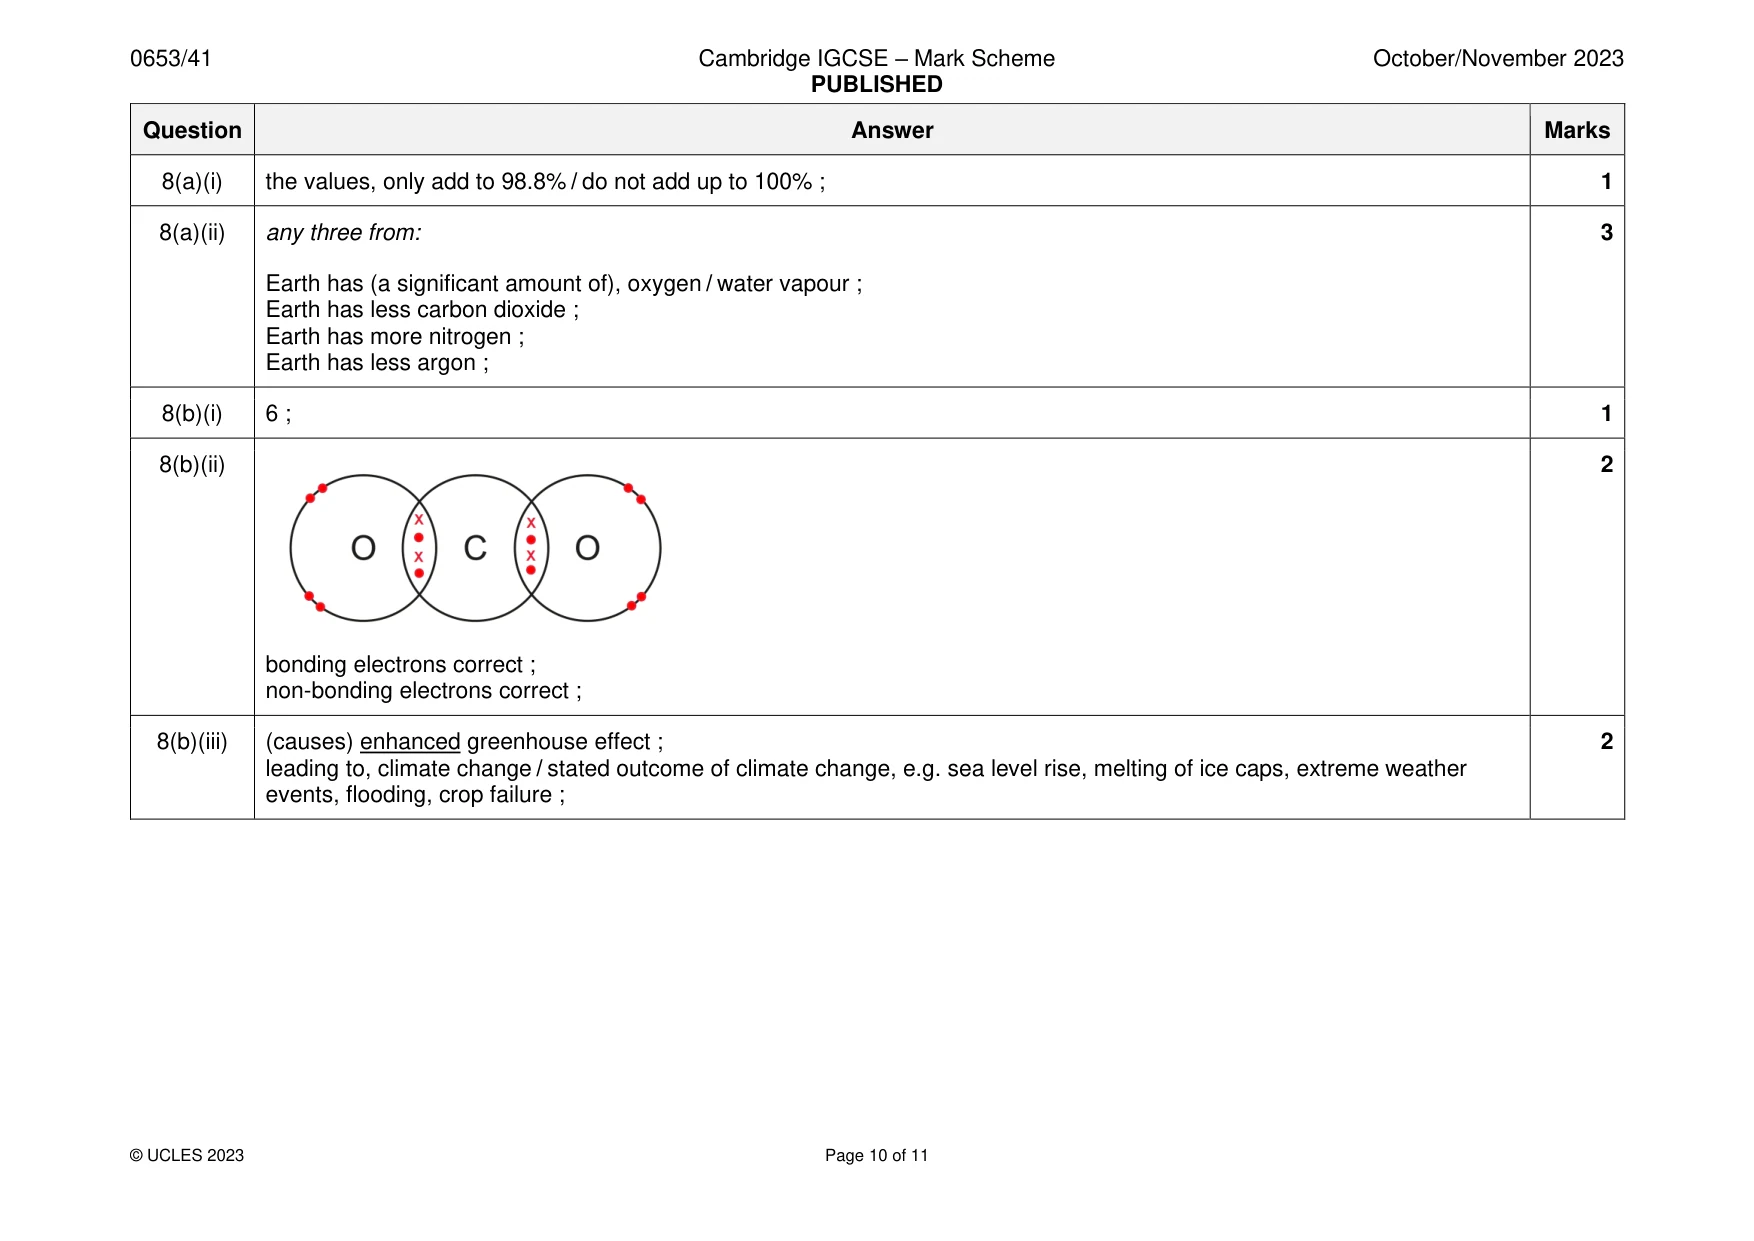
Mark scheme: 8(a)(i) the values, only add to 98.8% / do not add up to 100% ; 1 8(a)(ii) any three from: 3 Earth has (a significant amount of), oxygen / water vapour ; Earth has less carbon dioxide ; Earth has more nitrogen ; Earth has less argon ; 8(b)(i) 6 ; 1 8(b)(ii) 2 bonding electrons correct ; non-bonding electrons correct ; 8(b)(iii) (causes) enhanced greenhouse effect ; 2 leading to, climate change / stated outcome of climate change, e.g. sea level rise, melting of ice caps, extreme weather events, flooding, crop failure ;
Q9 · A sound wave in air
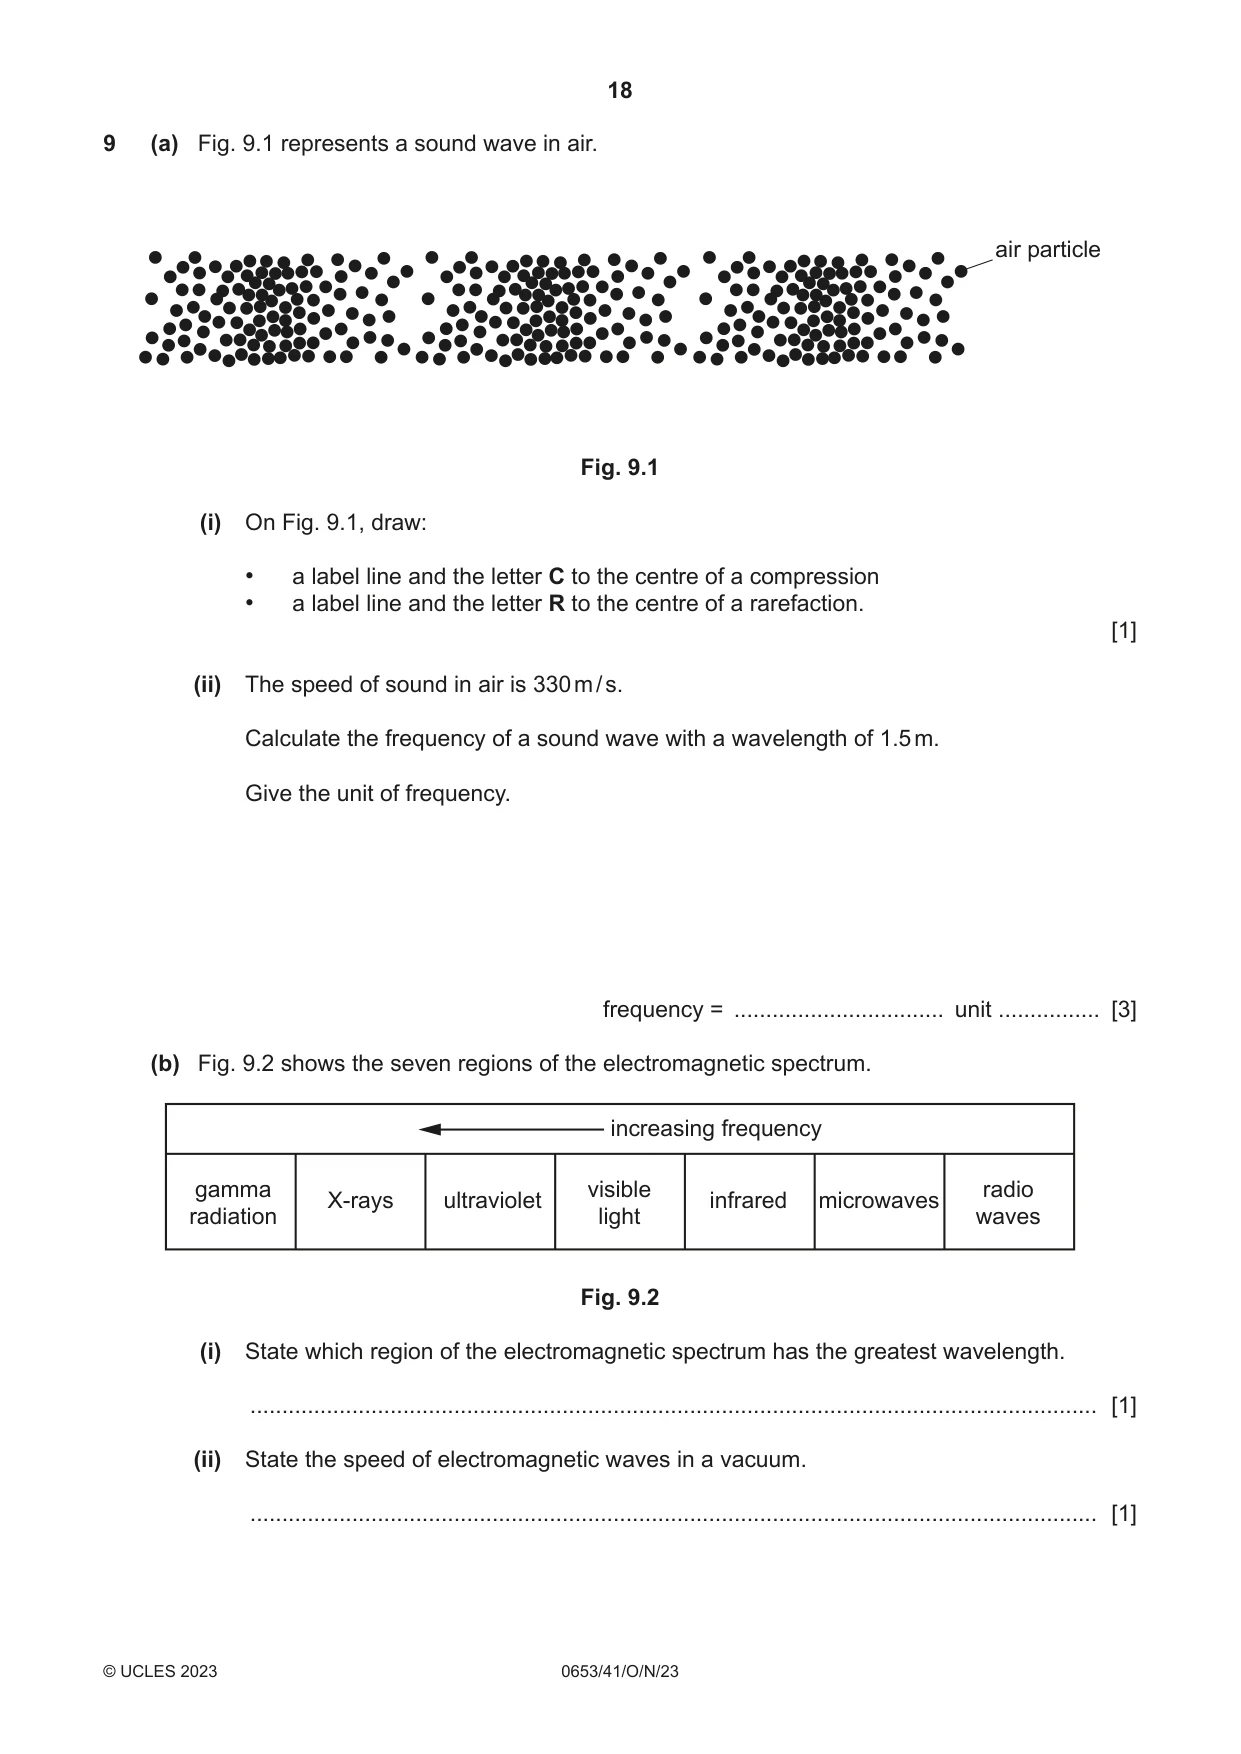
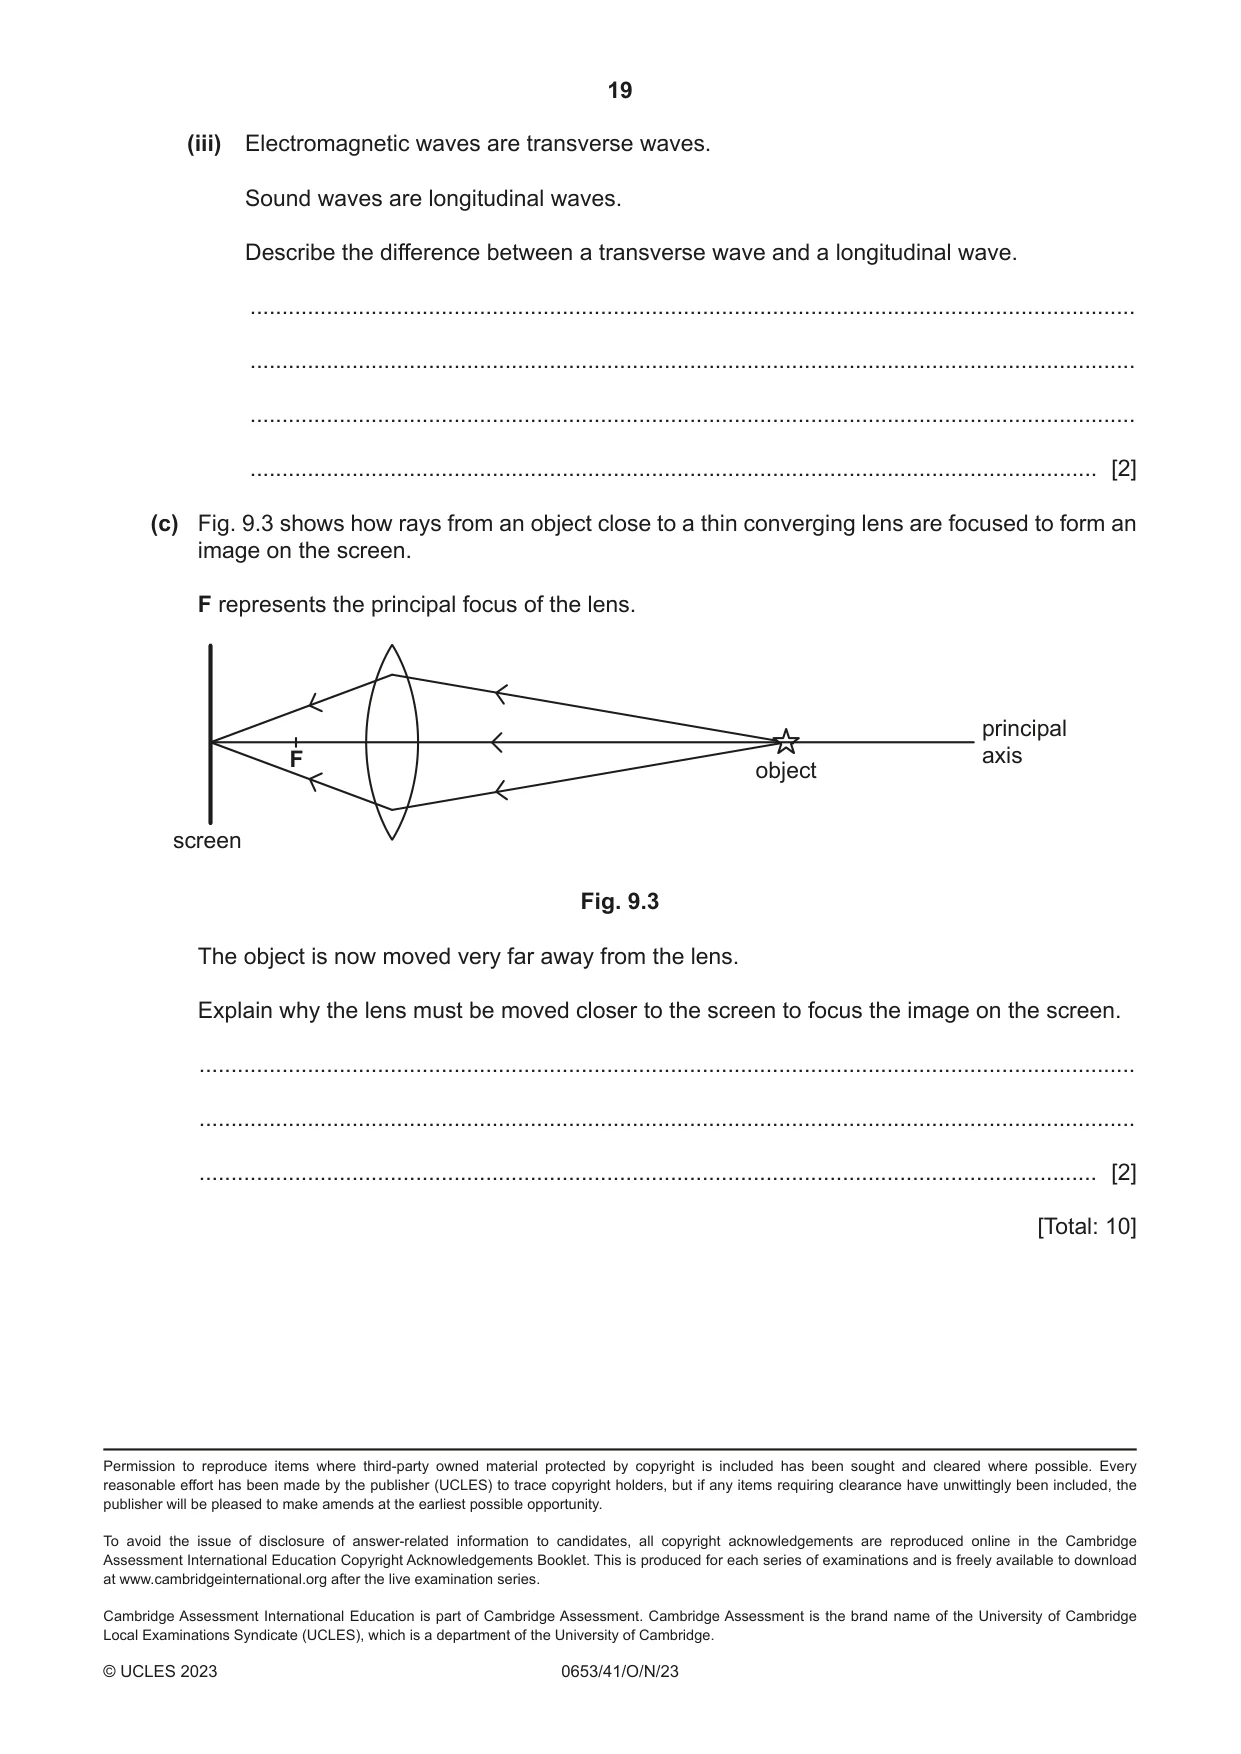
9 (a) Fig. 9.1 represents a sound wave in air. air particle Fig. 9.1 (i) On Fig. 9.1, draw: • a label line and the letter C to the centre of a compression • a label line and the letter R to the centre of a rarefaction. [1] (ii) The speed of sound in air is 330 m / s. Calculate the frequency of a sound wave with a wavelength of 1.5 m. Give the unit of frequency. frequency = ................................. unit ................ [3] (b) Fig. 9.2 shows the seven regions of the electromagnetic spectrum. increasing frequency gamma visible radio X-rays ultraviolet infrared microwaves radiation light waves Fig. 9.2 (i) State which region of the electromagnetic spectrum has the greatest wavelength. ..................................................................................................................................... [1] (ii) State the speed of electromagnetic waves in a vacuum. ..................................................................................................................................... [1] (iii) Electromagnetic waves are transverse waves. Sound waves are longitudinal waves. Describe the difference between a transverse wave and a longitudinal wave. ........................................................................................................................................... ........................................................................................................................................... ........................................................................................................................................... ..................................................................................................................................... [2] (c) Fig. 9.3 shows how rays from an object close to a thin converging lens are focused to form an image on the screen. F represents the principal focus of the lens. principal F axis object screen Fig. 9.3 The object is now moved very far away from the lens. Explain why the lens must be moved closer to the screen to focus the image on the screen. ................................................................................................................................................... ................................................................................................................................................... ............................................................................................................................................. [2] [Total: 10]
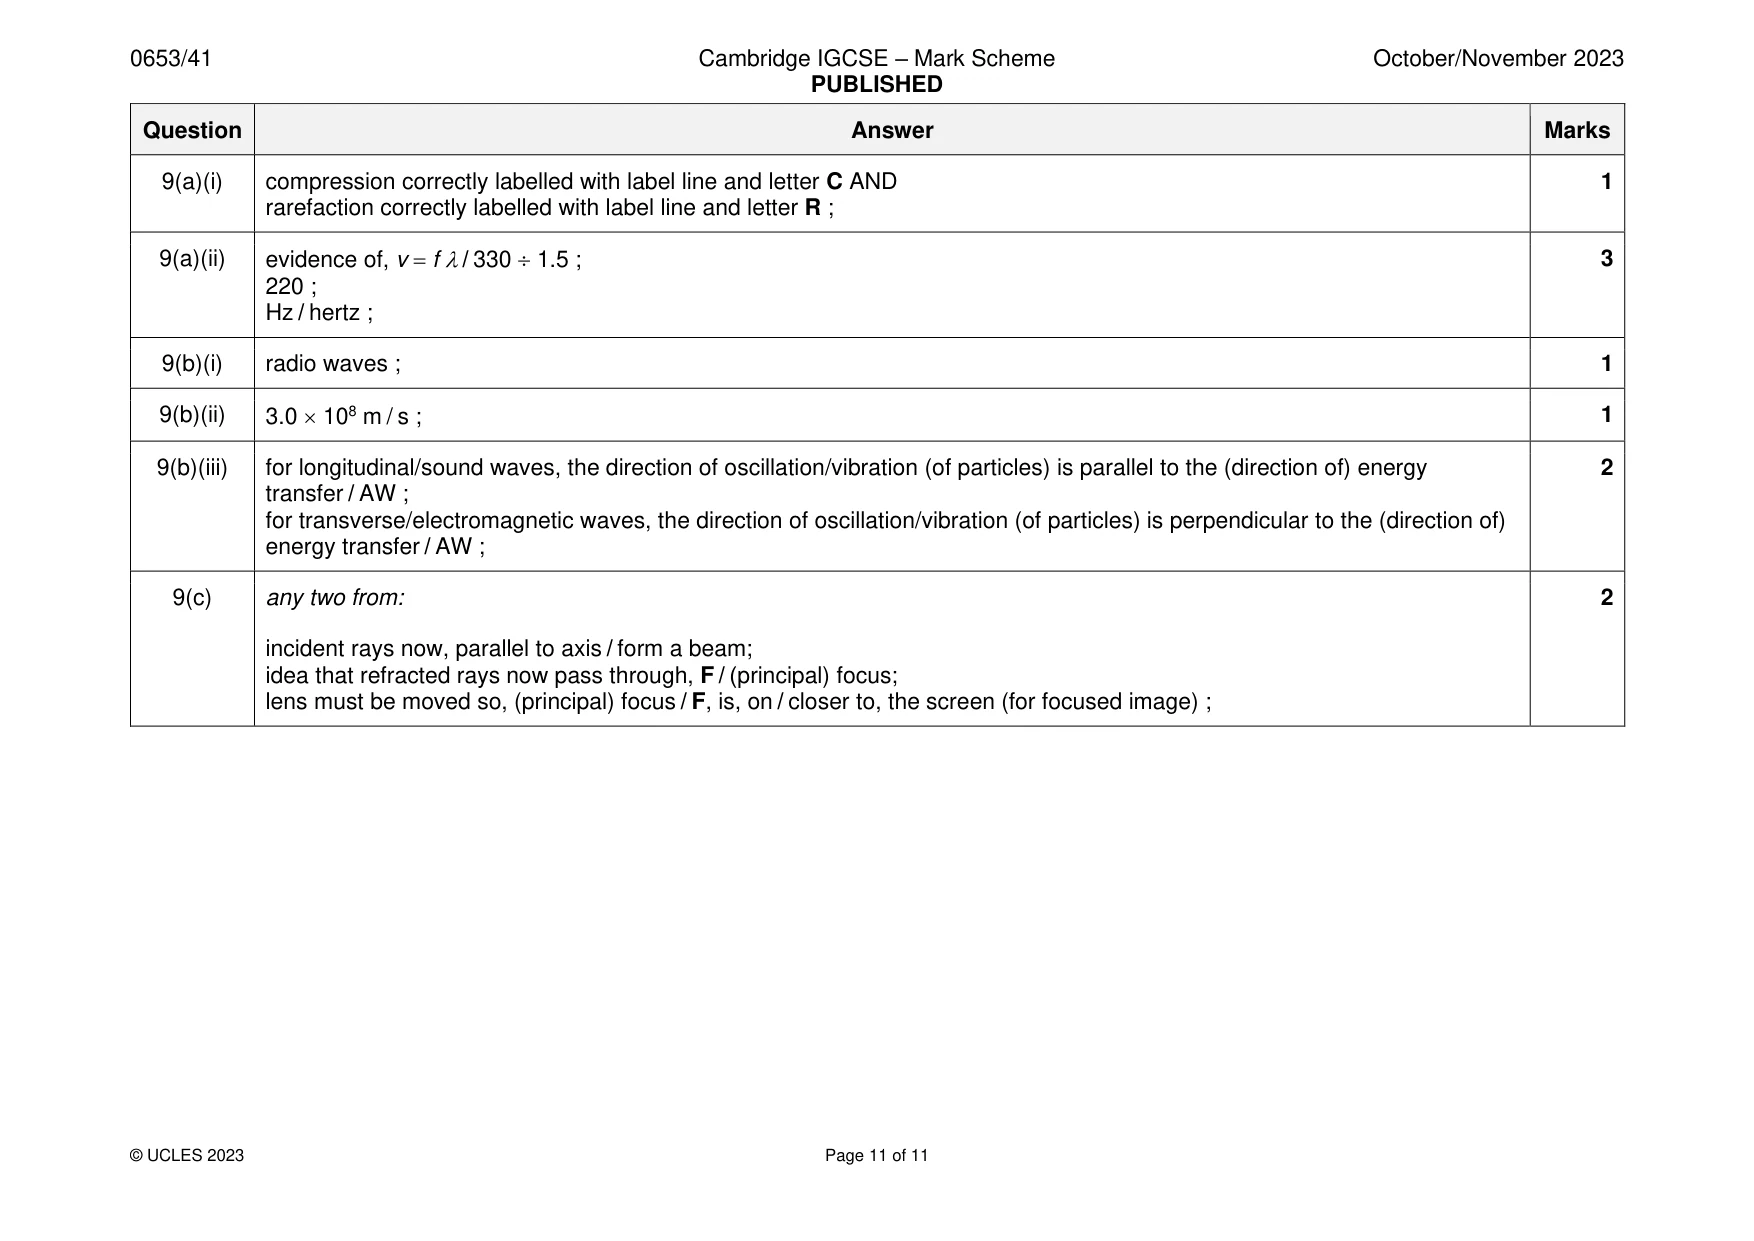
Mark scheme: 9(a)(i) compression correctly labelled with label line and letter C AND 1 rarefaction correctly labelled with label line and letter R ; 9(a)(ii) evidence of, v = f / 330 1.5 ; 3 220 ; Hz / hertz ; 9(b)(i) radio waves ; 1 9(b)(ii) 3.0 108 m / s ; 1 9(b)(iii) for longitudinal/sound waves, the direction of oscillation/vibration (of particles) is parallel to the (direction of) energy 2 transfer / AW ; for transverse/electromagnetic waves, the direction of oscillation/vibration (of particles) is perpendicular to the (direction of) energy transfer / AW ; 9(c) any two from: 2 incident rays now, parallel to axis / form a beam; idea that refracted rays now pass through, F / (principal) focus; lens must be moved so, (principal) focus / F, is, on / closer to, the screen (for focused image) ;
What was in this paper
The subtopics covered by these 9 questions, and how many questions each got. Open one in a new tab to see every Cambridge question on it.
What you needed in this session
Cambridge’s own grade thresholds for 2023 Oct/Nov, Paper 4 · Variant 1. A higher threshold means an easier paper — the bar moves with how the cohort did.