Cambridge IGCSE Science - Combined 0653 — 2022 Oct/Nov Paper 6 · Variant 3
0653/63/O/N/22 · 4 questions · 40 marks · ≈45 min
The question paper and its mark scheme, free to read here and free to download. This is Cambridge’s own paper, exactly as it was sat.
Question paper16 pages





Mark scheme8 pages
Answers below. Sit the paper first if you are practising.
Questions as text
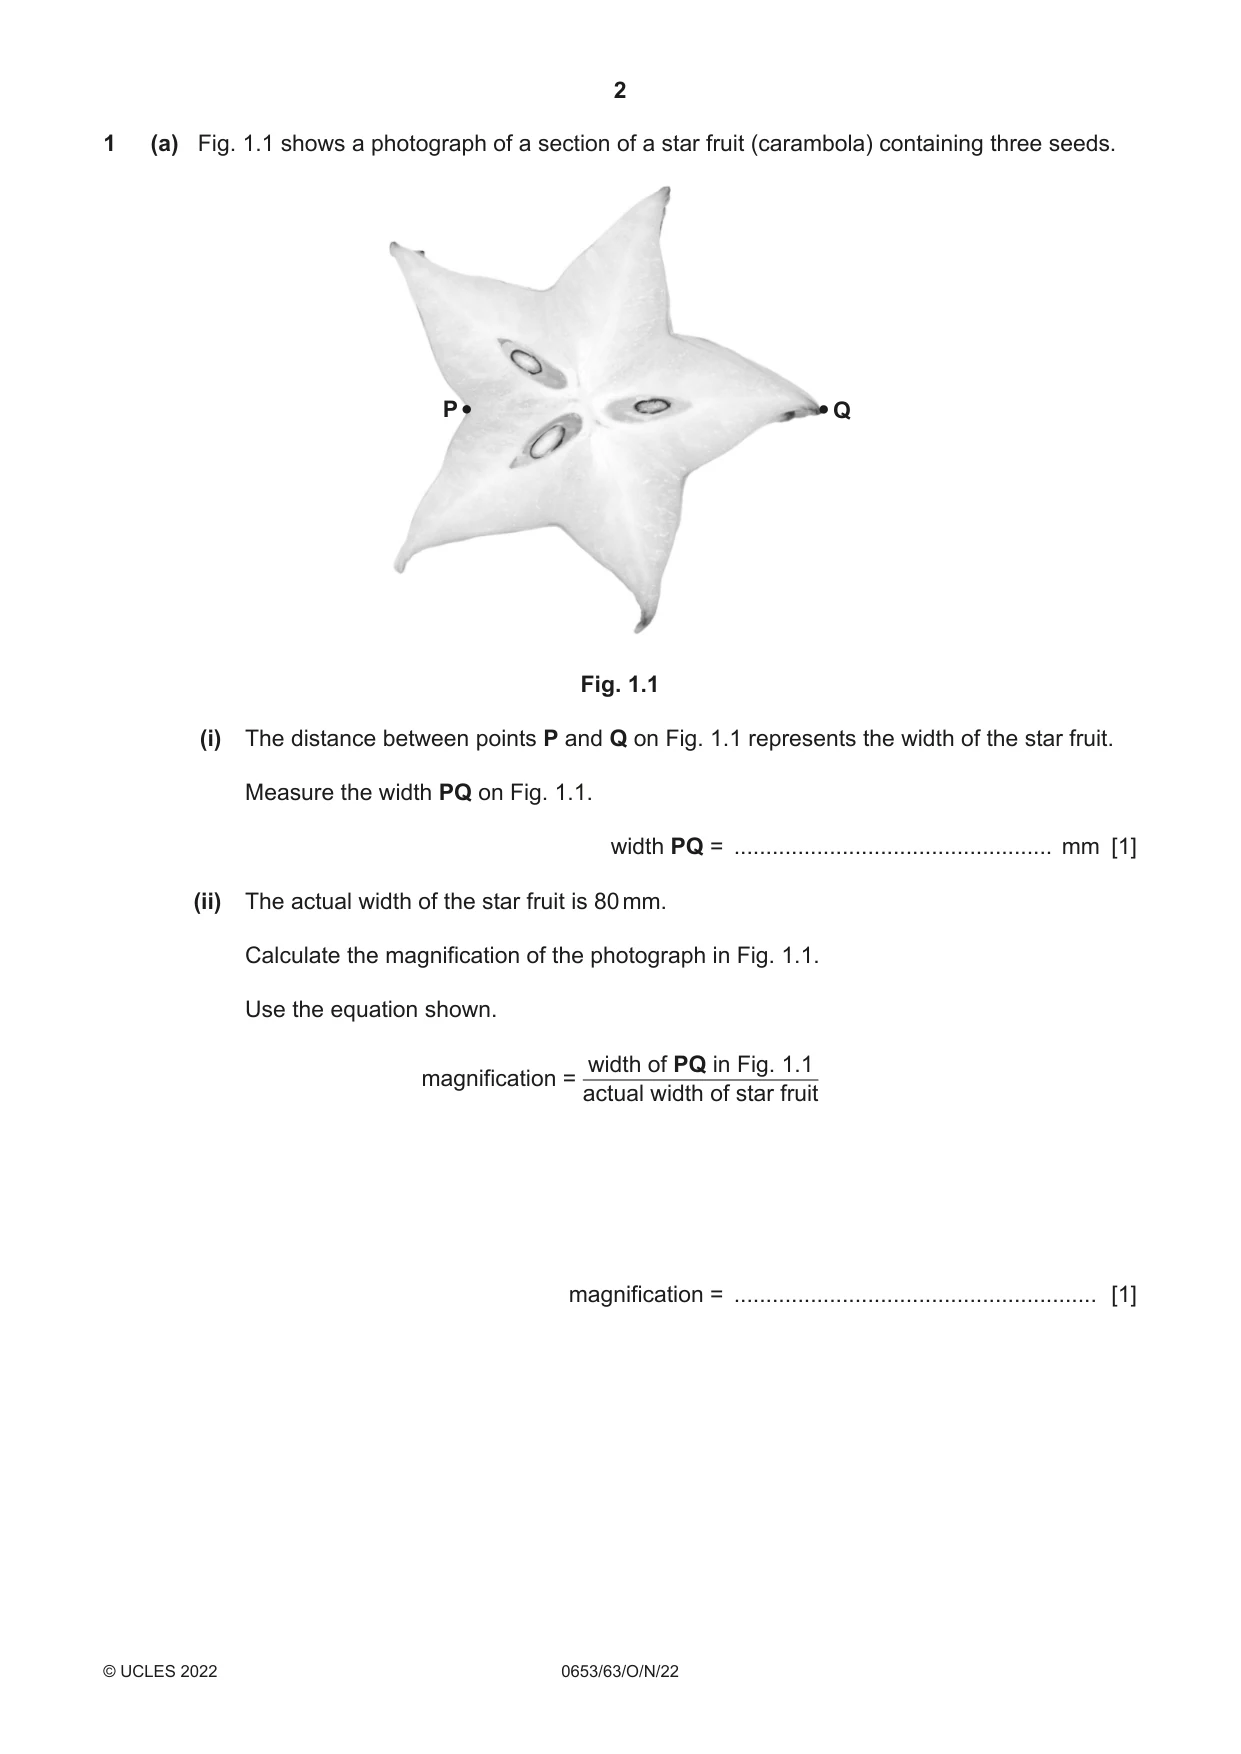
Q1 · A photograph of a section of a star fruit (carambola) containing three seeds
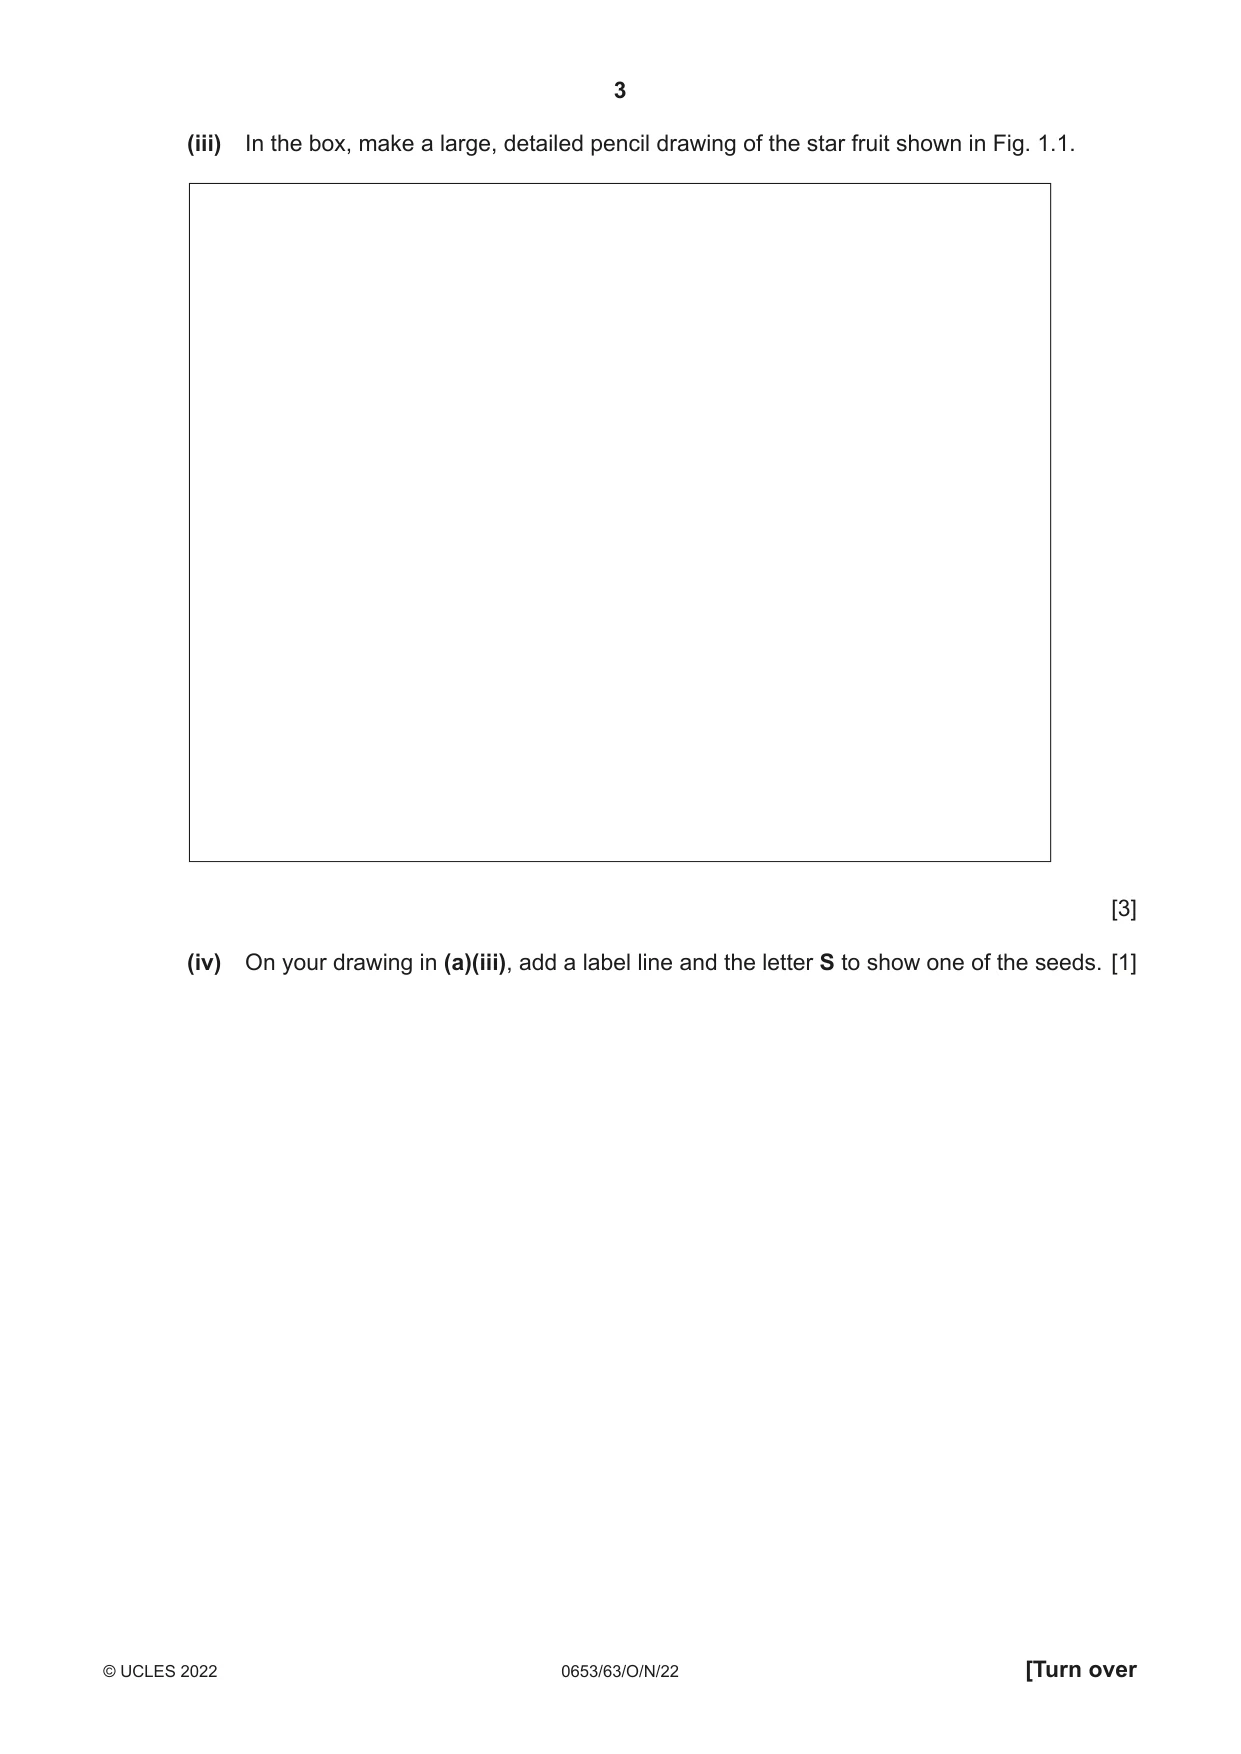
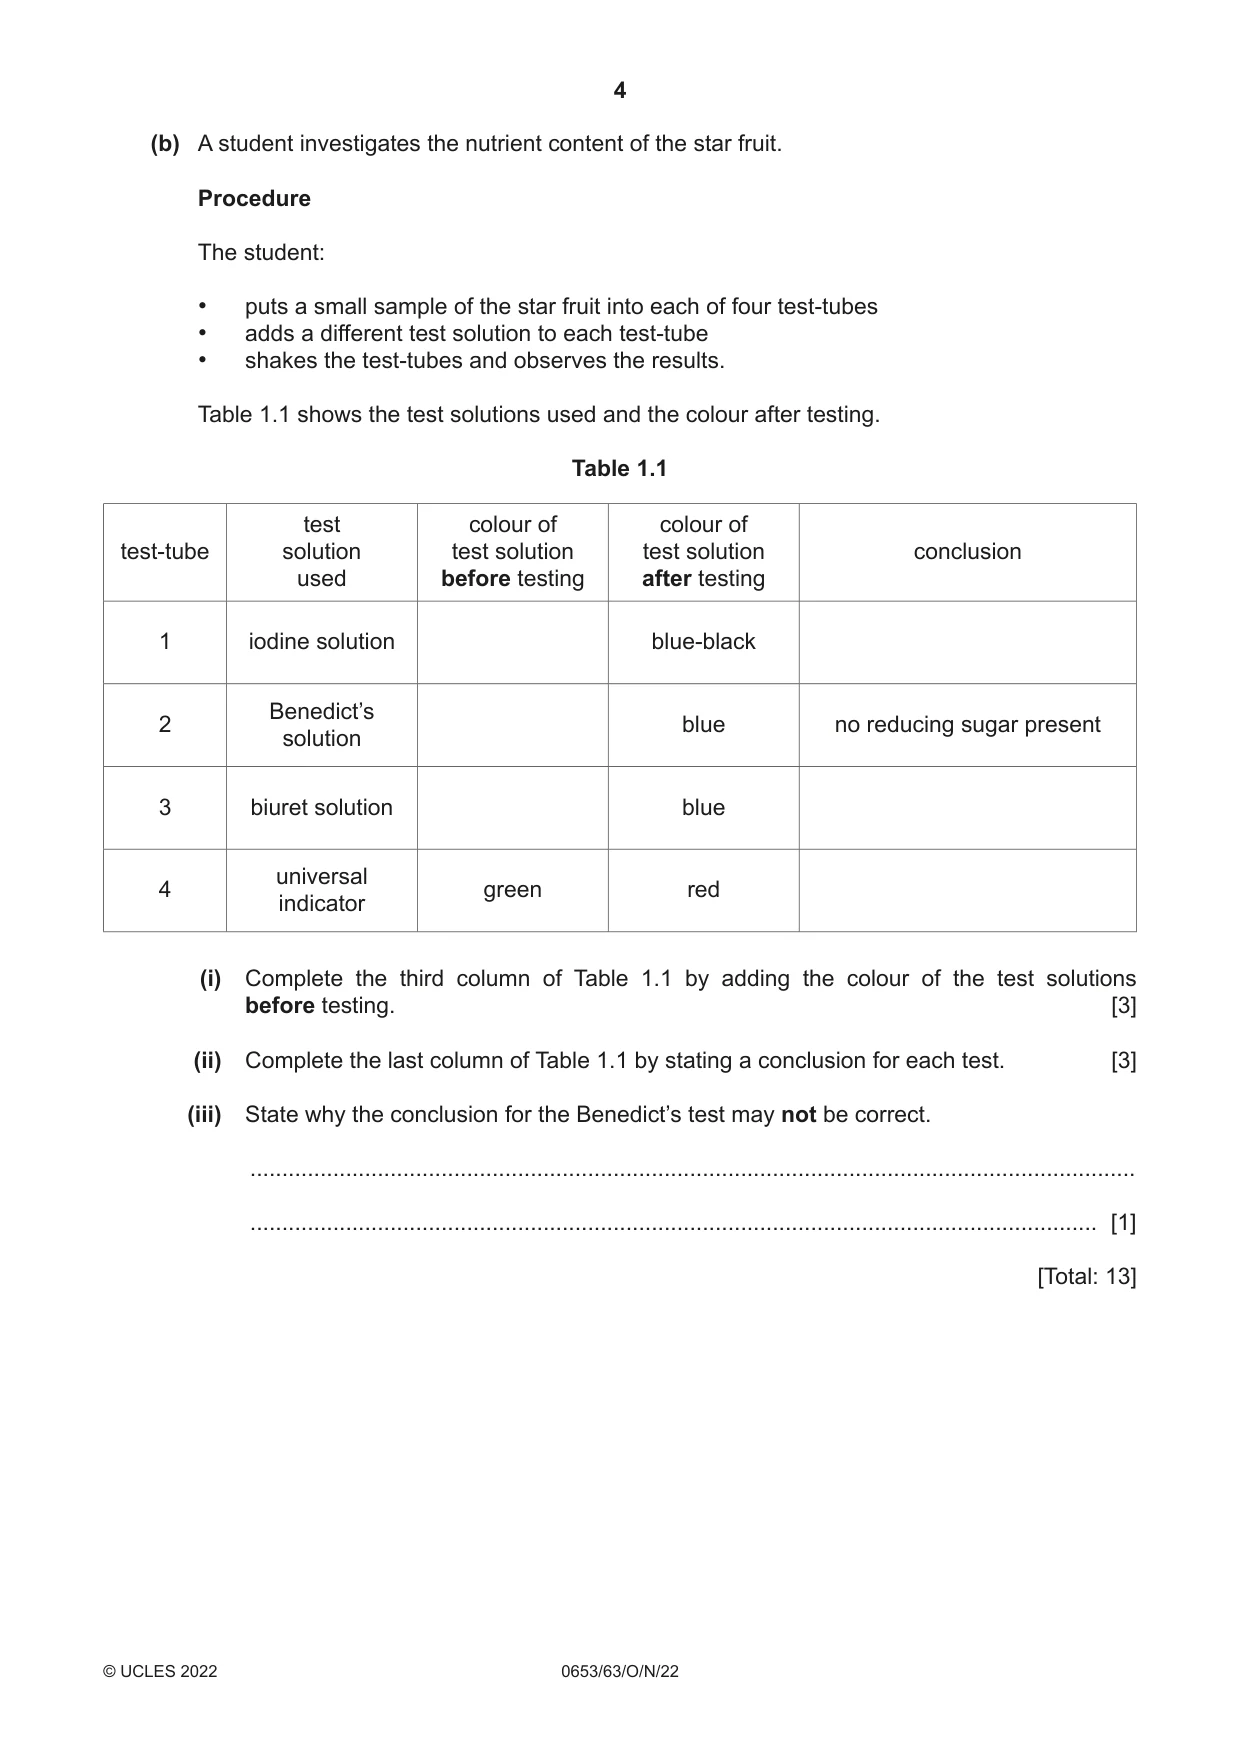
1 (a) Fig. 1.1 shows a photograph of a section of a star fruit (carambola) containing three seeds. P Q Fig. 1.1 (i) The distance between points P and Q on Fig. 1.1 represents the width of the star fruit. Measure the width PQ on Fig. 1.1. width PQ = .................................................. mm [1] (ii) The actual width of the star fruit is 80 mm. Calculate the magnification of the photograph in Fig. 1.1. Use the equation shown. width of PQ in Fig. 1.1 magnification = actual width of star fruit magnification = ......................................................... [1] (iii) In the box, make a large, detailed pencil drawing of the star fruit shown in Fig. 1.1. [3] (iv) On your drawing in (a)(iii), add a label line and the letter S to show one of the seeds. [1] (b) A student investigates the nutrient content of the star fruit. Procedure The student: • puts a small sample of the star fruit into each of four test-tubes • adds a different test solution to each test-tube • shakes the test-tubes and observes the results. Table 1.1 shows the test solutions used and the colour after testing. Table 1.1 test colour of colour of test-tube solution test solution test solution conclusion used before testing after testing 1 iodine solution blue-black Benedict’s 2 blue no reducing sugar present solution 3 biuret solution blue universal 4 green red indicator (i) Complete the third column of Table 1.1 by adding the colour of the test solutions before testing. [3] (ii) Complete the last column of Table 1.1 by stating a conclusion for each test. [3] (iii) State why the conclusion for the Benedict’s test may not be correct. ........................................................................................................................................... ..................................................................................................................................... [1] [Total: 13]
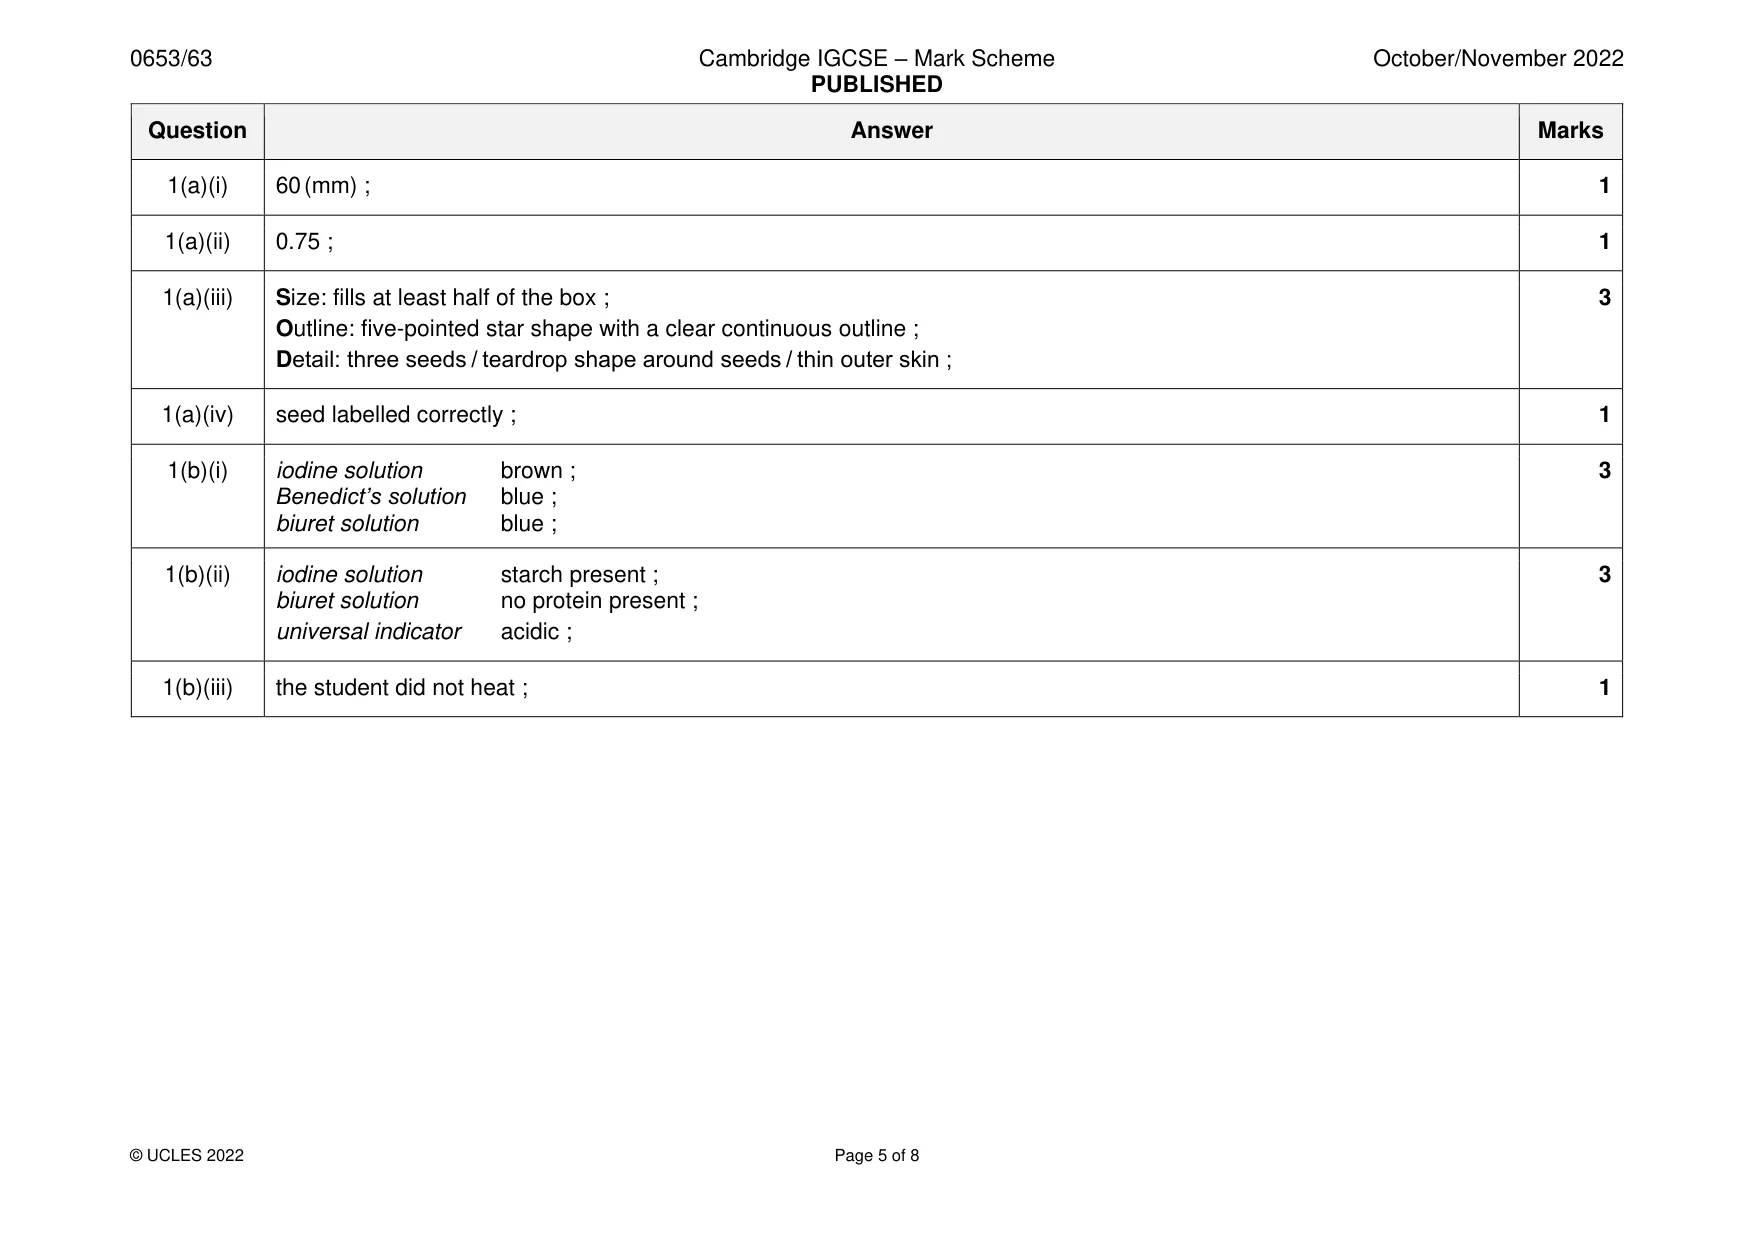
Mark scheme: Question Answer Marks 1(a)(i) 60 (mm) ; 1 1(a)(ii) 0.75 ; 1 1(a)(iii) Size: fills at least half of the box ; 3 Outline: five-pointed star shape with a clear continuous outline ; Detail: three seeds / teardrop shape around seeds / thin outer skin ; 1(a)(iv) seed labelled correctly ; 1 1(b)(i) iodine solution brown ; 3 Benedict’s solution blue ; biuret solution blue ; 1(b)(ii) iodine solution starch present ; 3 biuret solution no protein present ; universal indicator acidic ; 1(b)(iii) the student did not heat ; 1
Q2 · A student investigates the effect of heat on solid sodium hydrogencarbonate
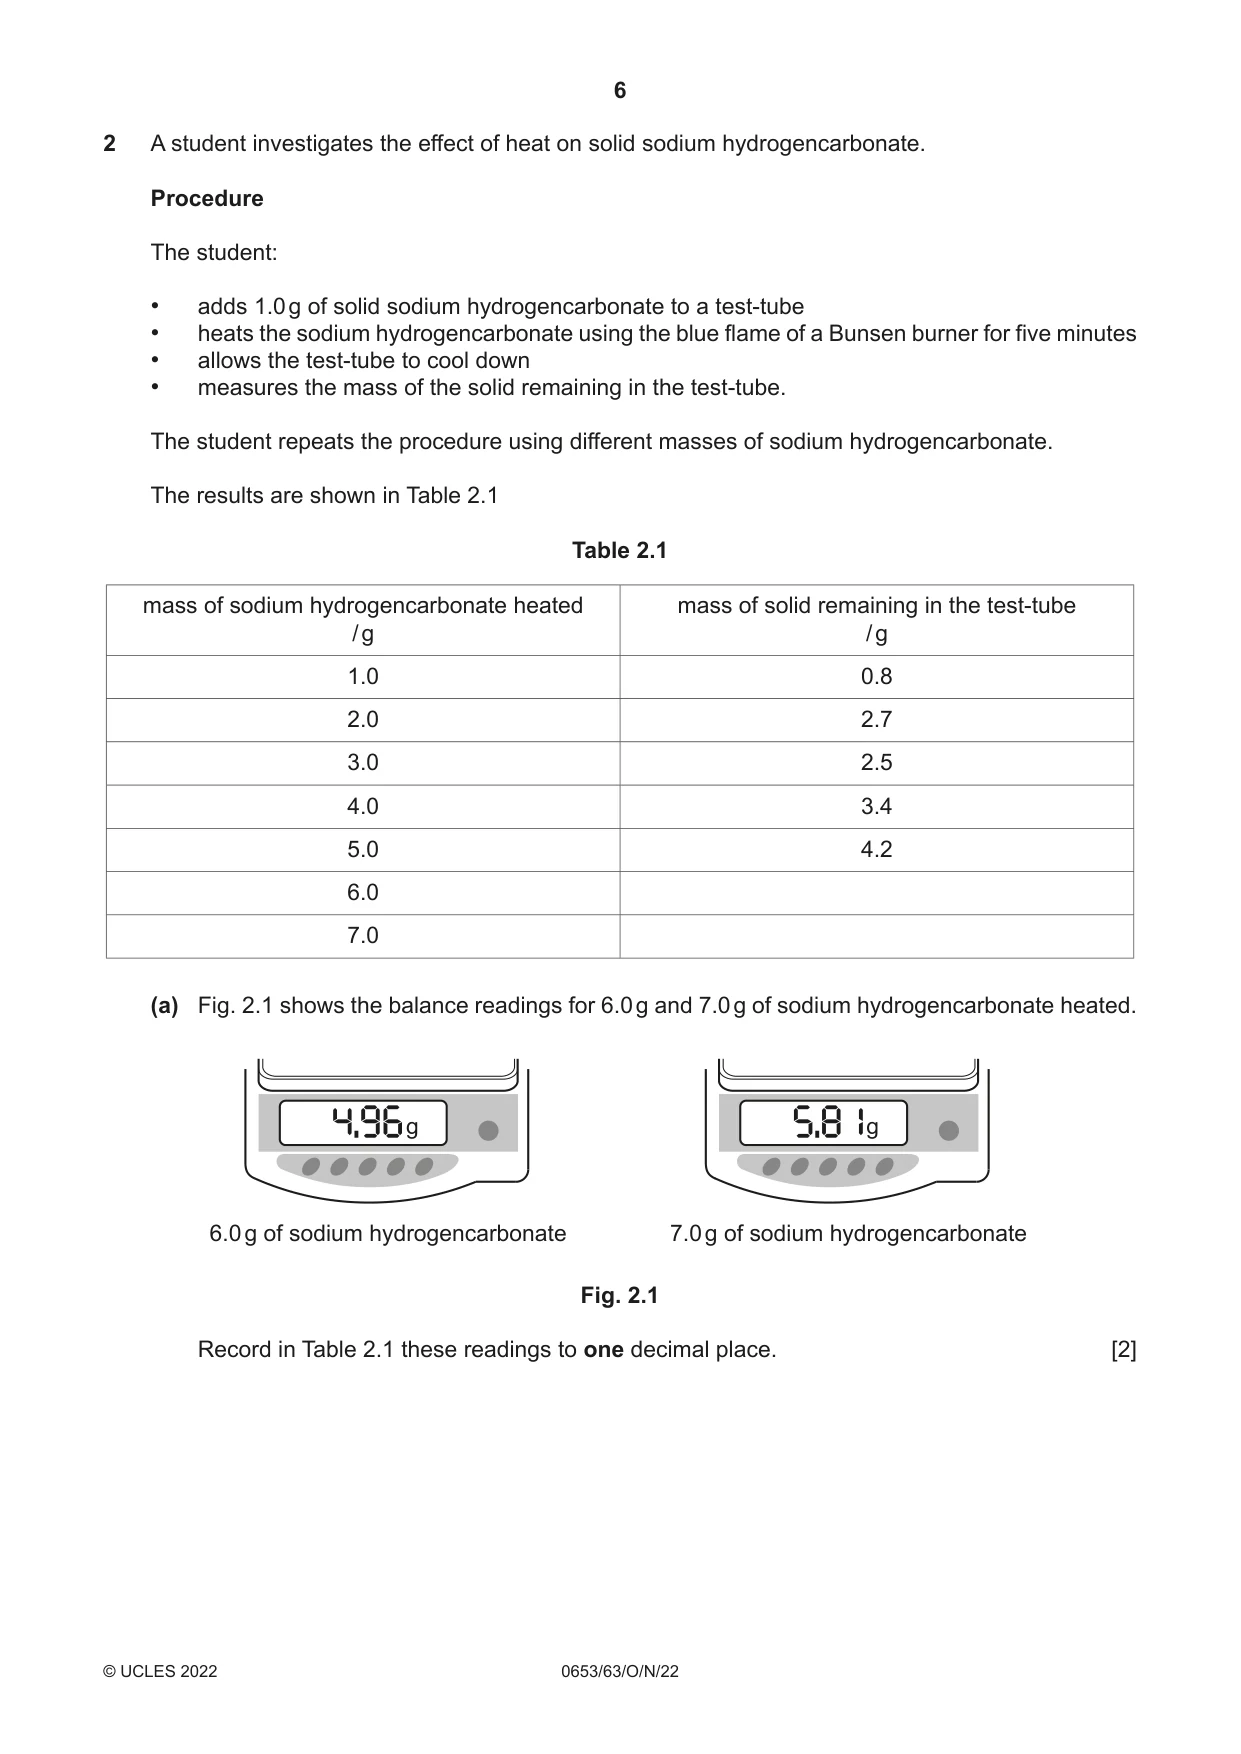
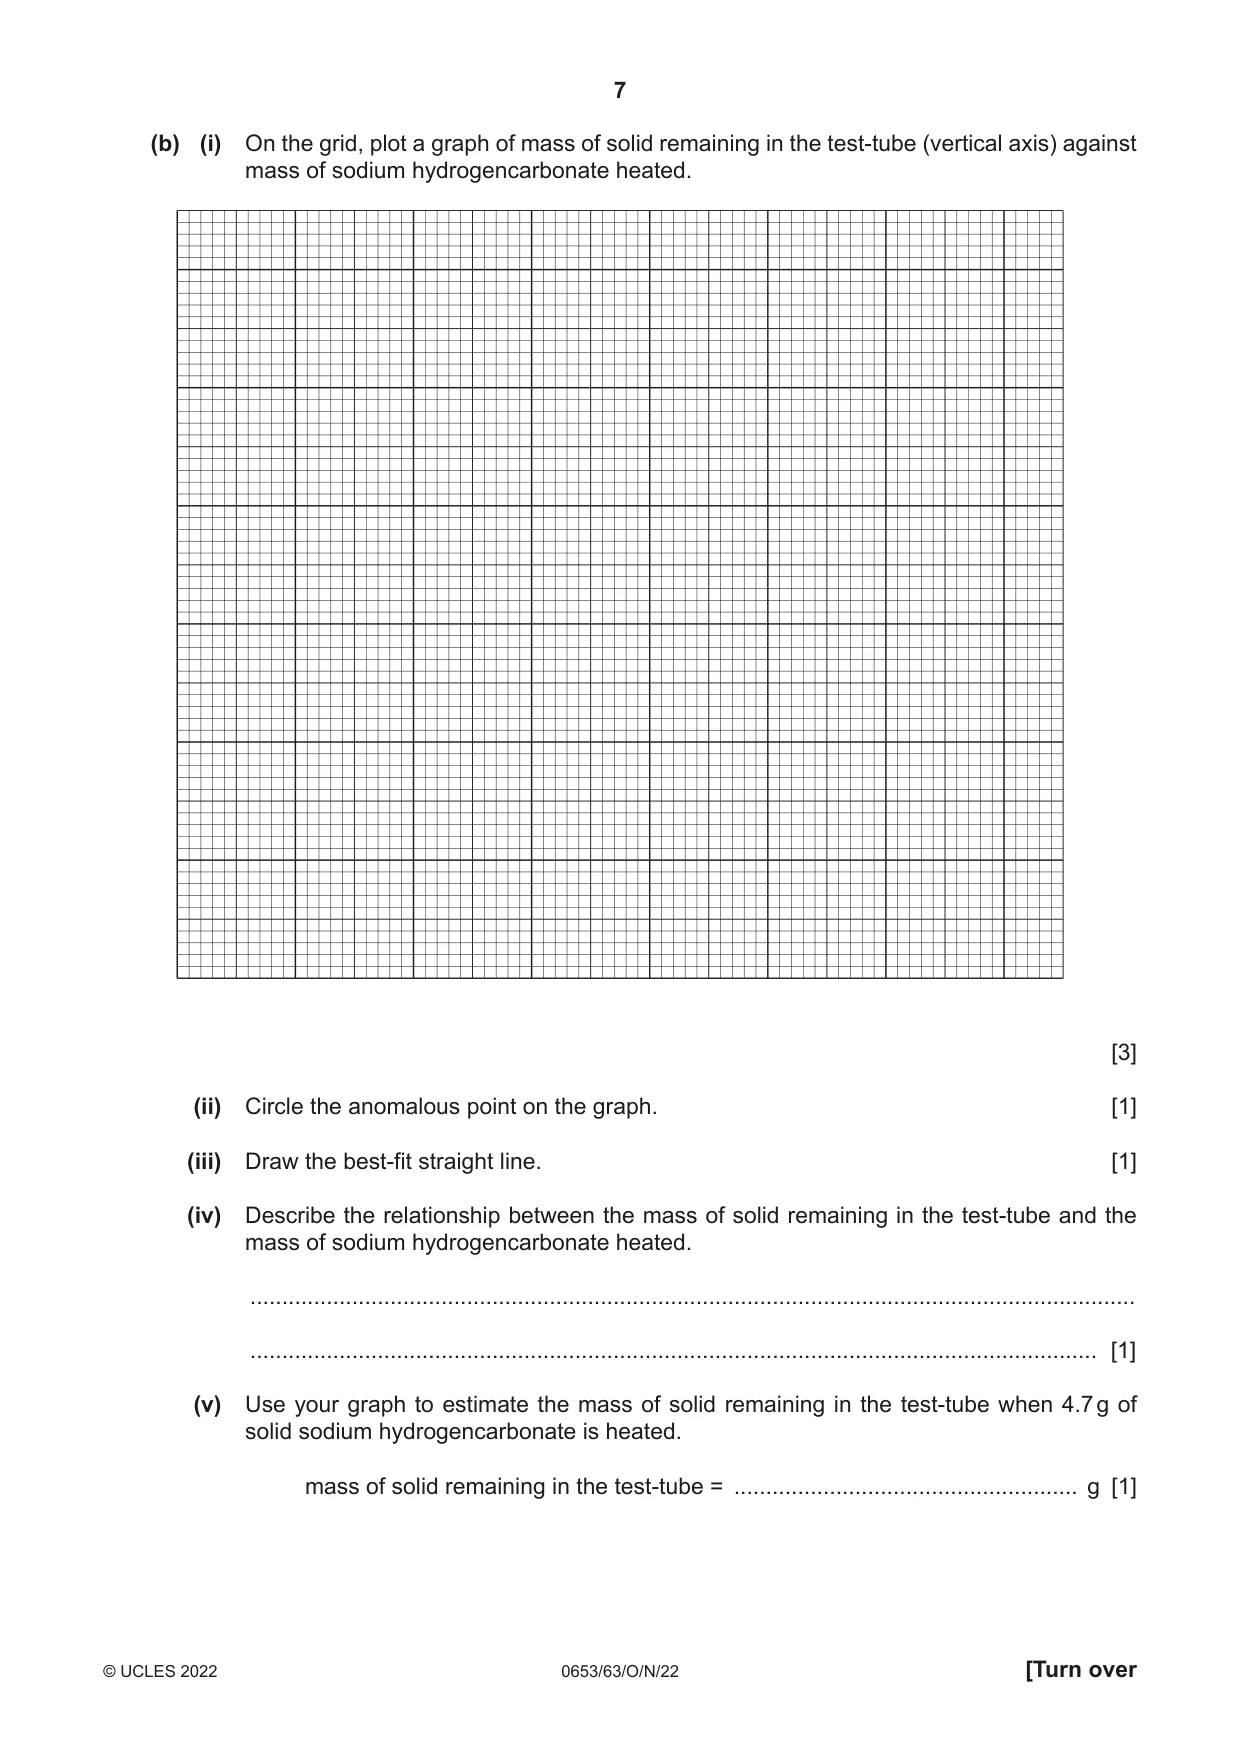
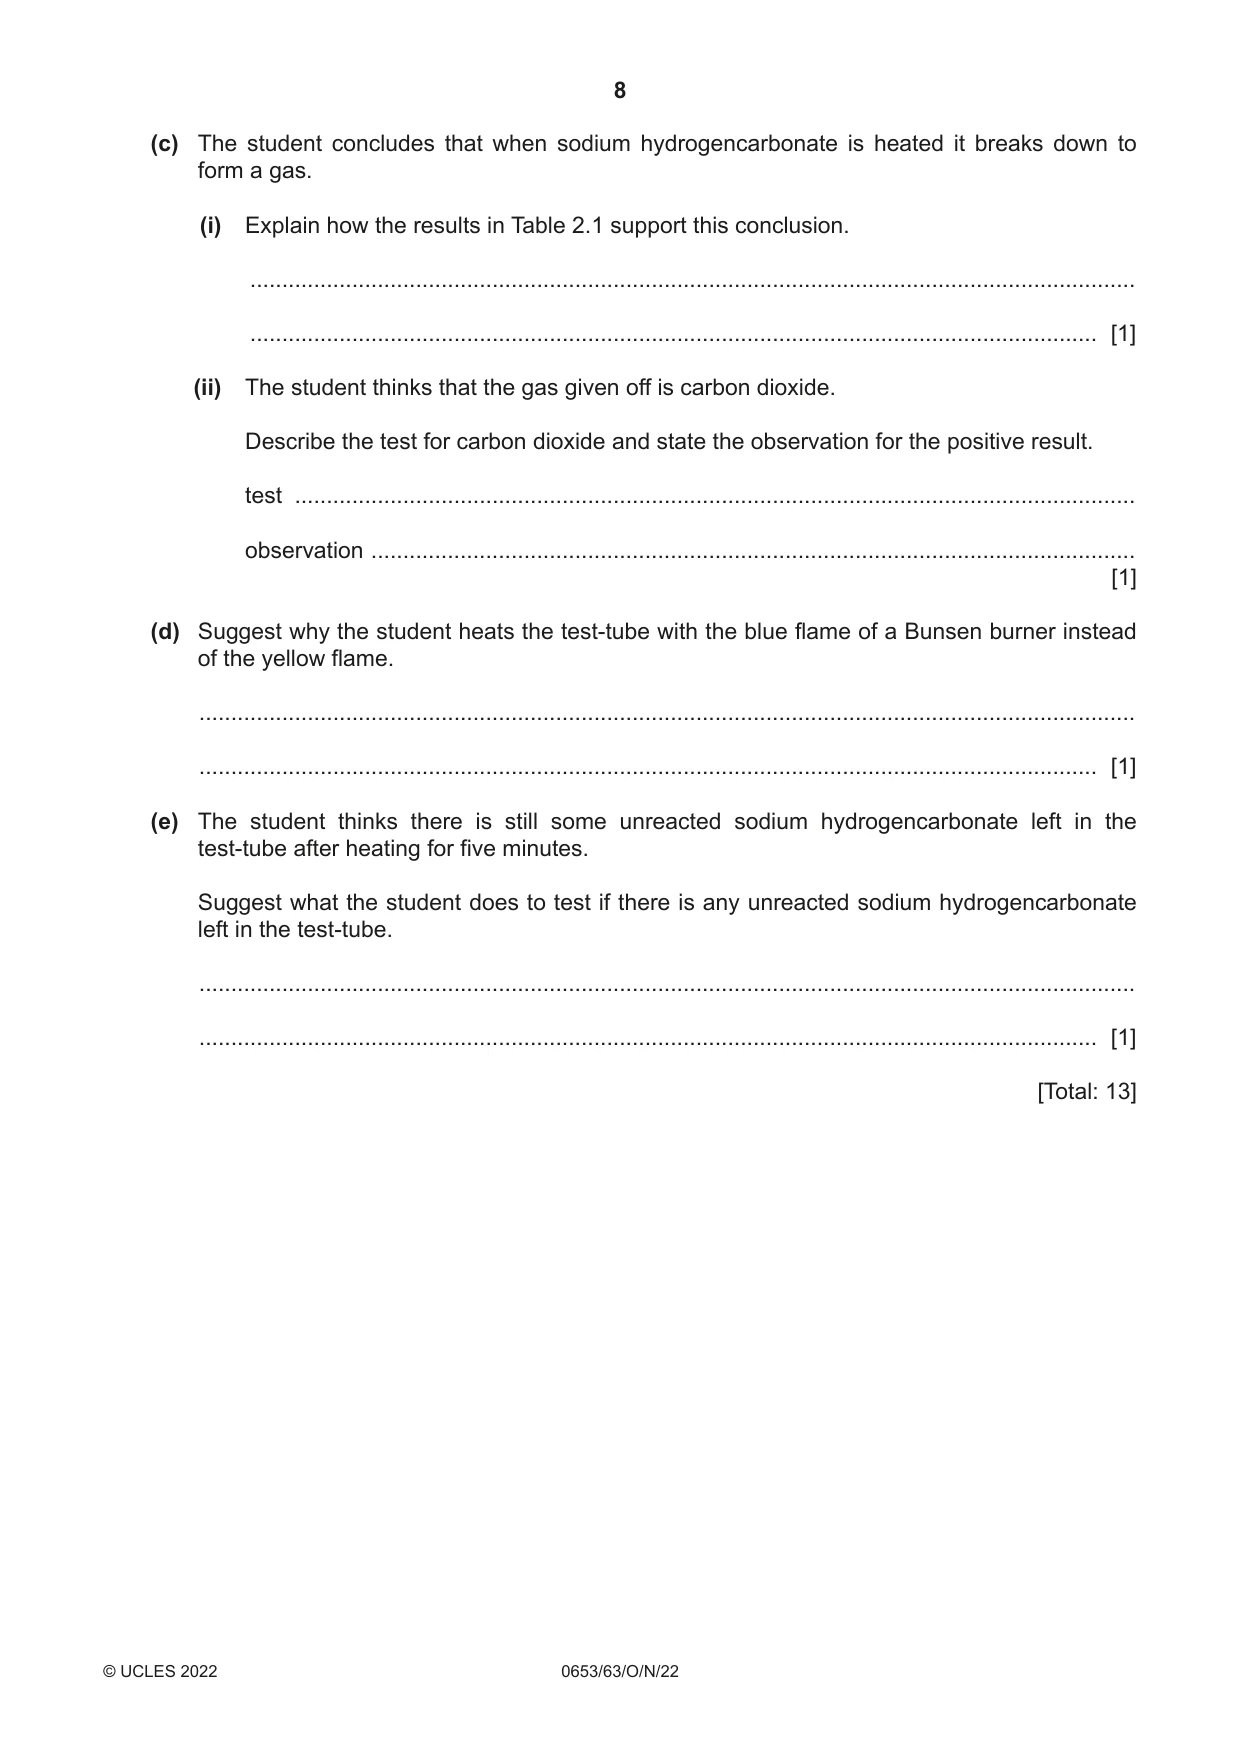
2 A student investigates the effect of heat on solid sodium hydrogencarbonate. Procedure The student: • adds 1.0 g of solid sodium hydrogencarbonate to a test-tube • heats the sodium hydrogencarbonate using the blue flame of a Bunsen burner for five minutes • allows the test-tube to cool down • measures the mass of the solid remaining in the test-tube. The student repeats the procedure using different masses of sodium hydrogencarbonate. The results are shown in Table 2.1 Table 2.1 mass of sodium hydrogencarbonate heated mass of solid remaining in the test-tube / g / g 1.0 0.8 2.0 2.7 3.0 2.5 4.0 3.4 5.0 4.2 6.0 7.0 (a) Fig. 2.1 shows the balance readings for 6.0 g and 7.0 g of sodium hydrogencarbonate heated. g g 6.0 g of sodium hydrogencarbonate 7.0 g of sodium hydrogencarbonate Fig. 2.1 Record in Table 2.1 these readings to one decimal place. [2] (b) (i) On the grid, plot a graph of mass of solid remaining in the test-tube (vertical axis) against mass of sodium hydrogencarbonate heated. [3] (ii) Circle the anomalous point on the graph. [1] (iii) Draw the best-fit straight line. [1] (iv) Describe the relationship between the mass of solid remaining in the test-tube and the mass of sodium hydrogencarbonate heated. ........................................................................................................................................... ..................................................................................................................................... [1] (v) Use your graph to estimate the mass of solid remaining in the test-tube when 4.7 g of solid sodium hydrogencarbonate is heated. mass of solid remaining in the test-tube = ...................................................... g [1] (c) The student concludes that when sodium hydrogencarbonate is heated it breaks down to form a gas. (i) Explain how the results in Table 2.1 support this conclusion. ........................................................................................................................................... ..................................................................................................................................... [1] (ii) The student thinks that the gas given off is carbon dioxide. Describe the test for carbon dioxide and state the observation for the positive result. test .................................................................................................................................... observation ........................................................................................................................ [1] (d) Suggest why the student heats the test-tube with the blue flame of a Bunsen burner instead of the yellow flame. ................................................................................................................................................... ............................................................................................................................................. [1] (e) The student thinks there is still some unreacted sodium hydrogencarbonate left in the test-tube after heating for five minutes. Suggest what the student does to test if there is any unreacted sodium hydrogencarbonate left in the test-tube. ................................................................................................................................................... ............................................................................................................................................. [1] [Total: 13]
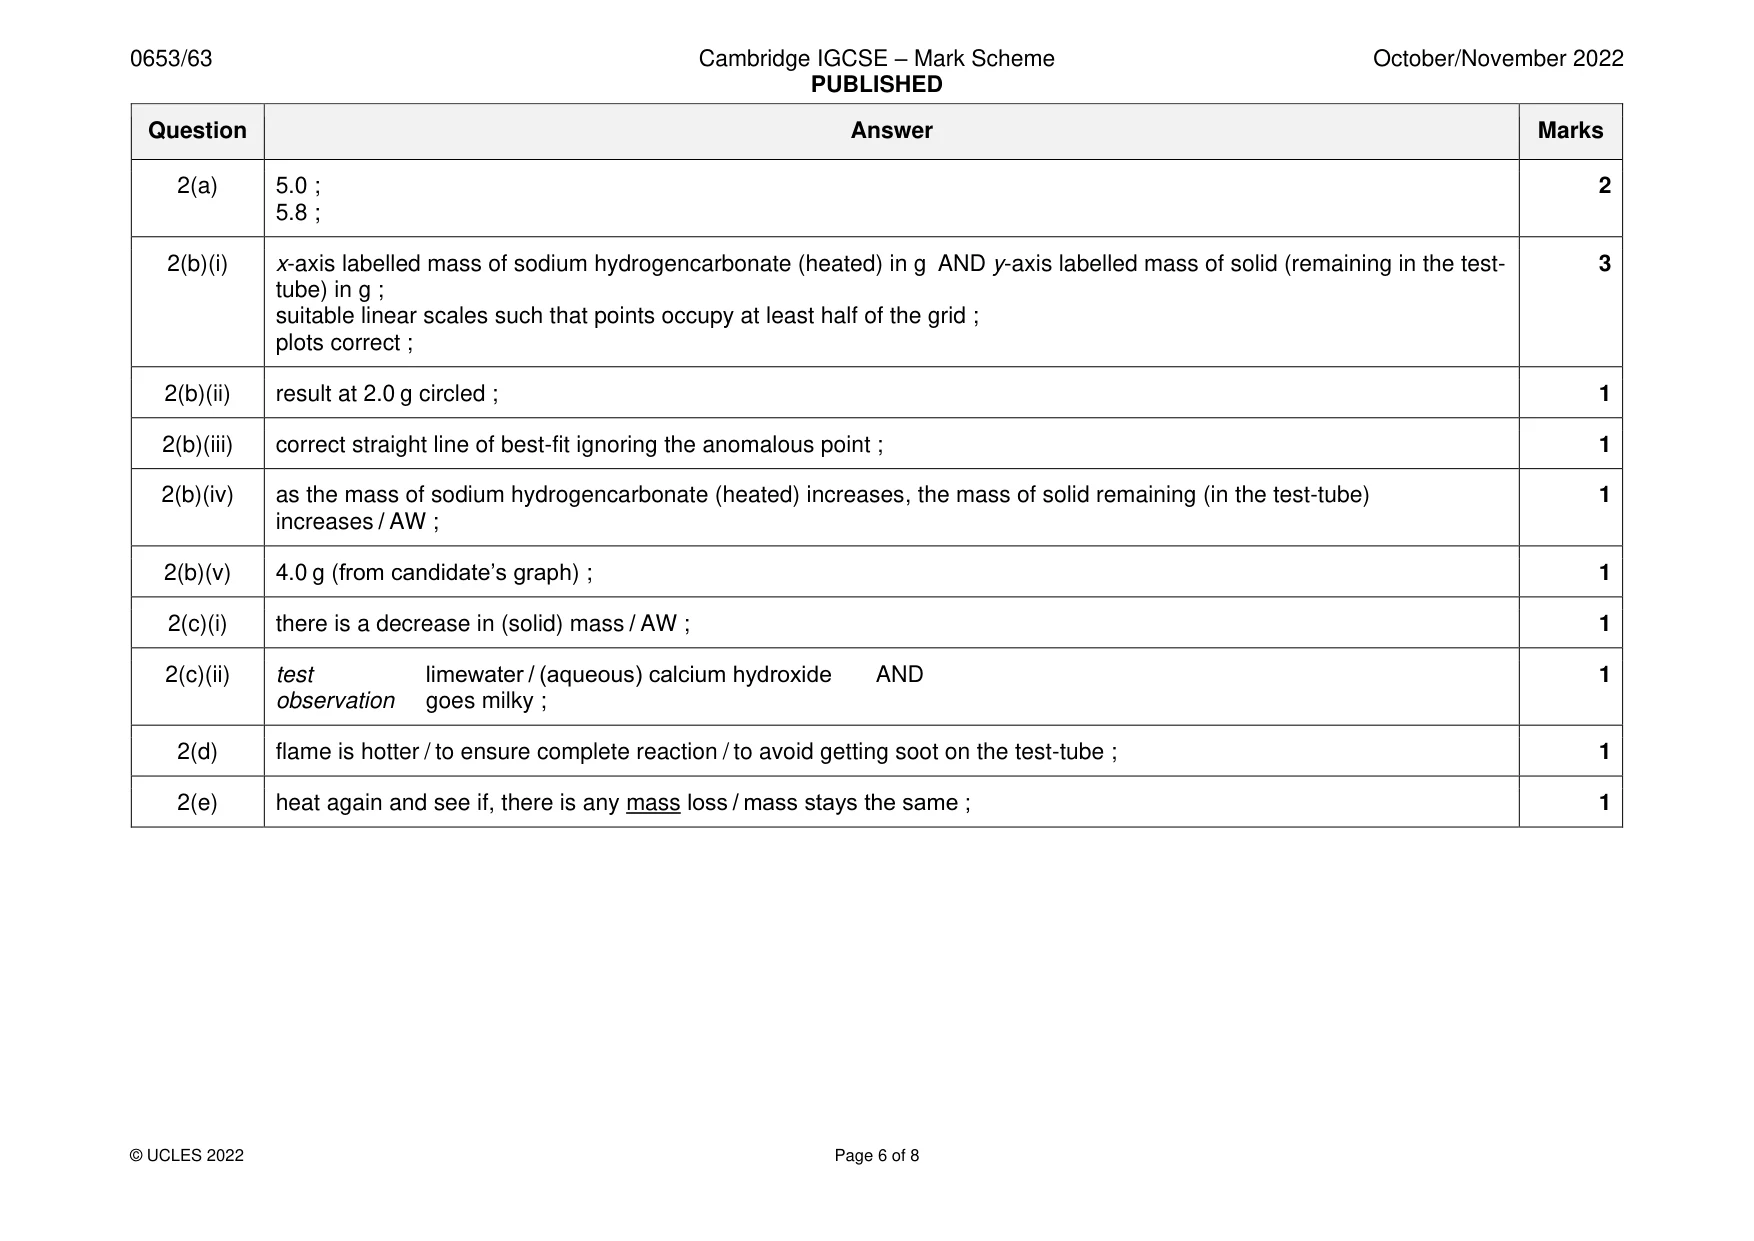
Mark scheme: 2(a) 5.0 ; 2 5.8 ; 2(b)(i) x-axis labelled mass of sodium hydrogencarbonate (heated) in g AND y-axis labelled mass of solid (remaining in the test- 3 tube) in g ; suitable linear scales such that points occupy at least half of the grid ; plots correct ; 2(b)(ii) result at 2.0 g circled ; 1 2(b)(iii) correct straight line of best-fit ignoring the anomalous point ; 1 2(b)(iv) as the mass of sodium hydrogencarbonate (heated) increases, the mass of solid remaining (in the test-tube) 1 increases / AW ; 2(b)(v) 4.0 g (from candidate’s graph) ; 1 2(c)(i) there is a decrease in (solid) mass / AW ; 1 2(c)(ii) test limewater / (aqueous) calcium hydroxide AND 1 observation goes milky ; 2(d) flame is hotter / to ensure complete reaction / to avoid getting soot on the test-tube ; 1 2(e) heat again and see if, there is any mass loss / mass stays the same ; 1
Q3 · A student determines the thermal energy lost by a beaker of water when an ice cube melts…
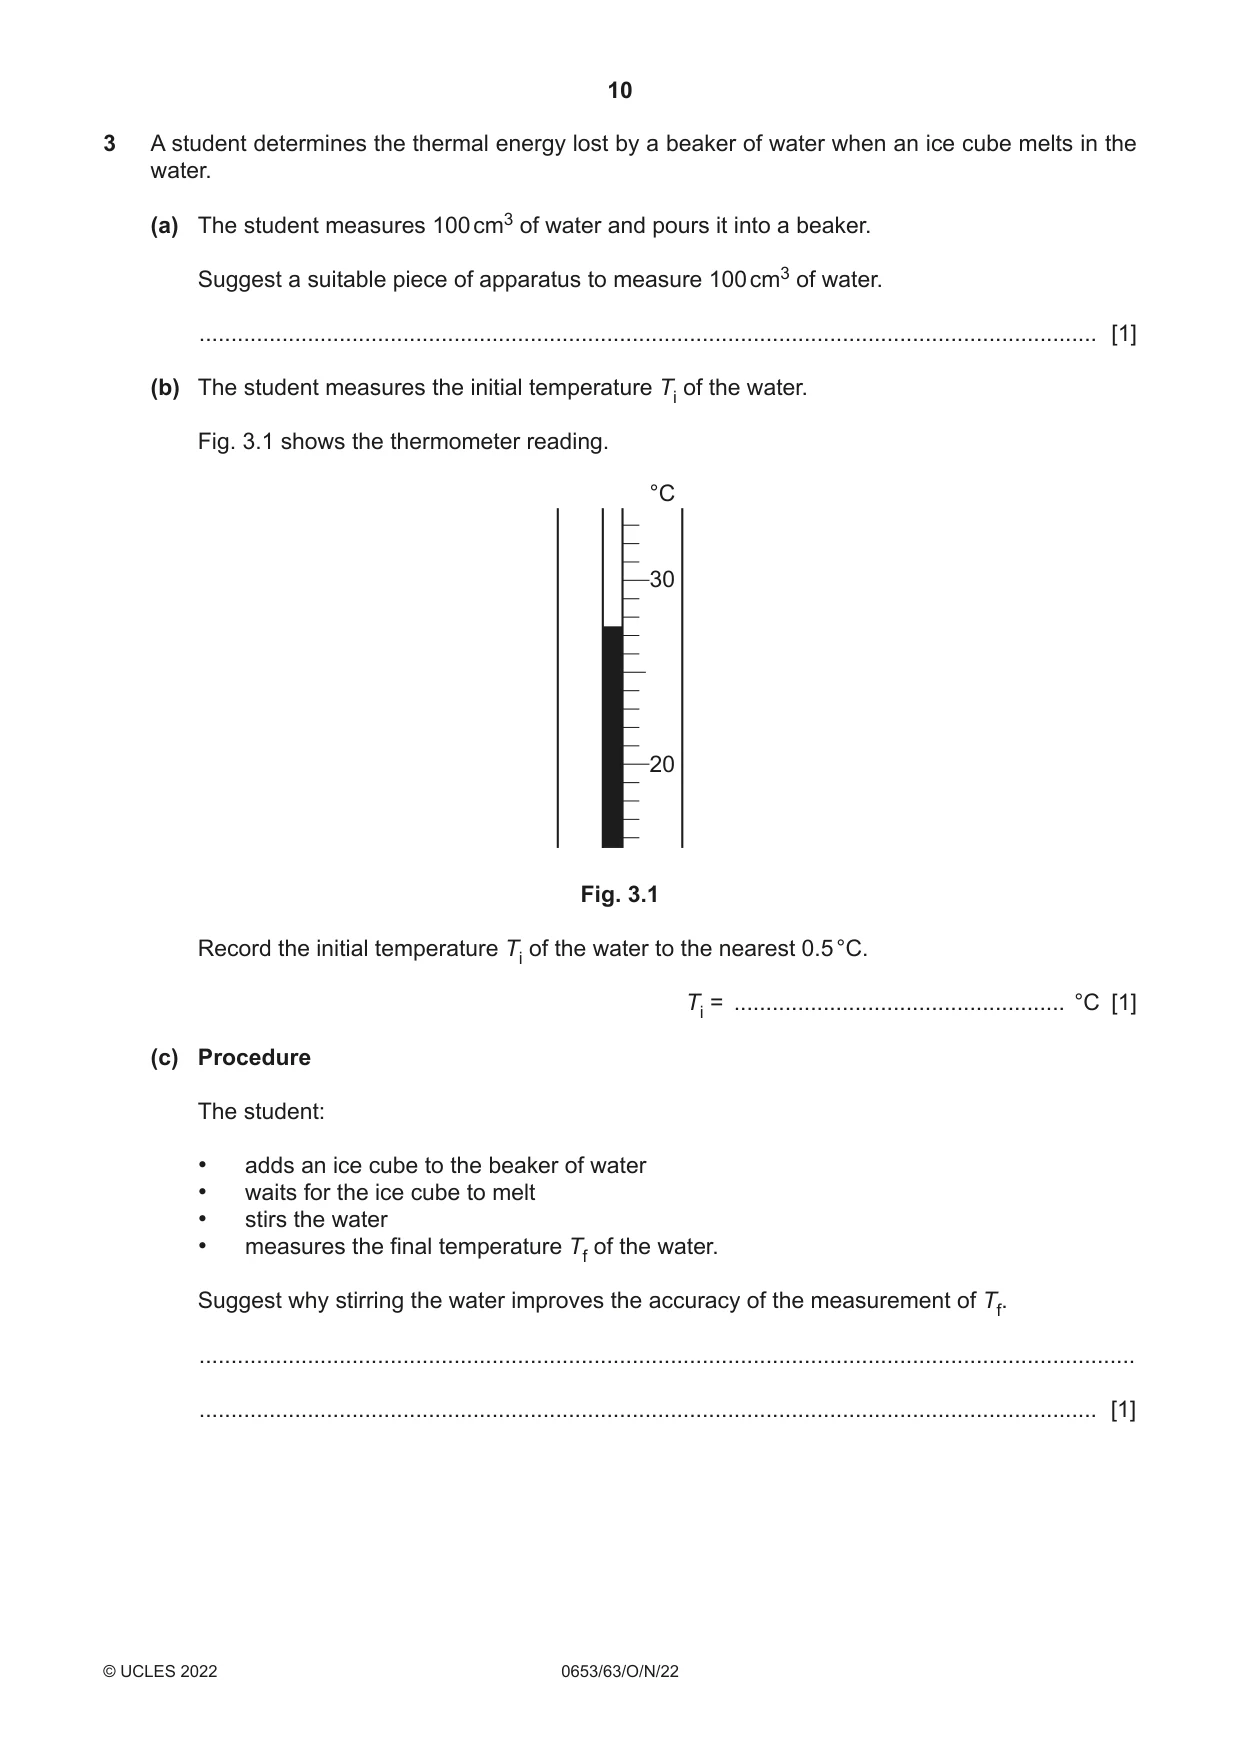
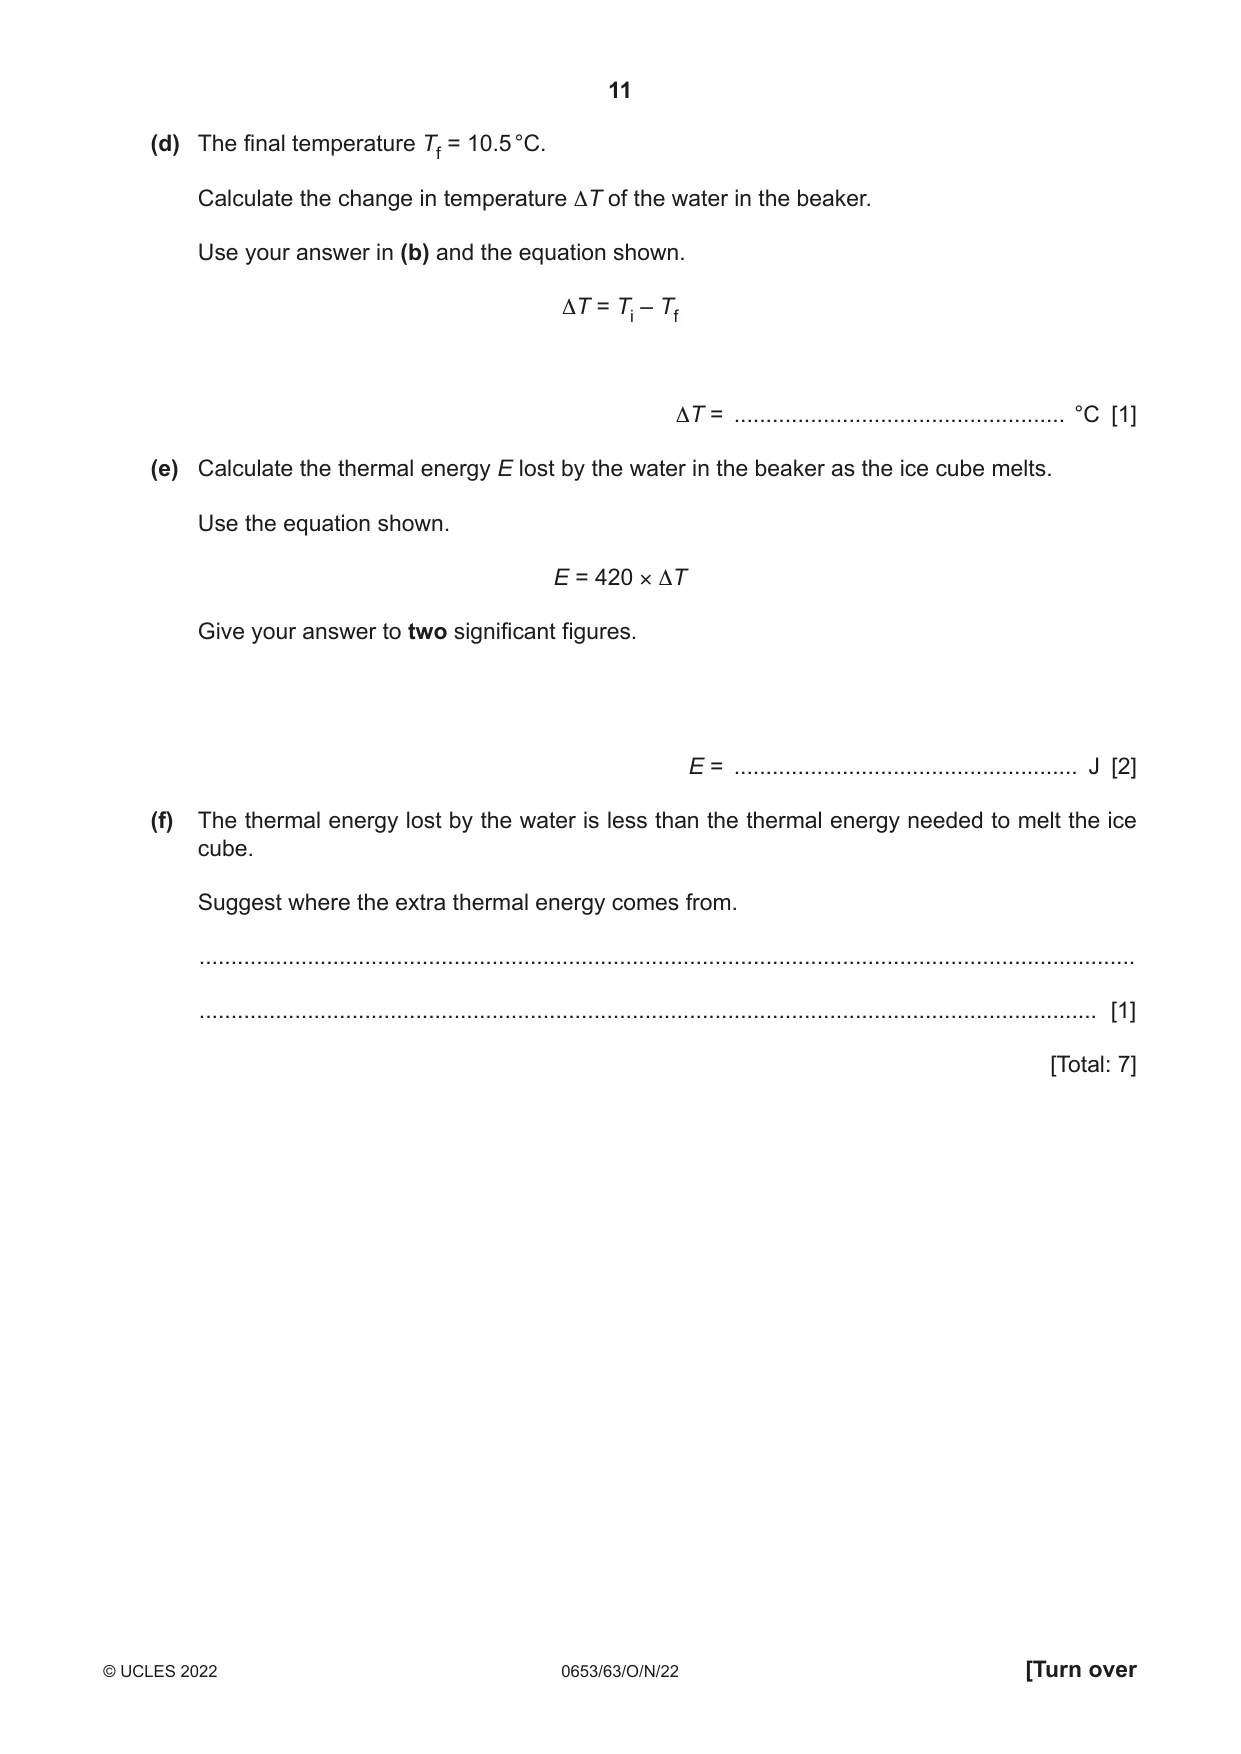
3 A student determines the thermal energy lost by a beaker of water when an ice cube melts in the water. (a) The student measures 100 cm3 of water and pours it into a beaker. Suggest a suitable piece of apparatus to measure 100 cm3 of water. ............................................................................................................................................. [1] (b) The student measures the initial temperature Ti of the water. Fig. 3.1 shows the thermometer reading. °C 30 20 Fig. 3.1 Record the initial temperature Ti of the water to the nearest 0.5 °C. Ti = .................................................... °C [1] (c) Procedure The student: • adds an ice cube to the beaker of water • waits for the ice cube to melt • stirs the water • measures the final temperature Tf of the water. Suggest why stirring the water improves the accuracy of the measurement of Tf. ................................................................................................................................................... ............................................................................................................................................. [1] (d) The final temperature Tf = 10.5 °C. Calculate the change in temperature ΔT of the water in the beaker. Use your answer in (b) and the equation shown. ΔT = Ti – Tf ΔT = .................................................... °C [1] (e) Calculate the thermal energy E lost by the water in the beaker as the ice cube melts. Use the equation shown. E = 420 × ΔT Give your answer to two significant figures. E = ...................................................... J [2] (f) The thermal energy lost by the water is less than the thermal energy needed to melt the ice cube. Suggest where the extra thermal energy comes from. ................................................................................................................................................... ............................................................................................................................................. [1] [Total: 7]
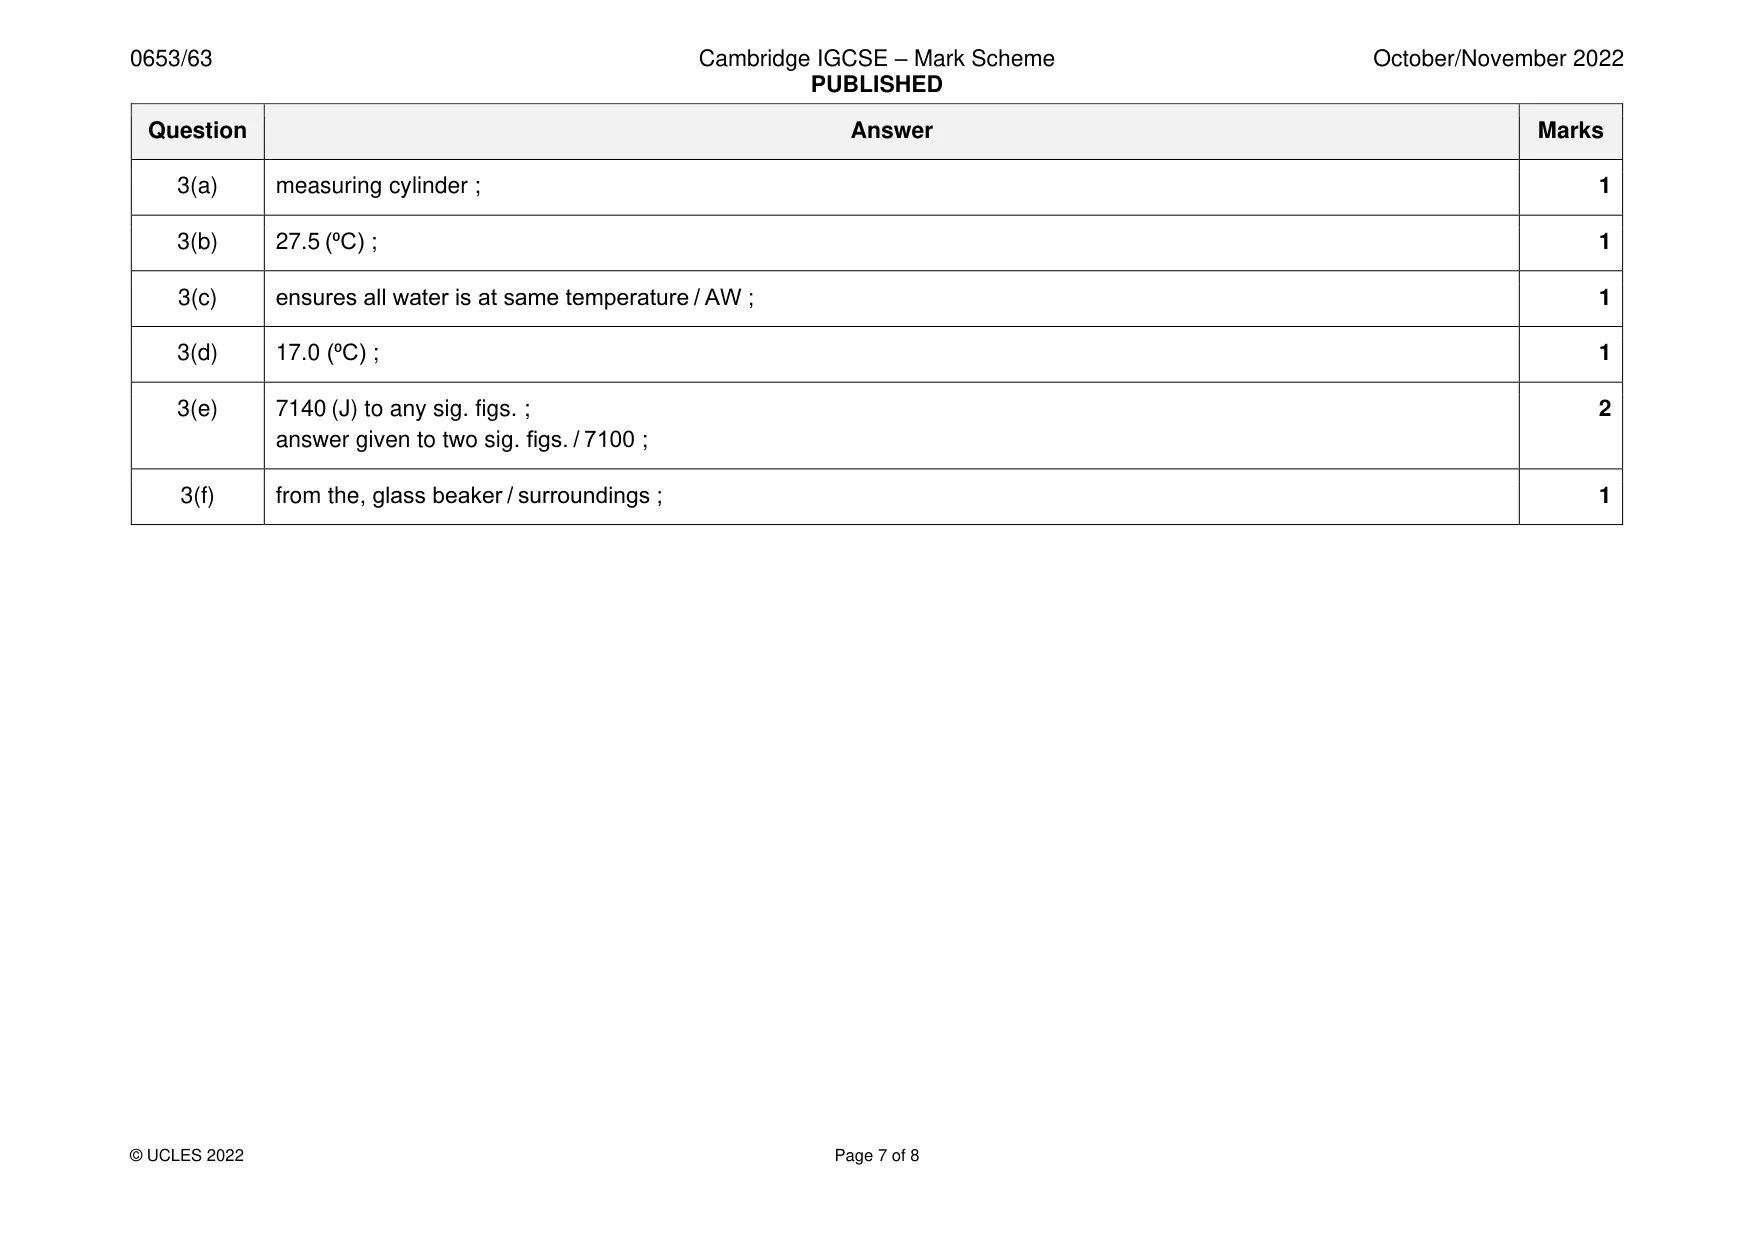
Mark scheme: 3(a) measuring cylinder ; 1 3(b) 27.5 (⁰C) ; 1 3(c) ensures all water is at same temperature / AW ; 1 3(d) 17.0 (⁰C) ; 1 3(e) 7140 (J) to any sig. figs. ; 2 answer given to two sig. figs. / 7100 ; 3(f) from the, glass beaker / surroundings ; 1
More questions on Physical quantities and measurement techniques
Q4 · A student wants to determine whether the resistance of a wire is related to the metal…
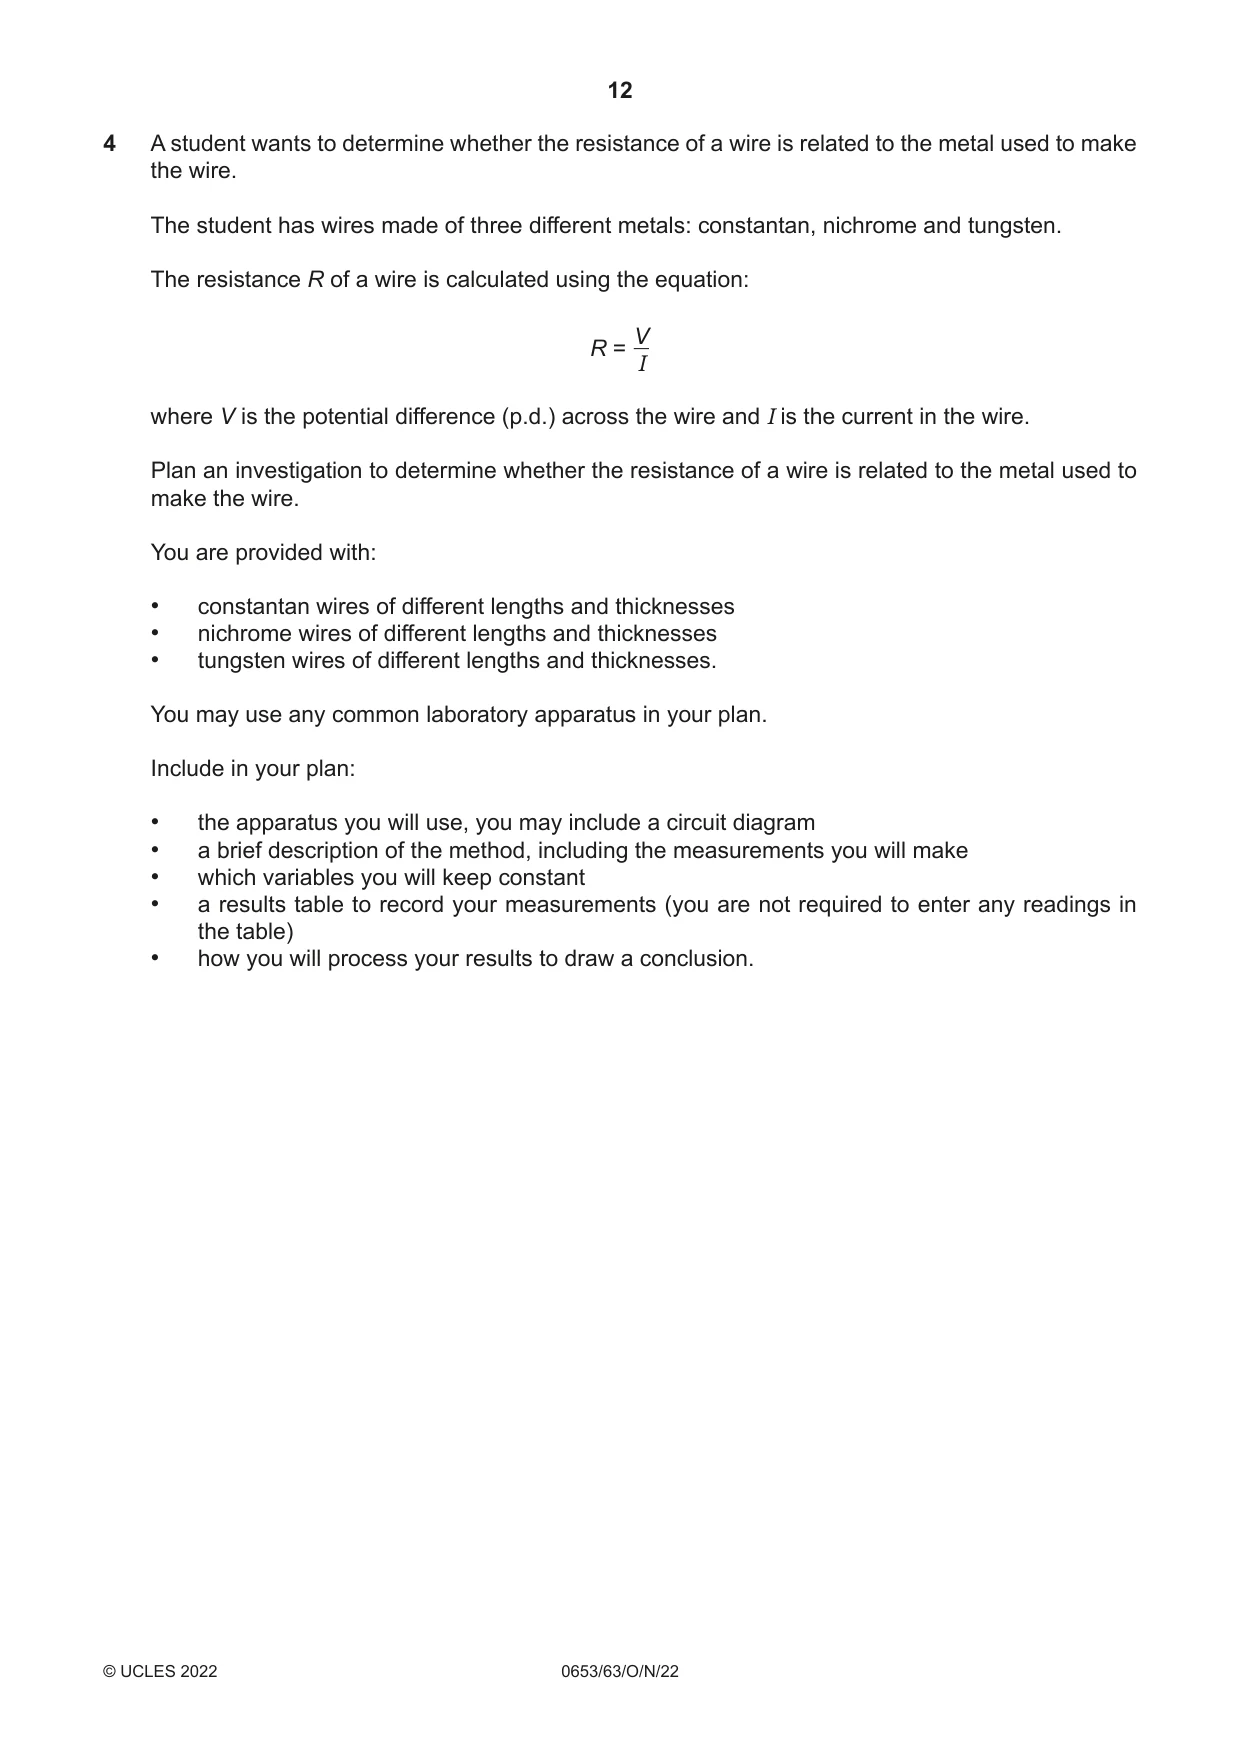
4 A student wants to determine whether the resistance of a wire is related to the metal used to make the wire. The student has wires made of three different metals: constantan, nichrome and tungsten. The resistance R of a wire is calculated using the equation: V R = I where V is the potential difference (p.d.) across the wire and I is the current in the wire. Plan an investigation to determine whether the resistance of a wire is related to the metal used to make the wire. You are provided with: • constantan wires of different lengths and thicknesses • nichrome wires of different lengths and thicknesses • tungsten wires of different lengths and thicknesses. You may use any common laboratory apparatus in your plan. Include in your plan: • the apparatus you will use, you may include a circuit diagram • a brief description of the method, including the measurements you will make • which variables you will keep constant • a results table to record your measurements (you are not required to enter any readings in the table) • how you will process your results to draw a conclusion. .......................................................................................................................................................... .......................................................................................................................................................... .......................................................................................................................................................... .......................................................................................................................................................... .......................................................................................................................................................... .......................................................................................................................................................... .......................................................................................................................................................... .......................................................................................................................................................... .......................................................................................................................................................... .......................................................................................................................................................... .......................................................................................................................................................... .......................................................................................................................................................... .......................................................................................................................................................... .......................................................................................................................................................... .......................................................................................................................................................... .................................................................................................................................................... [7]
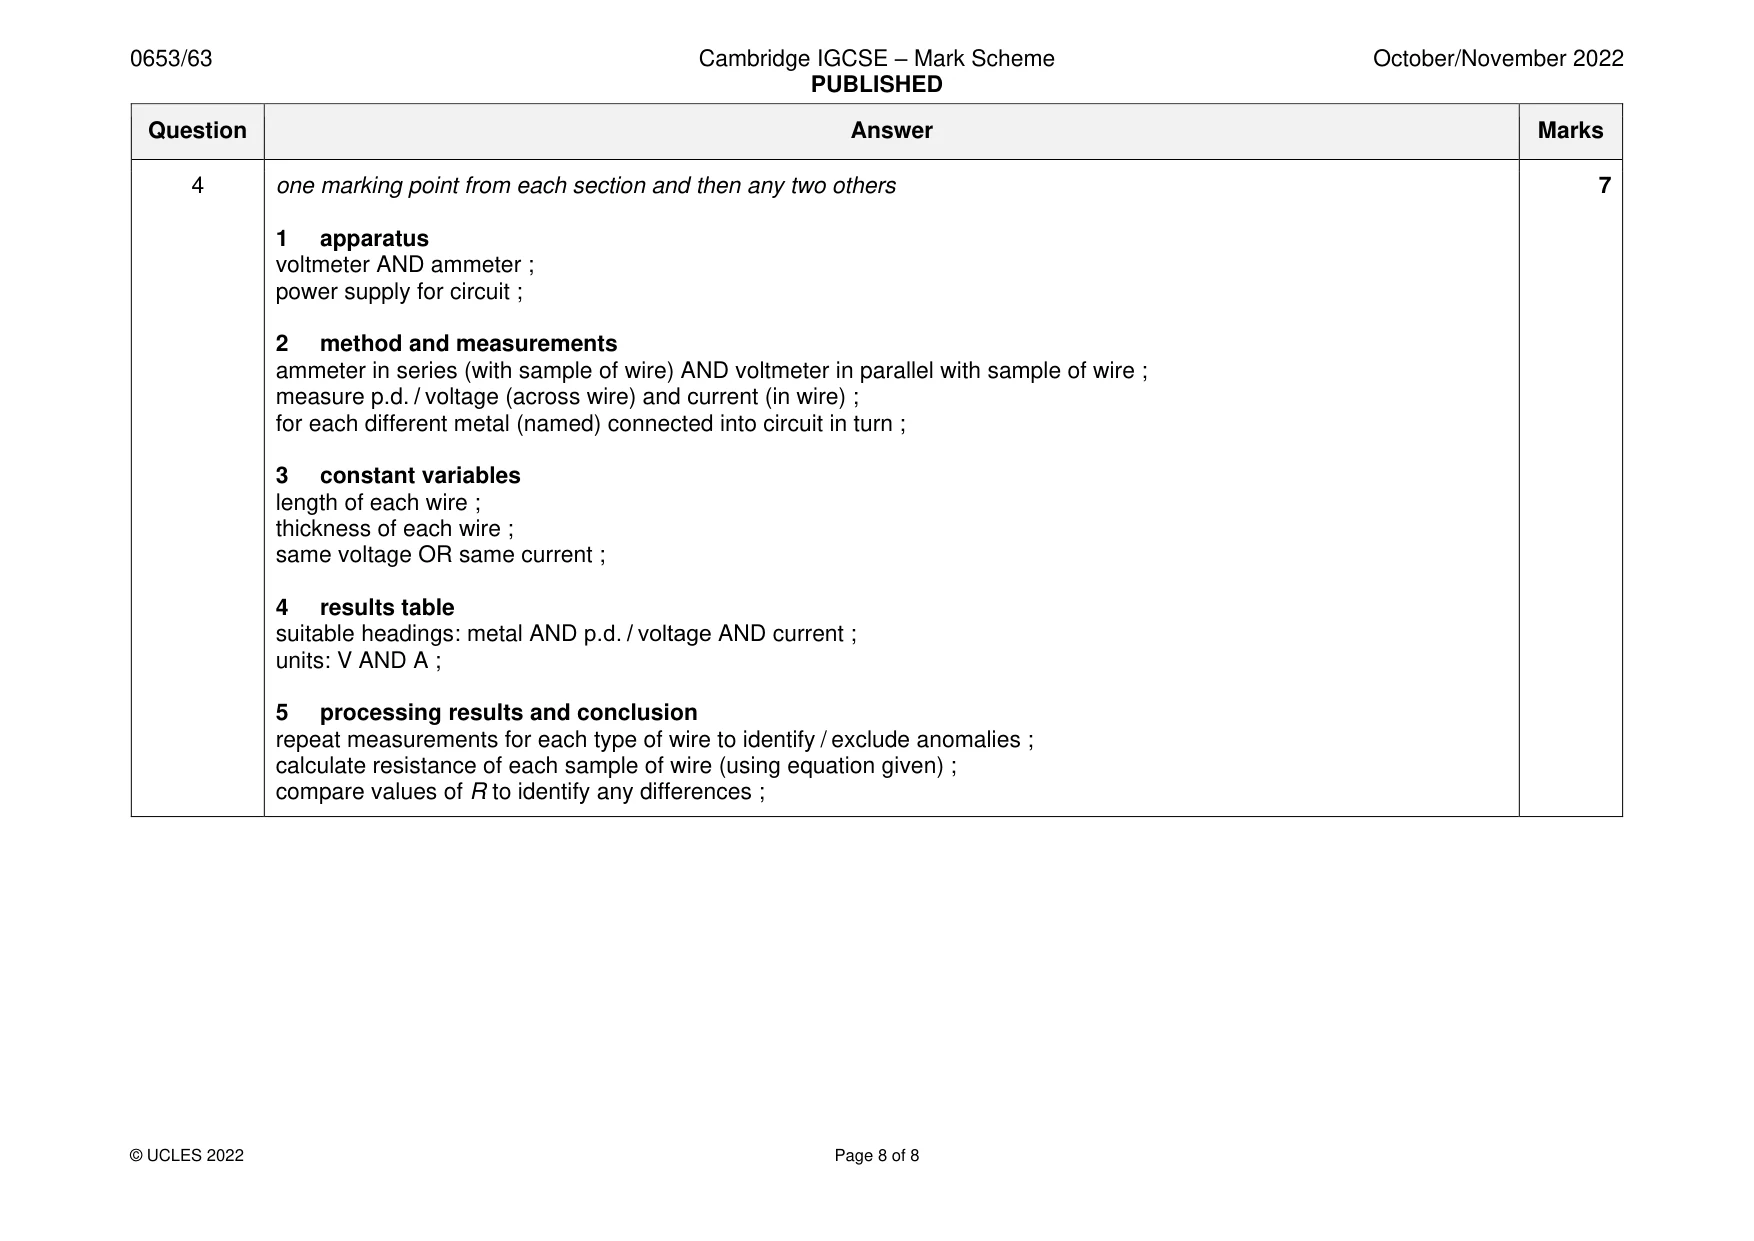
Mark scheme: 4 one marking point from each section and then any two others 7 1 apparatus voltmeter AND ammeter ; power supply for circuit ; 2 method and measurements ammeter in series (with sample of wire) AND voltmeter in parallel with sample of wire ; measure p.d. / voltage (across wire) and current (in wire) ; for each different metal (named) connected into circuit in turn ; 3 constant variables length of each wire ; thickness of each wire ; same voltage OR same current ; 4 results table suitable headings: metal AND p.d. / voltage AND current ; units: V AND A ; 5 processing results and conclusion repeat measurements for each type of wire to identify / exclude anomalies ; calculate resistance of each sample of wire (using equation given) ; compare values of R to identify any differences ;
What was in this paper
The subtopics covered by these 4 questions, and how many questions each got. Open one in a new tab to see every Cambridge question on it.
What you needed in this session
Cambridge’s own grade thresholds for 2022 Oct/Nov, Paper 6 · Variant 3. A higher threshold means an easier paper — the bar moves with how the cohort did.