Cambridge IGCSE Science - Combined 0653 — 2022 Oct/Nov Paper 6 · Variant 2
0653/62/O/N/22 · 4 questions · 40 marks · ≈45 min
The question paper and its mark scheme, free to read here and free to download. This is Cambridge’s own paper, exactly as it was sat.
Question paper16 pages

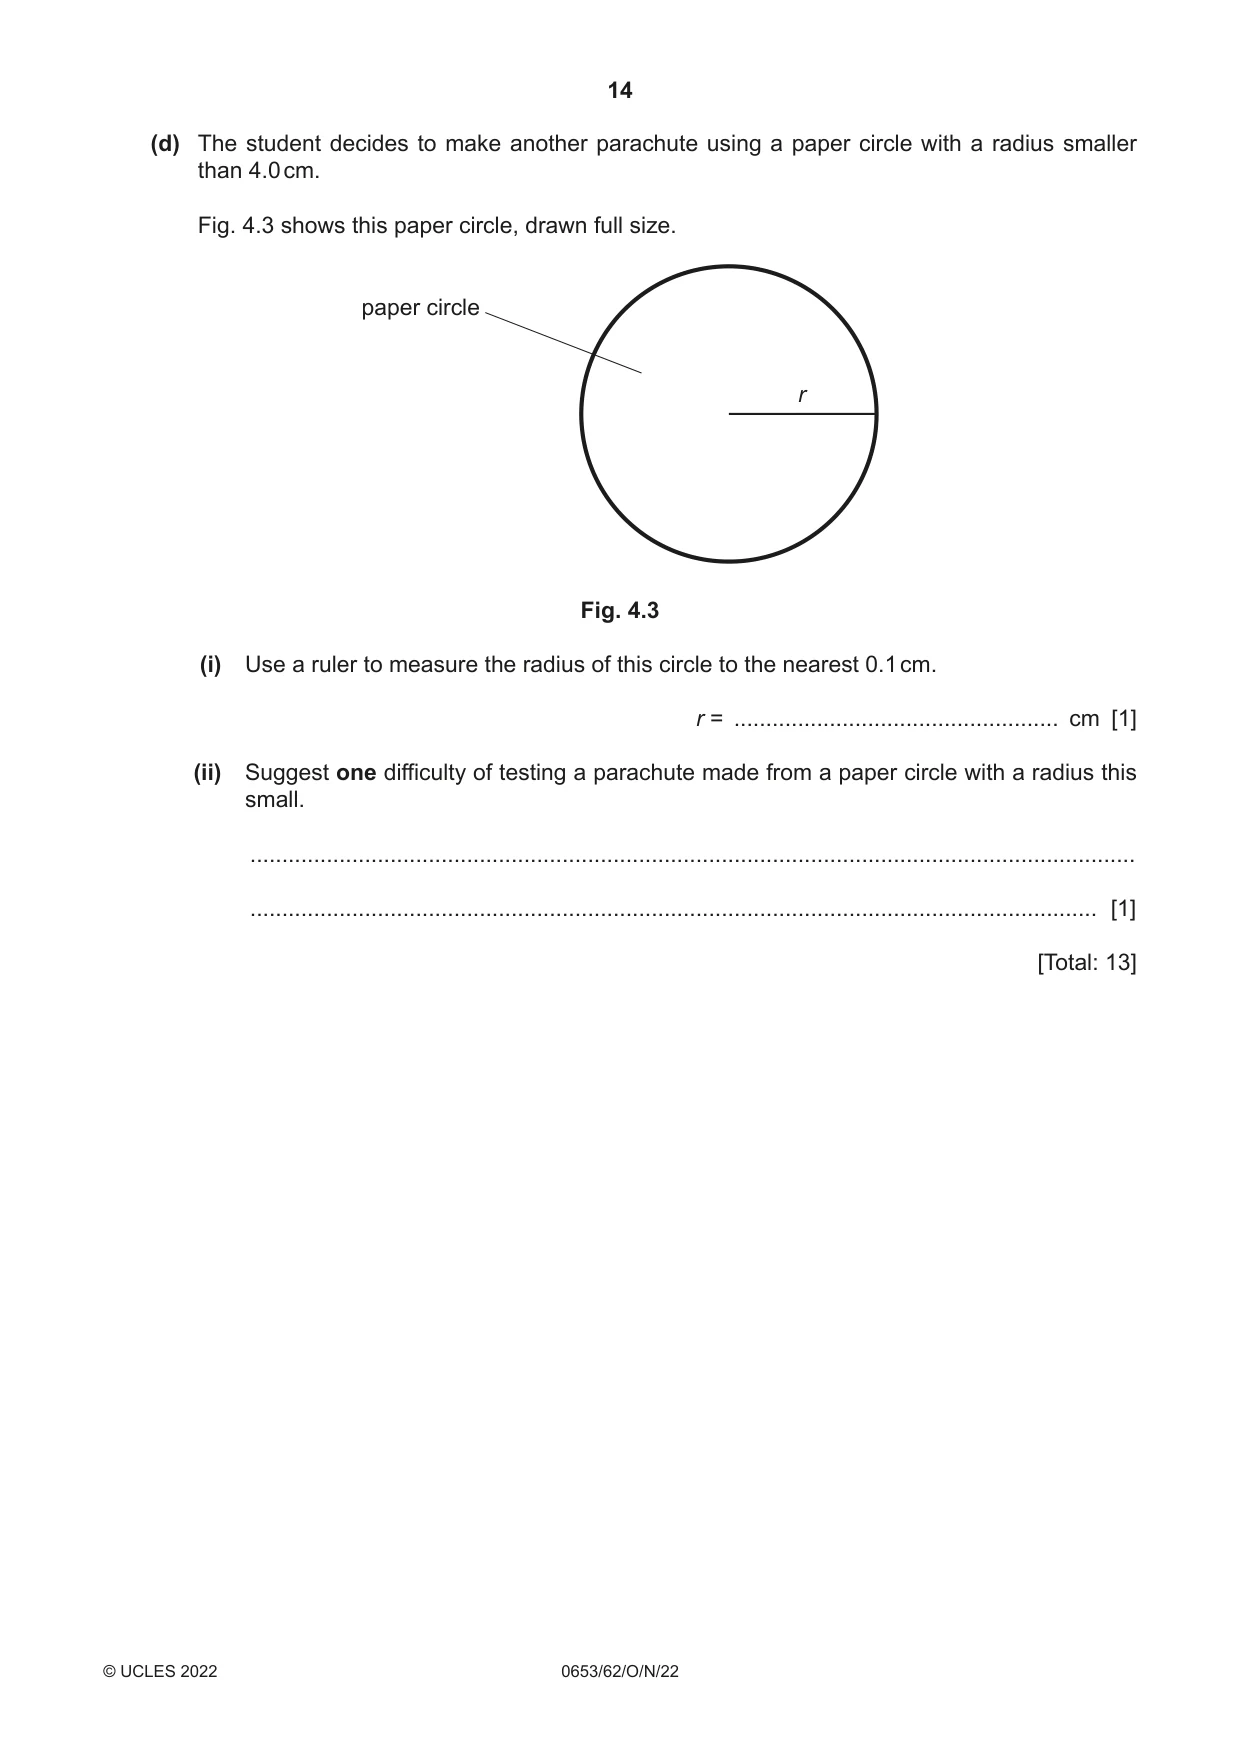

Mark scheme8 pages
Answers below. Sit the paper first if you are practising.
Questions as text
Q1 · A student investigates the effect of concentration of salt solution on osmosis in potatoes
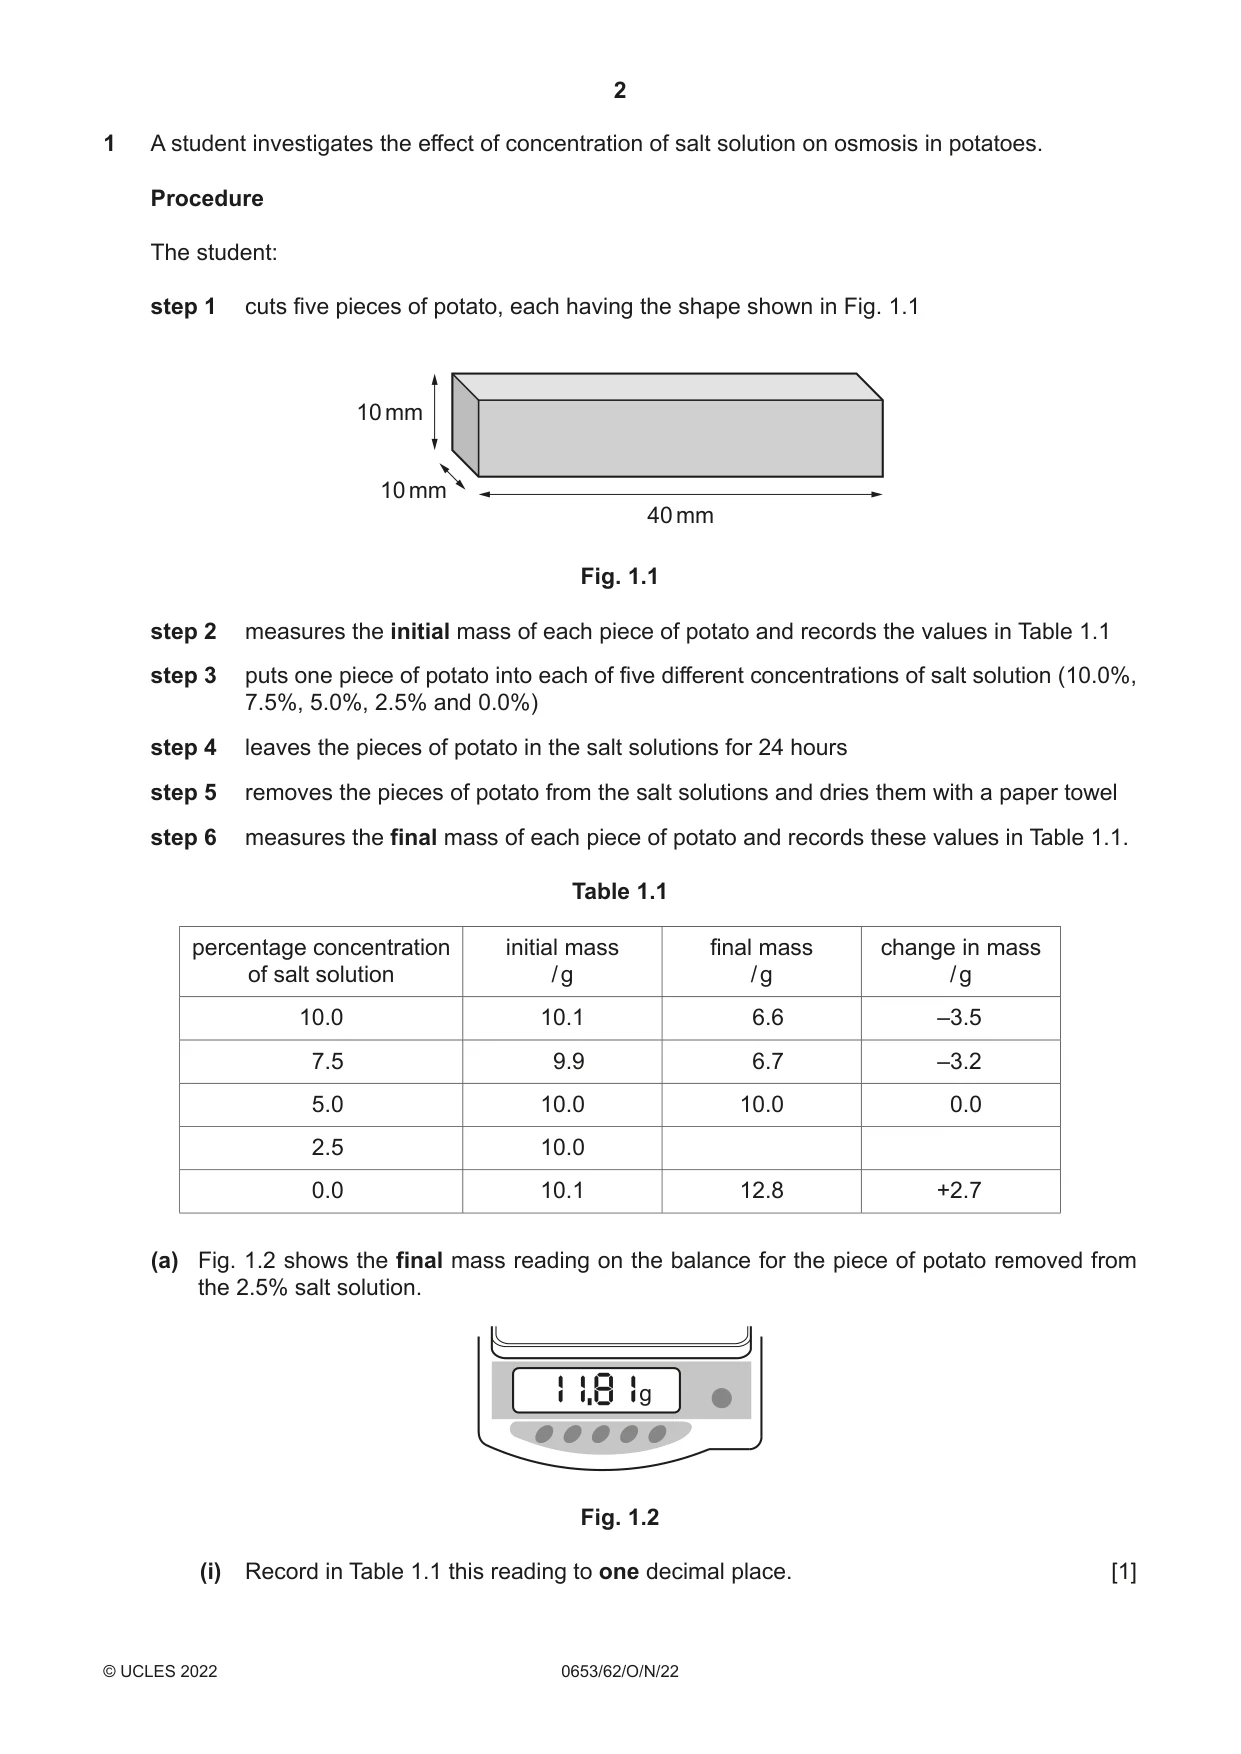
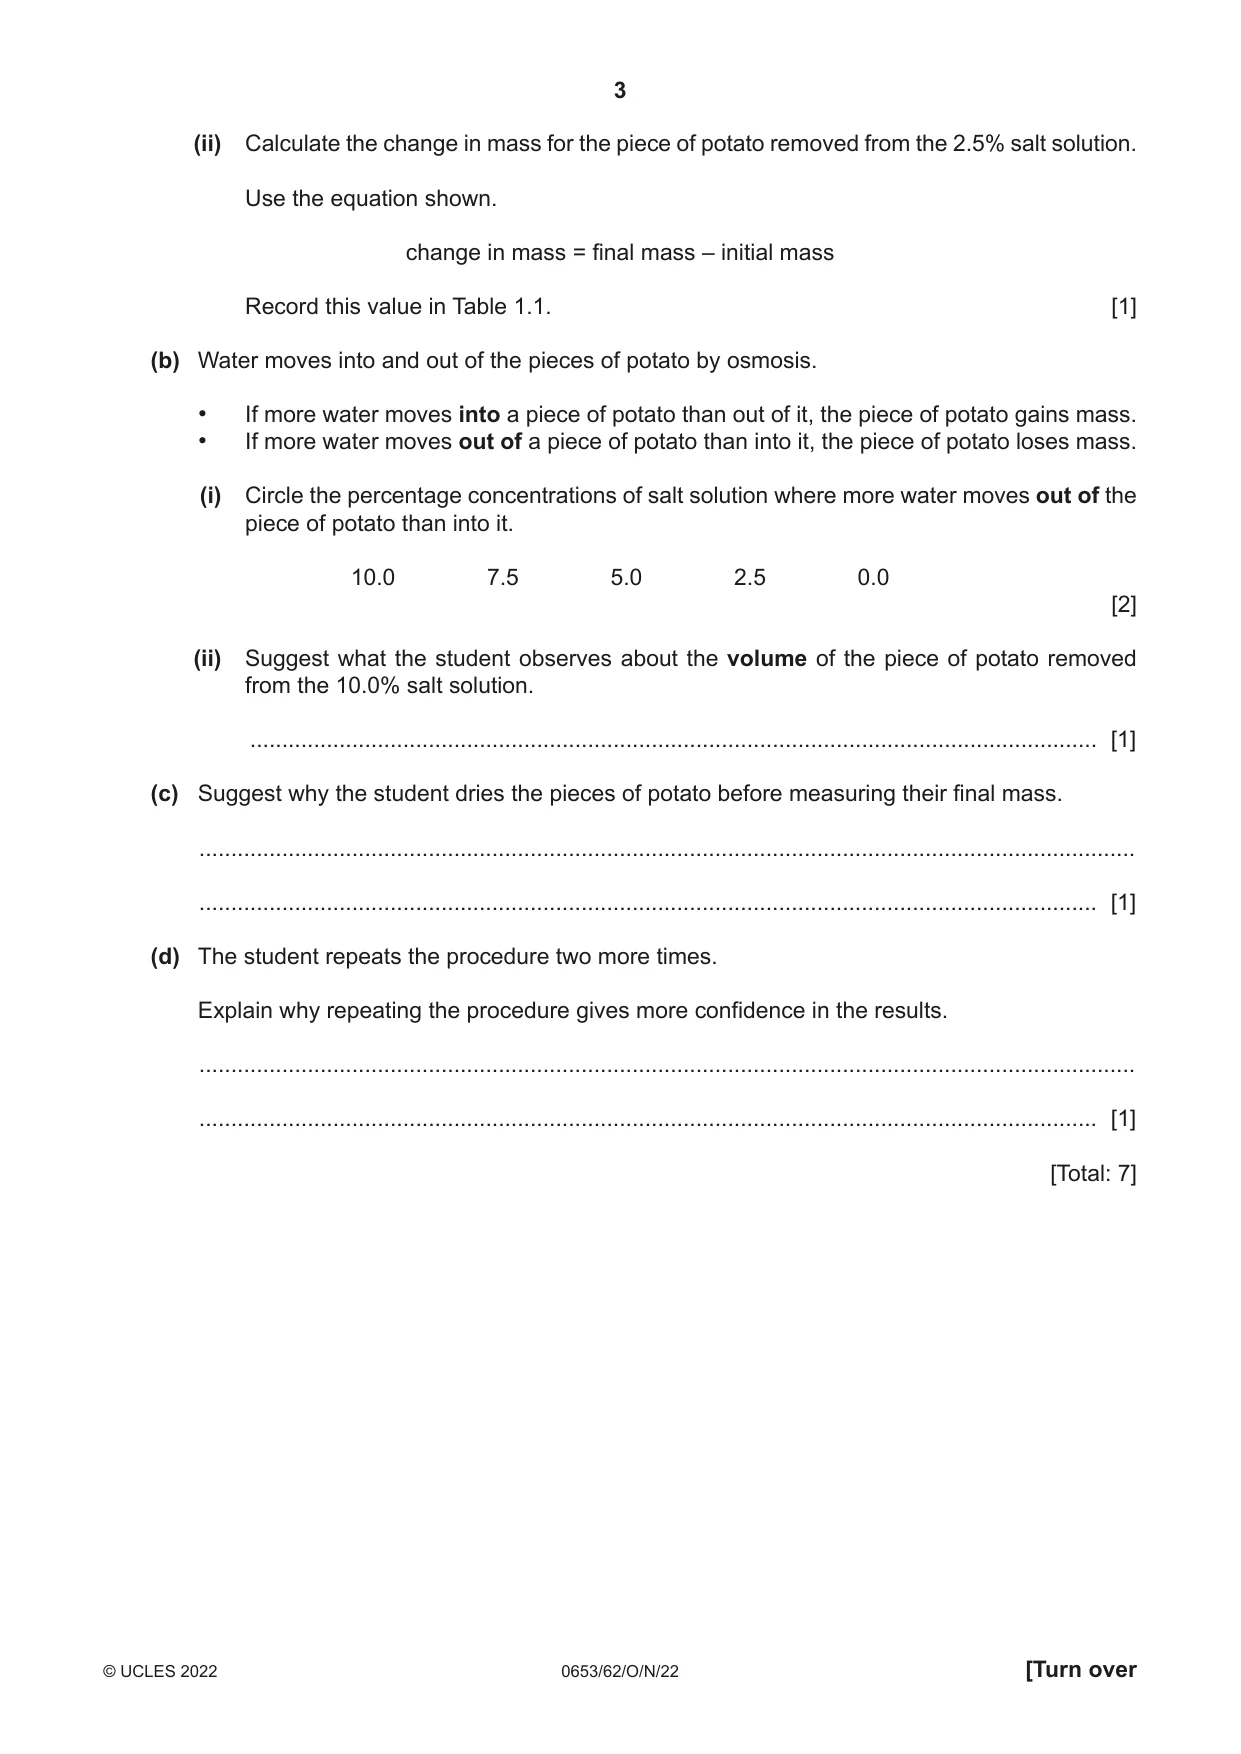
1 A student investigates the effect of concentration of salt solution on osmosis in potatoes. Procedure The student: step 1 cuts five pieces of potato, each having the shape shown in Fig. 1.1 10 mm 10 mm 40 mm Fig. 1.1 step 2 measures the initial mass of each piece of potato and records the values in Table 1.1 step 3 puts one piece of potato into each of five different concentrations of salt solution (10.0%, 7.5%, 5.0%, 2.5% and 0.0%) step 4 leaves the pieces of potato in the salt solutions for 24 hours step 5 removes the pieces of potato from the salt solutions and dries them with a paper towel step 6 measures the final mass of each piece of potato and records these values in Table 1.1. Table 1.1 percentage concentration initial mass final mass change in mass of salt solution / g / g / g 10.0 10.1 6.6 –3.5 7.5 9.9 6.7 –3.2 5.0 10.0 10.0 0.0 2.5 10.0 0.0 10.1 12.8 +2.7 (a) Fig. 1.2 shows the final mass reading on the balance for the piece of potato removed from the 2.5% salt solution. g Fig. 1.2 (i) Record in Table 1.1 this reading to one decimal place. [1] (ii) Calculate the change in mass for the piece of potato removed from the 2.5% salt solution. Use the equation shown. change in mass = final mass – initial mass Record this value in Table 1.1. [1] (b) Water moves into and out of the pieces of potato by osmosis. • If more water moves into a piece of potato than out of it, the piece of potato gains mass. • If more water moves out of a piece of potato than into it, the piece of potato loses mass. (i) Circle the percentage concentrations of salt solution where more water moves out of the piece of potato than into it. 10.0 7.5 5.0 2.5 0.0 [2] (ii) Suggest what the student observes about the volume of the piece of potato removed from the 10.0% salt solution. ..................................................................................................................................... [1] (c) Suggest why the student dries the pieces of potato before measuring their final mass. ................................................................................................................................................... ............................................................................................................................................. [1] (d) The student repeats the procedure two more times. Explain why repeating the procedure gives more confidence in the results. ................................................................................................................................................... ............................................................................................................................................. [1] [Total: 7]
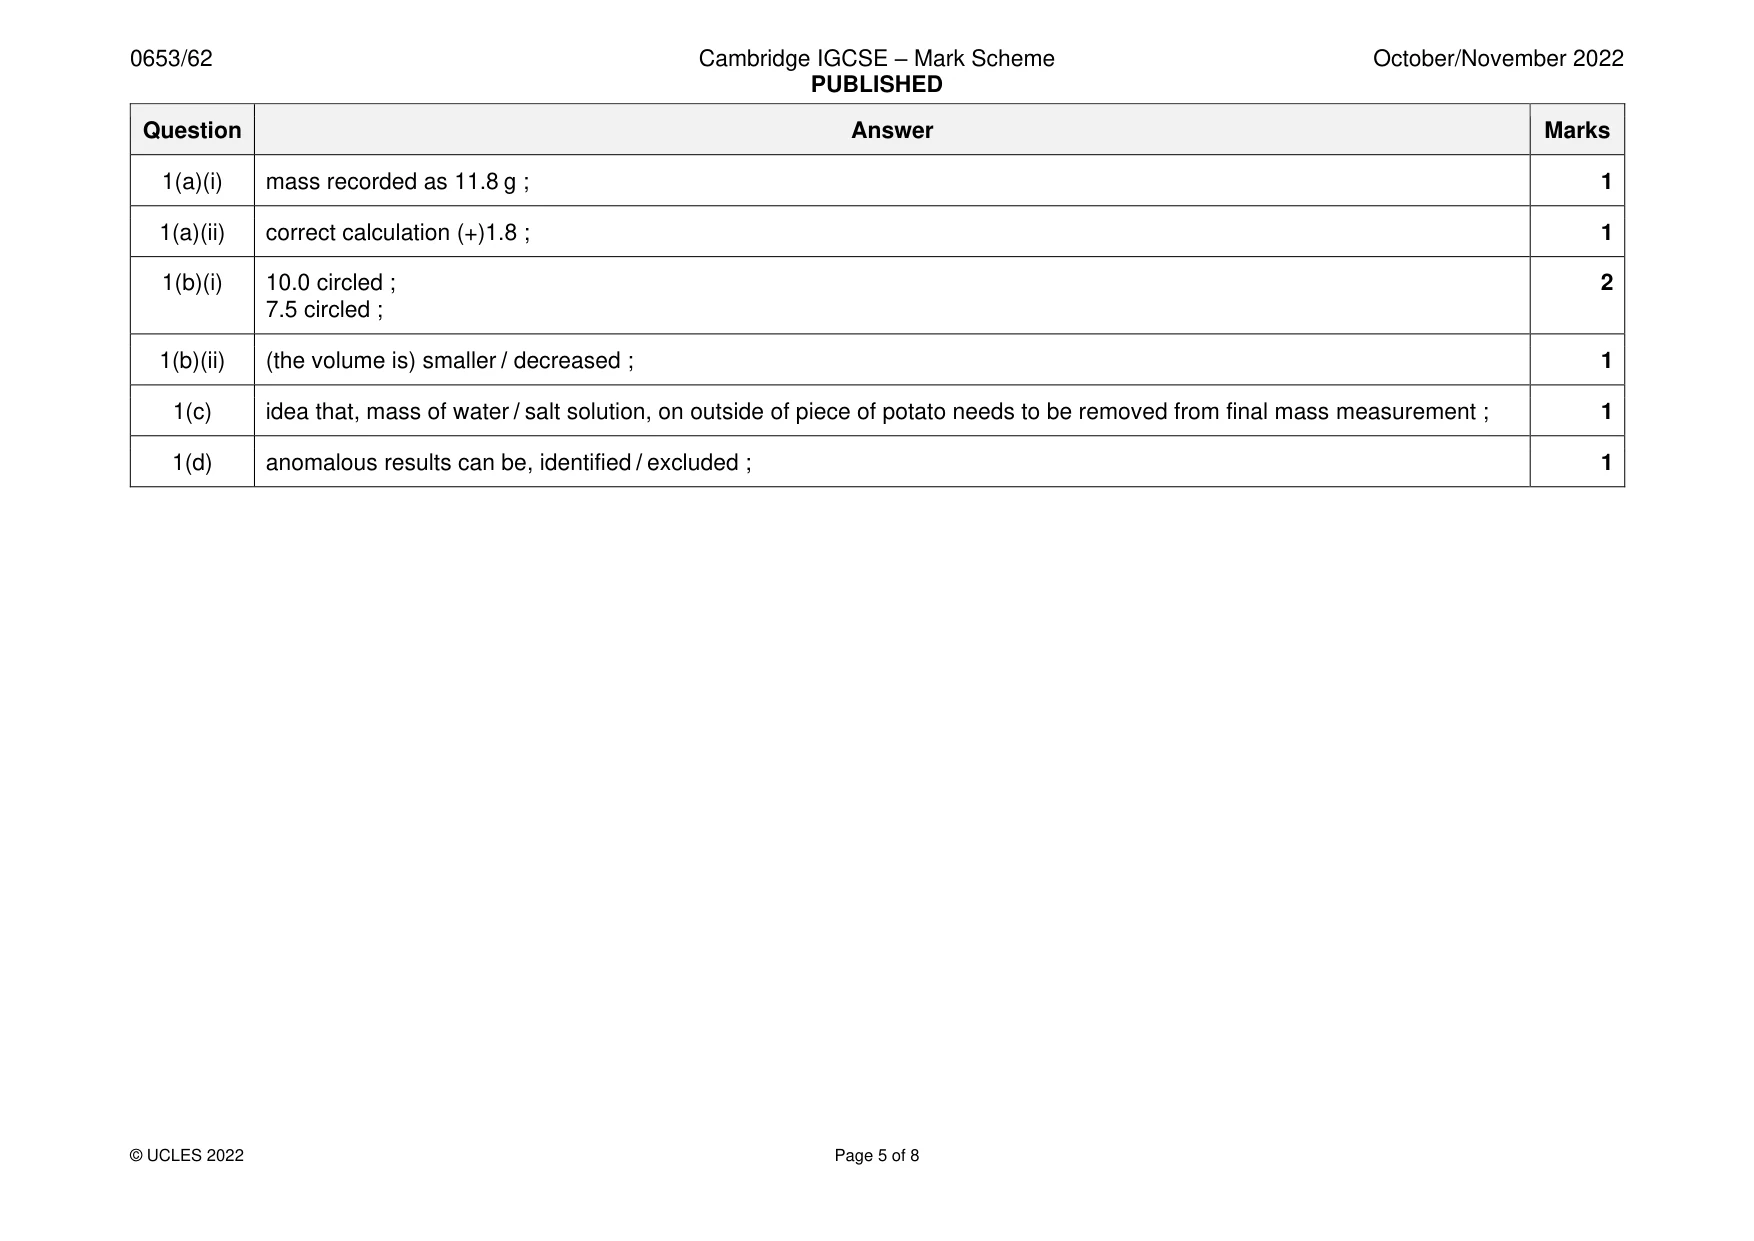
Mark scheme: Question Answer Marks 1(a)(i) mass recorded as 11.8 g ; 1 1(a)(ii) correct calculation (+)1.8 ; 1 1(b)(i) 10.0 circled ; 2 7.5 circled ; 1(b)(ii) (the volume is) smaller / decreased ; 1 1(c) idea that, mass of water / salt solution, on outside of piece of potato needs to be removed from final mass measurement ; 1 1(d) anomalous results can be, identified / excluded ; 1
Q2 · The pulse rate of a person increases during exercise
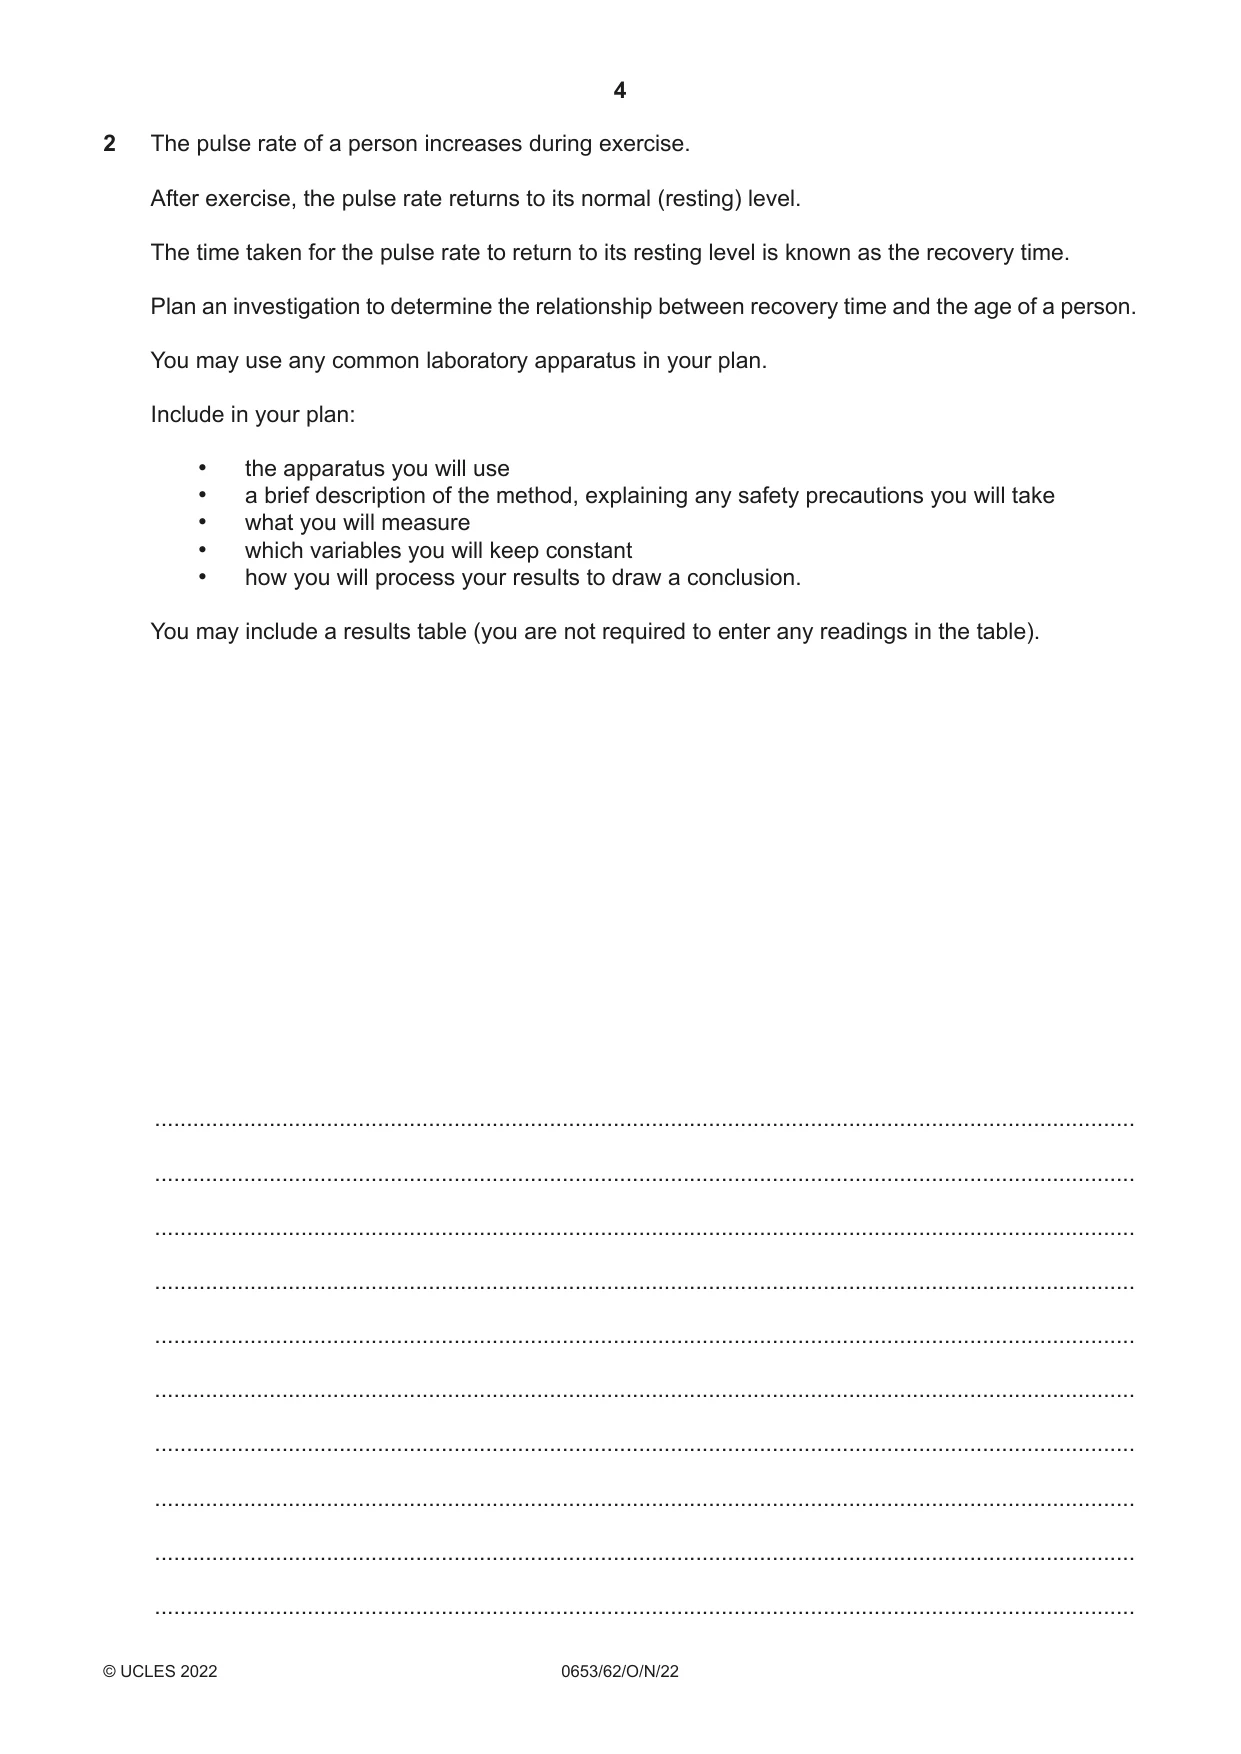
2 The pulse rate of a person increases during exercise. After exercise, the pulse rate returns to its normal (resting) level. The time taken for the pulse rate to return to its resting level is known as the recovery time. Plan an investigation to determine the relationship between recovery time and the age of a person. You may use any common laboratory apparatus in your plan. Include in your plan: • the apparatus you will use • a brief description of the method, explaining any safety precautions you will take • what you will measure • which variables you will keep constant • how you will process your results to draw a conclusion. You may include a results table (you are not required to enter any readings in the table). .......................................................................................................................................................... .......................................................................................................................................................... .......................................................................................................................................................... .......................................................................................................................................................... .......................................................................................................................................................... .......................................................................................................................................................... .......................................................................................................................................................... .......................................................................................................................................................... .......................................................................................................................................................... .......................................................................................................................................................... .......................................................................................................................................................... .......................................................................................................................................................... .......................................................................................................................................................... .......................................................................................................................................................... .......................................................................................................................................................... .................................................................................................................................................... [7]
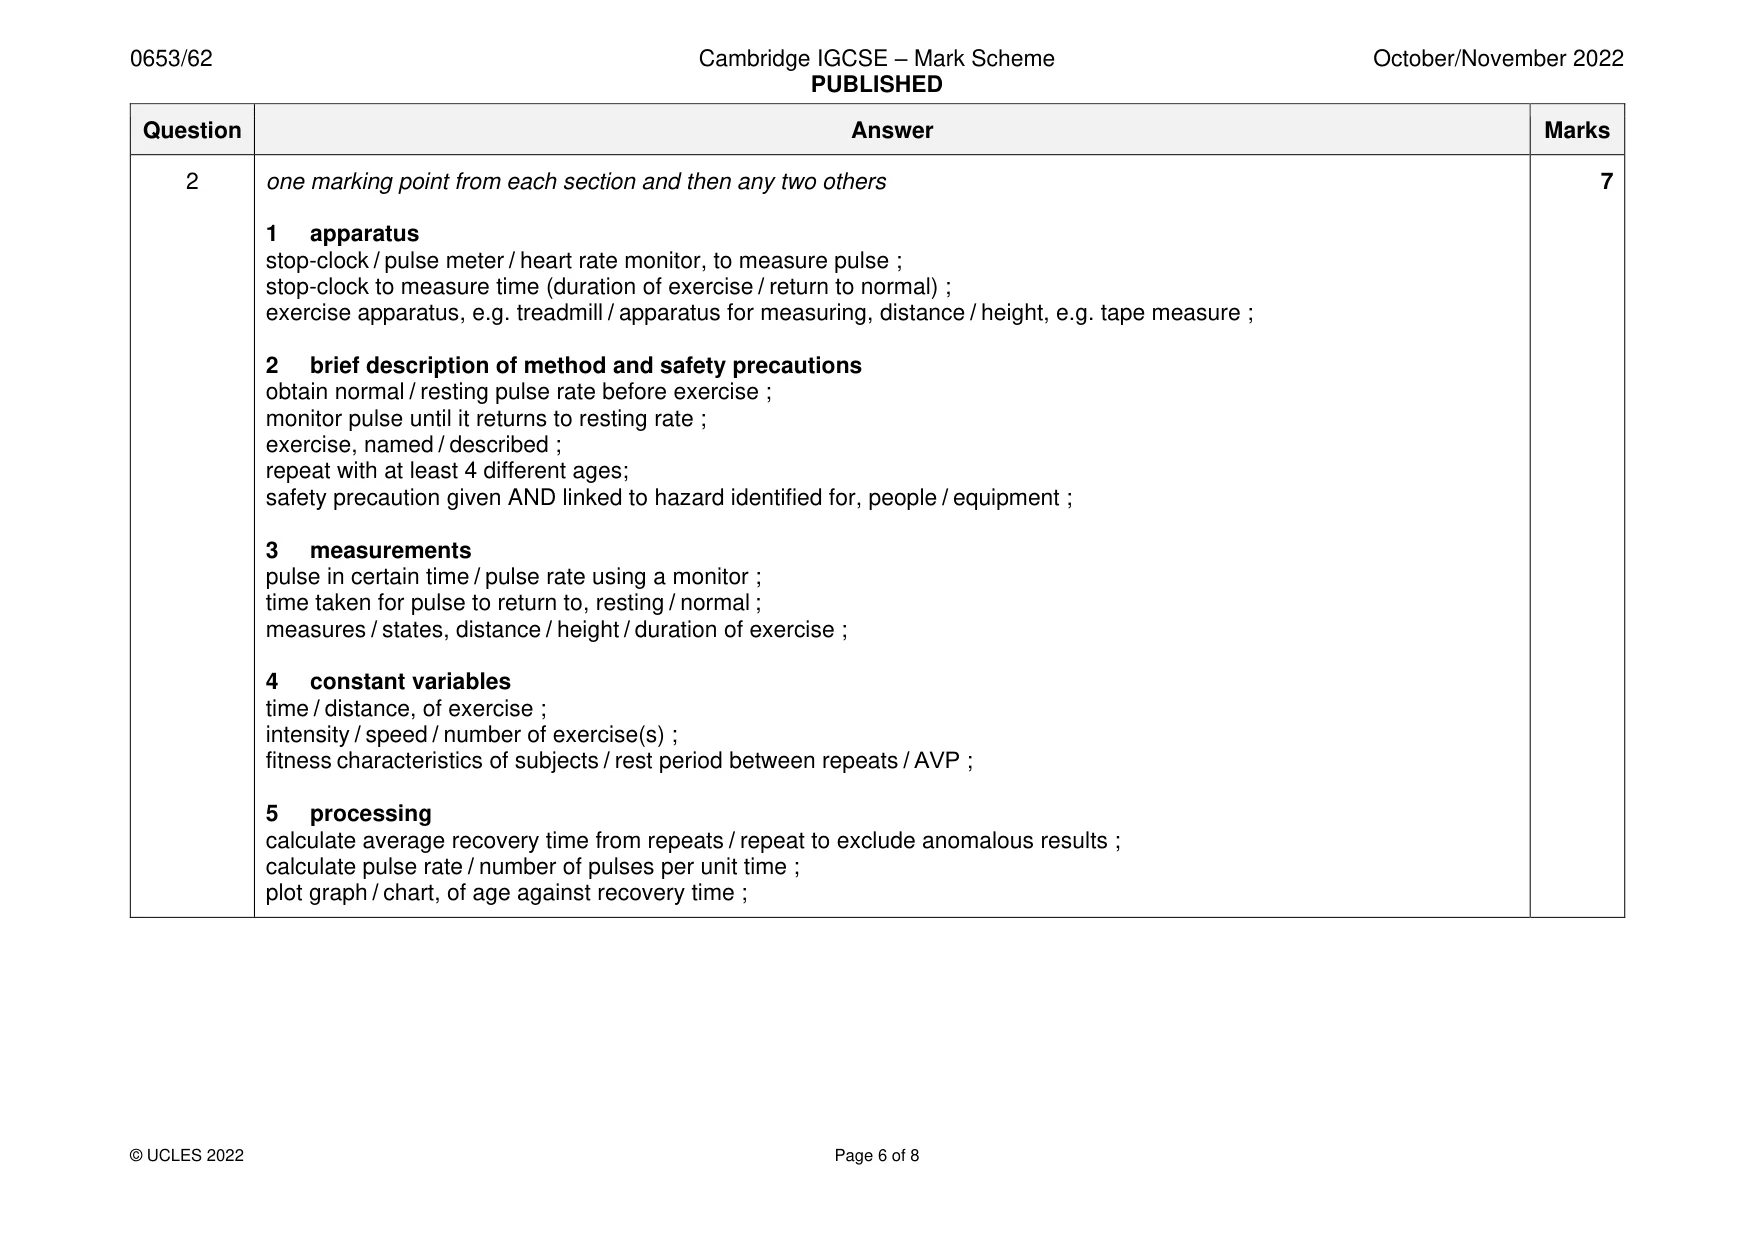
Mark scheme: 2 one marking point from each section and then any two others 7 1 apparatus stop-clock / pulse meter / heart rate monitor, to measure pulse ; stop-clock to measure time (duration of exercise / return to normal) ; exercise apparatus, e.g. treadmill / apparatus for measuring, distance / height, e.g. tape measure ; 2 brief description of method and safety precautions obtain normal / resting pulse rate before exercise ; monitor pulse until it returns to resting rate ; exercise, named / described ; repeat with at least 4 different ages; safety precaution given AND linked to hazard identified for, people / equipment ; 3 measurements pulse in certain time / pulse rate using a monitor ; time taken for pulse to return to, resting / normal ; measures / states, distance / height / duration of exercise ; 4 constant variables time / distance, of exercise ; intensity / speed / number of exercise(s) ; fitness characteristics of subjects / rest period between repeats / AVP ; 5 processing calculate average recovery time from repeats / repeat to exclude anomalous results ; calculate pulse rate / number of pulses per unit time ; plot graph / chart, of age against recovery time ;
Q3 · A student investigates some properties of sodium carbonate
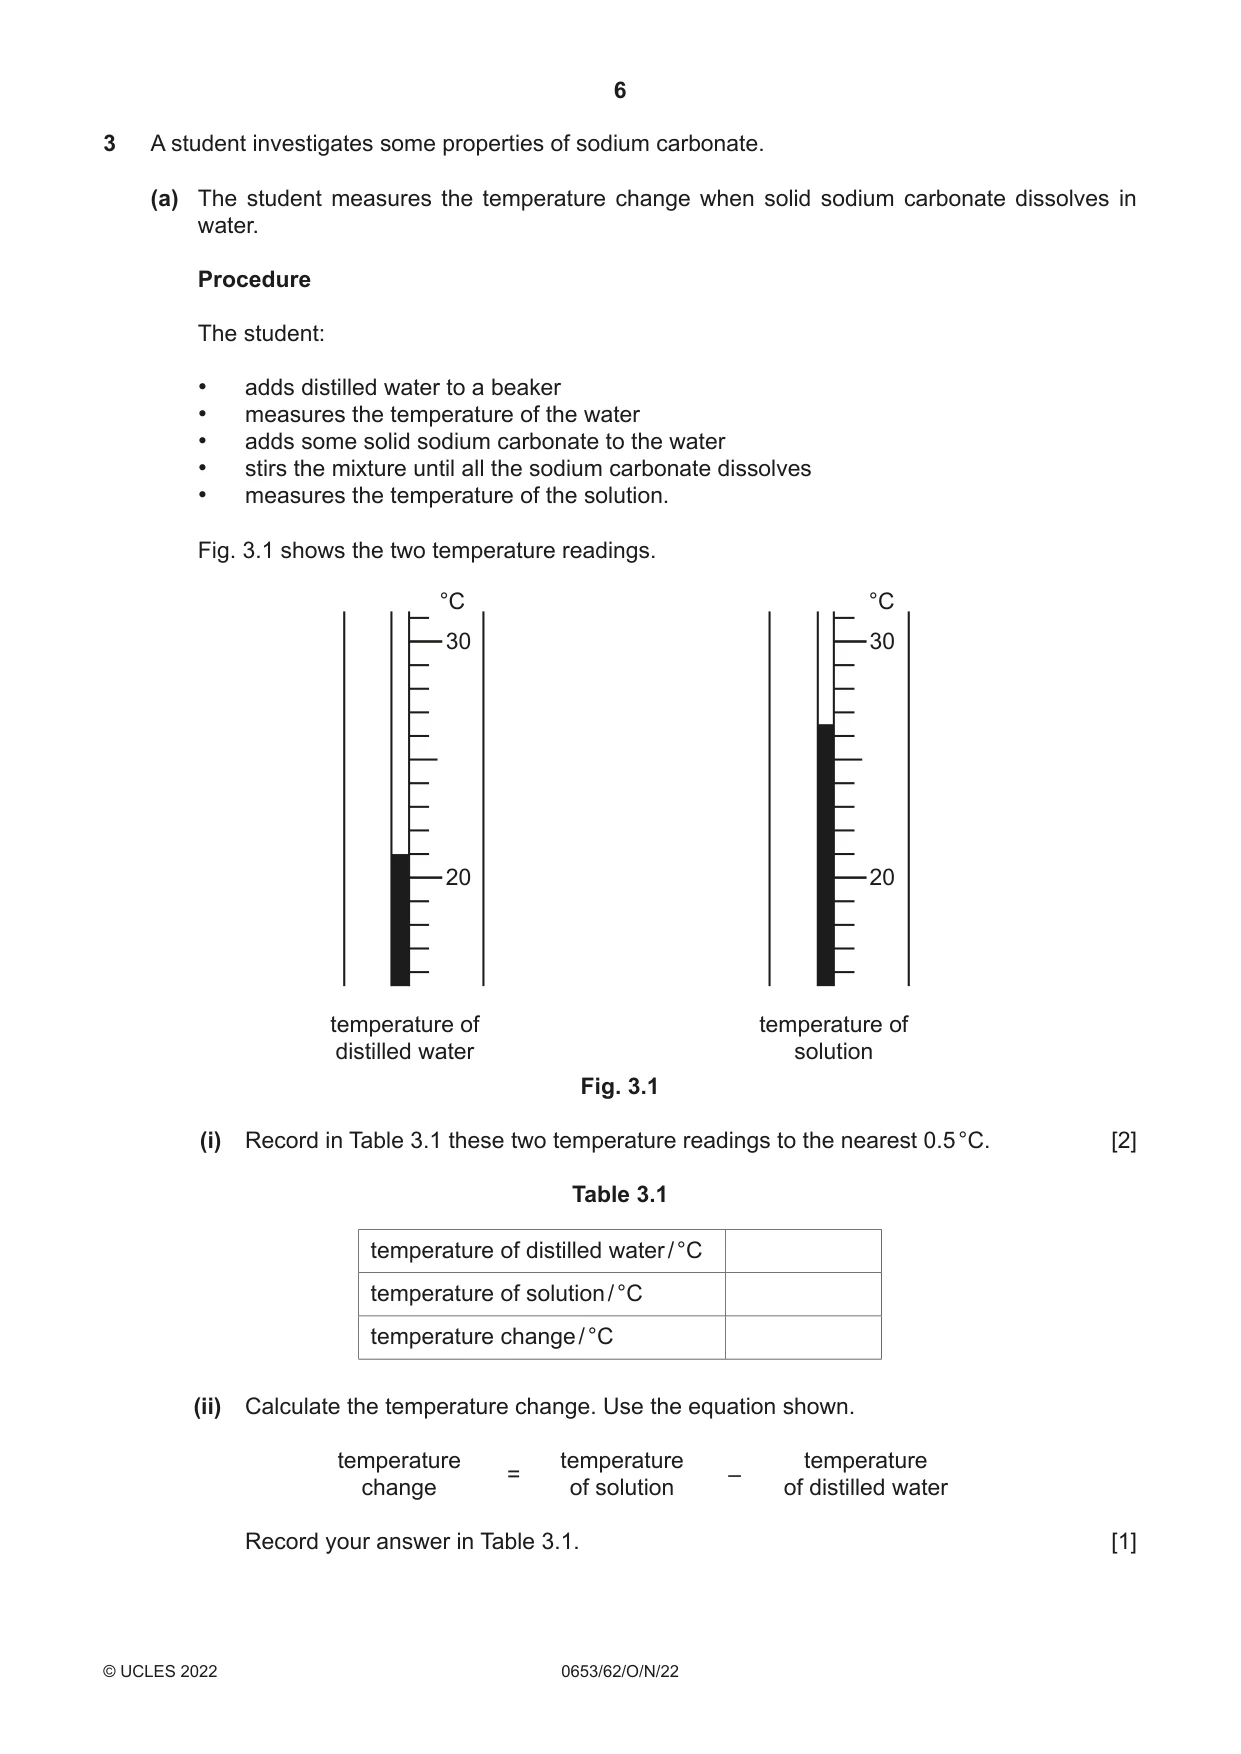
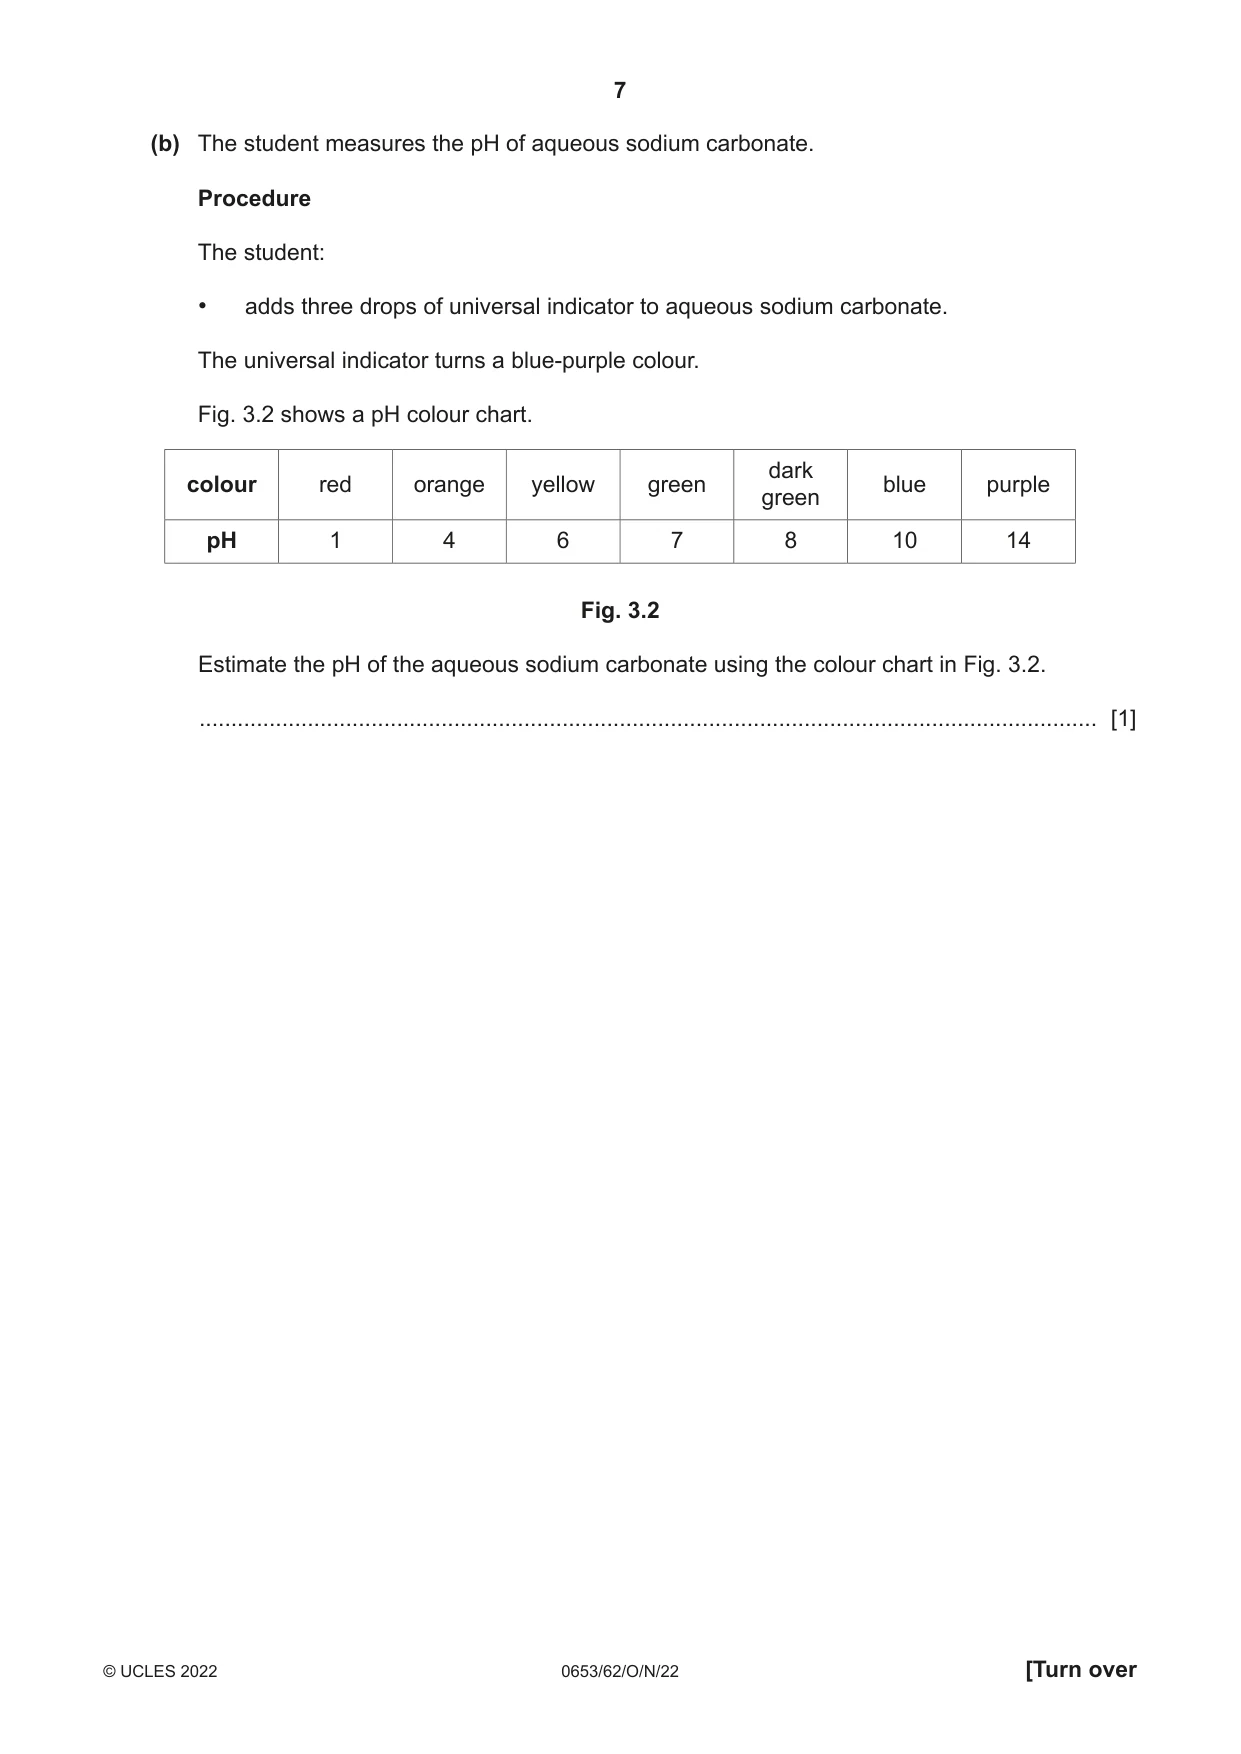
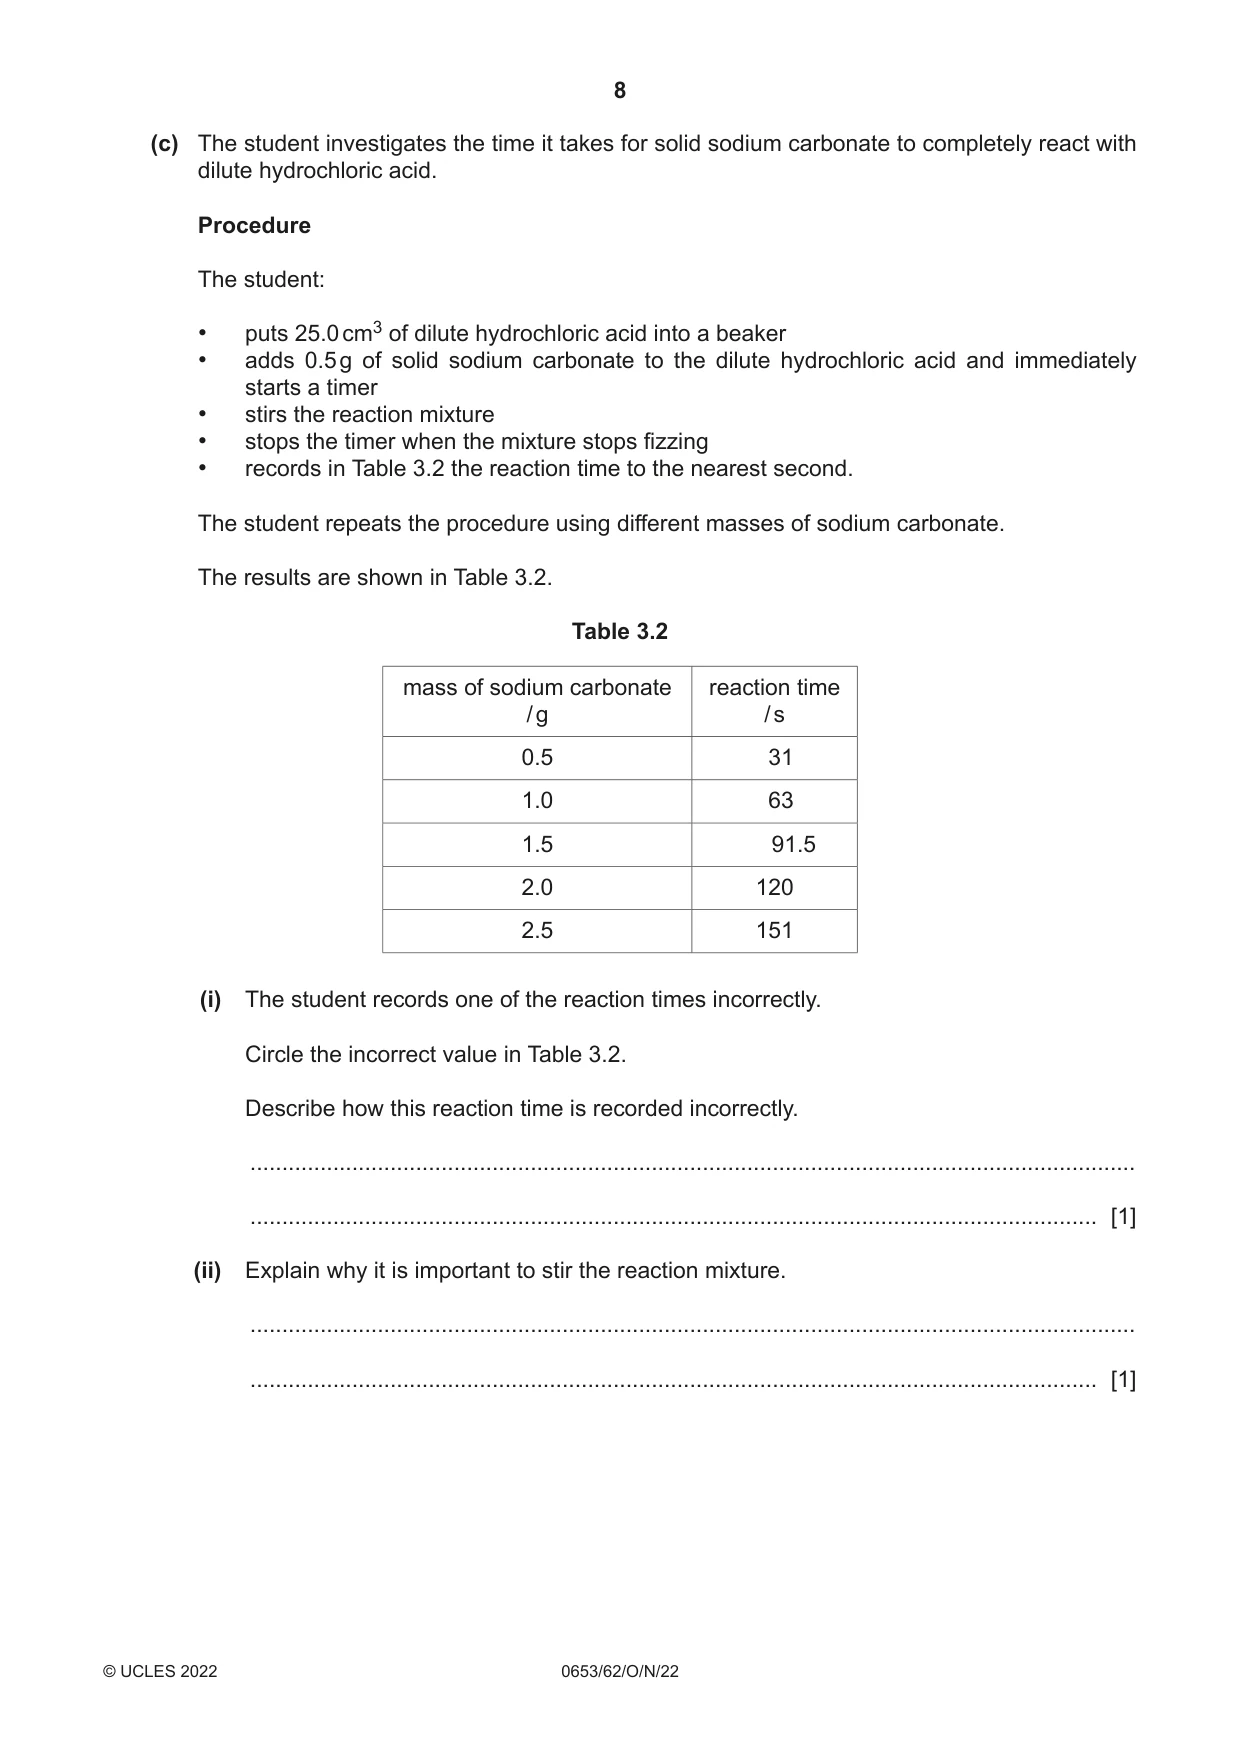
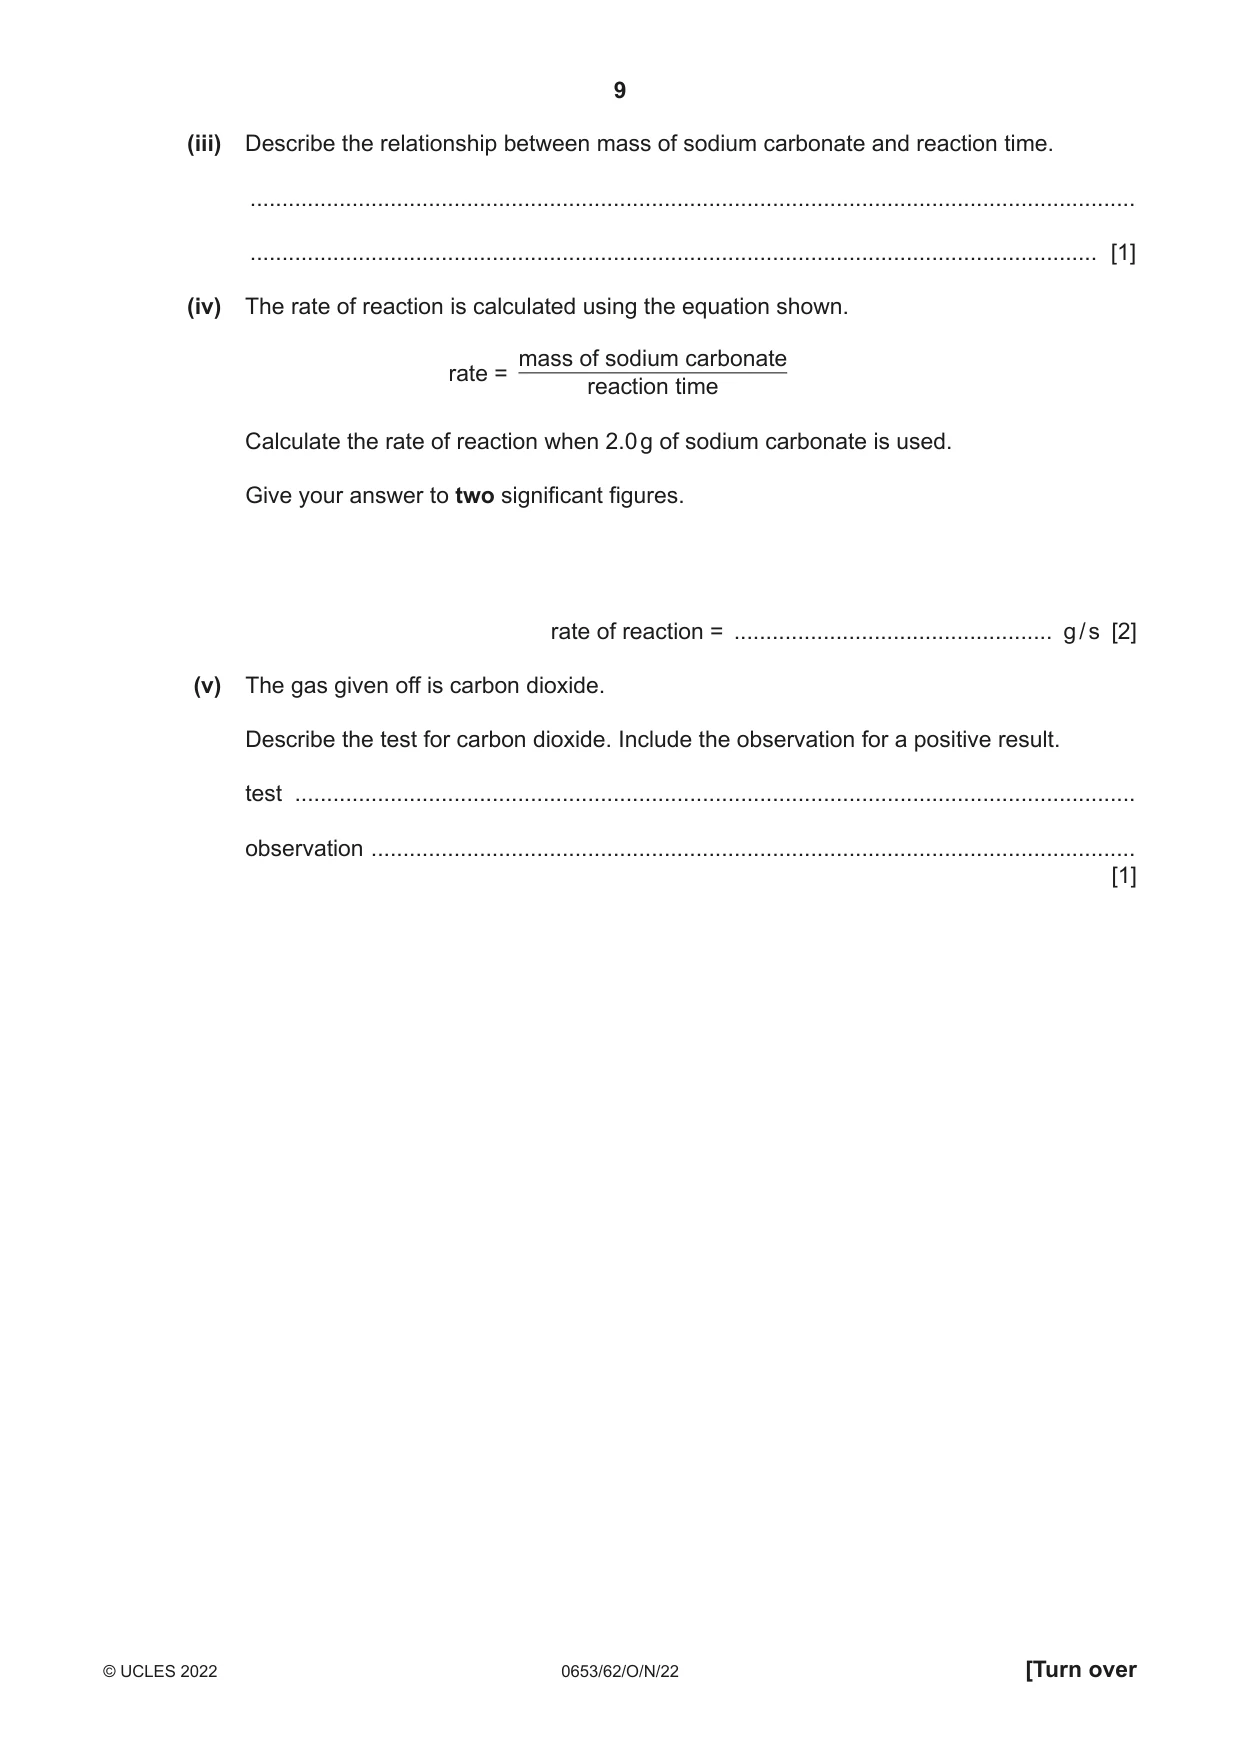
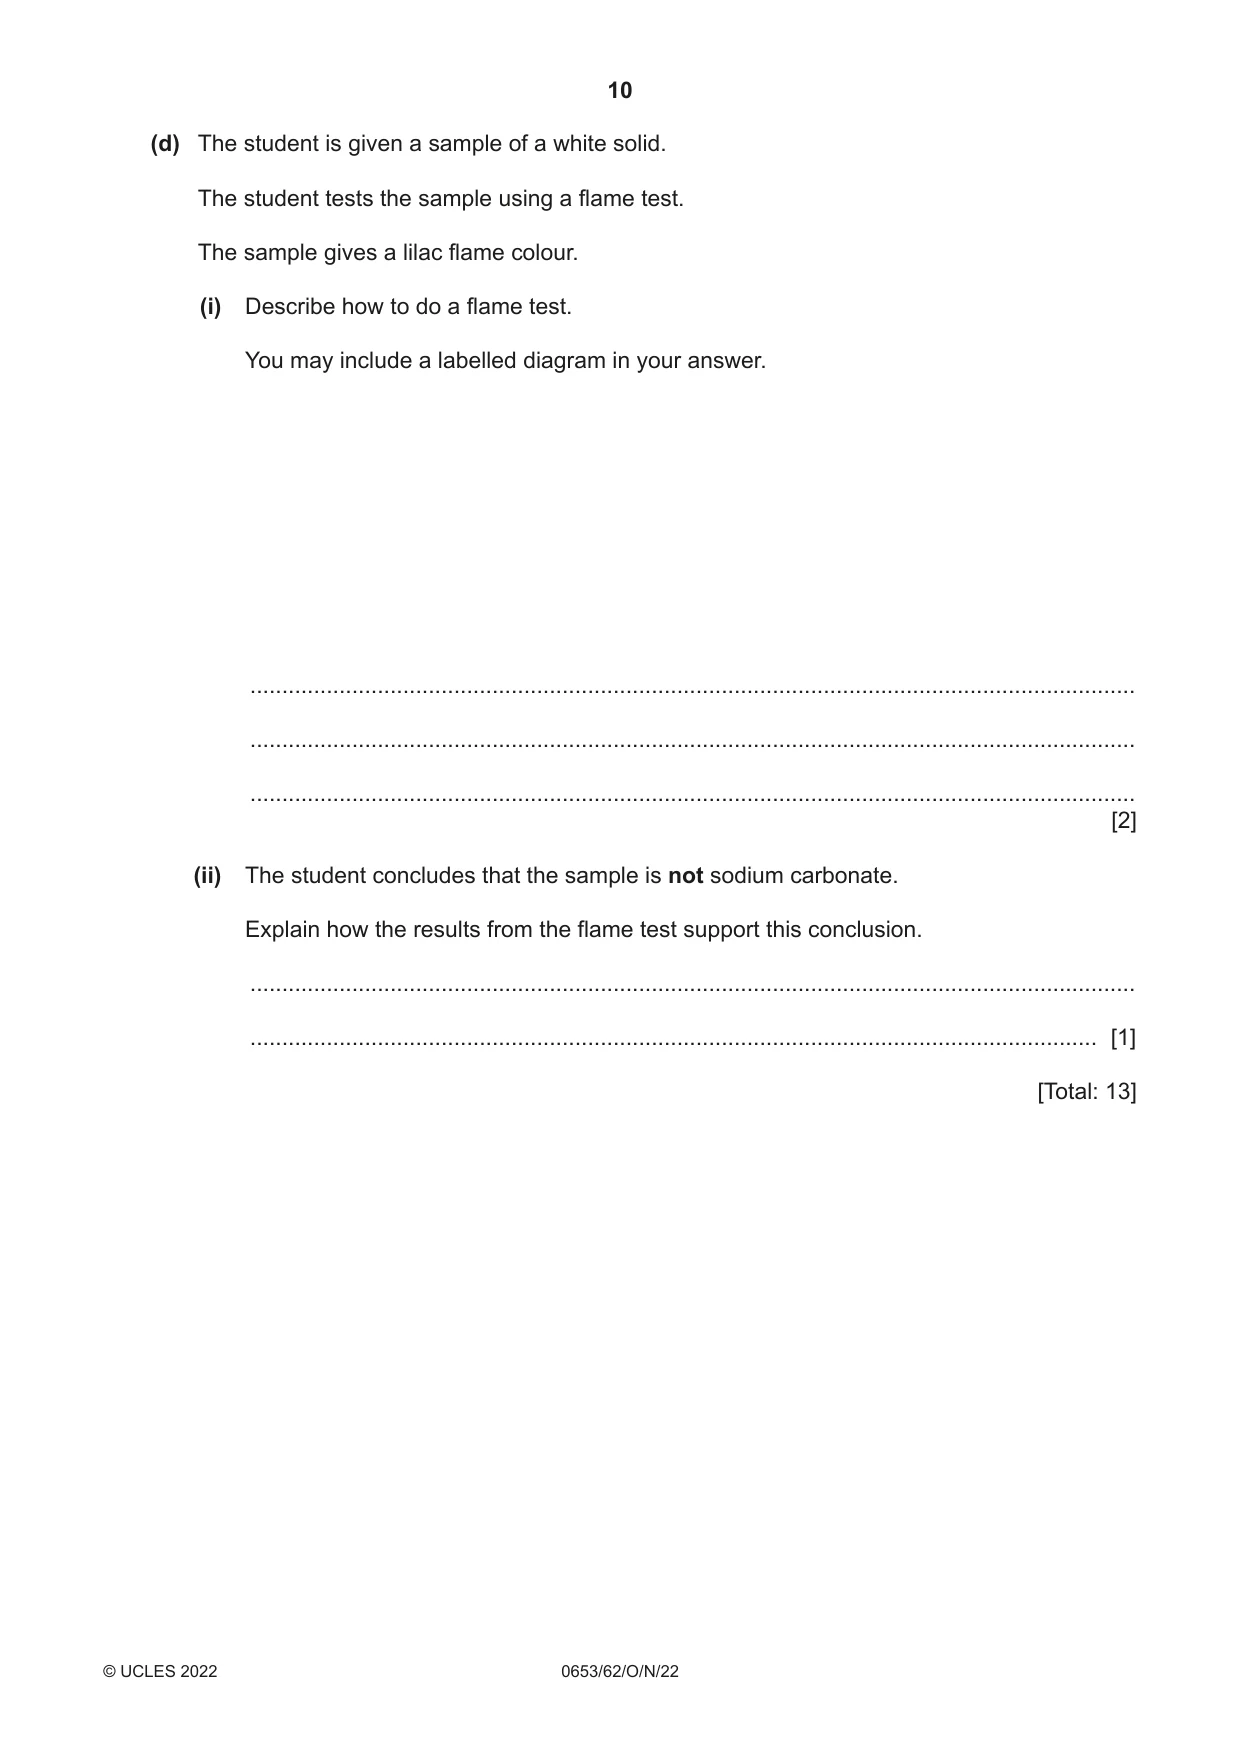
3 A student investigates some properties of sodium carbonate. (a) The student measures the temperature change when solid sodium carbonate dissolves in water. Procedure The student: • adds distilled water to a beaker • measures the temperature of the water • adds some solid sodium carbonate to the water • stirs the mixture until all the sodium carbonate dissolves • measures the temperature of the solution. Fig. 3.1 shows the two temperature readings. °C °C 30 30 20 20 temperature of temperature of distilled water solution Fig. 3.1 (i) Record in Table 3.1 these two temperature readings to the nearest 0.5 °C. [2] Table 3.1 temperature of distilled water / °C temperature of solution / °C temperature change / °C (ii) Calculate the temperature change. Use the equation shown. temperature temperature temperature = – change of solution of distilled water Record your answer in Table 3.1. [1] (b) The student measures the pH of aqueous sodium carbonate. Procedure The student: • adds three drops of universal indicator to aqueous sodium carbonate. The universal indicator turns a blue-purple colour. Fig. 3.2 shows a pH colour chart. dark colour red orange yellow green blue purple green pH 1 4 6 7 8 10 14 Fig. 3.2 Estimate the pH of the aqueous sodium carbonate using the colour chart in Fig. 3.2. ............................................................................................................................................. [1] (c) The student investigates the time it takes for solid sodium carbonate to completely react with dilute hydrochloric acid. Procedure The student: • puts 25.0 cm3 of dilute hydrochloric acid into a beaker • adds 0.5 g of solid sodium carbonate to the dilute hydrochloric acid and immediately starts a timer • stirs the reaction mixture • stops the timer when the mixture stops fizzing • records in Table 3.2 the reaction time to the nearest second. The student repeats the procedure using different masses of sodium carbonate. The results are shown in Table 3.2. Table 3.2 mass of sodium carbonate reaction time / g / s 0.5 31 1.0 63 1.5 91.5 2.0 120 2.5 151 (i) The student records one of the reaction times incorrectly. Circle the incorrect value in Table 3.2. Describe how this reaction time is recorded incorrectly. ........................................................................................................................................... ..................................................................................................................................... [1] (ii) Explain why it is important to stir the reaction mixture. ........................................................................................................................................... ..................................................................................................................................... [1] (iii) Describe the relationship between mass of sodium carbonate and reaction time. ........................................................................................................................................... ..................................................................................................................................... [1] (iv) The rate of reaction is calculated using the equation shown. mass of sodium carbonate rate = reaction time Calculate the rate of reaction when 2.0 g of sodium carbonate is used. Give your answer to two significant figures. rate of reaction = .................................................. g / s [2] (v) The gas given off is carbon dioxide. Describe the test for carbon dioxide. Include the observation for a positive result. test .................................................................................................................................... observation ........................................................................................................................ [1] (d) The student is given a sample of a white solid. The student tests the sample using a flame test. The sample gives a lilac flame colour. (i) Describe how to do a flame test. You may include a labelled diagram in your answer. ........................................................................................................................................... ........................................................................................................................................... ........................................................................................................................................... [2] (ii) The student concludes that the sample is not sodium carbonate. Explain how the results from the flame test support this conclusion. ........................................................................................................................................... ..................................................................................................................................... [1] [Total: 13]
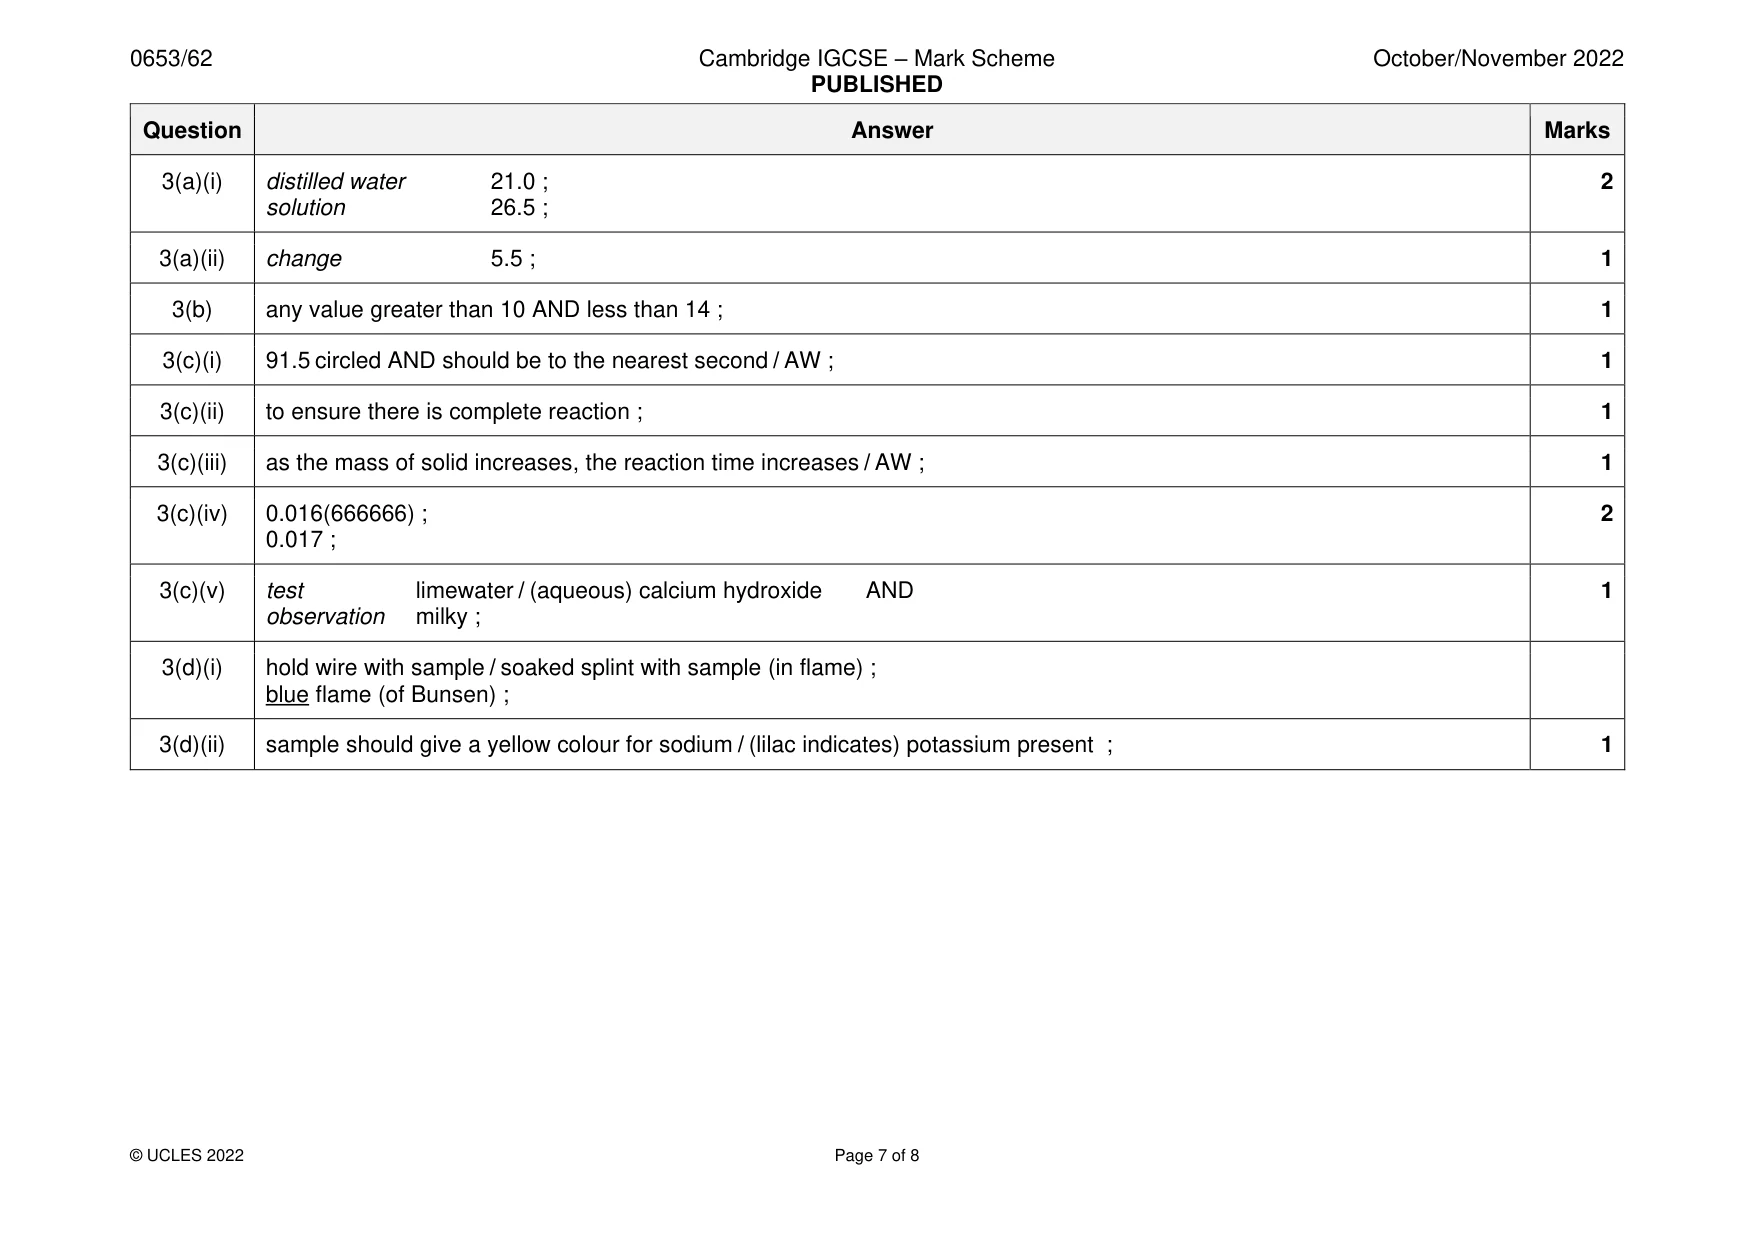
Mark scheme: 3(a)(i) distilled water 21.0 ; 2 solution 26.5 ; 3(a)(ii) change 5.5 ; 1 3(b) any value greater than 10 AND less than 14 ; 1 3(c)(i) 91.5 circled AND should be to the nearest second / AW ; 1 3(c)(ii) to ensure there is complete reaction ; 1 3(c)(iii) as the mass of solid increases, the reaction time increases / AW ; 1 3(c)(iv) 0.016(666666) ; 2 0.017 ; 3(c)(v) test limewater / (aqueous) calcium hydroxide AND 1 observation milky ; 3(d)(i) hold wire with sample / soaked splint with sample (in flame) ; blue flame (of Bunsen) ; 3(d)(ii) sample should give a yellow colour for sodium / (lilac indicates) potassium present ; 1
Q4 · A student makes a toy parachute by attaching a paper circle to an object using four…
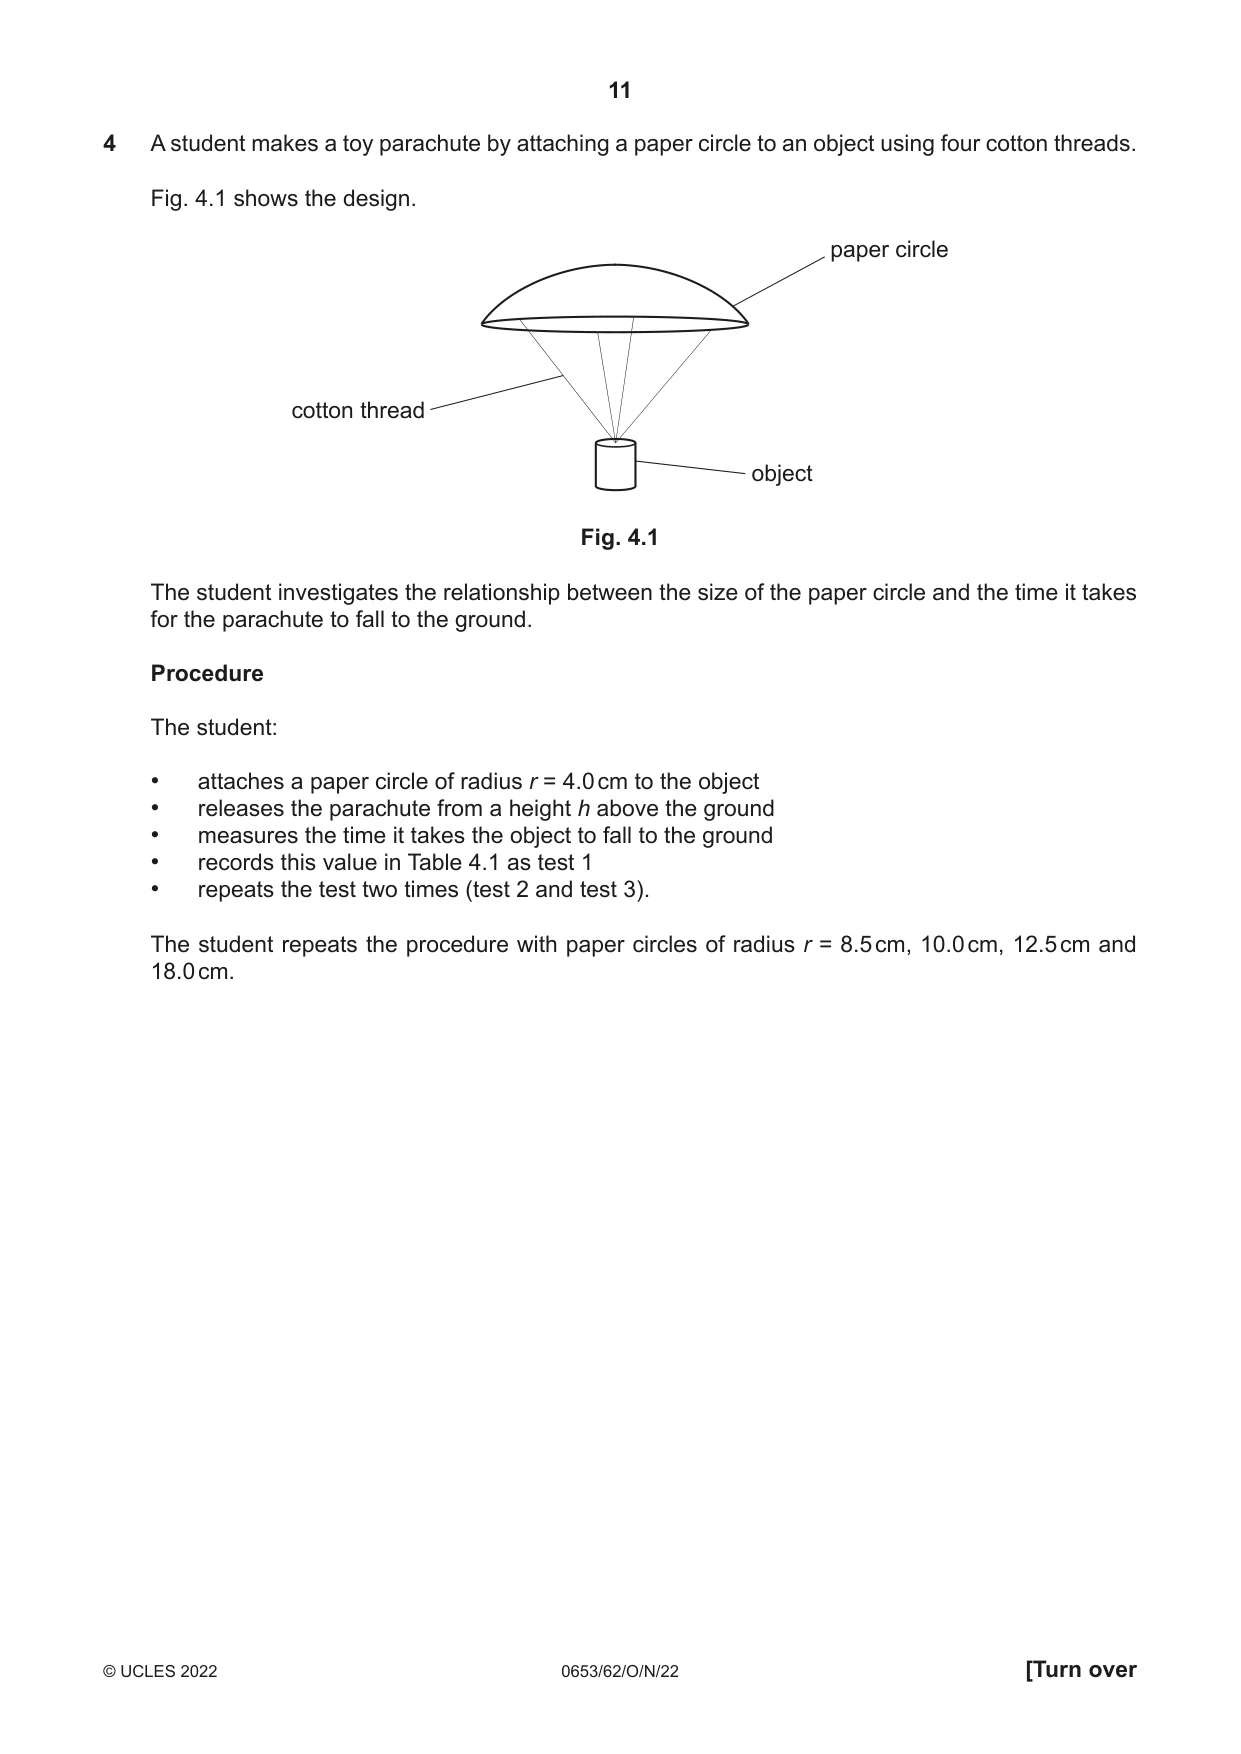
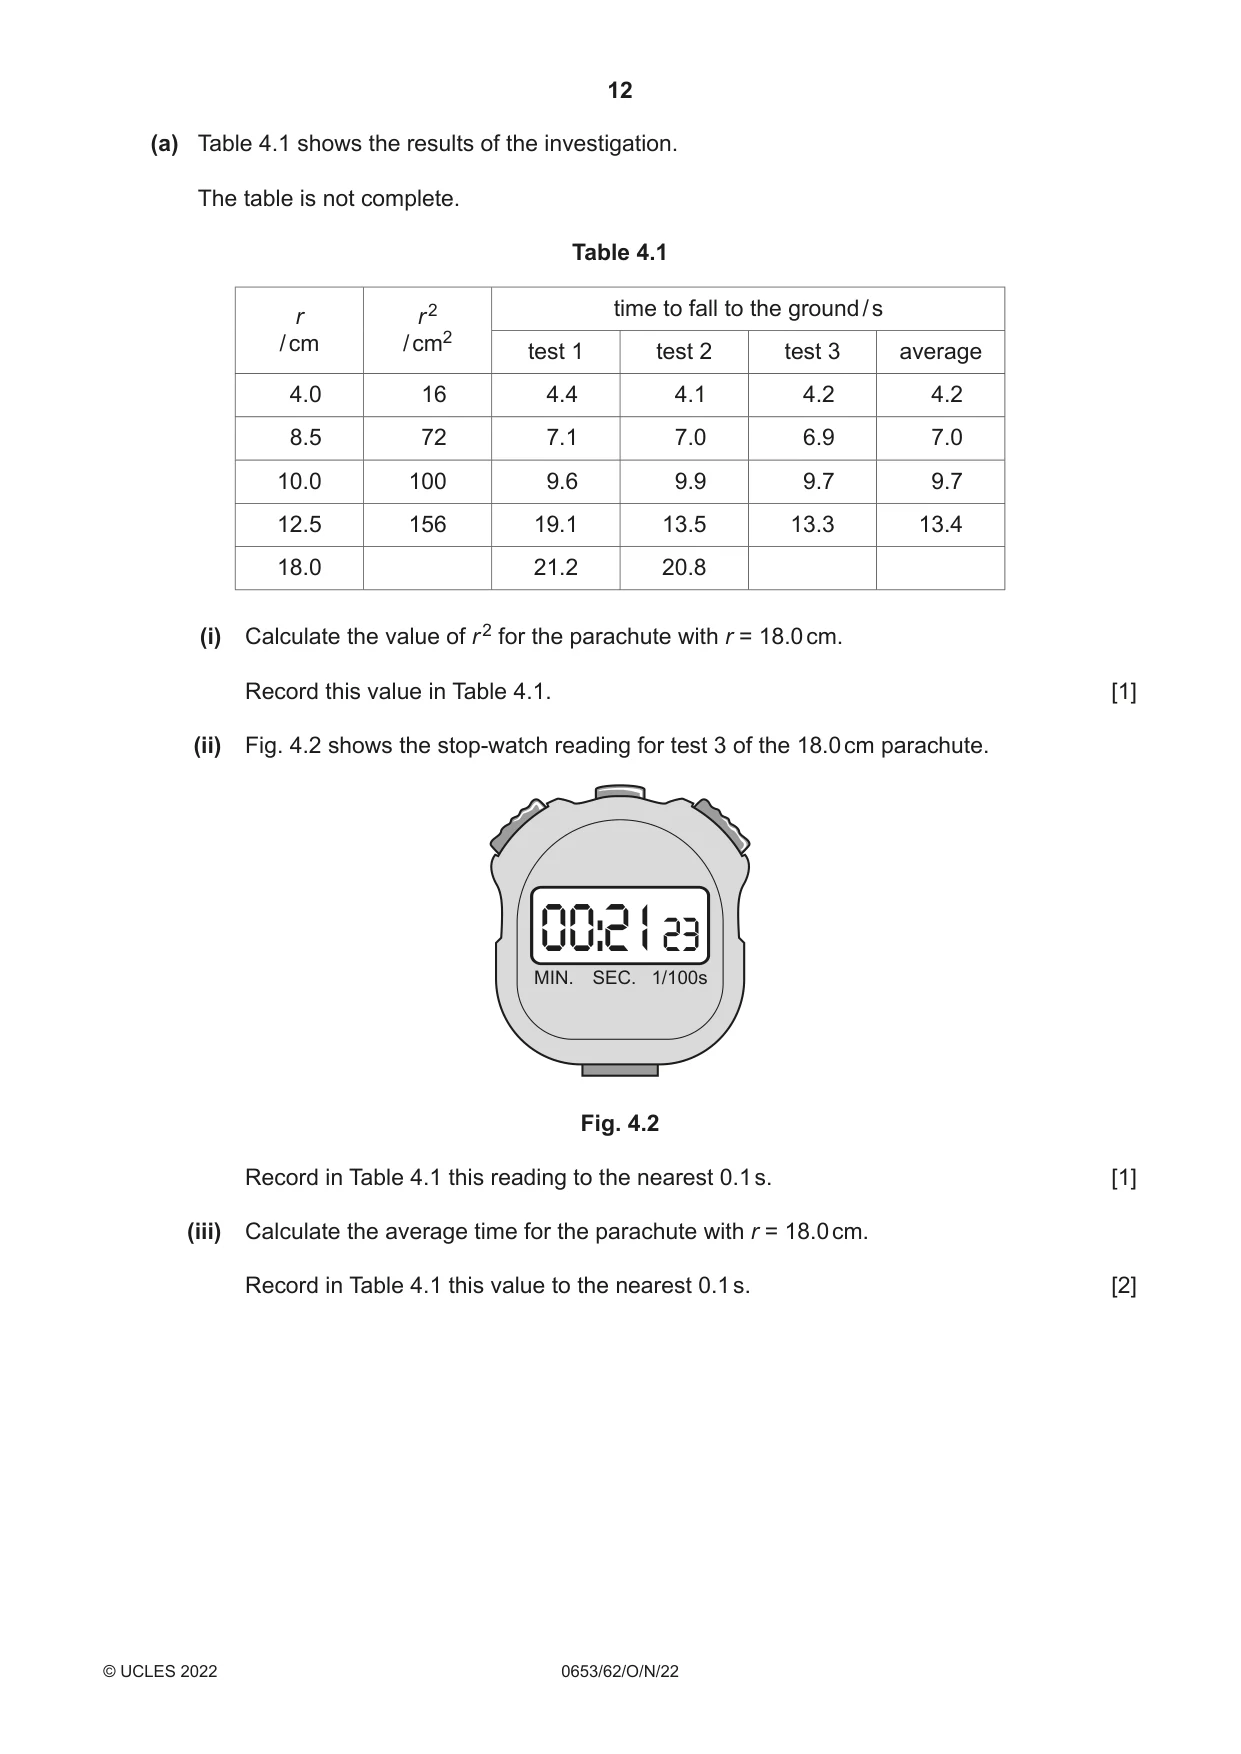
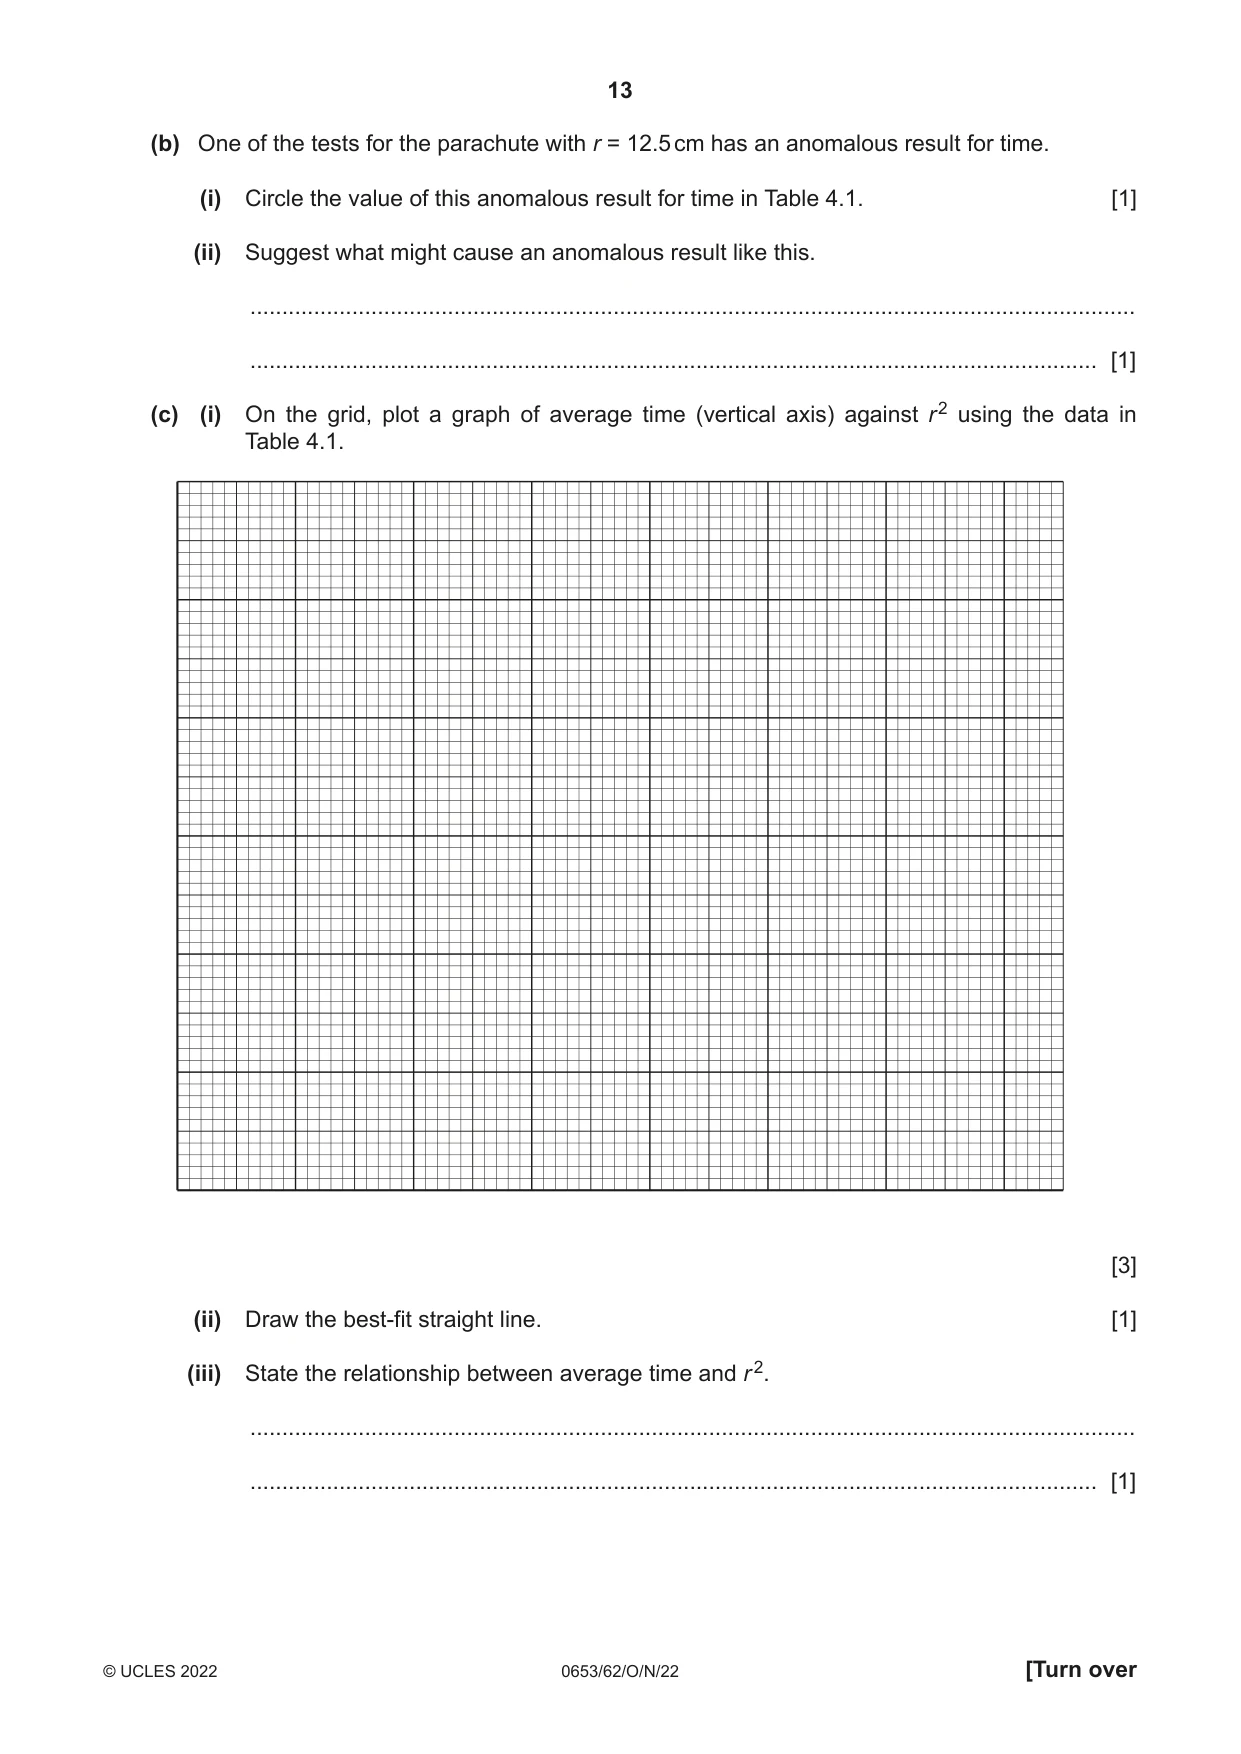
4 A student makes a toy parachute by attaching a paper circle to an object using four cotton threads. Fig. 4.1 shows the design. paper circle cotton thread object Fig. 4.1 The student investigates the relationship between the size of the paper circle and the time it takes for the parachute to fall to the ground. Procedure The student: • attaches a paper circle of radius r = 4.0 cm to the object • releases the parachute from a height h above the ground • measures the time it takes the object to fall to the ground • records this value in Table 4.1 as test 1 • repeats the test two times (test 2 and test 3). The student repeats the procedure with paper circles of radius r = 8.5 cm, 10.0 cm, 12.5 cm and 18.0 cm. (a) Table 4.1 shows the results of the investigation. The table is not complete. Table 4.1 2 time to fall to the ground / s r r / cm / cm2 test 1 test 2 test 3 average 4.0 16 4.4 4.1 4.2 4.2 8.5 72 7.1 7.0 6.9 7.0 10.0 100 9.6 9.9 9.7 9.7 12.5 156 19.1 13.5 13.3 13.4 18.0 21.2 20.8 (i) Calculate the value of r 2 for the parachute with r = 18.0 cm. Record this value in Table 4.1. [1] (ii) Fig. 4.2 shows the stop-watch reading for test 3 of the 18.0 cm parachute. 00:2123 MIN. SEC. 1/100s Fig. 4.2 Record in Table 4.1 this reading to the nearest 0.1 s. [1] (iii) Calculate the average time for the parachute with r = 18.0 cm. Record in Table 4.1 this value to the nearest 0.1 s. [2] (b) One of the tests for the parachute with r = 12.5 cm has an anomalous result for time. (i) Circle the value of this anomalous result for time in Table 4.1. [1] (ii) Suggest what might cause an anomalous result like this. ........................................................................................................................................... ..................................................................................................................................... [1] (c) (i) On the grid, plot a graph of average time (vertical axis) against r 2 using the data in Table 4.1. [3] (ii) Draw the best-fit straight line. [1] (iii) State the relationship between average time and r 2. ........................................................................................................................................... ..................................................................................................................................... [1]
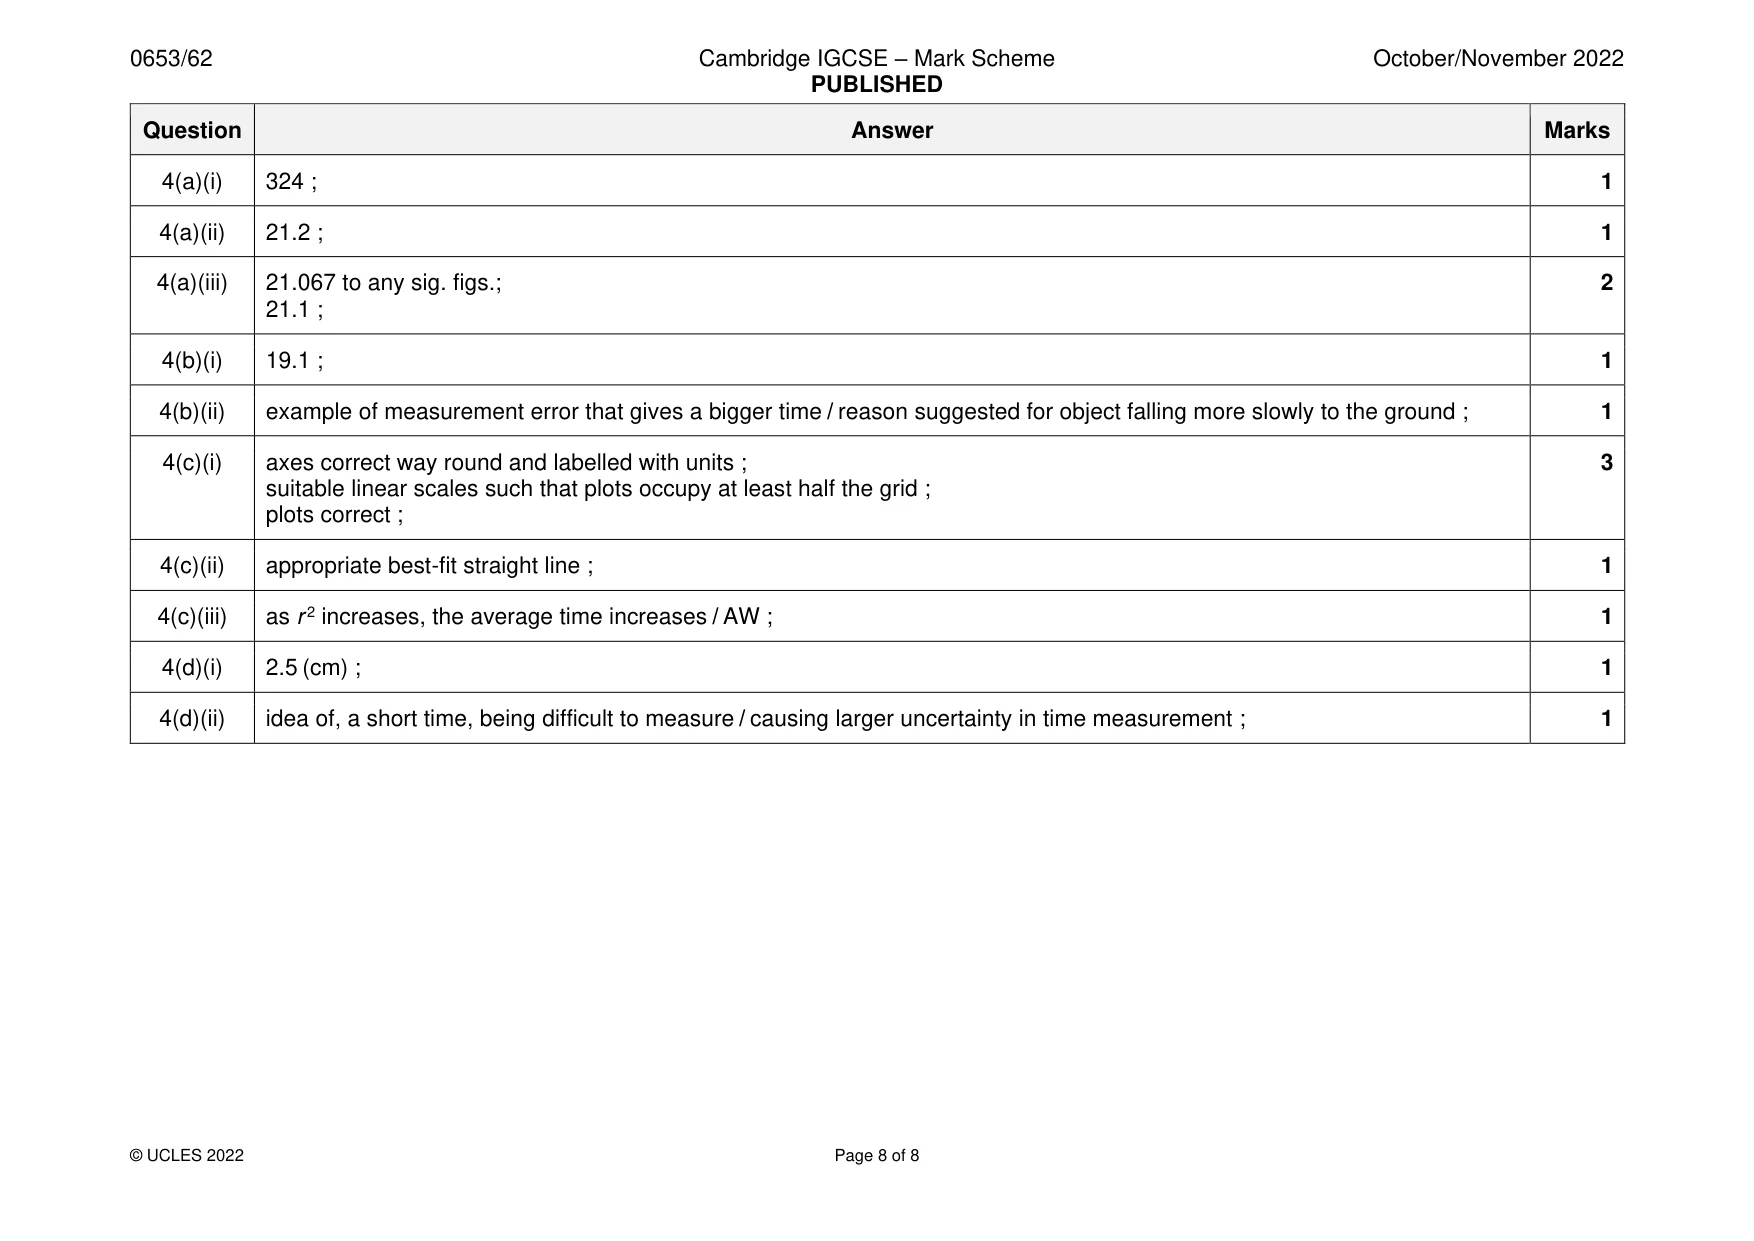
Mark scheme: 4(a)(i) 324 ; 1 4(a)(ii) 21.2 ; 1 4(a)(iii) 21.067 to any sig. figs.; 2 21.1 ; 4(b)(i) 19.1 ; 1 4(b)(ii) example of measurement error that gives a bigger time / reason suggested for object falling more slowly to the ground ; 1 4(c)(i) axes correct way round and labelled with units ; 3 suitable linear scales such that plots occupy at least half the grid ; plots correct ; 4(c)(ii) appropriate best-fit straight line ; 1 4(c)(iii) as r 2 increases, the average time increases / AW ; 1 4(d)(i) 2.5 (cm) ; 1 4(d)(ii) idea of, a short time, being difficult to measure / causing larger uncertainty in time measurement ; 1
What was in this paper
The subtopics covered by these 4 questions, and how many questions each got. Open one in a new tab to see every Cambridge question on it.
What you needed in this session
Cambridge’s own grade thresholds for 2022 Oct/Nov, Paper 6 · Variant 2. A higher threshold means an easier paper — the bar moves with how the cohort did.