Cambridge IGCSE Science - Combined 0653 — 2021 Oct/Nov Paper 6 · Variant 3
0653/63/O/N/21 · 4 questions · 40 marks · ≈45 min
The question paper and its mark scheme, free to read here and free to download. This is Cambridge’s own paper, exactly as it was sat.
Question paper16 pages



Mark scheme8 pages
Answers below. Sit the paper first if you are practising.
Questions as text
Q1 · A student investigates the effect of temperature on the amount of water lost (by…
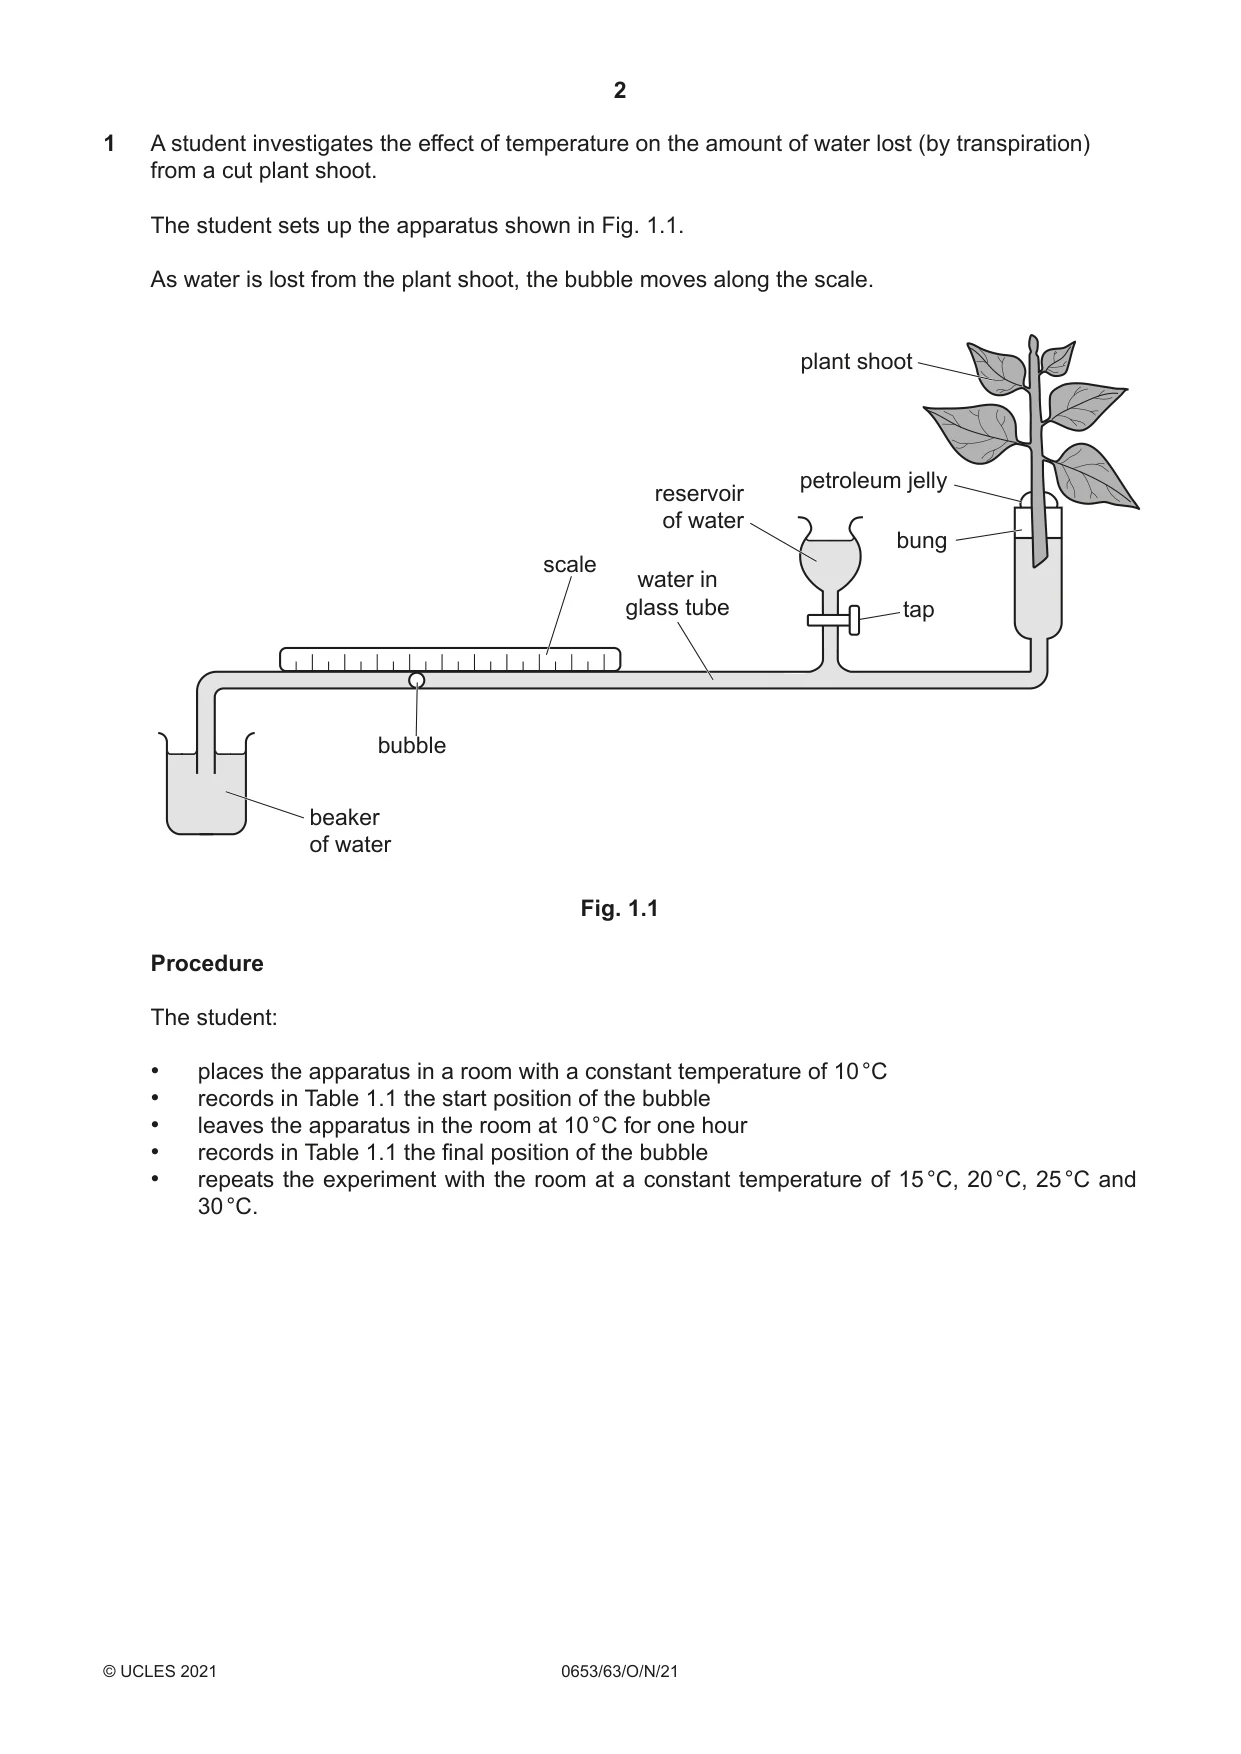
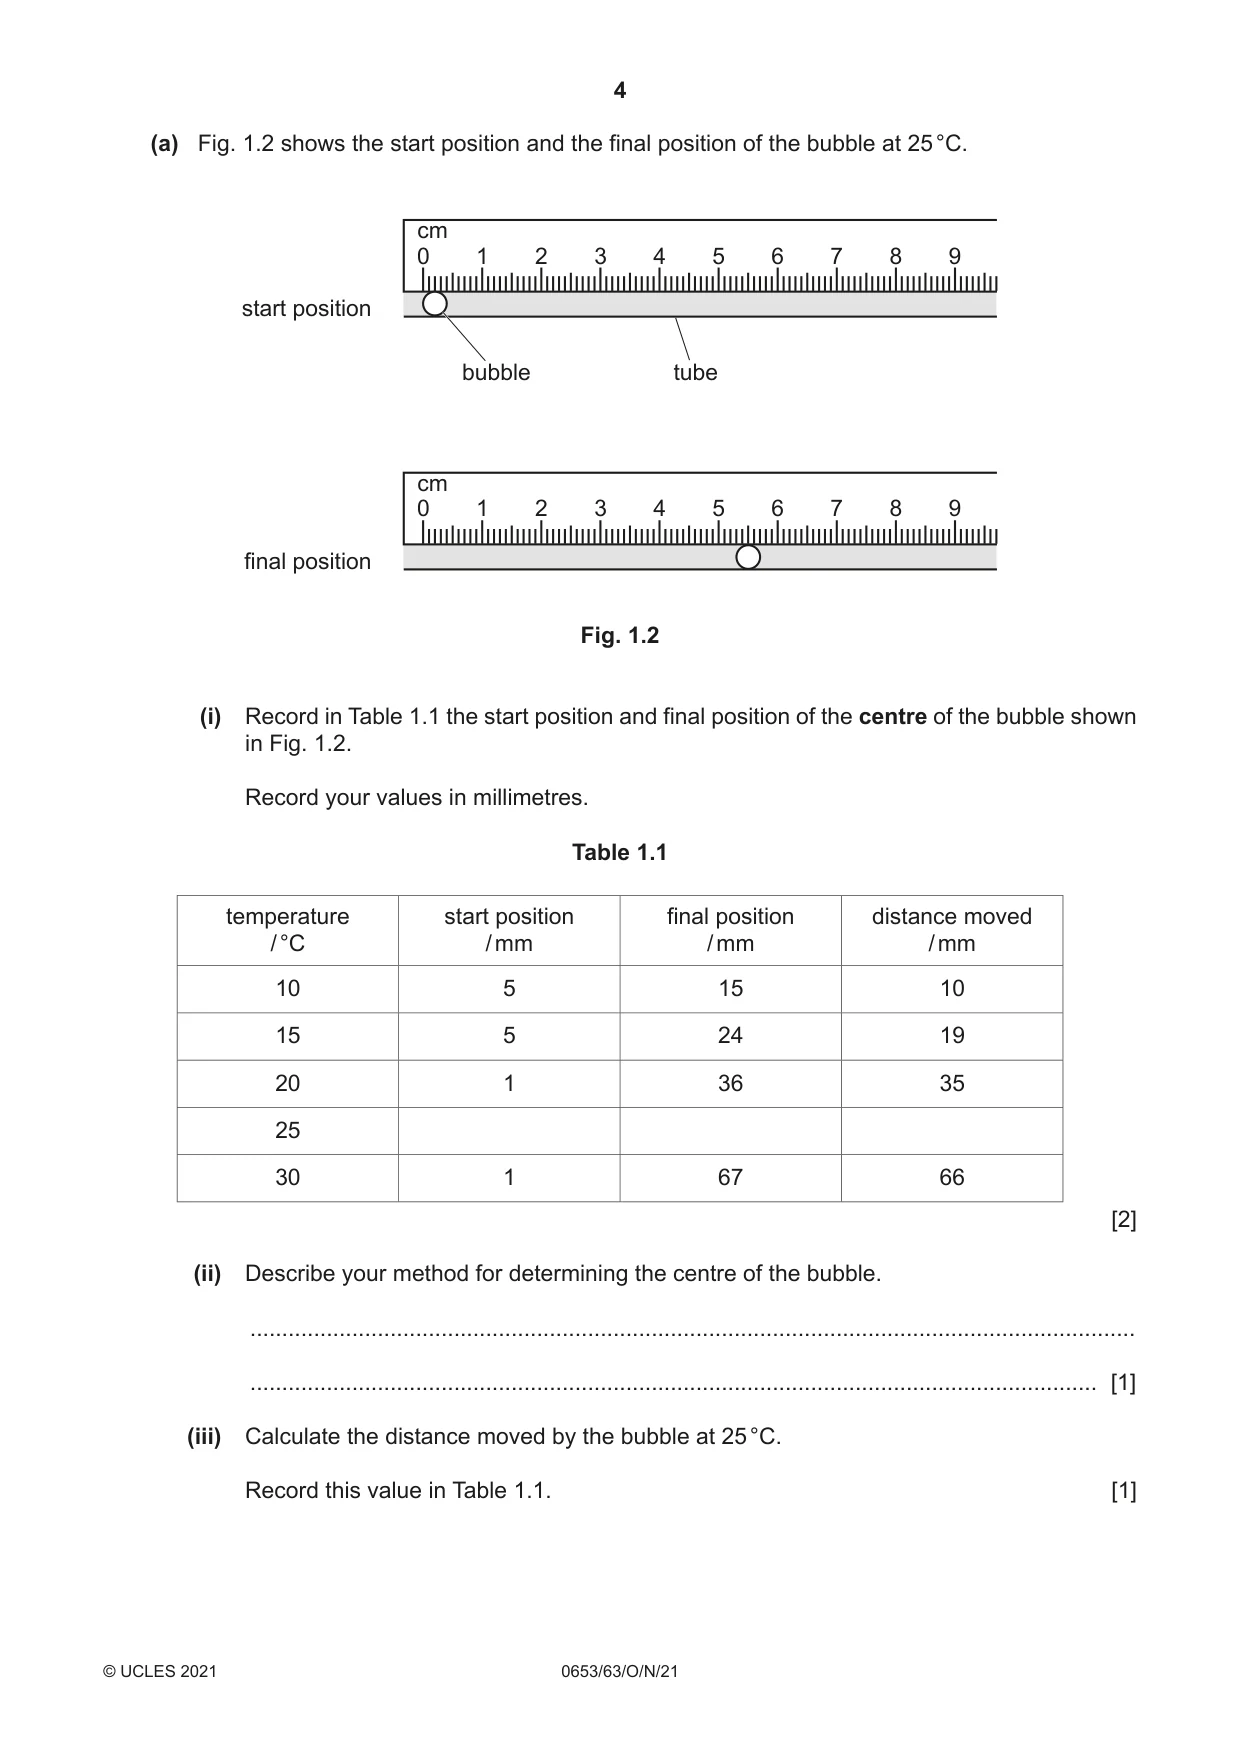
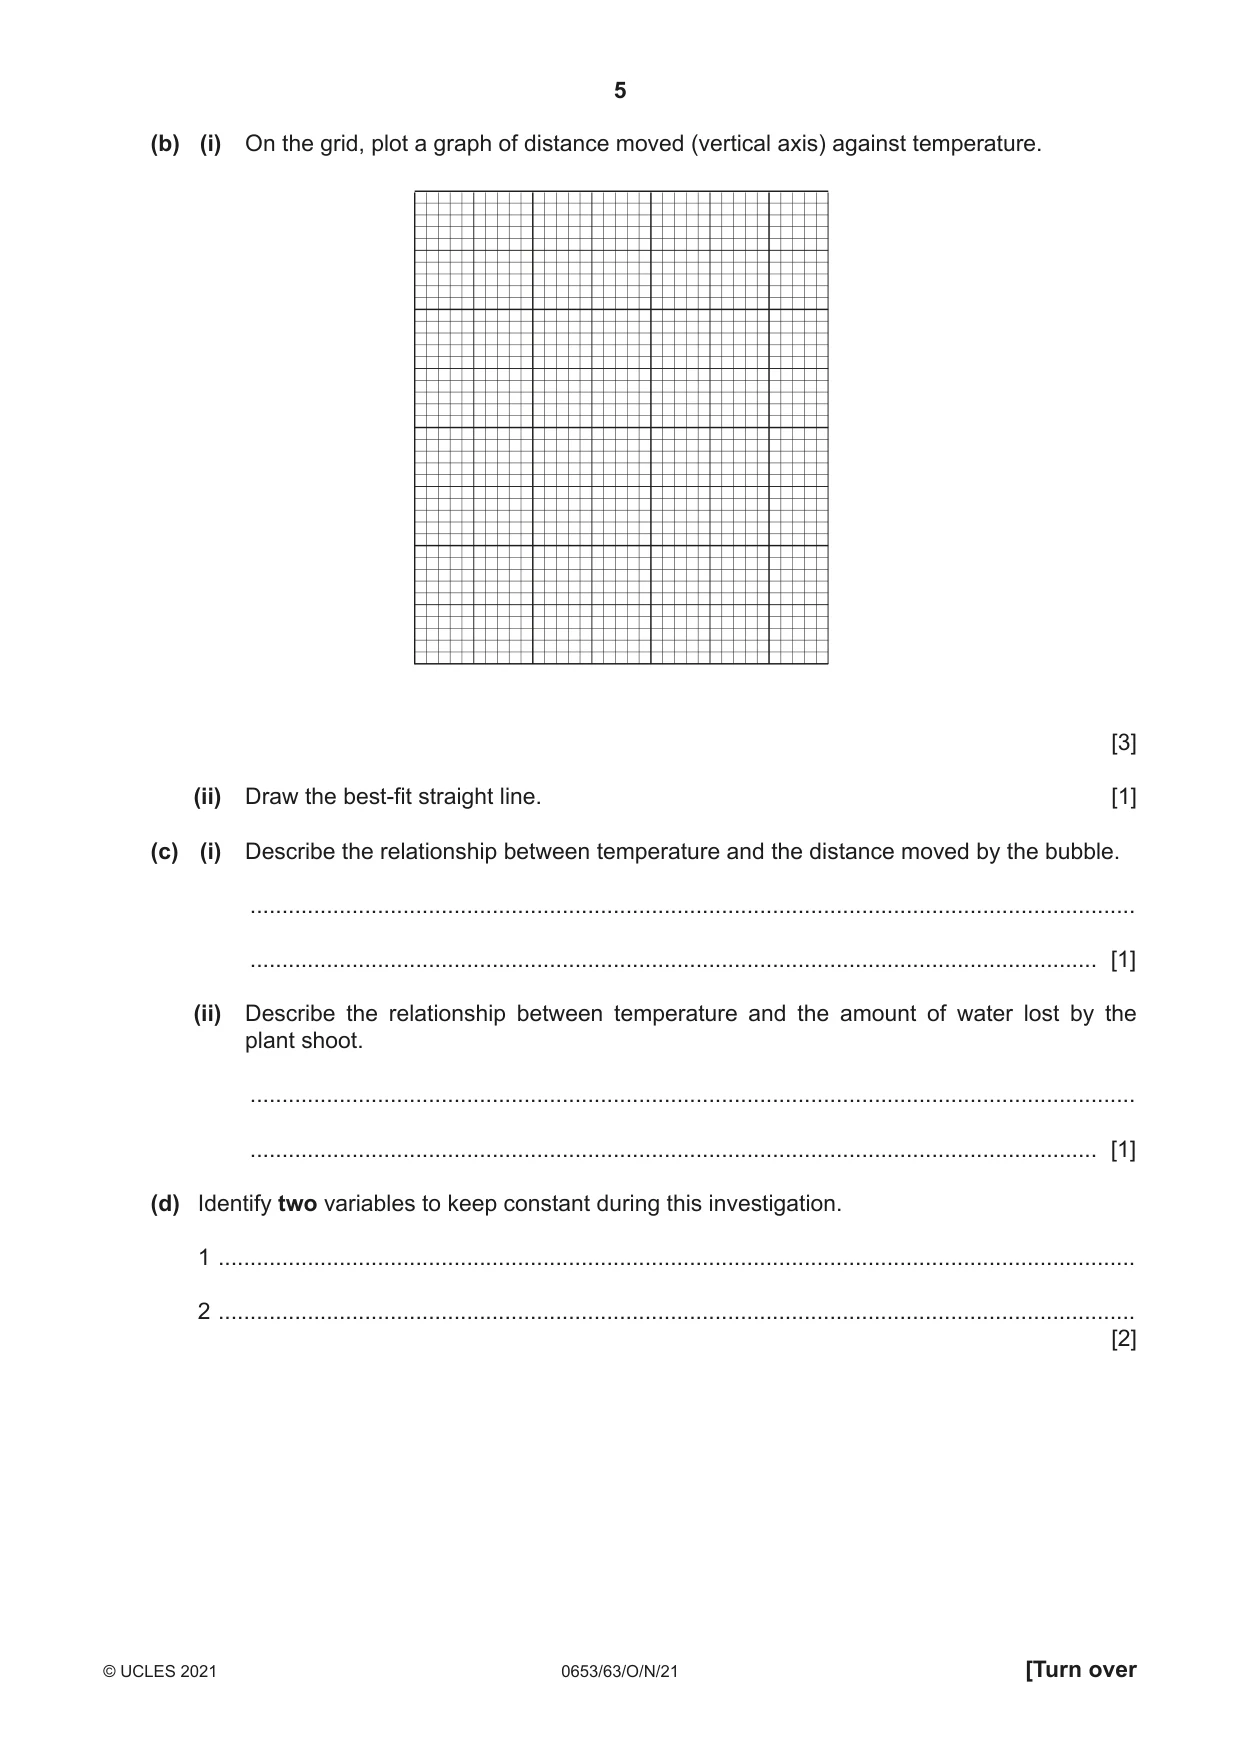
1 A student investigates the effect of temperature on the amount of water lost (by transpiration) from a cut plant shoot. The student sets up the apparatus shown in Fig. 1.1. As water is lost from the plant shoot, the bubble moves along the scale. plant shoot petroleum jelly reservoir of water bung scale water in glass tube tap bubble beaker of water Fig. 1.1 Procedure The student: • places the apparatus in a room with a constant temperature of 10 °C • records in Table 1.1 the start position of the bubble • leaves the apparatus in the room at 10 °C for one hour • records in Table 1.1 the final position of the bubble • repeats the experiment with the room at a constant temperature of 15 °C, 20 °C, 25 °C and 30 °C. (a) Fig. 1.2 shows the start position and the final position of the bubble at 25 °C. cm 0 1 2 3 4 5 6 7 8 9 start position bubble tube cm 0 1 2 3 4 5 6 7 8 9 final position Fig. 1.2 (i) Record in Table 1.1 the start position and final position of the centre of the bubble shown in Fig. 1.2. Record your values in millimetres. Table 1.1 temperature start position final position distance moved / °C / mm / mm / mm 10 5 15 10 15 5 24 19 20 1 36 35 25 30 1 67 66 [2] (ii) Describe your method for determining the centre of the bubble. ........................................................................................................................................... ..................................................................................................................................... [1] (iii) Calculate the distance moved by the bubble at 25 °C. Record this value in Table 1.1. [1] (b) (i) On the grid, plot a graph of distance moved (vertical axis) against temperature. [3] (ii) Draw the best-fit straight line. [1] (c) (i) Describe the relationship between temperature and the distance moved by the bubble. ........................................................................................................................................... ..................................................................................................................................... [1] (ii) Describe the relationship between temperature and the amount of water lost by the plant shoot. ........................................................................................................................................... ..................................................................................................................................... [1] (d) Identify two variables to keep constant during this investigation. 1 ................................................................................................................................................ 2 ................................................................................................................................................ [2] (e) Petroleum jelly is used to seal the apparatus and prevent water from leaking from the apparatus. A student repeats the experiment at 10 °C but forgets to seal the apparatus with the petroleum jelly. Suggest how this affects the distance moved by the bubble. ................................................................................................................................................... ............................................................................................................................................. [1] [Total: 13]
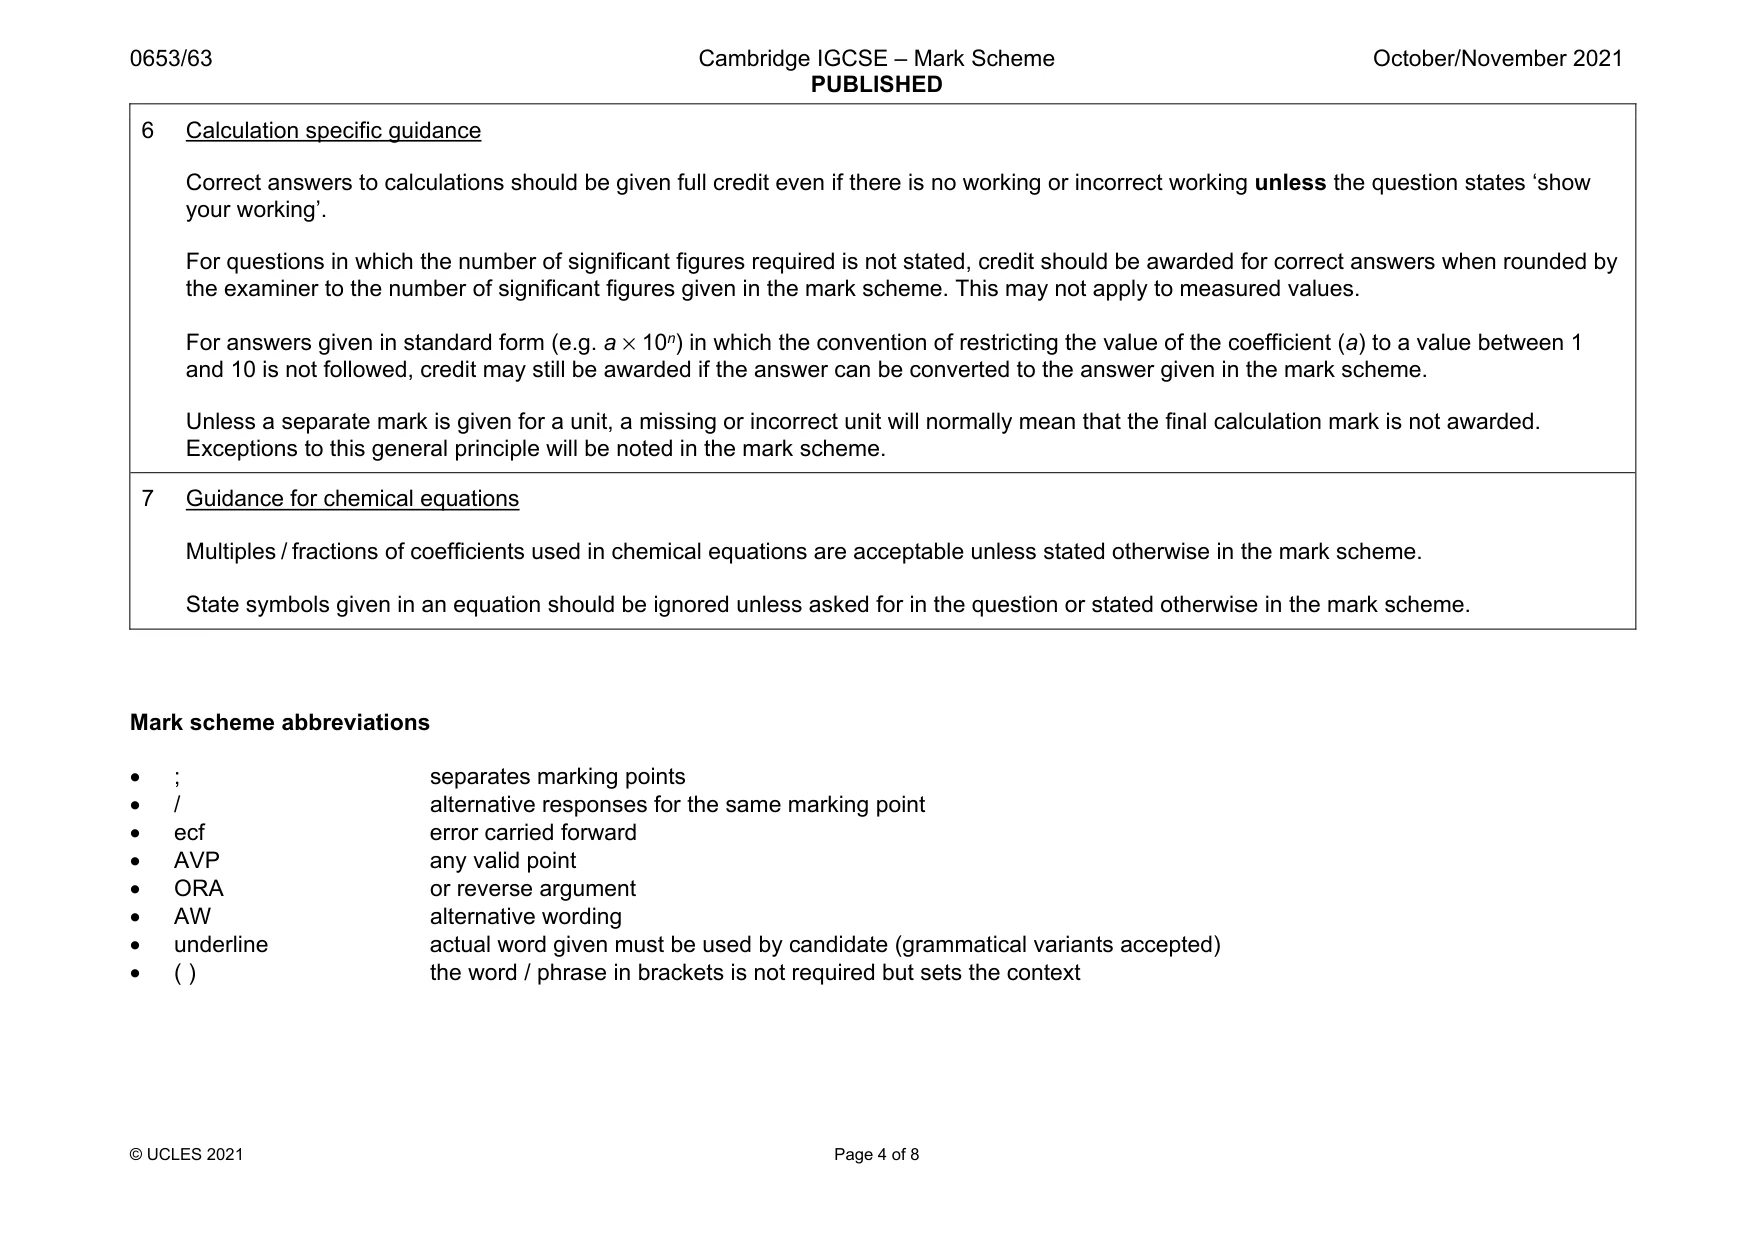
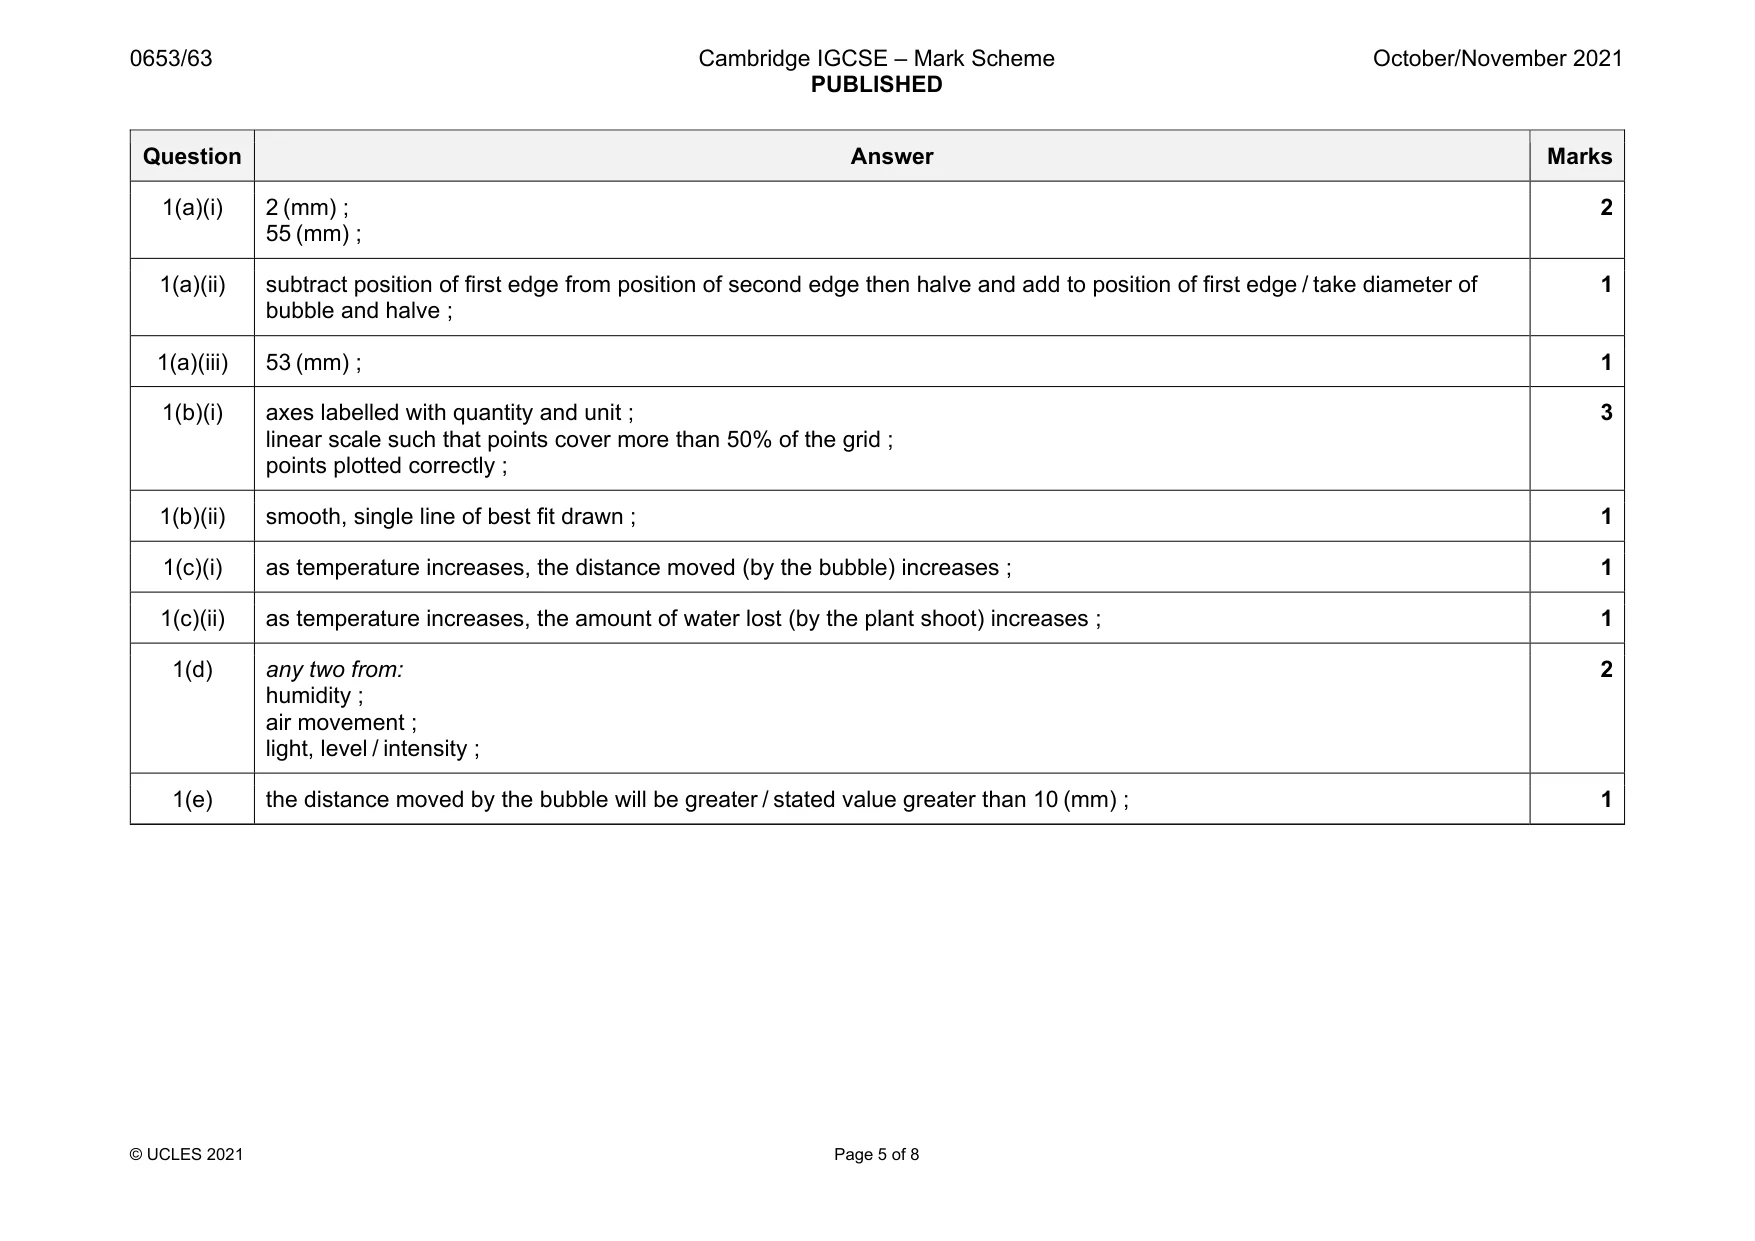
Mark scheme: 1(a)(i) 2 (mm) ; 55 (mm) ; 2 1(a)(ii) subtract position of first edge from position of second edge then halve and add to position of first edge / take diameter of bubble and halve ; 1 1(a)(iii) 53 (mm) ; 1 1(b)(i) axes labelled with quantity and unit ; linear scale such that points cover more than 50% of the grid ; points plotted correctly ; 3 1(b)(ii) smooth, single line of best fit drawn ; 1 1(c)(i) as temperature increases, the distance moved (by the bubble) increases ; 1 1(c)(ii) as temperature increases, the amount of water lost (by the plant shoot) increases ; 1 1(d) any two from: humidity ; air movement ; light, level / intensity ; 2 1(e) the distance moved by the bubble will be greater / stated value greater than 10 (mm) ; 1
Q2 · A student prepares a sample of the salt, magnesium sulfate
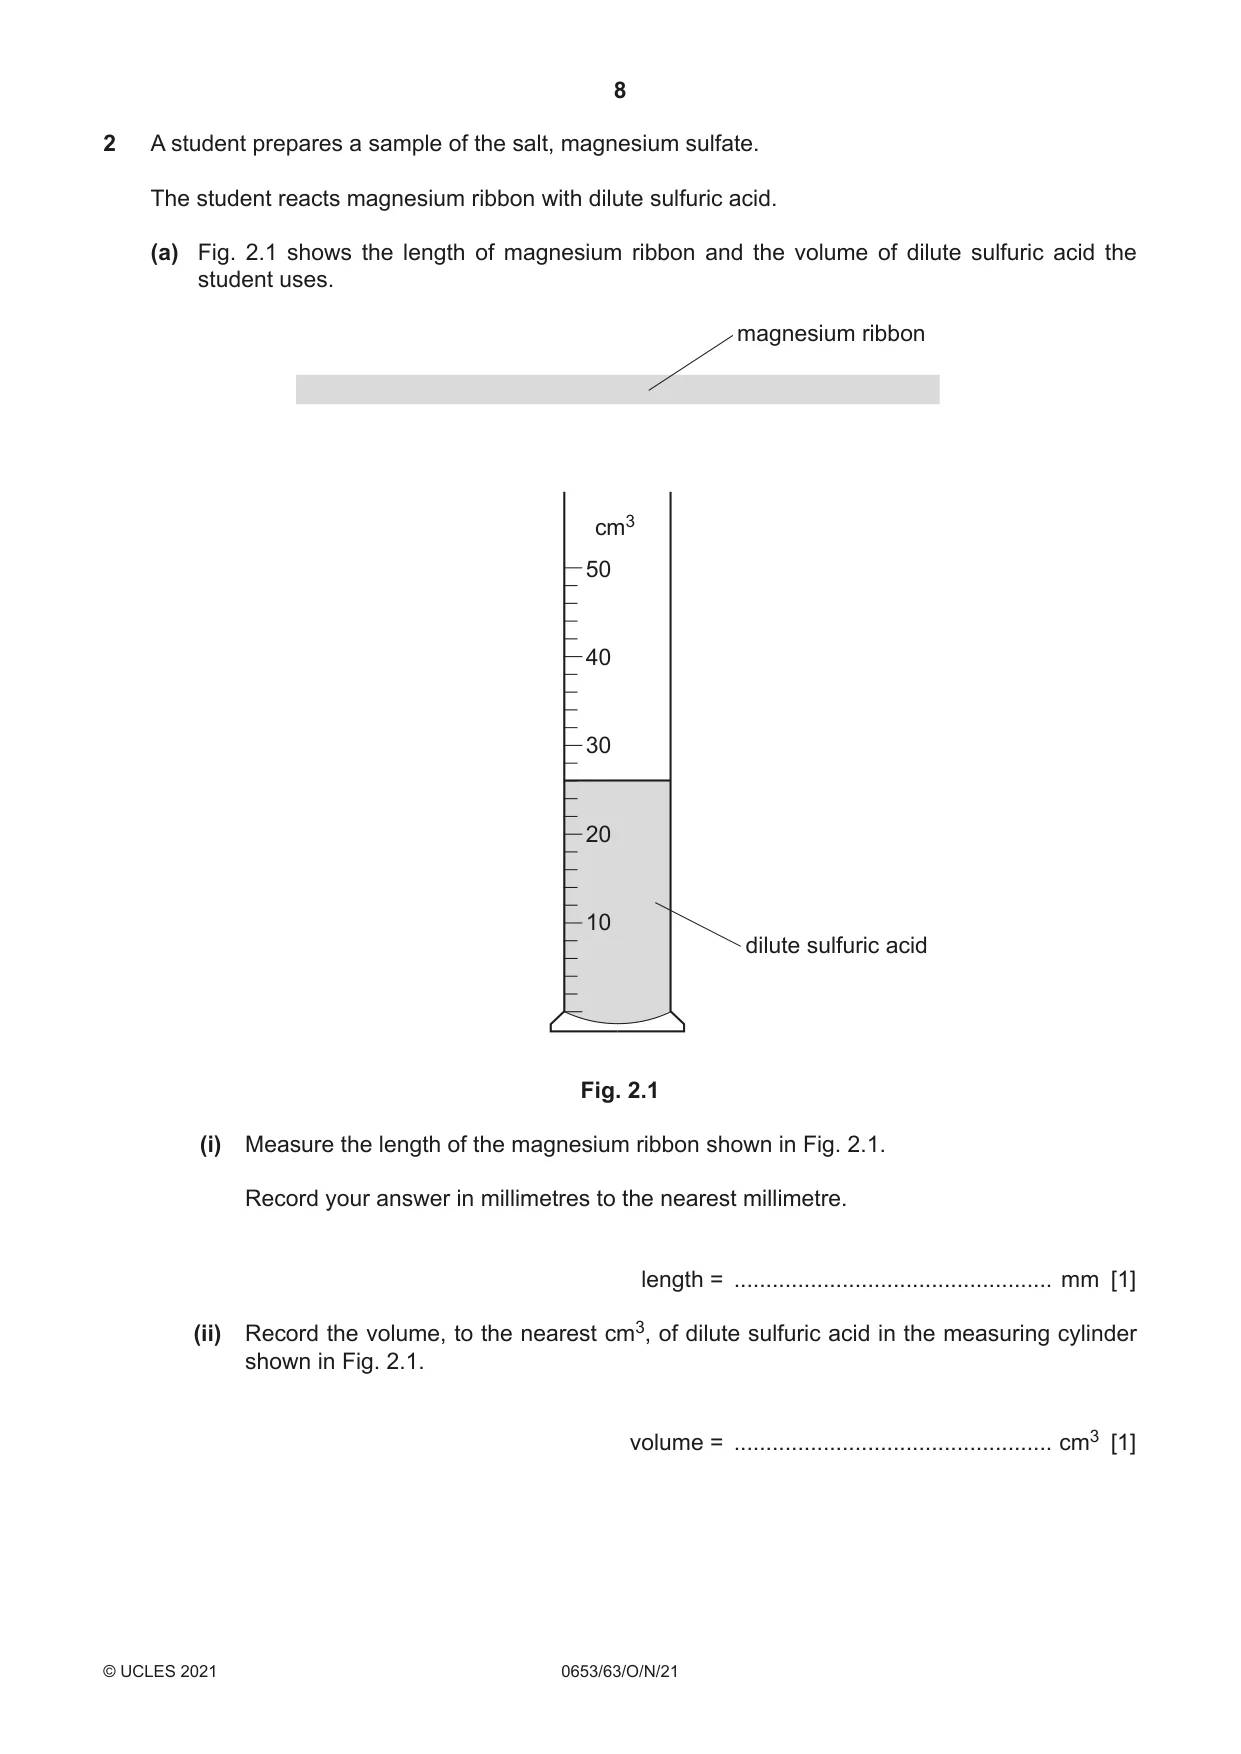
2 A student prepares a sample of the salt, magnesium sulfate. The student reacts magnesium ribbon with dilute sulfuric acid. (a) Fig. 2.1 shows the length of magnesium ribbon and the volume of dilute sulfuric acid the student uses. magnesium ribbon cm3 50 40 30 20 10 dilute sulfuric acid Fig. 2.1 (i) Measure the length of the magnesium ribbon shown in Fig. 2.1. Record your answer in millimetres to the nearest millimetre. length = .................................................. mm [1] (ii) Record the volume, to the nearest cm3, of dilute sulfuric acid in the measuring cylinder shown in Fig. 2.1. volume = .................................................. cm3 [1] (b) The student pours the dilute sulfuric acid into a beaker and then adds the piece of magnesium ribbon. The mixture fizzes and makes a gas that gives a squeaky pop with a lighted splint. A colourless solution and a small piece of magnesium remain when the reaction has finished. (i) Name the gas produced in the reaction. ..................................................................................................................................... [1] (ii) State how the observations show that all the dilute sulfuric acid has reacted. ........................................................................................................................................... ..................................................................................................................................... [1] (iii) The mixture in the beaker is filtered into a flask. Describe the appearance of the residue in the filter paper and the filtrate in the flask. residue .............................................................................................................................. filtrate ................................................................................................................................ [2] (c) The filtrate contains magnesium ions and sulfate ions. Describe the test to identify sulfate ions. State the observation for a positive result. test ............................................................................................................................................ ................................................................................................................................................... observation ............................................................................................................................... [2] (d) Describe, in detail, how to make crystals of magnesium sulfate from the filtrate. ................................................................................................................................................... ................................................................................................................................................... ................................................................................................................................................... ................................................................................................................................................... ................................................................................................................................................... ............................................................................................................................................. [3] (e) The student heats 2.46 g of magnesium sulfate crystals in a test-tube for 10 minutes. The student allows the test-tube and its contents to cool down. The mass of the solid left in the test-tube is 1.20 g. (i) Suggest why the mass of the magnesium sulfate crystals decreases when heated. ........................................................................................................................................... ..................................................................................................................................... [1] (ii) The student uses a blue Bunsen burner flame to heat the test-tube rather than a yellow Bunsen burner flame. Explain why the student uses a blue Bunsen burner flame. ........................................................................................................................................... ..................................................................................................................................... [1] [Total: 13]
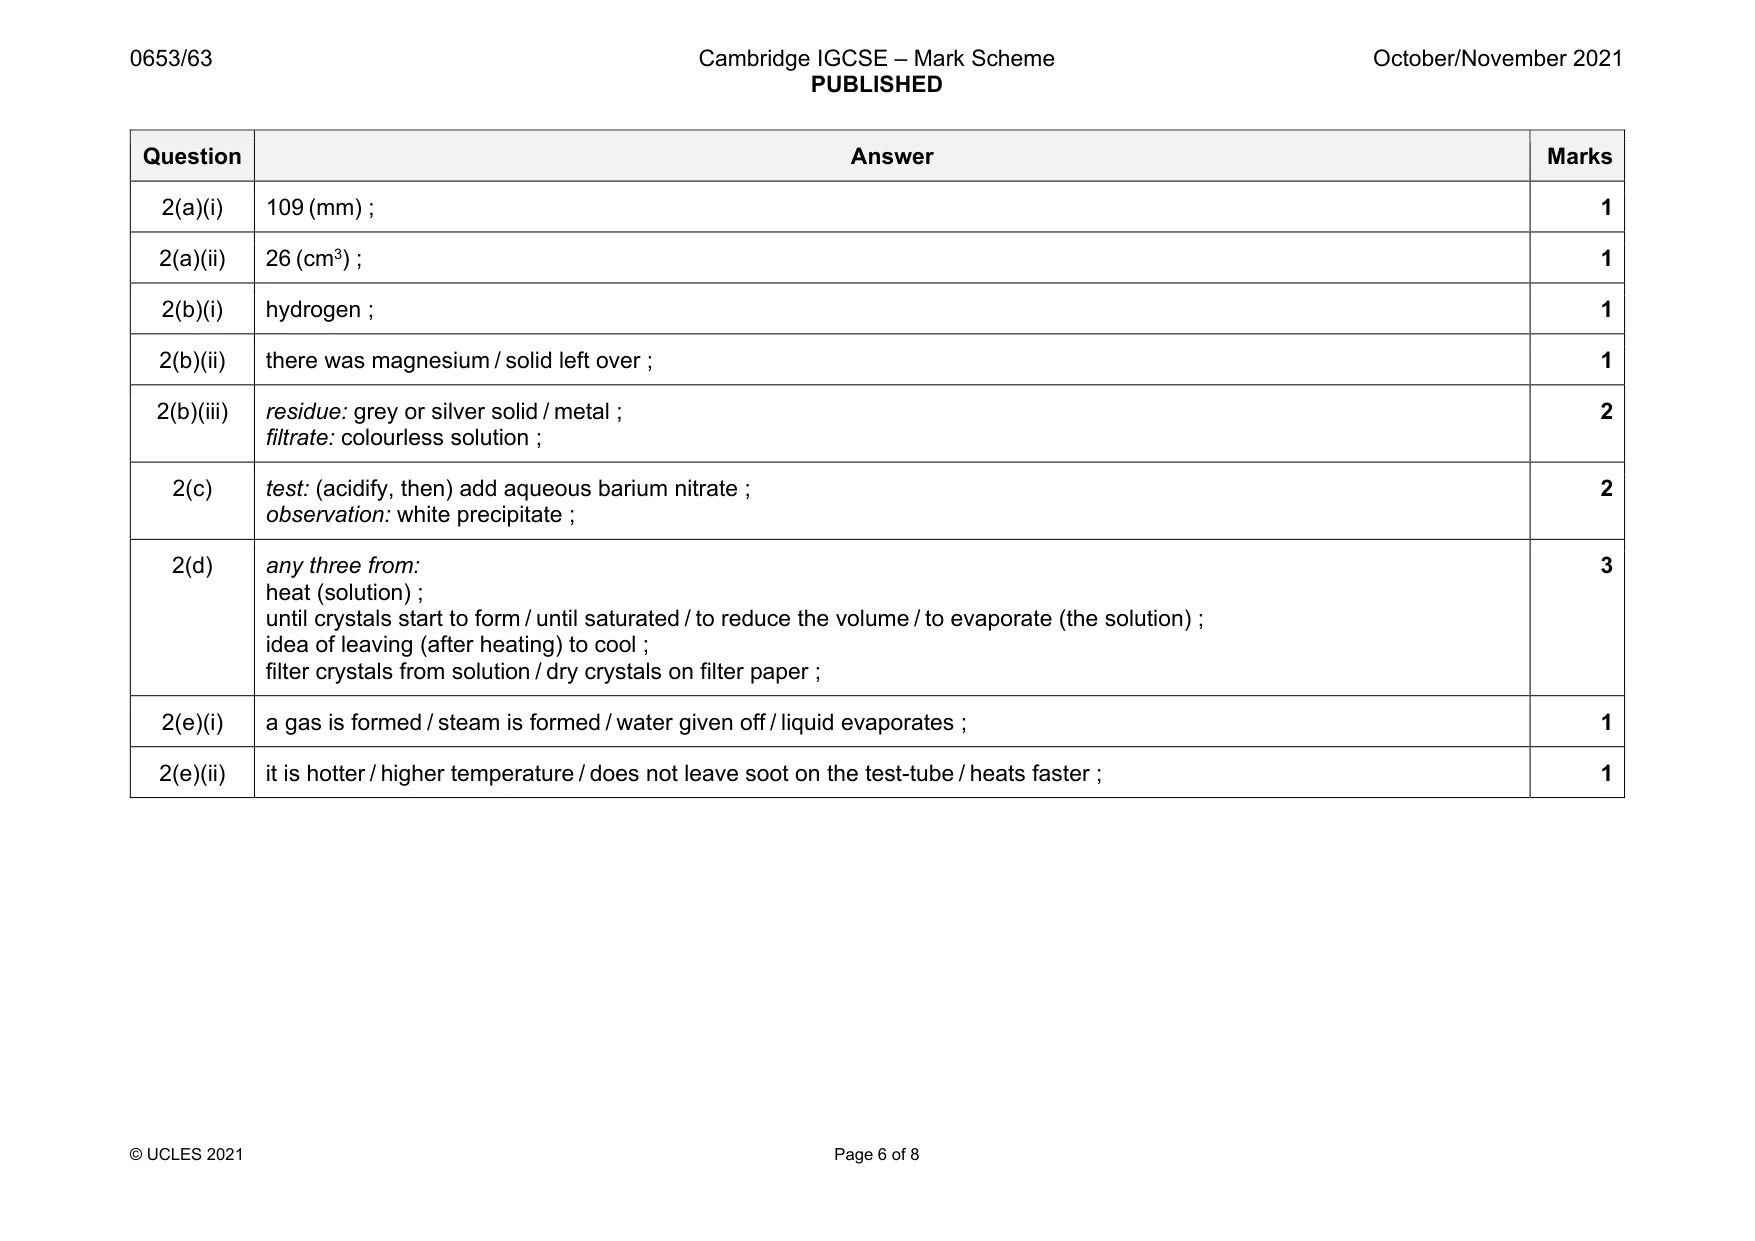
Mark scheme: 2(a)(i) 109 (mm) ; 1 2(a)(ii) 26 (cm3) ; 1 2(b)(i) hydrogen ; 1 2(b)(ii) there was magnesium / solid left over ; 1 2(b)(iii) residue: grey or silver solid / metal ; filtrate: colourless solution ; 2 2(c) test: (acidify, then) add aqueous barium nitrate ; observation: white precipitate ; 2 2(d) any three from: heat (solution) ; until crystals start to form / until saturated / to reduce the volume / to evaporate (the solution) ; idea of leaving (after heating) to cool ; filter crystals from solution / dry crystals on filter paper ; 3 2(e)(i) a gas is formed / steam is formed / water given off / liquid evaporates ; 1 2(e)(ii) it is hotter / higher temperature / does not leave soot on the test-tube / heats faster ; 1
Q3 · A student uses a simple pendulum to determine the acceleration due to gravity g
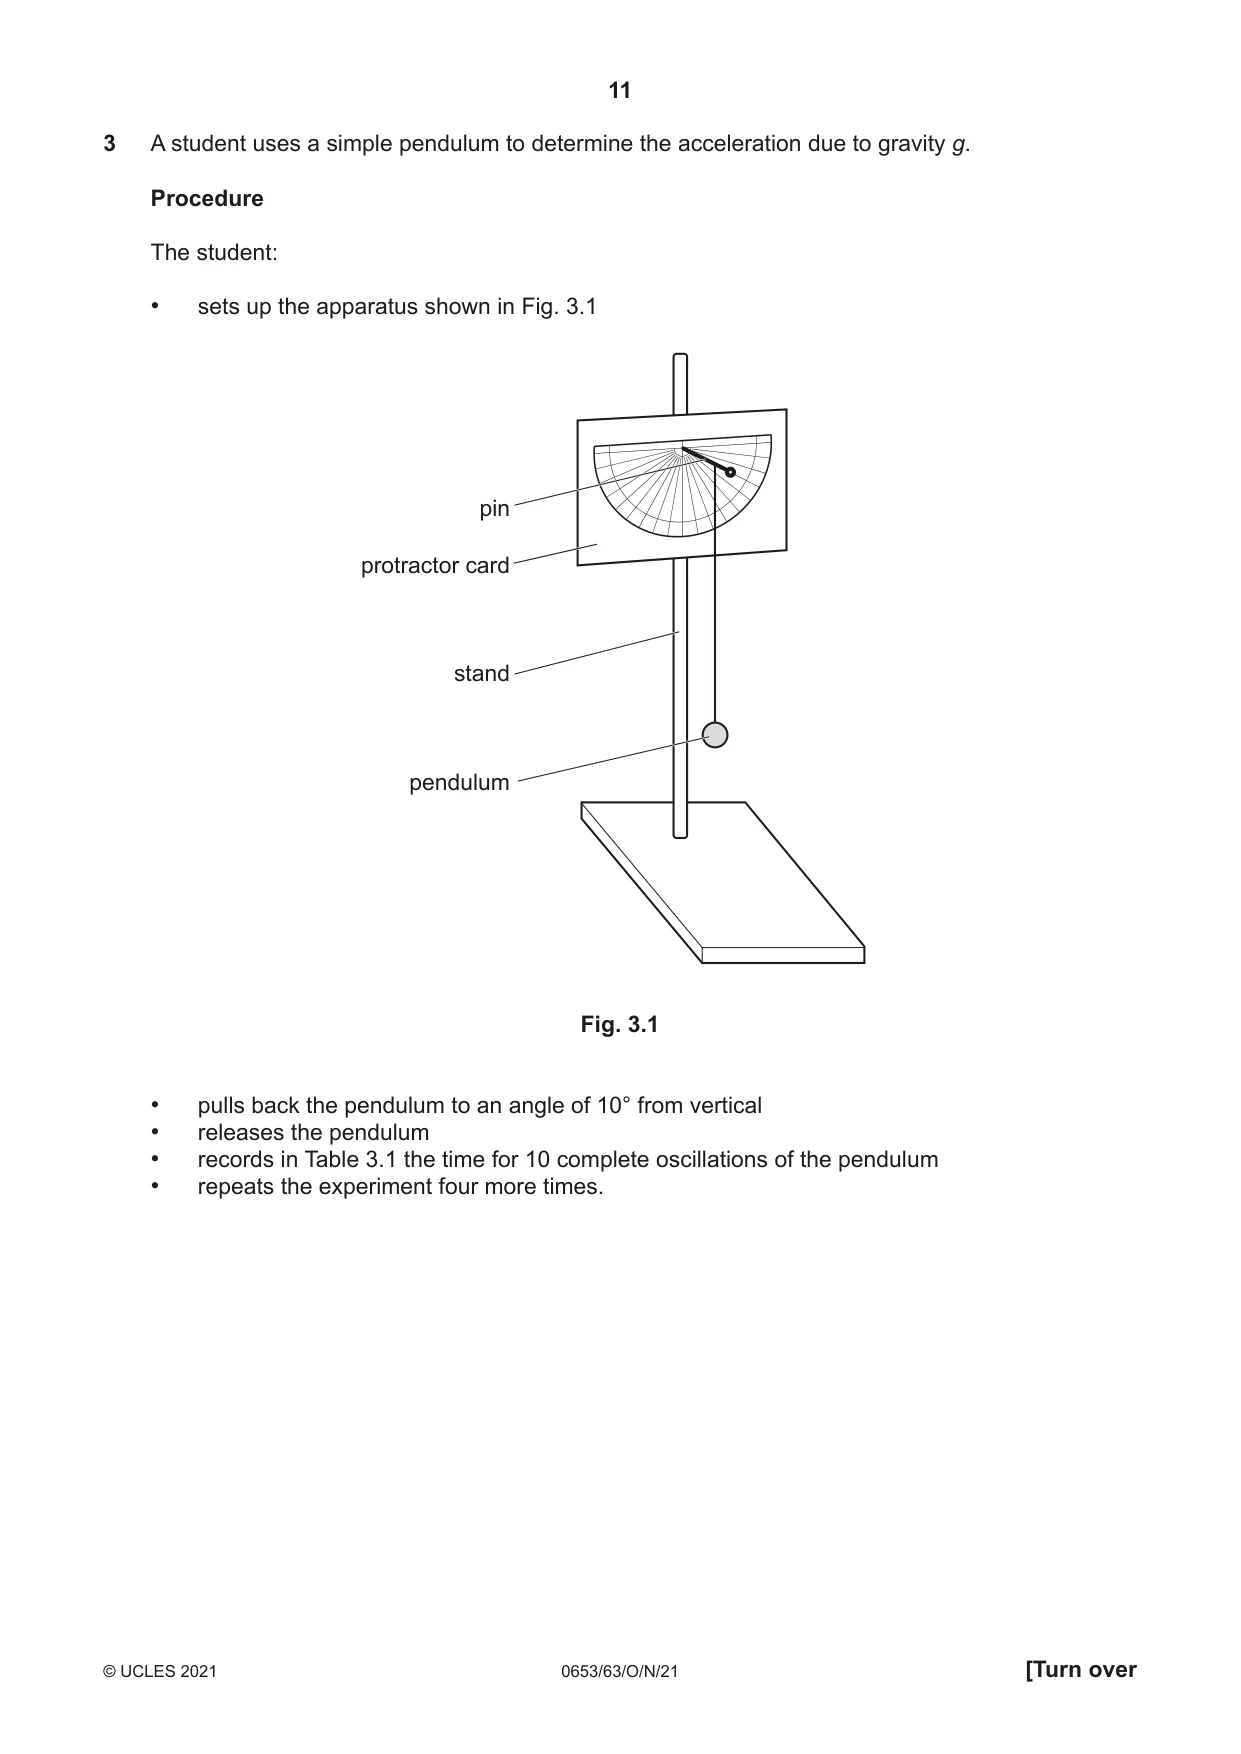
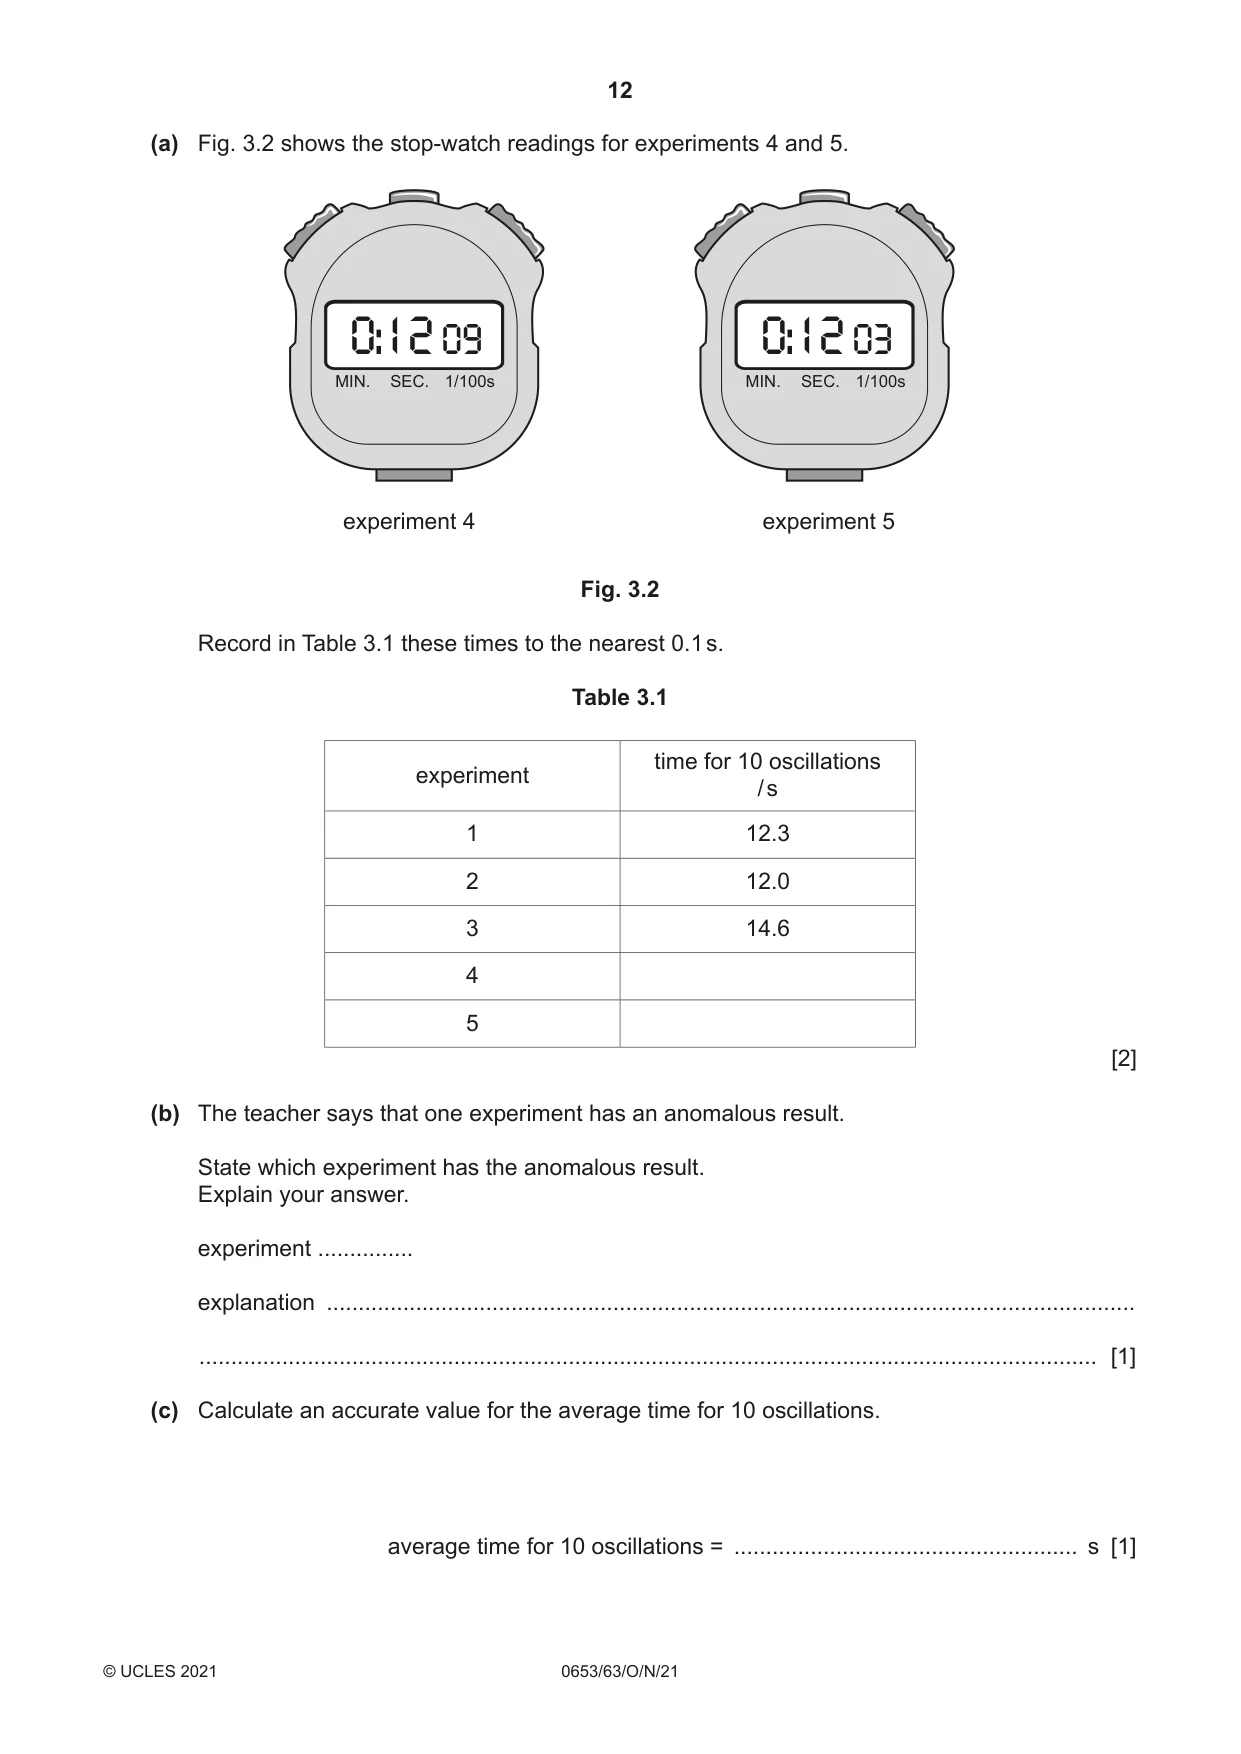
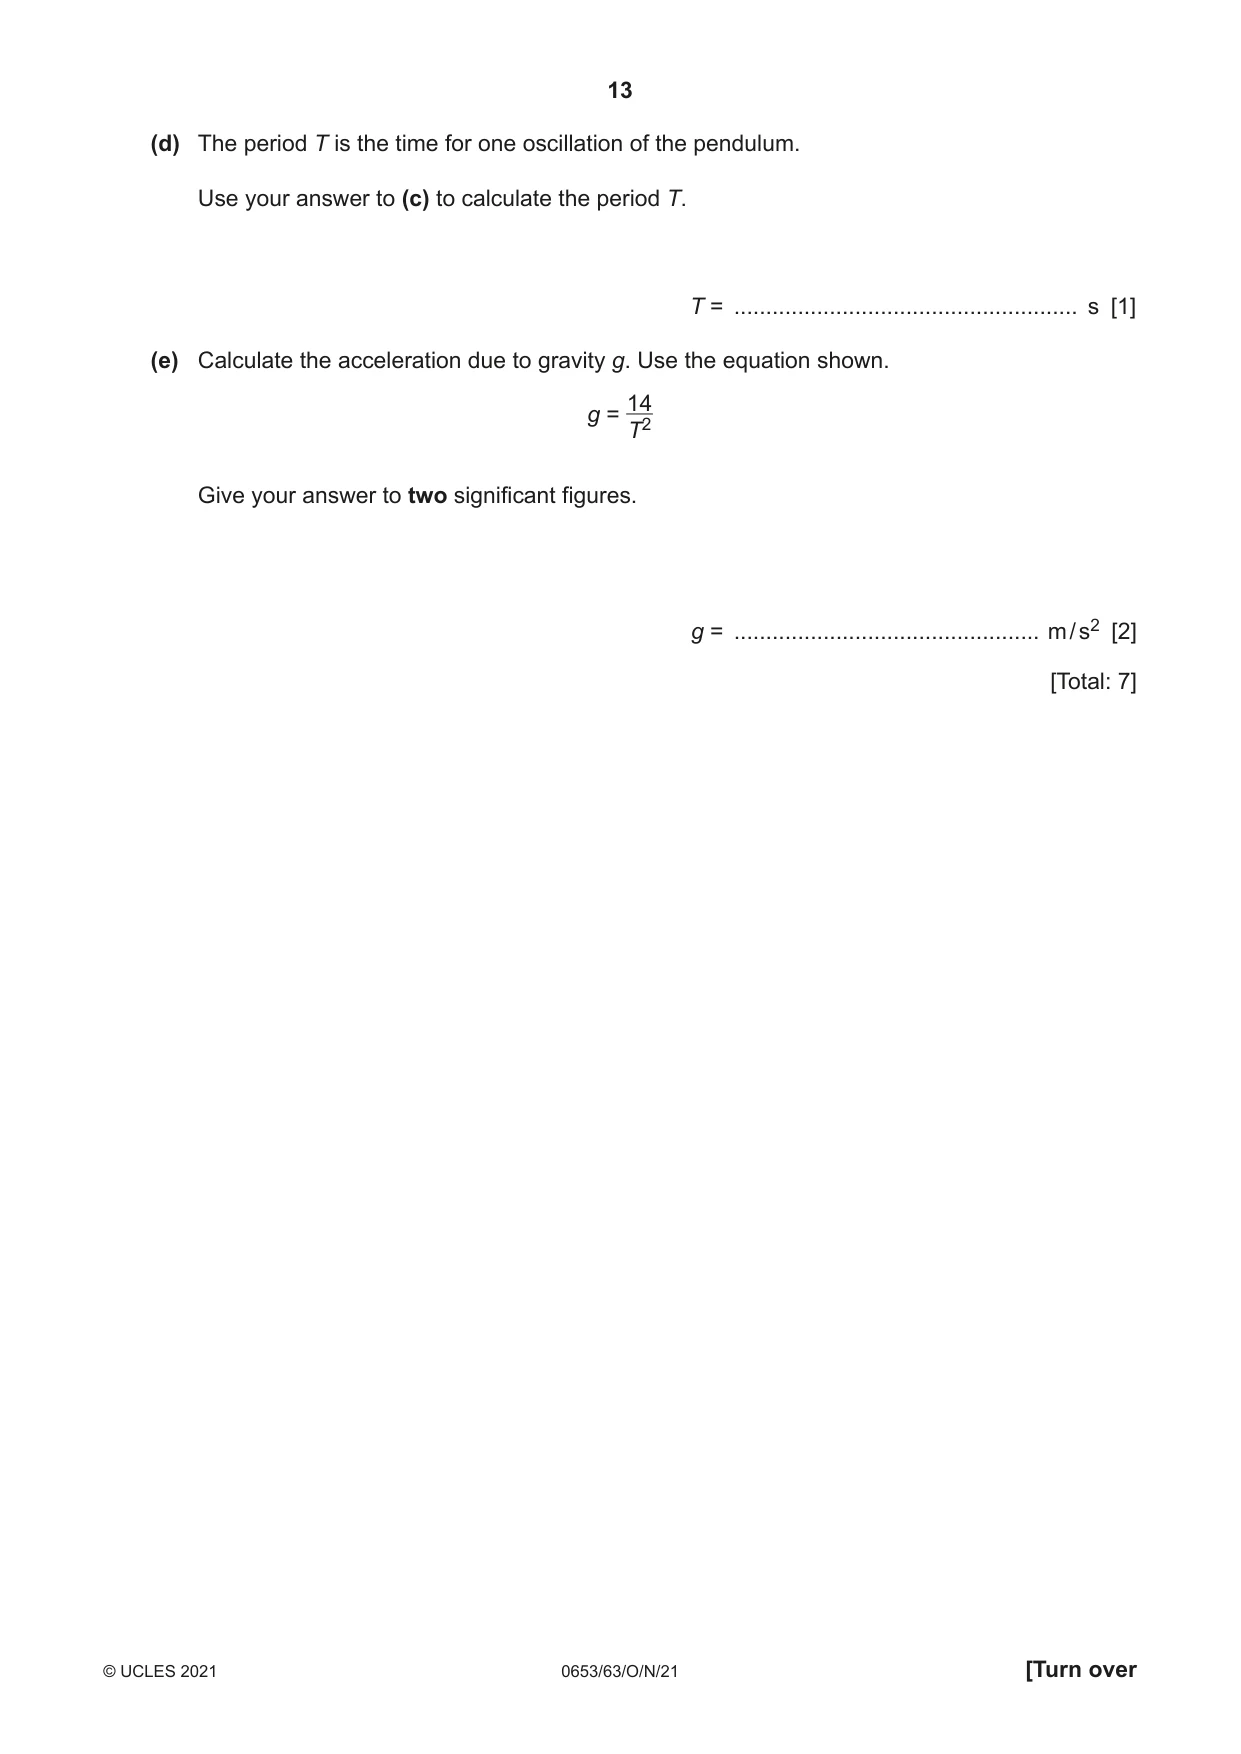
3 A student uses a simple pendulum to determine the acceleration due to gravity g. Procedure The student: • sets up the apparatus shown in Fig. 3.1 pin protractor card stand pendulum Fig. 3.1 • pulls back the pendulum to an angle of 10° from vertical • releases the pendulum • records in Table 3.1 the time for 10 complete oscillations of the pendulum • repeats the experiment four more times. (a) Fig. 3.2 shows the stop-watch readings for experiments 4 and 5. 0:12 09 0:12 03 MIN. SEC. 1/100s MIN. SEC. 1/100s experiment 4 experiment 5 Fig. 3.2 Record in Table 3.1 these times to the nearest 0.1 s. Table 3.1 time for 10 oscillations experiment / s 1 12.3 2 12.0 3 14.6 4 5 [2] (b) The teacher says that one experiment has an anomalous result. State which experiment has the anomalous result. Explain your answer. experiment ............... explanation ............................................................................................................................... ............................................................................................................................................. [1] (c) Calculate an accurate value for the average time for 10 oscillations. average time for 10 oscillations = ...................................................... s [1] (d) The period T is the time for one oscillation of the pendulum. Use your answer to (c) to calculate the period T. T = ...................................................... s [1] (e) Calculate the acceleration due to gravity g. Use the equation shown. 14 g = T2 Give your answer to two significant figures. g = ................................................ m / s2 [2] [Total: 7]
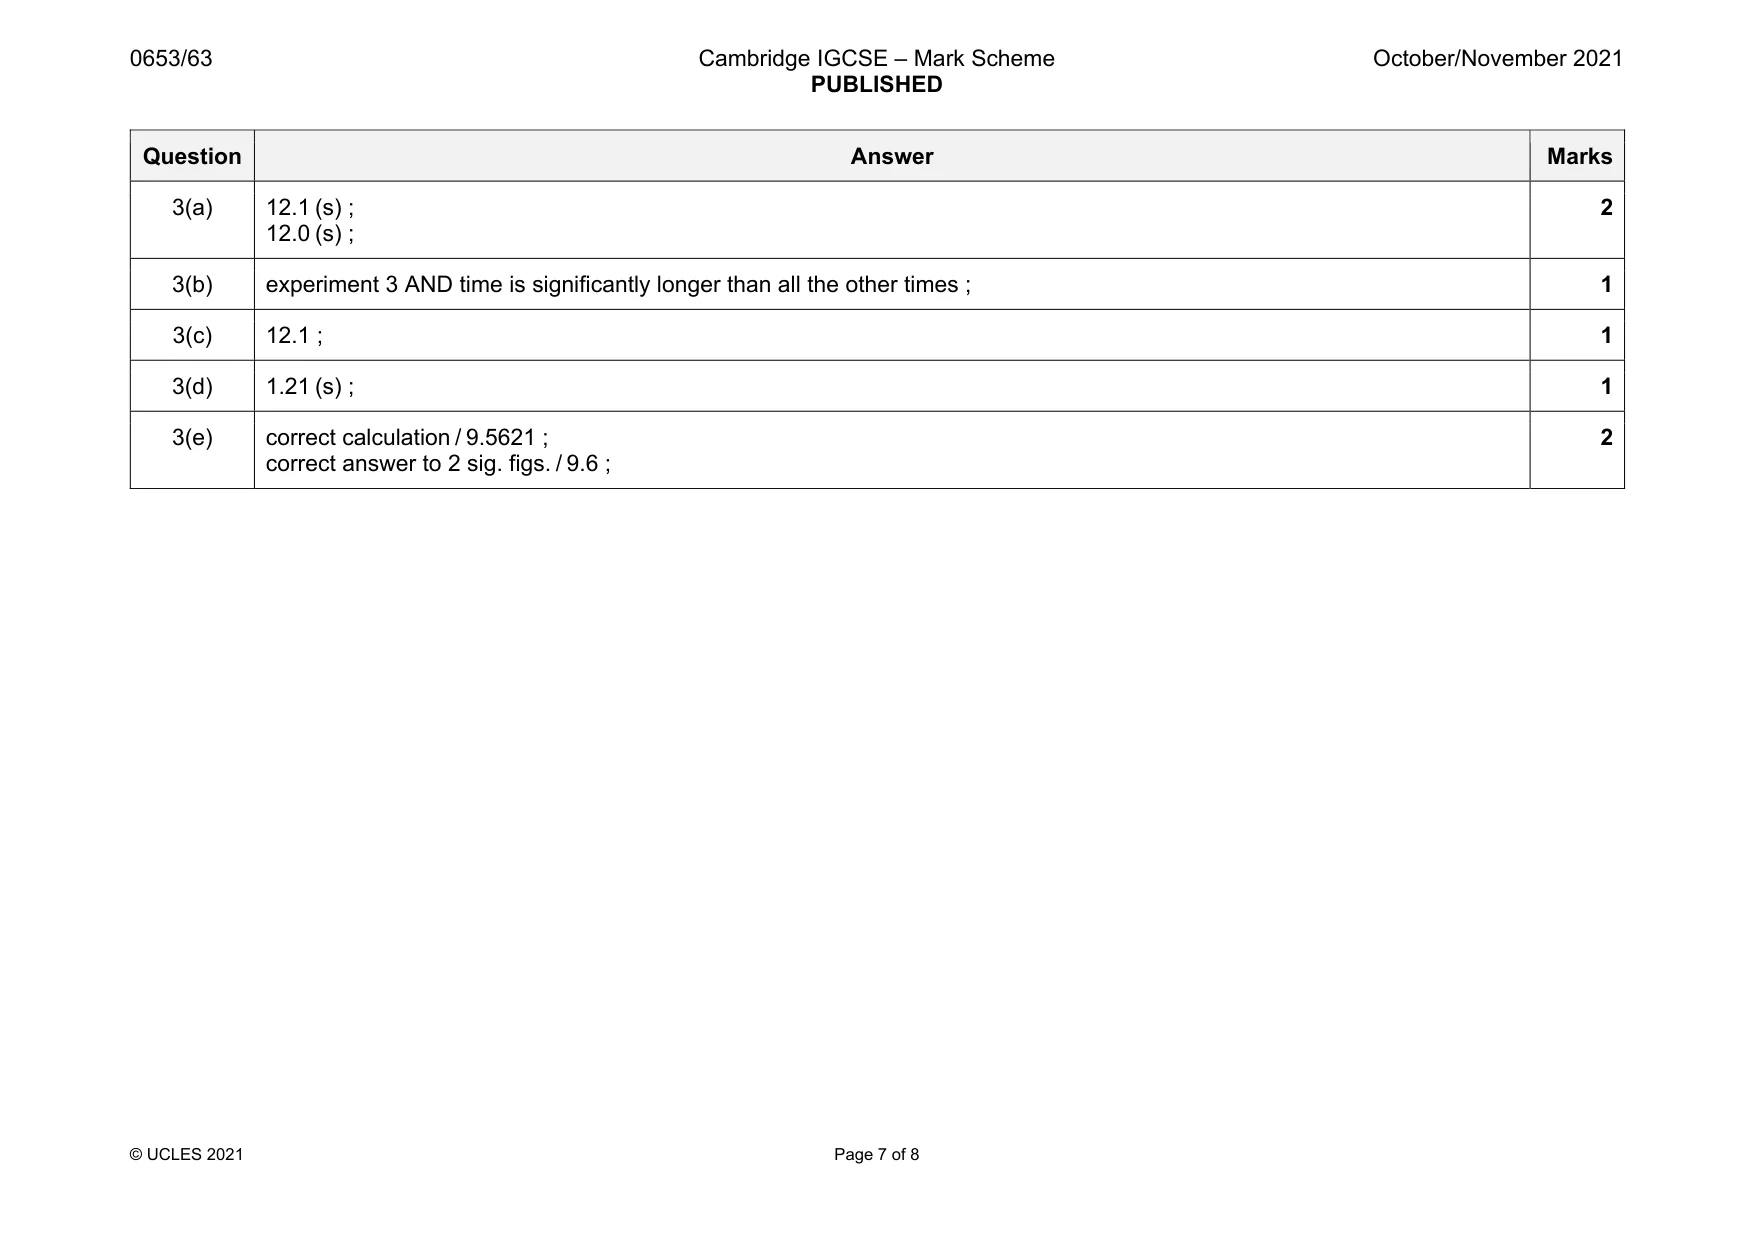
Mark scheme: 3(a) 12.1 (s) ; 12.0 (s) ; 2 3(b) experiment 3 AND time is significantly longer than all the other times ; 1 3(c) 12.1 ; 1 3(d) 1.21 (s) ; 1 3(e) correct calculation / 9.5621 ; correct answer to 2 sig. figs. / 9.6 ; 2
More questions on Physical quantities and measurement techniques
Q4 · A wool cloth being rubbed on a rod made of insulating material
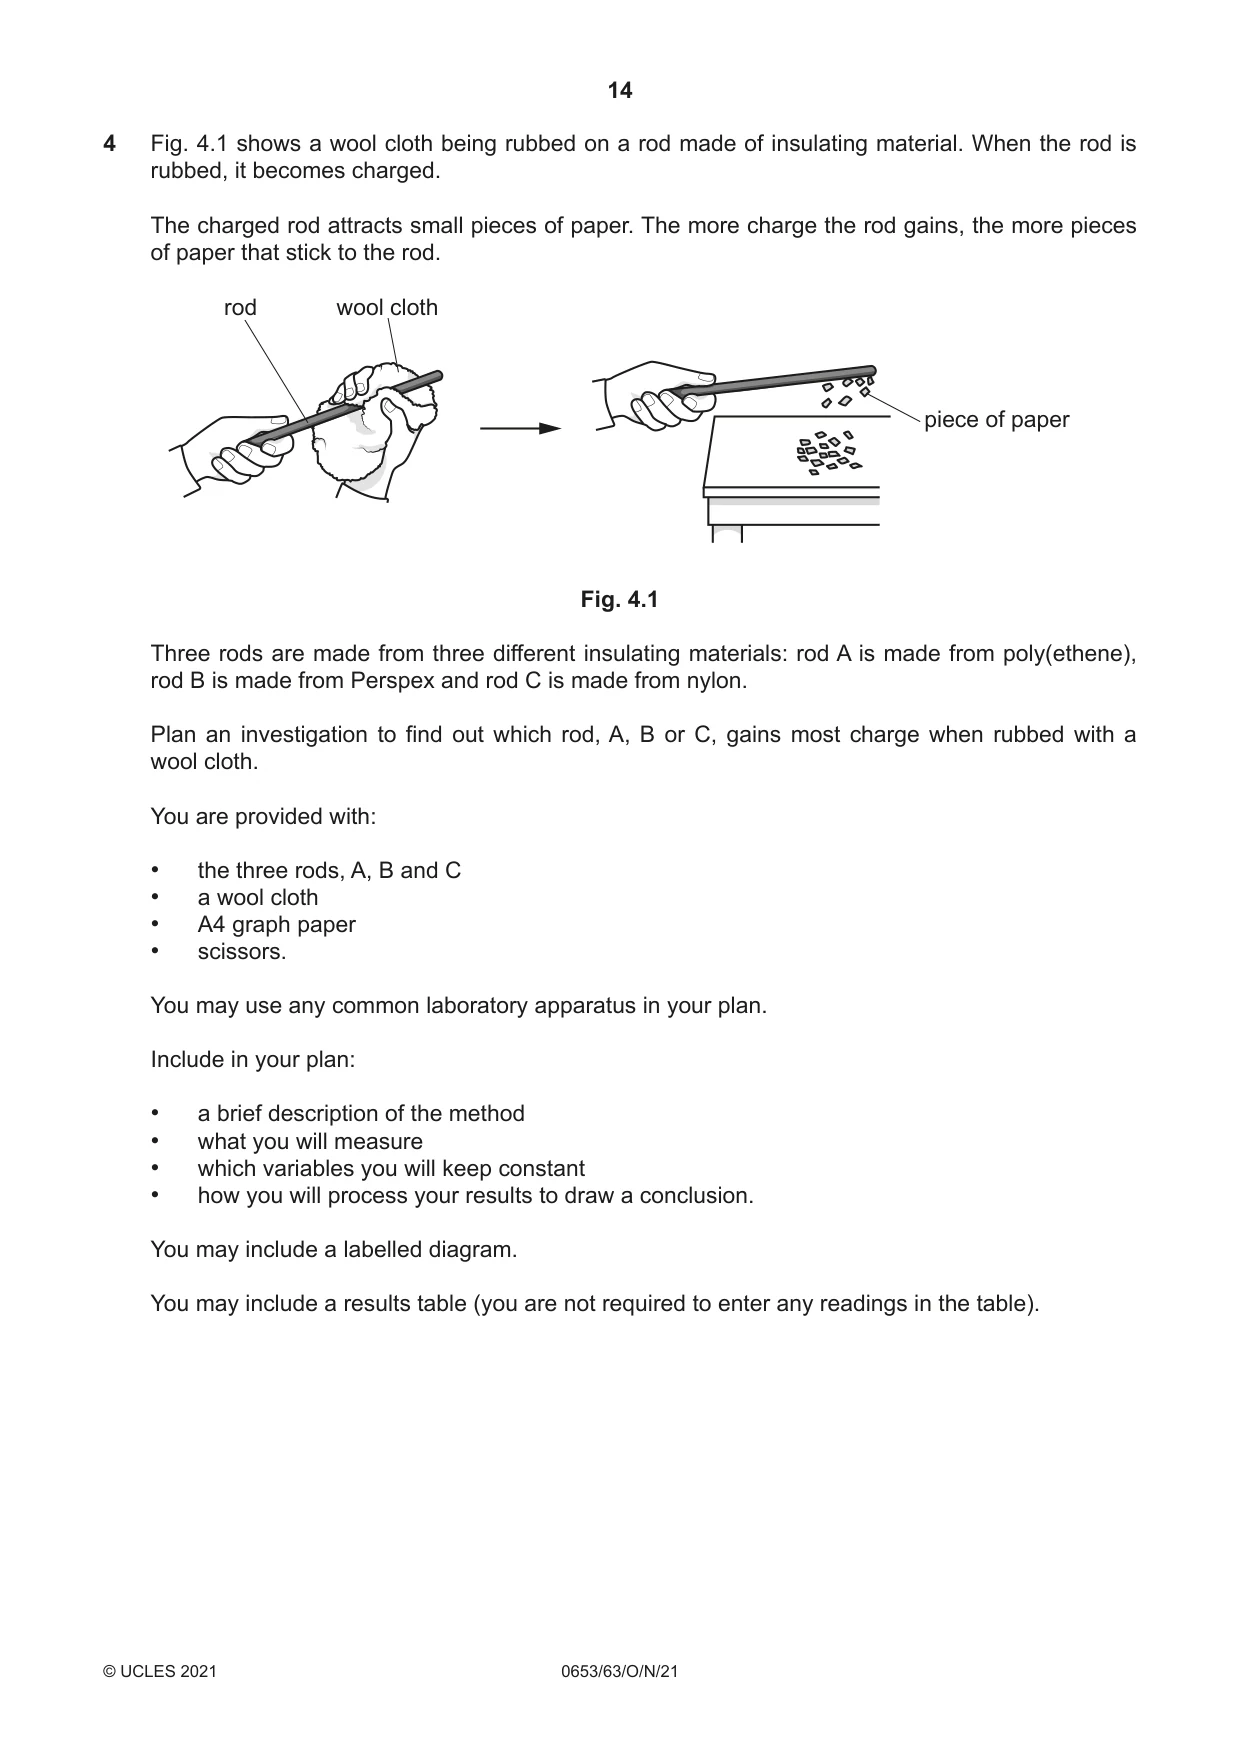
4 Fig. 4.1 shows a wool cloth being rubbed on a rod made of insulating material. When the rod is rubbed, it becomes charged. The charged rod attracts small pieces of paper. The more charge the rod gains, the more pieces of paper that stick to the rod. rod wool cloth piece of paper Fig. 4.1 Three rods are made from three different insulating materials: rod A is made from poly(ethene), rod B is made from Perspex and rod C is made from nylon. Plan an investigation to find out which rod, A, B or C, gains most charge when rubbed with a wool cloth. You are provided with: • the three rods, A, B and C • a wool cloth • A4 graph paper • scissors. You may use any common laboratory apparatus in your plan. Include in your plan: • a brief description of the method • what you will measure • which variables you will keep constant • how you will process your results to draw a conclusion. You may include a labelled diagram. You may include a results table (you are not required to enter any readings in the table). .......................................................................................................................................................... .......................................................................................................................................................... .......................................................................................................................................................... .......................................................................................................................................................... .......................................................................................................................................................... .......................................................................................................................................................... .......................................................................................................................................................... .......................................................................................................................................................... .......................................................................................................................................................... .......................................................................................................................................................... .......................................................................................................................................................... .......................................................................................................................................................... .......................................................................................................................................................... .................................................................................................................................................... [7]
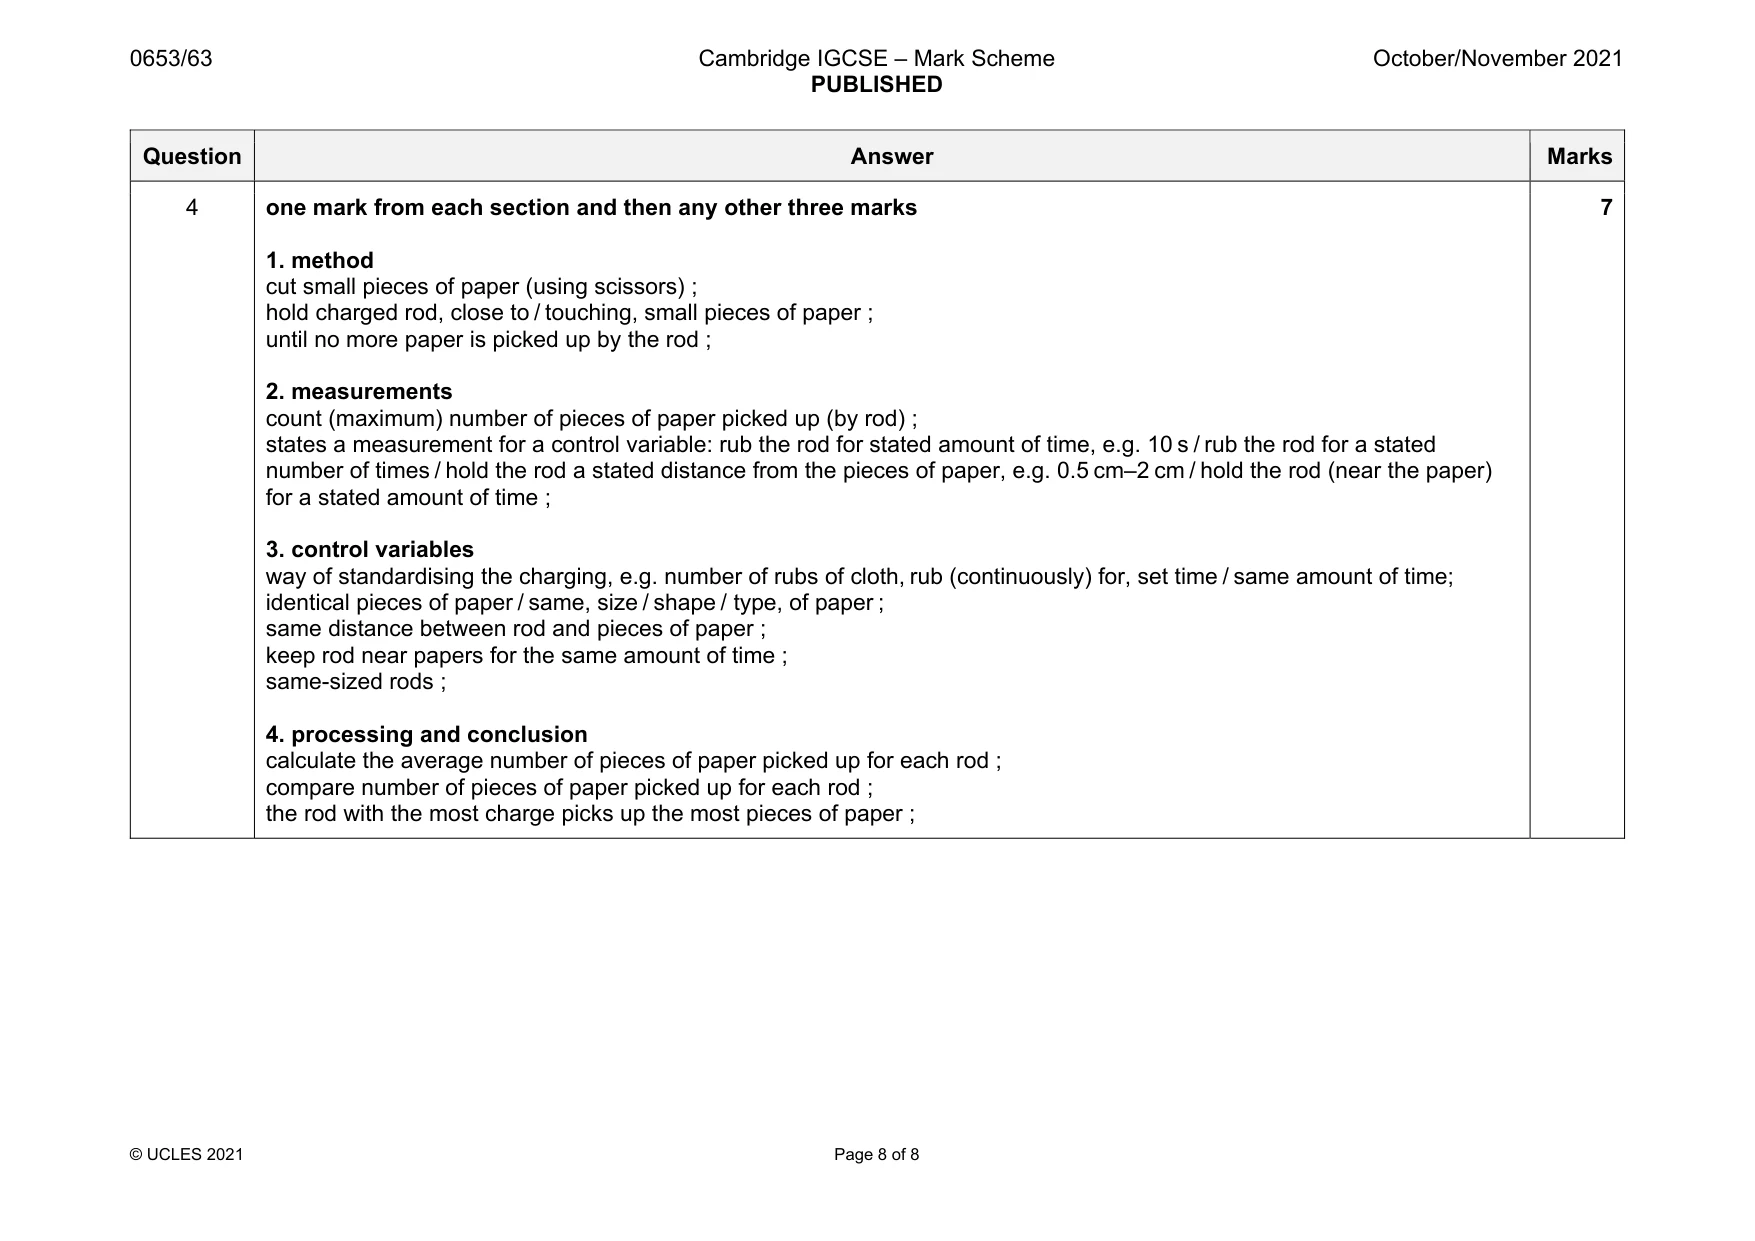
Mark scheme: 4 one mark from each section and then any other three marks 1. method cut small pieces of paper (using scissors) ; hold charged rod, close to / touching, small pieces of paper ; until no more paper is picked up by the rod ; 2. measurements count (maximum) number of pieces of paper picked up (by rod) ; states a measurement for a control variable: rub the rod for stated amount of time, e.g. 10 s / rub the rod for a stated number of times / hold the rod a stated distance from the pieces of paper, e.g. 0.5 cm–2 cm / hold the rod (near the paper) for a stated amount of time ; 3. control variables way of standardising the charging, e.g. number of rubs of cloth, rub (continuously) for, set time / same amount of time; identical pieces of paper / same, size / shape / type, of paper ; same distance between rod and pieces of paper ; keep rod near papers for the same amount of time ; same-sized rods ; 4. processing and conclusion calculate the average number of pieces of paper picked up for each rod ; compare number of pieces of paper picked up for each rod ; the rod with the most charge picks up the most pieces of paper ;
What was in this paper
The subtopics covered by these 4 questions, and how many questions each got. Open one in a new tab to see every Cambridge question on it.
What you needed in this session
Cambridge’s own grade thresholds for 2021 Oct/Nov, Paper 6 · Variant 3. A higher threshold means an easier paper — the bar moves with how the cohort did.