Cambridge IGCSE Science - Combined 0653 — 2021 Oct/Nov Paper 6 · Variant 1
0653/61/O/N/21 · 4 questions · 40 marks · ≈45 min
The question paper and its mark scheme, free to read here and free to download. This is Cambridge’s own paper, exactly as it was sat.
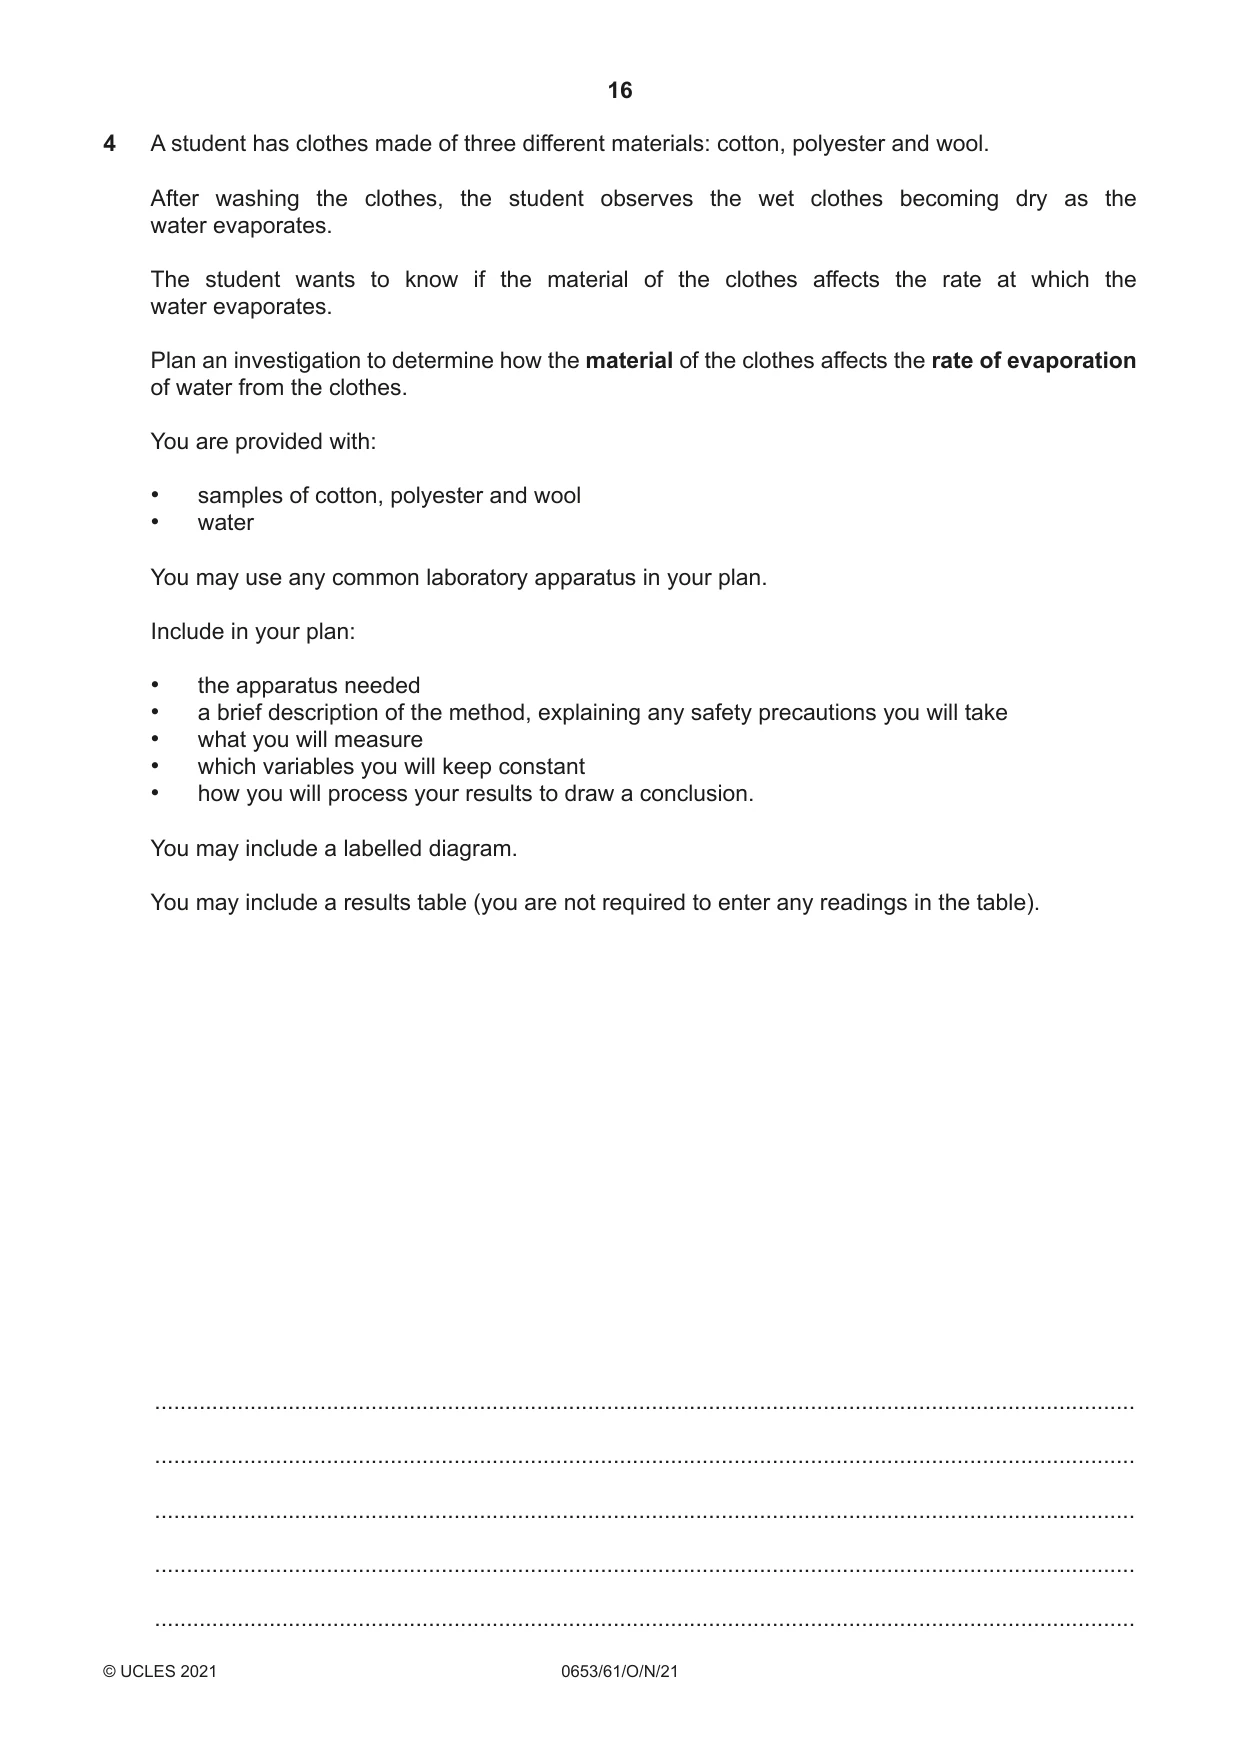
Question paper20 pages






Mark scheme8 pages
Answers below. Sit the paper first if you are practising.
Questions as text
Q1 · Two animals, one from a cold climate and one from a hot climate
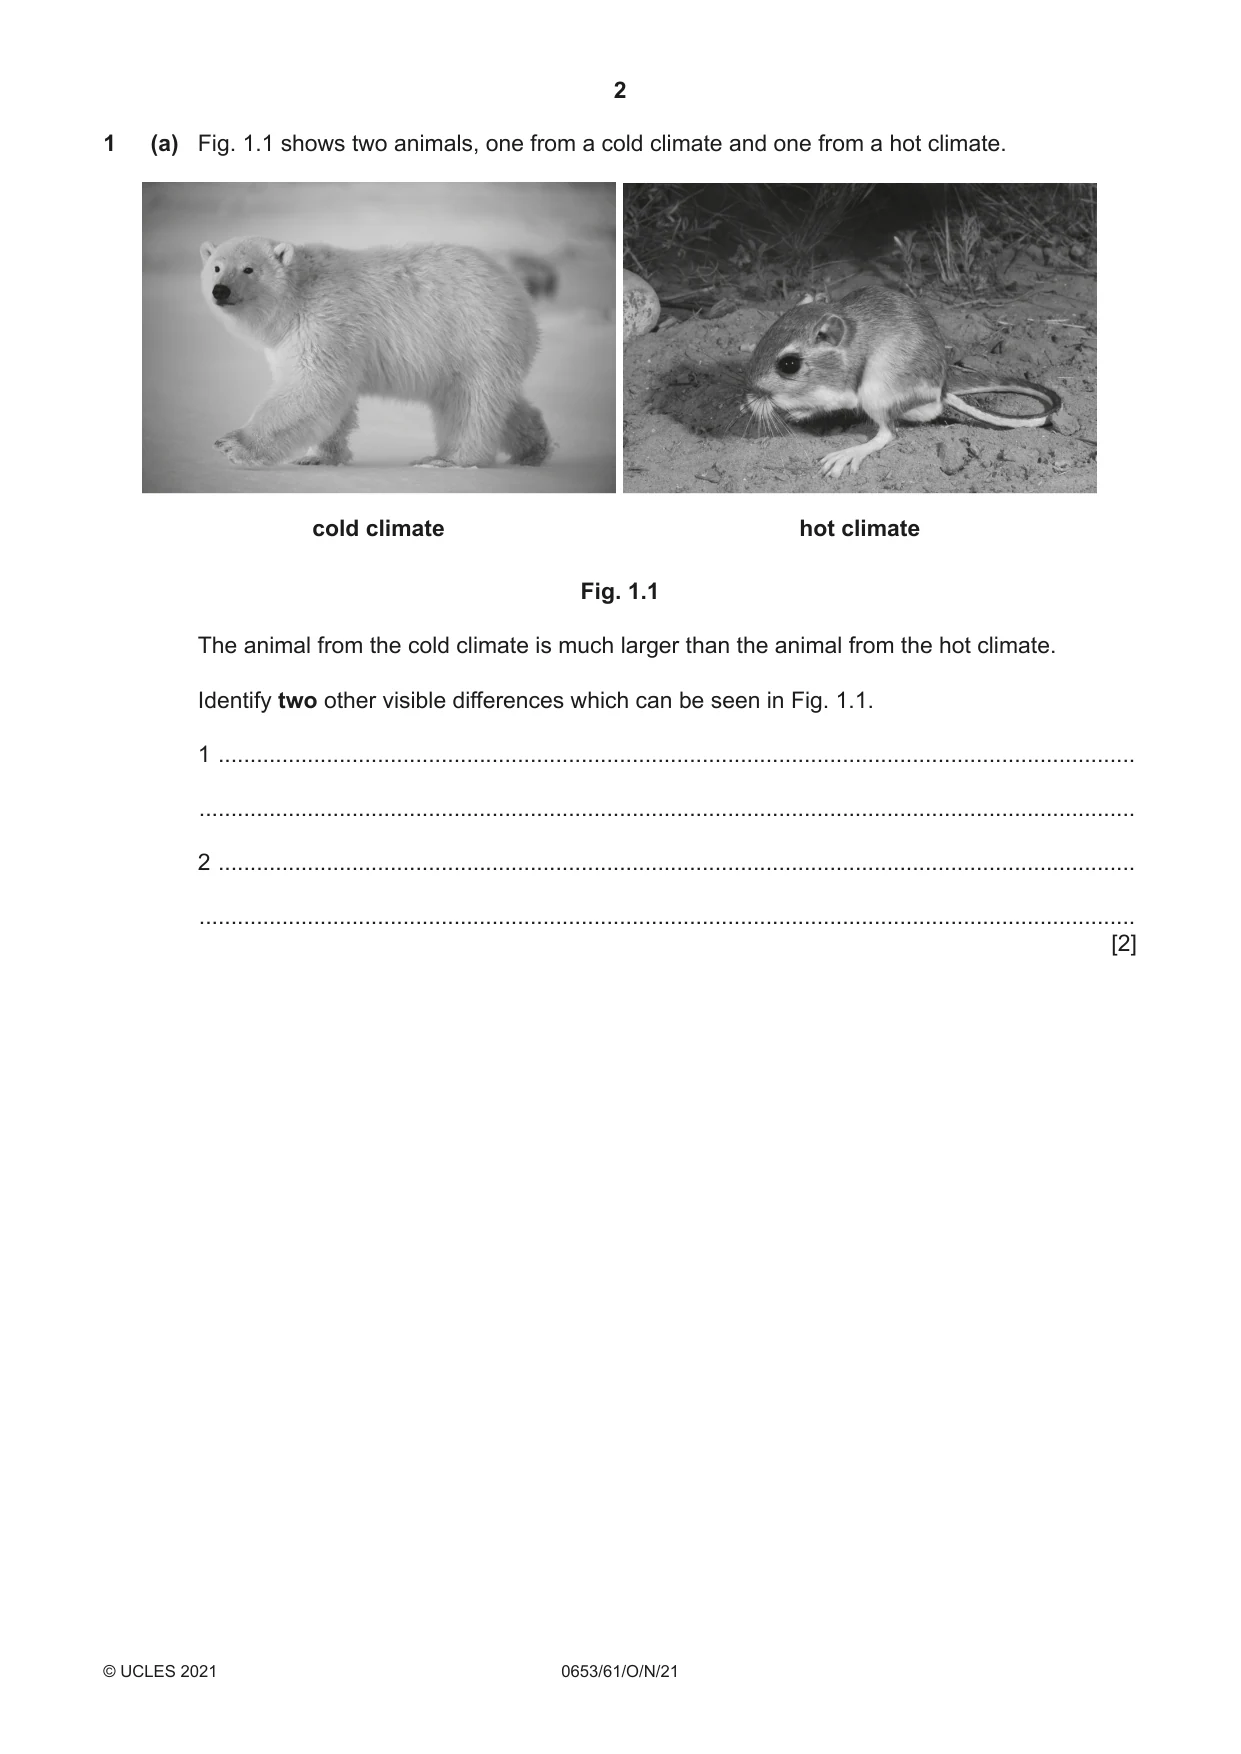
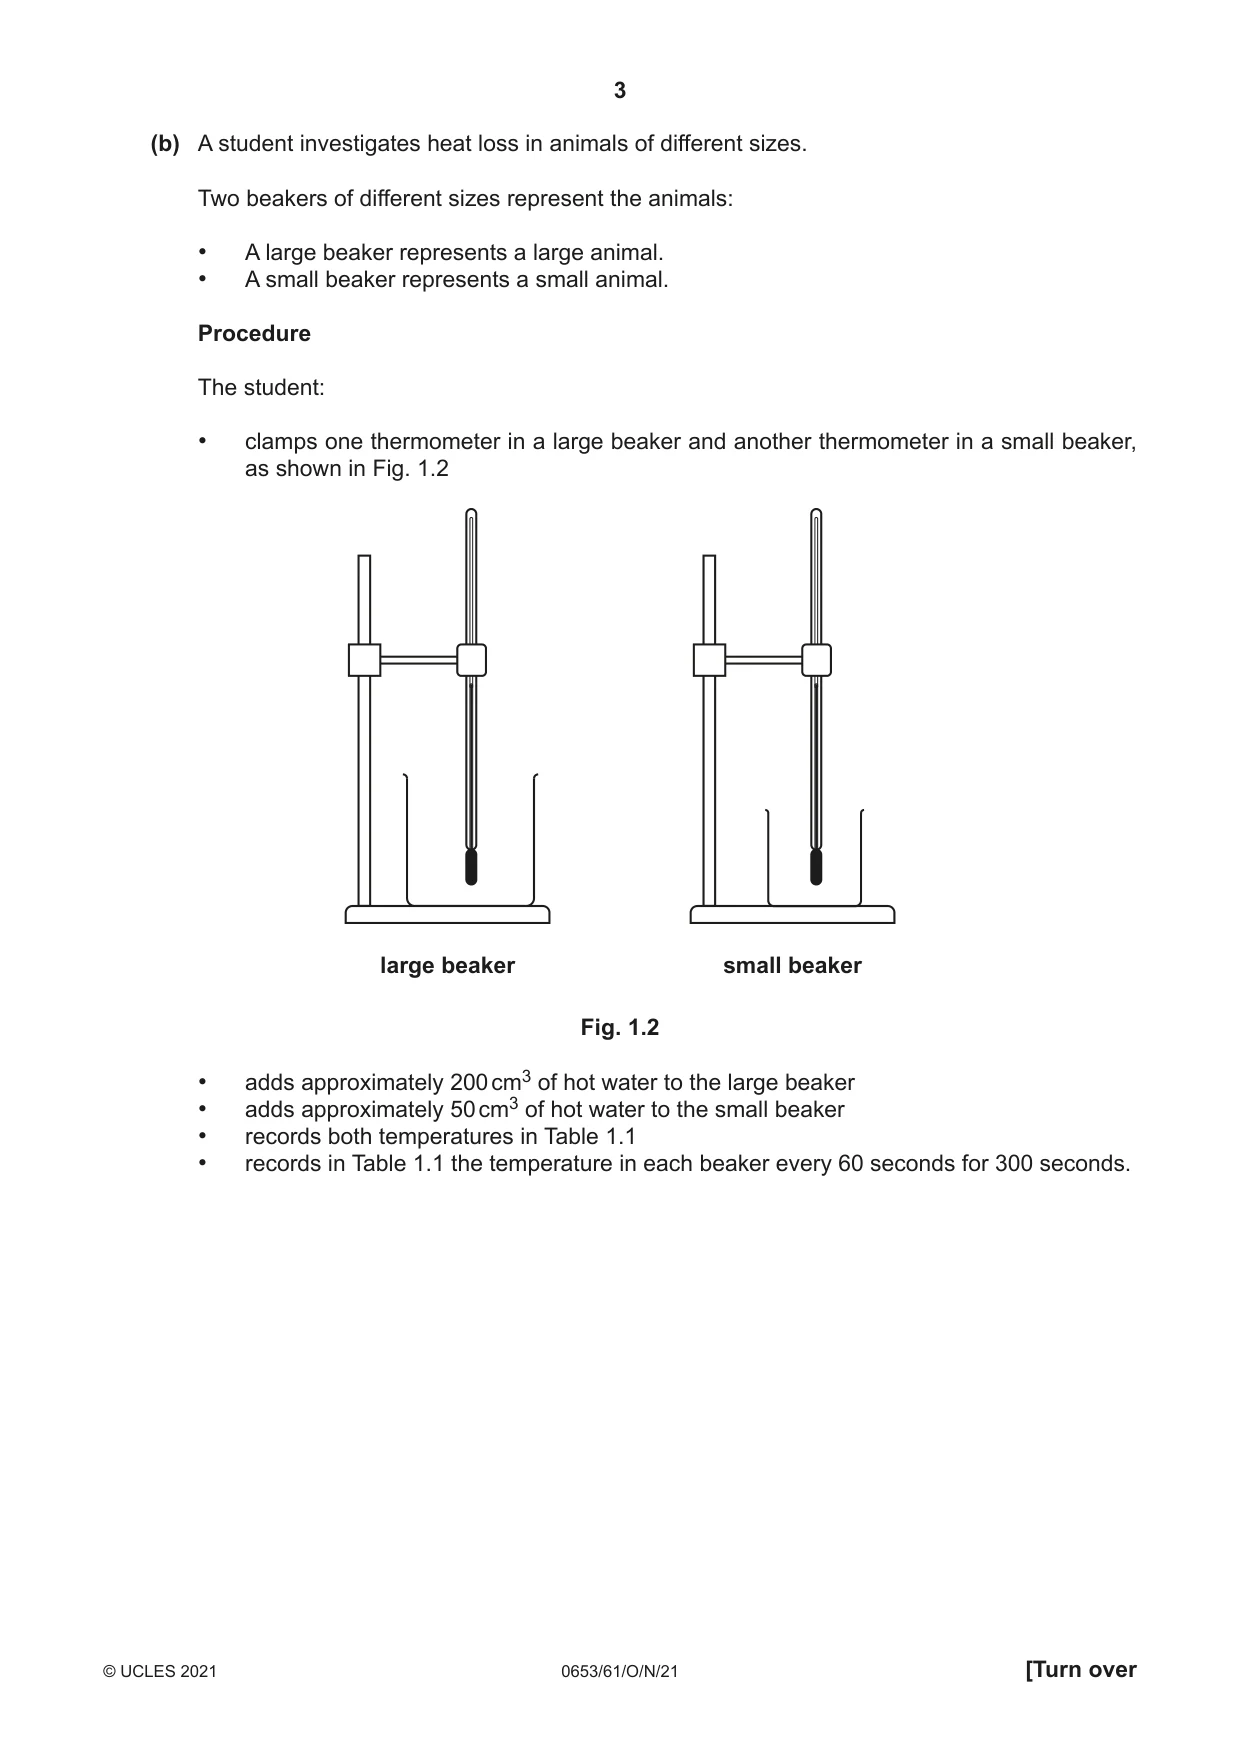
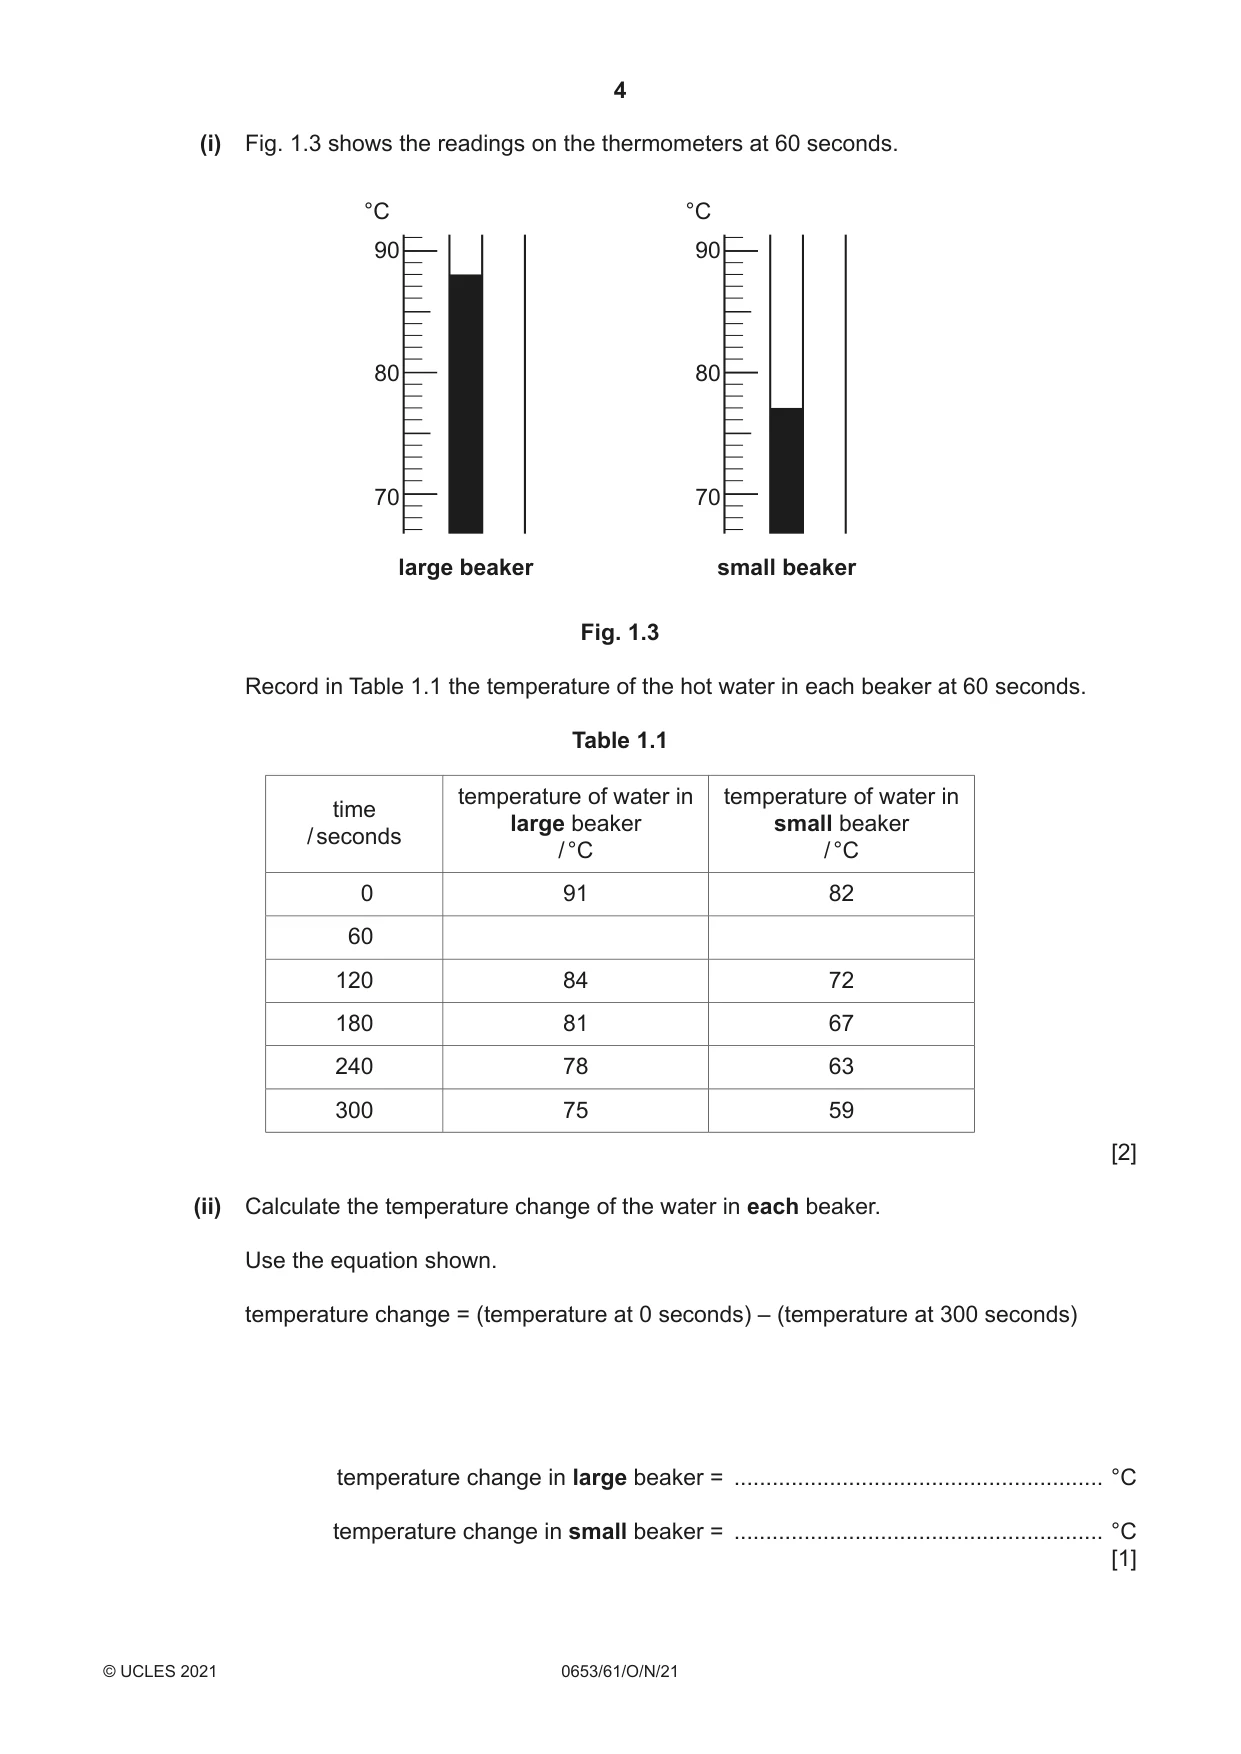
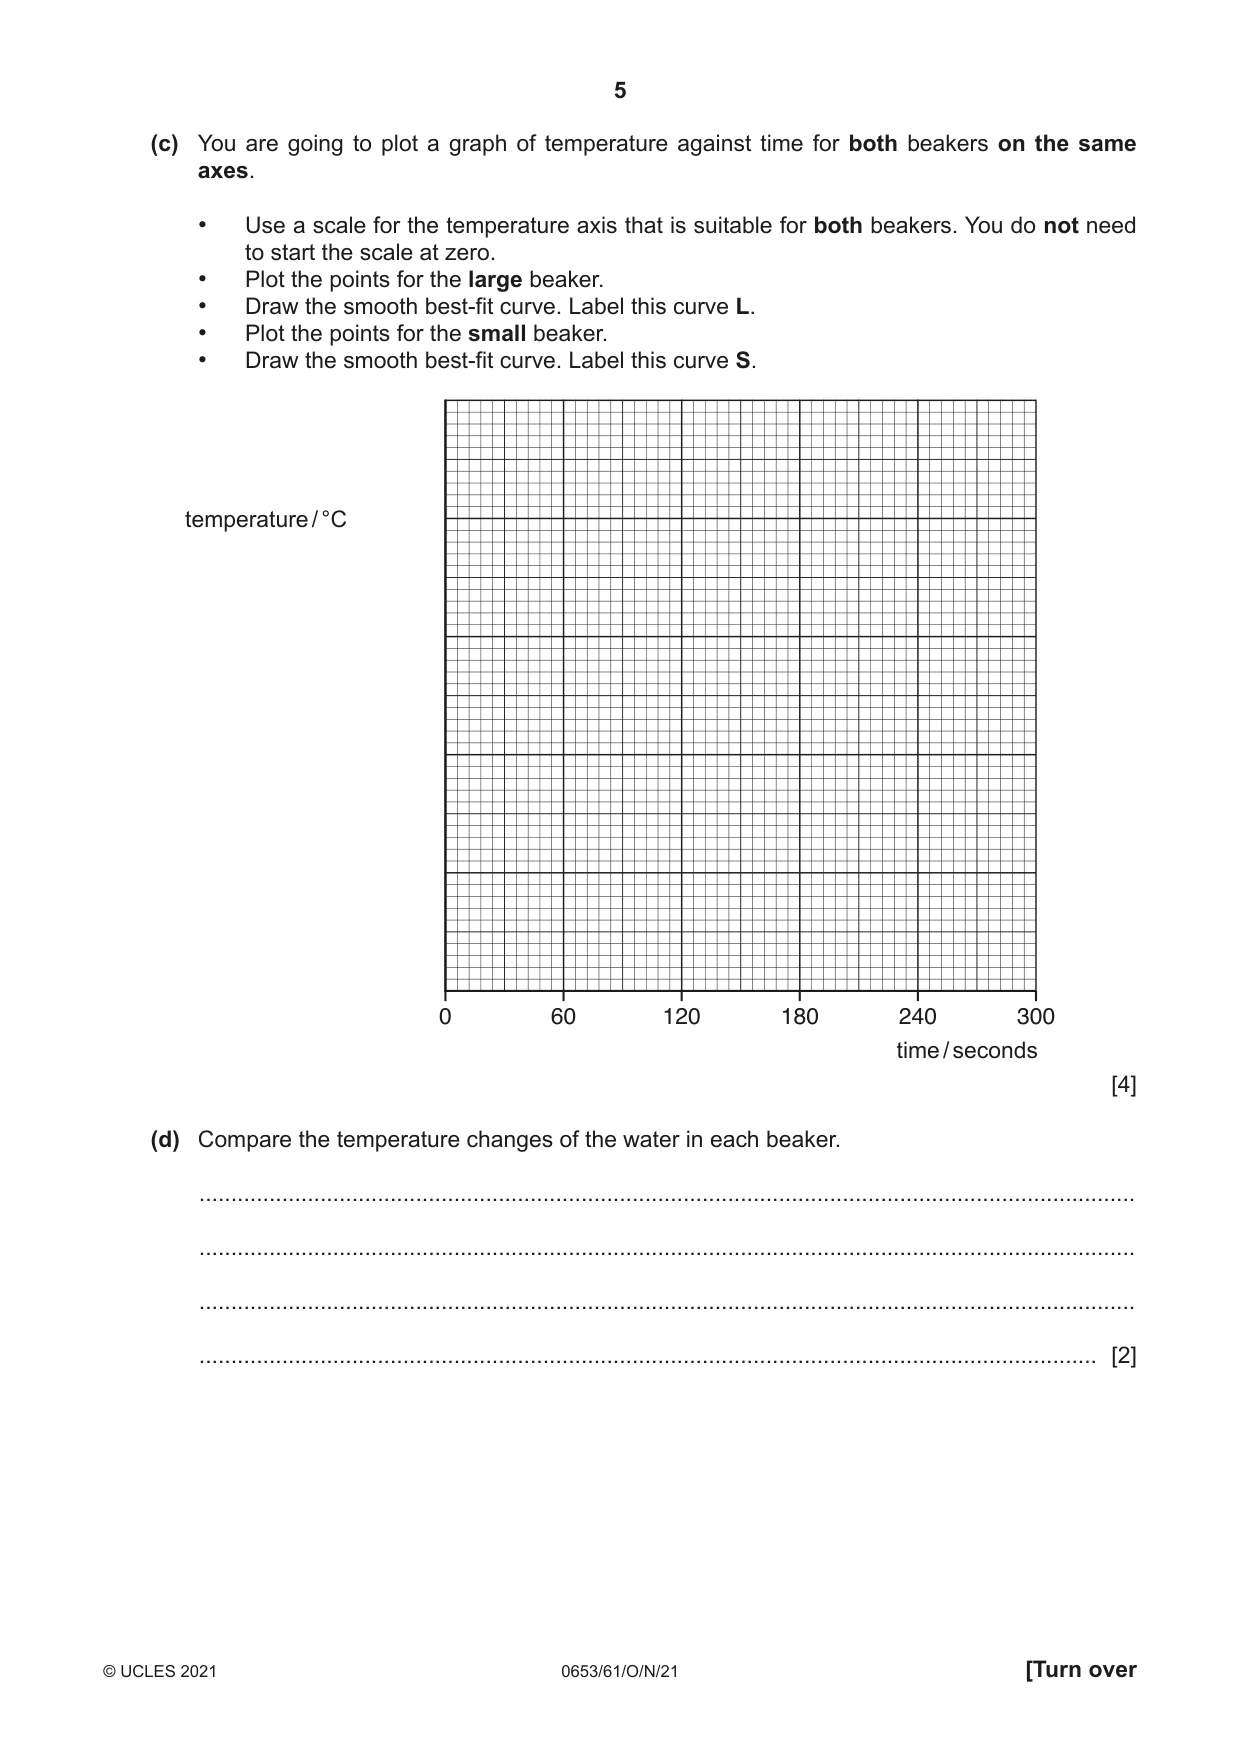
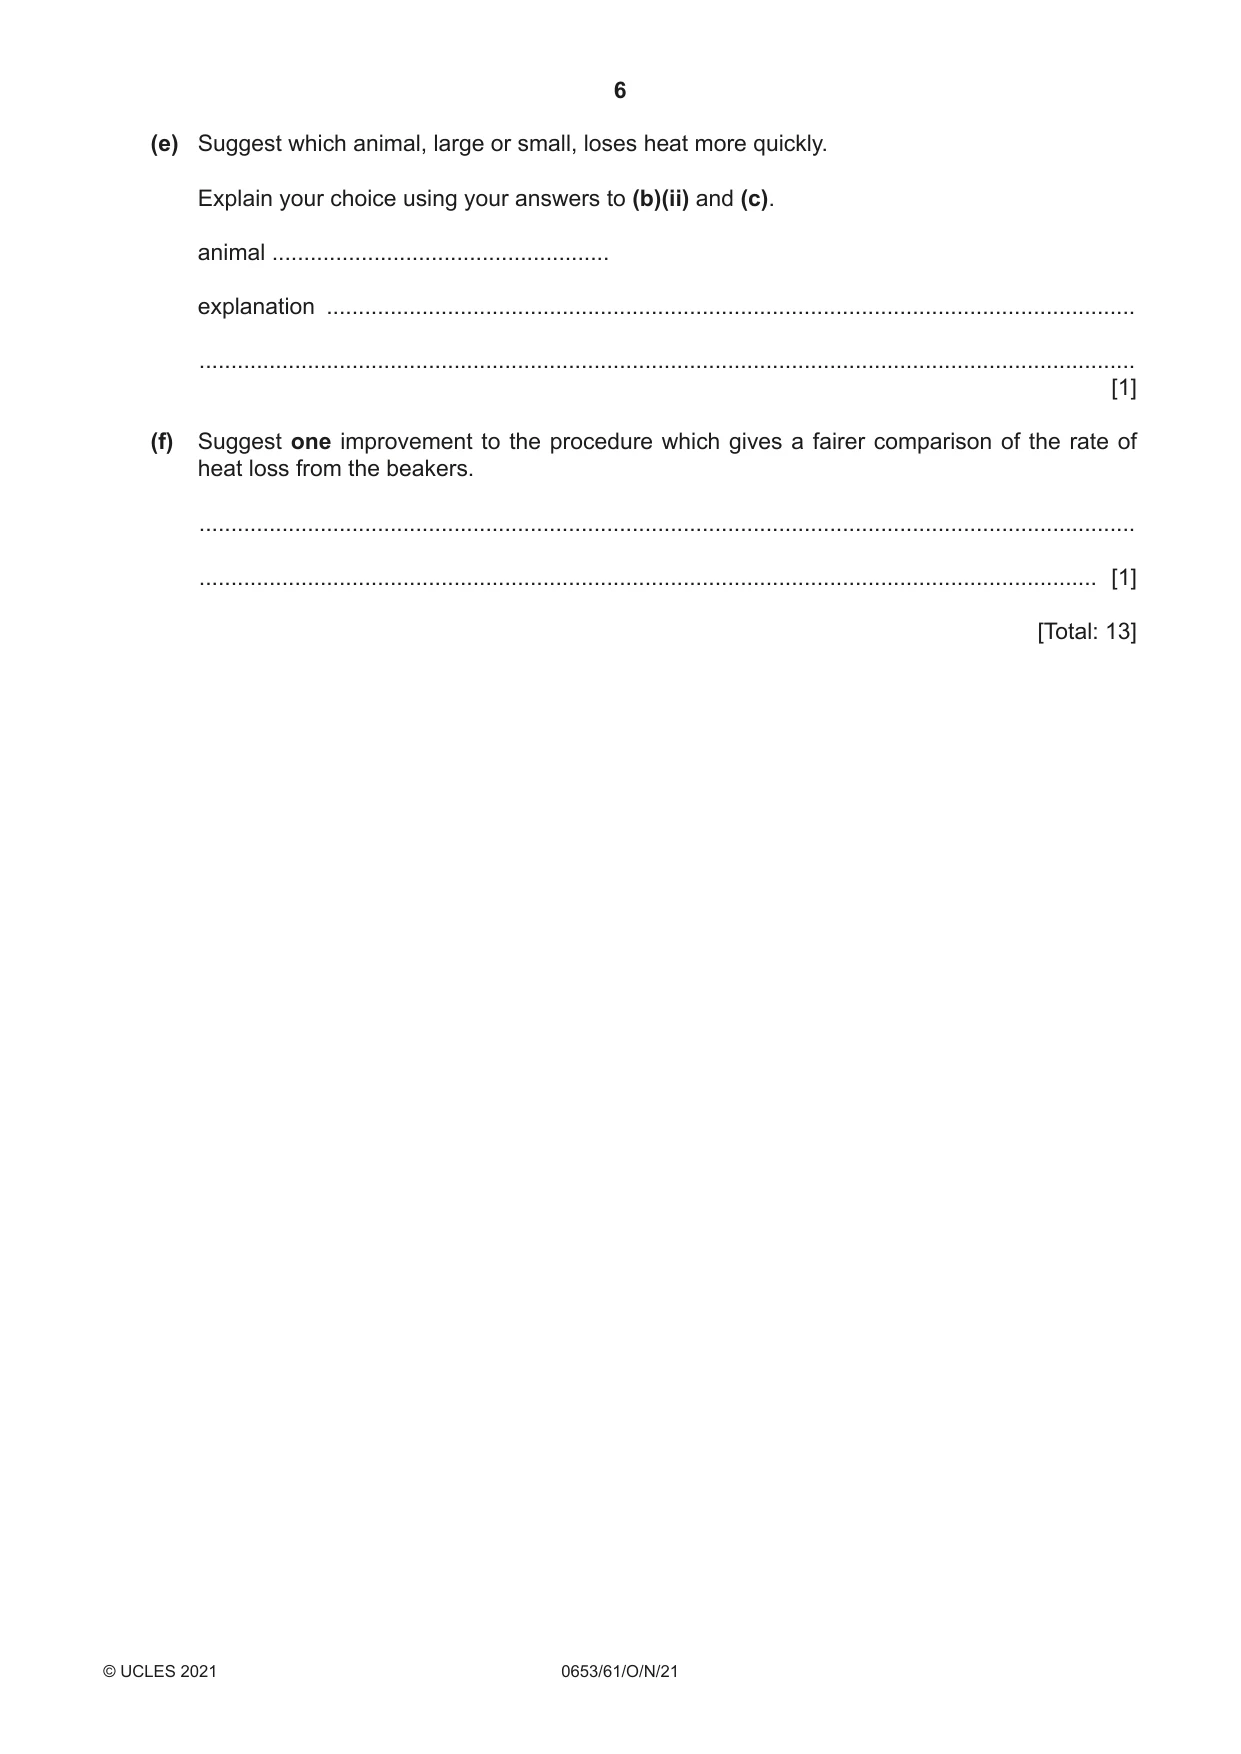
1 (a) Fig. 1.1 shows two animals, one from a cold climate and one from a hot climate. cold climate hot climate Fig. 1.1 The animal from the cold climate is much larger than the animal from the hot climate. Identify two other visible differences which can be seen in Fig. 1.1. 1 ................................................................................................................................................ ................................................................................................................................................... 2 ................................................................................................................................................ ................................................................................................................................................... [2] (b) A student investigates heat loss in animals of different sizes. Two beakers of different sizes represent the animals: • A large beaker represents a large animal. • A small beaker represents a small animal. Procedure The student: • clamps one thermometer in a large beaker and another thermometer in a small beaker, as shown in Fig. 1.2 large beaker small beaker Fig. 1.2 • adds approximately 200 cm3 of hot water to the large beaker • adds approximately 50 cm3 of hot water to the small beaker • records both temperatures in Table 1.1 • records in Table 1.1 the temperature in each beaker every 60 seconds for 300 seconds. (i) Fig. 1.3 shows the readings on the thermometers at 60 seconds. °C °C 90 90 80 80 70 70 large beaker small beaker Fig. 1.3 Record in Table 1.1 the temperature of the hot water in each beaker at 60 seconds. Table 1.1 temperature of water in temperature of water in time large beaker small beaker / seconds / °C / °C 0 91 82 60 120 84 72 180 81 67 240 78 63 300 75 59 [2] (ii) Calculate the temperature change of the water in each beaker. Use the equation shown. temperature change = (temperature at 0 seconds) – (temperature at 300 seconds) temperature change in large beaker = .......................................................... °C temperature change in small beaker = .......................................................... °C [1] (c) You are going to plot a graph of temperature against time for both beakers on the same axes. • Use a scale for the temperature axis that is suitable for both beakers. You do not need to start the scale at zero. • Plot the points for the large beaker. • Draw the smooth best‑fit curve. Label this curve L. • Plot the points for the small beaker. • Draw the smooth best‑fit curve. Label this curve S. temperature / °C 0 60 120 180 240 300 time / seconds [4] (d) Compare the temperature changes of the water in each beaker. ................................................................................................................................................... ................................................................................................................................................... ................................................................................................................................................... ............................................................................................................................................. [2] (e) Suggest which animal, large or small, loses heat more quickly. Explain your choice using your answers to (b)(ii) and (c). animal ..................................................... explanation ............................................................................................................................... ................................................................................................................................................... [1] (f) Suggest one improvement to the procedure which gives a fairer comparison of the rate of heat loss from the beakers. ................................................................................................................................................... ............................................................................................................................................. [1] [Total: 13]
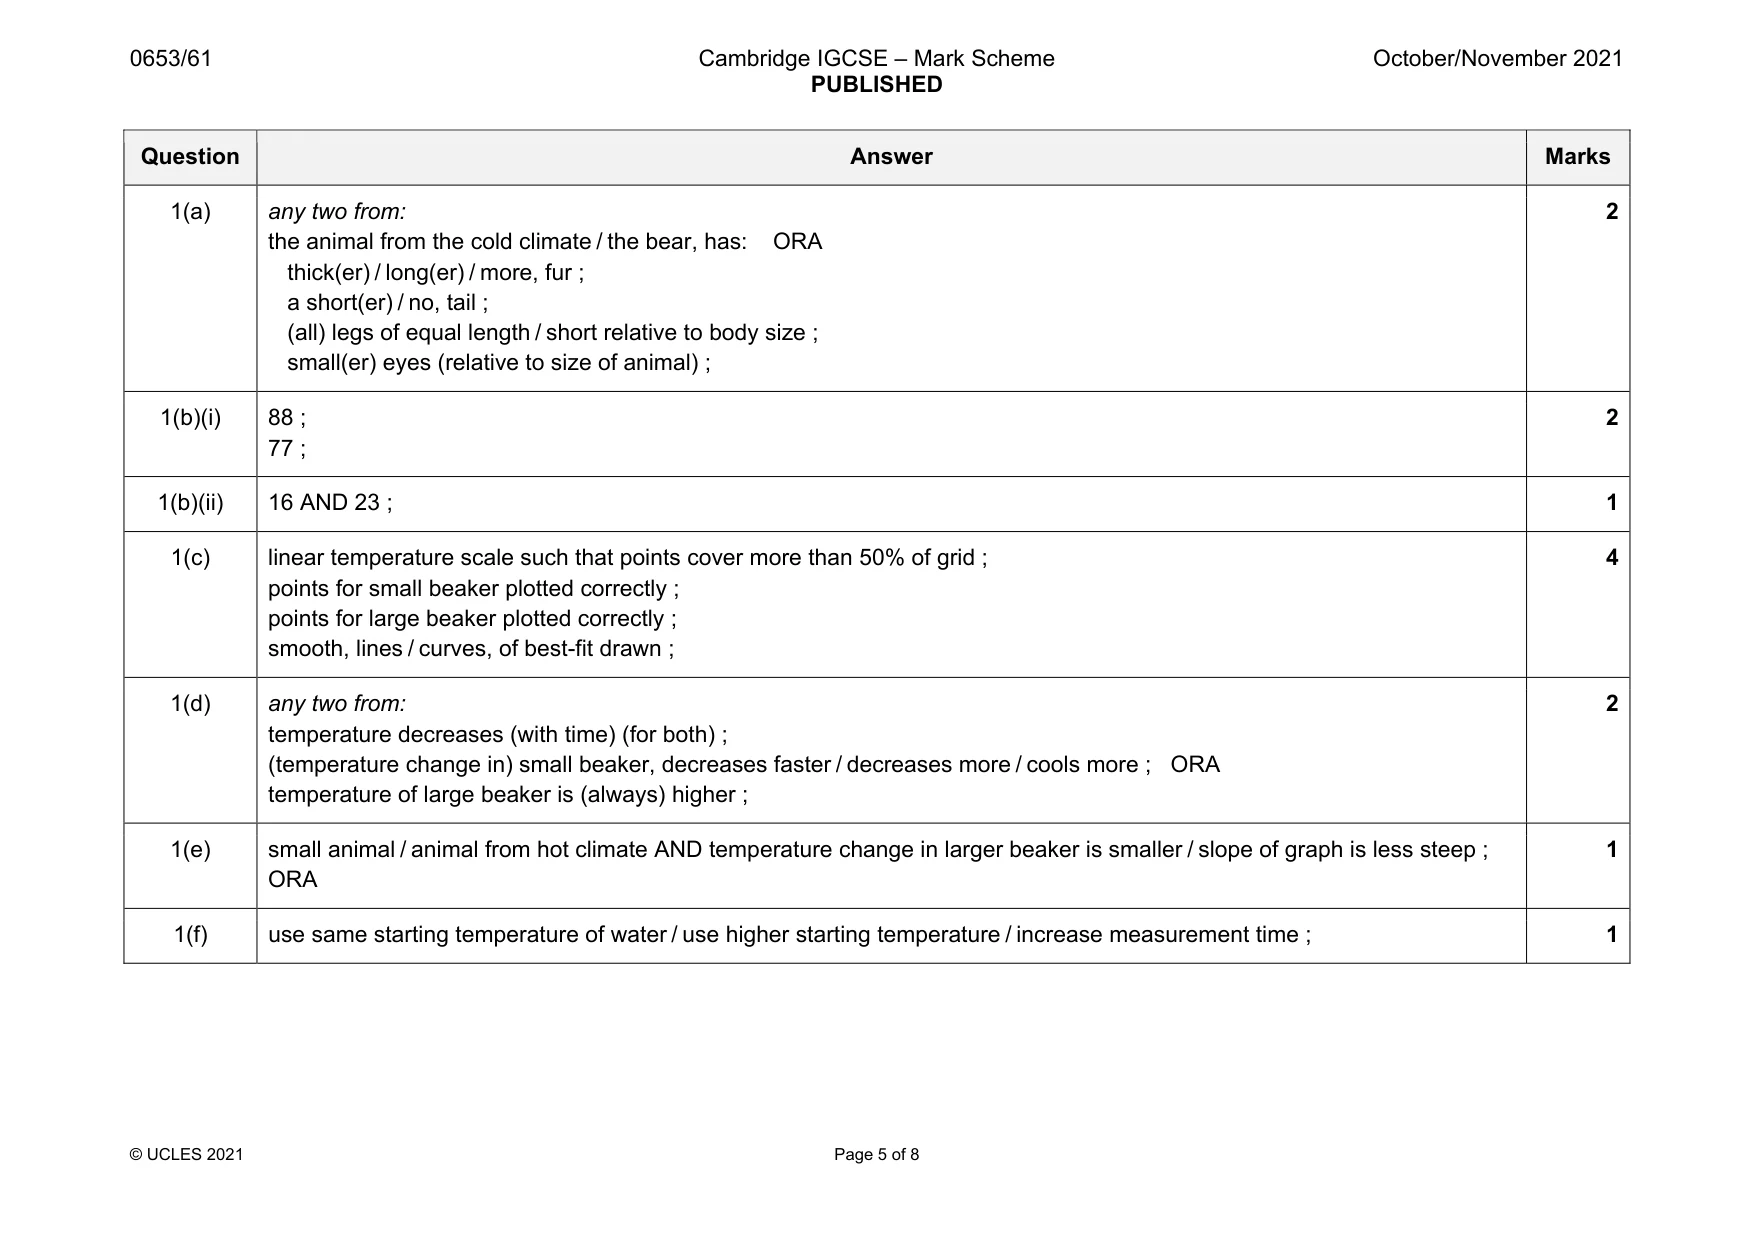
Mark scheme: 1(a) any two from: the animal from the cold climate / the bear, has: ORA thick(er) / long(er) / more, fur ; a short(er) / no, tail ; (all) legs of equal length / short relative to body size ; small(er) eyes (relative to size of animal) ; 2 1(b)(i) 88 ; 77 ; 2 1(b)(ii) 16 AND 23 ; 1 1(c) linear temperature scale such that points cover more than 50% of grid ; points for small beaker plotted correctly ; points for large beaker plotted correctly ; smooth, lines / curves, of best-fit drawn ; 4 1(d) any two from: temperature decreases (with time) (for both) ; (temperature change in) small beaker, decreases faster / decreases more / cools more ; ORA temperature of large beaker is (always) higher ; 2 1(e) small animal / animal from hot climate AND temperature change in larger beaker is smaller / slope of graph is less steep ; ORA 1 1(f) use same starting temperature of water / use higher starting temperature / increase measurement time ; 1
Q2 · A student prepares a sample of the blue salt, copper(II) sulfate
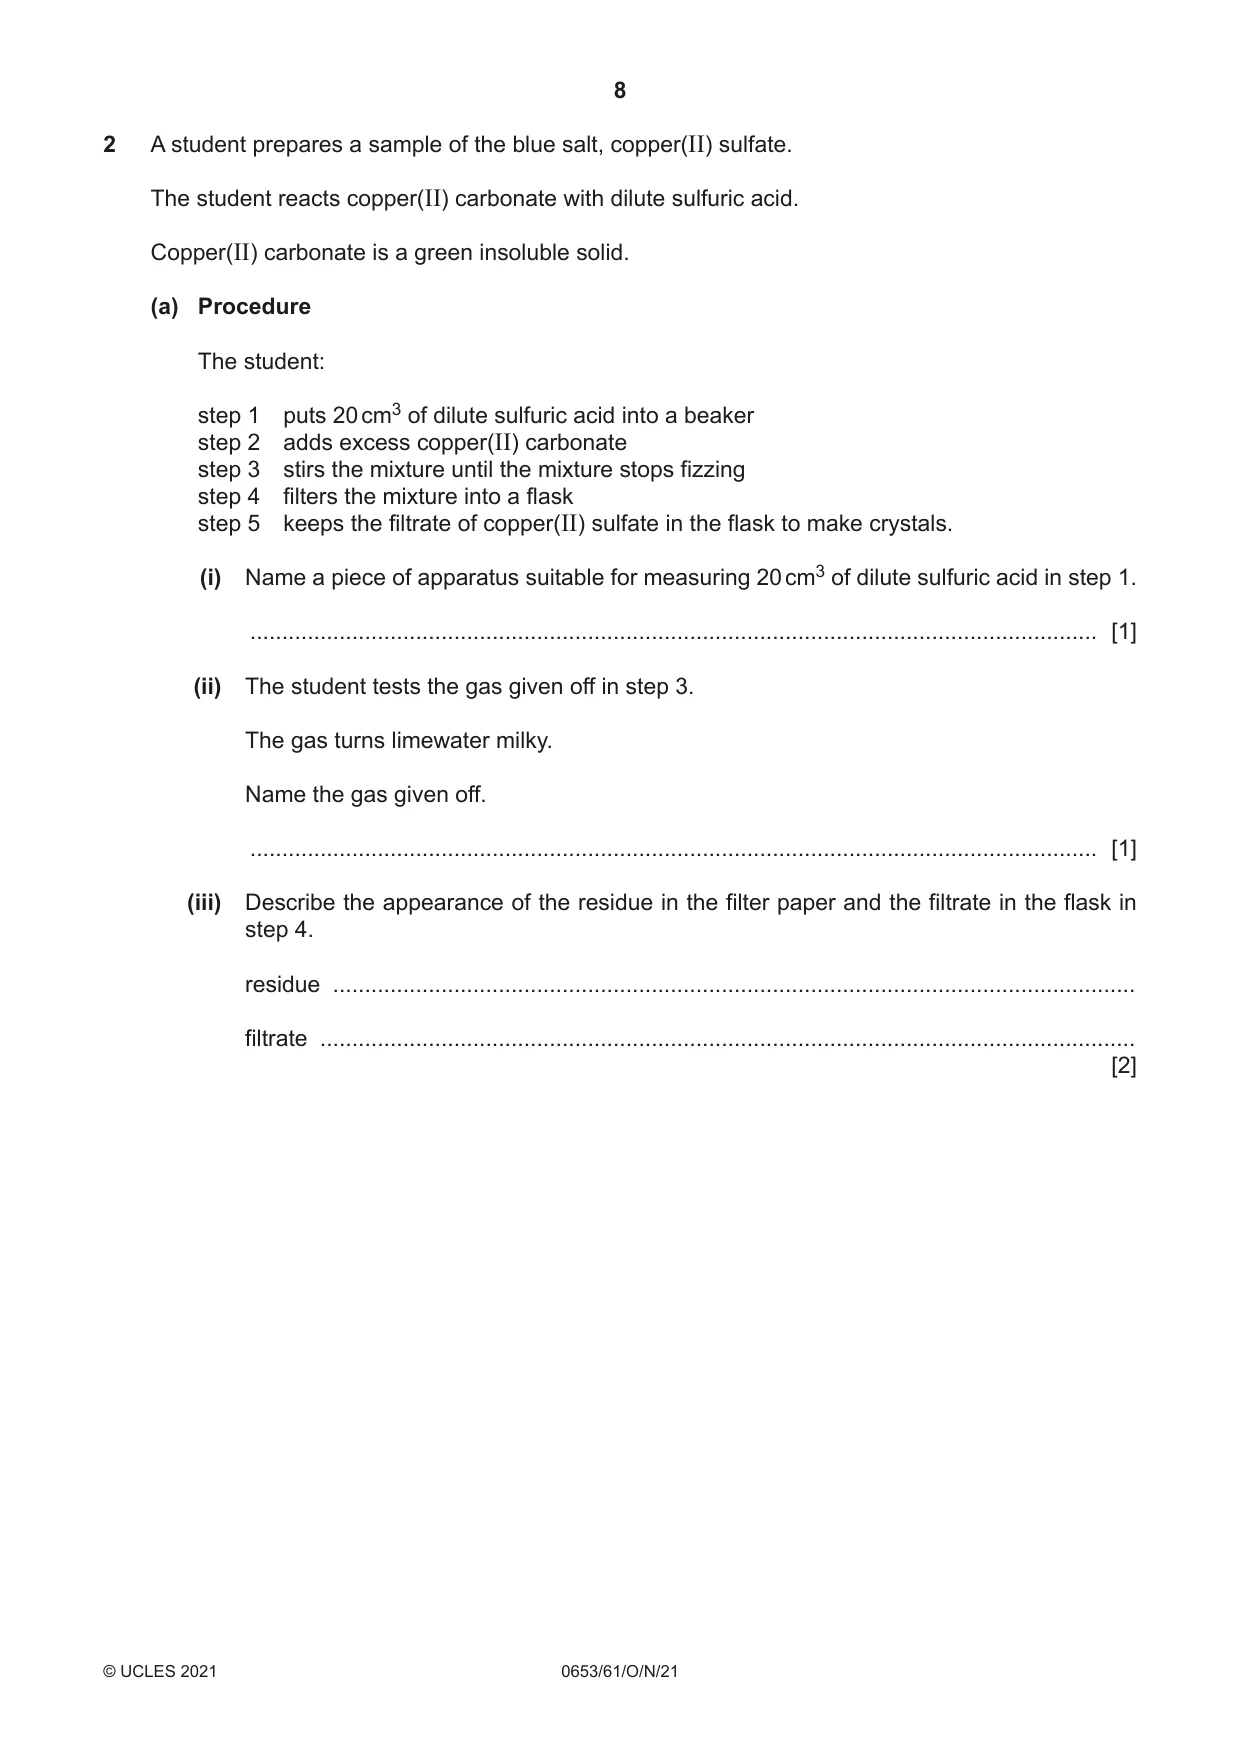
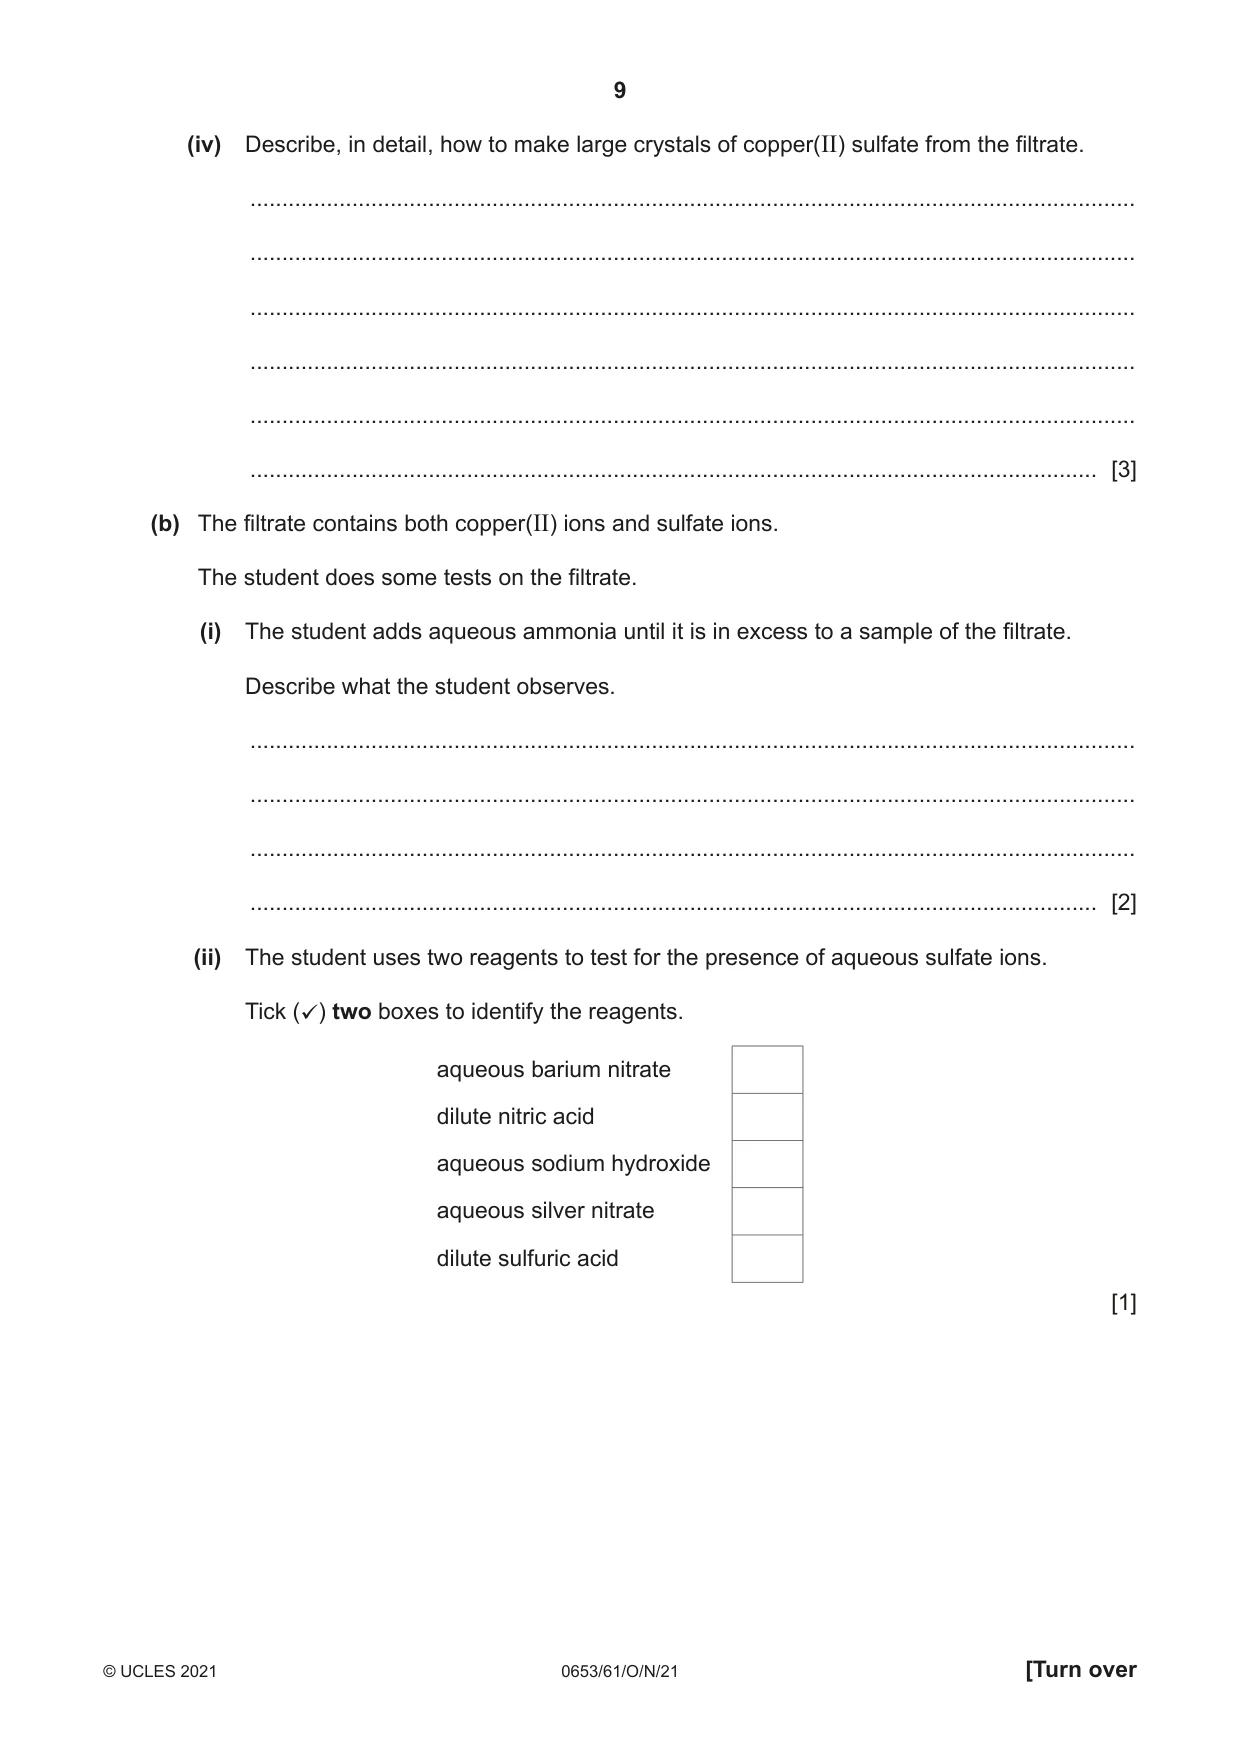
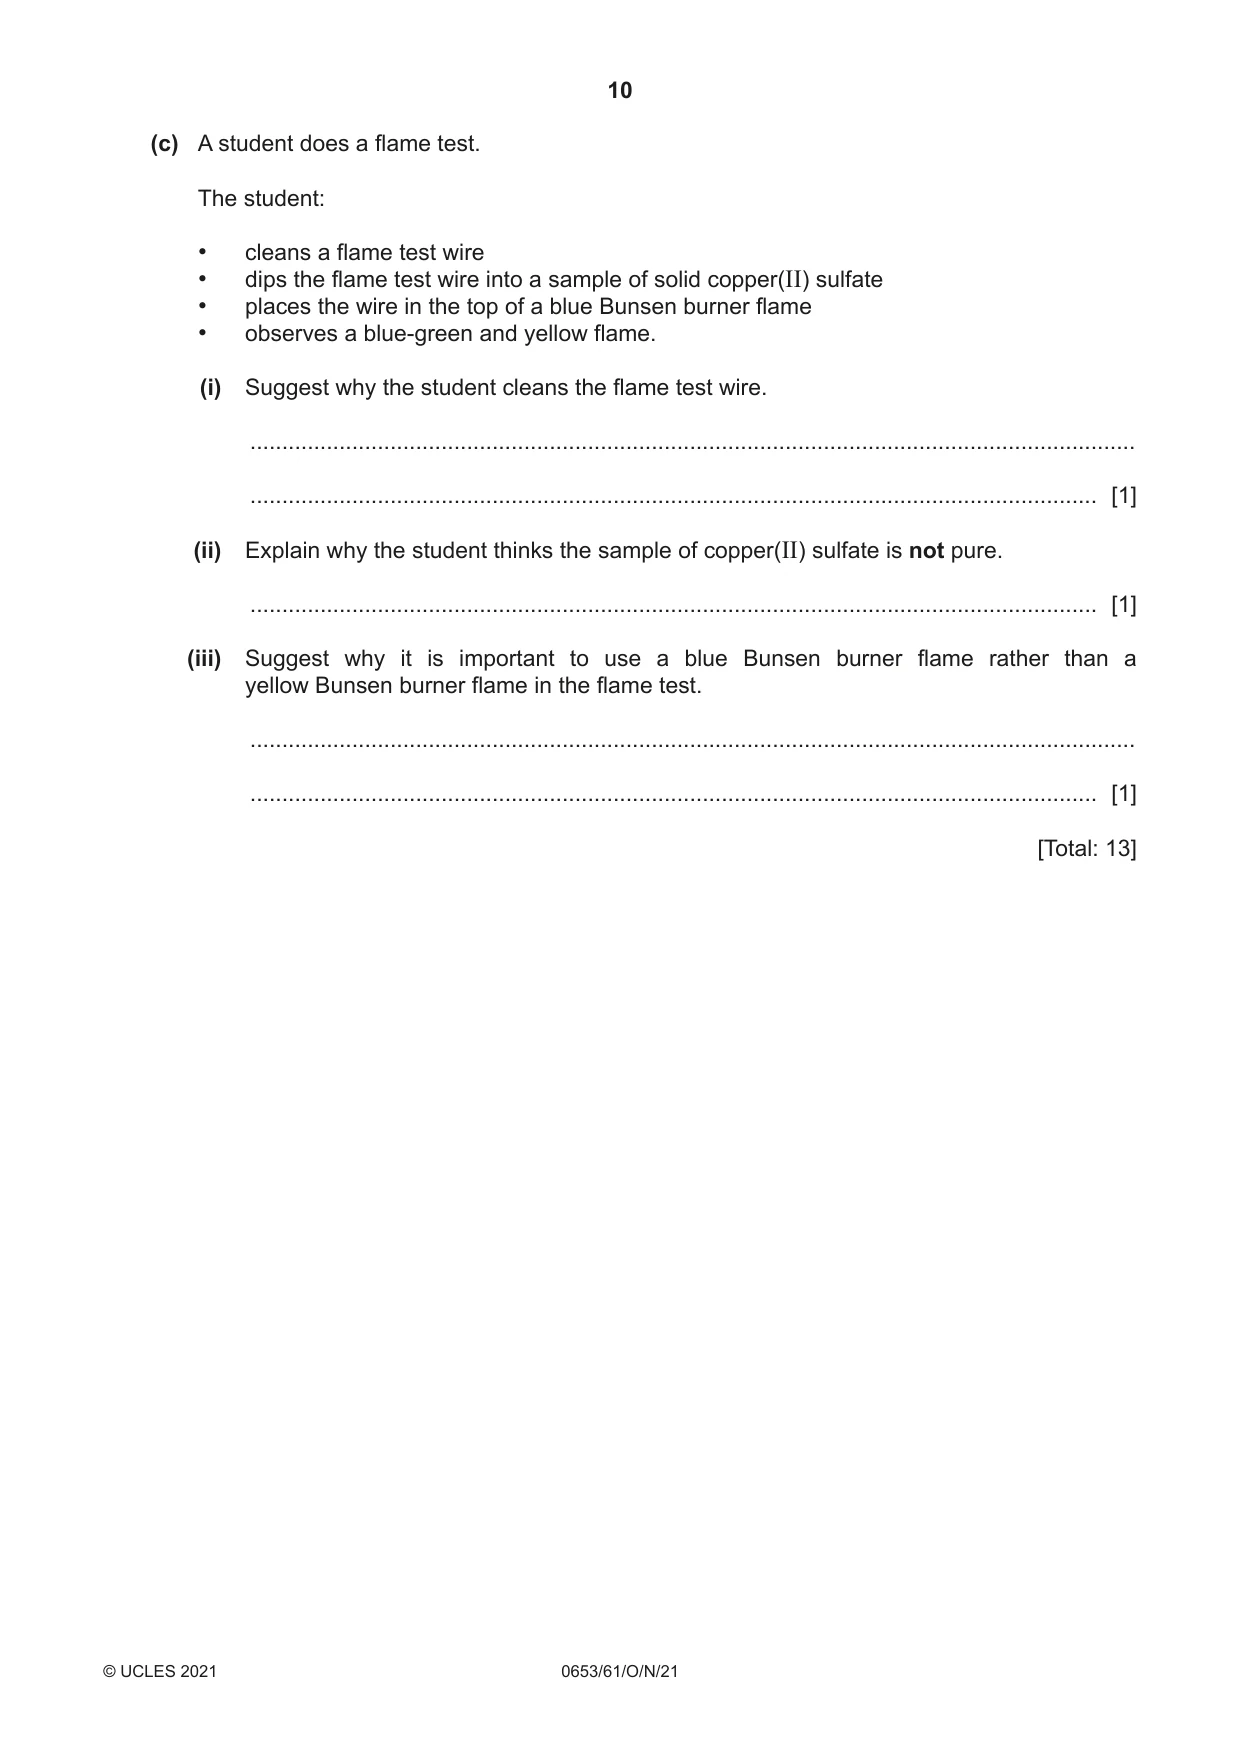
2 A student prepares a sample of the blue salt, copper(II) sulfate. The student reacts copper(II) carbonate with dilute sulfuric acid. Copper(II) carbonate is a green insoluble solid. (a) Procedure The student: step 1 puts 20 cm3 of dilute sulfuric acid into a beaker step 2 adds excess copper(II) carbonate step 3 stirs the mixture until the mixture stops fizzing step 4 filters the mixture into a flask step 5 keeps the filtrate of copper(II) sulfate in the flask to make crystals. (i) Name a piece of apparatus suitable for measuring 20 cm3 of dilute sulfuric acid in step 1. ..................................................................................................................................... [1] (ii) The student tests the gas given off in step 3. The gas turns limewater milky. Name the gas given off. ..................................................................................................................................... [1] (iii) Describe the appearance of the residue in the filter paper and the filtrate in the flask in step 4. residue .............................................................................................................................. filtrate ................................................................................................................................ [2] (iv) Describe, in detail, how to make large crystals of copper(II) sulfate from the filtrate. ........................................................................................................................................... ........................................................................................................................................... ........................................................................................................................................... ........................................................................................................................................... ........................................................................................................................................... ..................................................................................................................................... [3] (b) The filtrate contains both copper(II) ions and sulfate ions. The student does some tests on the filtrate. (i) The student adds aqueous ammonia until it is in excess to a sample of the filtrate. Describe what the student observes. ........................................................................................................................................... ........................................................................................................................................... ........................................................................................................................................... ..................................................................................................................................... [2] (ii) The student uses two reagents to test for the presence of aqueous sulfate ions. Tick () two boxes to identify the reagents. aqueous barium nitrate dilute nitric acid aqueous sodium hydroxide aqueous silver nitrate dilute sulfuric acid [1] (c) A student does a flame test. The student: • cleans a flame test wire • dips the flame test wire into a sample of solid copper(II) sulfate • places the wire in the top of a blue Bunsen burner flame • observes a blue‑green and yellow flame. (i) Suggest why the student cleans the flame test wire. ........................................................................................................................................... ..................................................................................................................................... [1] (ii) Explain why the student thinks the sample of copper(II) sulfate is not pure. ..................................................................................................................................... [1] (iii) Suggest why it is important to use a blue Bunsen burner flame rather than a yellow Bunsen burner flame in the flame test. ........................................................................................................................................... ..................................................................................................................................... [1] [Total: 13]
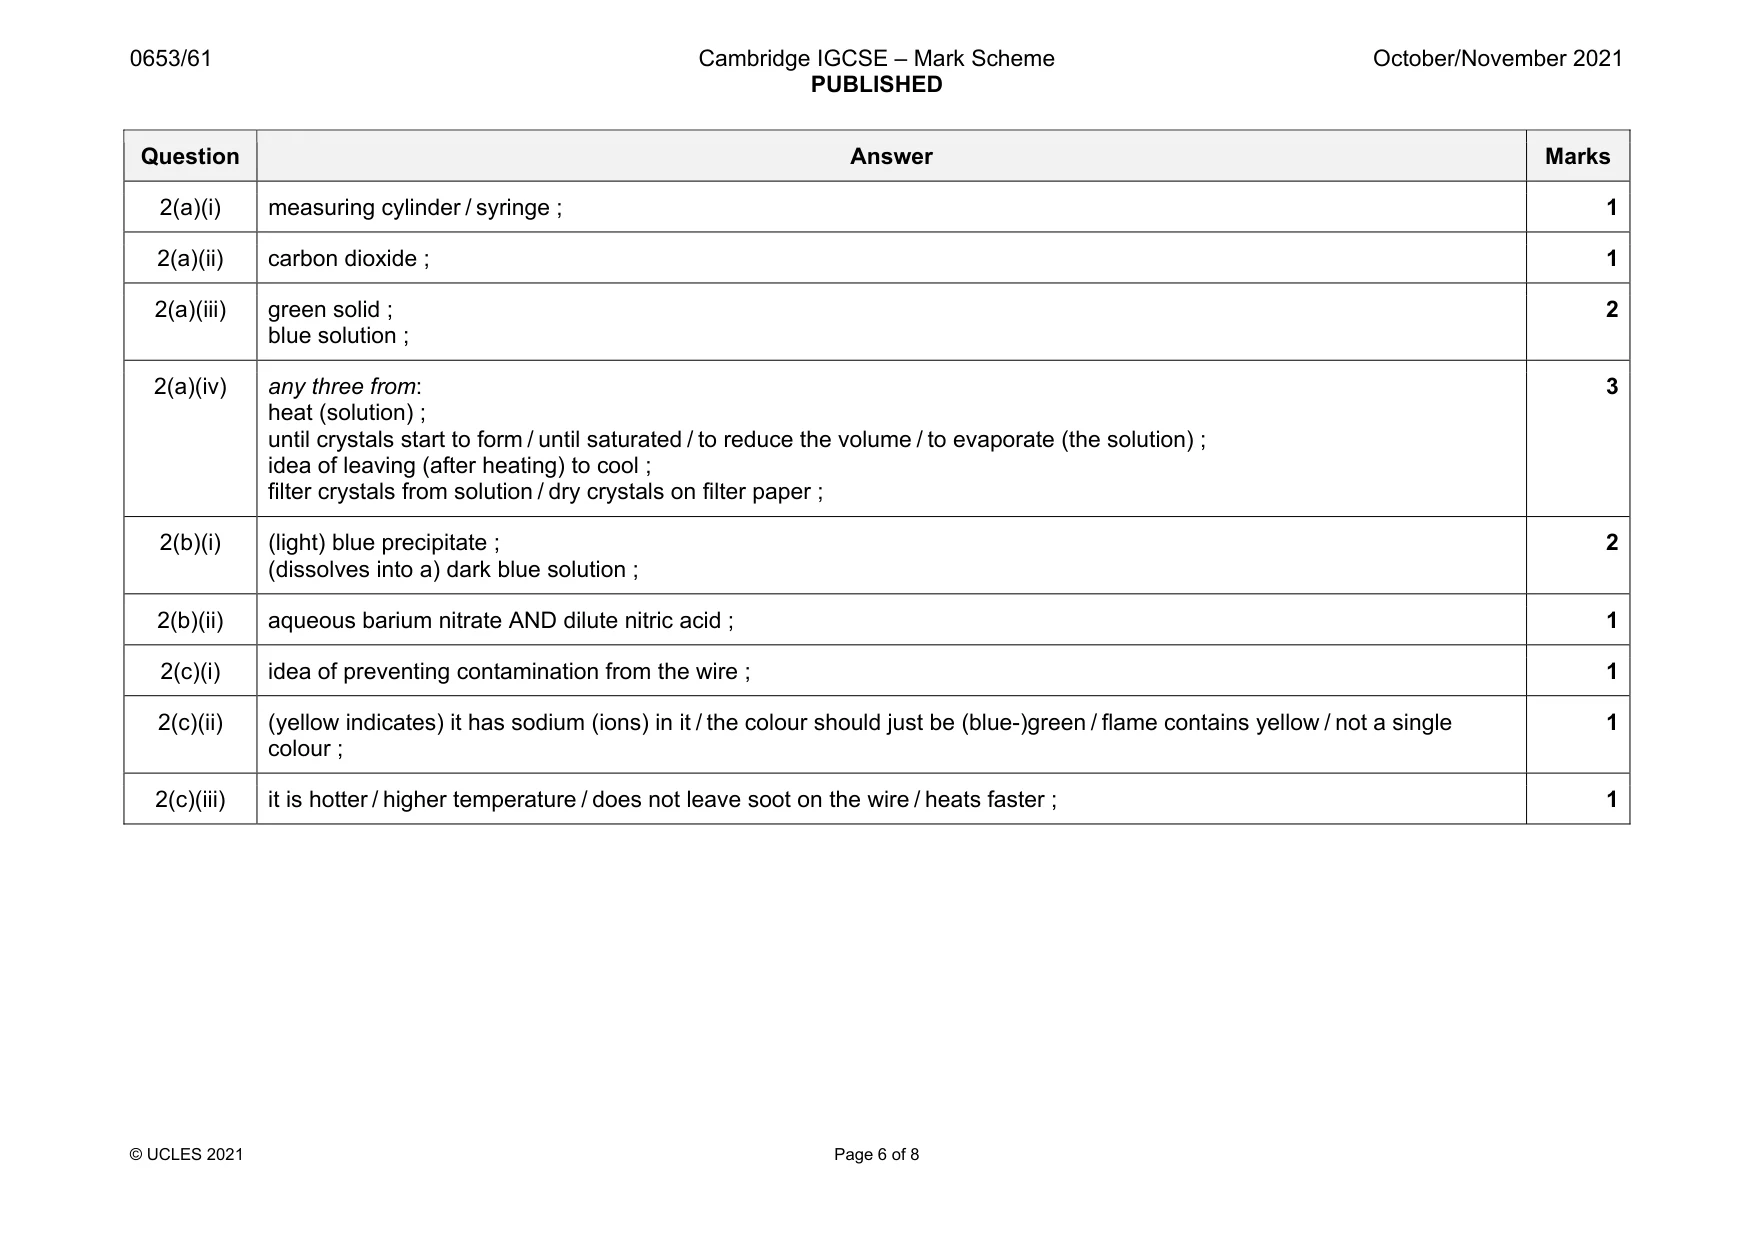
Mark scheme: 2(a)(i) measuring cylinder / syringe ; 1 2(a)(ii) carbon dioxide ; 1 2(a)(iii) green solid ; blue solution ; 2 2(a)(iv) any three from: heat (solution) ; until crystals start to form / until saturated / to reduce the volume / to evaporate (the solution) ; idea of leaving (after heating) to cool ; filter crystals from solution / dry crystals on filter paper ; 3 2(b)(i) (light) blue precipitate ; (dissolves into a) dark blue solution ; 2 2(b)(ii) aqueous barium nitrate AND dilute nitric acid ; 1 2(c)(i) idea of preventing contamination from the wire ; 1 2(c)(ii) (yellow indicates) it has sodium (ions) in it / the colour should just be (blue-)green / flame contains yellow / not a single colour ; 1 2(c)(iii) it is hotter / higher temperature / does not leave soot on the wire / heats faster ; 1
Q3 · A student determines the density of a cork
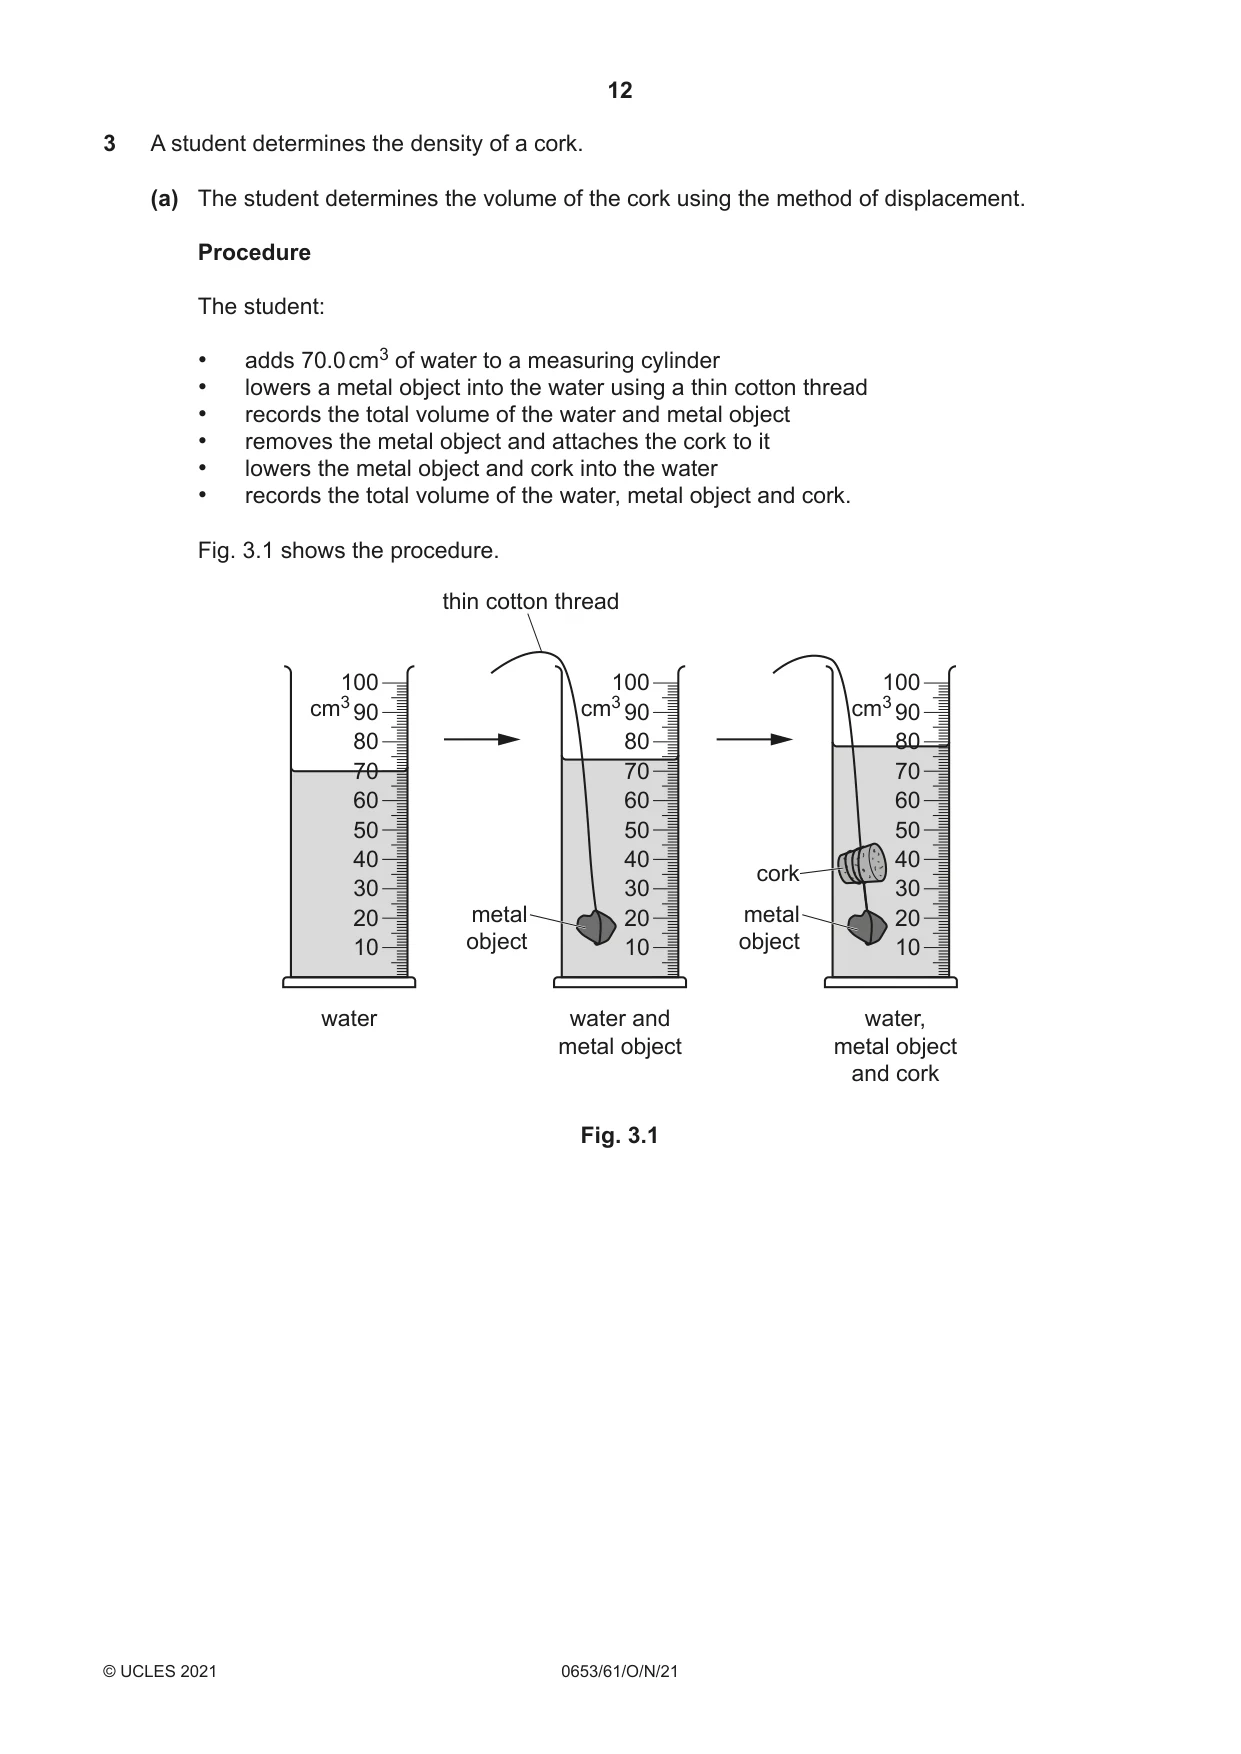
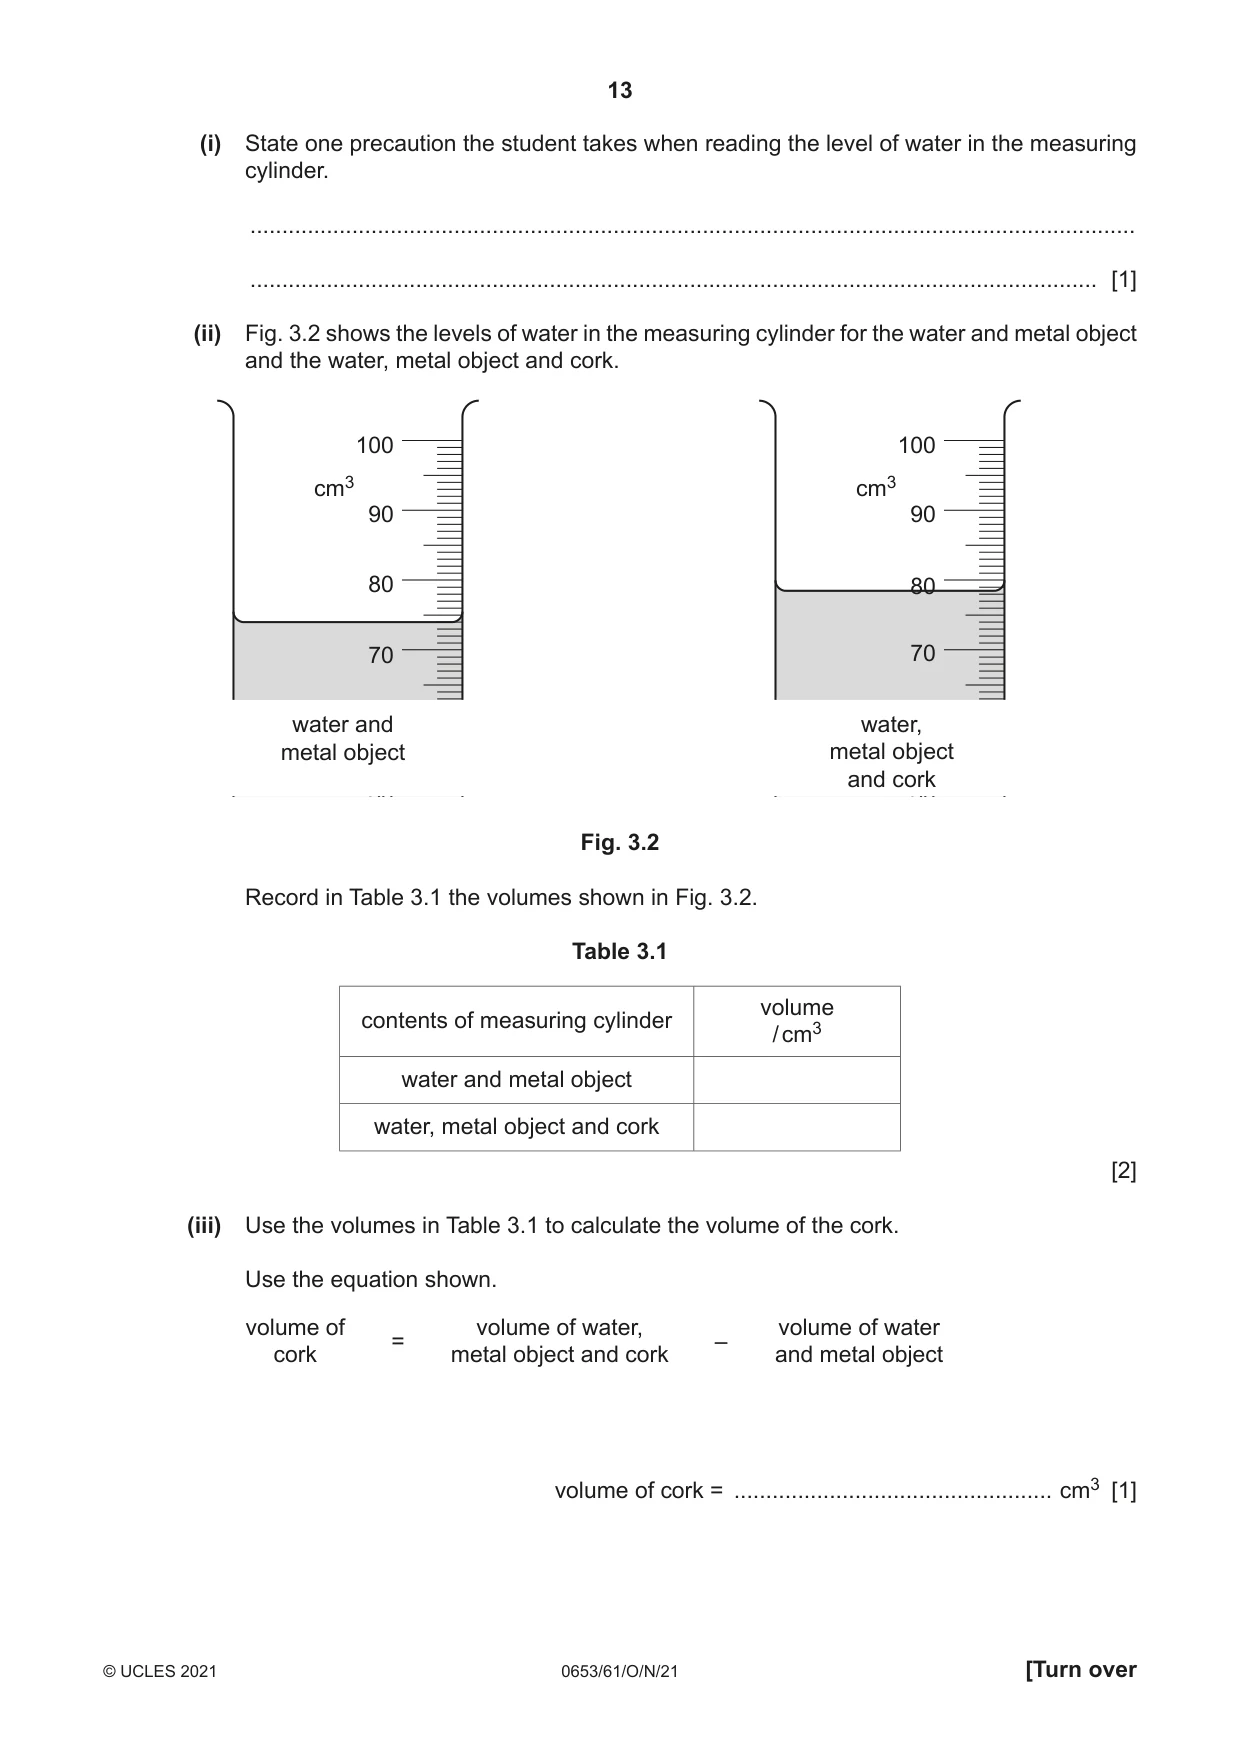
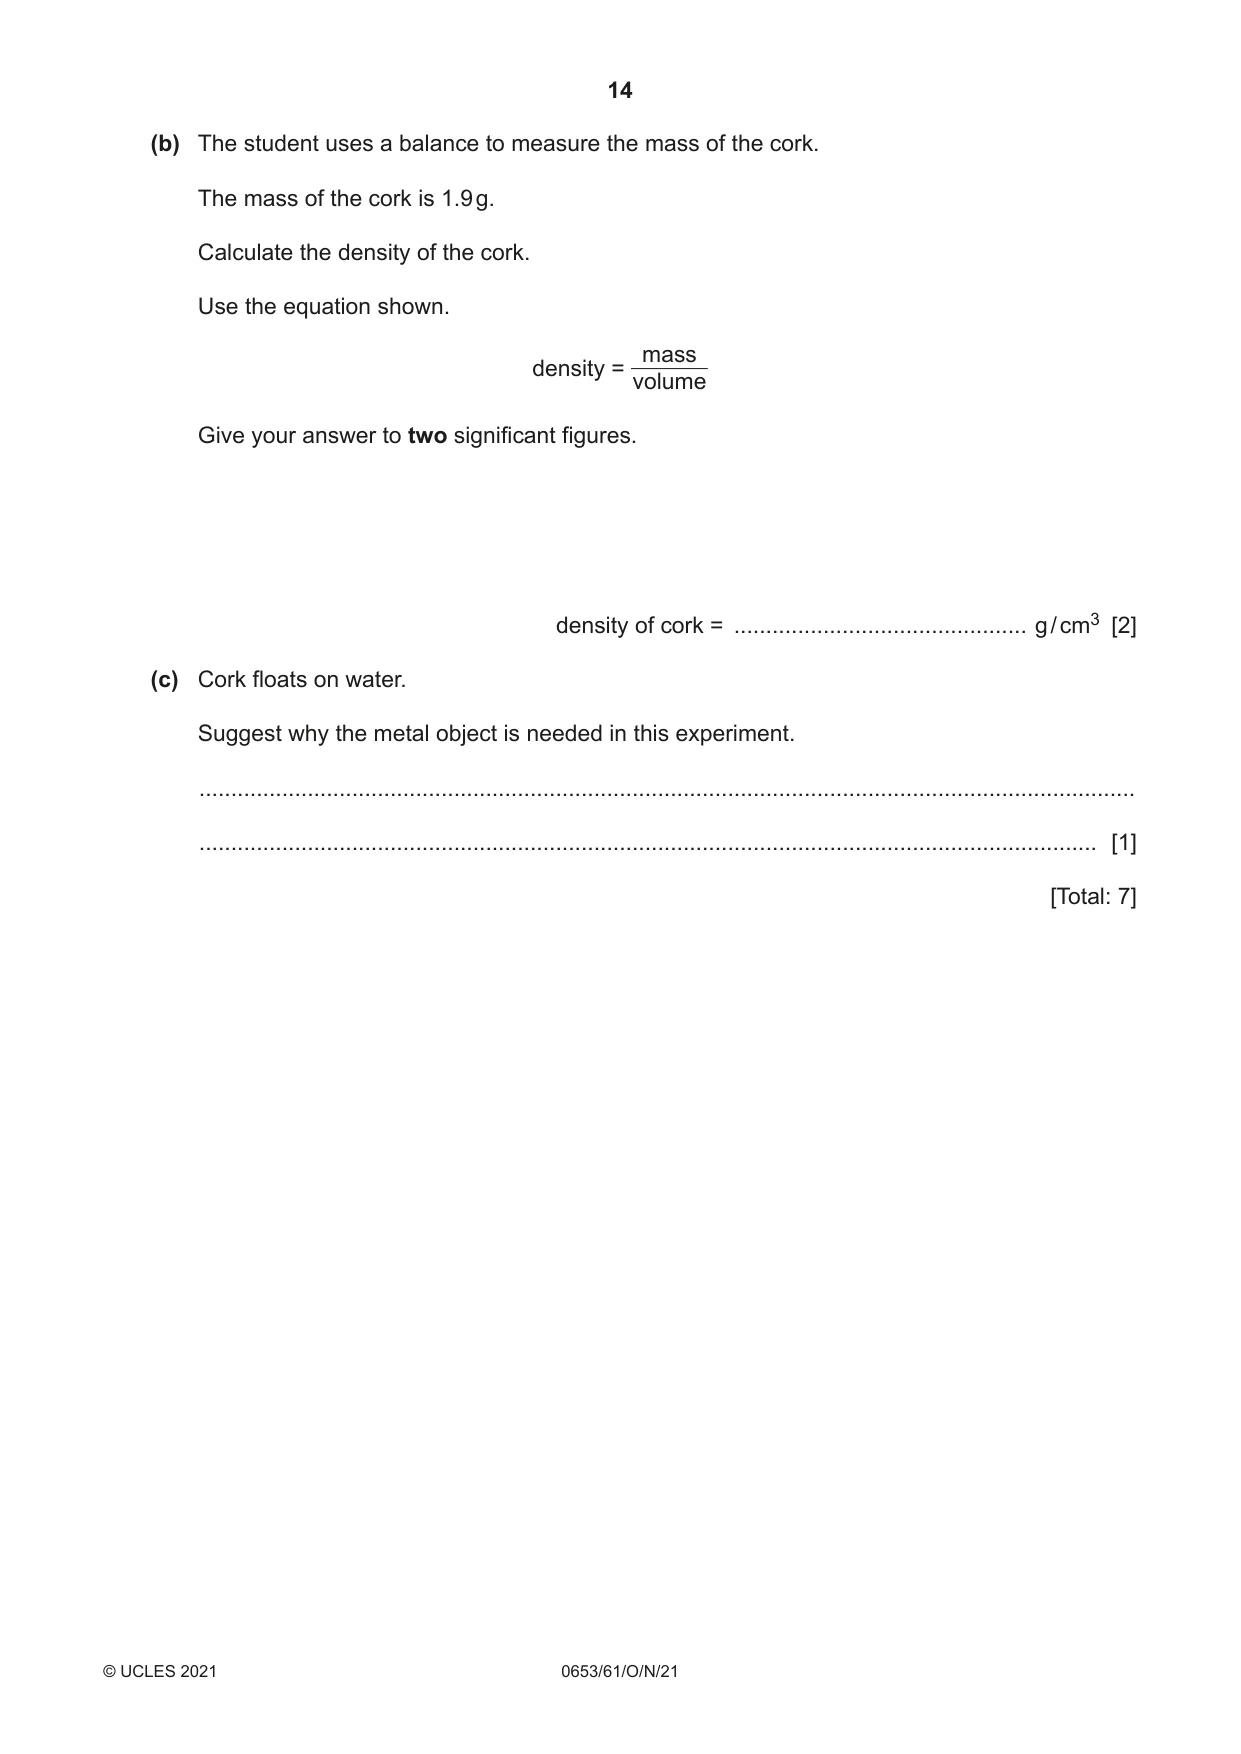
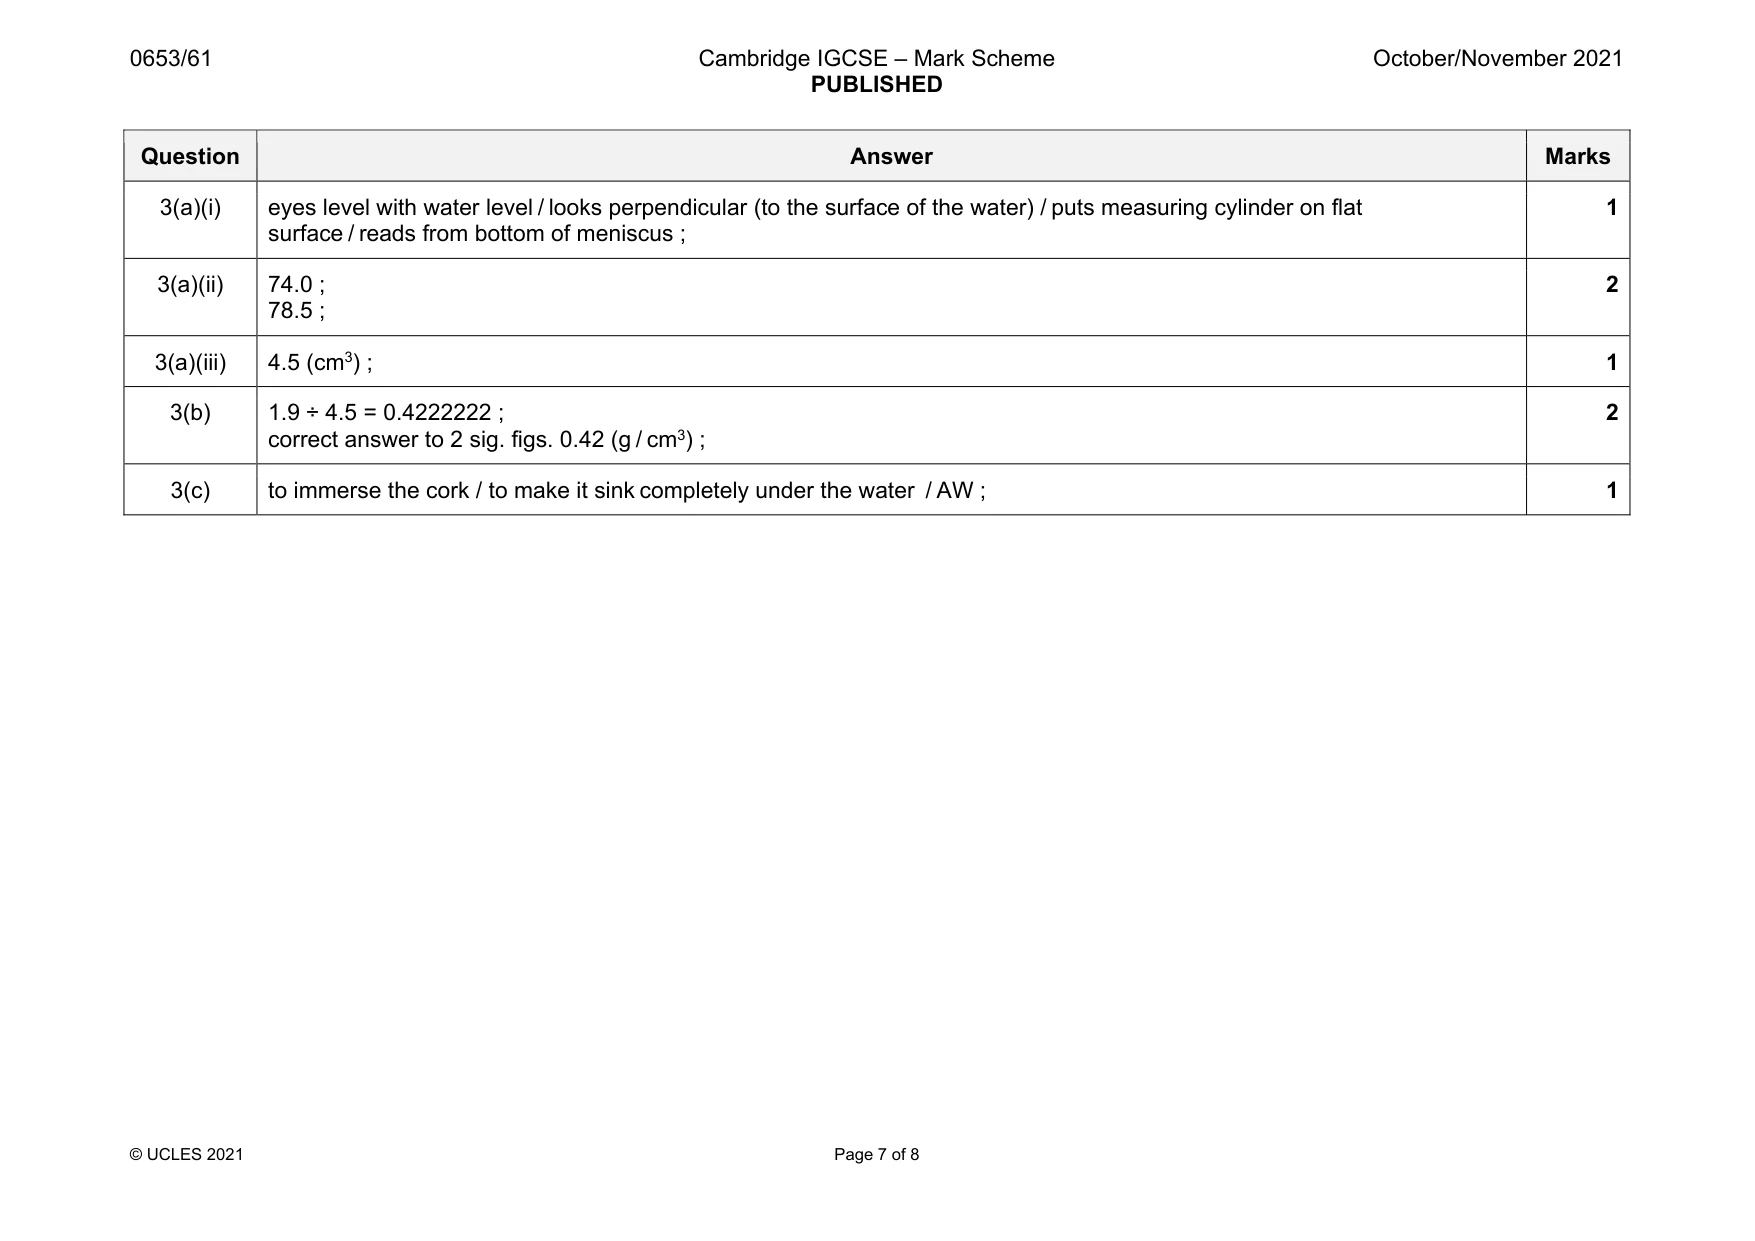
3 A student determines the density of a cork. (a) The student determines the volume of the cork using the method of displacement. Procedure The student: • adds 70.0 cm3 of water to a measuring cylinder • lowers a metal object into the water using a thin cotton thread • records the total volume of the water and metal object • removes the metal object and attaches the cork to it • lowers the metal object and cork into the water • records the total volume of the water, metal object and cork. Fig. 3.1 shows the procedure. thin cotton thread 100 100 100 cm3 90 cm3 90 cm3 90 80 80 80 70 70 70 60 60 60 50 50 50 40 40 40 cork 30 30 30 20 metal 20 metal 20 10 object 10 object 10 water water and water, metal object metal object and cork Fig. 3.1 (i) State one precaution the student takes when reading the level of water in the measuring cylinder. ........................................................................................................................................... ..................................................................................................................................... [1] (ii) Fig. 3.2 shows the levels of water in the measuring cylinder for the water and metal object and the water, metal object and cork. 100 100 cm3 cm3 90 90 80 80 70 70 water and60 water,60 metal object metal object and cork 50 50 Fig. 3.2 Record in Table 3.1 the volumes shown in Fig. 3.2. Table 3.1 volume contents of measuring cylinder / cm3 water and metal object water, metal object and cork [2] (iii) Use the volumes in Table 3.1 to calculate the volume of the cork. Use the equation shown. volume of volume of water, volume of water = – cork metal object and cork and metal object volume of cork = .................................................. cm3 [1] (b) The student uses a balance to measure the mass of the cork. The mass of the cork is 1.9 g. Calculate the density of the cork. Use the equation shown. mass density = volume Give your answer to two significant figures. density of cork = .............................................. g / cm3 [2] (c) Cork floats on water. Suggest why the metal object is needed in this experiment. ................................................................................................................................................... ............................................................................................................................................. [1] [Total: 7]
Mark scheme: 3(a)(i) eyes level with water level / looks perpendicular (to the surface of the water) / puts measuring cylinder on flat surface / reads from bottom of meniscus ; 1 3(a)(ii) 74.0 ; 78.5 ; 2 3(a)(iii) 4.5 (cm3) ; 1 3(b) 1.9 ÷ 4.5 = 0.4222222 ; correct answer to 2 sig. figs. 0.42 (g / cm3) ; 2 3(c) to immerse the cork / to make it sink completely under the water / AW ; 1
More questions on Physical quantities and measurement techniques
Q4 · A student has clothes made of three different materials: cotton, polyester and wool
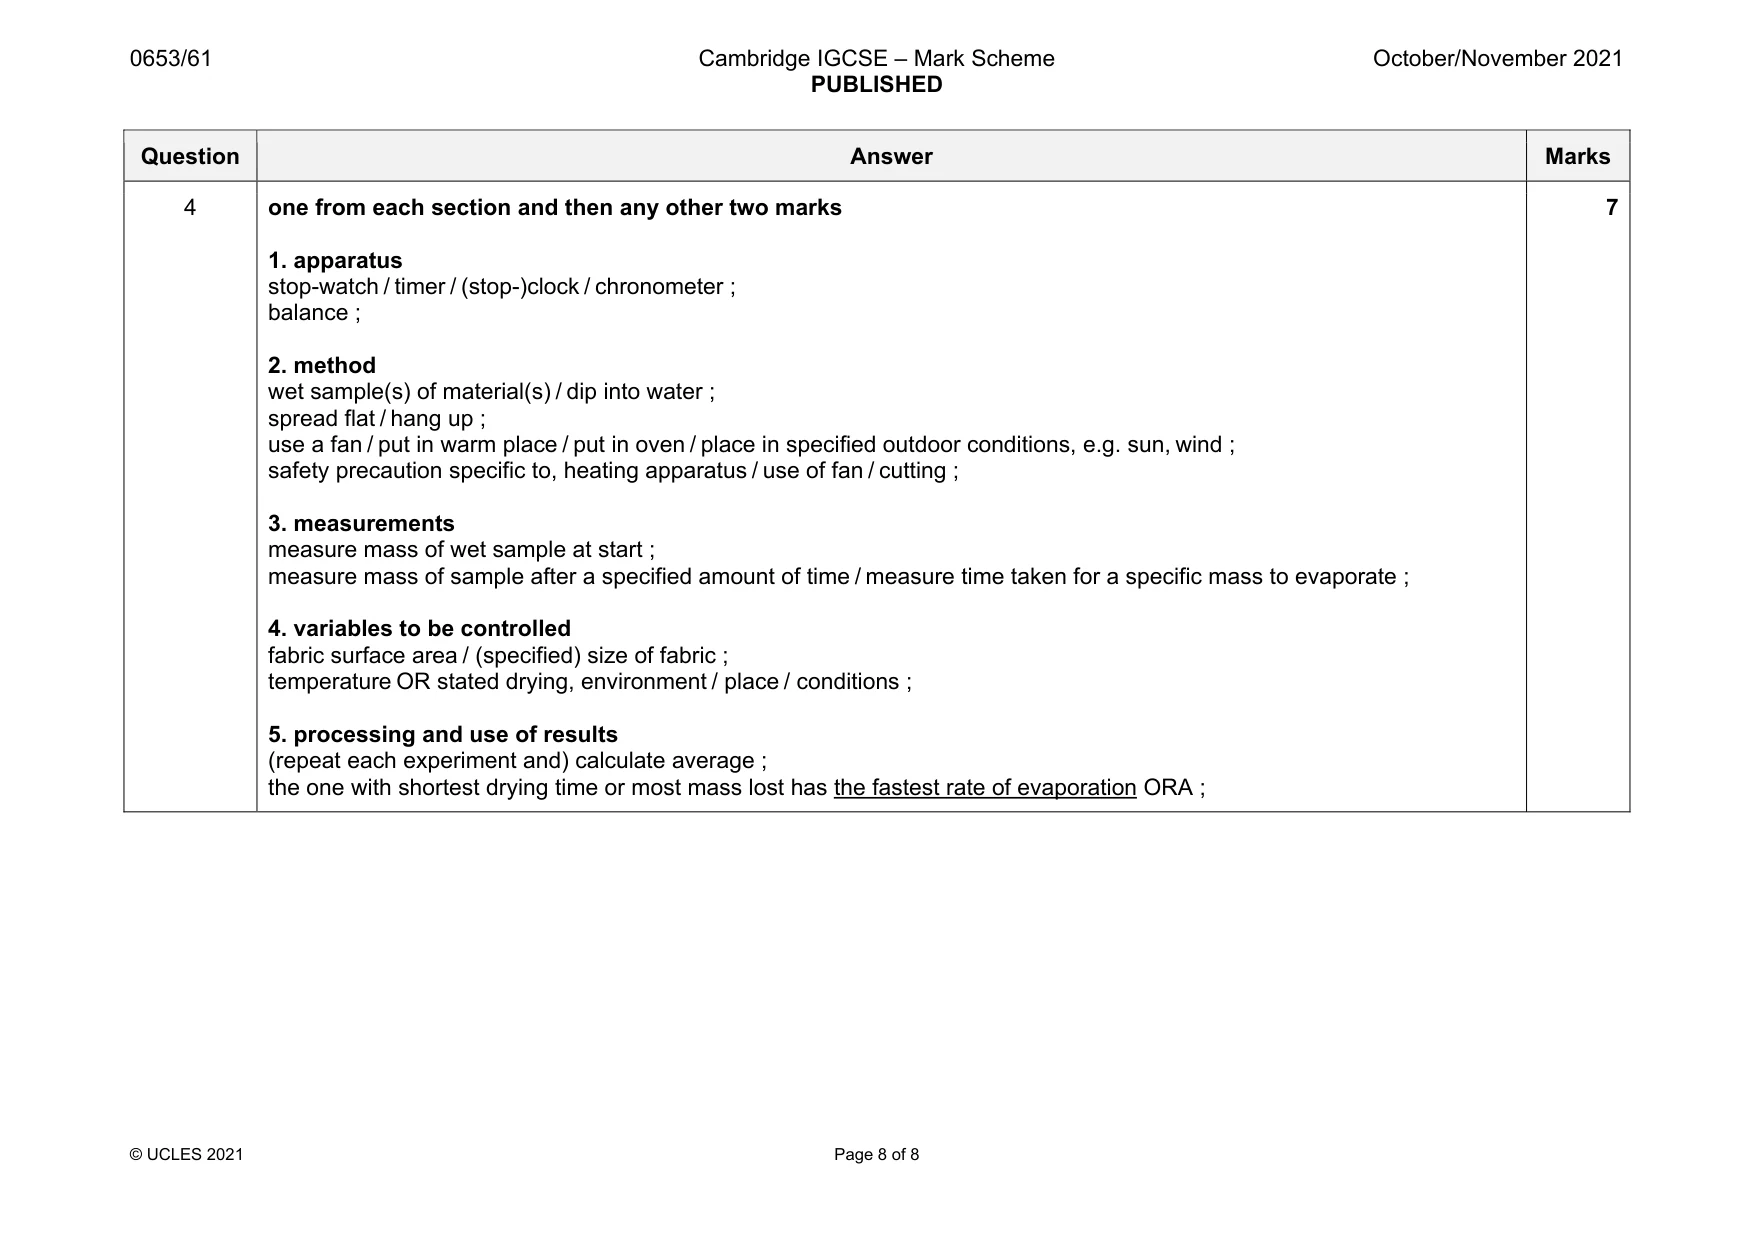
4 A student has clothes made of three different materials: cotton, polyester and wool. After washing the clothes, the student observes the wet clothes becoming dry as the water evaporates. The student wants to know if the material of the clothes affects the rate at which the water evaporates. Plan an investigation to determine how the material of the clothes affects the rate of evaporation of water from the clothes. You are provided with: • samples of cotton, polyester and wool • water You may use any common laboratory apparatus in your plan. Include in your plan: • the apparatus needed • a brief description of the method, explaining any safety precautions you will take • what you will measure • which variables you will keep constant • how you will process your results to draw a conclusion. You may include a labelled diagram. You may include a results table (you are not required to enter any readings in the table). .......................................................................................................................................................... .......................................................................................................................................................... .......................................................................................................................................................... .......................................................................................................................................................... .......................................................................................................................................................... .......................................................................................................................................................... .......................................................................................................................................................... .......................................................................................................................................................... .......................................................................................................................................................... .......................................................................................................................................................... .......................................................................................................................................................... .......................................................................................................................................................... .......................................................................................................................................................... .................................................................................................................................................... [7]
Mark scheme: 4 one from each section and then any other two marks 1. apparatus stop-watch / timer / (stop-)clock / chronometer ; balance ; 2. method wet sample(s) of material(s) / dip into water ; spread flat / hang up ; use a fan / put in warm place / put in oven / place in specified outdoor conditions, e.g. sun, wind ; safety precaution specific to, heating apparatus / use of fan / cutting ; 3. measurements measure mass of wet sample at start ; measure mass of sample after a specified amount of time / measure time taken for a specific mass to evaporate ; 4. variables to be controlled fabric surface area / (specified) size of fabric ; temperature OR stated drying, environment / place / conditions ; 5. processing and use of results (repeat each experiment and) calculate average ; the one with shortest drying time or most mass lost has the fastest rate of evaporation ORA ; 7
What was in this paper
The subtopics covered by these 4 questions, and how many questions each got. Open one in a new tab to see every Cambridge question on it.
What you needed in this session
Cambridge’s own grade thresholds for 2021 Oct/Nov, Paper 6 · Variant 1. A higher threshold means an easier paper — the bar moves with how the cohort did.