Cambridge IGCSE Science - Combined 0653 — 2021 Oct/Nov Paper 6 · Variant 2
0653/62/O/N/21 · 4 questions · 40 marks · ≈45 min
The question paper and its mark scheme, free to read here and free to download. This is Cambridge’s own paper, exactly as it was sat.
Question paper16 pages


Mark scheme8 pages
Answers below. Sit the paper first if you are practising.
Questions as text
Q1 · A student investigates the effect of concentration of salt solution on the movement of…
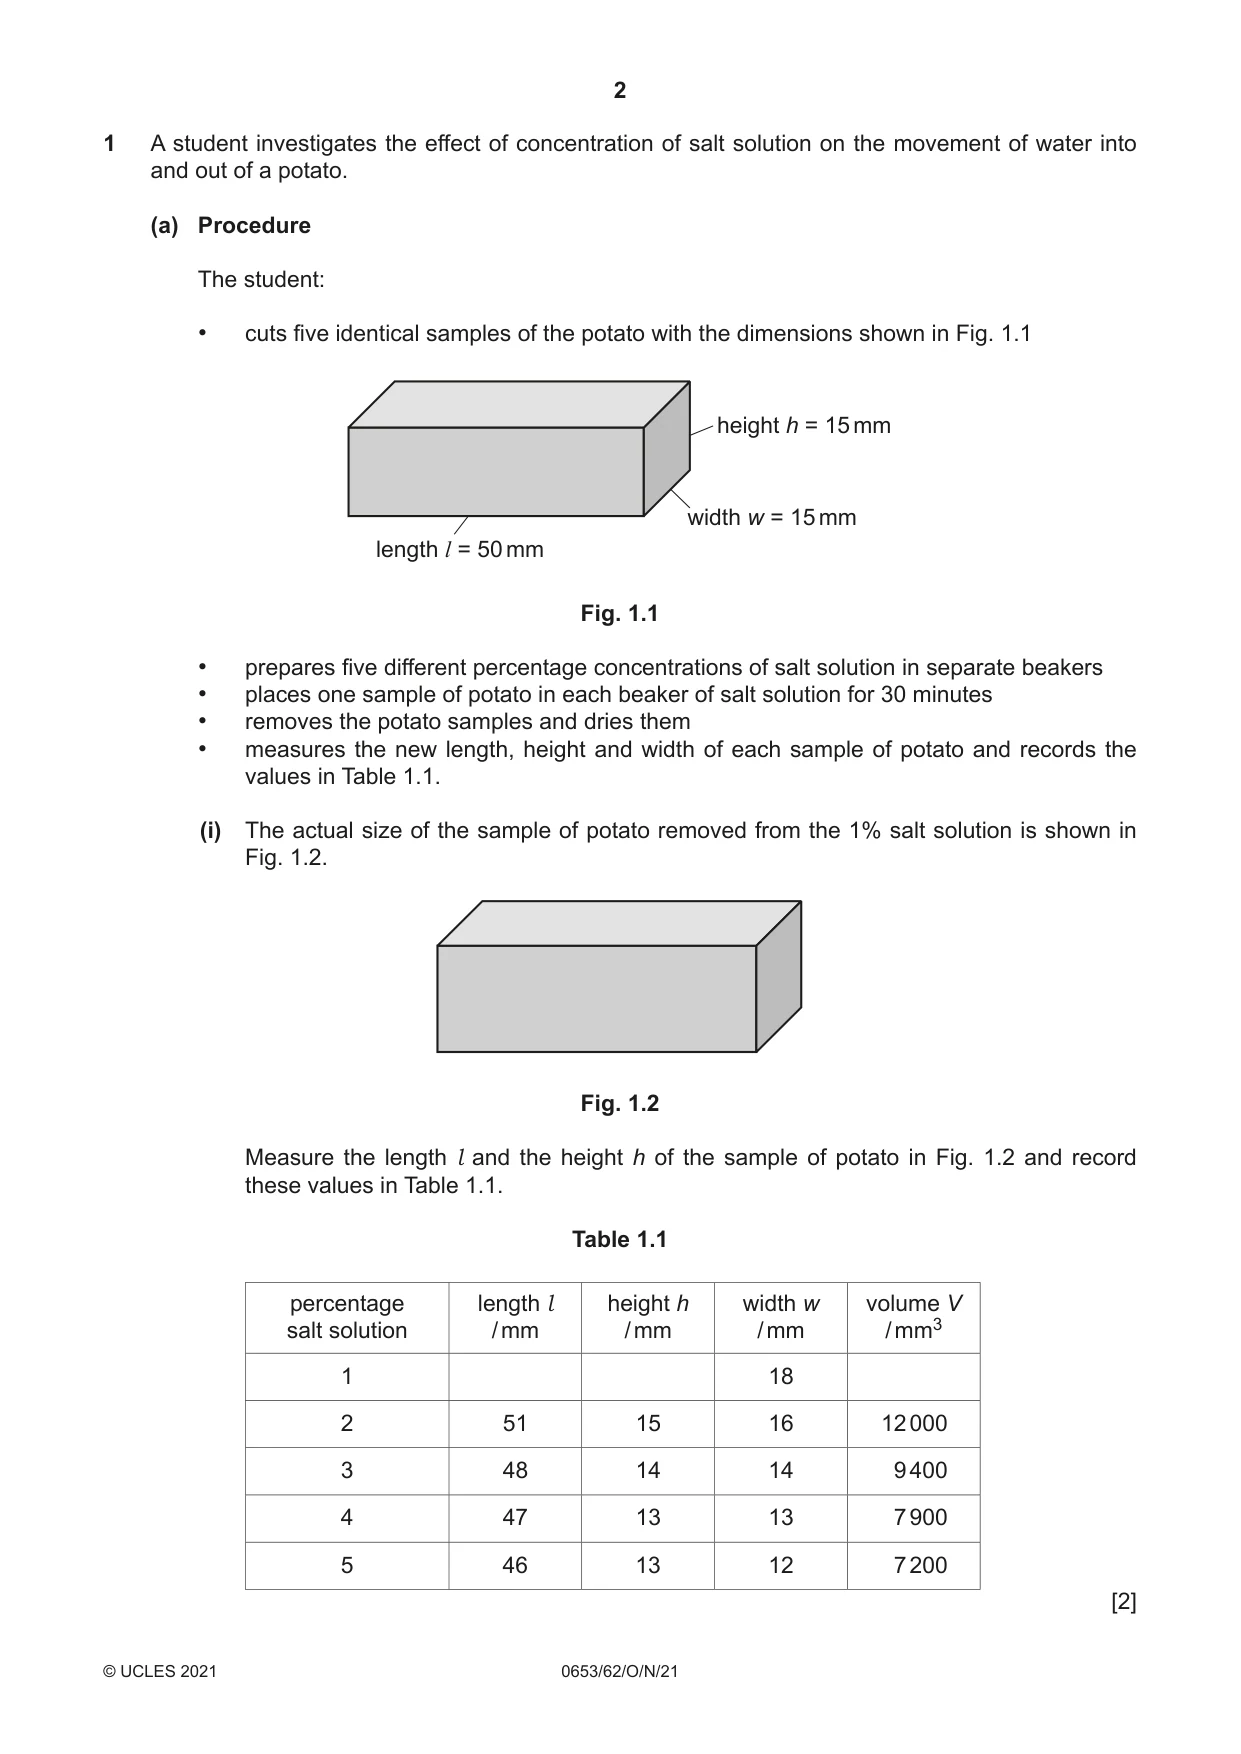
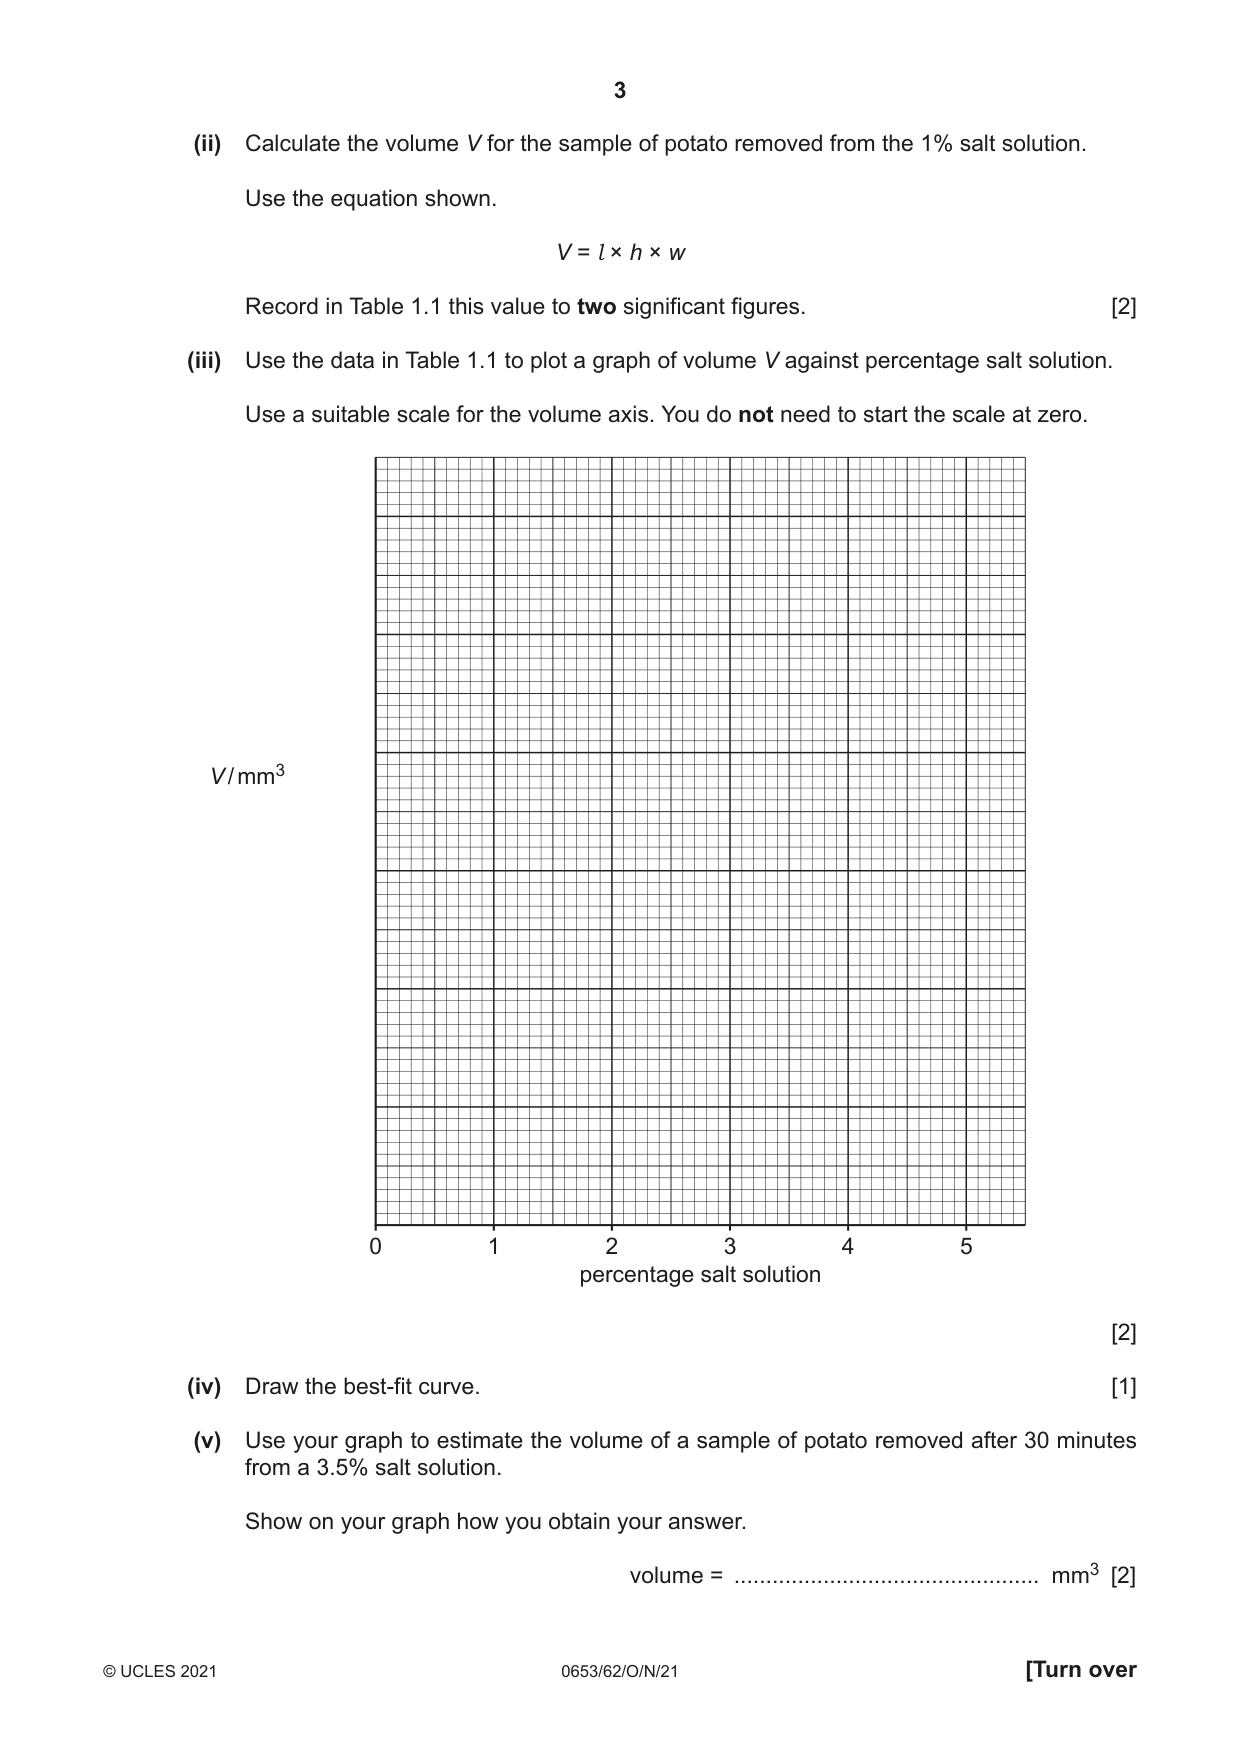
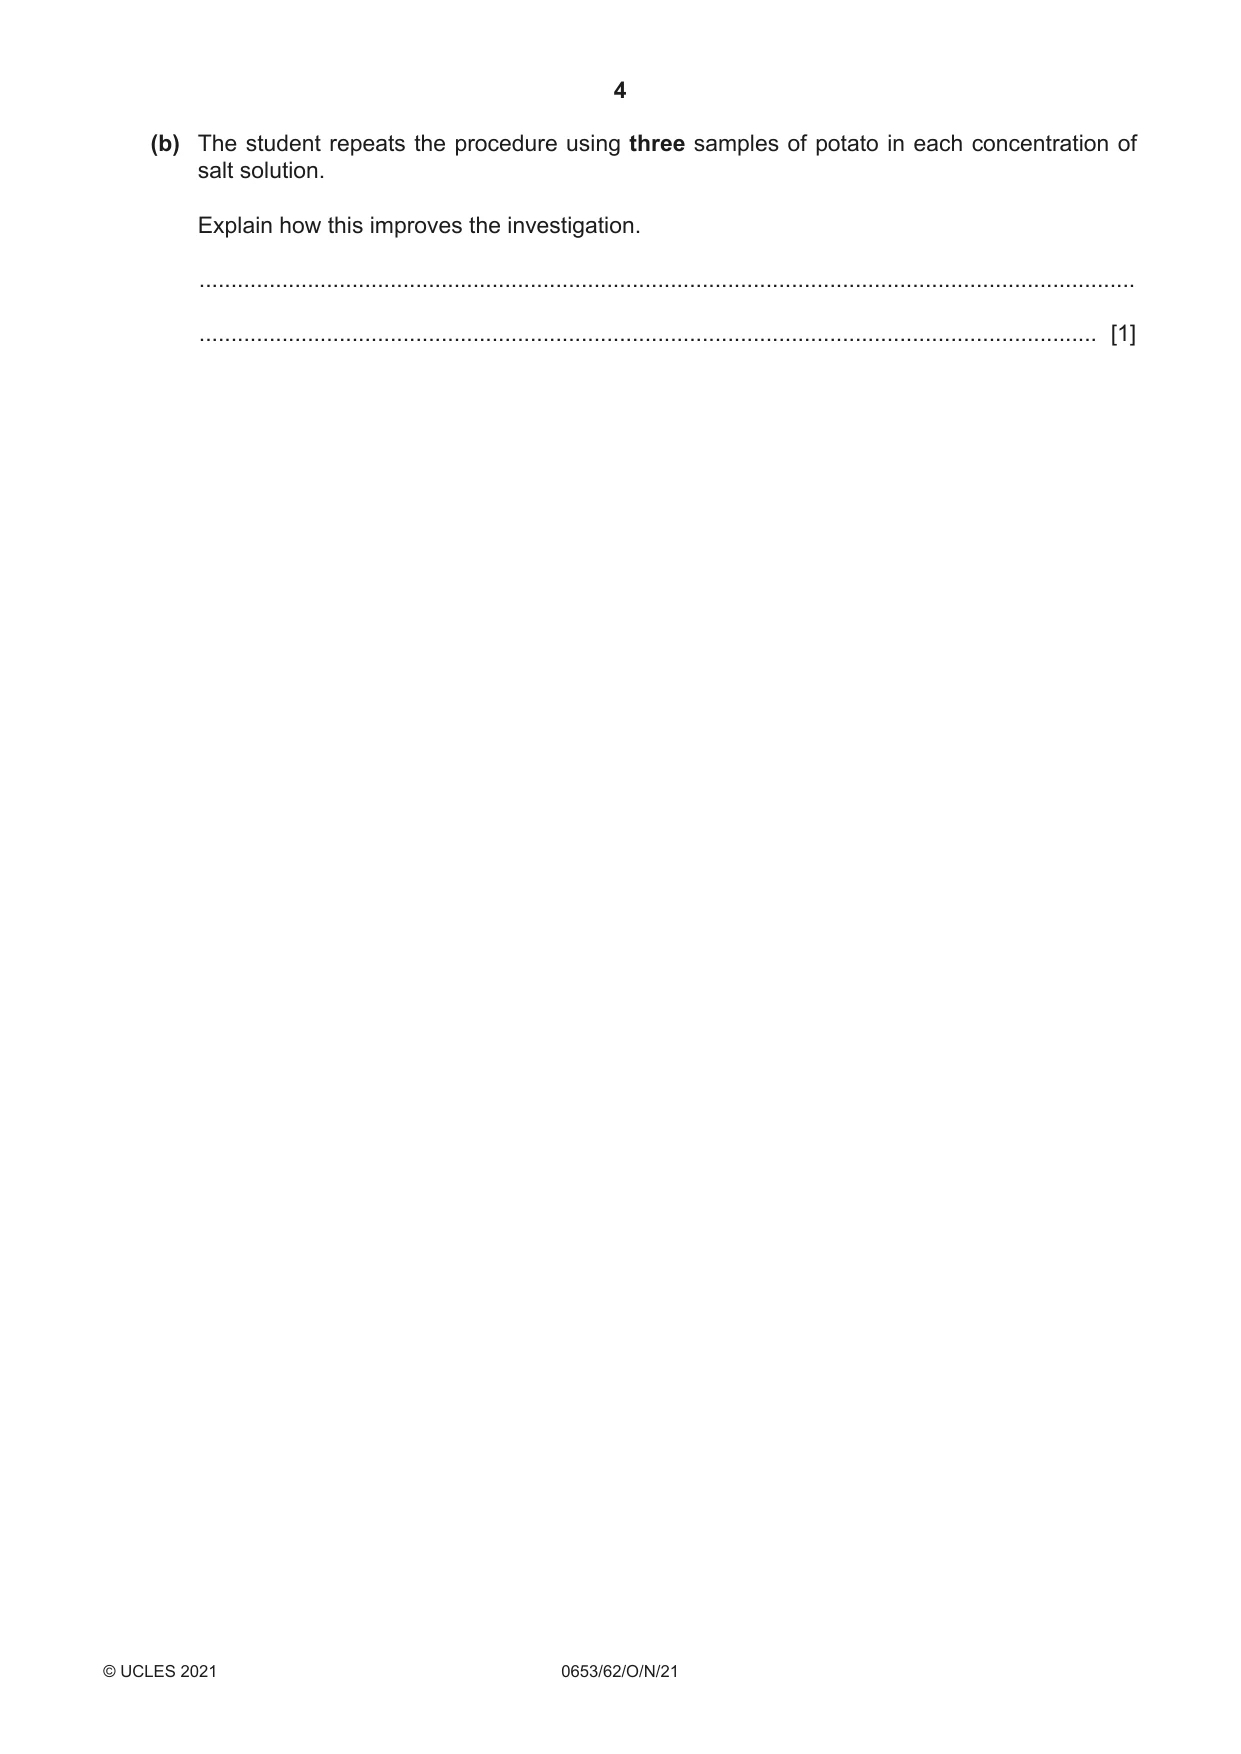
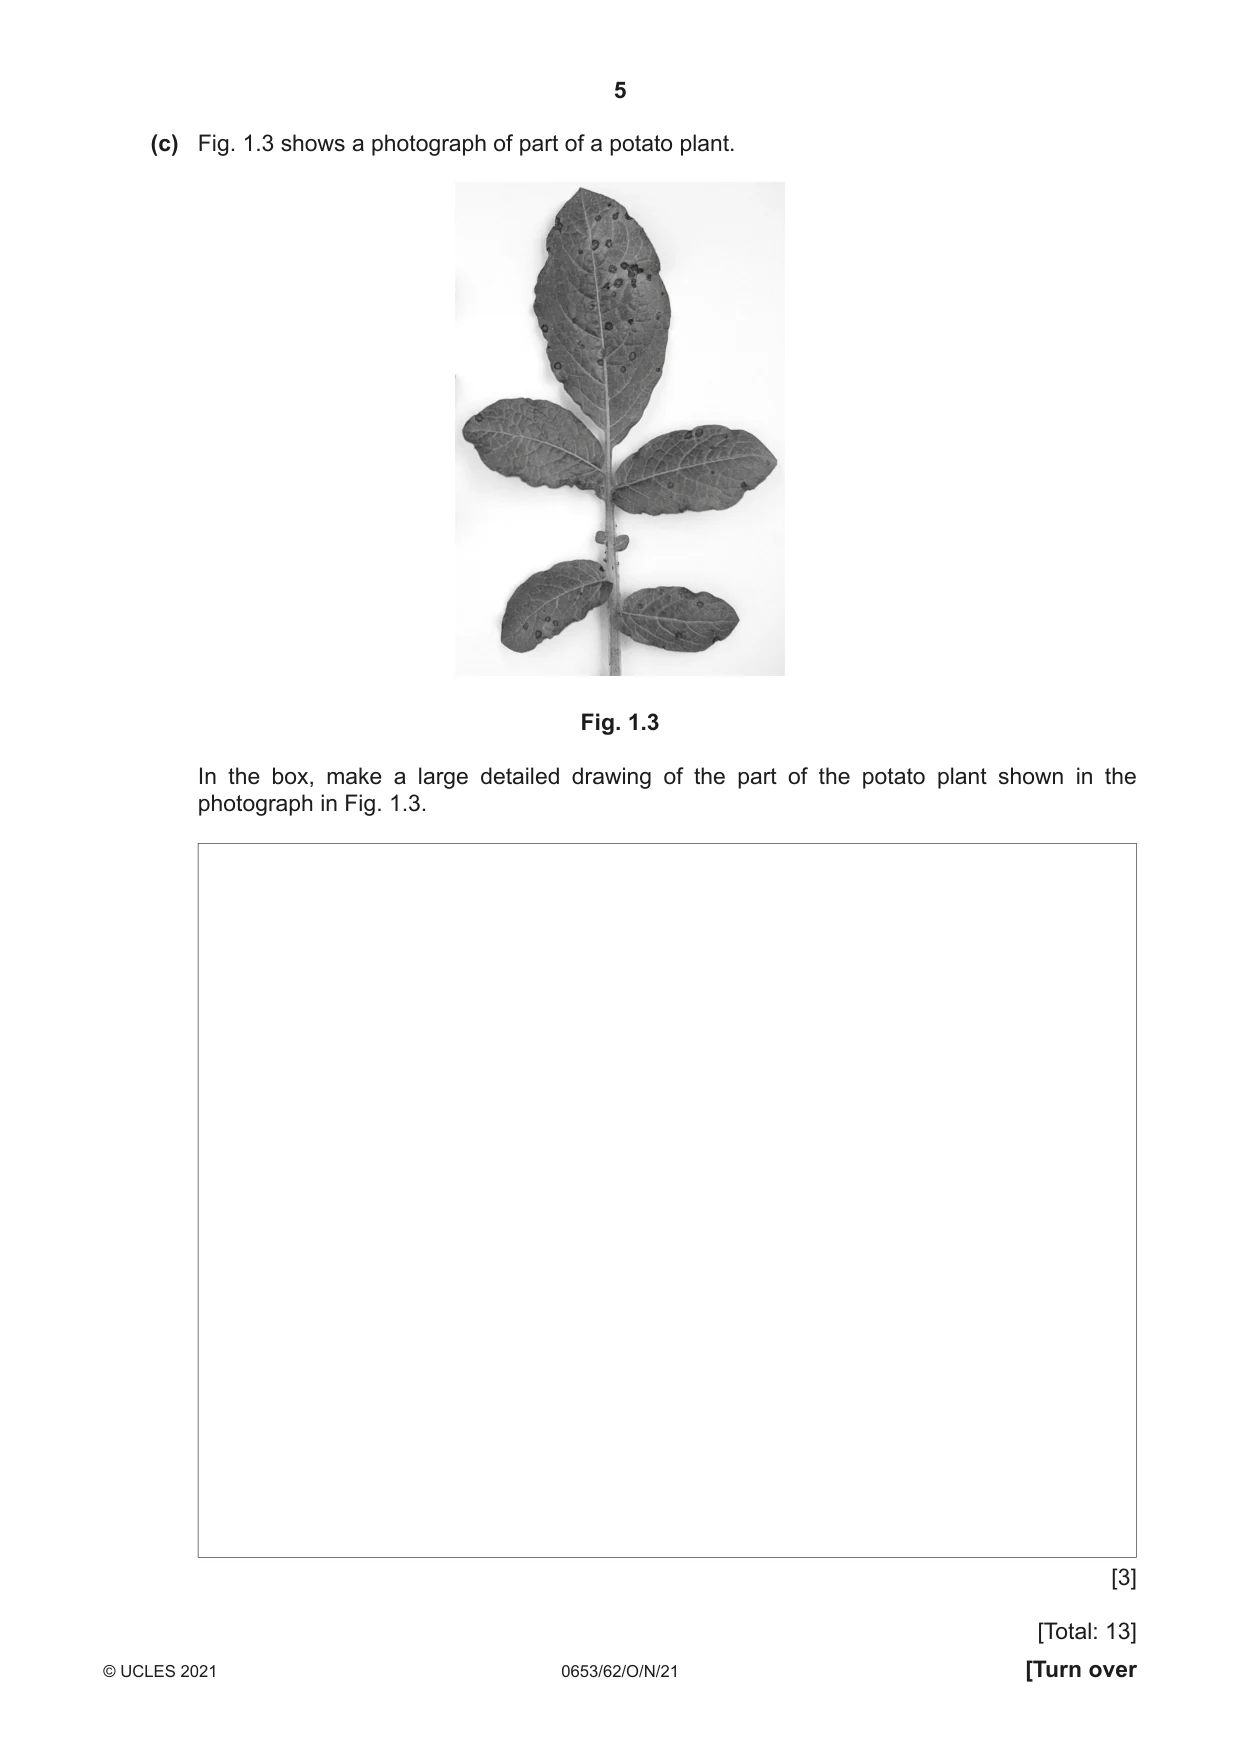
1 A student investigates the effect of concentration of salt solution on the movement of water into and out of a potato. (a) Procedure The student: • cuts five identical samples of the potato with the dimensions shown in Fig. 1.1 height h = 15 mm width w = 15 mm length l = 50 mm Fig. 1.1 • prepares five different percentage concentrations of salt solution in separate beakers • places one sample of potato in each beaker of salt solution for 30 minutes • removes the potato samples and dries them • measures the new length, height and width of each sample of potato and records the values in Table 1.1. (i) The actual size of the sample of potato removed from the 1% salt solution is shown in Fig. 1.2. Fig. 1.2 Measure the length l and the height h of the sample of potato in Fig. 1.2 and record these values in Table 1.1. Table 1.1 percentage length l height h width w volume V salt solution / mm / mm / mm / mm3 1 18 2 51 15 16 12 000 3 48 14 14 9 400 4 47 13 13 7 900 5 46 13 12 7 200 [2] (ii) Calculate the volume V for the sample of potato removed from the 1% salt solution. Use the equation shown. V = l × h × w Record in Table 1.1 this value to two significant figures. [2] (iii) Use the data in Table 1.1 to plot a graph of volume V against percentage salt solution. Use a suitable scale for the volume axis. You do not need to start the scale at zero. V / mm3 0 1 2 3 4 5 percentage salt solution [2] (iv) Draw the best-fit curve. [1] (v) Use your graph to estimate the volume of a sample of potato removed after 30 minutes from a 3.5% salt solution. Show on your graph how you obtain your answer. volume = ................................................ mm3 [2] (b) The student repeats the procedure using three samples of potato in each concentration of salt solution. Explain how this improves the investigation. ................................................................................................................................................... ............................................................................................................................................. [1] (c) Fig. 1.3 shows a photograph of part of a potato plant. Fig. 1.3 In the box, make a large detailed drawing of the part of the potato plant shown in the photograph in Fig. 1.3. [3] [Total: 13]
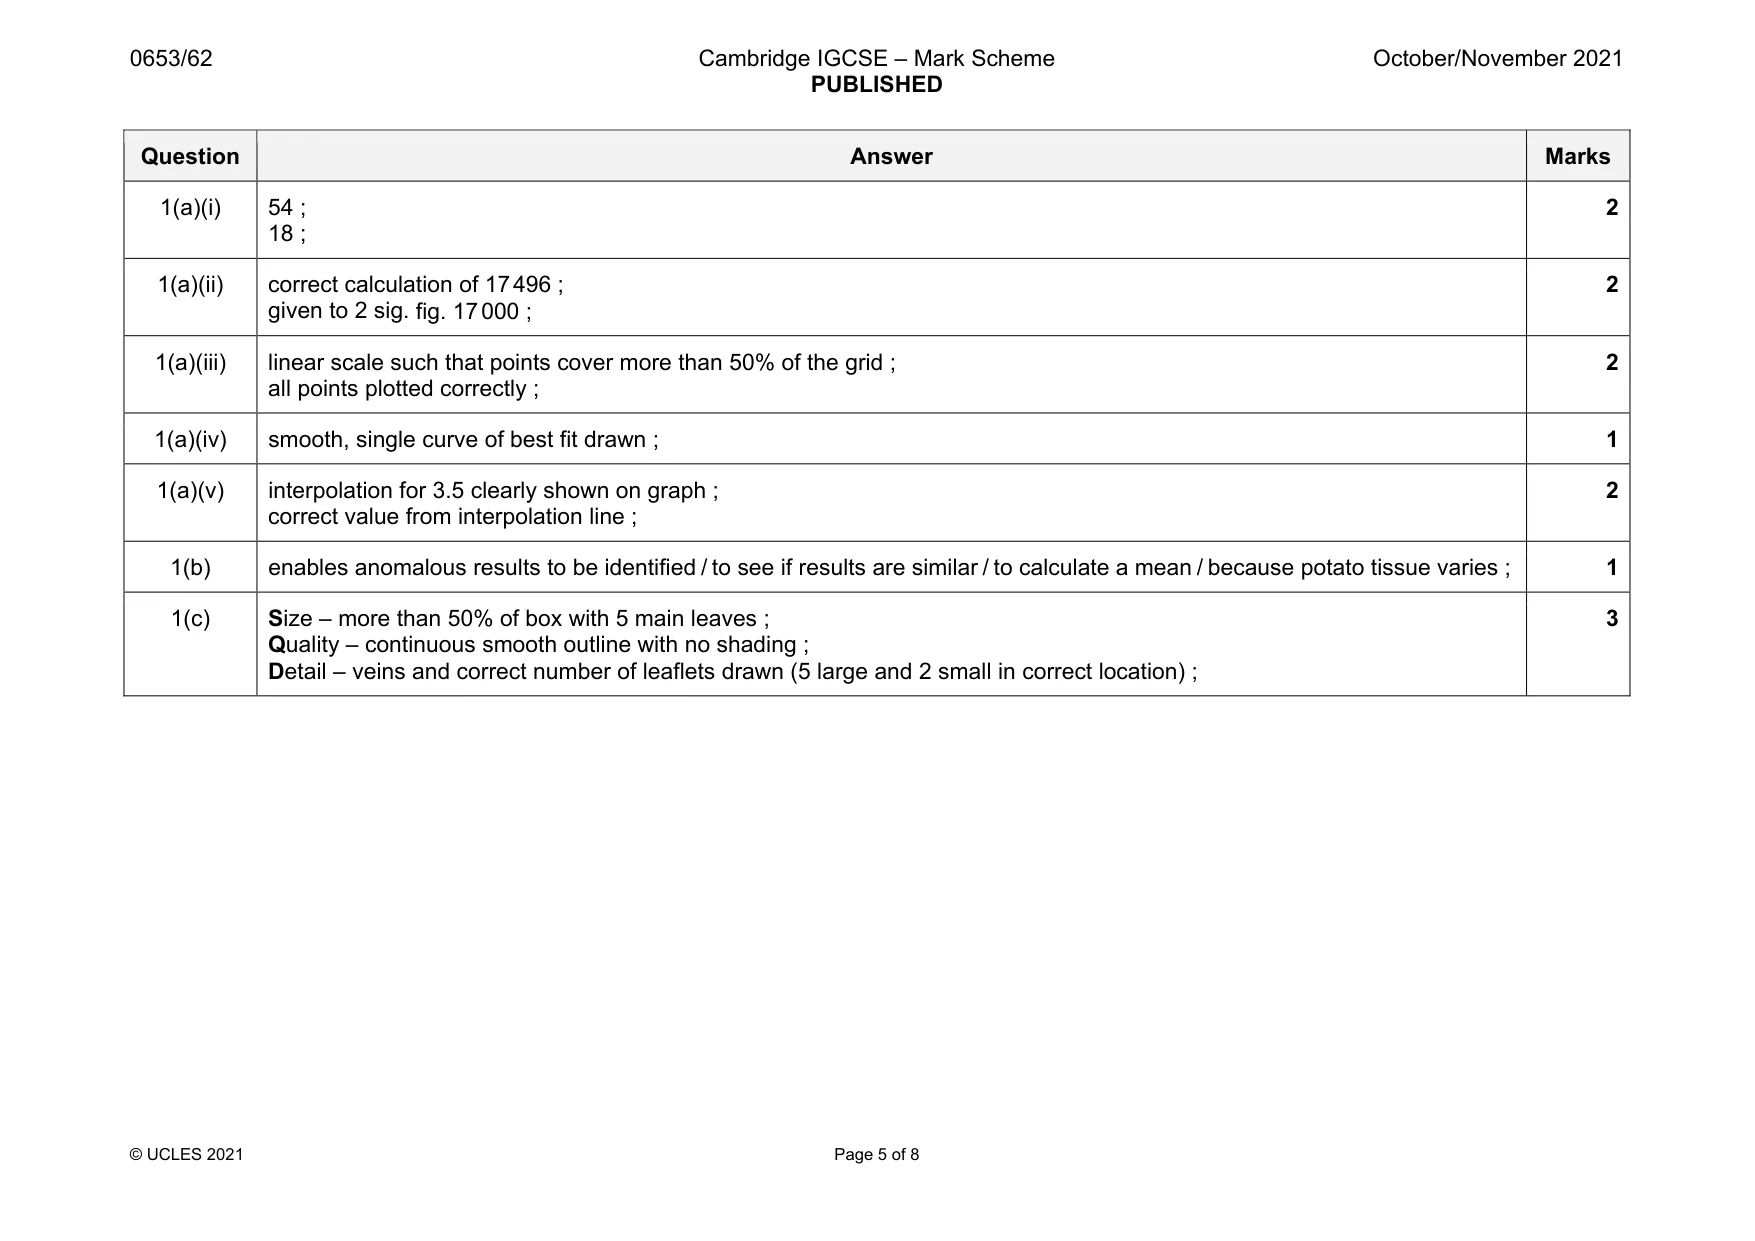
Mark scheme: 1(a)(i) 54 ; 18 ; 2 1(a)(ii) correct calculation of 17 496 ; given to 2 sig. fig. 17000 ; 2 1(a)(iii) linear scale such that points cover more than 50% of the grid ; all points plotted correctly ; 2 1(a)(iv) smooth, single curve of best fit drawn ; 1 1(a)(v) interpolation for 3.5 clearly shown on graph ; correct value from interpolation line ; 2 1(b) enables anomalous results to be identified / to see if results are similar / to calculate a mean / because potato tissue varies ; 1 1(c) Size – more than 50% of box with 5 main leaves ; Quality – continuous smooth outline with no shading ; Detail – veins and correct number of leaflets drawn (5 large and 2 small in correct location) ; 3
Q2 · A student prepares a sample of a salt by neutralising aqueous sodium hydroxide with…
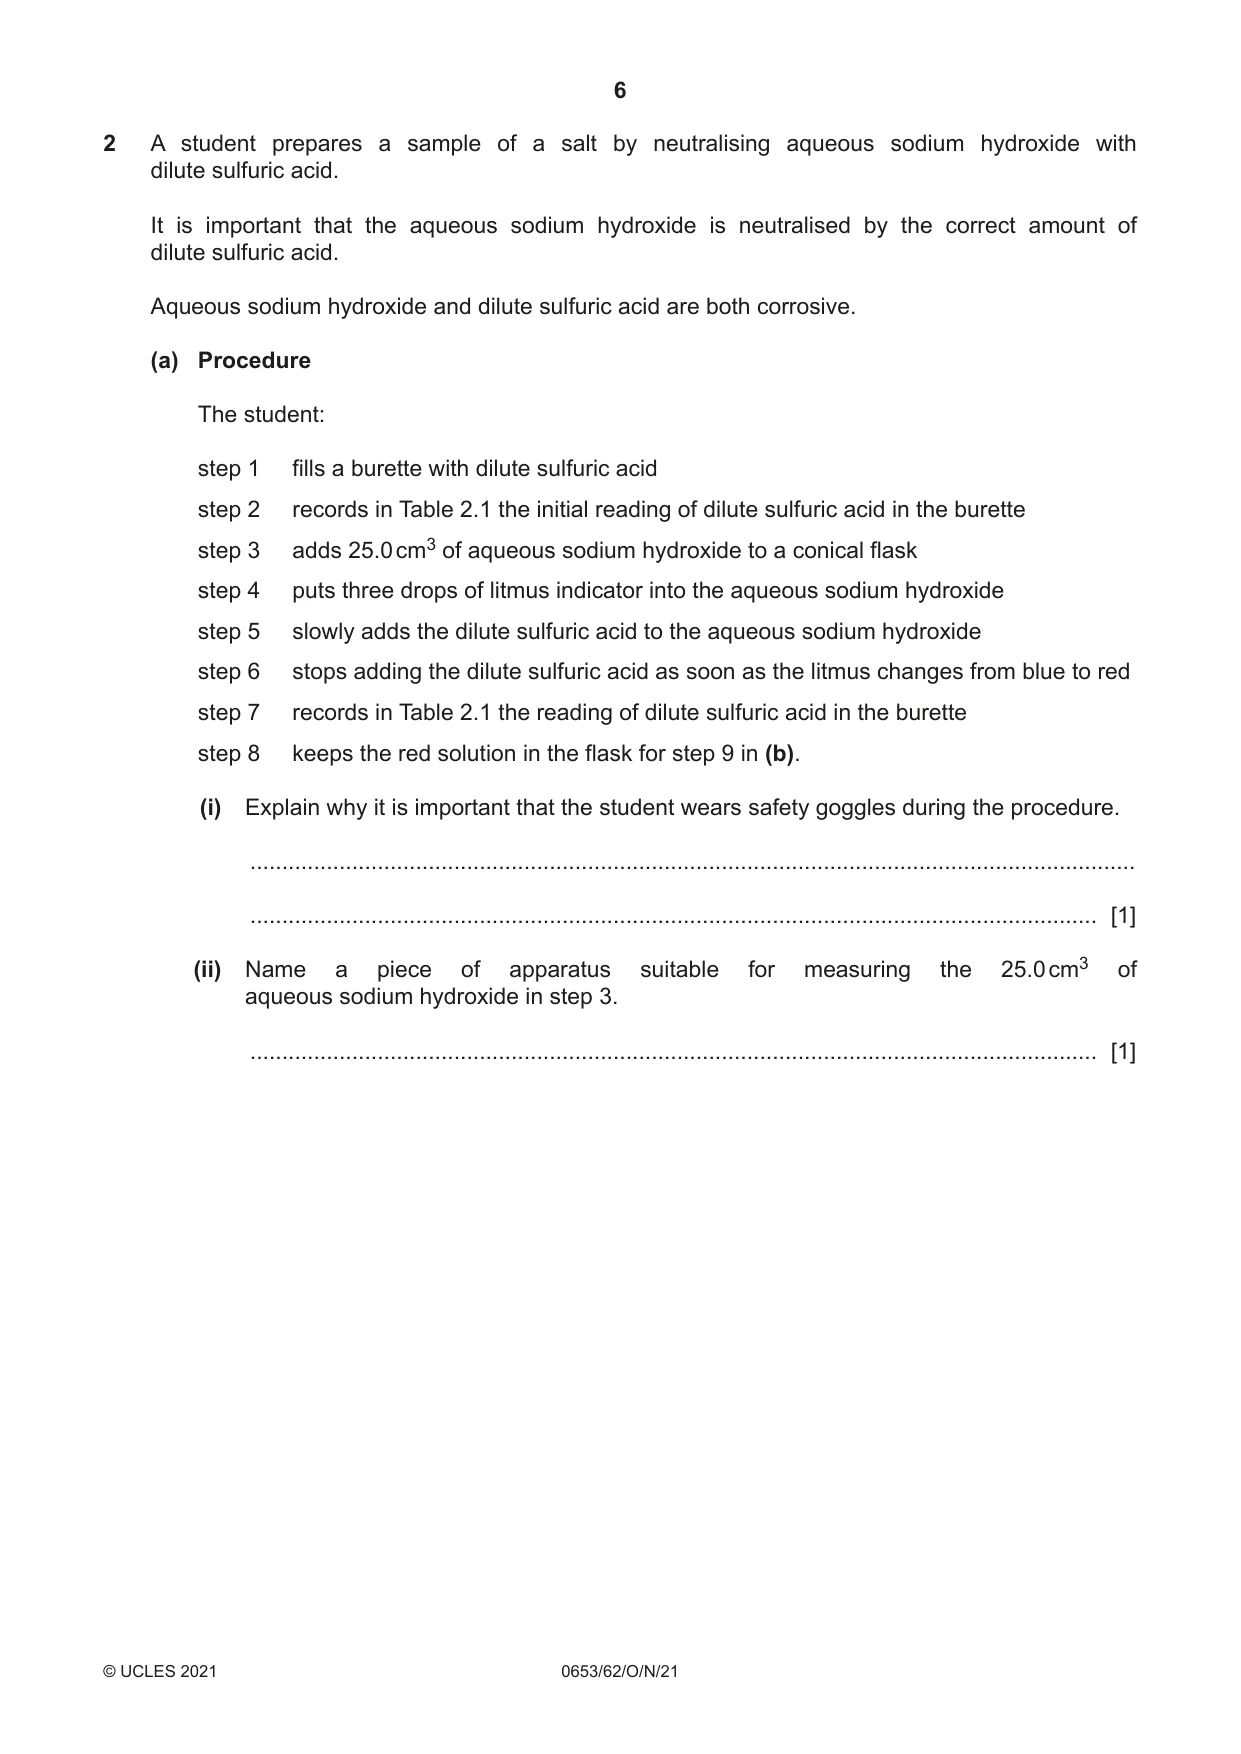
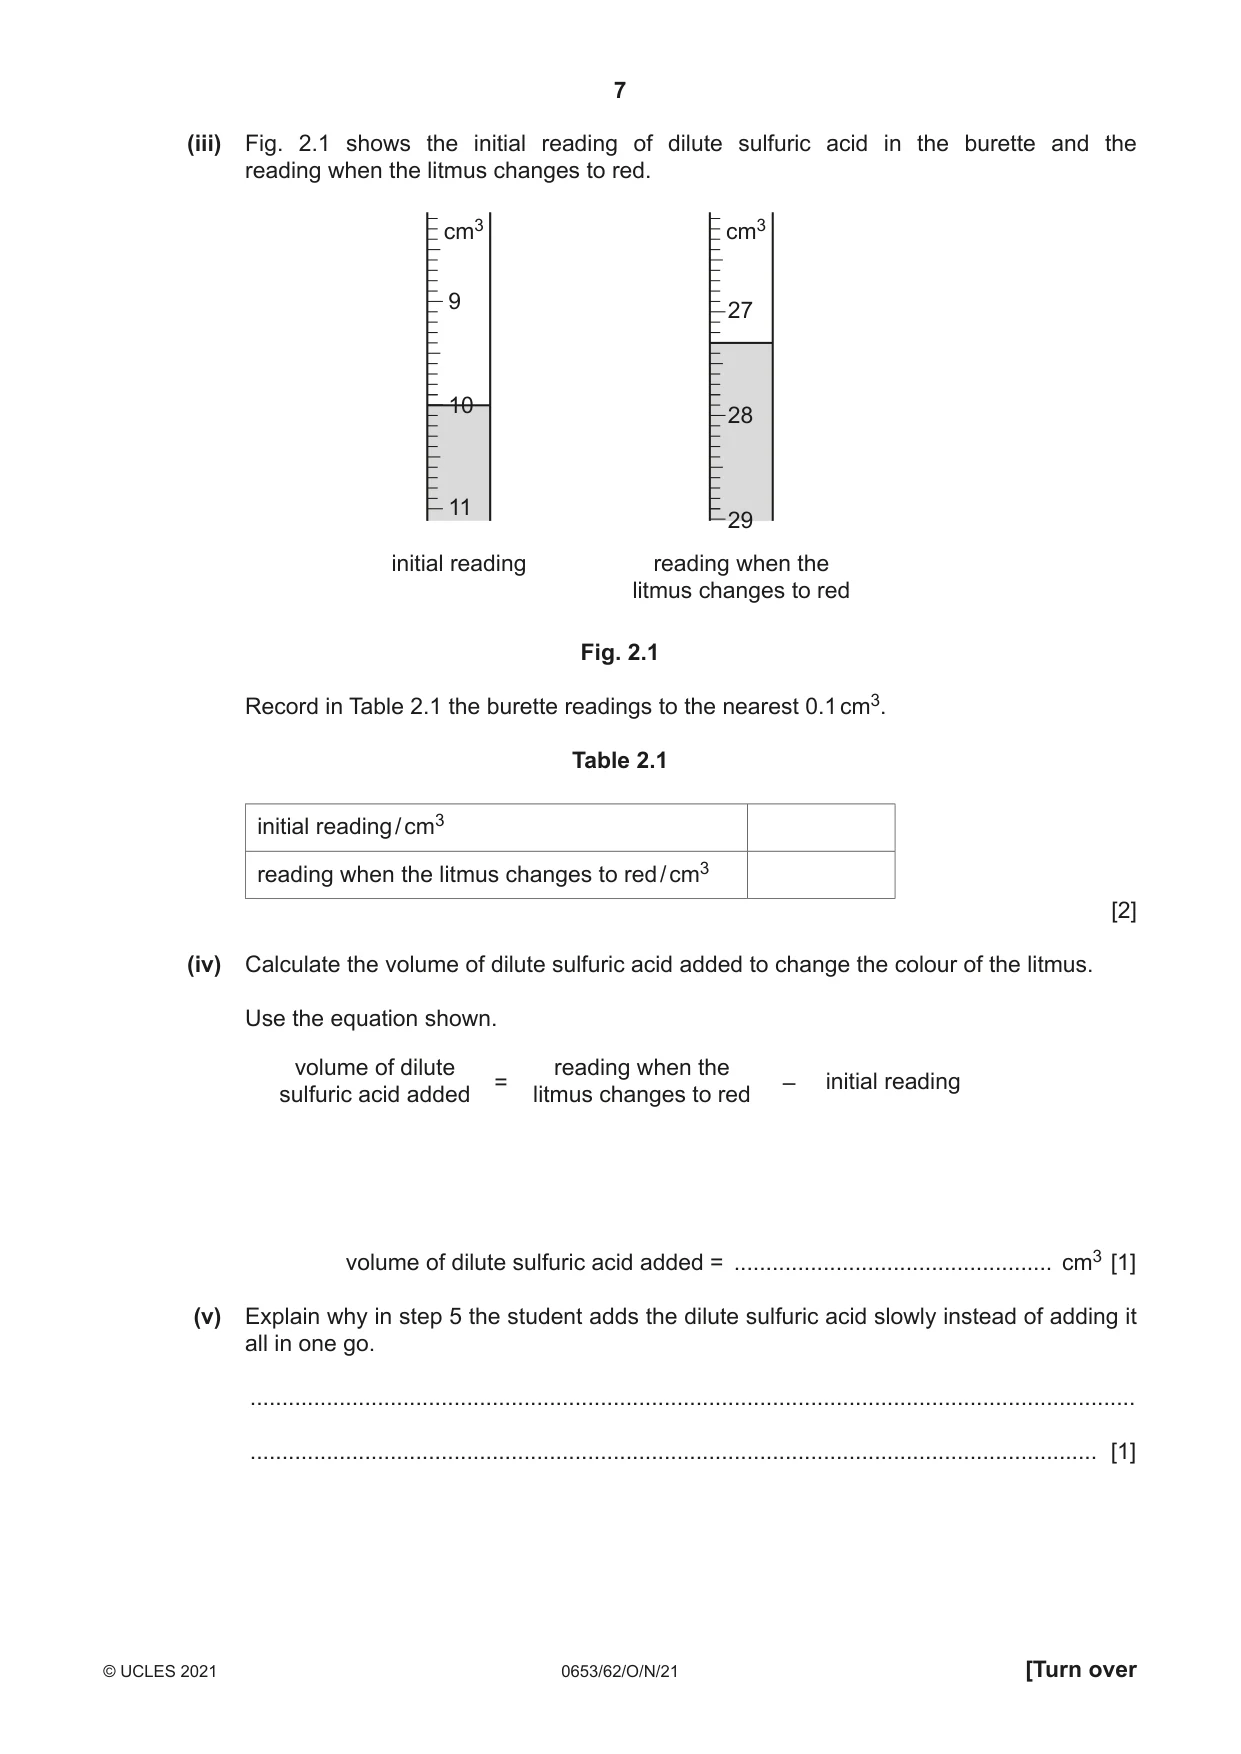
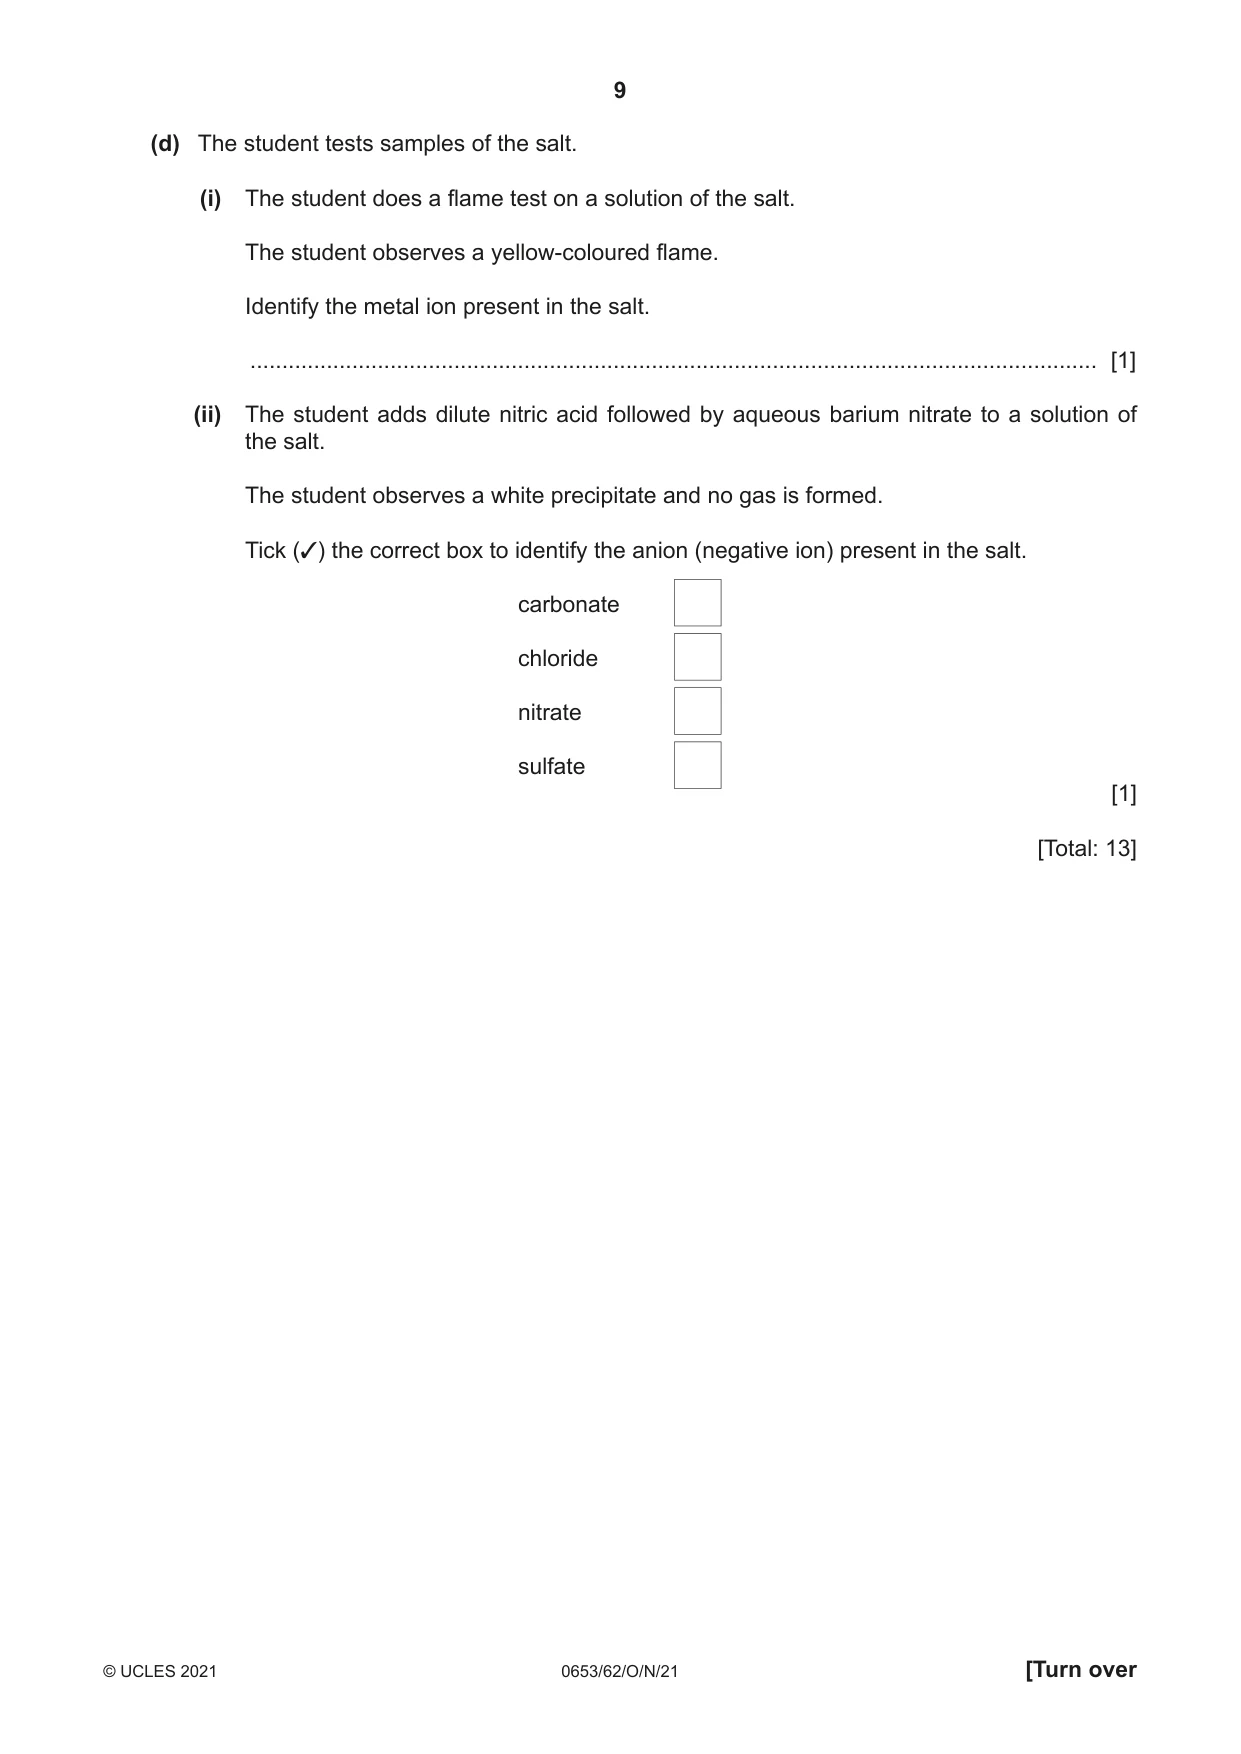
2 A student prepares a sample of a salt by neutralising aqueous sodium hydroxide with dilute sulfuric acid. It is important that the aqueous sodium hydroxide is neutralised by the correct amount of dilute sulfuric acid. Aqueous sodium hydroxide and dilute sulfuric acid are both corrosive. (a) Procedure The student: step 1 fills a burette with dilute sulfuric acid step 2 records in Table 2.1 the initial reading of dilute sulfuric acid in the burette step 3 adds 25.0 cm3 of aqueous sodium hydroxide to a conical flask step 4 puts three drops of litmus indicator into the aqueous sodium hydroxide step 5 slowly adds the dilute sulfuric acid to the aqueous sodium hydroxide step 6 stops adding the dilute sulfuric acid as soon as the litmus changes from blue to red step 7 records in Table 2.1 the reading of dilute sulfuric acid in the burette step 8 keeps the red solution in the flask for step 9 in (b). (i) Explain why it is important that the student wears safety goggles during the procedure. ........................................................................................................................................... ..................................................................................................................................... [1] (ii) Name a piece of apparatus suitable for measuring the 25.0 cm3 of aqueous sodium hydroxide in step 3. ..................................................................................................................................... [1] (iii) Fig. 2.1 shows the initial reading of dilute sulfuric acid in the burette and the reading when the litmus changes to red. cm3 cm3 9 27 10 28 11 29 initial reading reading when the litmus changes to red Fig. 2.1 Record in Table 2.1 the burette readings to the nearest 0.1 cm3. Table 2.1 initial reading / cm3 reading when the litmus changes to red / cm3 [2] (iv) Calculate the volume of dilute sulfuric acid added to change the colour of the litmus. Use the equation shown. volume of dilute reading when the = – initial reading sulfuric acid added litmus changes to red volume of dilute sulfuric acid added = .................................................. cm3 [1] (v) Explain why in step 5 the student adds the dilute sulfuric acid slowly instead of adding it all in one go. ........................................................................................................................................... ..................................................................................................................................... [1] (b) Procedure The student: step 9 adds a black insoluble powder called carbon to the red solution in the flask step 10 warms this mixture and then allows it to cool step 11 filters the mixture into a clean flask to obtain a colourless solution of the salt. (i) Describe the appearance of the residue in the filter paper after step 11. ..................................................................................................................................... [1] (ii) The filtrate is a colourless solution of the salt. Suggest the function of the carbon in steps 9 and 10. ........................................................................................................................................... ..................................................................................................................................... [1] (c) The student wants to obtain crystals of the salt from the colourless solution. Describe what the student does to obtain crystals. ................................................................................................................................................... ................................................................................................................................................... ................................................................................................................................................... ................................................................................................................................................... ................................................................................................................................................... ............................................................................................................................................. [3] (d) The student tests samples of the salt. (i) The student does a flame test on a solution of the salt. The student observes a yellow-coloured flame. Identify the metal ion present in the salt. ..................................................................................................................................... [1] (ii) The student adds dilute nitric acid followed by aqueous barium nitrate to a solution of the salt. The student observes a white precipitate and no gas is formed. Tick (3) the correct box to identify the anion (negative ion) present in the salt. carbonate chloride nitrate sulfate [1] [Total: 13]
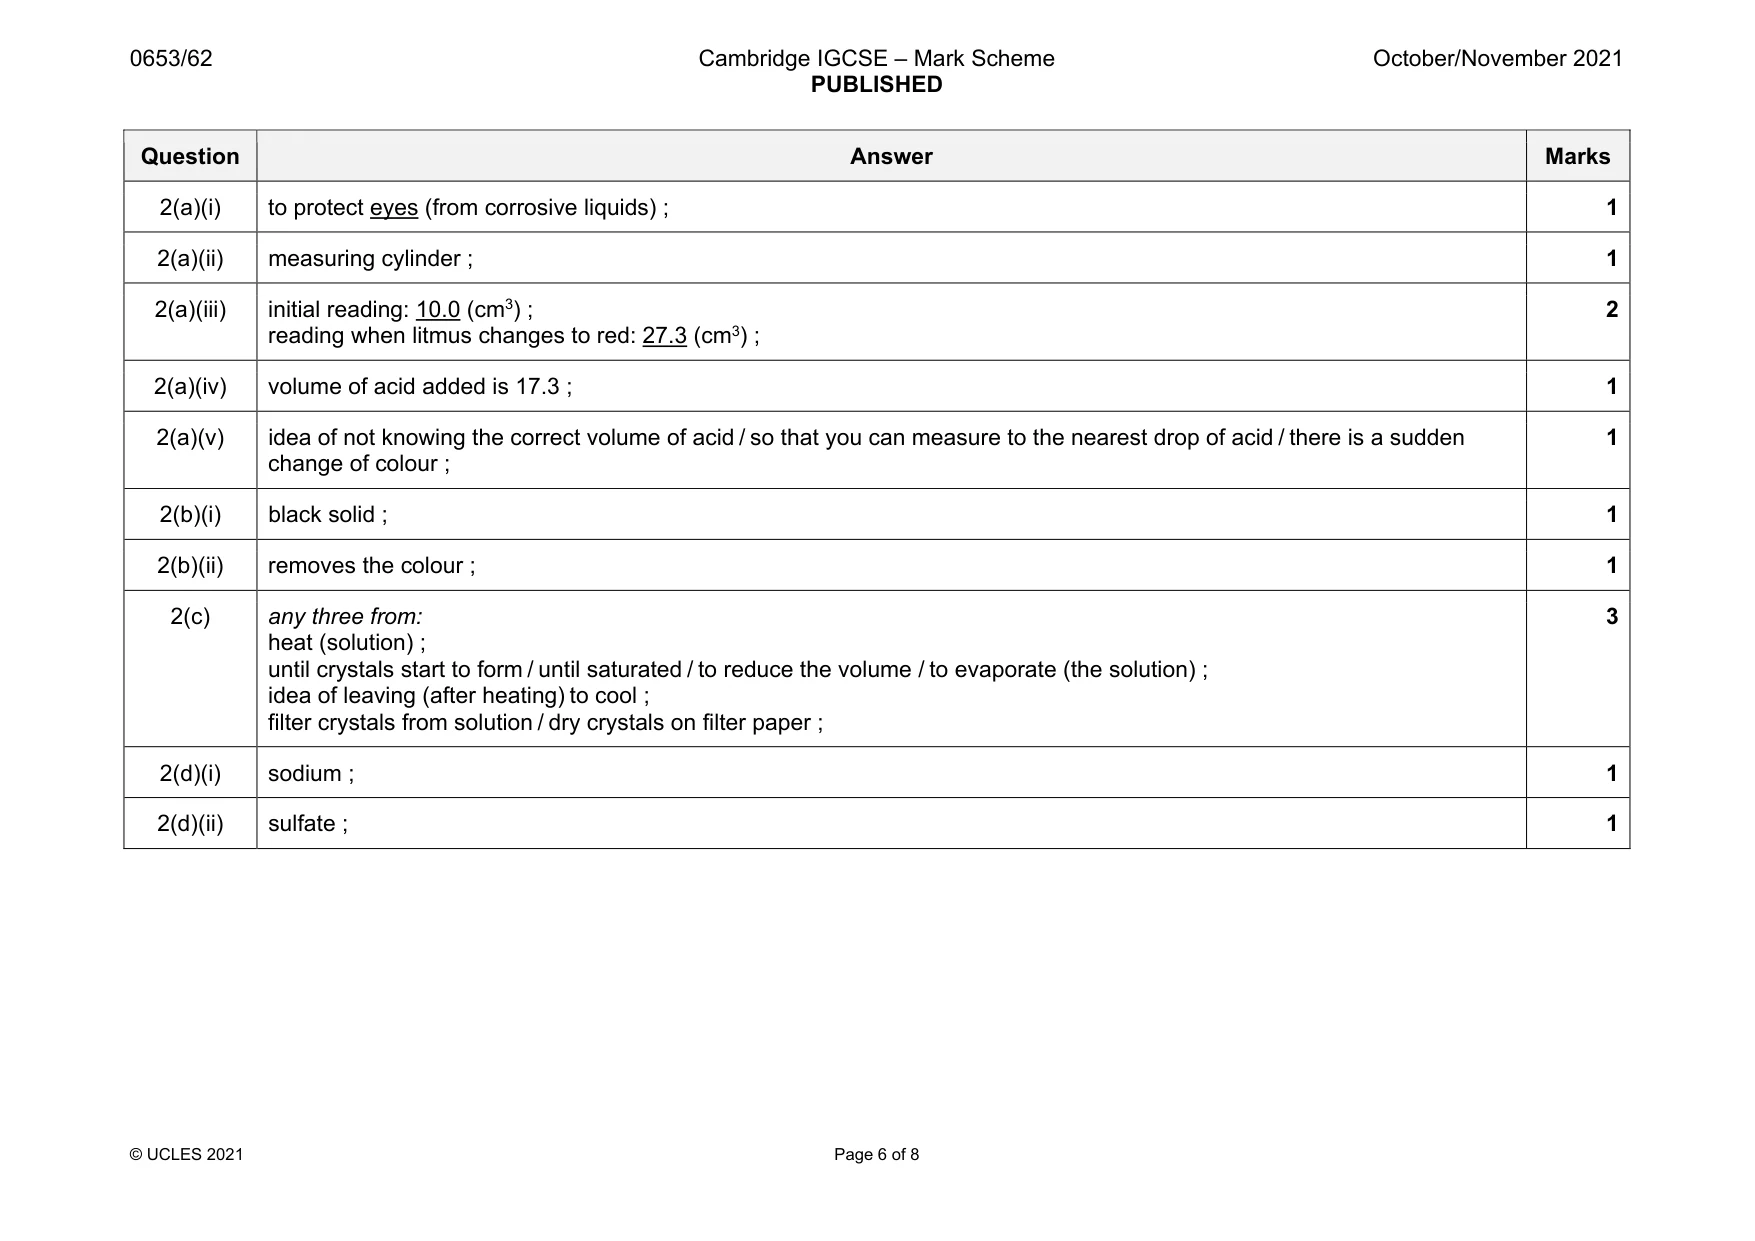
Mark scheme: 2(a)(i) to protect eyes (from corrosive liquids) ; 1 2(a)(ii) measuring cylinder ; 1 2(a)(iii) initial reading: 10.0 (cm3) ; reading when litmus changes to red: 27.3 (cm3) ; 2 2(a)(iv) volume of acid added is 17.3 ; 1 2(a)(v) idea of not knowing the correct volume of acid / so that you can measure to the nearest drop of acid / there is a sudden change of colour ; 1 2(b)(i) black solid ; 1 2(b)(ii) removes the colour ; 1 2(c) any three from: heat (solution) ; until crystals start to form / until saturated / to reduce the volume / to evaporate (the solution) ; idea of leaving (after heating) to cool ; filter crystals from solution / dry crystals on filter paper ; 3 2(d)(i) sodium ; 1 2(d)(ii) sulfate ; 1
More questions on The characteristic properties of acids and bases
Q3 · A student uses a balancing method to determine the mass of a metre rule
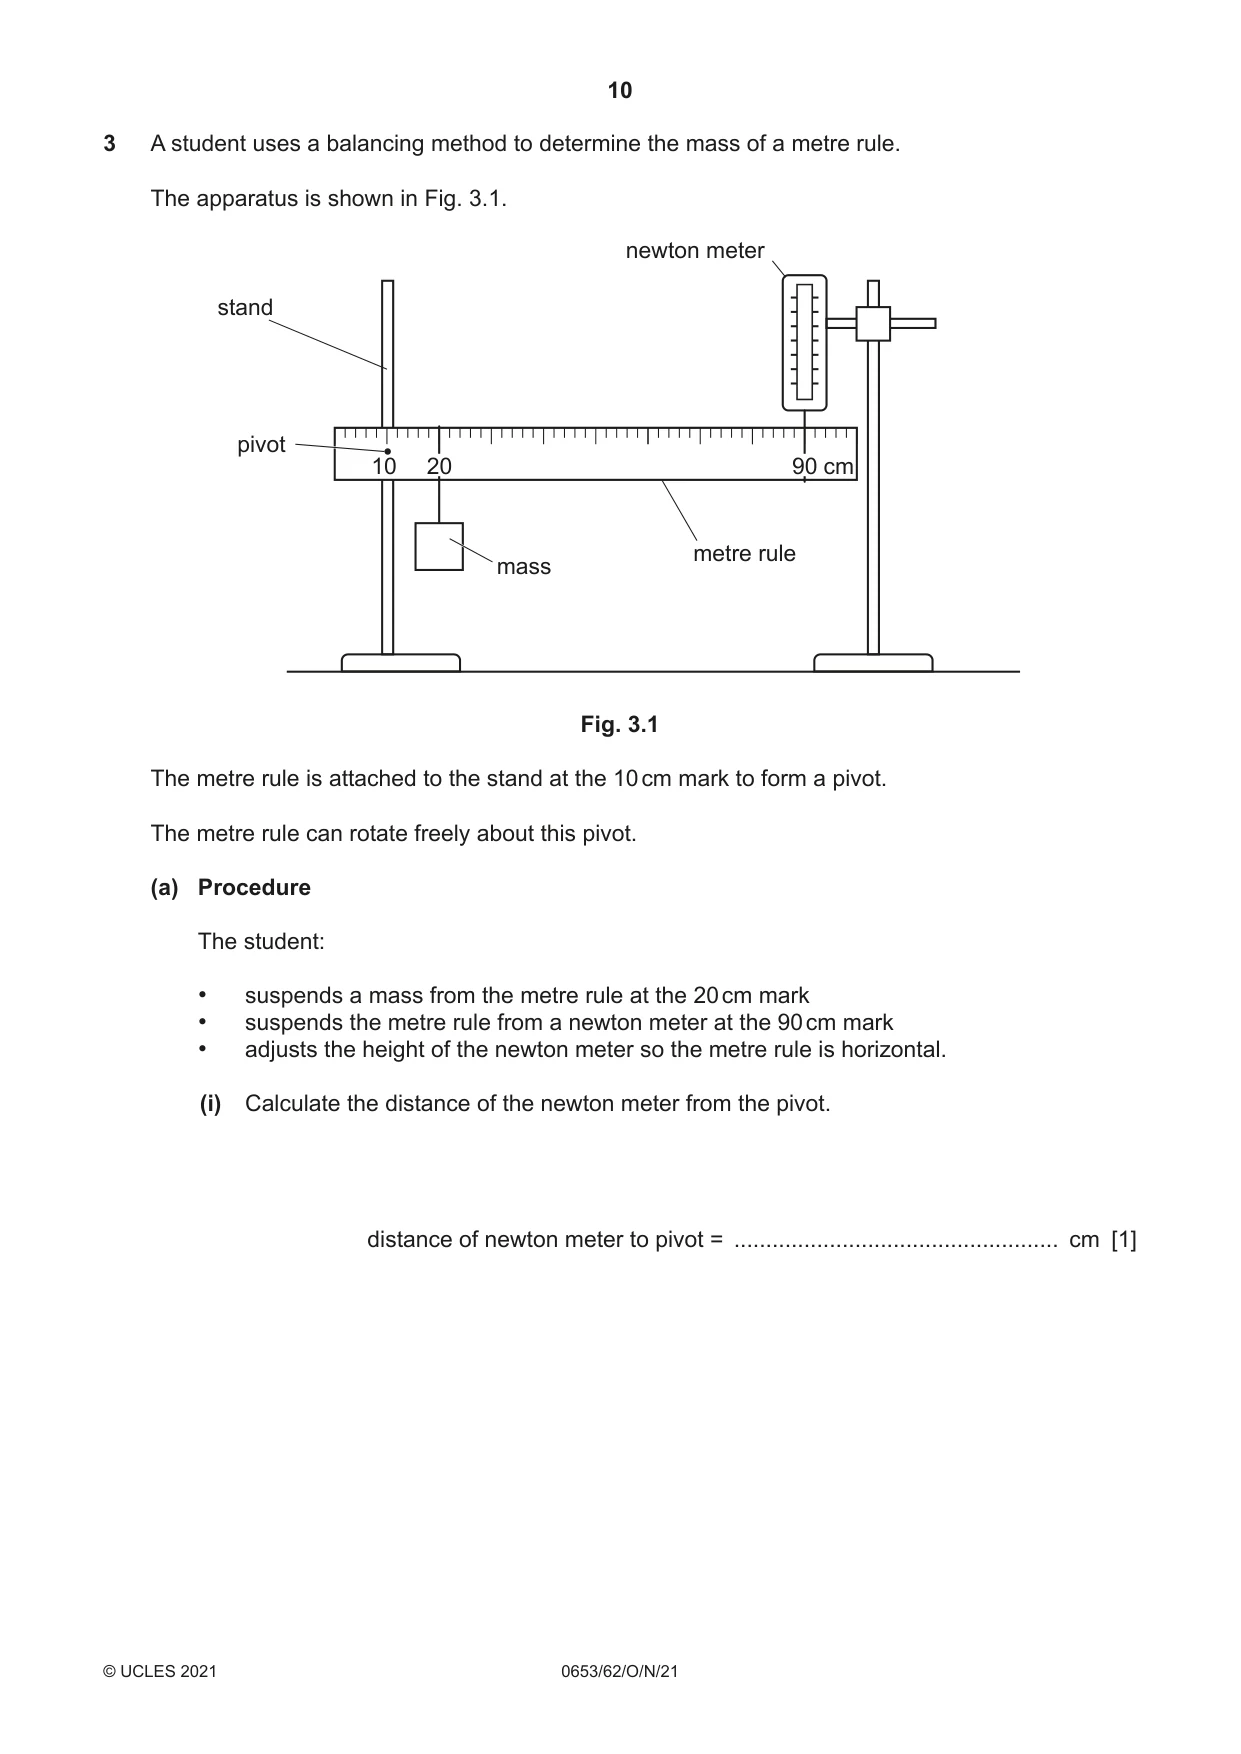
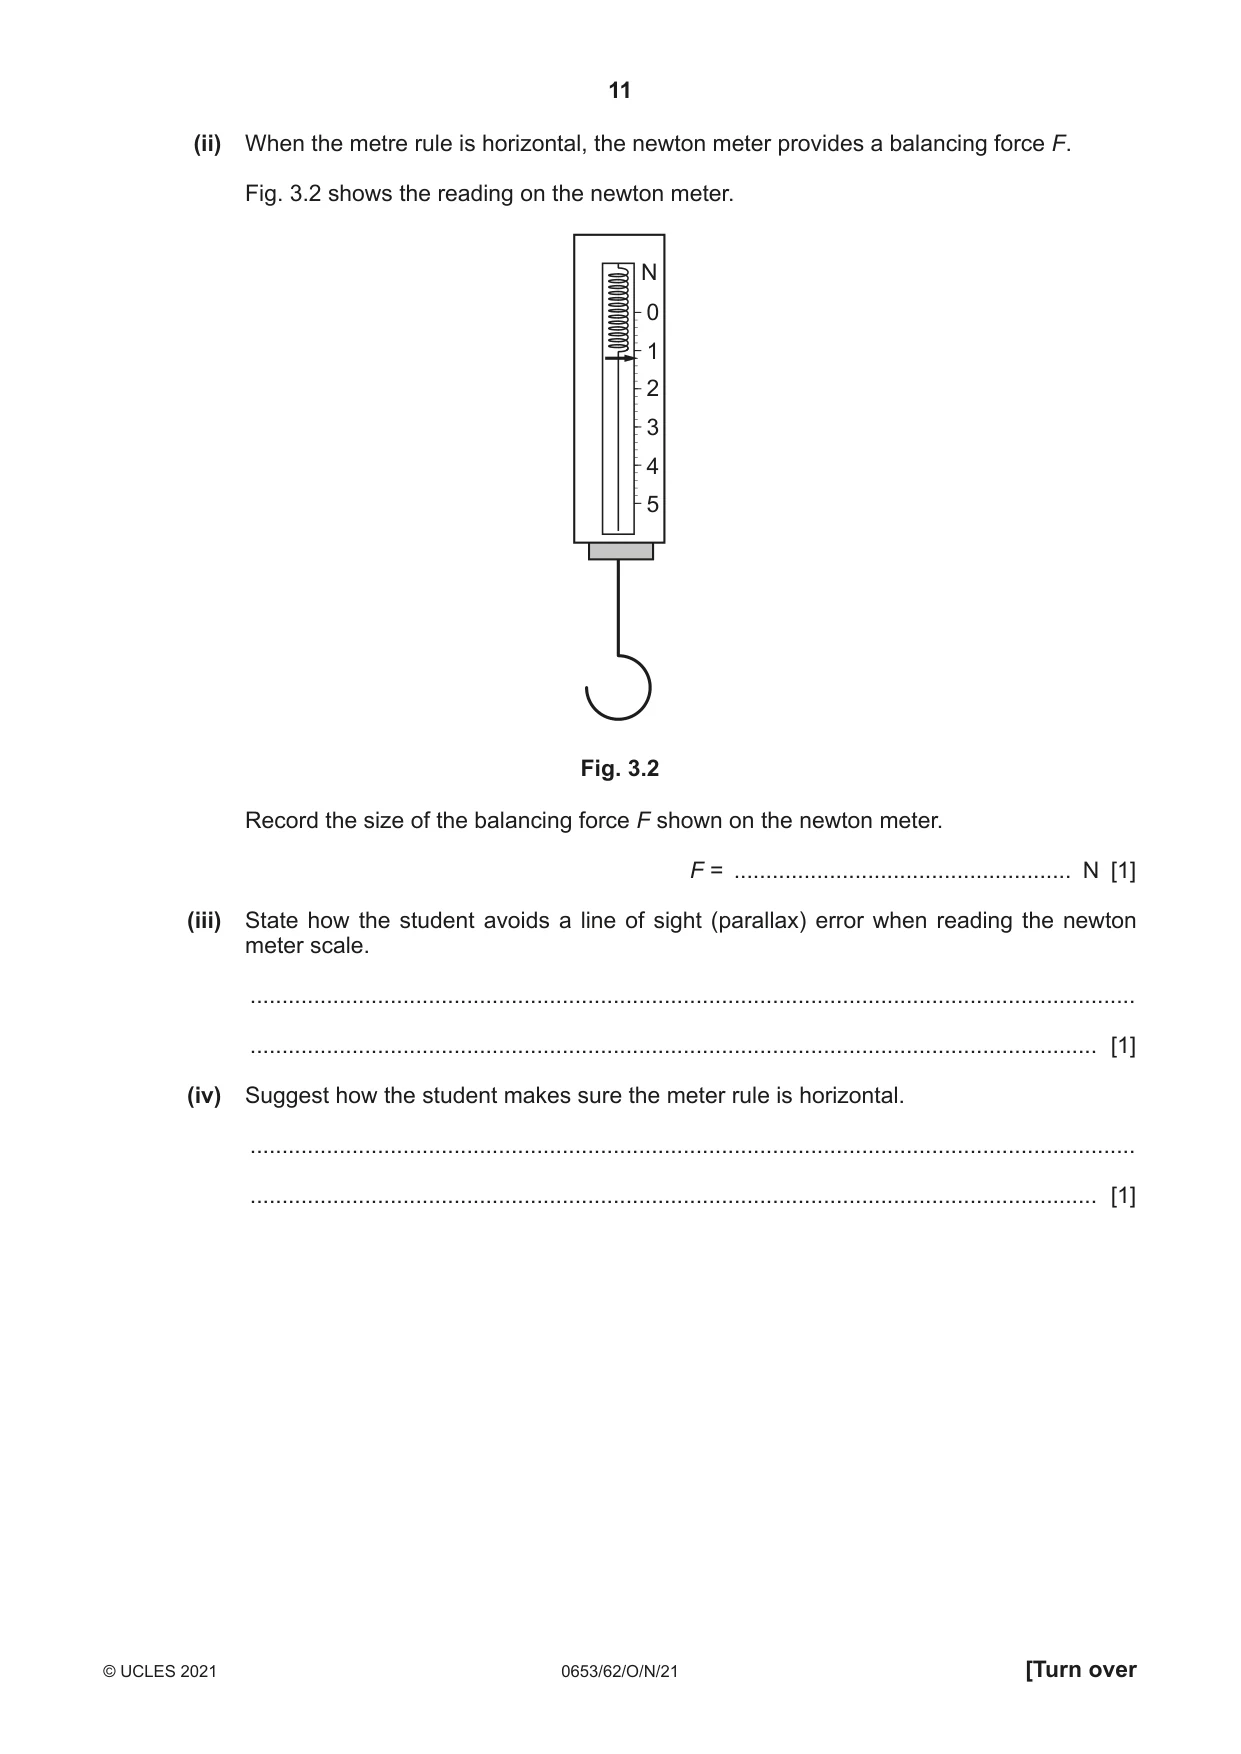
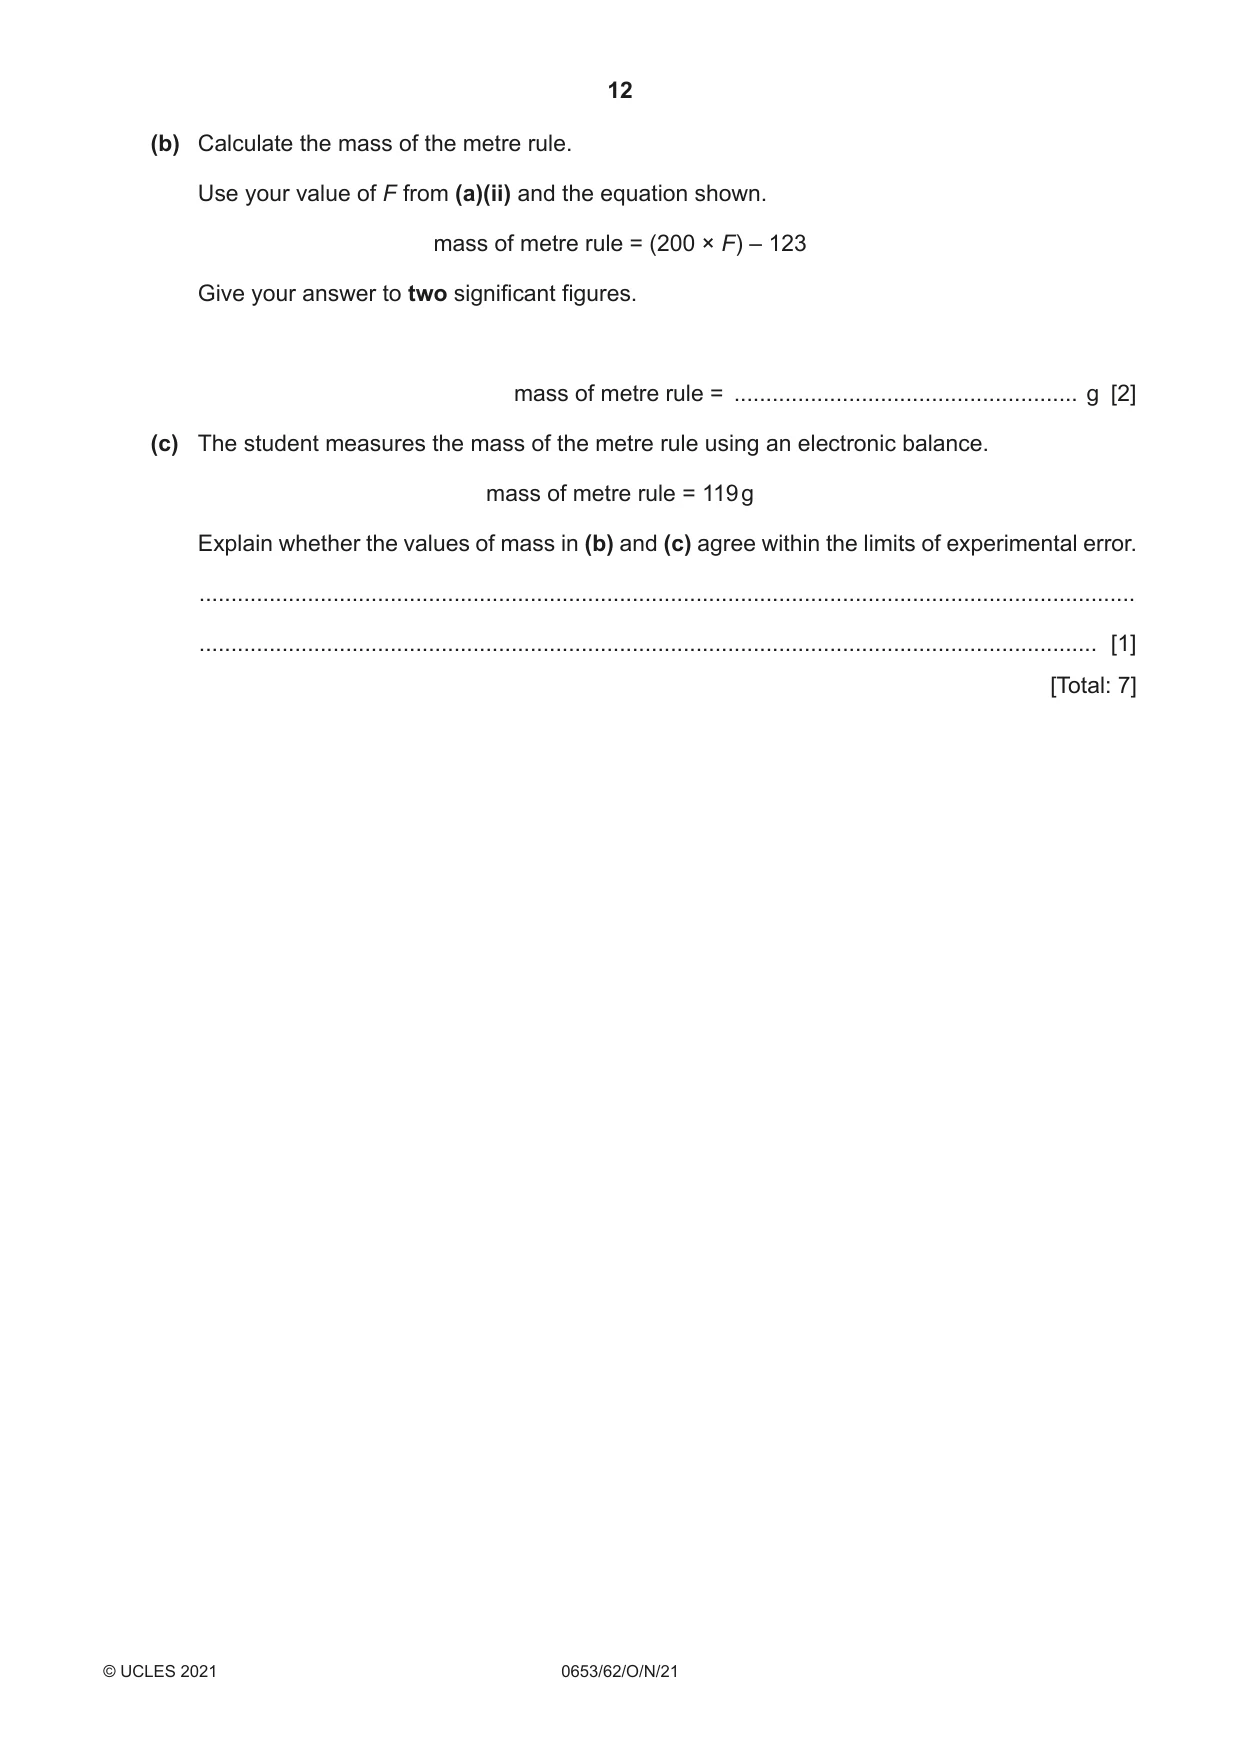
3 A student uses a balancing method to determine the mass of a metre rule. The apparatus is shown in Fig. 3.1. newton meter stand pivot 10 20 90 cm metre rule mass Fig. 3.1 The metre rule is attached to the stand at the 10 cm mark to form a pivot. The metre rule can rotate freely about this pivot. (a) Procedure The student: • suspends a mass from the metre rule at the 20 cm mark • suspends the metre rule from a newton meter at the 90 cm mark • adjusts the height of the newton meter so the metre rule is horizontal. (i) Calculate the distance of the newton meter from the pivot. distance of newton meter to pivot = ................................................... cm [1] (ii) When the metre rule is horizontal, the newton meter provides a balancing force F. Fig. 3.2 shows the reading on the newton meter. N 0 1 2 3 4 5 Fig. 3.2 Record the size of the balancing force F shown on the newton meter. F = ..................................................... N [1] (iii) State how the student avoids a line of sight (parallax) error when reading the newton meter scale. ........................................................................................................................................... ..................................................................................................................................... [1] (iv) Suggest how the student makes sure the meter rule is horizontal. ........................................................................................................................................... ..................................................................................................................................... [1] (b) Calculate the mass of the metre rule. Use your value of F from (a)(ii) and the equation shown. mass of metre rule = (200 × F) – 123 Give your answer to two significant figures. mass of metre rule = ...................................................... g [2] (c) The student measures the mass of the metre rule using an electronic balance. mass of metre rule = 119 g Explain whether the values of mass in (b) and (c) agree within the limits of experimental error. ................................................................................................................................................... ............................................................................................................................................. [1] [Total: 7]
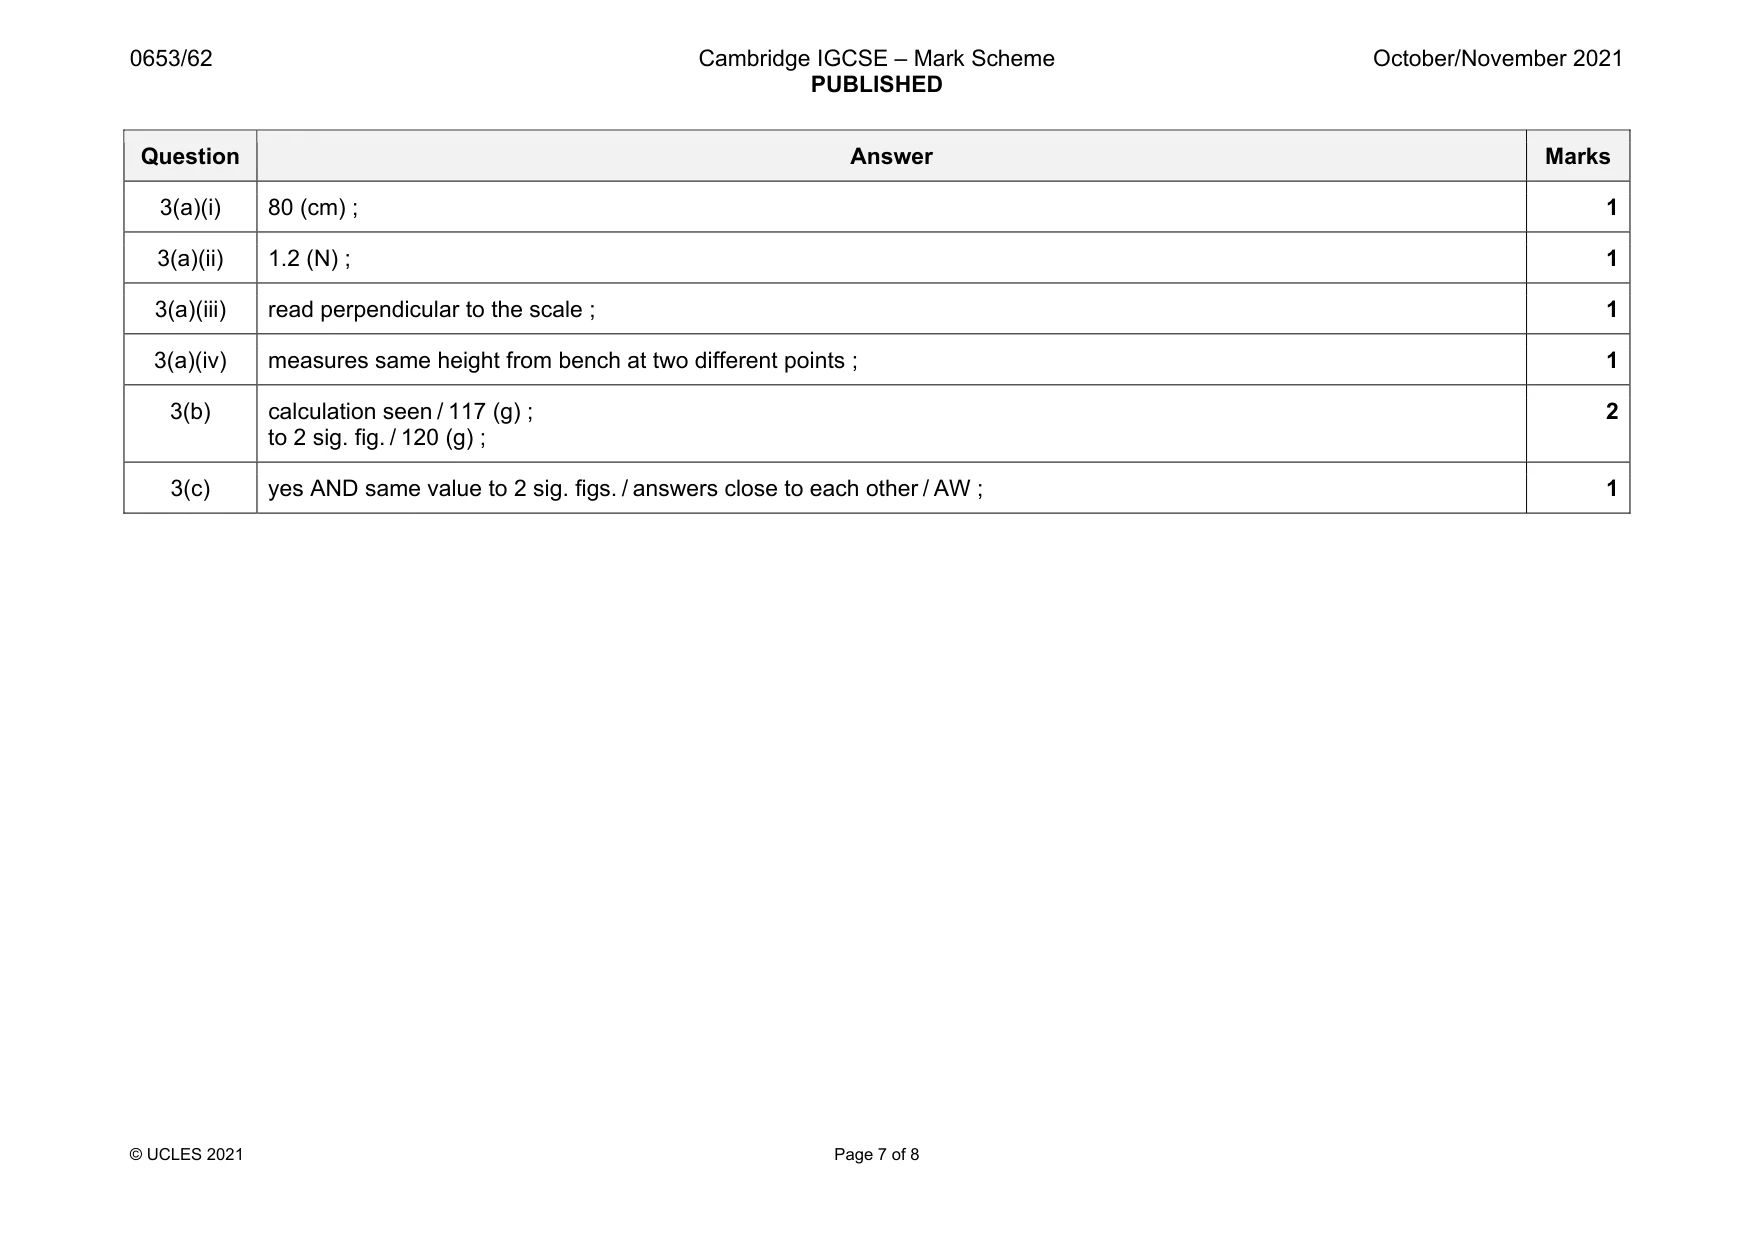
Mark scheme: 3(a)(i) 80 (cm) ; 1 3(a)(ii) 1.2 (N) ; 1 3(a)(iii) read perpendicular to the scale ; 1 3(a)(iv) measures same height from bench at two different points ; 1 3(b) calculation seen / 117 (g) ; to 2 sig. fig. / 120 (g) ; 2 3(c) yes AND same value to 2 sig. figs. / answers close to each other / AW ; 1
More questions on Physical quantities and measurement techniques
Q4 · A ‘drinks cooler sleeve’
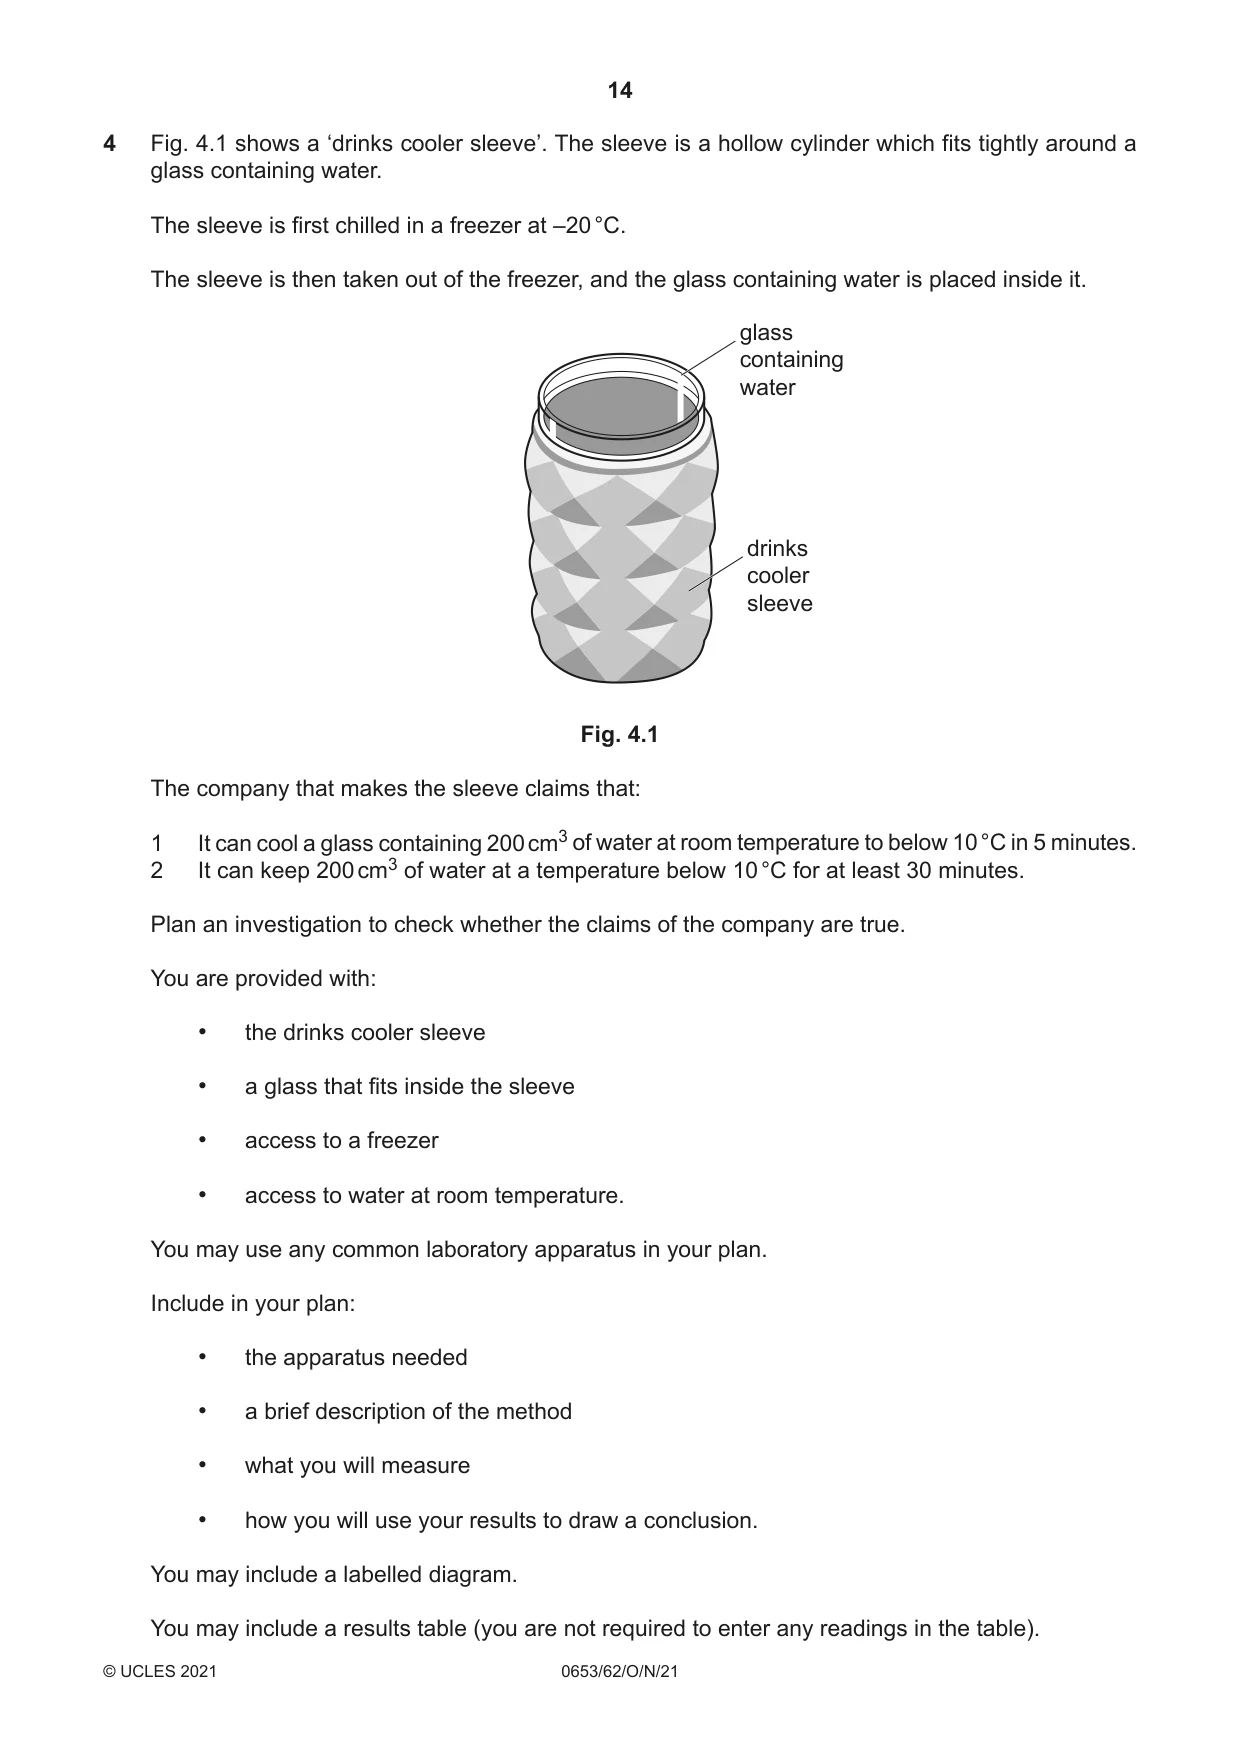
4 Fig. 4.1 shows a ‘drinks cooler sleeve’. The sleeve is a hollow cylinder which fits tightly around a glass containing water. The sleeve is first chilled in a freezer at –20 °C. The sleeve is then taken out of the freezer, and the glass containing water is placed inside it. glass containing water drinks cooler sleeve Fig. 4.1 The company that makes the sleeve claims that: 1 It can cool a glass containing 200 cm3 of water at room temperature to below 10 °C in 5 minutes. 2 It can keep 200 cm3 of water at a temperature below 10 °C for at least 30 minutes. Plan an investigation to check whether the claims of the company are true. You are provided with: • the drinks cooler sleeve • a glass that fits inside the sleeve • access to a freezer • access to water at room temperature. You may use any common laboratory apparatus in your plan. Include in your plan: • the apparatus needed • a brief description of the method • what you will measure • how you will use your results to draw a conclusion. You may include a labelled diagram. You may include a results table (you are not required to enter any readings in the table). .......................................................................................................................................................... .......................................................................................................................................................... .......................................................................................................................................................... .......................................................................................................................................................... .......................................................................................................................................................... .......................................................................................................................................................... .......................................................................................................................................................... .......................................................................................................................................................... .......................................................................................................................................................... .......................................................................................................................................................... .......................................................................................................................................................... .......................................................................................................................................................... .......................................................................................................................................................... .................................................................................................................................................... [7]
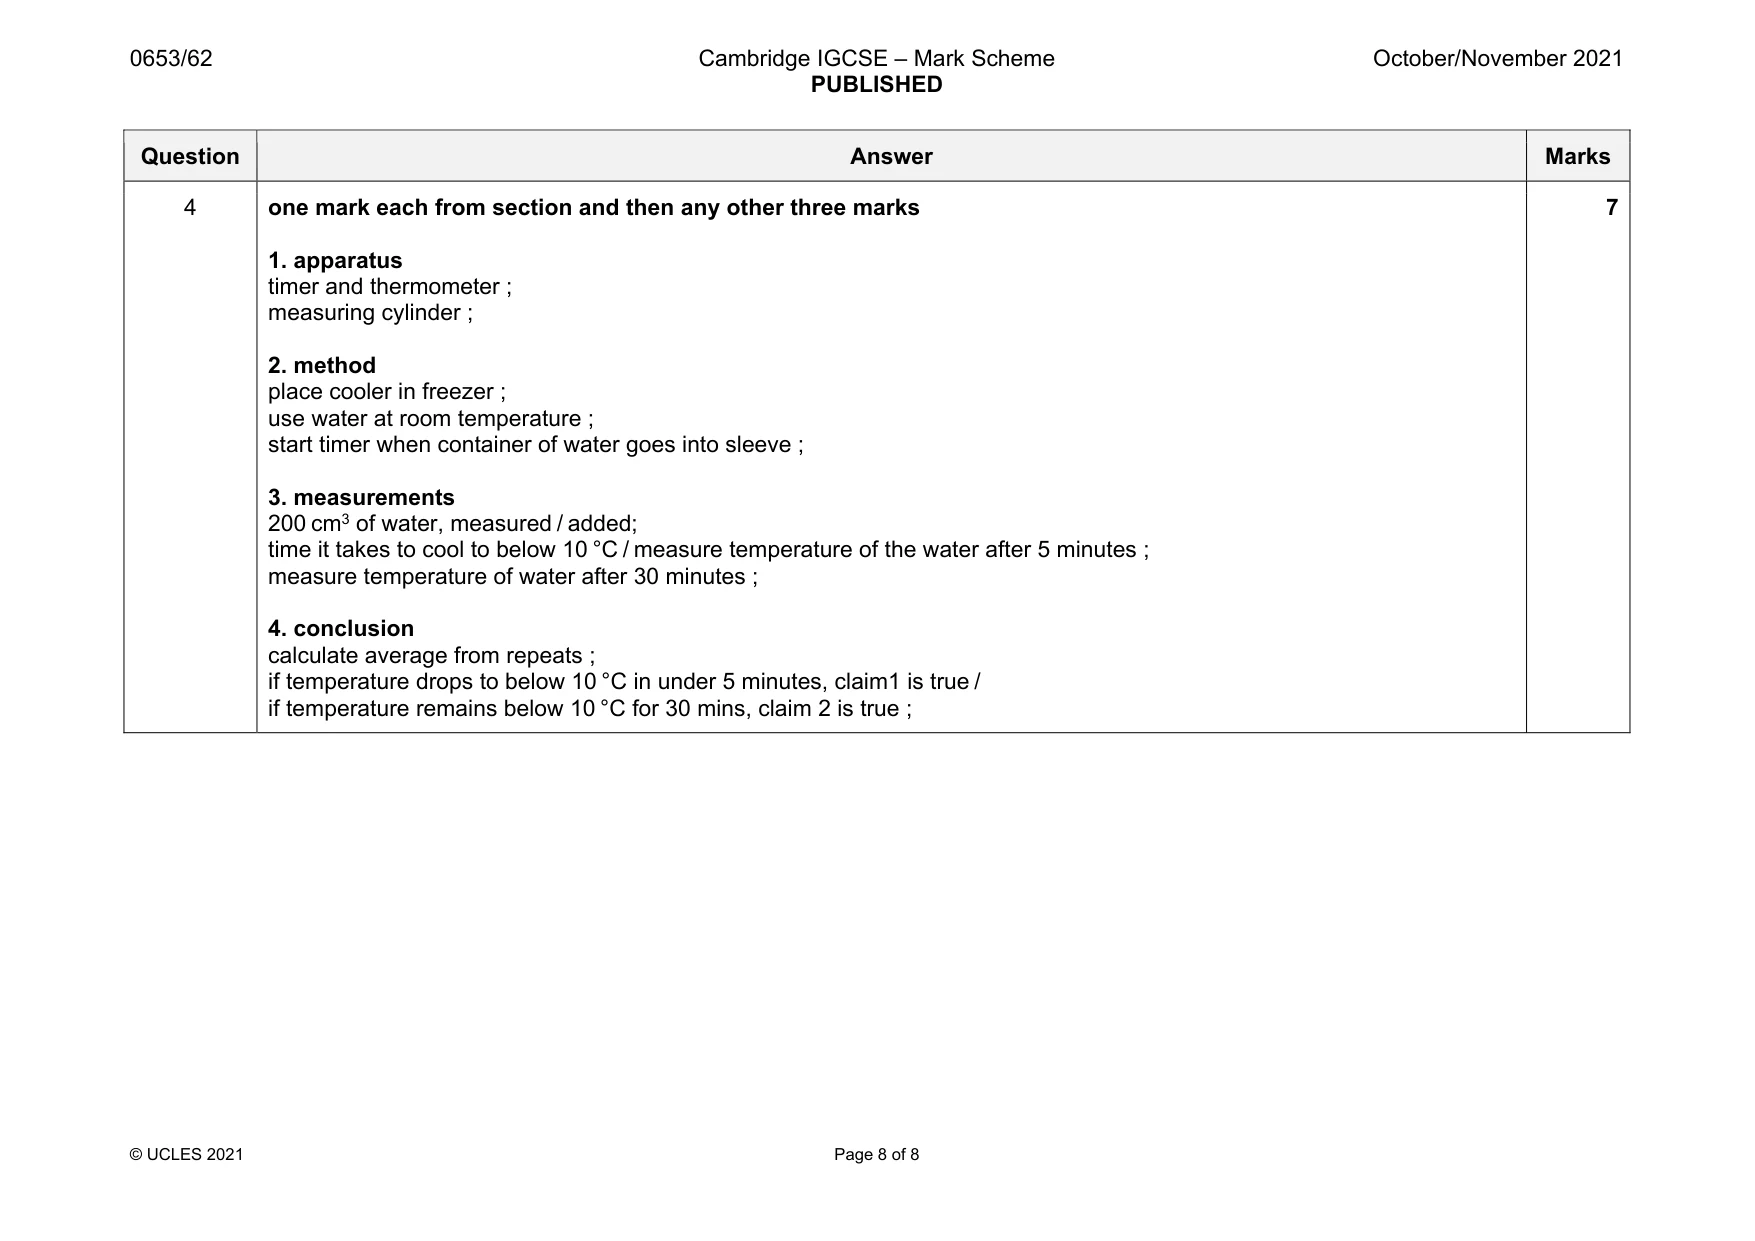
Mark scheme: 4 one mark each from section and then any other three marks 1. apparatus timer and thermometer ; measuring cylinder ; 2. method place cooler in freezer ; use water at room temperature ; start timer when container of water goes into sleeve ; 3. measurements 200 cm3 of water, measured / added; time it takes to cool to below 10 °C / measure temperature of the water after 5 minutes ; measure temperature of water after 30 minutes ; 4. conclusion calculate average from repeats ; if temperature drops to below 10 °C in under 5 minutes, claim1 is true / if temperature remains below 10 °C for 30 mins, claim 2 is true ; 7
What was in this paper
The subtopics covered by these 4 questions, and how many questions each got. Open one in a new tab to see every Cambridge question on it.
What you needed in this session
Cambridge’s own grade thresholds for 2021 Oct/Nov, Paper 6 · Variant 2. A higher threshold means an easier paper — the bar moves with how the cohort did.