Cambridge IGCSE Science - Combined 0653 — 2020 Oct/Nov Paper 6 · Variant 3
0653/63/O/N/20 · 4 questions · 40 marks · ≈45 min
The question paper and its mark scheme, free to read here and free to download. This is Cambridge’s own paper, exactly as it was sat.
Question paper16 pages



Mark scheme8 pages
Answers below. Sit the paper first if you are practising.
Questions as text
Q1 · A student investigates the effect of minerals on the growth of plants
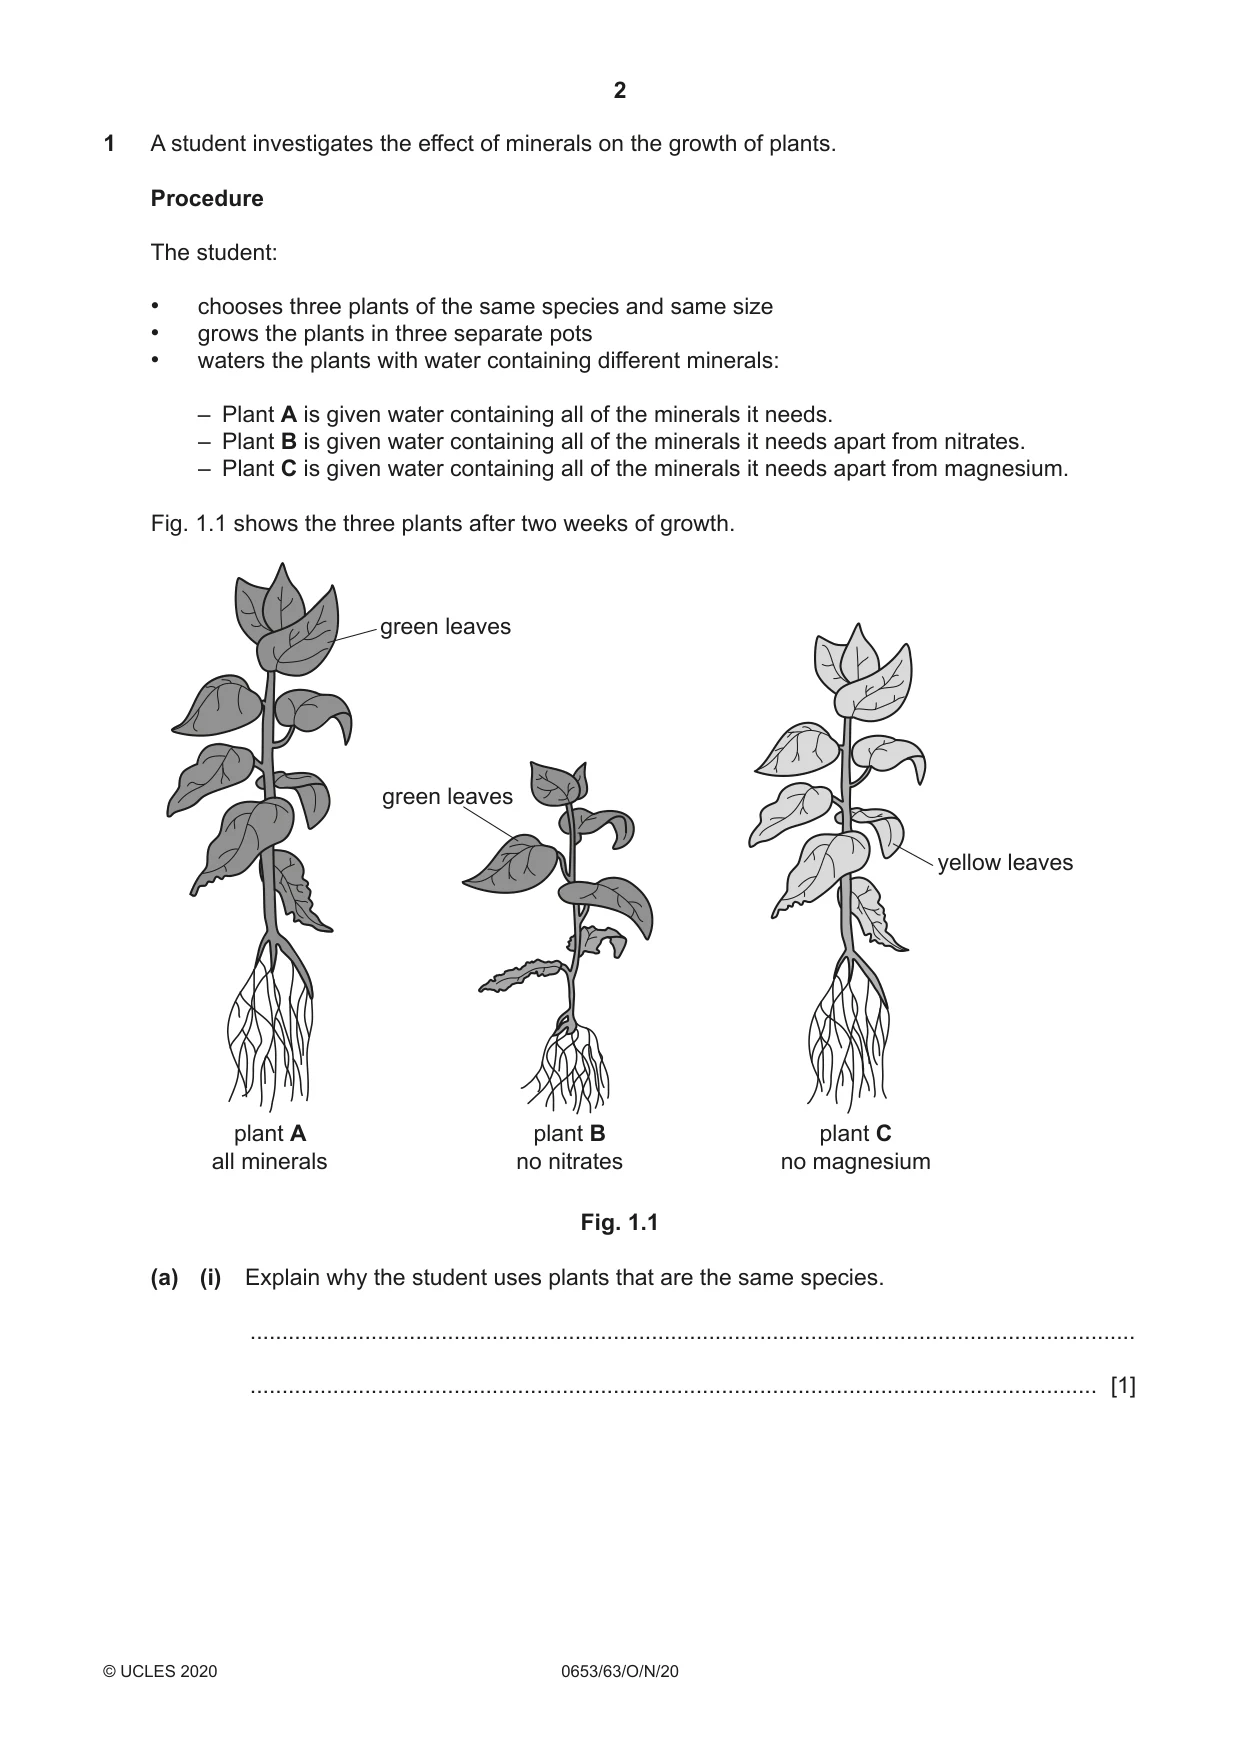
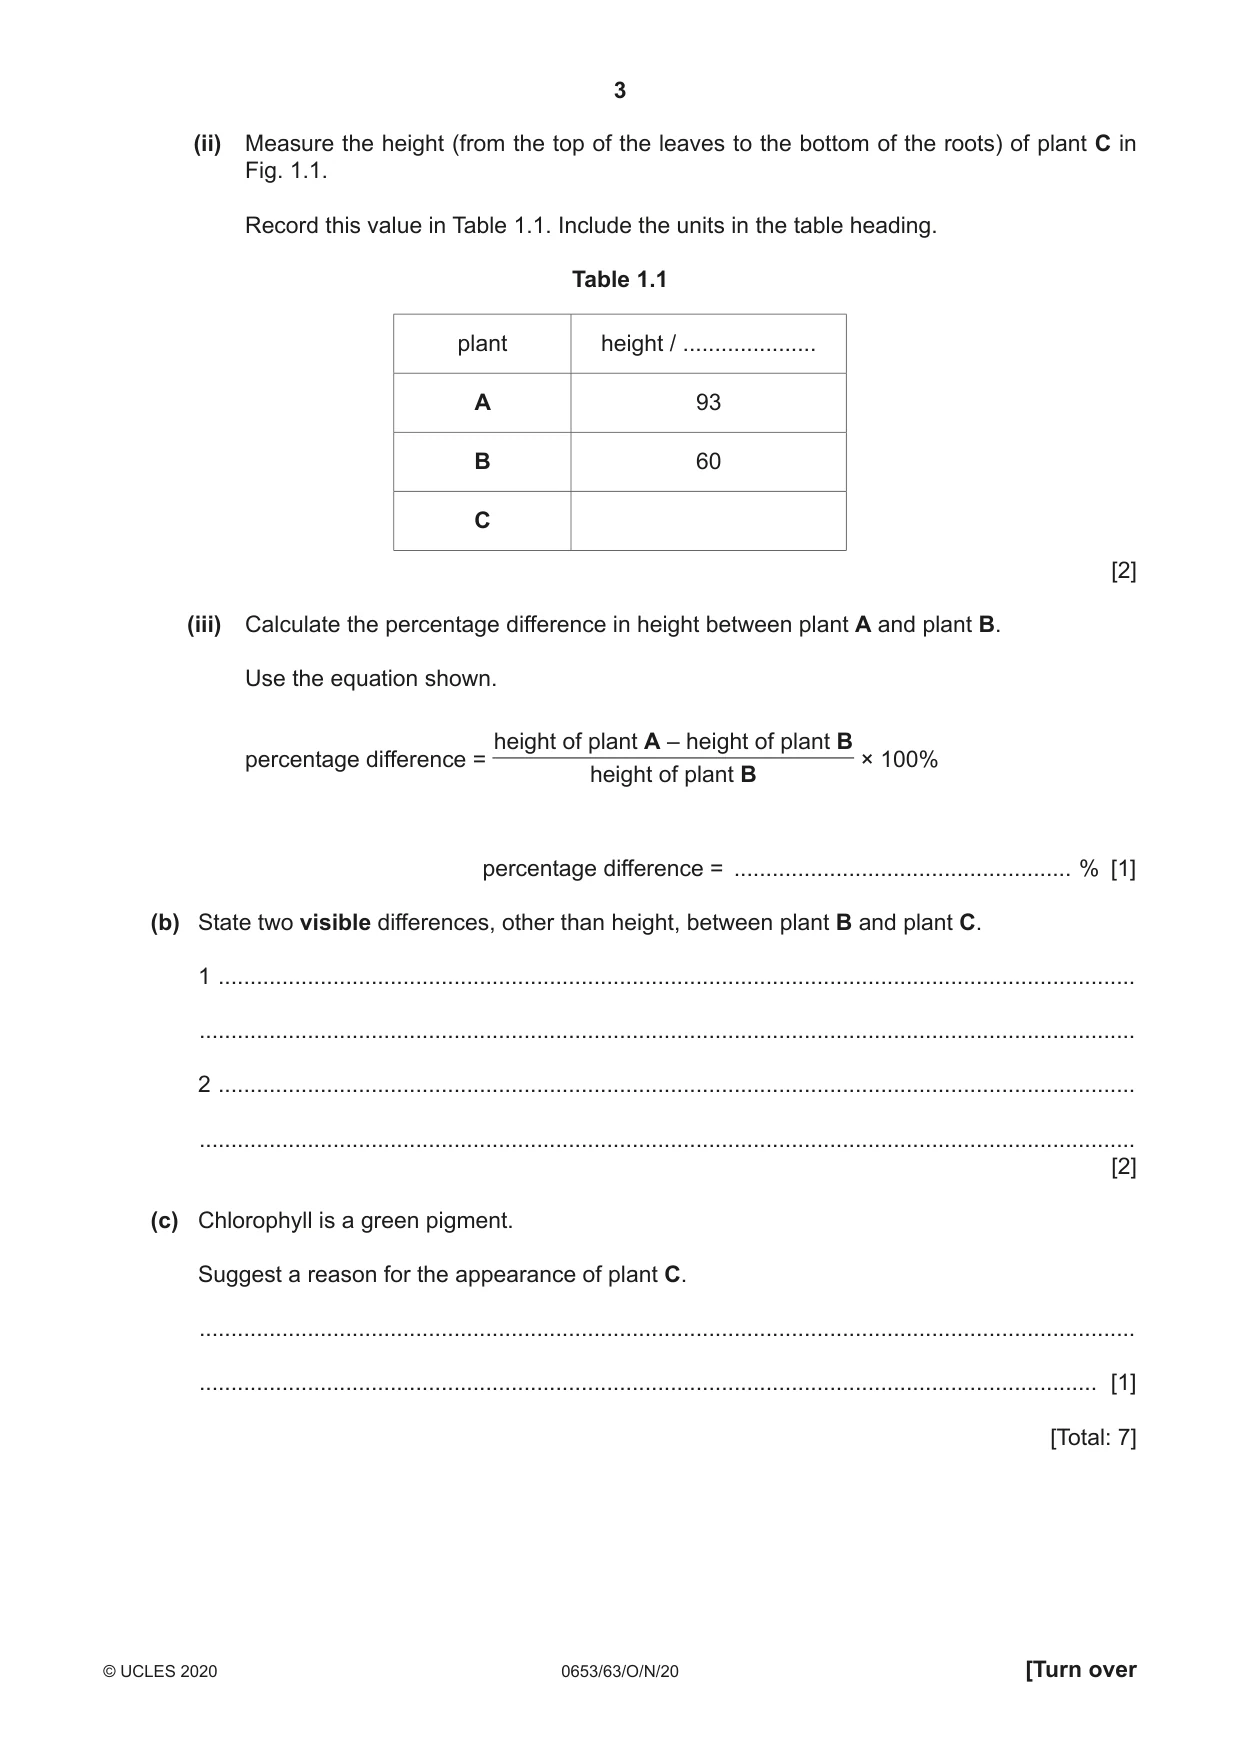
1 A student investigates the effect of minerals on the growth of plants. Procedure The student: • chooses three plants of the same species and same size • grows the plants in three separate pots • waters the plants with water containing different minerals: – Plant A is given water containing all of the minerals it needs. – Plant B is given water containing all of the minerals it needs apart from nitrates. – Plant C is given water containing all of the minerals it needs apart from magnesium. Fig. 1.1 shows the three plants after two weeks of growth. green leaves green leaves yellow leaves plant A plant B plant C all minerals no nitrates no magnesium Fig. 1.1 (a) (i) Explain why the student uses plants that are the same species. ........................................................................................................................................... ..................................................................................................................................... [1] (ii) Measure the height (from the top of the leaves to the bottom of the roots) of plant C in Fig. 1.1. Record this value in Table 1.1. Include the units in the table heading. Table 1.1 plant height / ..................... A 93 B 60 C [2] (iii) Calculate the percentage difference in height between plant A and plant B. Use the equation shown. height of plant A – height of plant B percentage difference = × 100% height of plant B percentage difference = ..................................................... % [1] (b) State two visible differences, other than height, between plant B and plant C. 1 ................................................................................................................................................ ................................................................................................................................................... 2 ................................................................................................................................................ ................................................................................................................................................... [2] (c) Chlorophyll is a green pigment. Suggest a reason for the appearance of plant C. ................................................................................................................................................... ............................................................................................................................................. [1] [Total: 7]
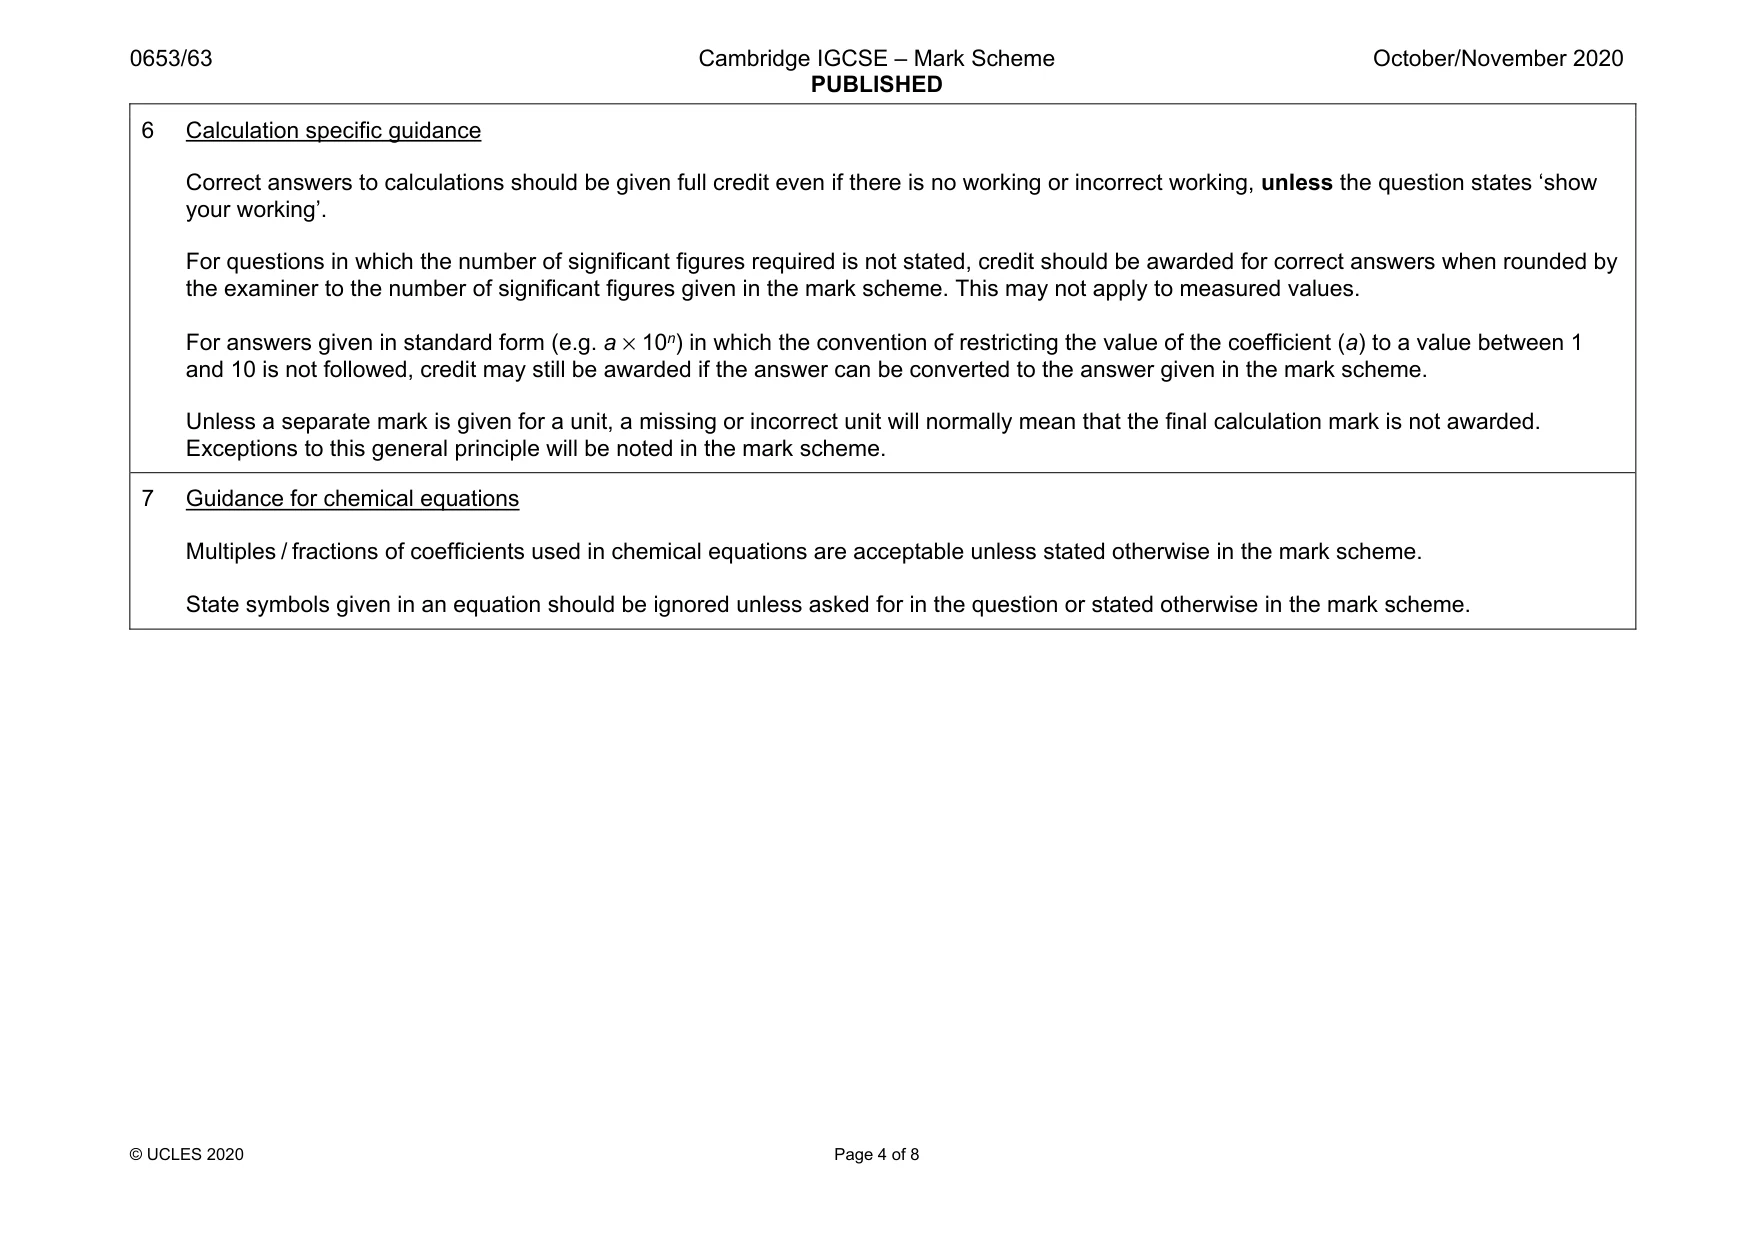
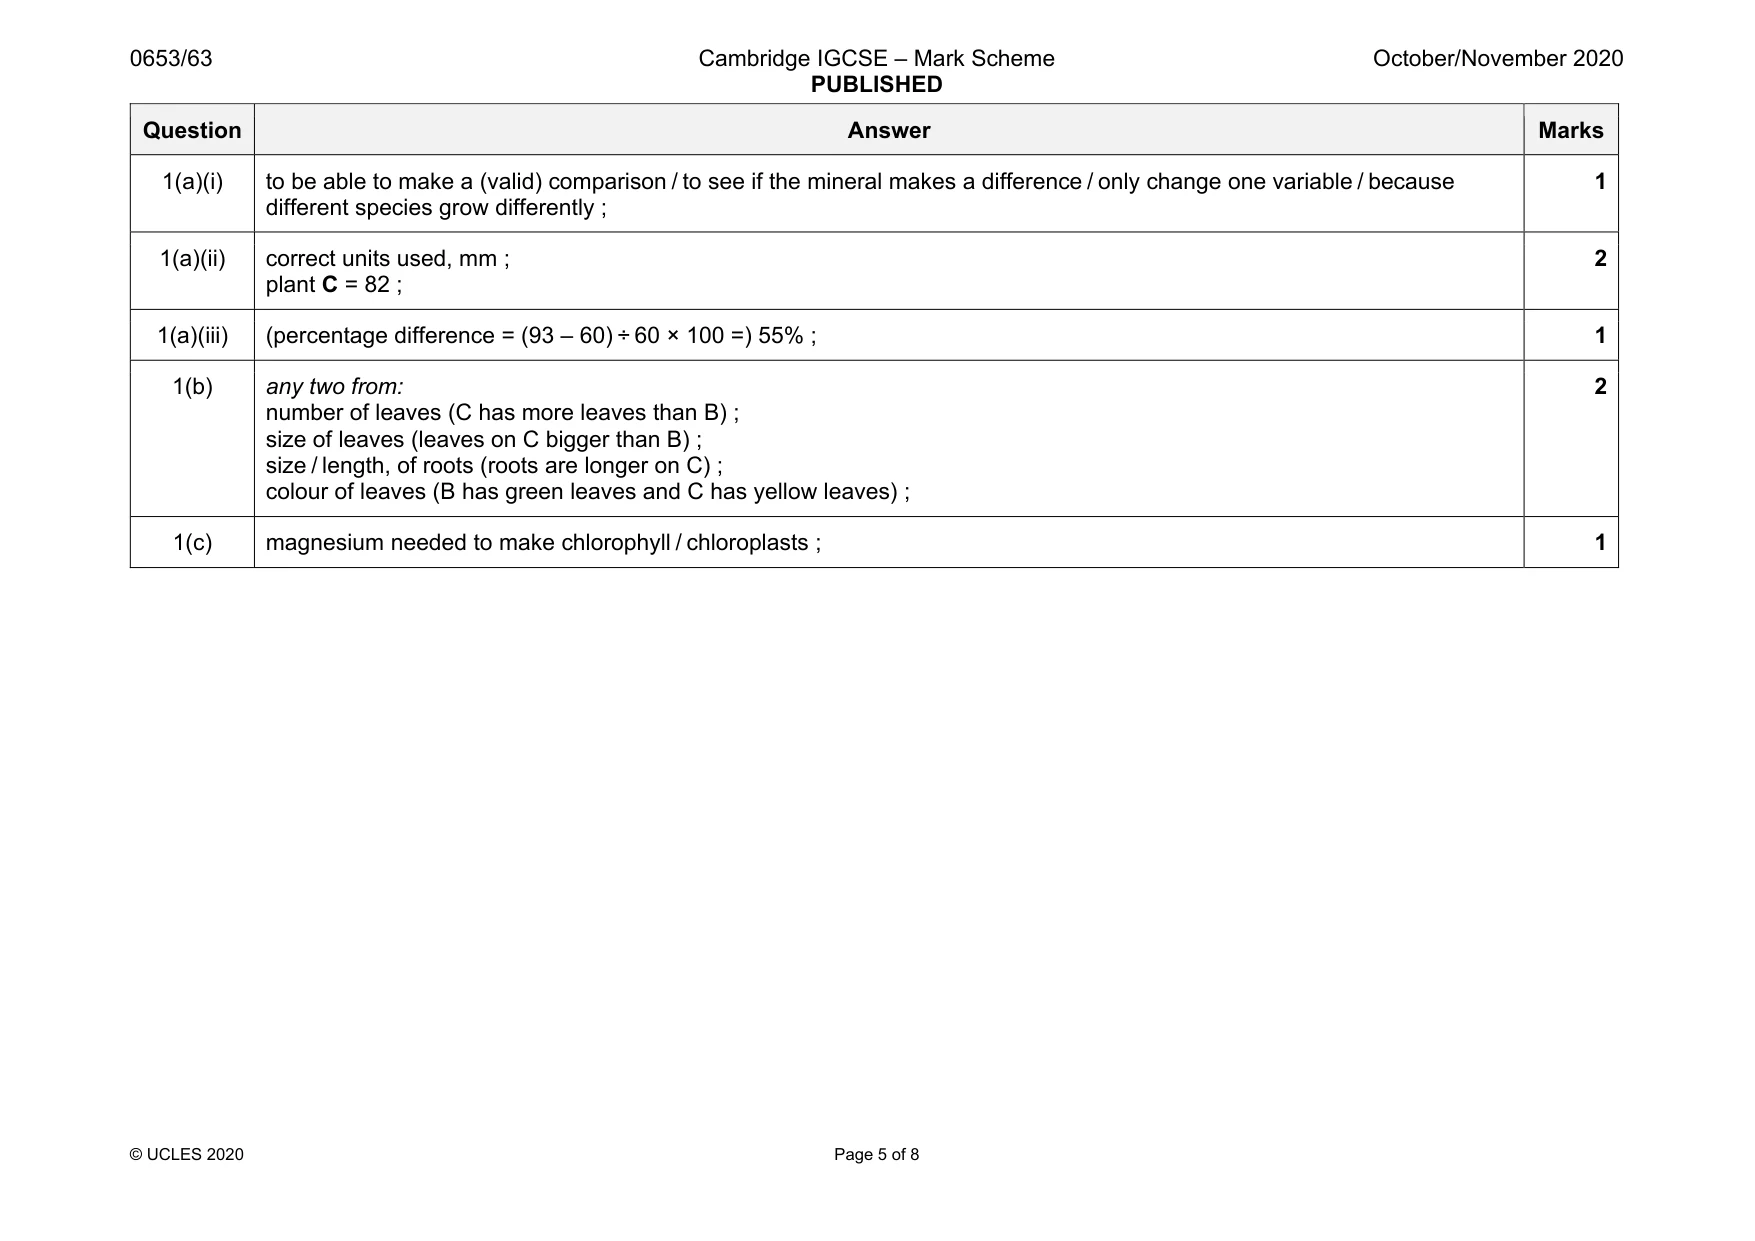
Mark scheme: 1(a)(i) to be able to make a (valid) comparison / to see if the mineral makes a difference / only change one variable / because different species grow differently ; 1 1(a)(ii) correct units used, mm ; plant C = 82 ; 2 1(a)(iii) (percentage difference = (93 – 60) ÷ 60 × 100 =) 55% ; 1 1(b) any two from: number of leaves (C has more leaves than B) ; size of leaves (leaves on C bigger than B) ; size / length, of roots (roots are longer on C) ; colour of leaves (B has green leaves and C has yellow leaves) ; 2 1(c) magnesium needed to make chlorophyll / chloroplasts ; 1
Q2 · A student states: ‘If I double the intensity of light, the rate of photosynthesis will…
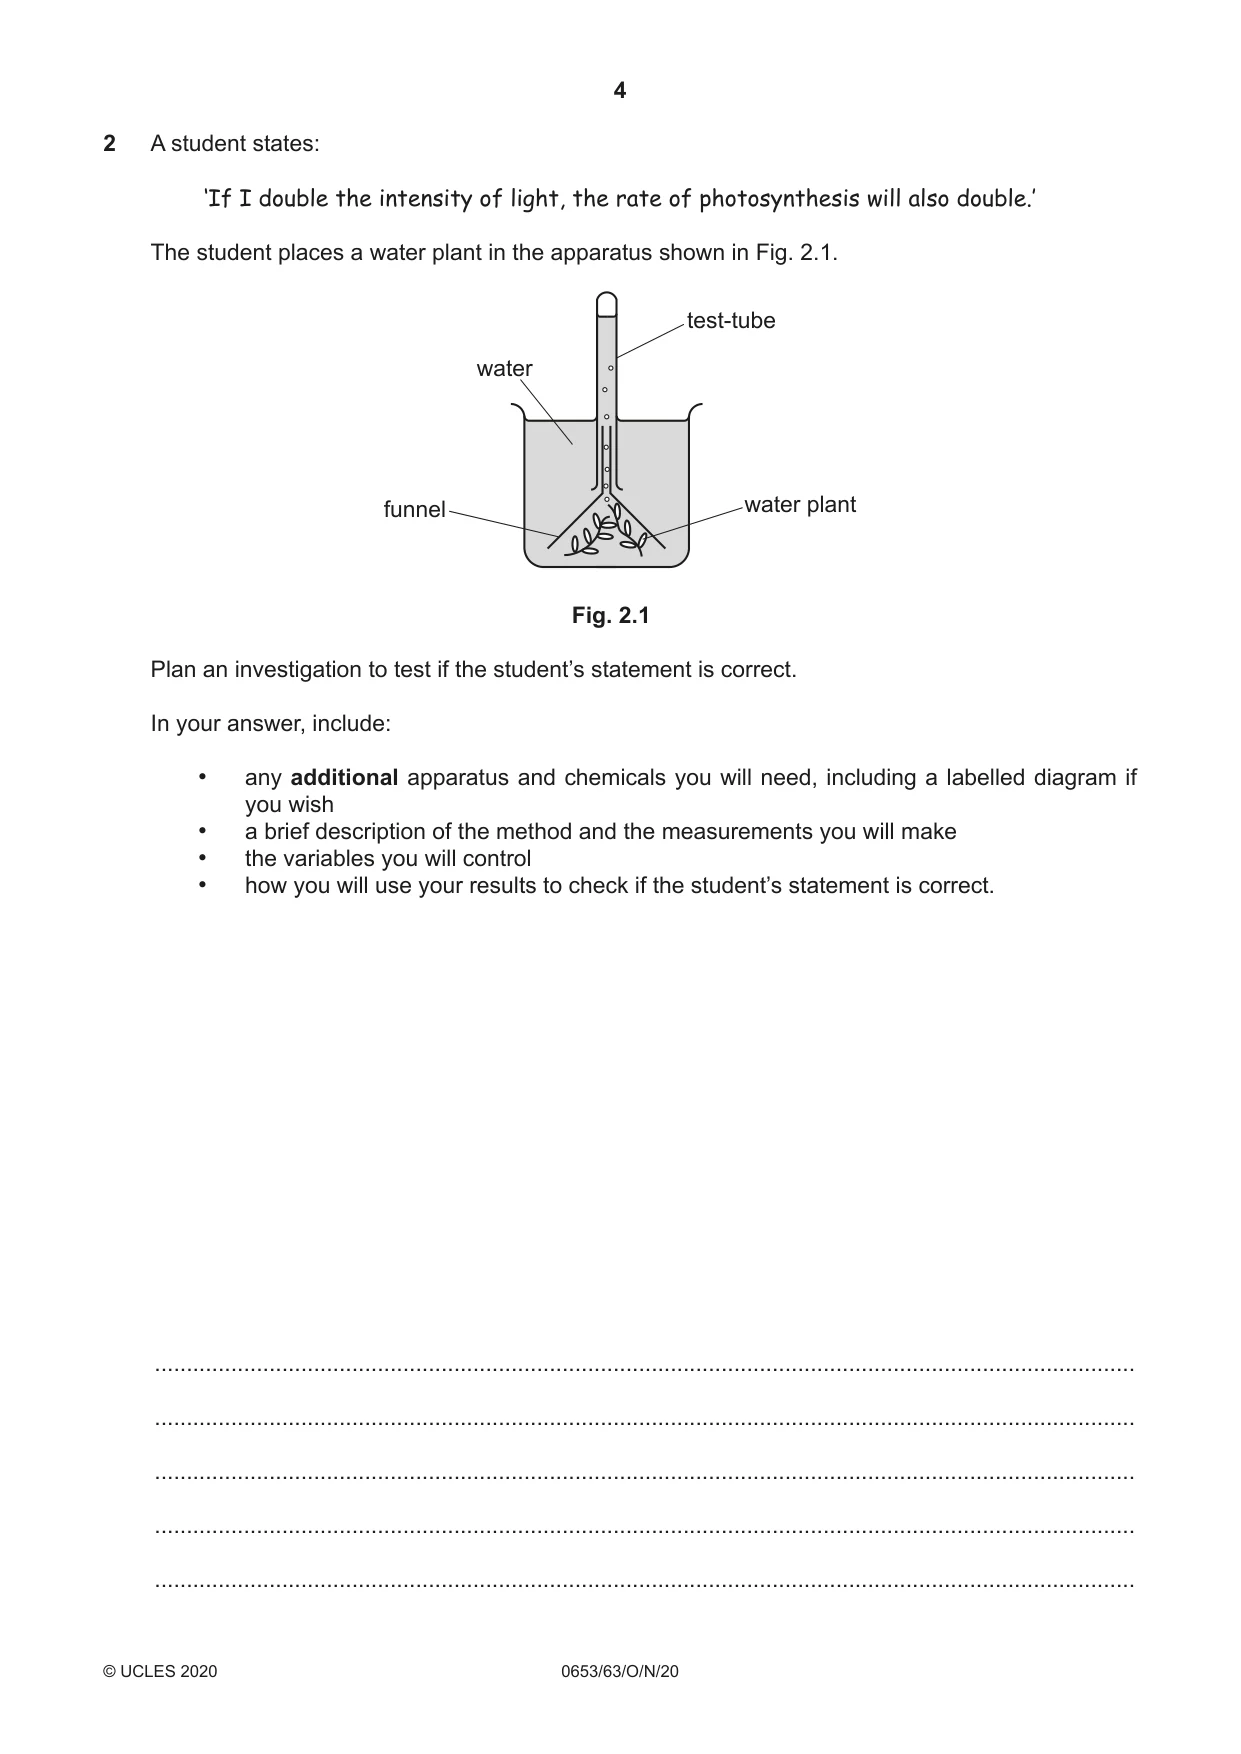
2 A student states: ‘If I double the intensity of light, the rate of photosynthesis will also double.’ The student places a water plant in the apparatus shown in Fig. 2.1. test-tube water funnel water plant Fig. 2.1 Plan an investigation to test if the student’s statement is correct. In your answer, include: • any additional apparatus and chemicals you will need, including a labelled diagram if you wish • a brief description of the method and the measurements you will make • the variables you will control • how you will use your results to check if the student’s statement is correct. .......................................................................................................................................................... .......................................................................................................................................................... .......................................................................................................................................................... .......................................................................................................................................................... .......................................................................................................................................................... .......................................................................................................................................................... .......................................................................................................................................................... .......................................................................................................................................................... .......................................................................................................................................................... .......................................................................................................................................................... .......................................................................................................................................................... .......................................................................................................................................................... .......................................................................................................................................................... .......................................................................................................................................................... .................................................................................................................................................... [7]
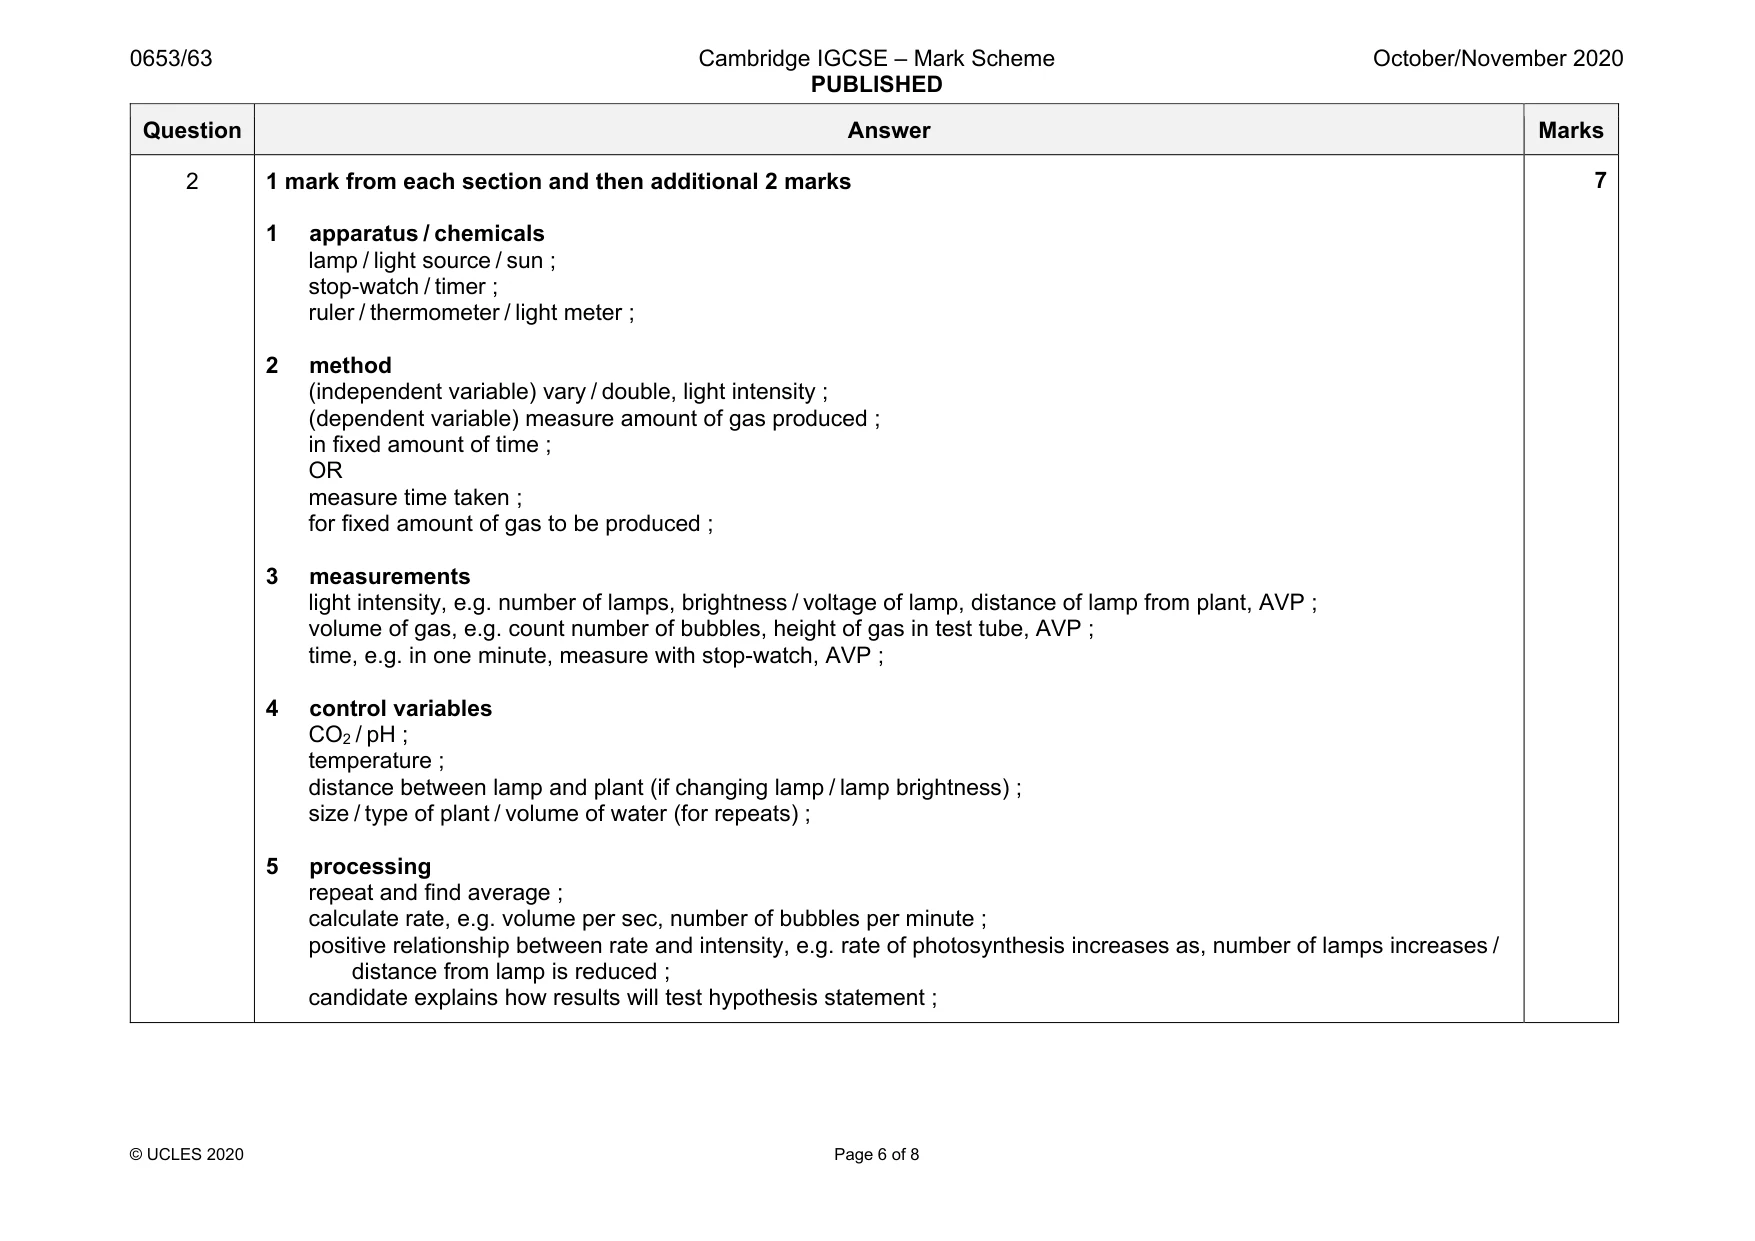
Mark scheme: 2 1 mark from each section and then additional 2 marks 1 apparatus / chemicals lamp / light source / sun ; stop-watch / timer ; ruler / thermometer / light meter ; 2 method (independent variable) vary / double, light intensity ; (dependent variable) measure amount of gas produced ; in fixed amount of time ; OR measure time taken ; for fixed amount of gas to be produced ; 3 measurements light intensity, e.g. number of lamps, brightness / voltage of lamp, distance of lamp from plant, AVP ; volume of gas, e.g. count number of bubbles, height of gas in test tube, AVP ; time, e.g. in one minute, measure with stop-watch, AVP ; 4 control variables CO2 / pH ; temperature ; distance between lamp and plant (if changing lamp / lamp brightness) ; size / type of plant / volume of water (for repeats) ; 5 processing repeat and find average ; calculate rate, e.g. volume per sec, number of bubbles per minute ; positive relationship between rate and intensity, e.g. rate of photosynthesis increases as, number of lamps increases / distance from lamp is reduced ; candidate explains how results will test hypothesis statement ;
Q3 · A student investigates the effect of temperature on the rate of a reaction
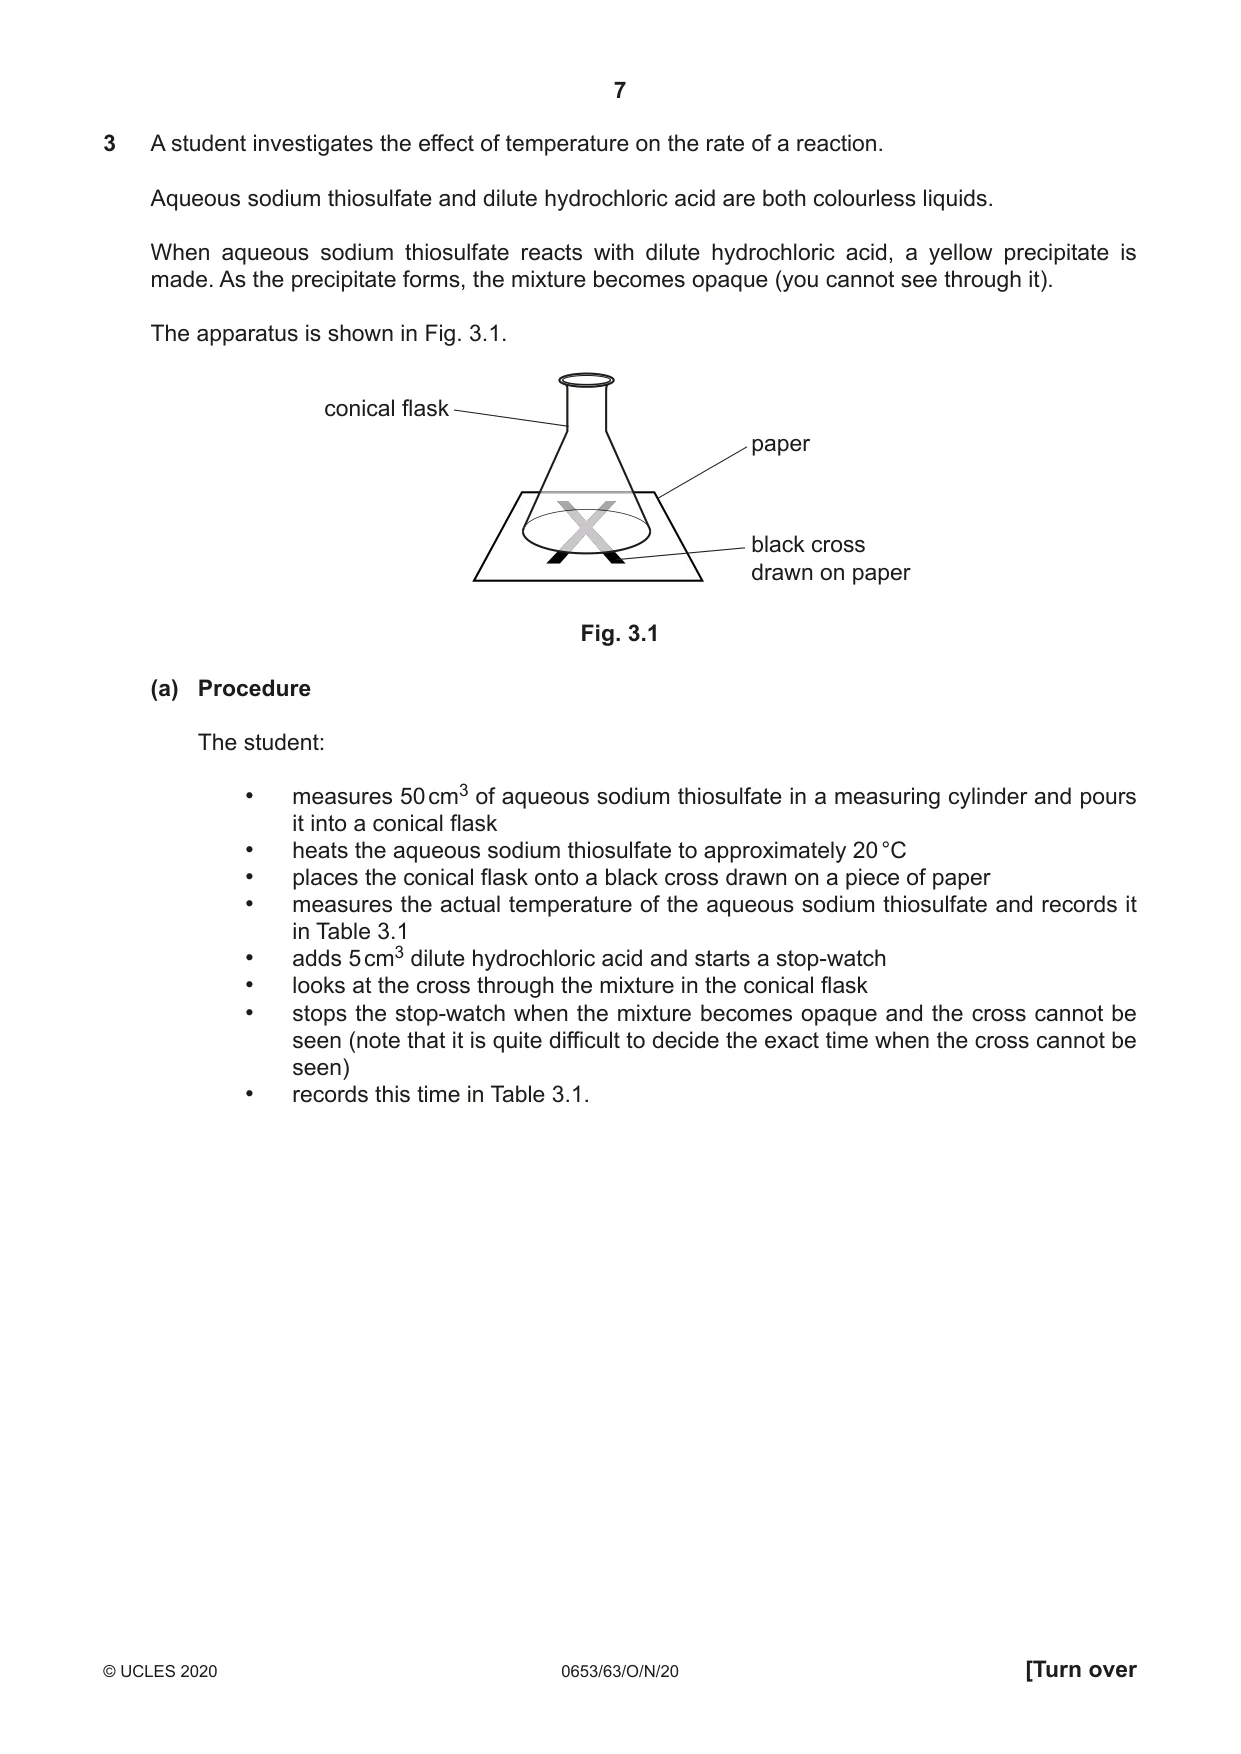
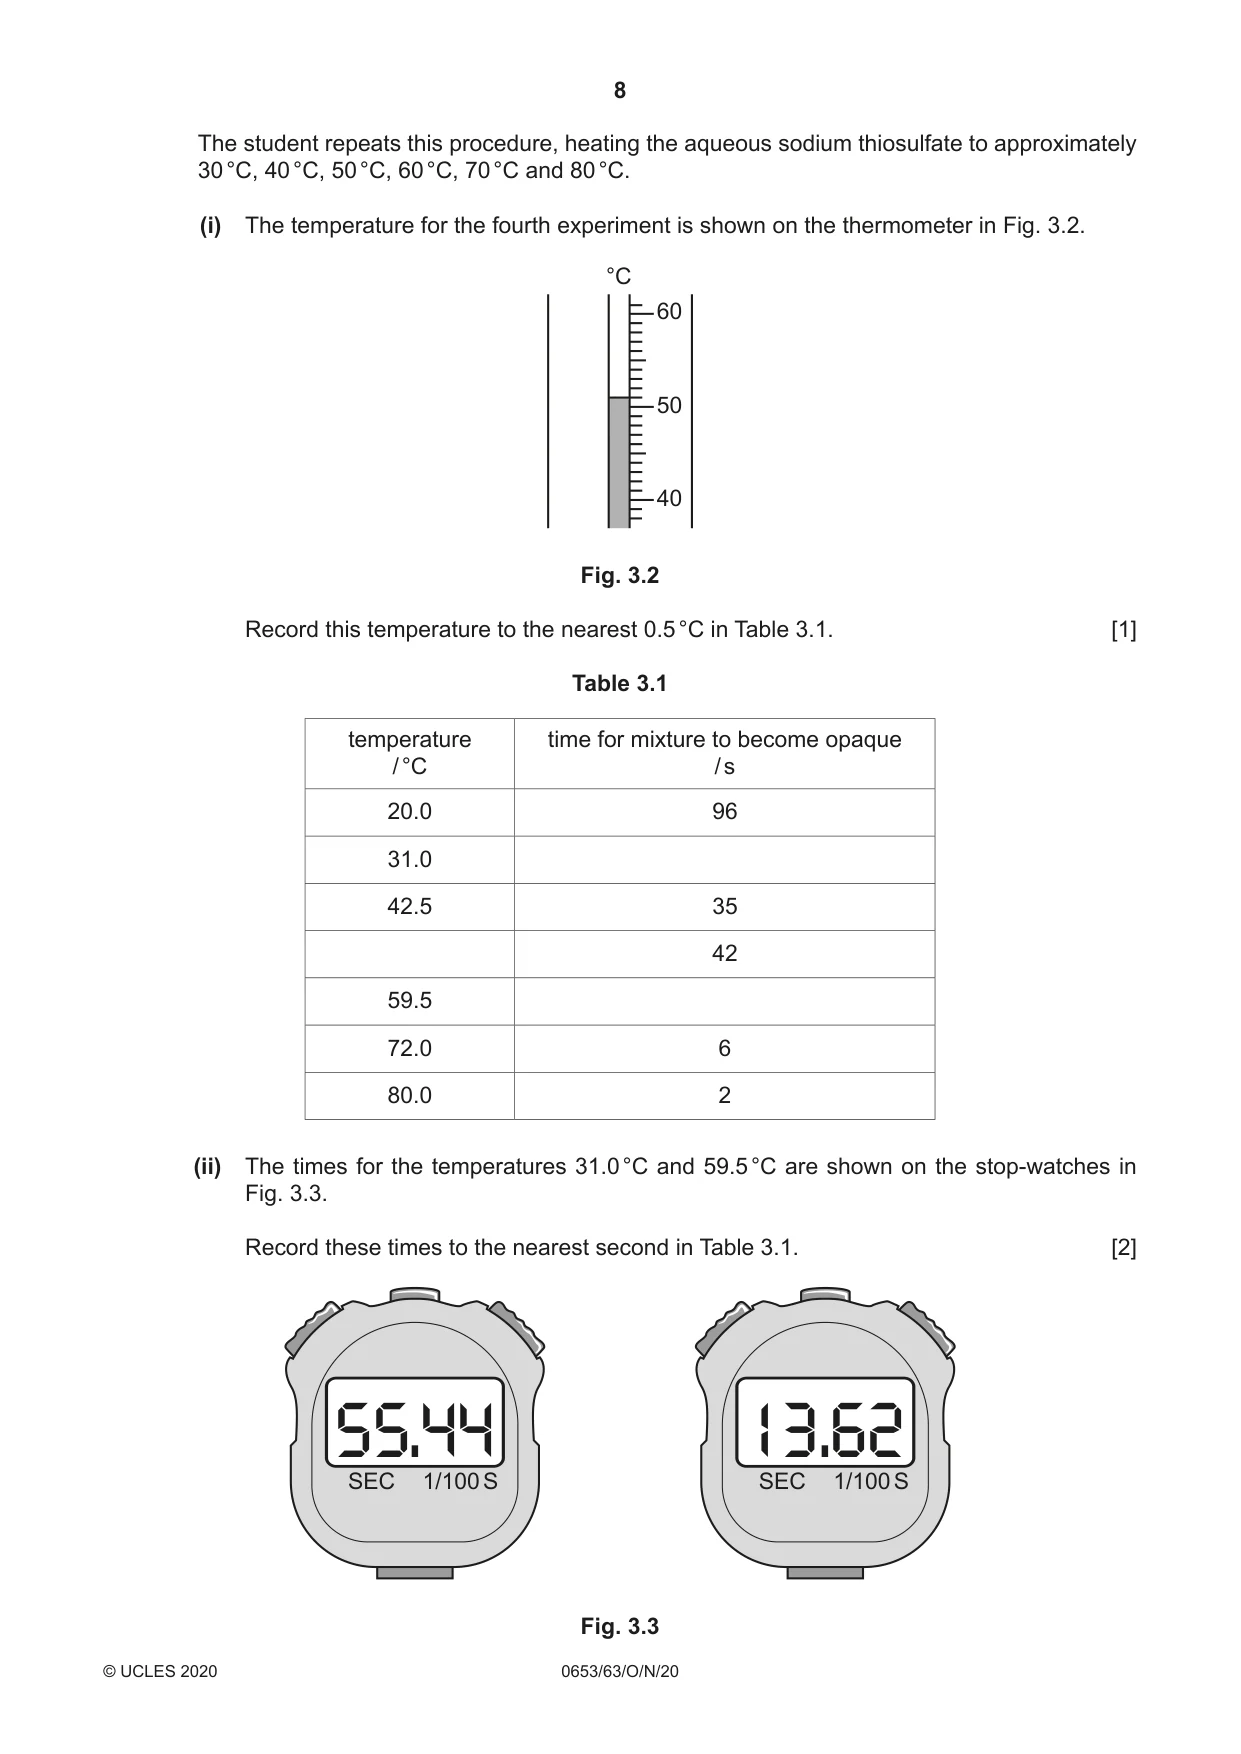
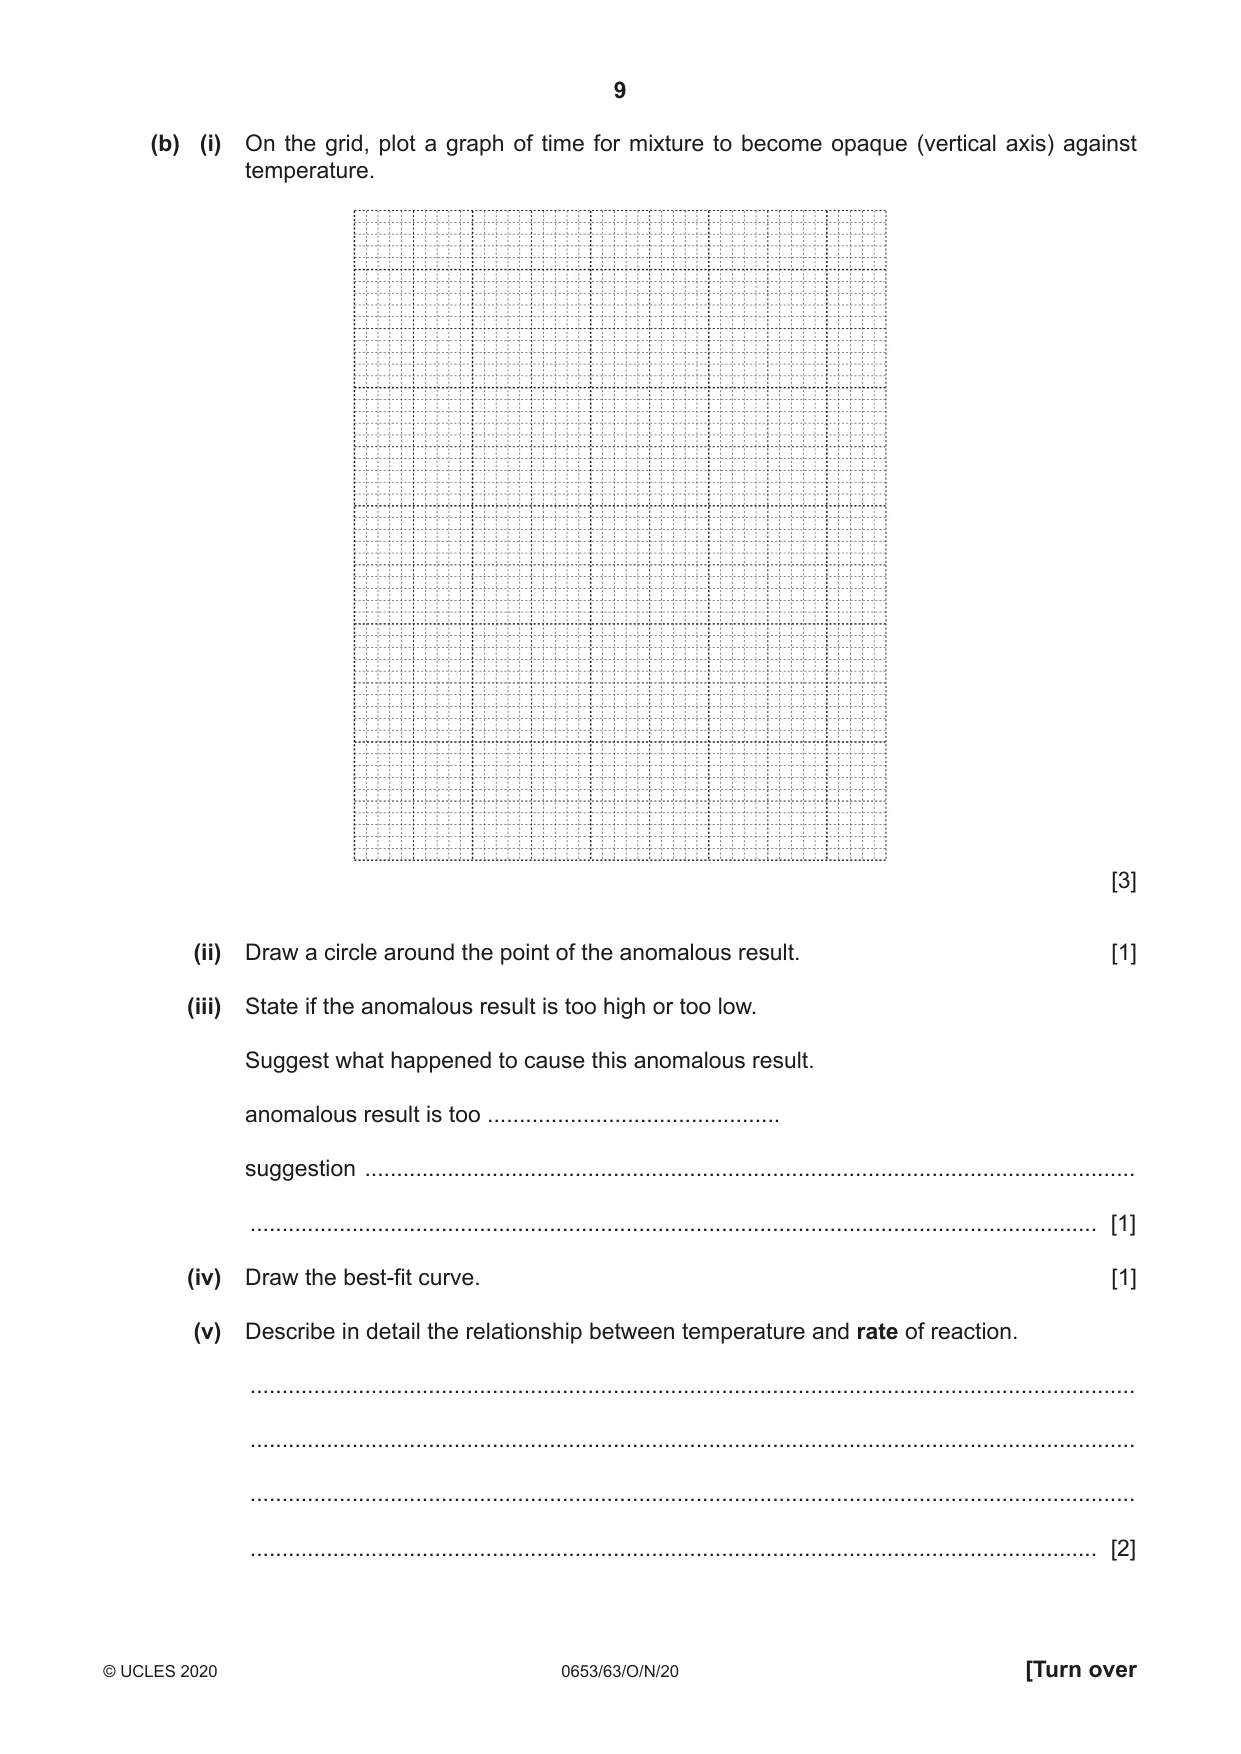
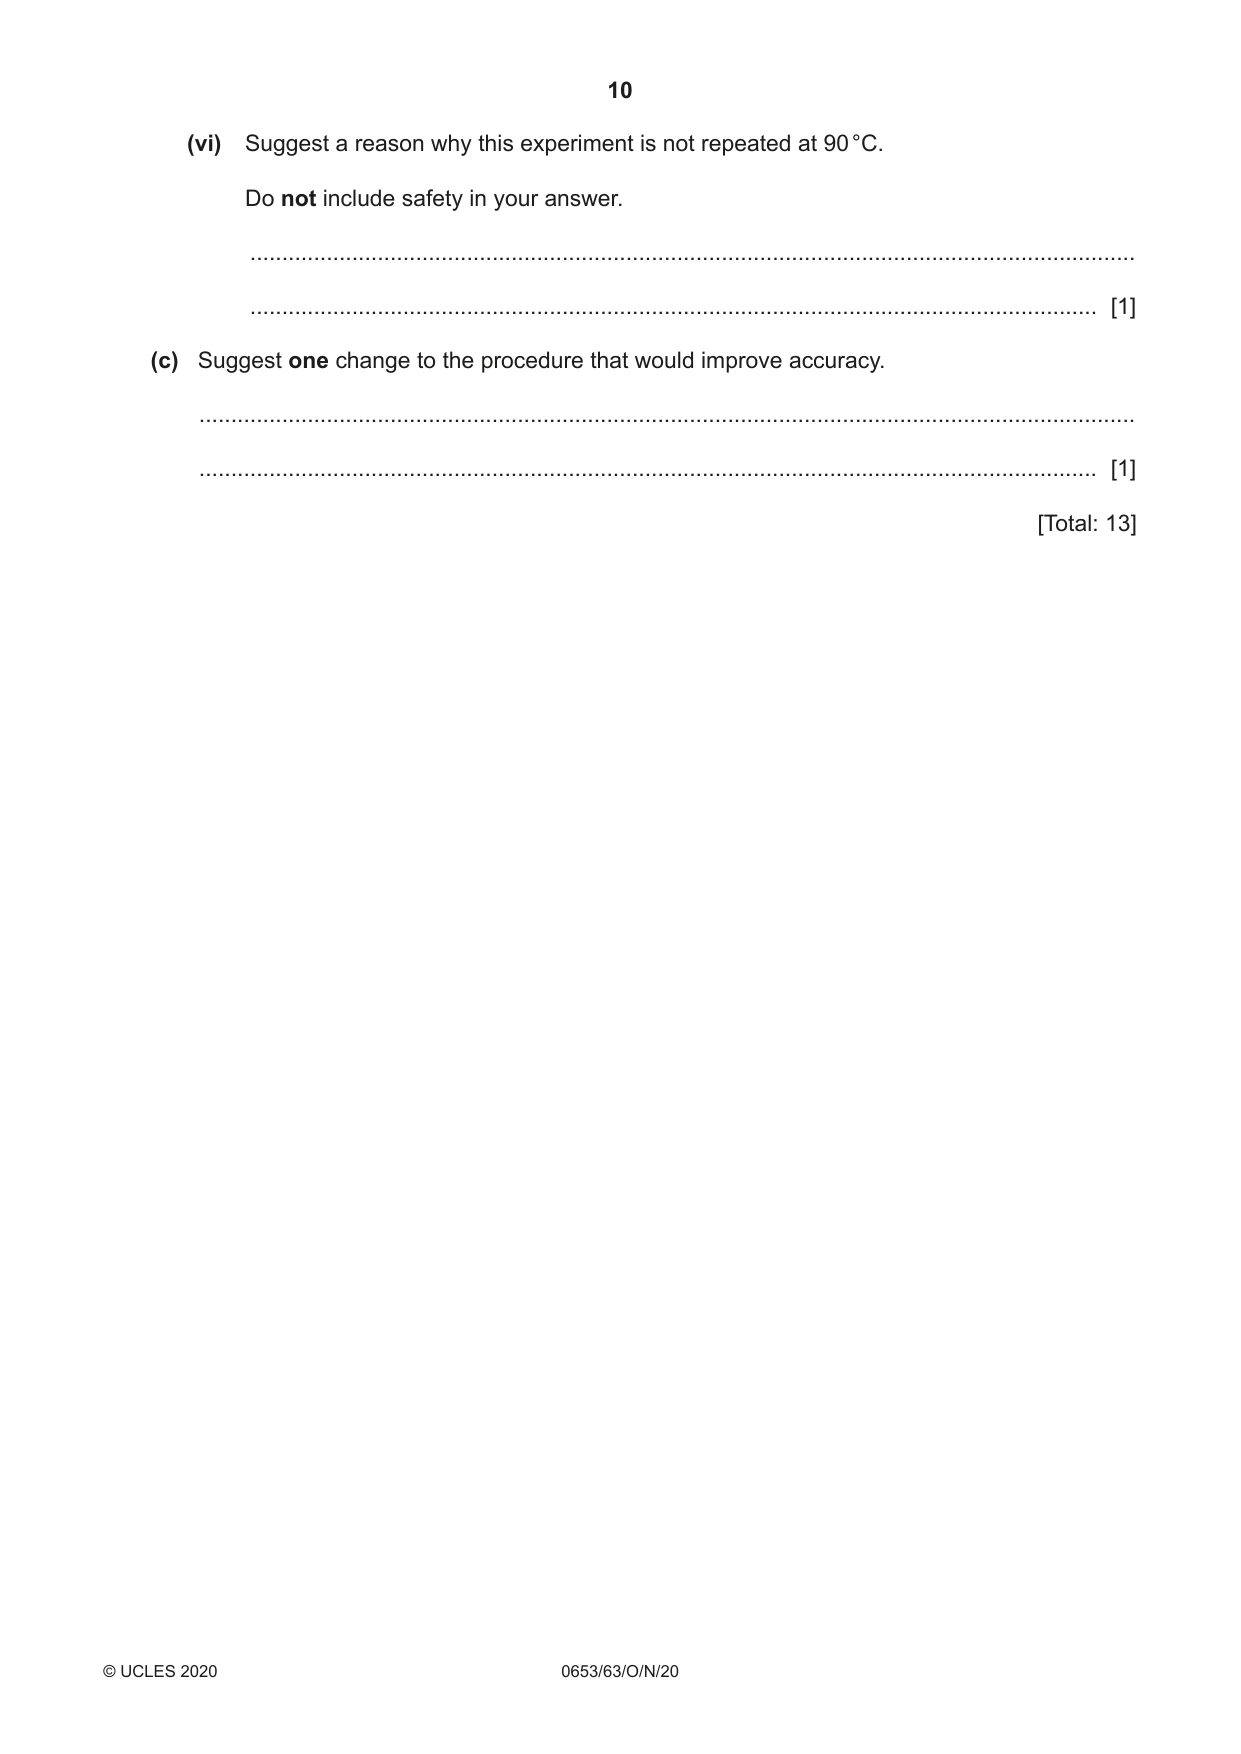
3 A student investigates the effect of temperature on the rate of a reaction. Aqueous sodium thiosulfate and dilute hydrochloric acid are both colourless liquids. When aqueous sodium thiosulfate reacts with dilute hydrochloric acid, a yellow precipitate is made. As the precipitate forms, the mixture becomes opaque (you cannot see through it). The apparatus is shown in Fig. 3.1. conical flask paper black cross drawn on paper Fig. 3.1 (a) Procedure The student: • measures 50 cm3 of aqueous sodium thiosulfate in a measuring cylinder and pours it into a conical flask • heats the aqueous sodium thiosulfate to approximately 20 °C • places the conical flask onto a black cross drawn on a piece of paper • measures the actual temperature of the aqueous sodium thiosulfate and records it in Table 3.1 • adds 5 cm3 dilute hydrochloric acid and starts a stop-watch • looks at the cross through the mixture in the conical flask • stops the stop-watch when the mixture becomes opaque and the cross cannot be seen (note that it is quite difficult to decide the exact time when the cross cannot be seen) • records this time in Table 3.1. The student repeats this procedure, heating the aqueous sodium thiosulfate to approximately 30 °C, 40 °C, 50 °C, 60 °C, 70 °C and 80 °C. (i) The temperature for the fourth experiment is shown on the thermometer in Fig. 3.2. °C 60 50 40 Fig. 3.2 Record this temperature to the nearest 0.5 °C in Table 3.1. [1] Table 3.1 temperature time for mixture to become opaque / °C / s 20.0 96 31.0 42.5 35 42 59.5 72.0 6 80.0 2 (ii) The times for the temperatures 31.0 °C and 59.5 °C are shown on the stop-watches in Fig. 3.3. Record these times to the nearest second in Table 3.1. [2] 55.44 13.62 SEC 1/100 S SEC 1/100 S Fig. 3.3 (b) (i) On the grid, plot a graph of time for mixture to become opaque (vertical axis) against temperature. [3] (ii) Draw a circle around the point of the anomalous result. [1] (iii) State if the anomalous result is too high or too low. Suggest what happened to cause this anomalous result. anomalous result is too .............................................. suggestion ......................................................................................................................... ..................................................................................................................................... [1] (iv) Draw the best-fit curve. [1] (v) Describe in detail the relationship between temperature and rate of reaction. ........................................................................................................................................... ........................................................................................................................................... ........................................................................................................................................... ..................................................................................................................................... [2] (vi) Suggest a reason why this experiment is not repeated at 90 °C. Do not include safety in your answer. ........................................................................................................................................... ..................................................................................................................................... [1] (c) Suggest one change to the procedure that would improve accuracy. ................................................................................................................................................... ............................................................................................................................................. [1] [Total: 13]
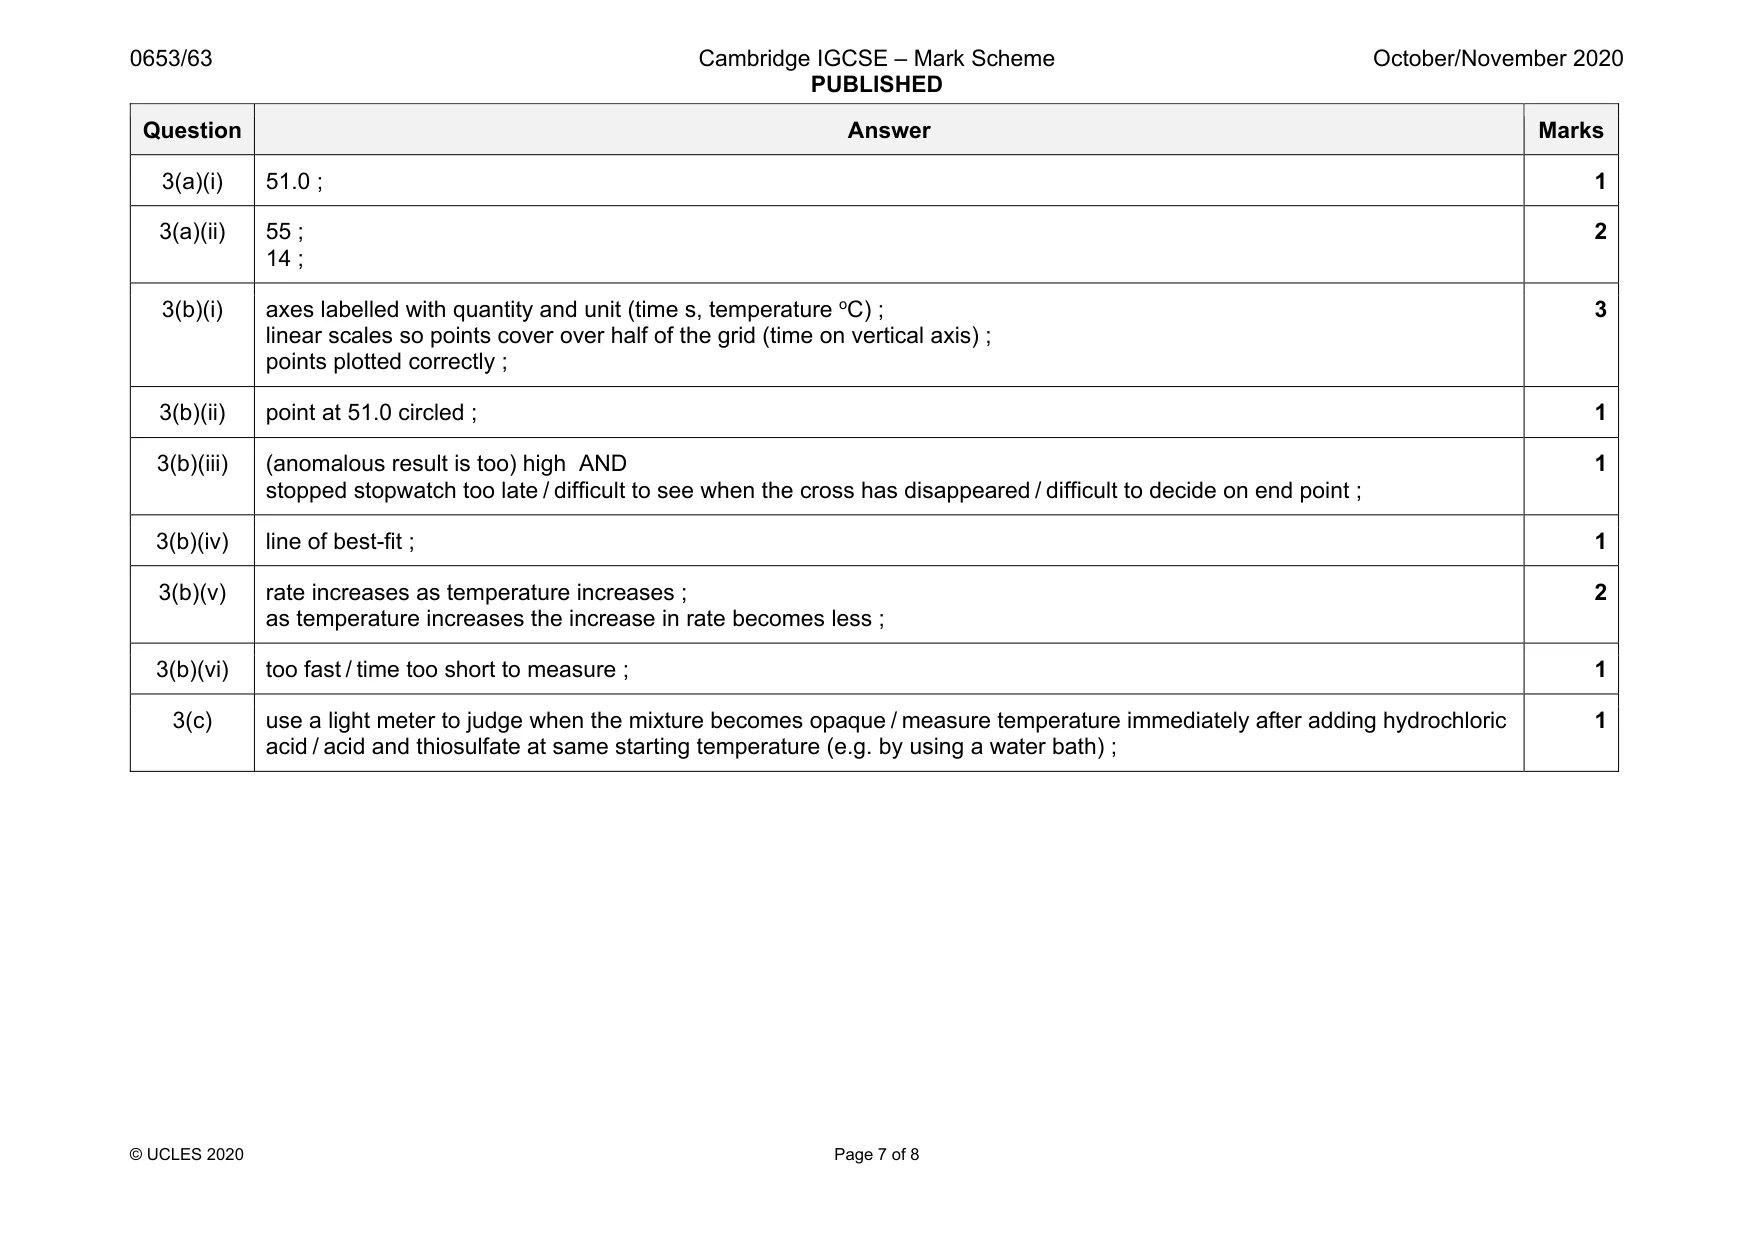
Mark scheme: 3(a)(i) 51.0 ; 1 3(a)(ii) 55 ; 14 ; 2 3(b)(i) axes labelled with quantity and unit (time s, temperature oC) ; linear scales so points cover over half of the grid (time on vertical axis) ; points plotted correctly ; 3 3(b)(ii) point at 51.0 circled ; 1 3(b)(iii) (anomalous result is too) high AND stopped stopwatch too late / difficult to see when the cross has disappeared / difficult to decide on end point ; 1 3(b)(iv) line of best-fit ; 1 3(b)(v) rate increases as temperature increases ; as temperature increases the increase in rate becomes less ; 2 3(b)(vi) too fast / time too short to measure ; 1 3(c) use a light meter to judge when the mixture becomes opaque / measure temperature immediately after adding hydrochloric acid / acid and thiosulfate at same starting temperature (e.g. by using a water bath) ; 1
Q4 · A student compares the temperature changes that occur when three different liquids A, B…
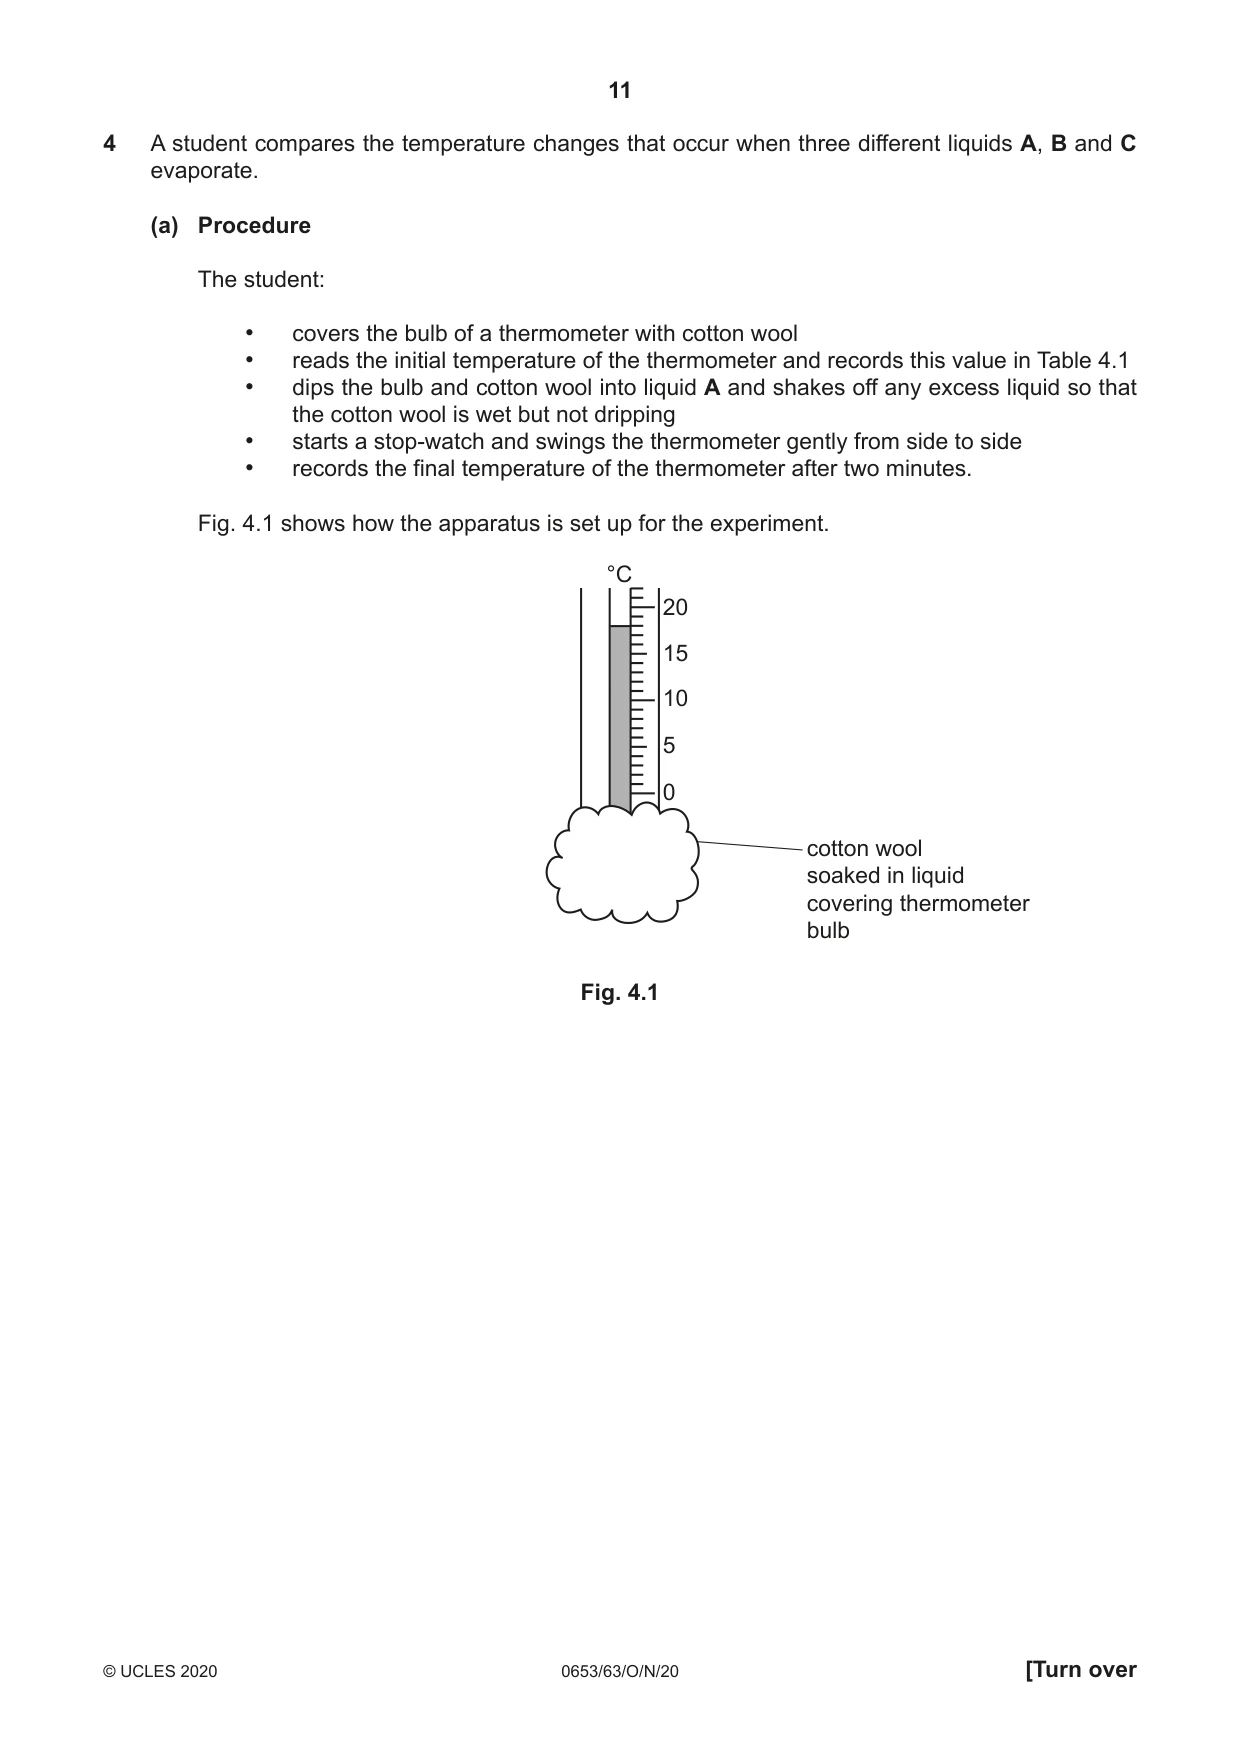
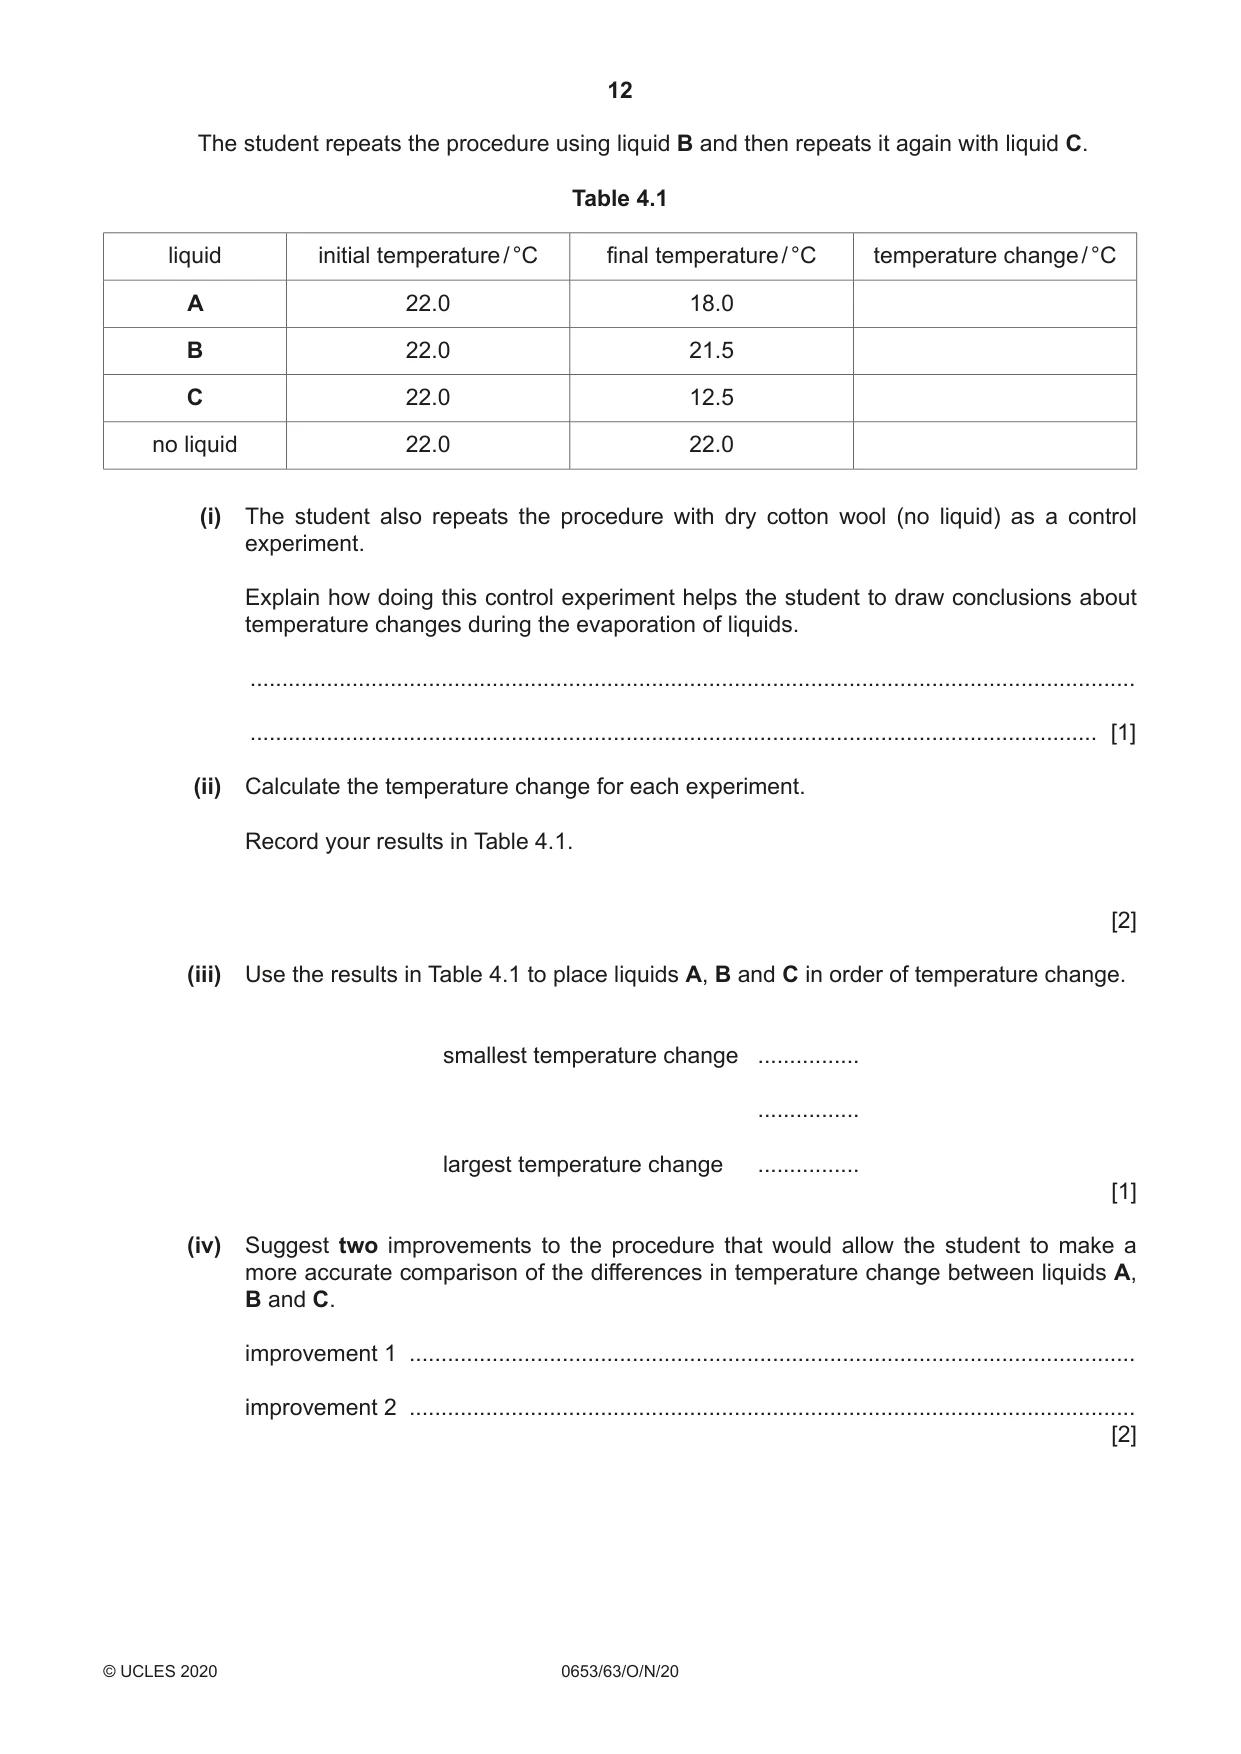
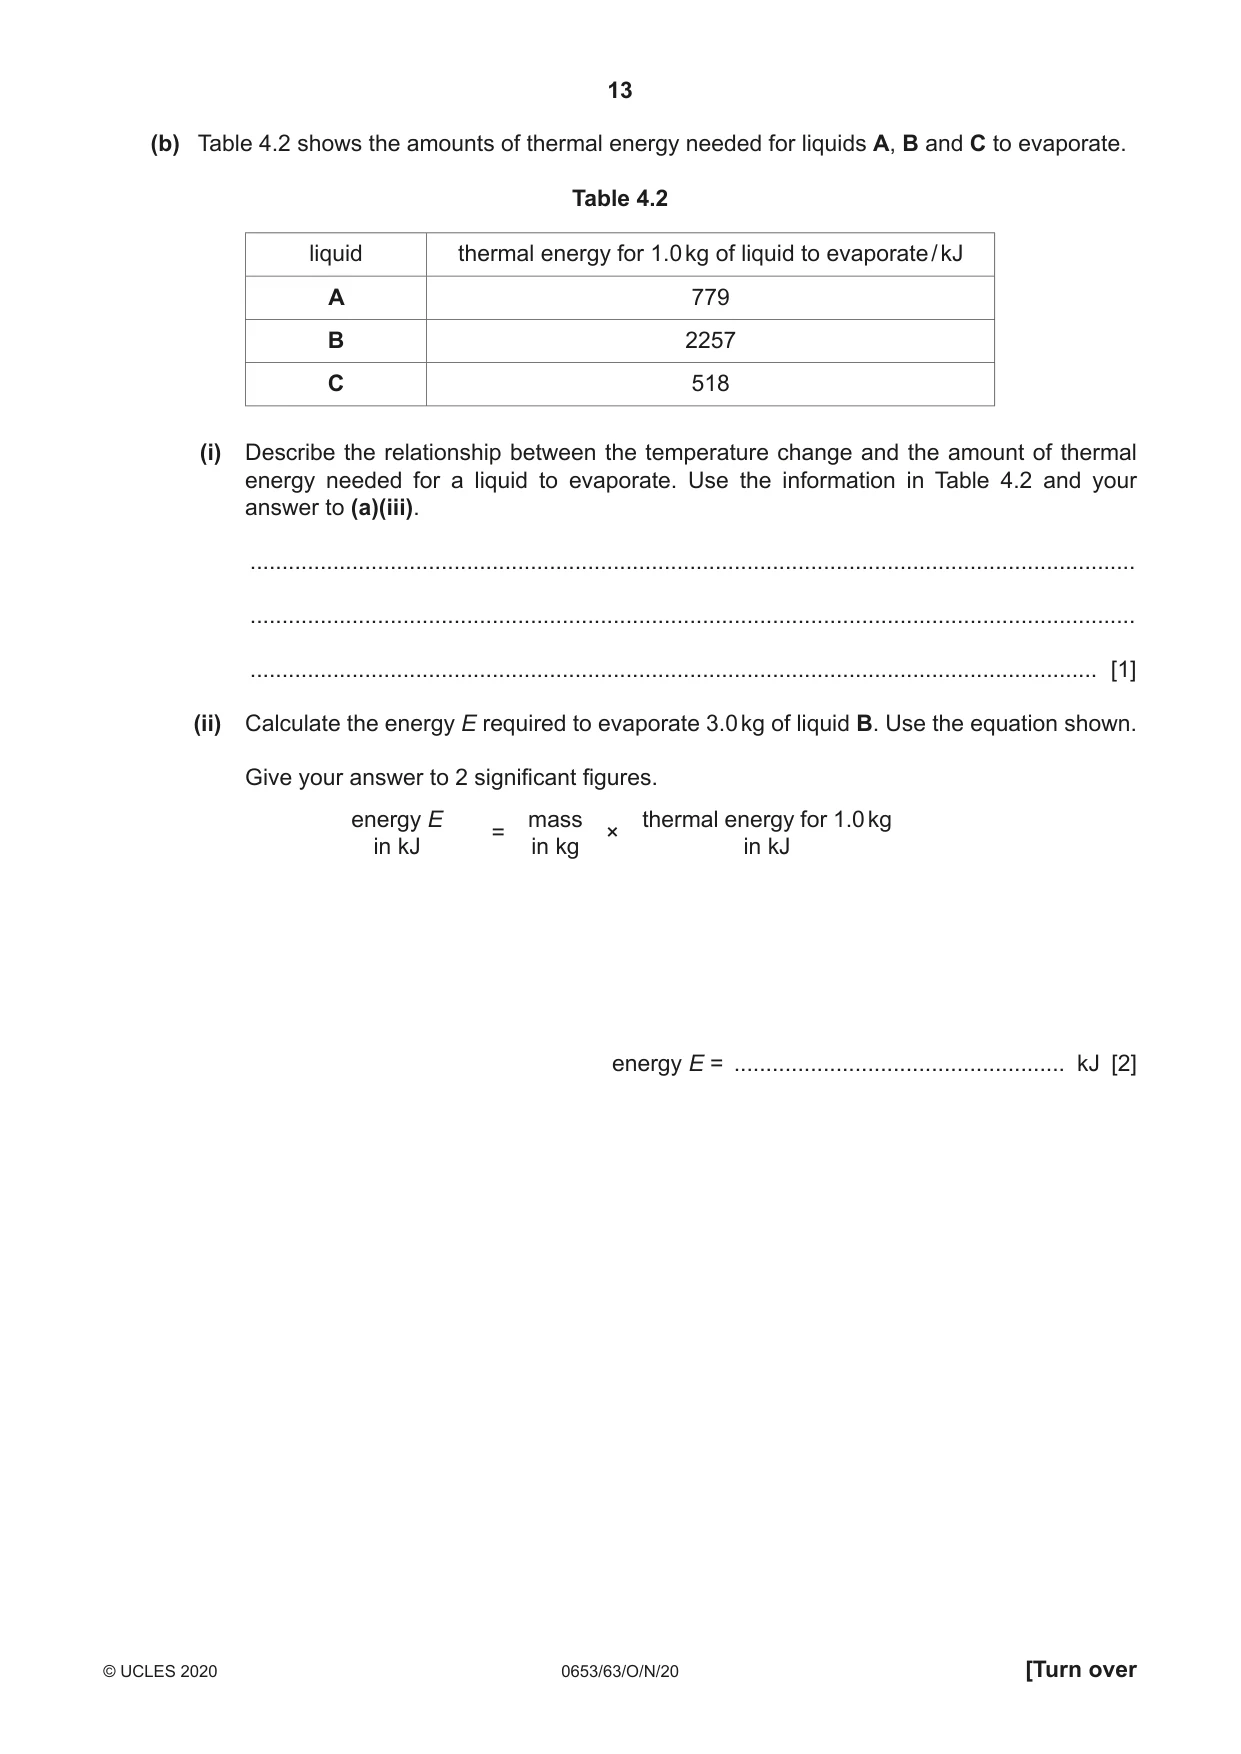
4 A student compares the temperature changes that occur when three different liquids A, B and C evaporate. (a) Procedure The student: • covers the bulb of a thermometer with cotton wool • reads the initial temperature of the thermometer and records this value in Table 4.1 • dips the bulb and cotton wool into liquid A and shakes off any excess liquid so that the cotton wool is wet but not dripping • starts a stop-watch and swings the thermometer gently from side to side • records the final temperature of the thermometer after two minutes. Fig. 4.1 shows how the apparatus is set up for the experiment. °C 20 15 10 5 0 cotton wool soaked in liquid covering thermometer bulb Fig. 4.1 The student repeats the procedure using liquid B and then repeats it again with liquid C. Table 4.1 liquid initial temperature / °C final temperature / °C temperature change / °C A 22.0 18.0 B 22.0 21.5 C 22.0 12.5 no liquid 22.0 22.0 (i) The student also repeats the procedure with dry cotton wool (no liquid) as a control experiment. Explain how doing this control experiment helps the student to draw conclusions about temperature changes during the evaporation of liquids. ........................................................................................................................................... ..................................................................................................................................... [1] (ii) Calculate the temperature change for each experiment. Record your results in Table 4.1. [2] (iii) Use the results in Table 4.1 to place liquids A, B and C in order of temperature change. smallest temperature change ................ ................ largest temperature change ................ [1] (iv) Suggest two improvements to the procedure that would allow the student to make a more accurate comparison of the differences in temperature change between liquids A, B and C. improvement 1 .................................................................................................................. improvement 2 .................................................................................................................. [2] (b) Table 4.2 shows the amounts of thermal energy needed for liquids A, B and C to evaporate. Table 4.2 liquid thermal energy for 1.0 kg of liquid to evaporate / kJ A 779 B 2257 C 518 (i) Describe the relationship between the temperature change and the amount of thermal energy needed for a liquid to evaporate. Use the information in Table 4.2 and your answer to (a)(iii). ........................................................................................................................................... ........................................................................................................................................... ..................................................................................................................................... [1] (ii) Calculate the energy E required to evaporate 3.0 kg of liquid B. Use the equation shown. Give your answer to 2 significant figures. energy E mass thermal energy for 1.0 kg = × in kJ in kg in kJ energy E = .................................................... kJ [2]
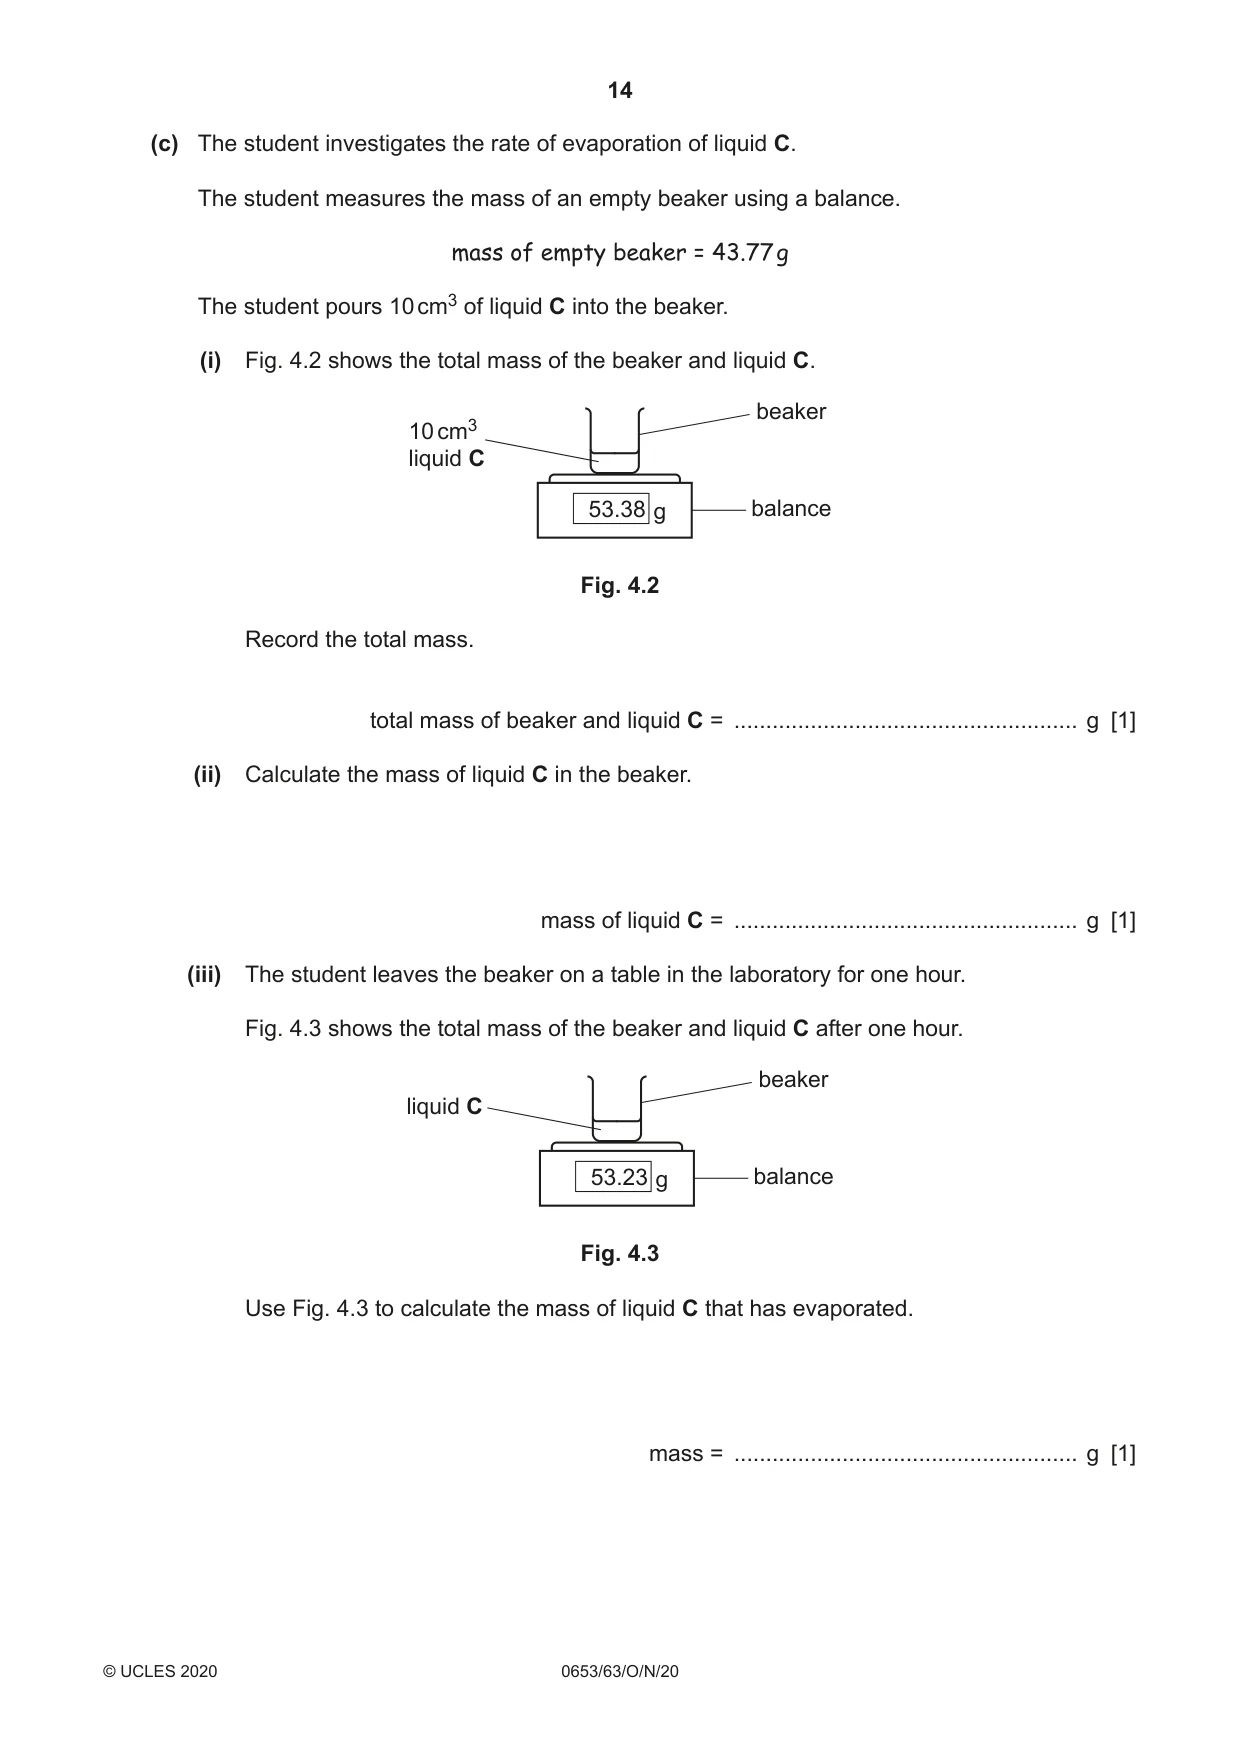
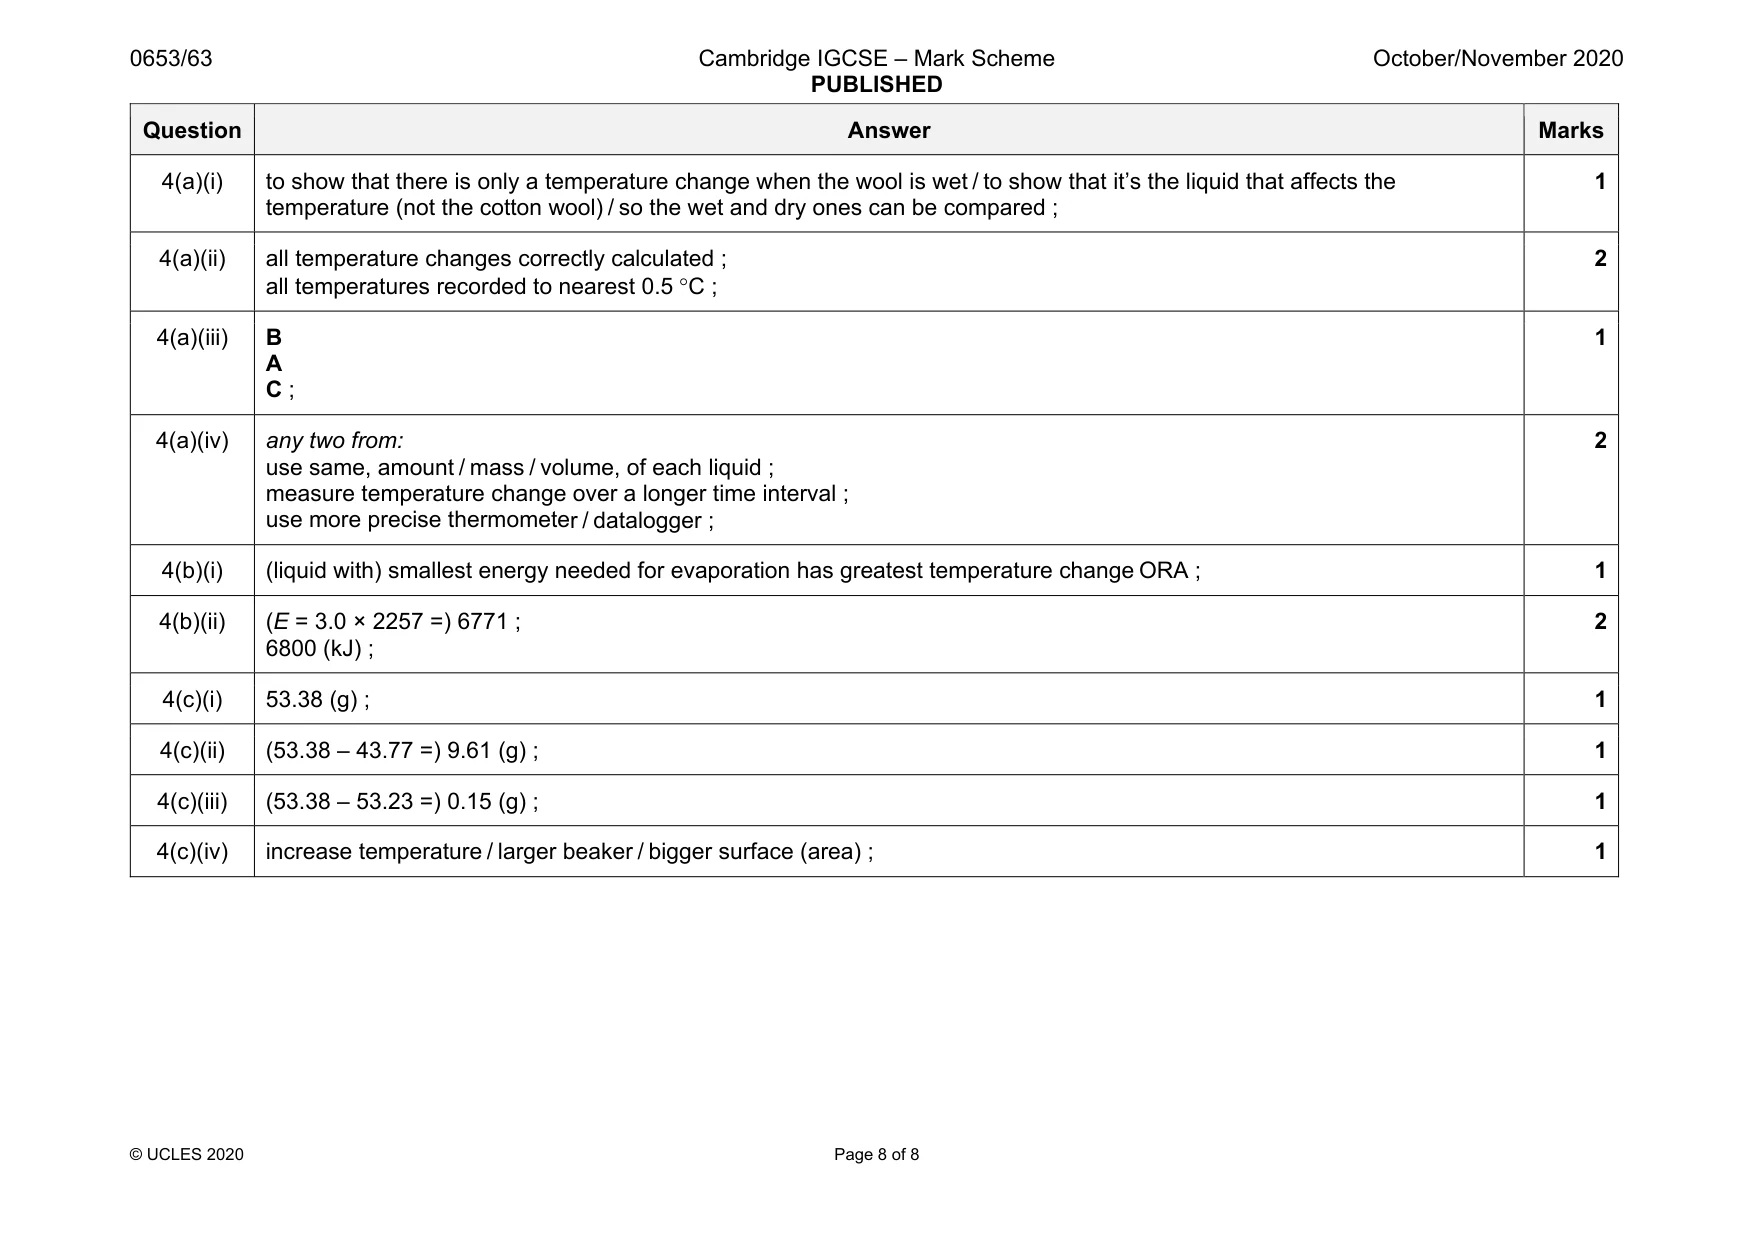
Mark scheme: 4(a)(i) to show that there is only a temperature change when the wool is wet / to show that it’s the liquid that affects the temperature (not the cotton wool) / so the wet and dry ones can be compared ; 1 4(a)(ii) all temperature changes correctly calculated ; all temperatures recorded to nearest 0.5 °C ; 2 4(a)(iii) B A C ; 1 4(a)(iv) any two from: use same, amount / mass / volume, of each liquid ; measure temperature change over a longer time interval ; use more precise thermometer / datalogger ; 2 4(b)(i) (liquid with) smallest energy needed for evaporation has greatest temperature change ORA ; 1 4(b)(ii) (E = 3.0 × 2257 =) 6771 ; 6800 (kJ) ; 2 4(c)(i) 53.38 (g) ; 1 4(c)(ii) (53.38 – 43.77 =) 9.61 (g) ; 1 4(c)(iii) (53.38 – 53.23 =) 0.15 (g) ; 1 4(c)(iv) increase temperature / larger beaker / bigger surface (area) ; 1
What was in this paper
The subtopics covered by these 4 questions, and how many questions each got. Open one in a new tab to see every Cambridge question on it.
What you needed in this session
Cambridge’s own grade thresholds for 2020 Oct/Nov, Paper 6 · Variant 3. A higher threshold means an easier paper — the bar moves with how the cohort did.