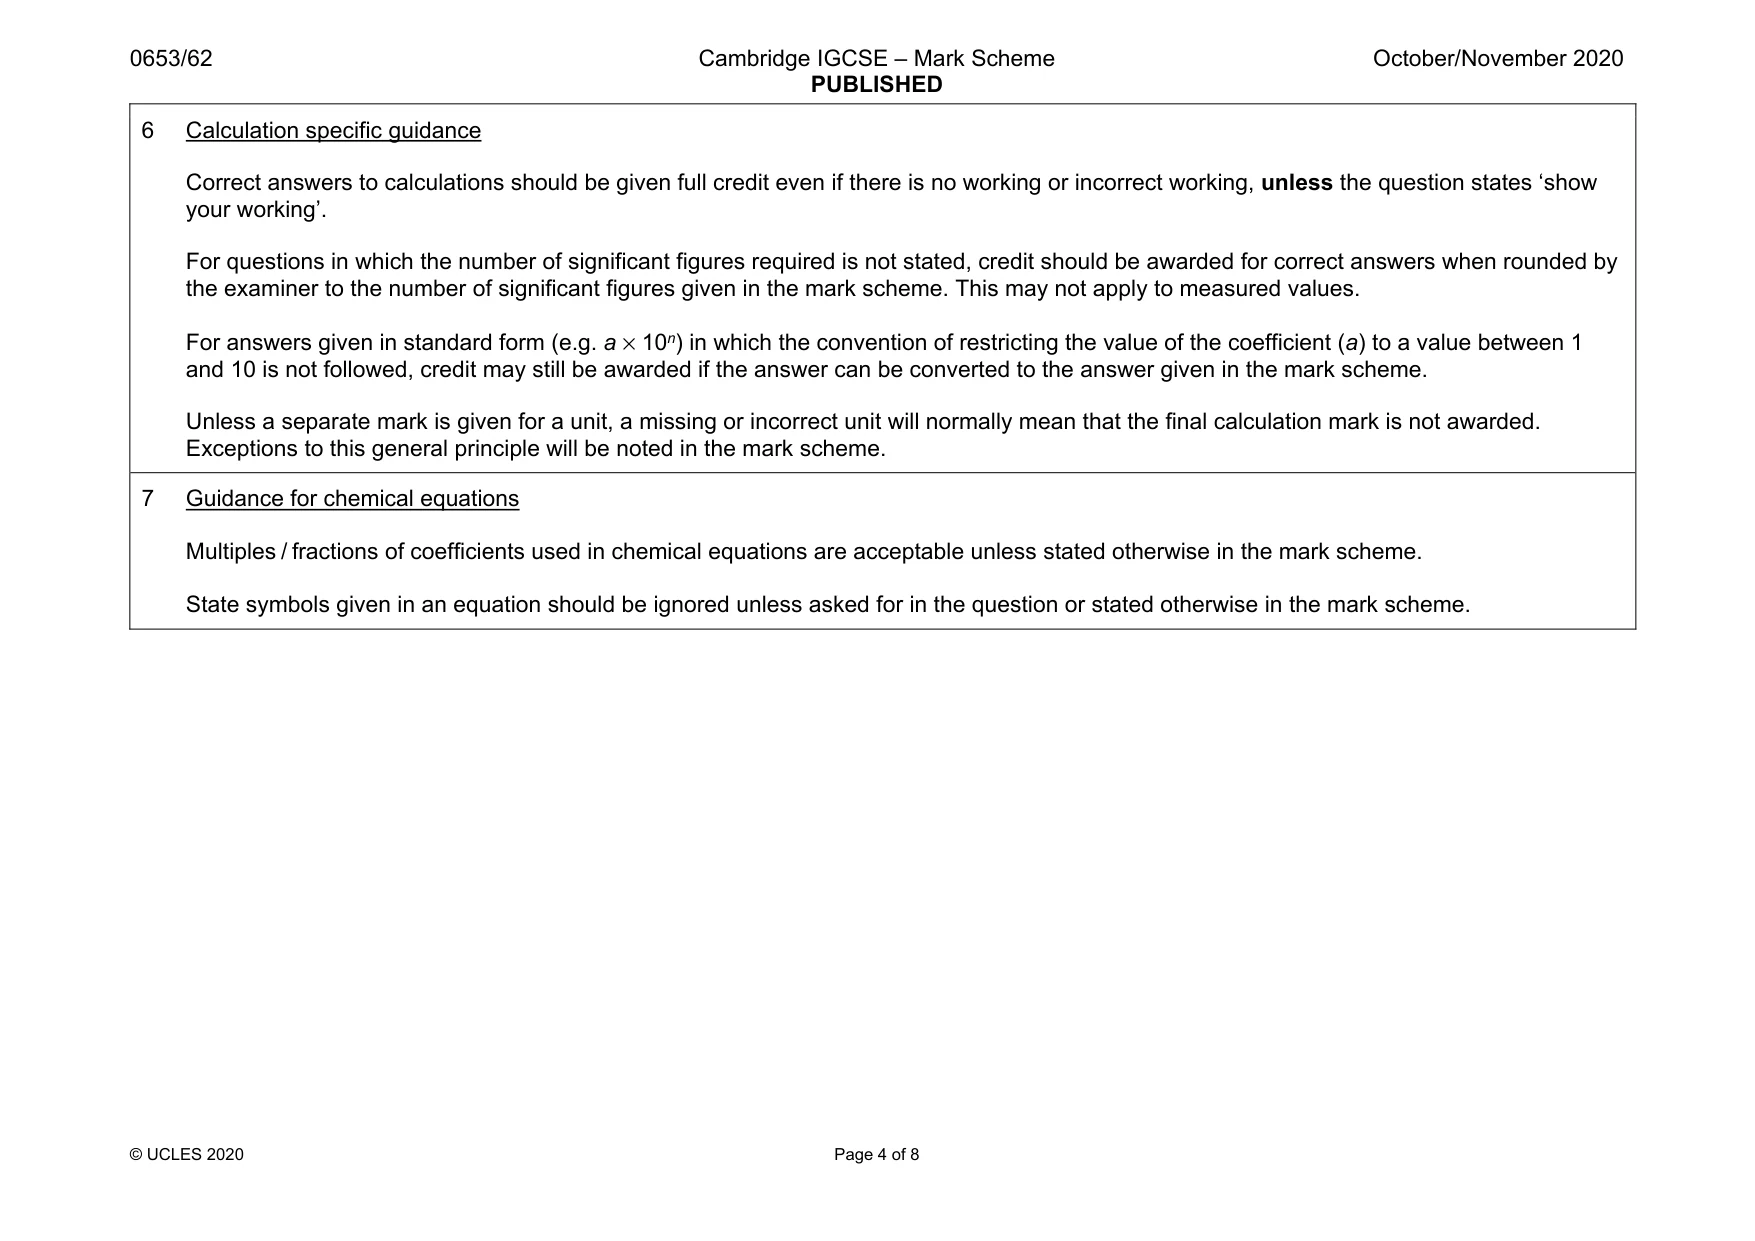
Cambridge IGCSE Science - Combined 0653 — 2020 Oct/Nov Paper 6 · Variant 2
0653/62/O/N/20 · 4 questions · 40 marks · ≈45 min
The question paper and its mark scheme, free to read here and free to download. This is Cambridge’s own paper, exactly as it was sat.
Question paper16 pages



Mark scheme8 pages
Answers below. Sit the paper first if you are practising.
Questions as text
Q1 · Diatoms are single-celled organisms that live in water
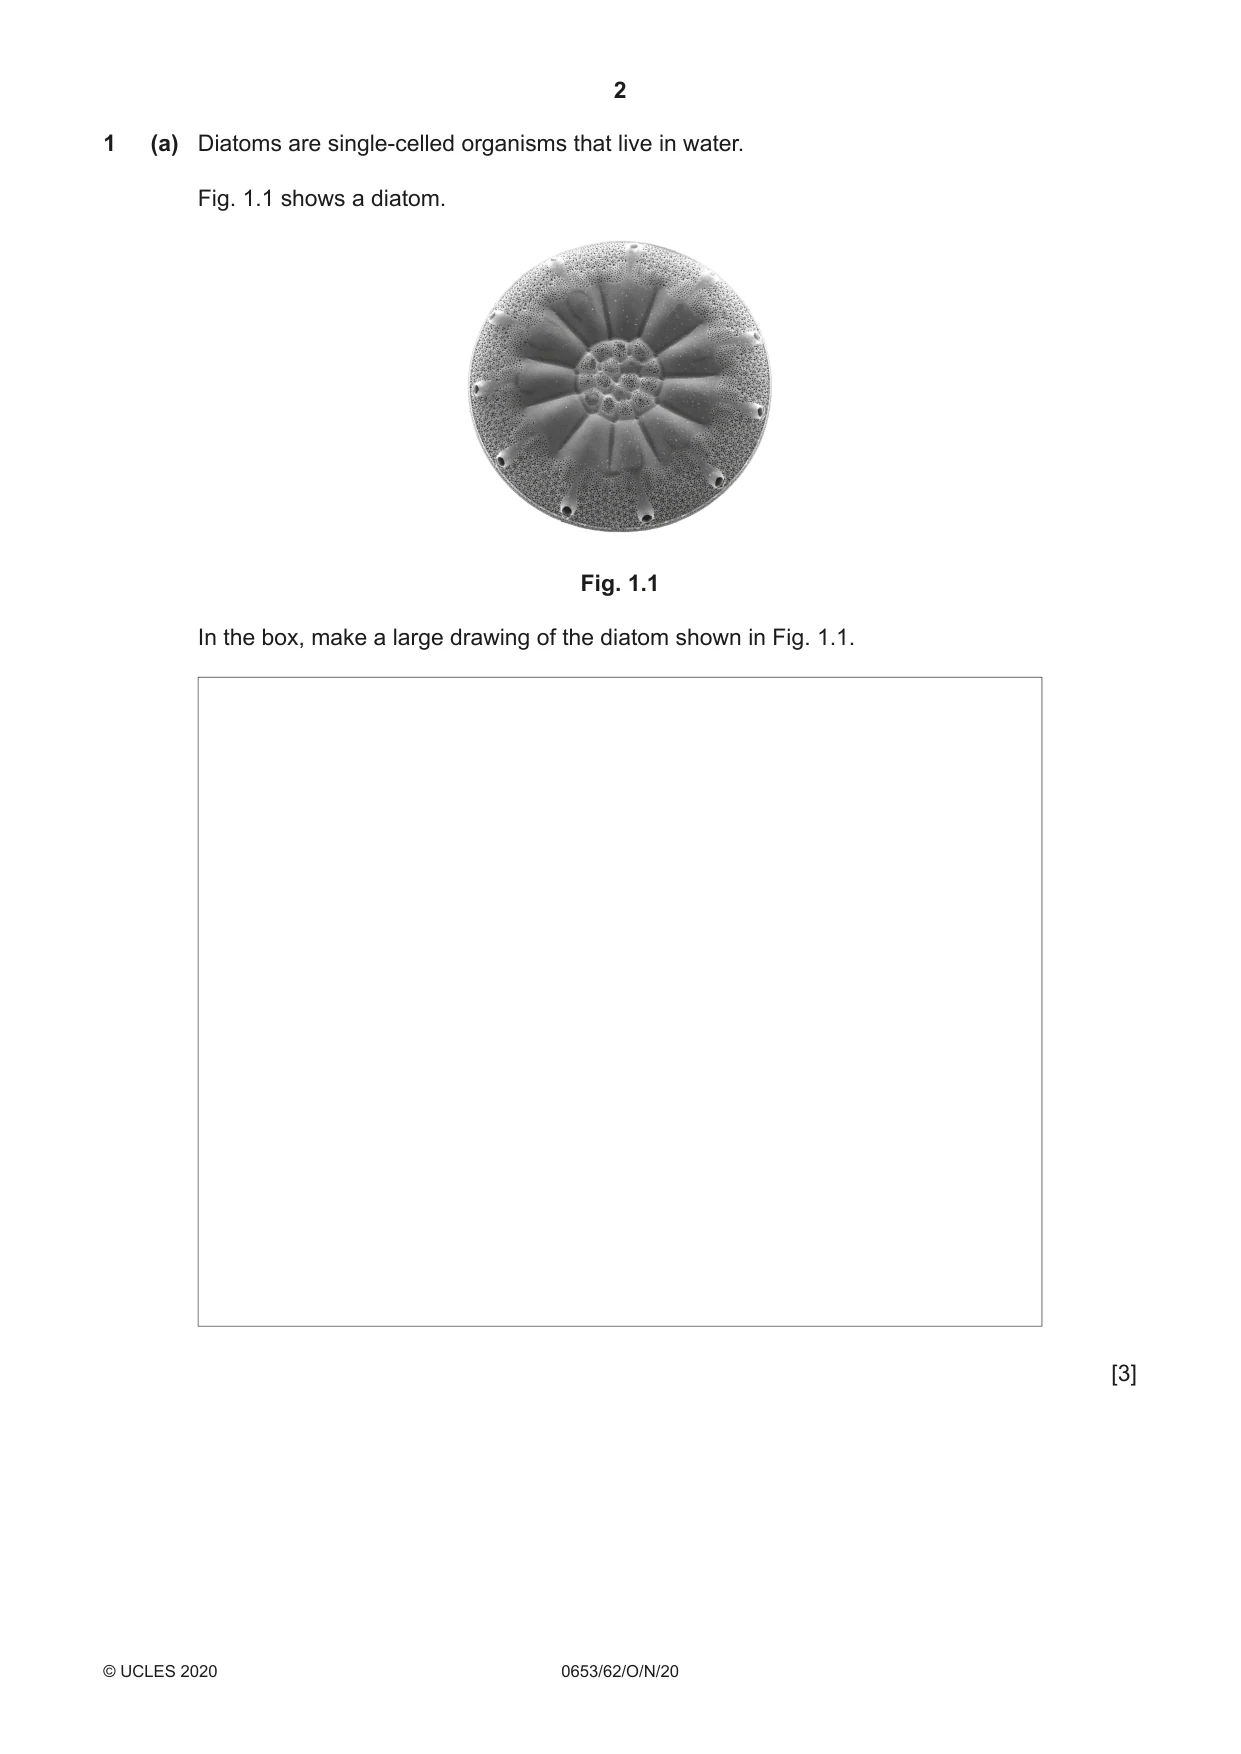
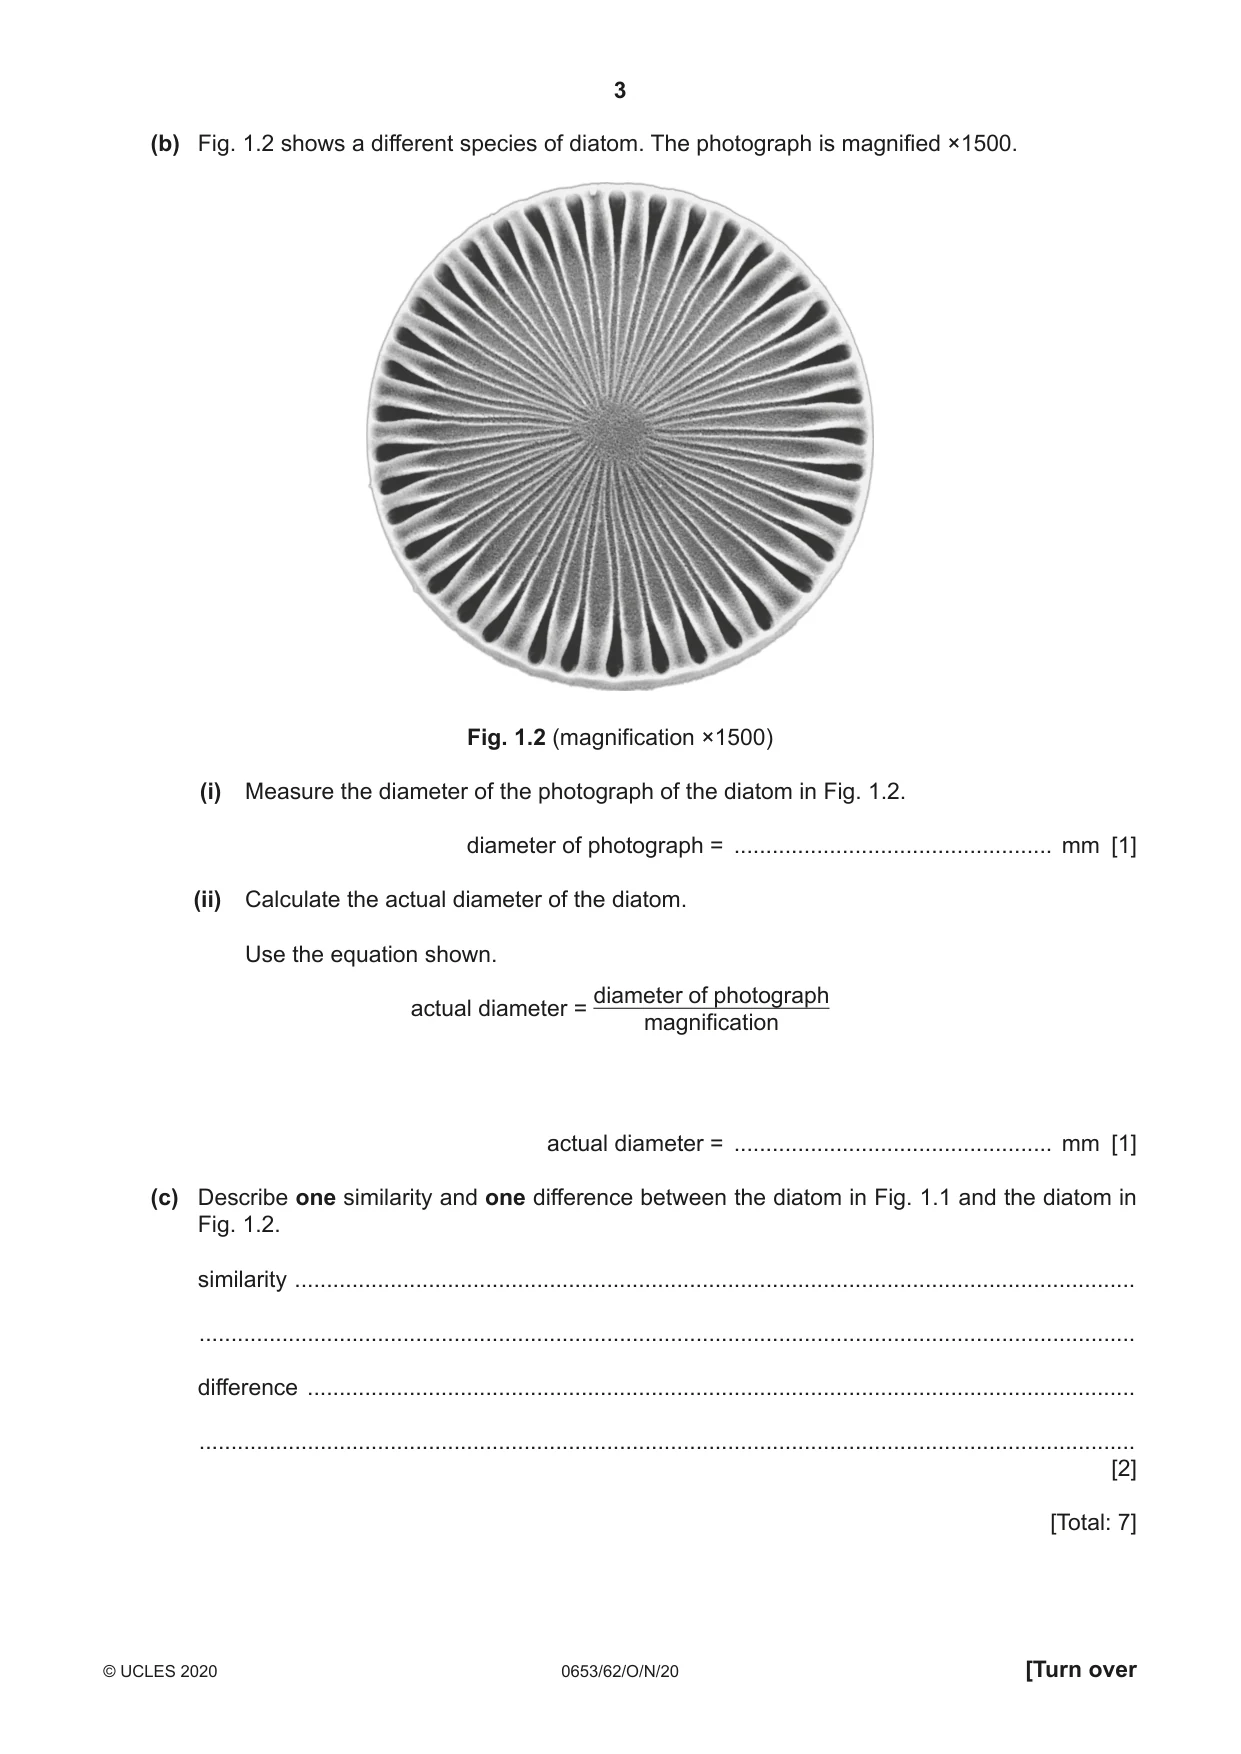
1 (a) Diatoms are single-celled organisms that live in water. Fig. 1.1 shows a diatom. Fig. 1.1 In the box, make a large drawing of the diatom shown in Fig. 1.1. [3] (b) Fig. 1.2 shows a different species of diatom. The photograph is magnified ×1500. Fig. 1.2 (magnification ×1500) (i) Measure the diameter of the photograph of the diatom in Fig. 1.2. diameter of photograph = .................................................. mm [1] (ii) Calculate the actual diameter of the diatom. Use the equation shown. diameter of photograph actual diameter = magnification actual diameter = .................................................. mm [1] (c) Describe one similarity and one difference between the diatom in Fig. 1.1 and the diatom in Fig. 1.2. similarity .................................................................................................................................... ................................................................................................................................................... difference .................................................................................................................................. ................................................................................................................................................... [2] [Total: 7]
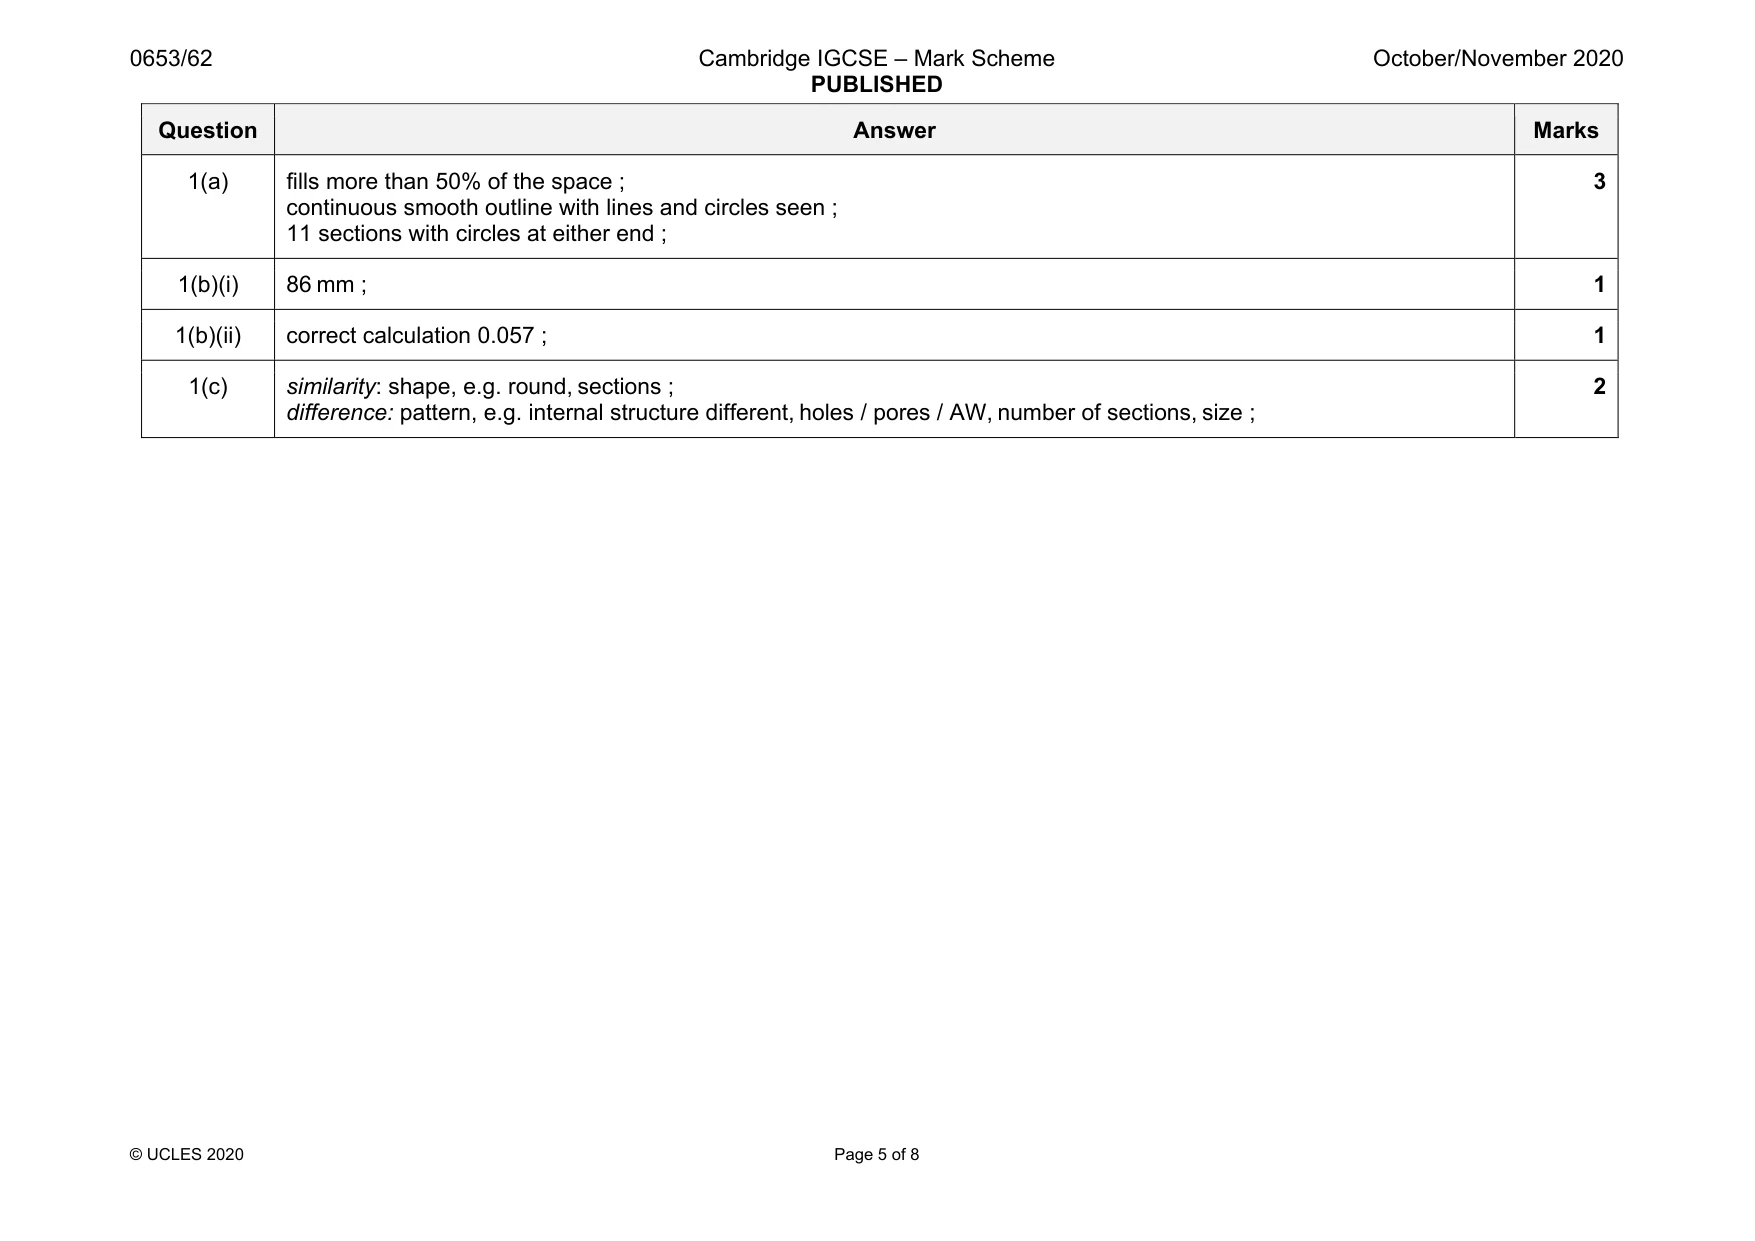
Mark scheme: 1(a) fills more than 50% of the space ; continuous smooth outline with lines and circles seen ; 11 sections with circles at either end ; 3 1(b)(i) 86 mm ; 1 1(b)(ii) correct calculation 0.057 ; 1 1(c) similarity: shape, e.g. round, sections ; difference: pattern, e.g. internal structure different, holes / pores / AW, number of sections, size ; 2
Q2 · A student wants to investigate two plant tissues to identify which plant tissue loses the…
2 A student wants to investigate two plant tissues to identify which plant tissue loses the most water when placed in aqueous concentrated salt solution. The student is provided with a potato, a carrot and aqueous concentrated salt solution. Plan an investigation to compare the loss of water in pieces of potato and carrot placed in aqueous concentrated salt solution. In your answer, include: • the apparatus you will need, including a labelled diagram if you wish • a brief description of the method and the measurements you will make • the variables you will control • how you will process and use the results to draw a conclusion. .......................................................................................................................................................... .......................................................................................................................................................... .......................................................................................................................................................... .......................................................................................................................................................... .......................................................................................................................................................... .......................................................................................................................................................... .......................................................................................................................................................... .......................................................................................................................................................... .......................................................................................................................................................... .......................................................................................................................................................... .......................................................................................................................................................... .......................................................................................................................................................... .......................................................................................................................................................... .......................................................................................................................................................... .................................................................................................................................................... [7]
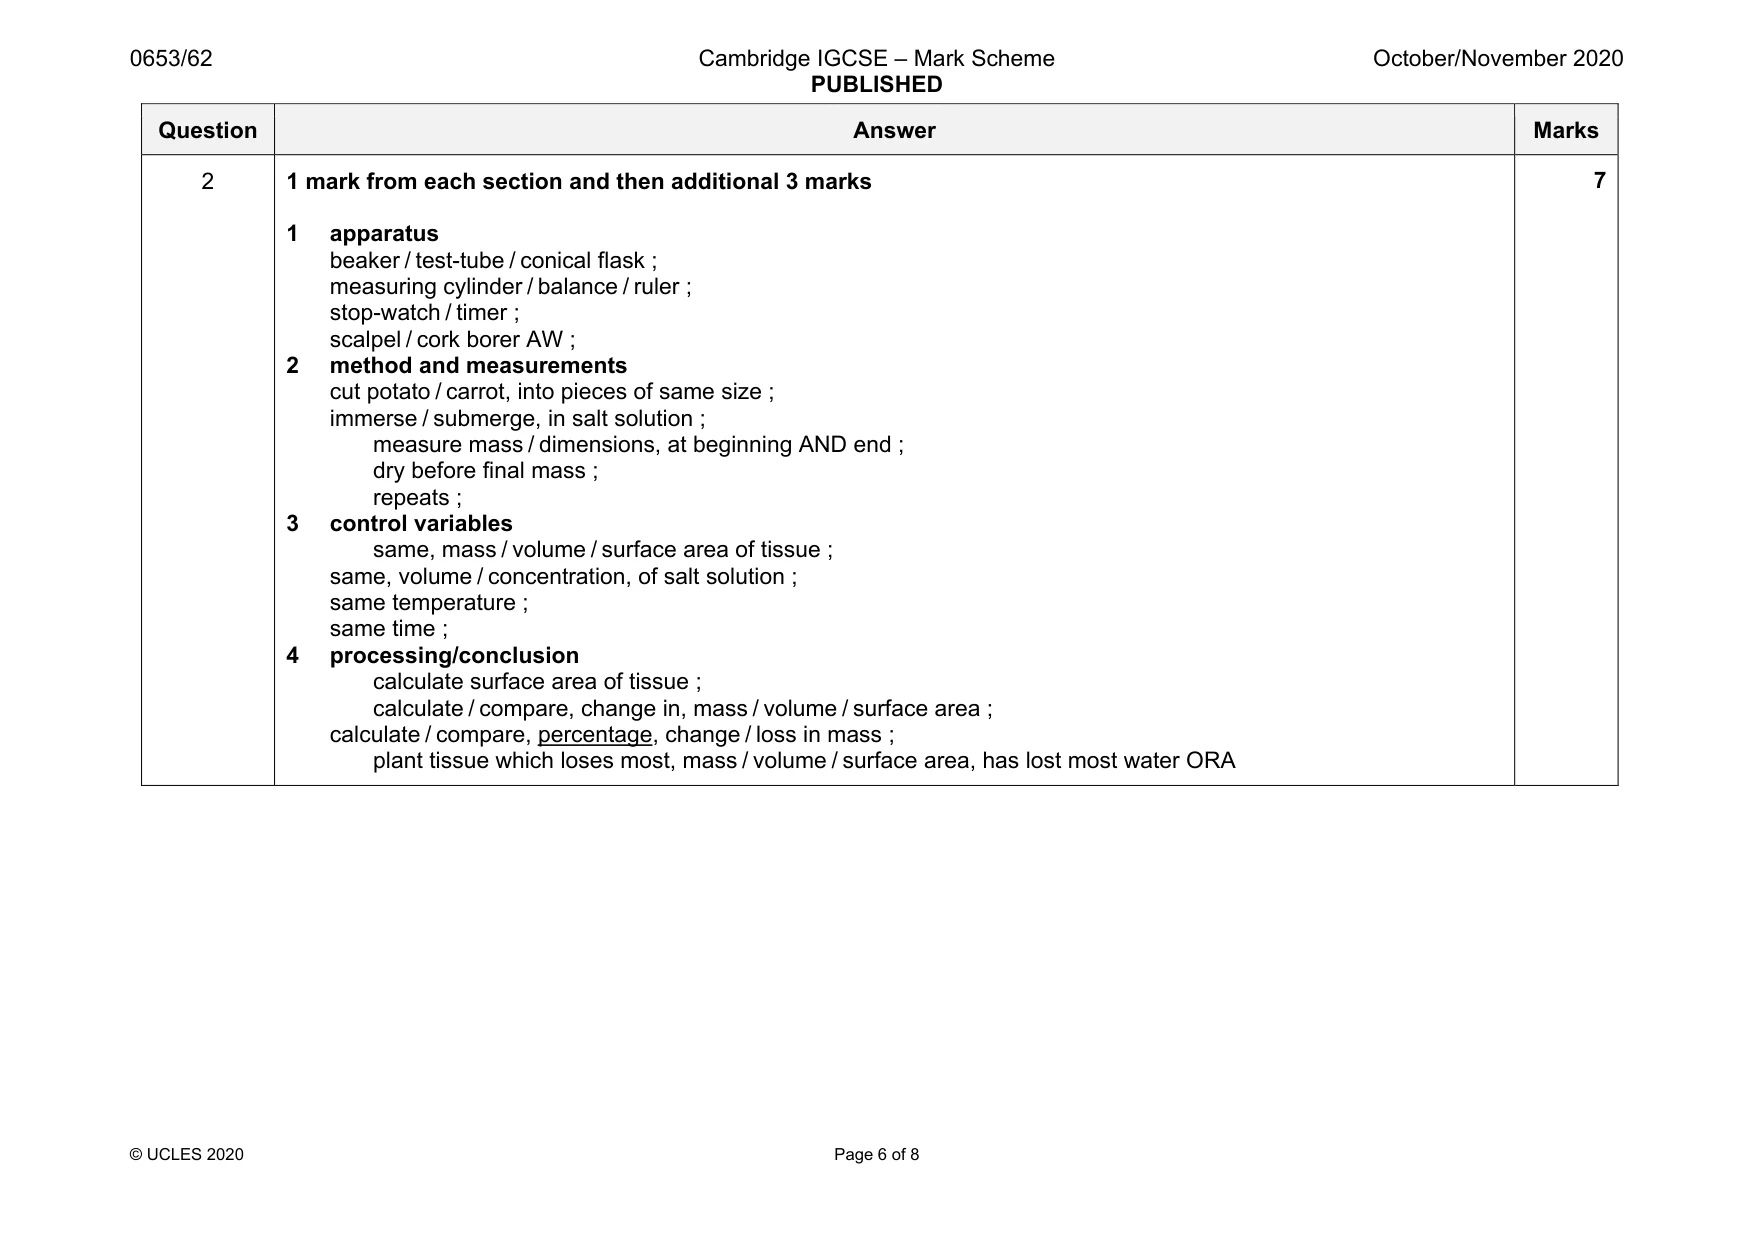
Mark scheme: 2 1 mark from each section and then additional 3 marks 1 apparatus beaker / test-tube / conical flask ; measuring cylinder / balance / ruler ; stop-watch / timer ; scalpel / cork borer AW ; 2 method and measurements cut potato / carrot, into pieces of same size ; immerse / submerge, in salt solution ; measure mass / dimensions, at beginning AND end ; dry before final mass ; repeats ; 3 control variables same, mass / volume / surface area of tissue ; same, volume / concentration, of salt solution ; same temperature ; same time ; 4 processing/conclusion calculate surface area of tissue ; calculate / compare, change in, mass / volume / surface area ; calculate / compare, percentage, change / loss in mass ; plant tissue which loses most, mass / volume / surface area, has lost most water ORA
Q3 · A student investigates the changes in temperature that occur when dilute acid is added to…
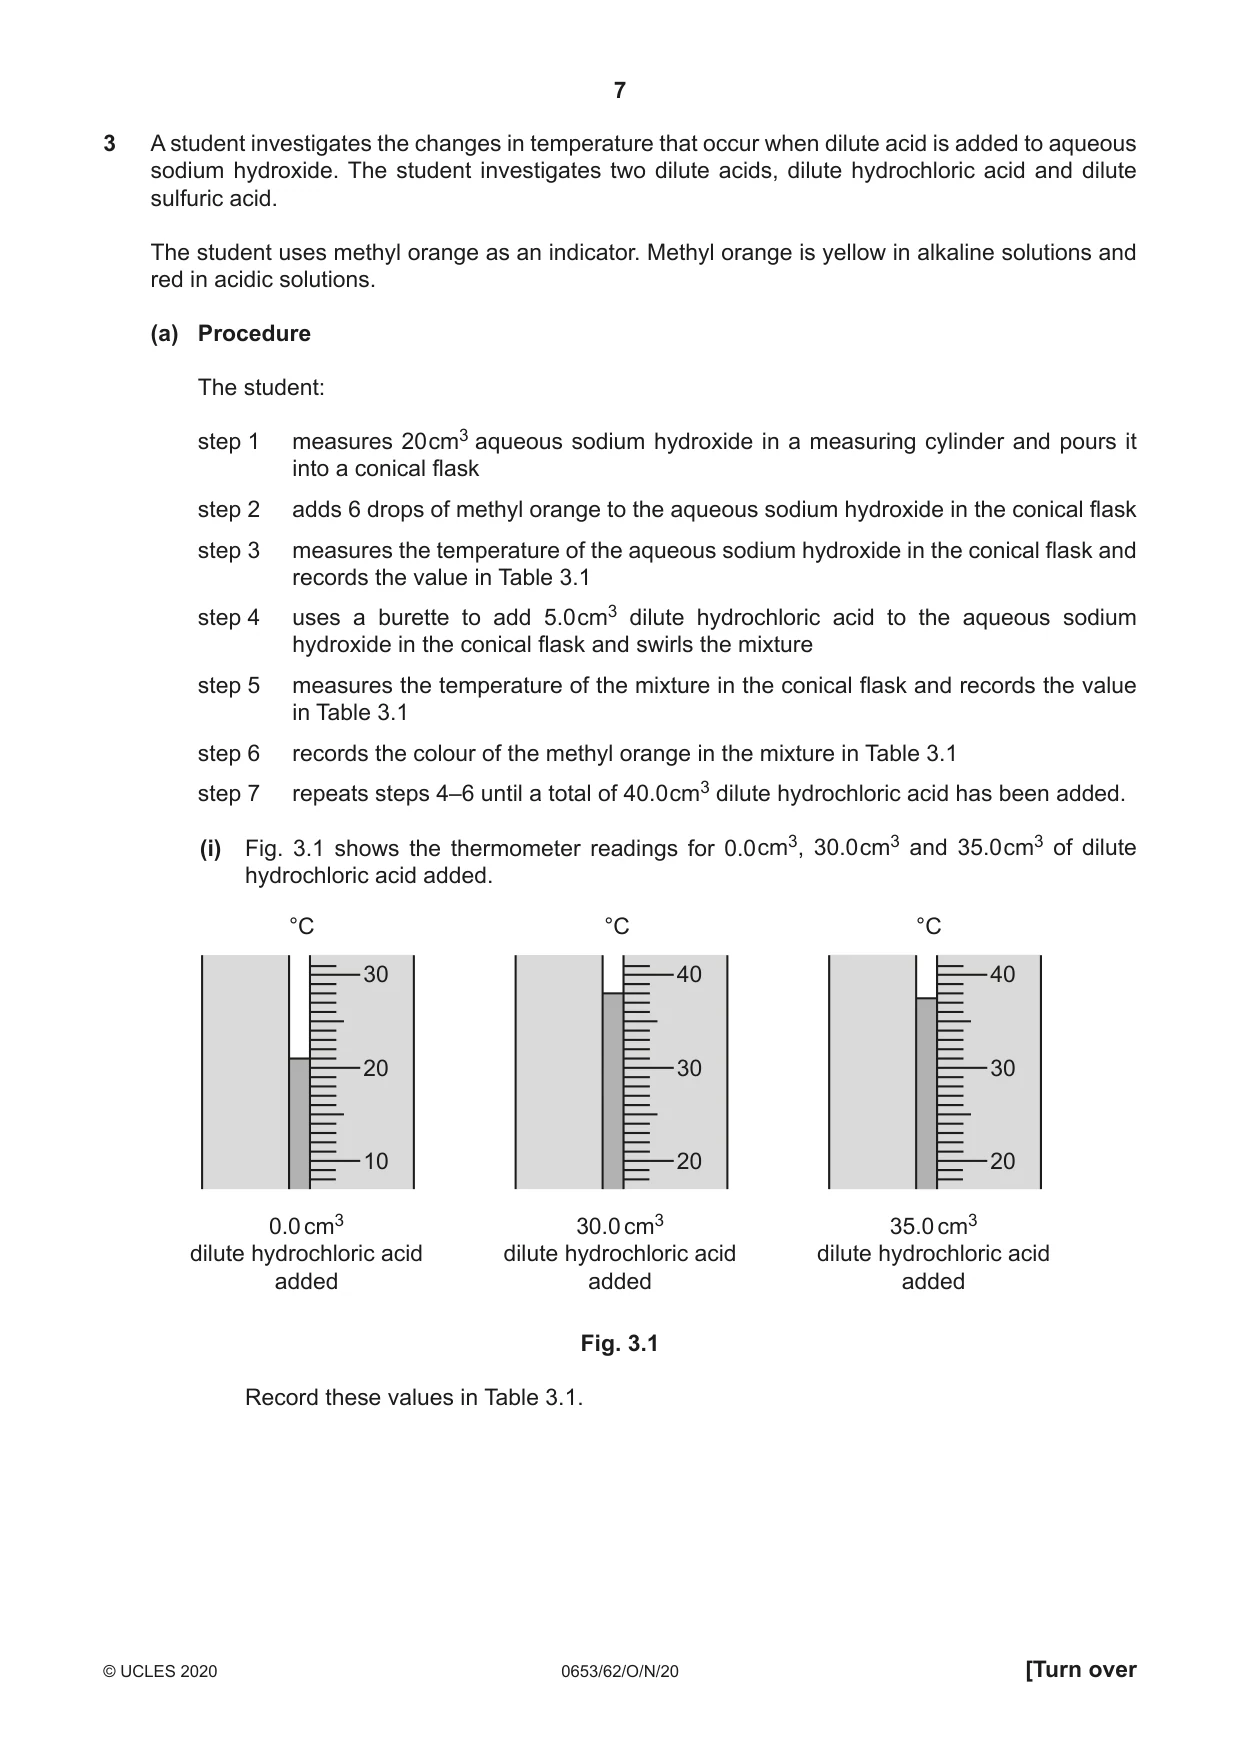
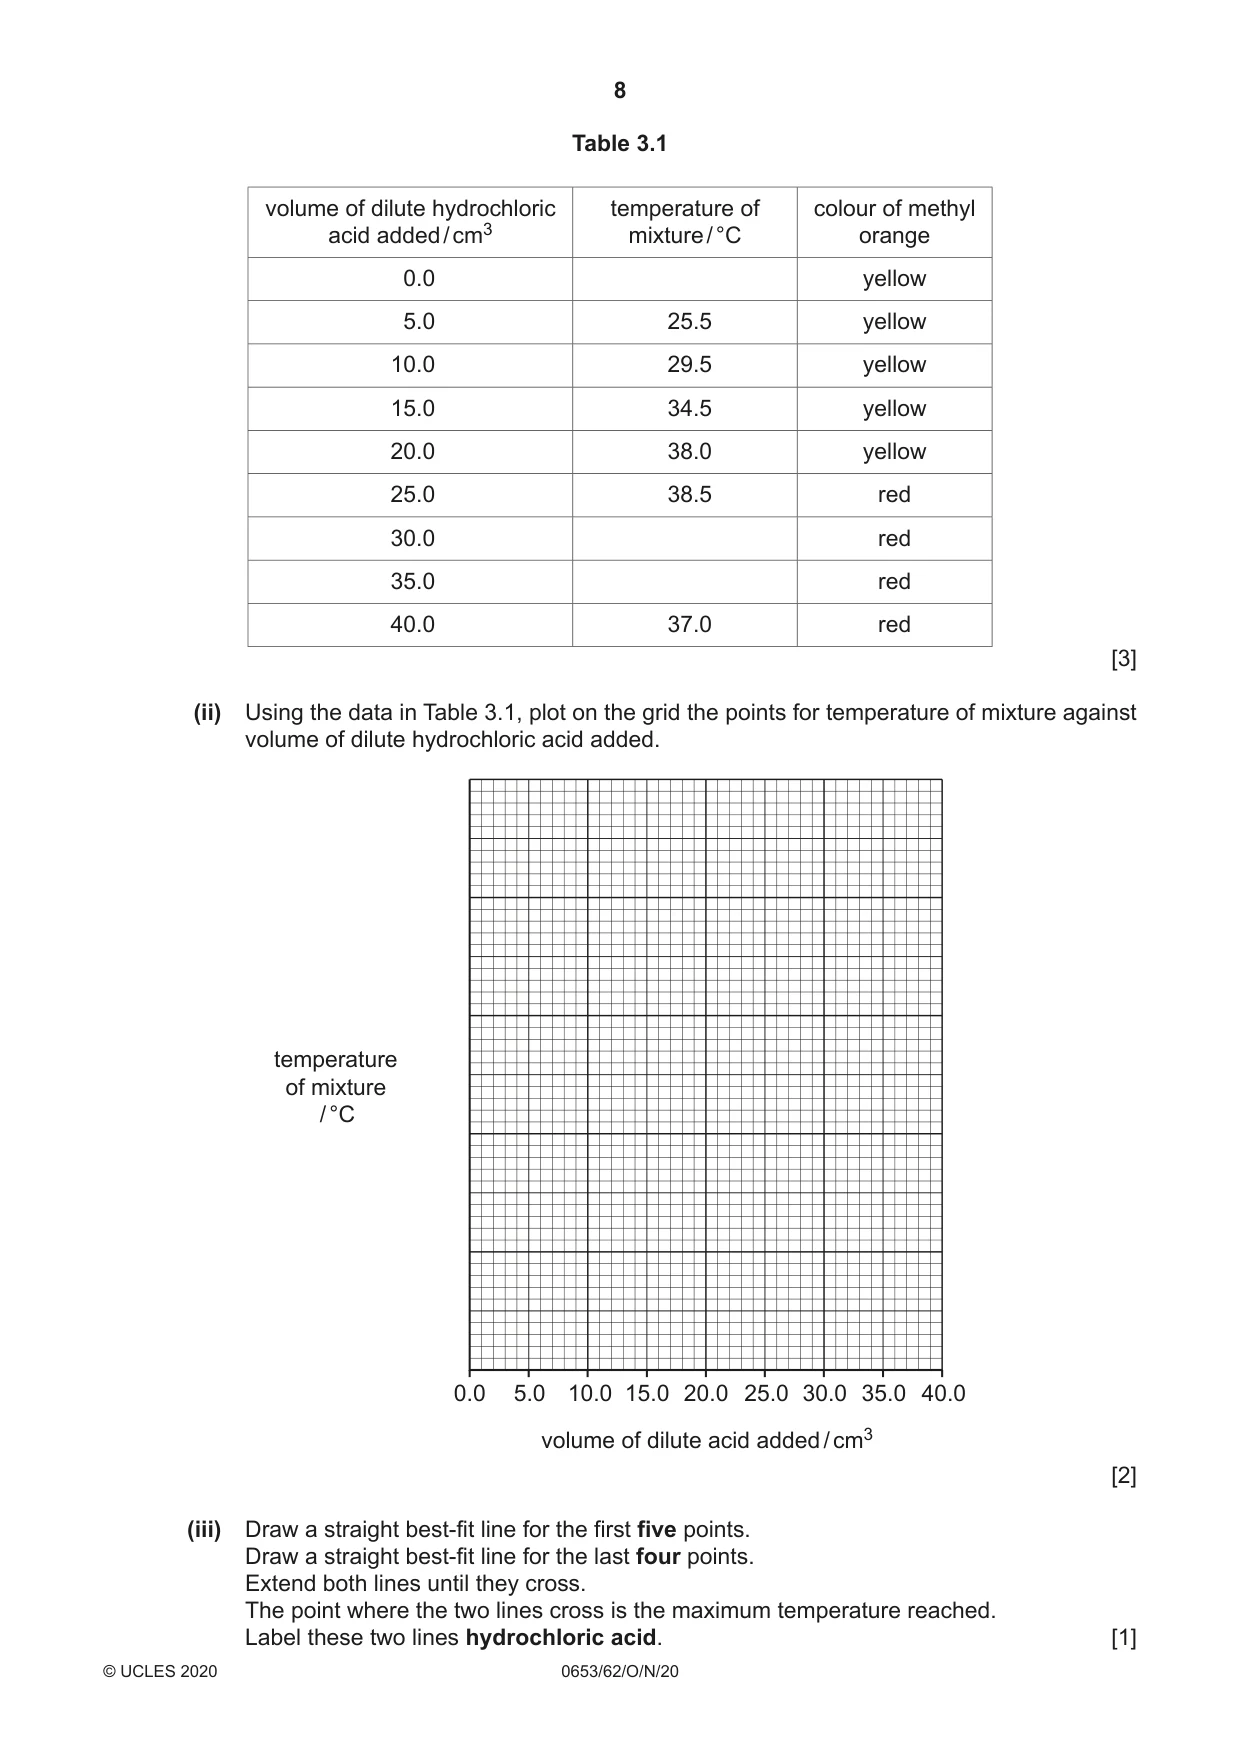
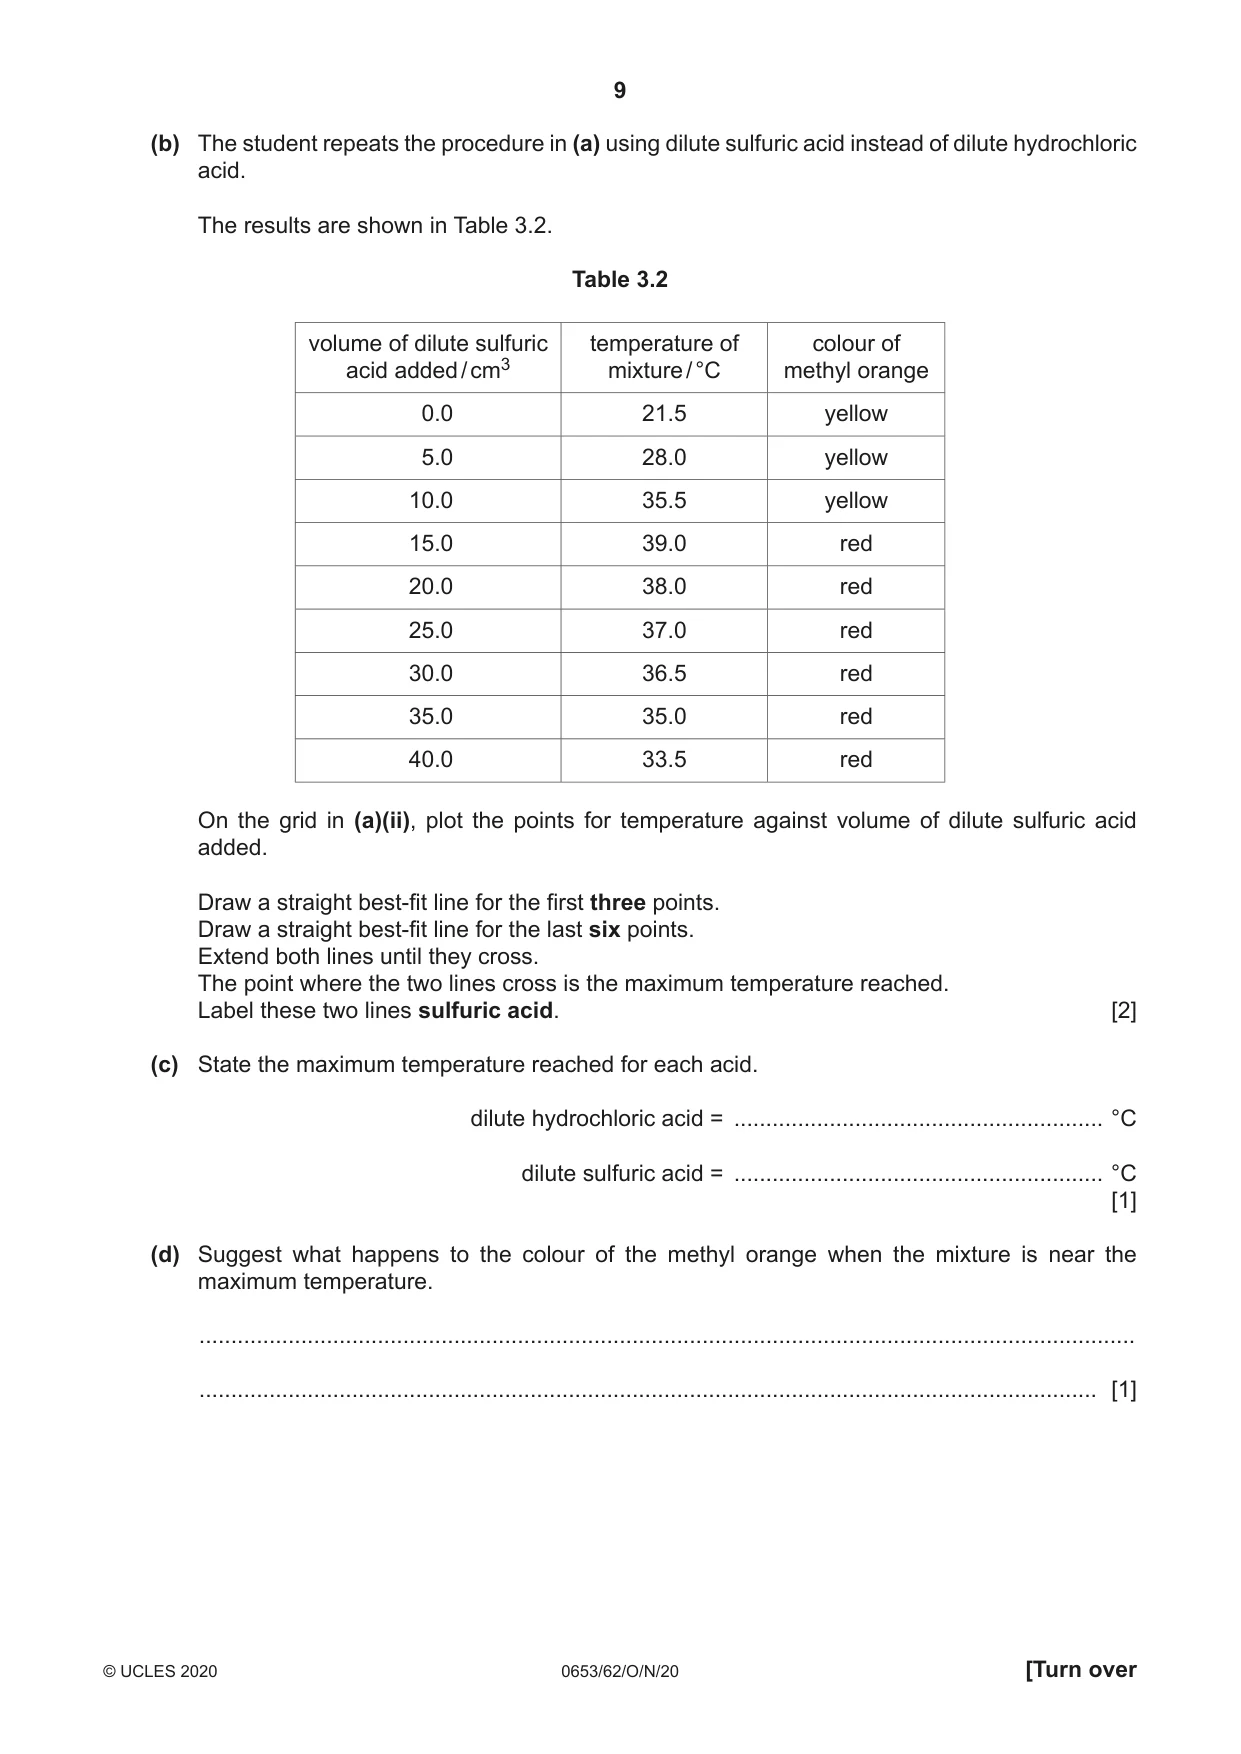
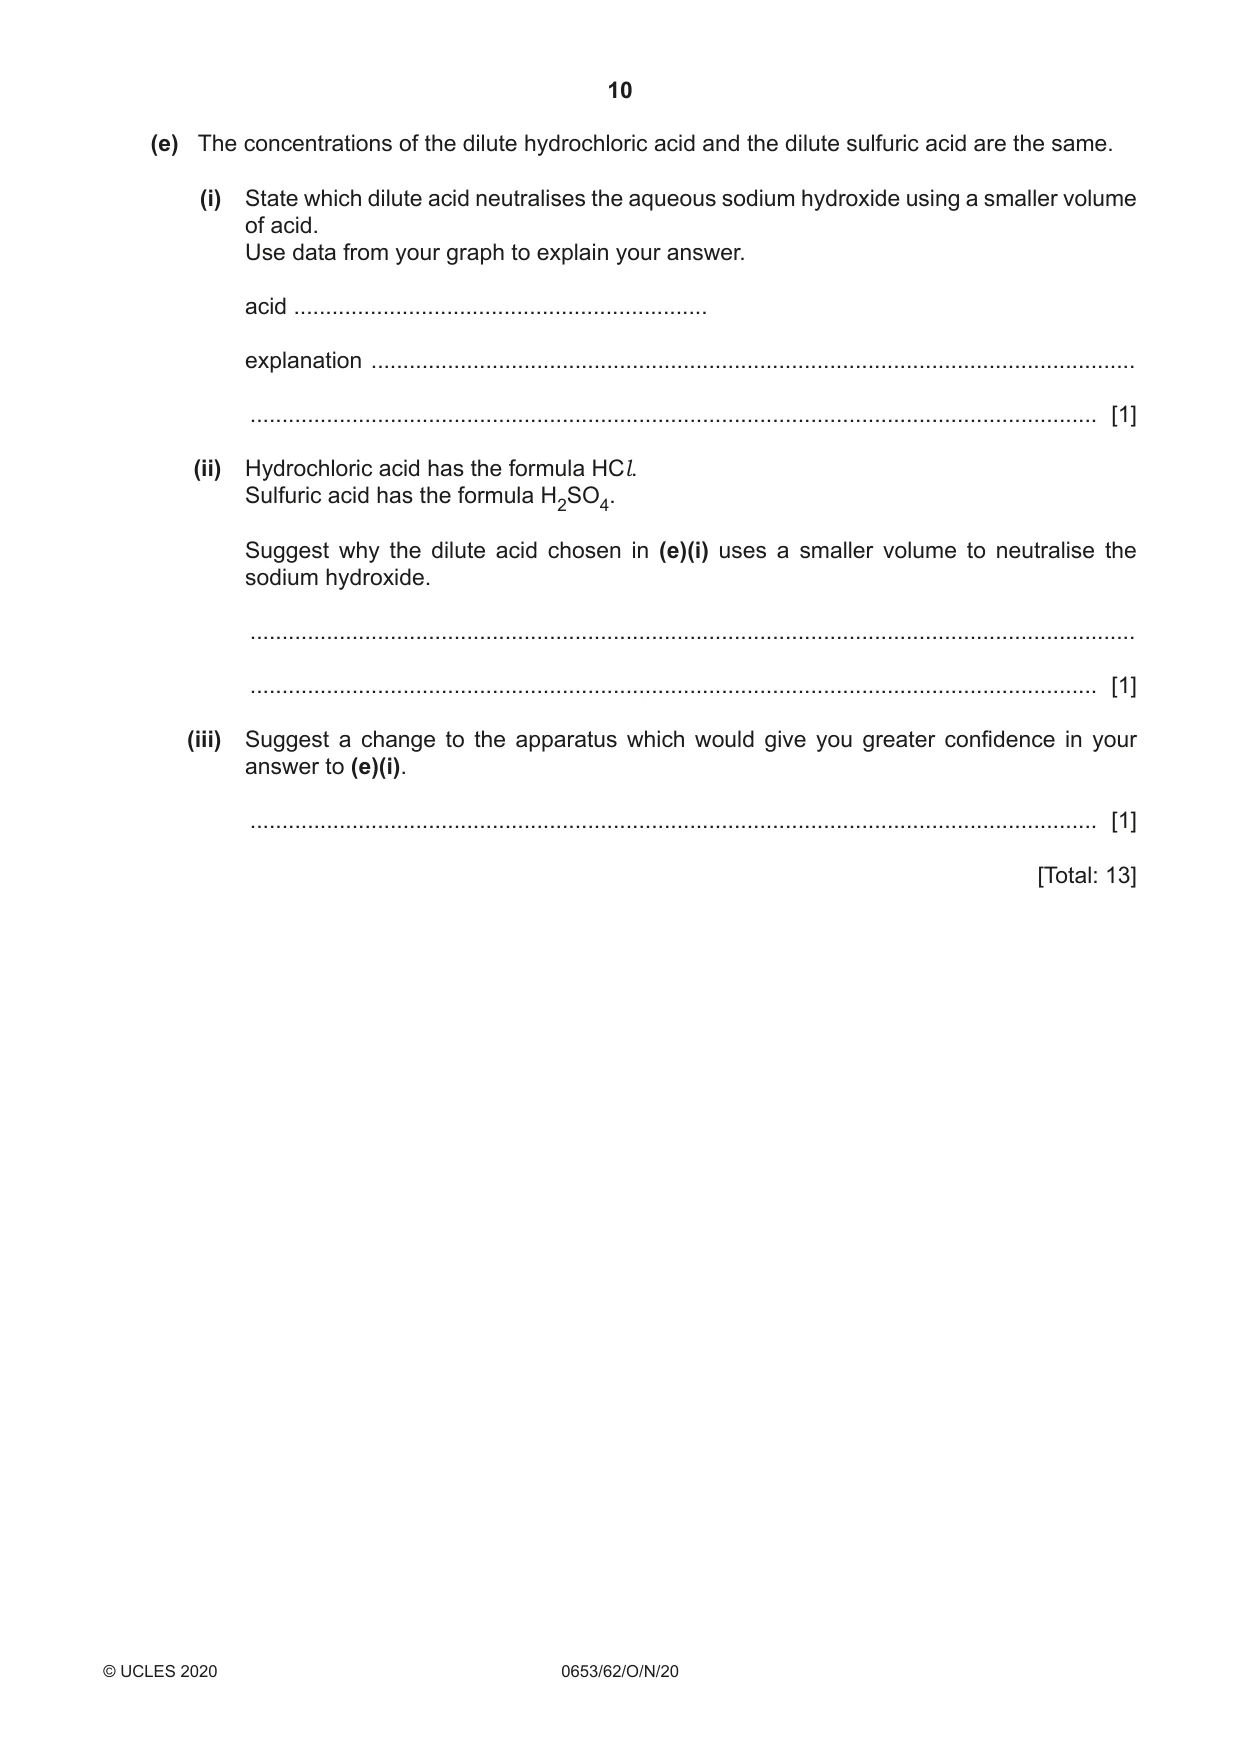
3 A student investigates the changes in temperature that occur when dilute acid is added to aqueous sodium hydroxide. The student investigates two dilute acids, dilute hydrochloric acid and dilute sulfuric acid. The student uses methyl orange as an indicator. Methyl orange is yellow in alkaline solutions and red in acidic solutions. (a) Procedure The student: step 1 measures 20 cm3 aqueous sodium hydroxide in a measuring cylinder and pours it into a conical flask step 2 adds 6 drops of methyl orange to the aqueous sodium hydroxide in the conical flask step 3 measures the temperature of the aqueous sodium hydroxide in the conical flask and records the value in Table 3.1 step 4 uses a burette to add 5.0 cm3 dilute hydrochloric acid to the aqueous sodium hydroxide in the conical flask and swirls the mixture step 5 measures the temperature of the mixture in the conical flask and records the value in Table 3.1 step 6 records the colour of the methyl orange in the mixture in Table 3.1 step 7 repeats steps 4–6 until a total of 40.0 cm3 dilute hydrochloric acid has been added. (i) Fig. 3.1 shows the thermometer readings for 0.0 cm3, 30.0 cm3 and 35.0 cm3 of dilute hydrochloric acid added. °C °C °C 30 40 40 20 30 30 10 20 20 0.0 cm3 30.0 cm3 35.0 cm3 dilute hydrochloric acid dilute hydrochloric acid dilute hydrochloric acid added added added Fig. 3.1 Record these values in Table 3.1. Table 3.1 volume of dilute hydrochloric temperature of colour of methyl acid added / cm3 mixture / °C orange 0.0 yellow 5.0 25.5 yellow 10.0 29.5 yellow 15.0 34.5 yellow 20.0 38.0 yellow 25.0 38.5 red 30.0 red 35.0 red 40.0 37.0 red [3] (ii) Using the data in Table 3.1, plot on the grid the points for temperature of mixture against volume of dilute hydrochloric acid added. temperature of mixture / °C 0.0 5.0 10.0 15.0 20.0 25.0 30.0 35.0 40.0 volume of dilute acid added / cm3 [2] (iii) Draw a straight best-fit line for the first five points. Draw a straight best-fit line for the last four points. Extend both lines until they cross. The point where the two lines cross is the maximum temperature reached. Label these two lines hydrochloric acid. [1] (b) The student repeats the procedure in (a) using dilute sulfuric acid instead of dilute hydrochloric acid. The results are shown in Table 3.2. Table 3.2 volume of dilute sulfuric temperature of colour of acid added / cm3 mixture / °C methyl orange 0.0 21.5 yellow 5.0 28.0 yellow 10.0 35.5 yellow 15.0 39.0 red 20.0 38.0 red 25.0 37.0 red 30.0 36.5 red 35.0 35.0 red 40.0 33.5 red On the grid in (a)(ii), plot the points for temperature against volume of dilute sulfuric acid added. Draw a straight best-fit line for the first three points. Draw a straight best-fit line for the last six points. Extend both lines until they cross. The point where the two lines cross is the maximum temperature reached. Label these two lines sulfuric acid. [2] (c) State the maximum temperature reached for each acid. dilute hydrochloric acid = .......................................................... °C dilute sulfuric acid = .......................................................... °C [1] (d) Suggest what happens to the colour of the methyl orange when the mixture is near the maximum temperature. ................................................................................................................................................... ............................................................................................................................................. [1] (e) The concentrations of the dilute hydrochloric acid and the dilute sulfuric acid are the same. (i) State which dilute acid neutralises the aqueous sodium hydroxide using a smaller volume of acid. Use data from your graph to explain your answer. acid ................................................................. explanation ........................................................................................................................ ..................................................................................................................................... [1] (ii) Hydrochloric acid has the formula HCl. Sulfuric acid has the formula H2SO4. Suggest why the dilute acid chosen in (e)(i) uses a smaller volume to neutralise the sodium hydroxide. ........................................................................................................................................... ..................................................................................................................................... [1] (iii) Suggest a change to the apparatus which would give you greater confidence in your answer to (e)(i). ..................................................................................................................................... [1] [Total: 13]
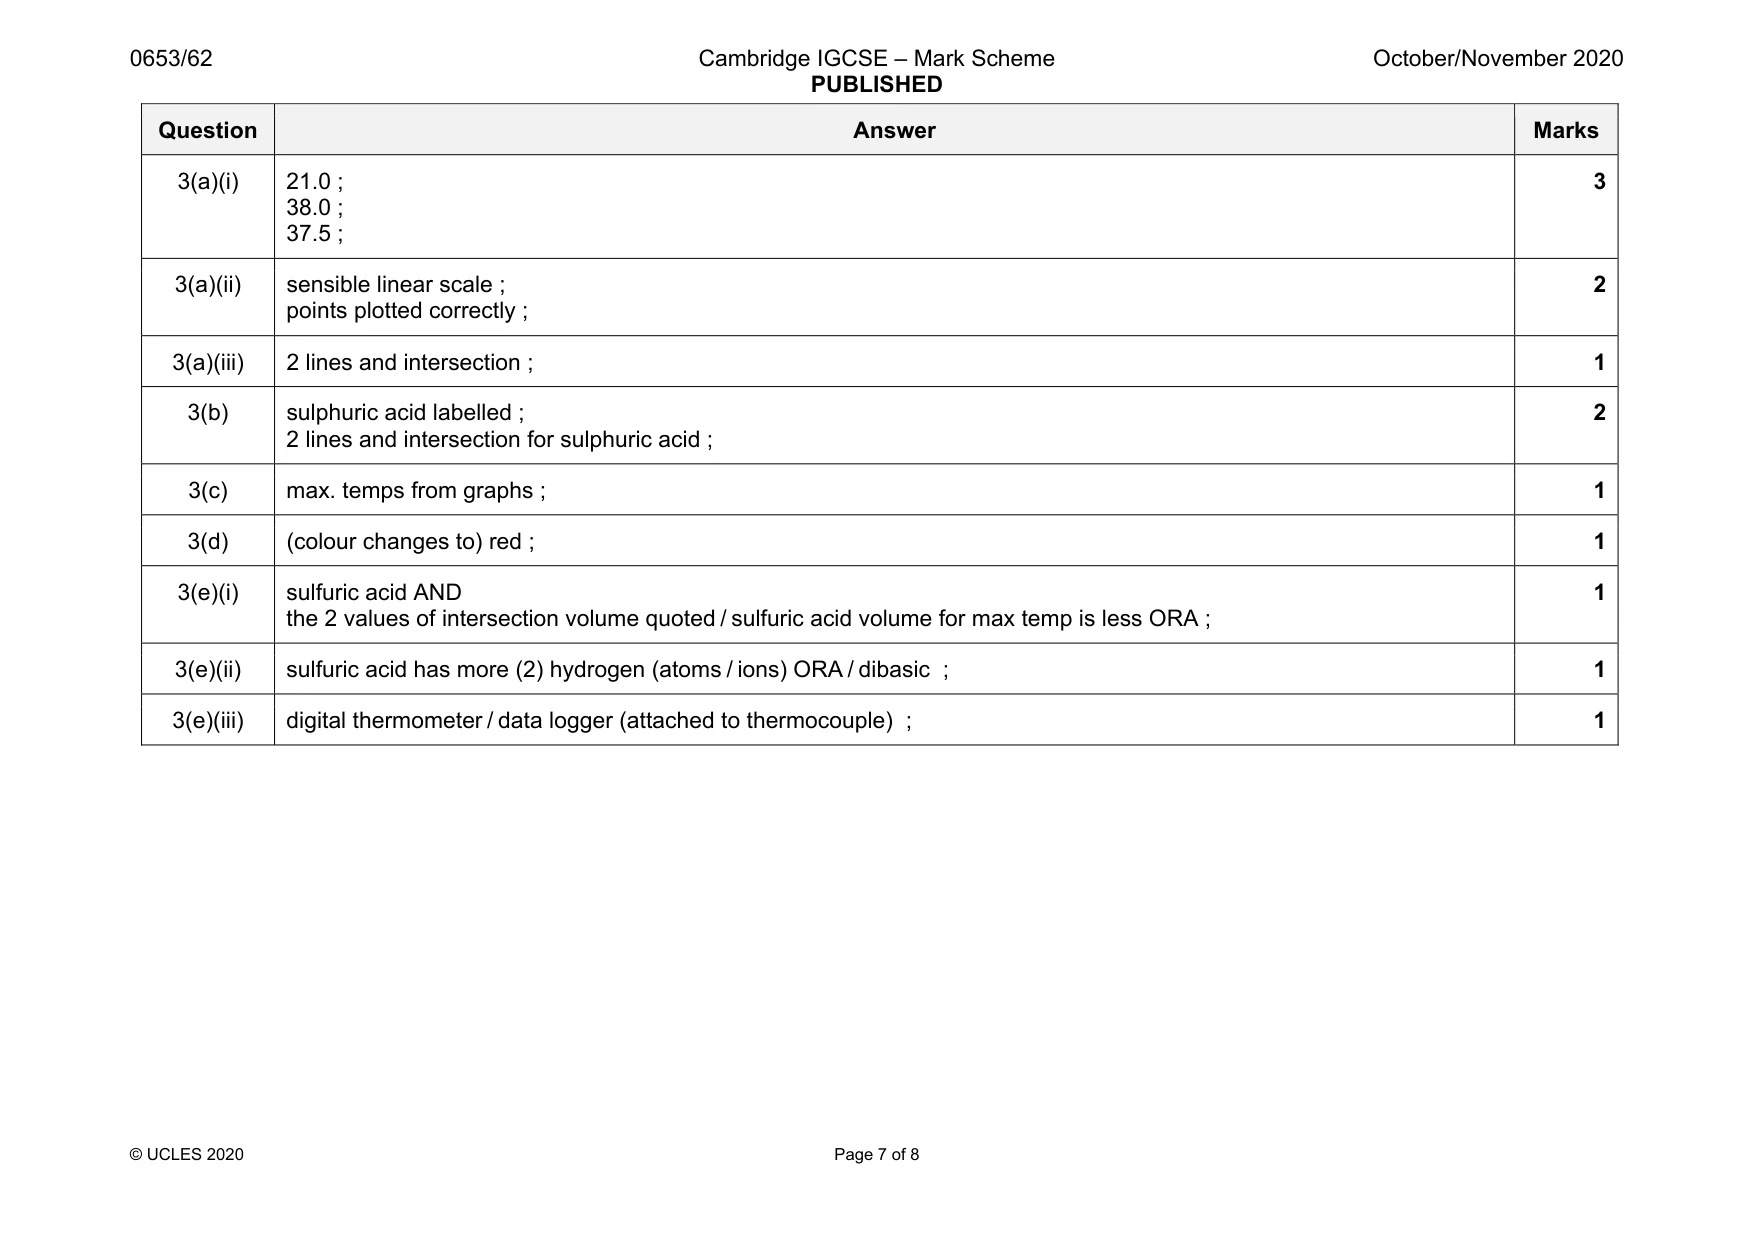
Mark scheme: 3(a)(i) 21.0 ; 38.0 ; 37.5 ; 3 3(a)(ii) sensible linear scale ; points plotted correctly ; 2 3(a)(iii) 2 lines and intersection ; 1 3(b) sulphuric acid labelled ; 2 lines and intersection for sulphuric acid ; 2 3(c) max. temps from graphs ; 1 3(d) (colour changes to) red ; 1 3(e)(i) sulfuric acid AND the 2 values of intersection volume quoted / sulfuric acid volume for max temp is less ORA ; 1 3(e)(ii) sulfuric acid has more (2) hydrogen (atoms / ions) ORA / dibasic ; 1 3(e)(iii) digital thermometer / data logger (attached to thermocouple) ; 1
Q4 · The ‘internal resistance’ of a cell is the resistance inside the cell
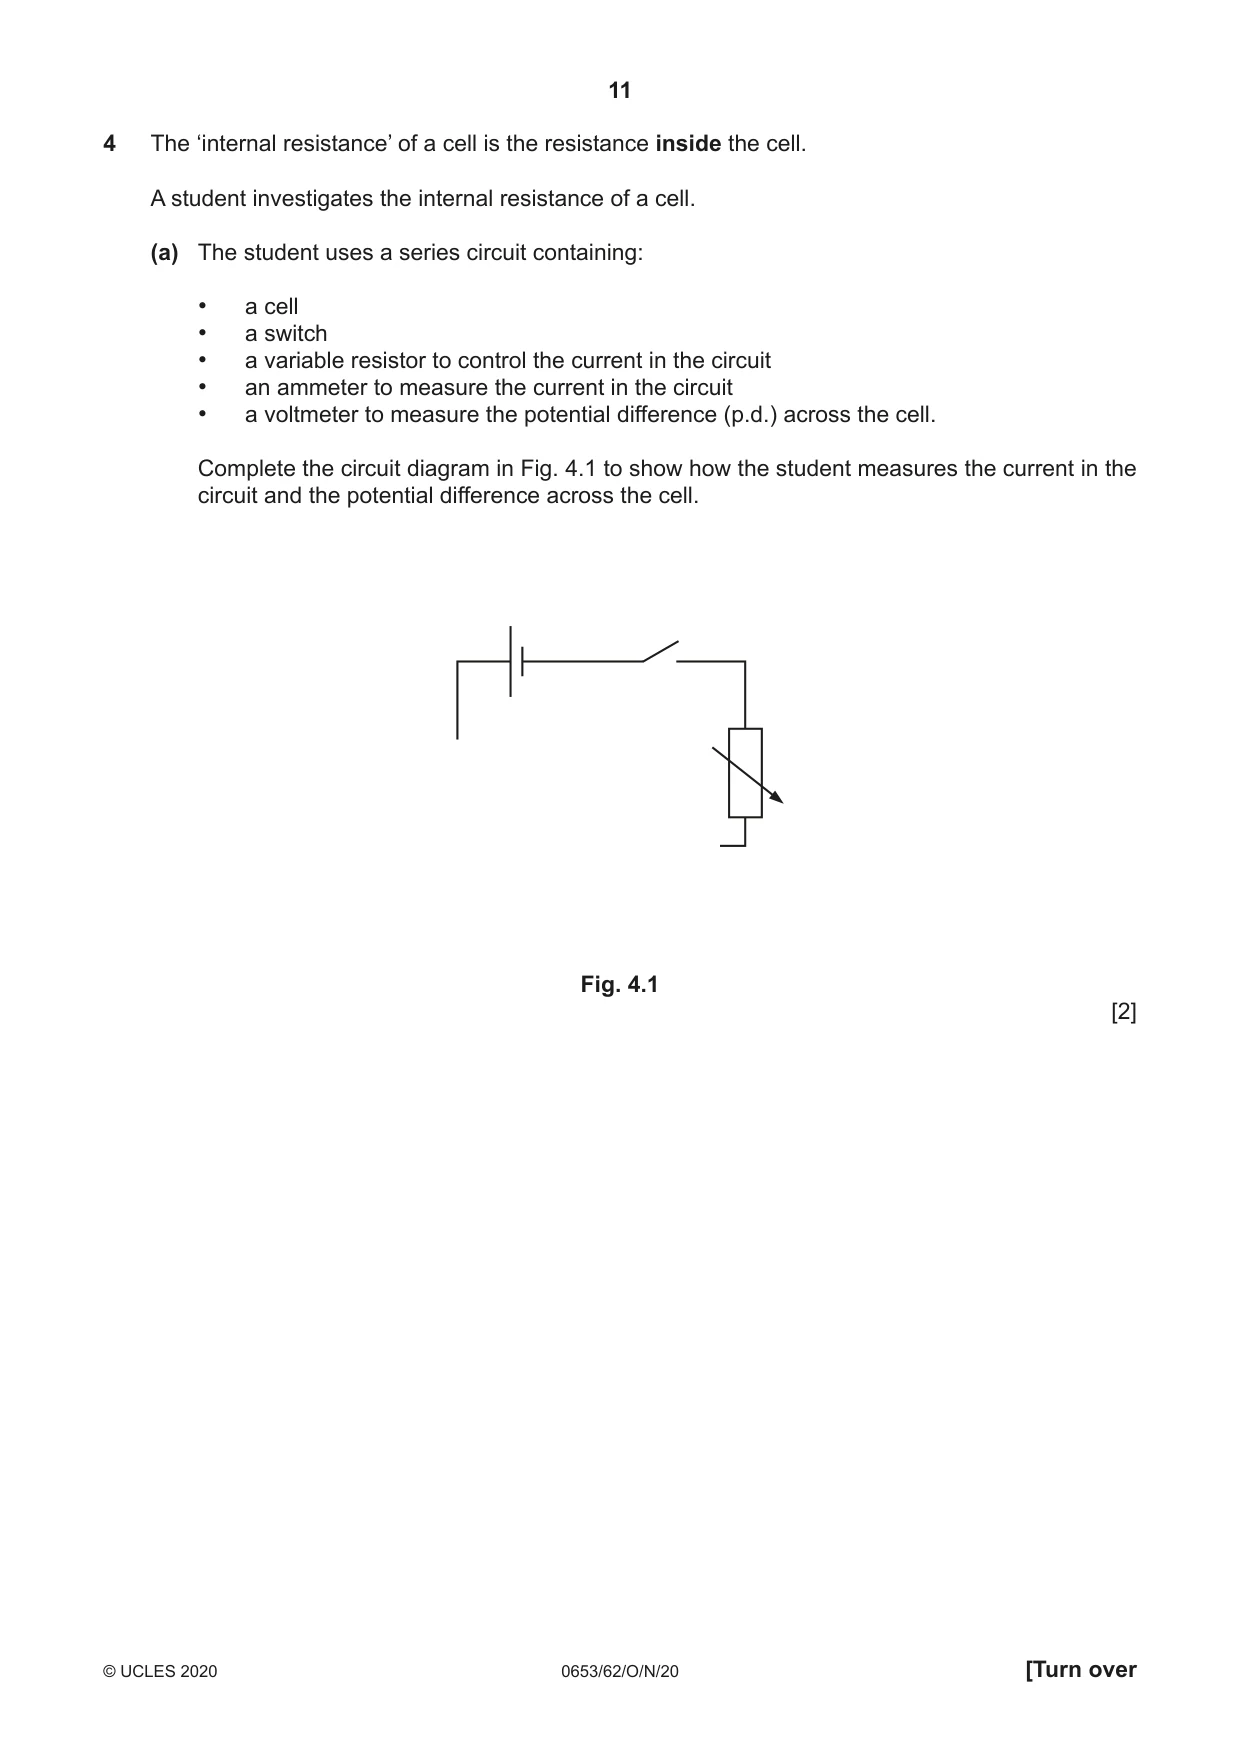
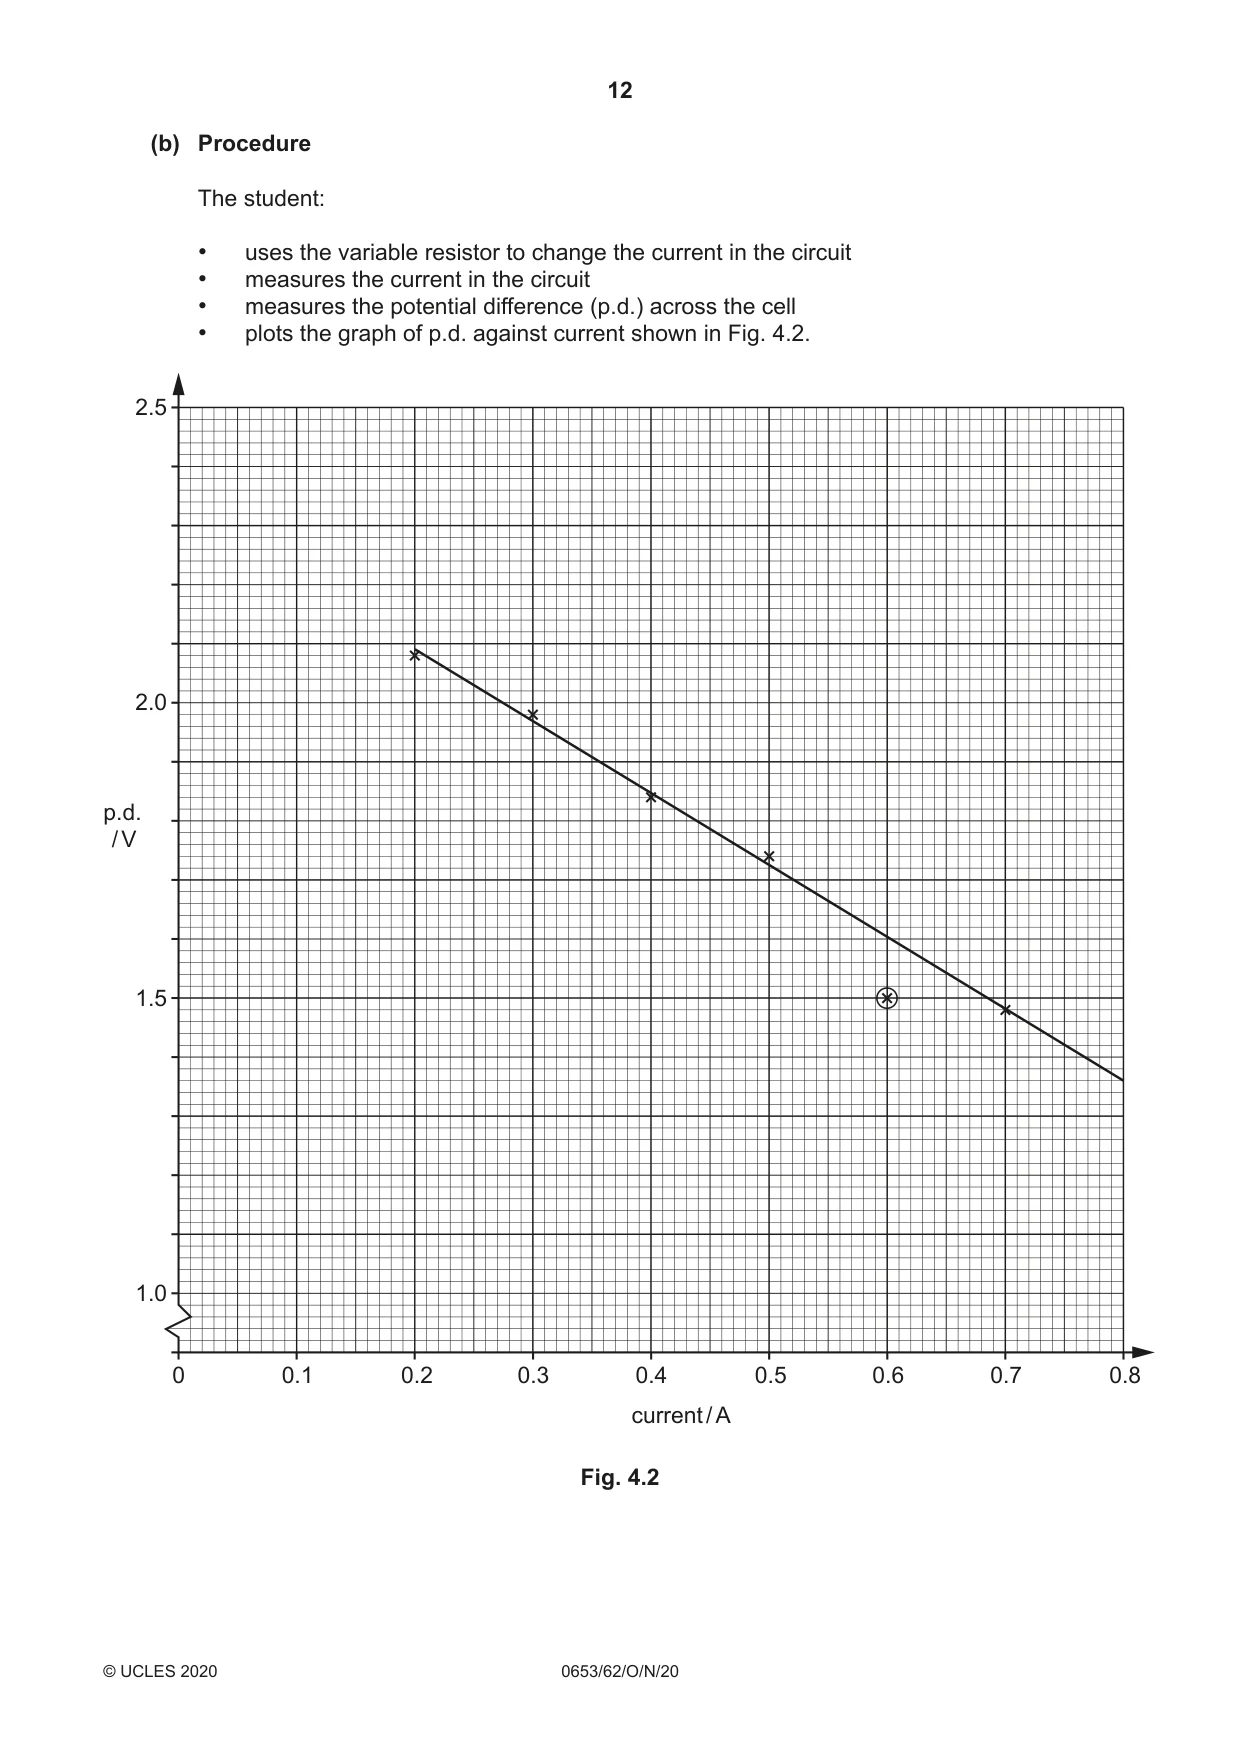
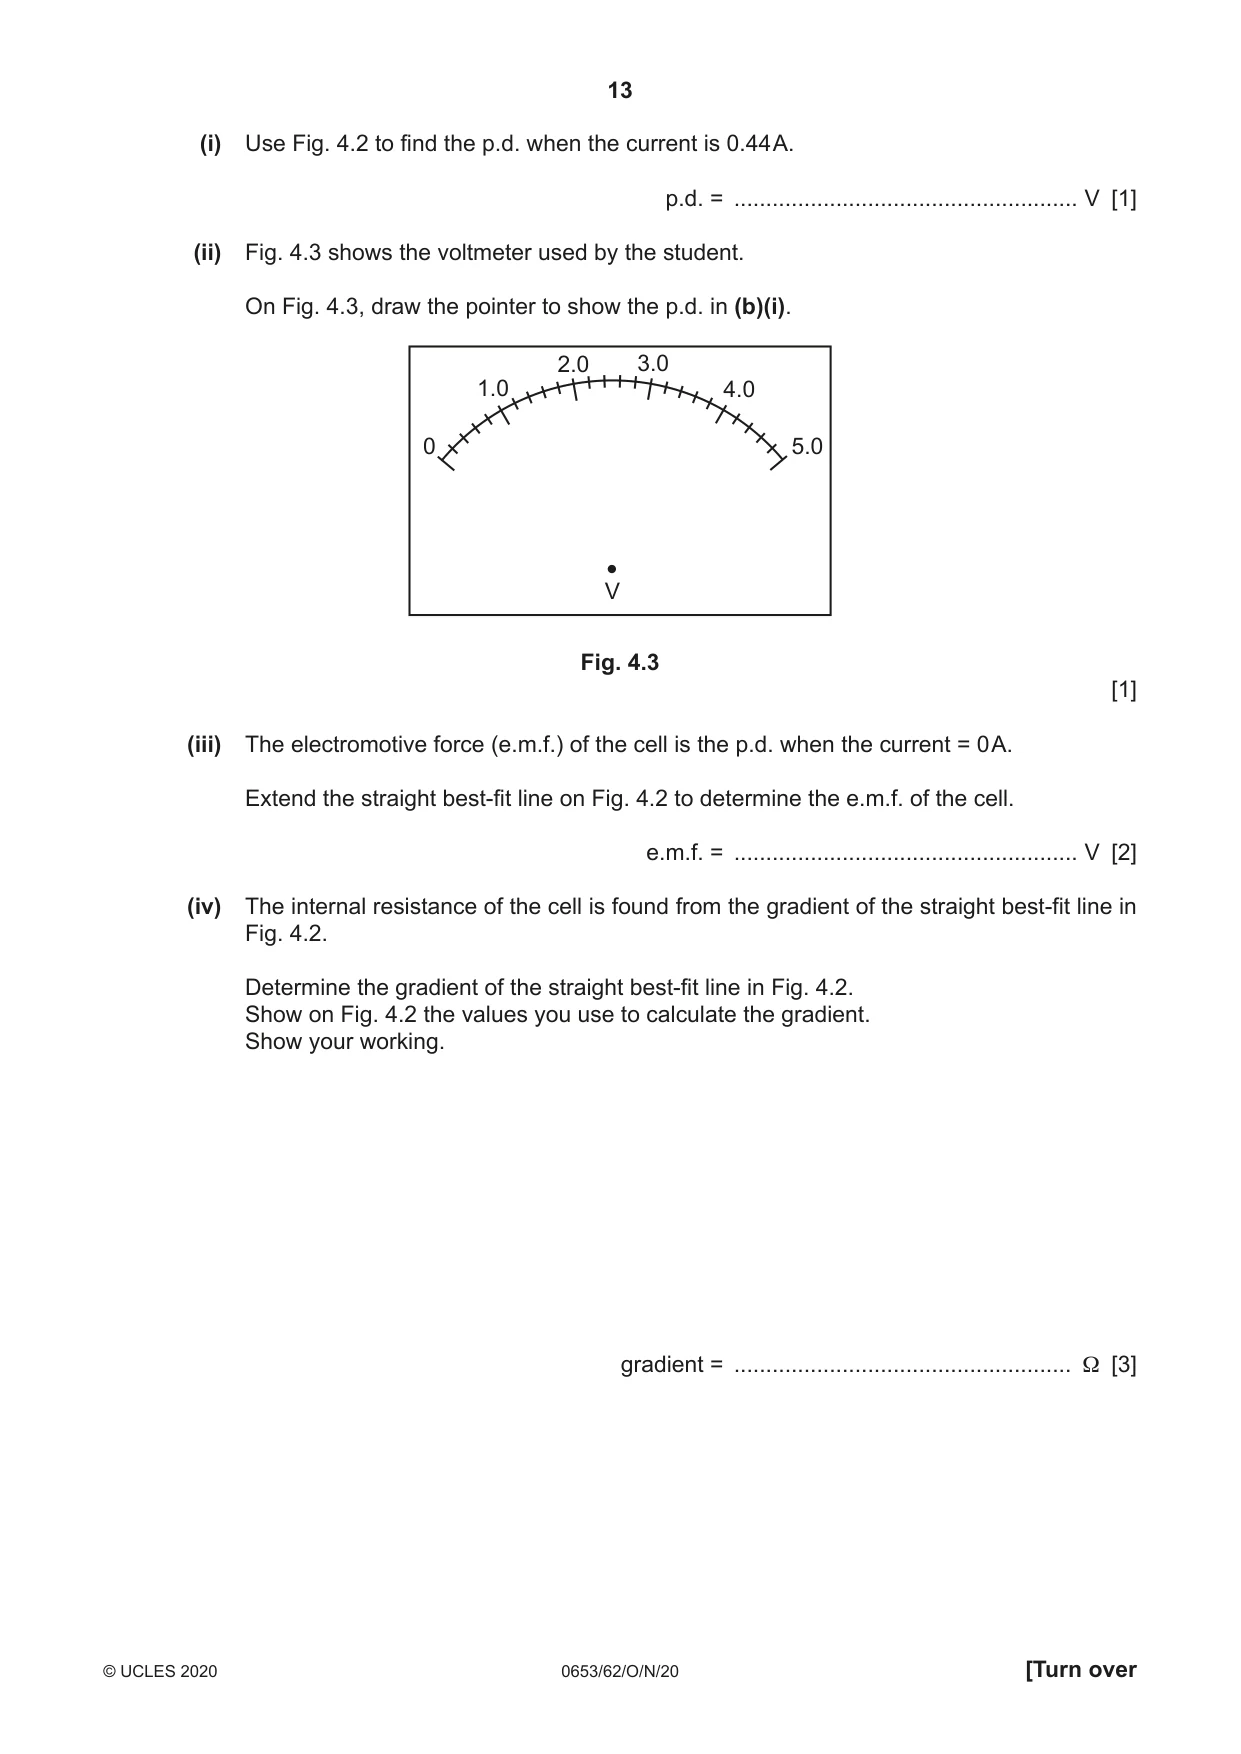
4 The ‘internal resistance’ of a cell is the resistance inside the cell. A student investigates the internal resistance of a cell. (a) The student uses a series circuit containing: • a cell • a switch • a variable resistor to control the current in the circuit • an ammeter to measure the current in the circuit • a voltmeter to measure the potential difference (p.d.) across the cell. Complete the circuit diagram in Fig. 4.1 to show how the student measures the current in the circuit and the potential difference across the cell. Fig. 4.1 [2] (b) Procedure The student: • uses the variable resistor to change the current in the circuit • measures the current in the circuit • measures the potential difference (p.d.) across the cell • plots the graph of p.d. against current shown in Fig. 4.2. 2.5 2.0 p.d. / V 1.5 1.0 0 0.1 0.2 0.3 0.4 0.5 0.6 0.7 0.8 current / A Fig. 4.2 (i) Use Fig. 4.2 to find the p.d. when the current is 0.44 A. p.d. = ...................................................... V [1] (ii) Fig. 4.3 shows the voltmeter used by the student. On Fig. 4.3, draw the pointer to show the p.d. in (b)(i). 2.0 3.0 1.0 4.0 0 5.0 V Fig. 4.3 [1] (iii) The electromotive force (e.m.f.) of the cell is the p.d. when the current = 0 A. Extend the straight best-fit line on Fig. 4.2 to determine the e.m.f. of the cell. e.m.f. = ...................................................... V [2] (iv) The internal resistance of the cell is found from the gradient of the straight best-fit line in Fig. 4.2. Determine the gradient of the straight best-fit line in Fig. 4.2. Show on Fig. 4.2 the values you use to calculate the gradient. Show your working. gradient = ..................................................... Ω [3]
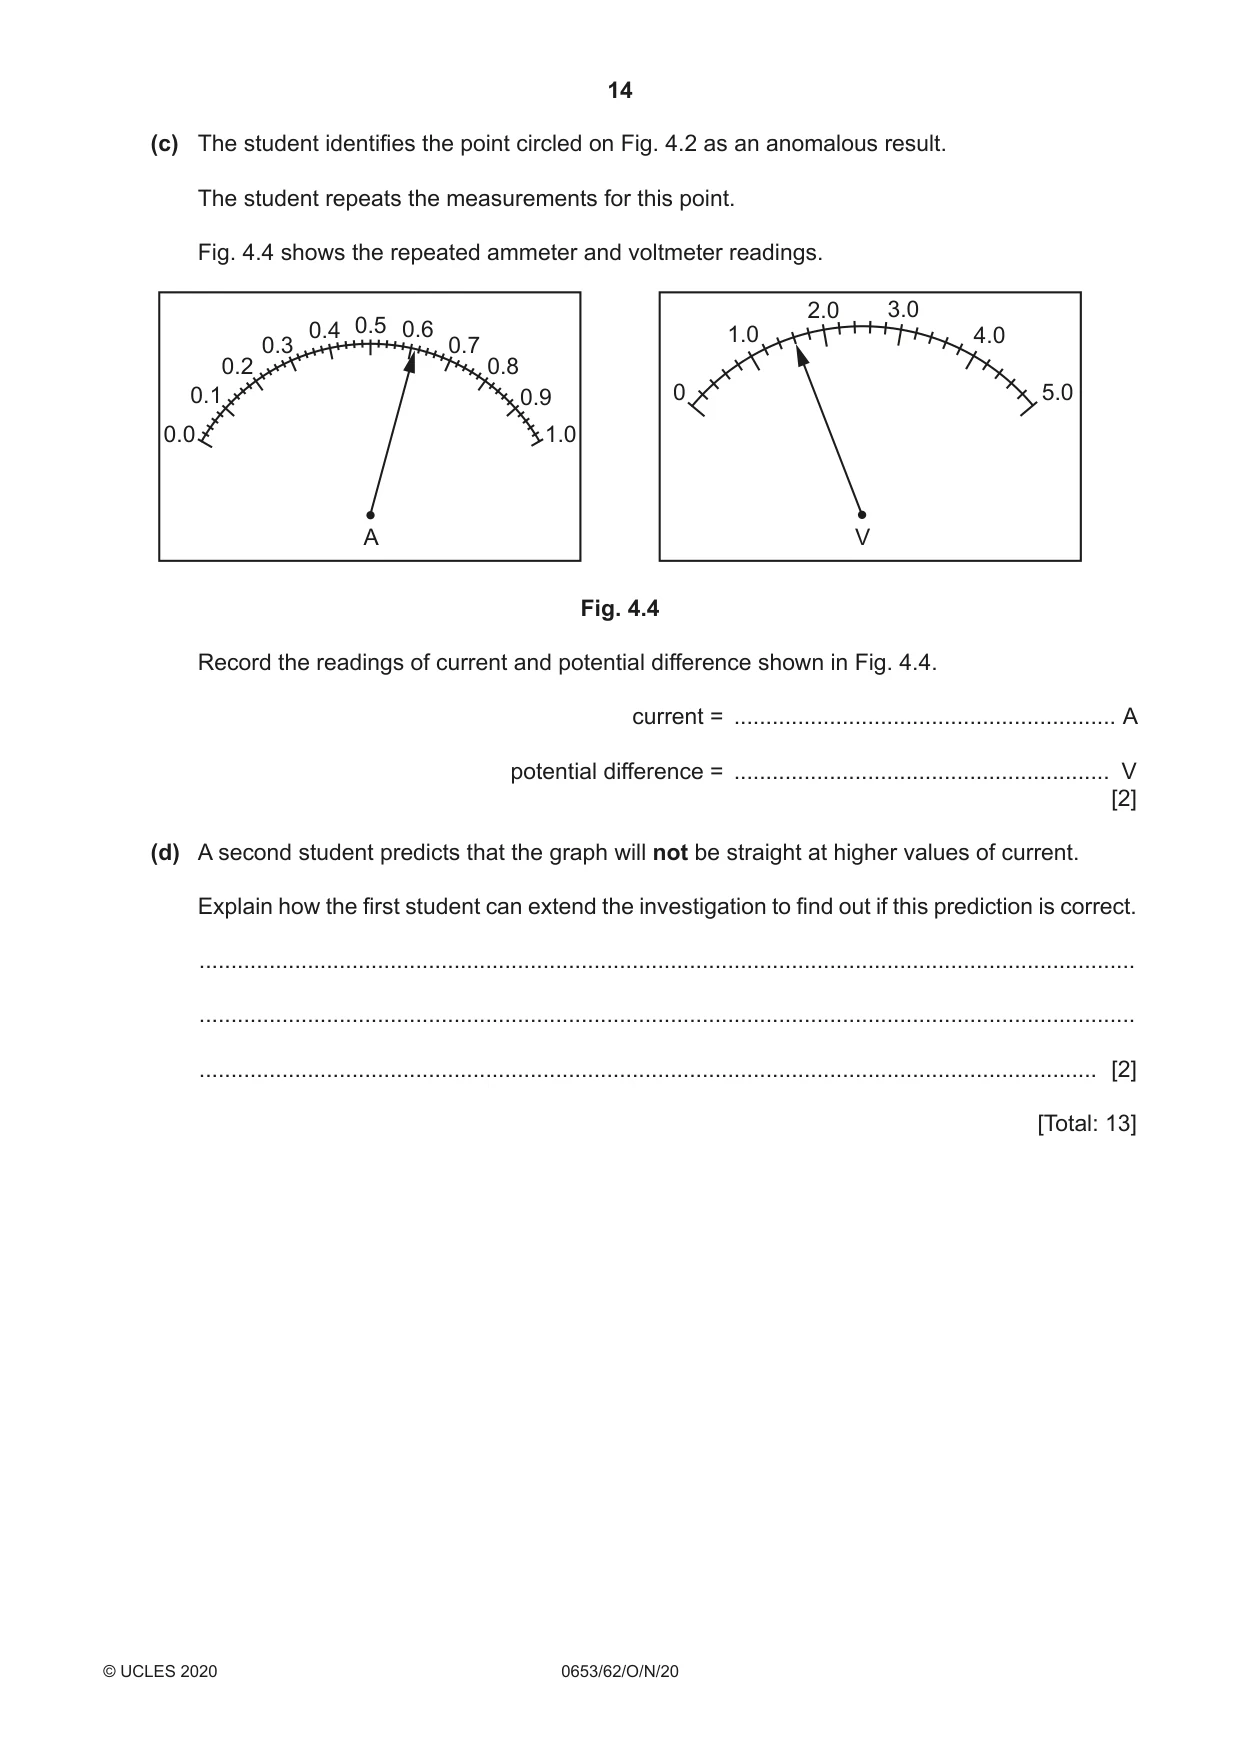
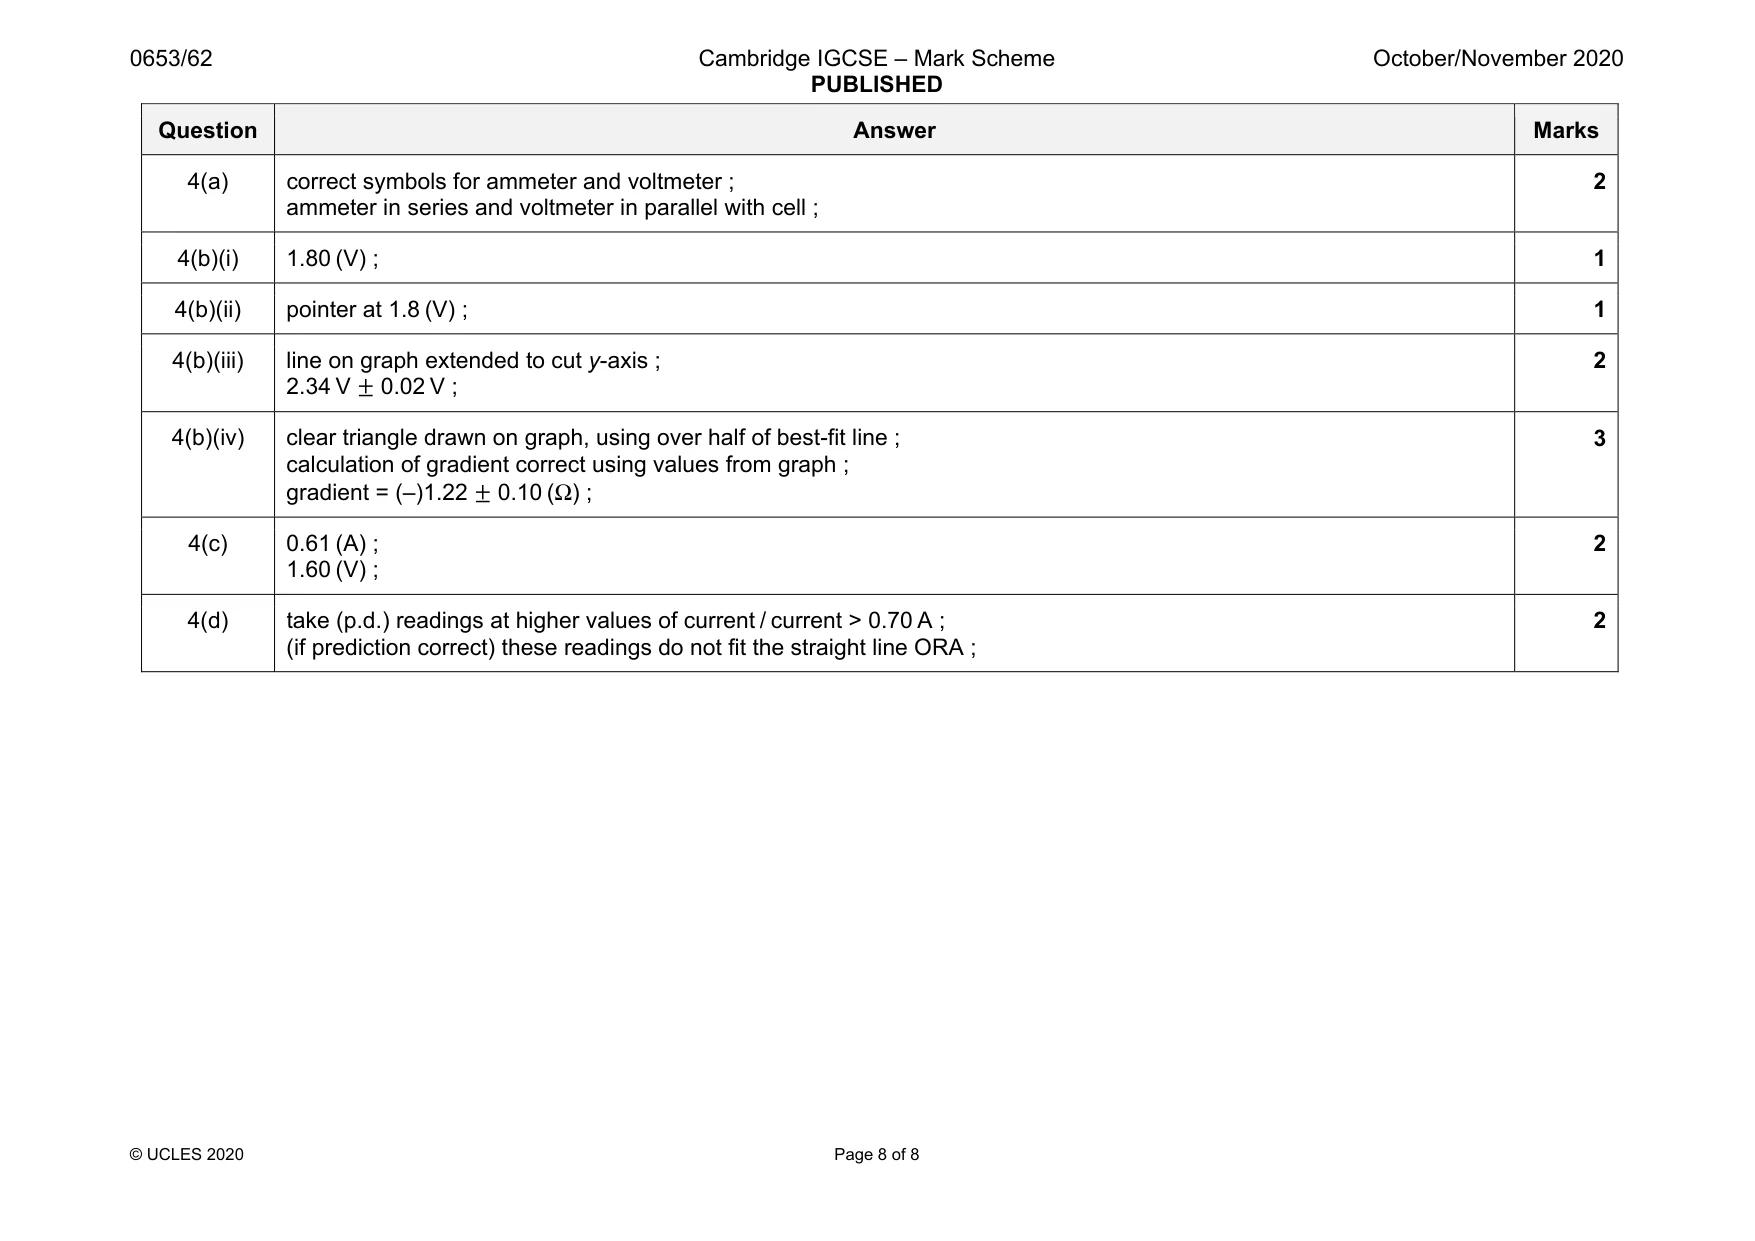
Mark scheme: 4(a) correct symbols for ammeter and voltmeter ; ammeter in series and voltmeter in parallel with cell ; 2 4(b)(i) 1.80 (V) ; 1 4(b)(ii) pointer at 1.8 (V) ; 1 4(b)(iii) line on graph extended to cut y-axis ; 2.34 V ± 0.02 V ; 2 4(b)(iv) clear triangle drawn on graph, using over half of best-fit line ; calculation of gradient correct using values from graph ; gradient = (–)1.22 ± 0.10 (Ω) ; 3 4(c) 0.61 (A) ; 1.60 (V) ; 2 4(d) take (p.d.) readings at higher values of current / current > 0.70 A ; (if prediction correct) these readings do not fit the straight line ORA ; 2
What was in this paper
The subtopics covered by these 4 questions, and how many questions each got. Open one in a new tab to see every Cambridge question on it.
What you needed in this session
Cambridge’s own grade thresholds for 2020 Oct/Nov, Paper 6 · Variant 2. A higher threshold means an easier paper — the bar moves with how the cohort did.