Cambridge IGCSE Science - Combined 0653 — 2020 Oct/Nov Paper 6 · Variant 1
0653/61/O/N/20 · 4 questions · 40 marks · ≈45 min
The question paper and its mark scheme, free to read here and free to download. This is Cambridge’s own paper, exactly as it was sat.
Question paper16 pages
Mark scheme8 pages
Answers below. Sit the paper first if you are practising.
Questions as text
Q1 · A student investigates the amount of vitamin C in orange juice
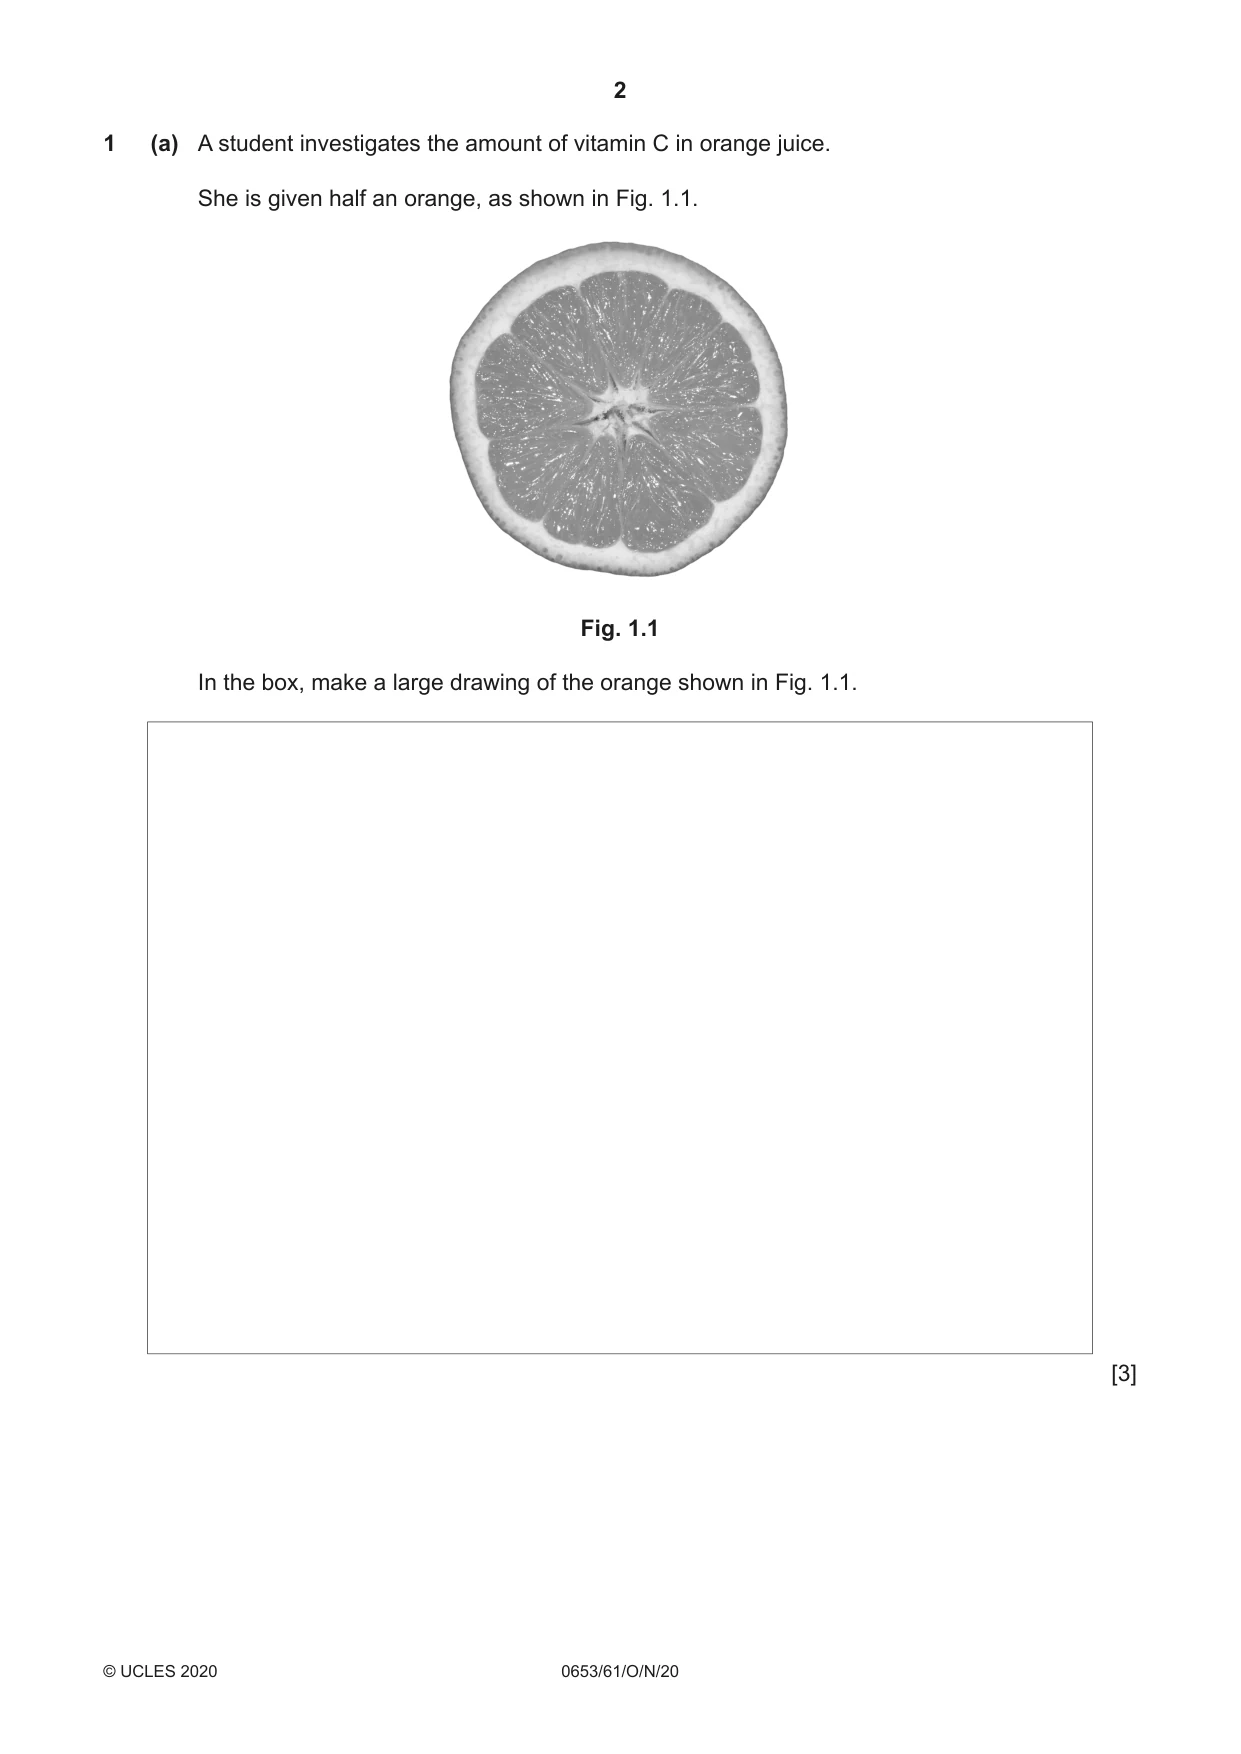
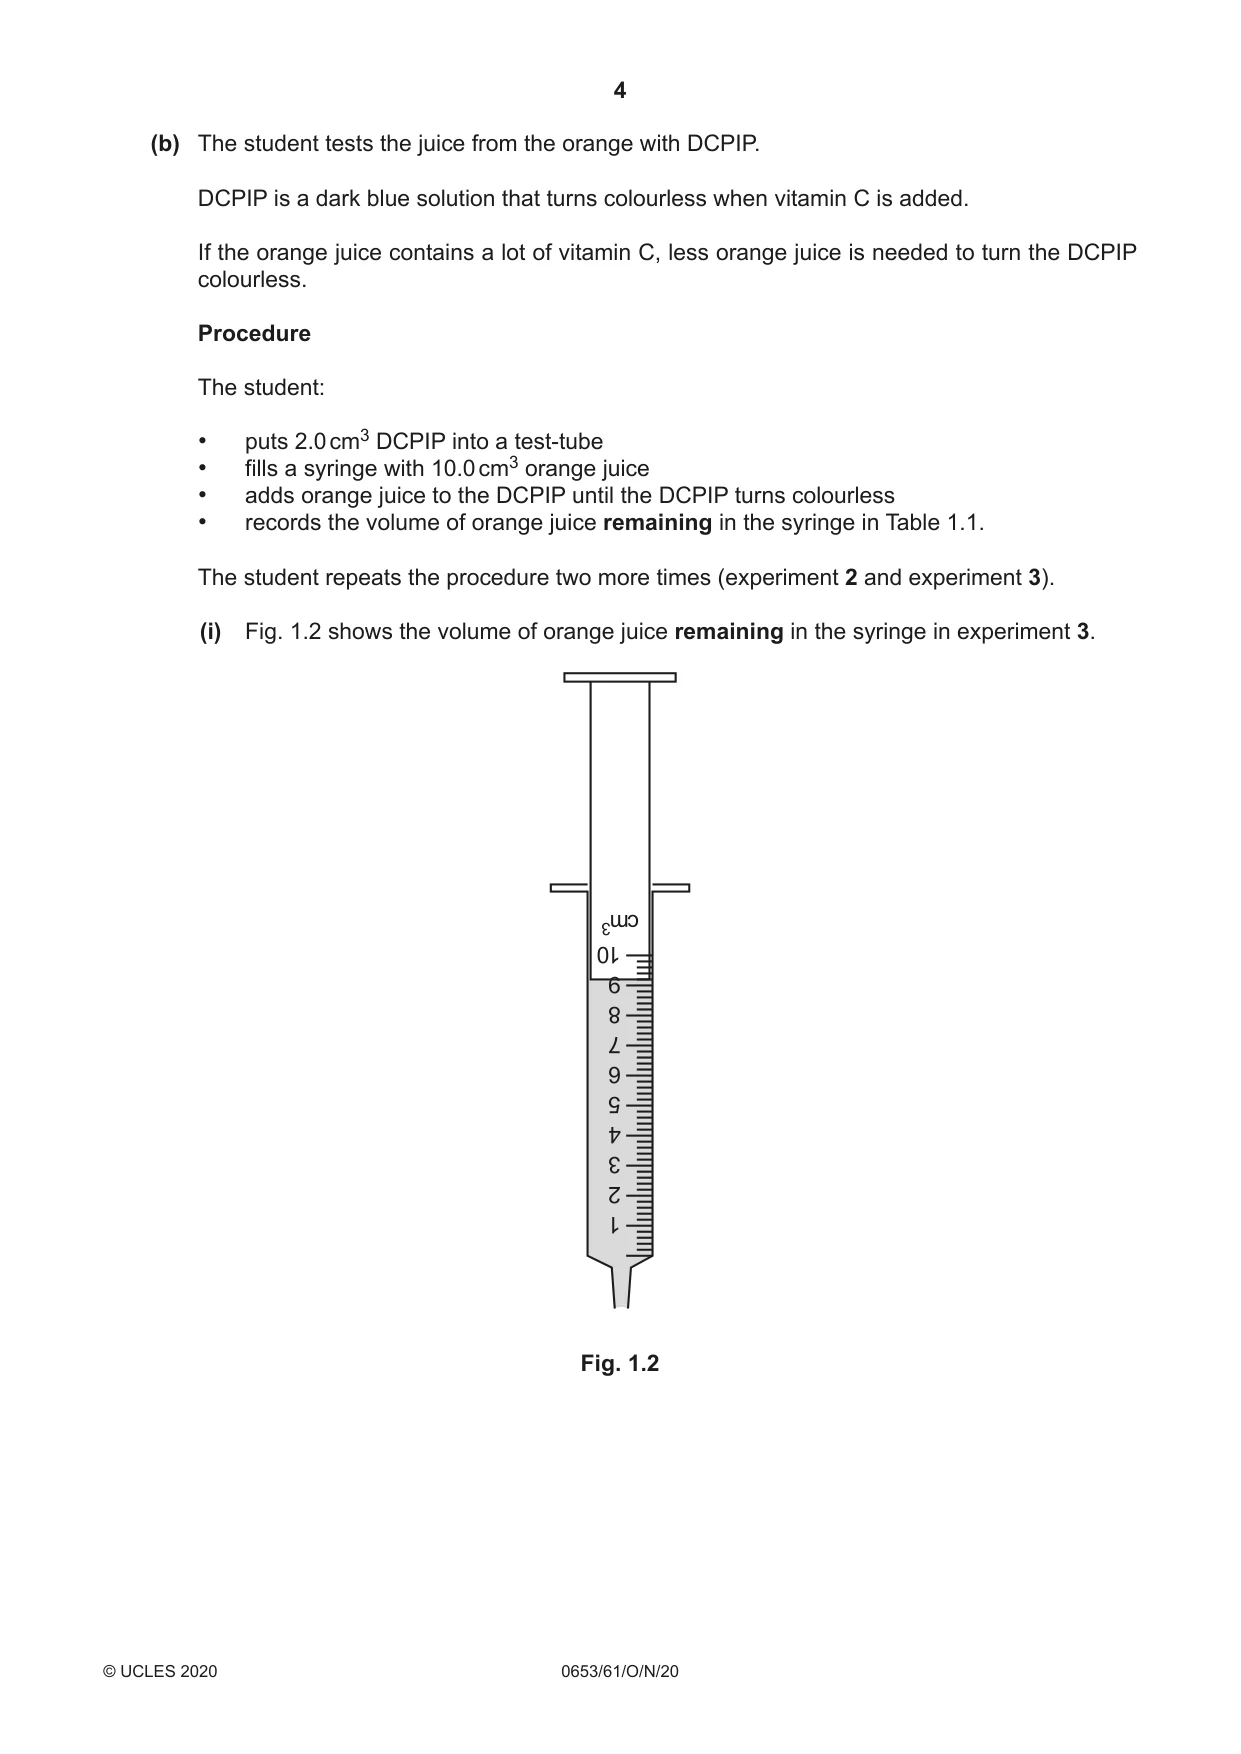
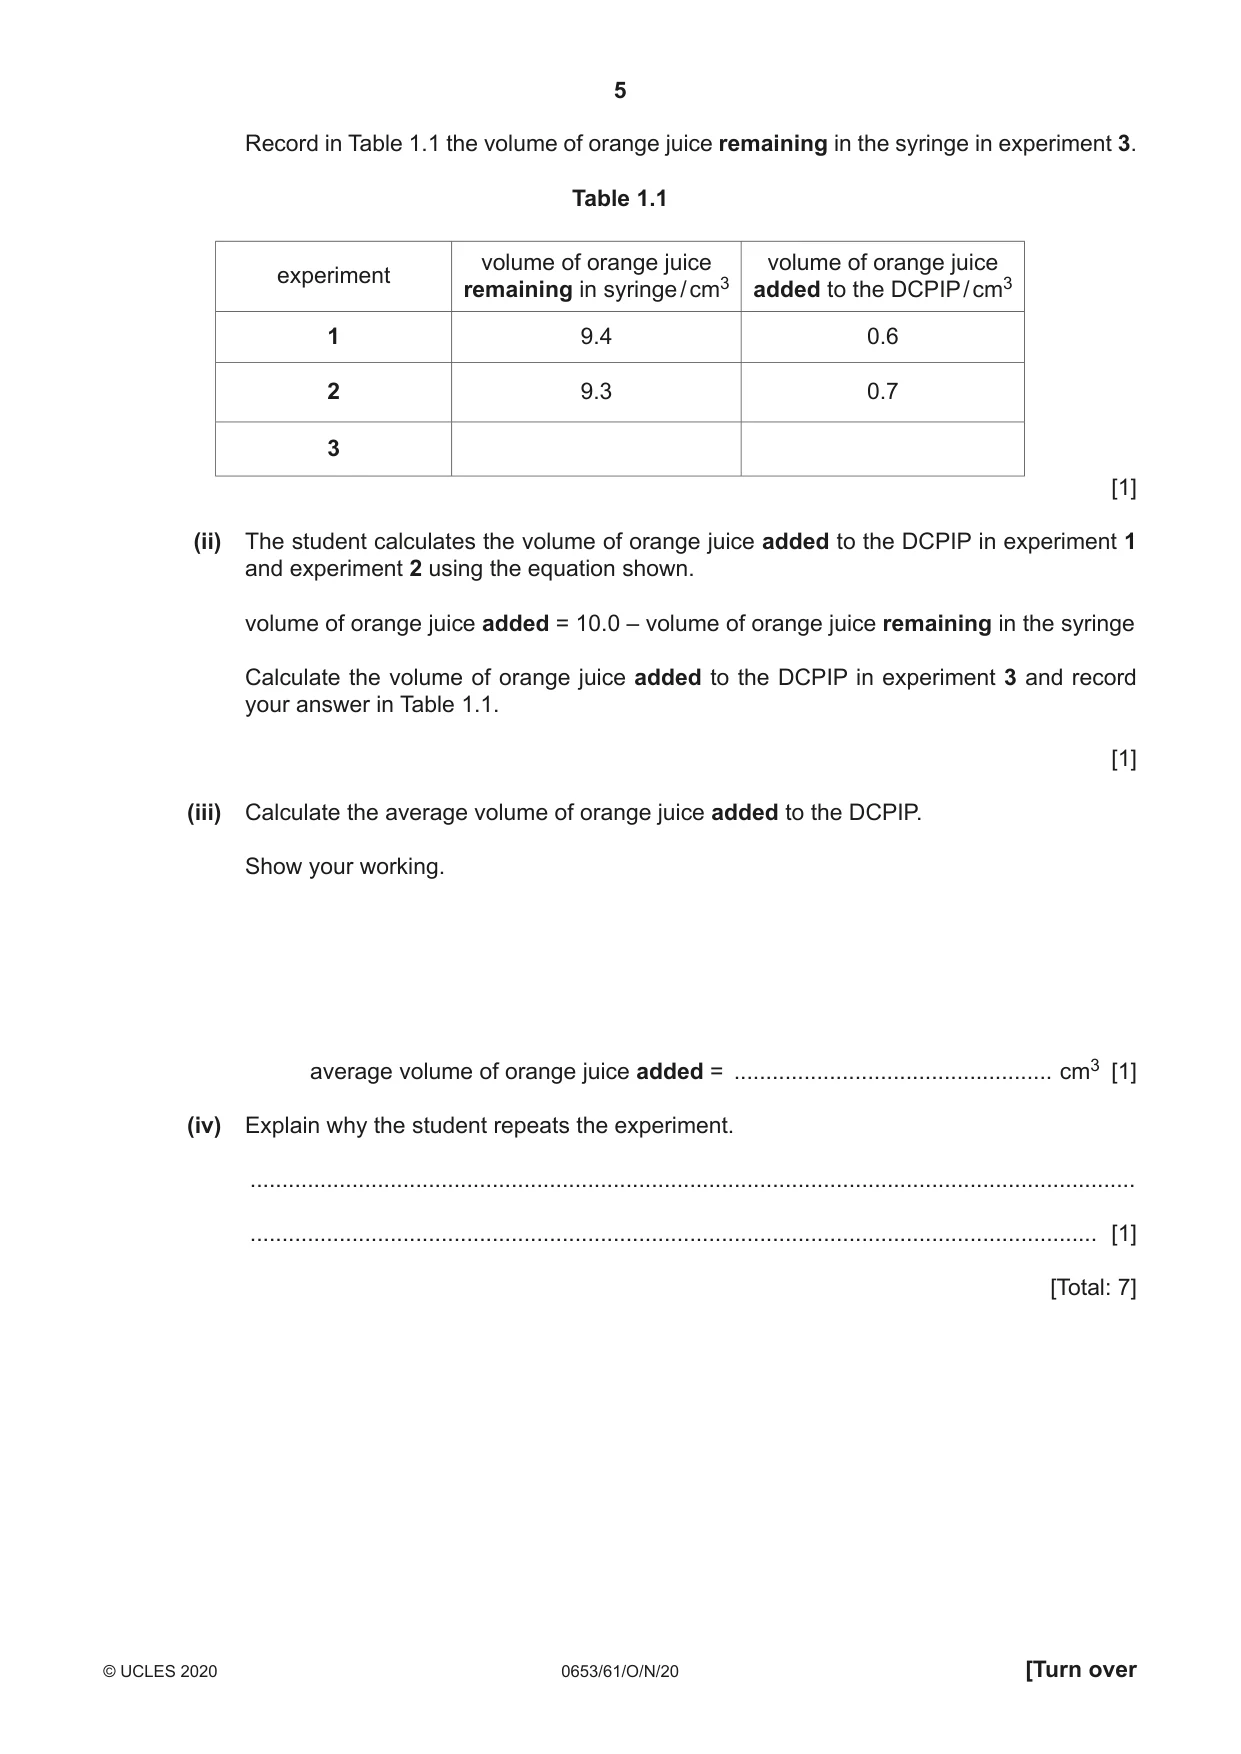
1 (a) A student investigates the amount of vitamin C in orange juice. She is given half an orange, as shown in Fig. 1.1. Fig. 1.1 In the box, make a large drawing of the orange shown in Fig. 1.1. [3] (b) The student tests the juice from the orange with DCPIP. DCPIP is a dark blue solution that turns colourless when vitamin C is added. If the orange juice contains a lot of vitamin C, less orange juice is needed to turn the DCPIP colourless. Procedure The student: • puts 2.0 cm3 DCPIP into a test-tube • fills a syringe with 10.0 cm3 orange juice • adds orange juice to the DCPIP until the DCPIP turns colourless • records the volume of orange juice remaining in the syringe in Table 1.1. The student repeats the procedure two more times (experiment 2 and experiment 3). (i) Fig. 1.2 shows the volume of orange juice remaining in the syringe in experiment 3. cm3 10 9 8 7 6 5 4 3 2 1 Fig. 1.2 Record in Table 1.1 the volume of orange juice remaining in the syringe in experiment 3. Table 1.1 volume of orange juice volume of orange juice experiment remaining in syringe / cm3 added to the DCPIP / cm3 1 9.4 0.6 2 9.3 0.7 3 [1] (ii) The student calculates the volume of orange juice added to the DCPIP in experiment 1 and experiment 2 using the equation shown. volume of orange juice added = 10.0 – volume of orange juice remaining in the syringe Calculate the volume of orange juice added to the DCPIP in experiment 3 and record your answer in Table 1.1. [1] (iii) Calculate the average volume of orange juice added to the DCPIP. Show your working. average volume of orange juice added = .................................................. cm3 [1] (iv) Explain why the student repeats the experiment. ........................................................................................................................................... ..................................................................................................................................... [1] [Total: 7]
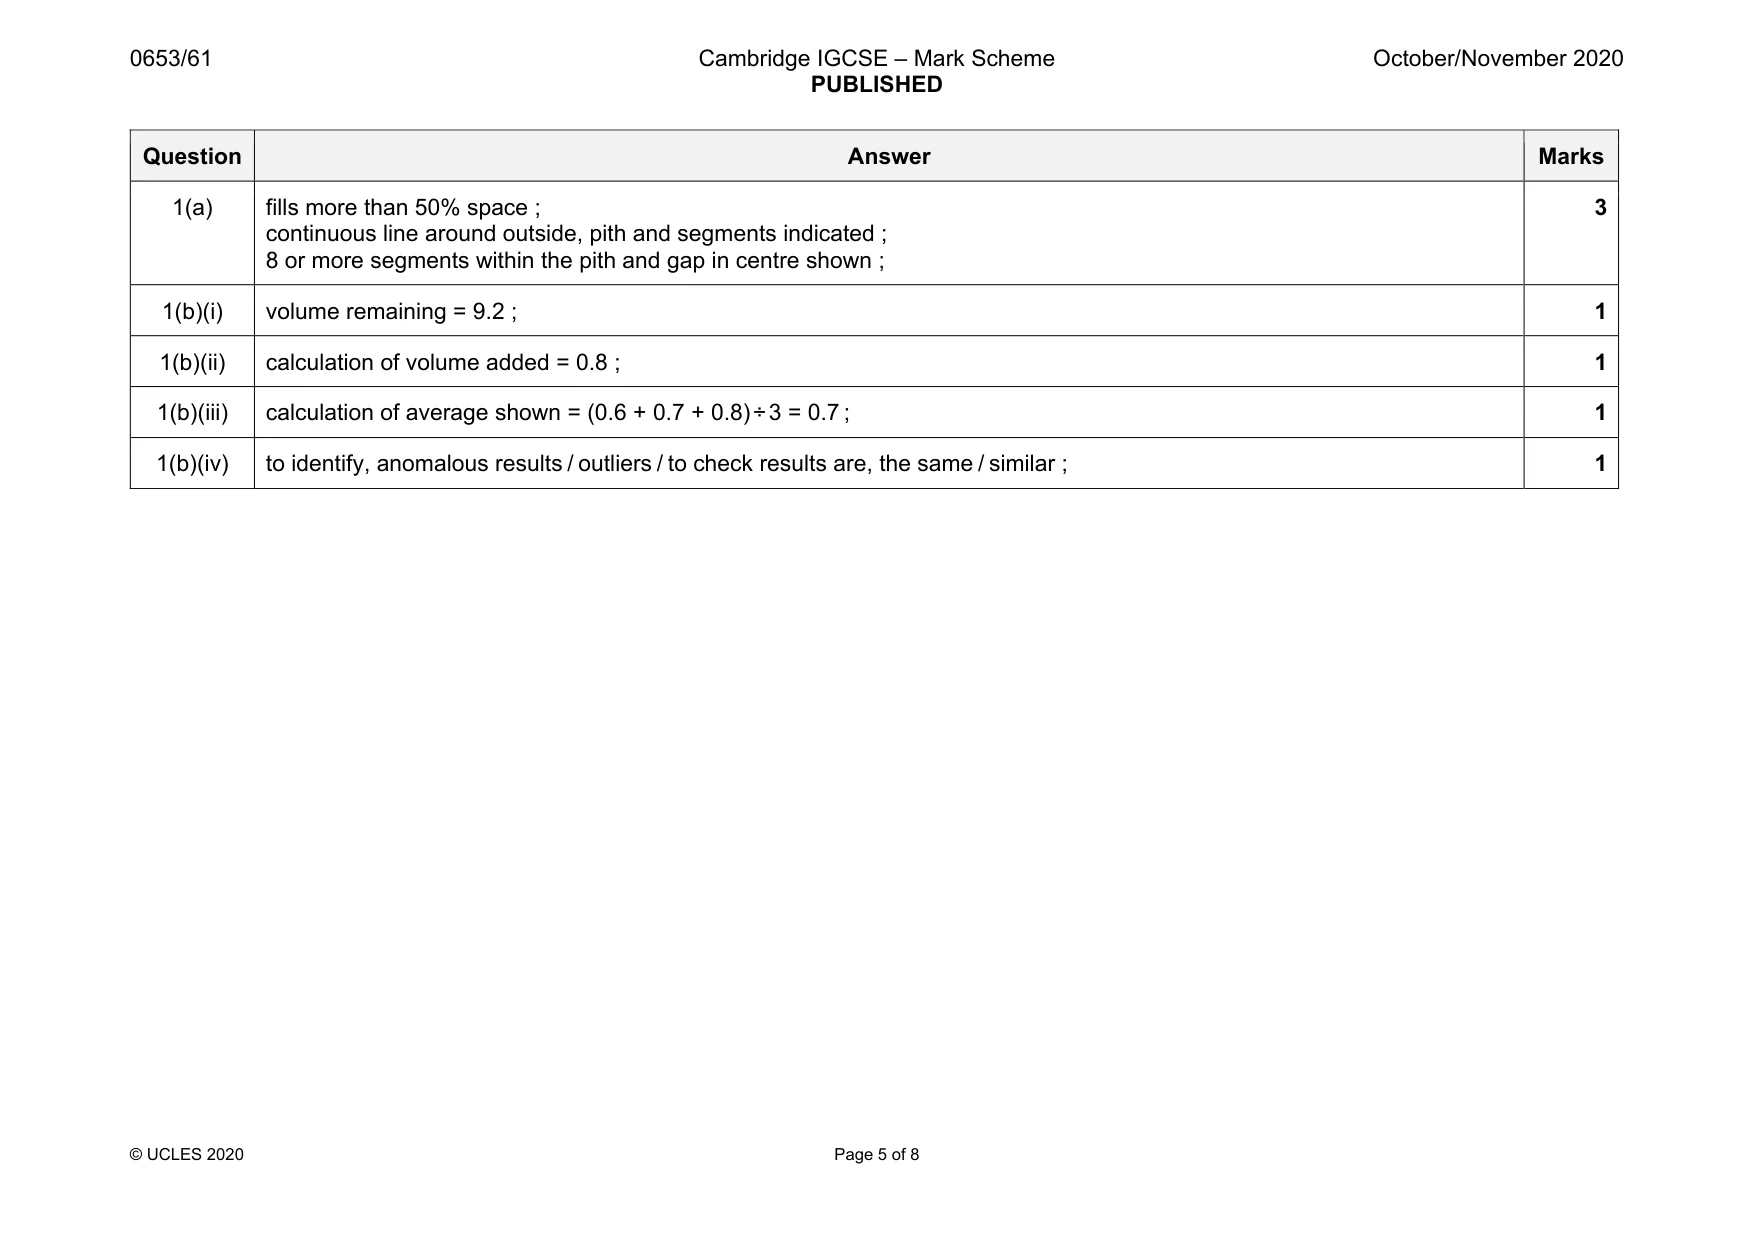
Mark scheme: 1(a) fills more than 50% space ; continuous line around outside, pith and segments indicated ; 8 or more segments within the pith and gap in centre shown ; 3 1(b)(i) volume remaining = 9.2 ; 1 1(b)(ii) calculation of volume added = 0.8 ; 1 1(b)(iii) calculation of average shown = (0.6 + 0.7 + 0.8)÷3 = 0.7 ; 1 1(b)(iv) to identify, anomalous results / outliers / to check results are, the same / similar ; 1
Q2 · A manufacturer makes two drinks, A and B, as shown in Fig
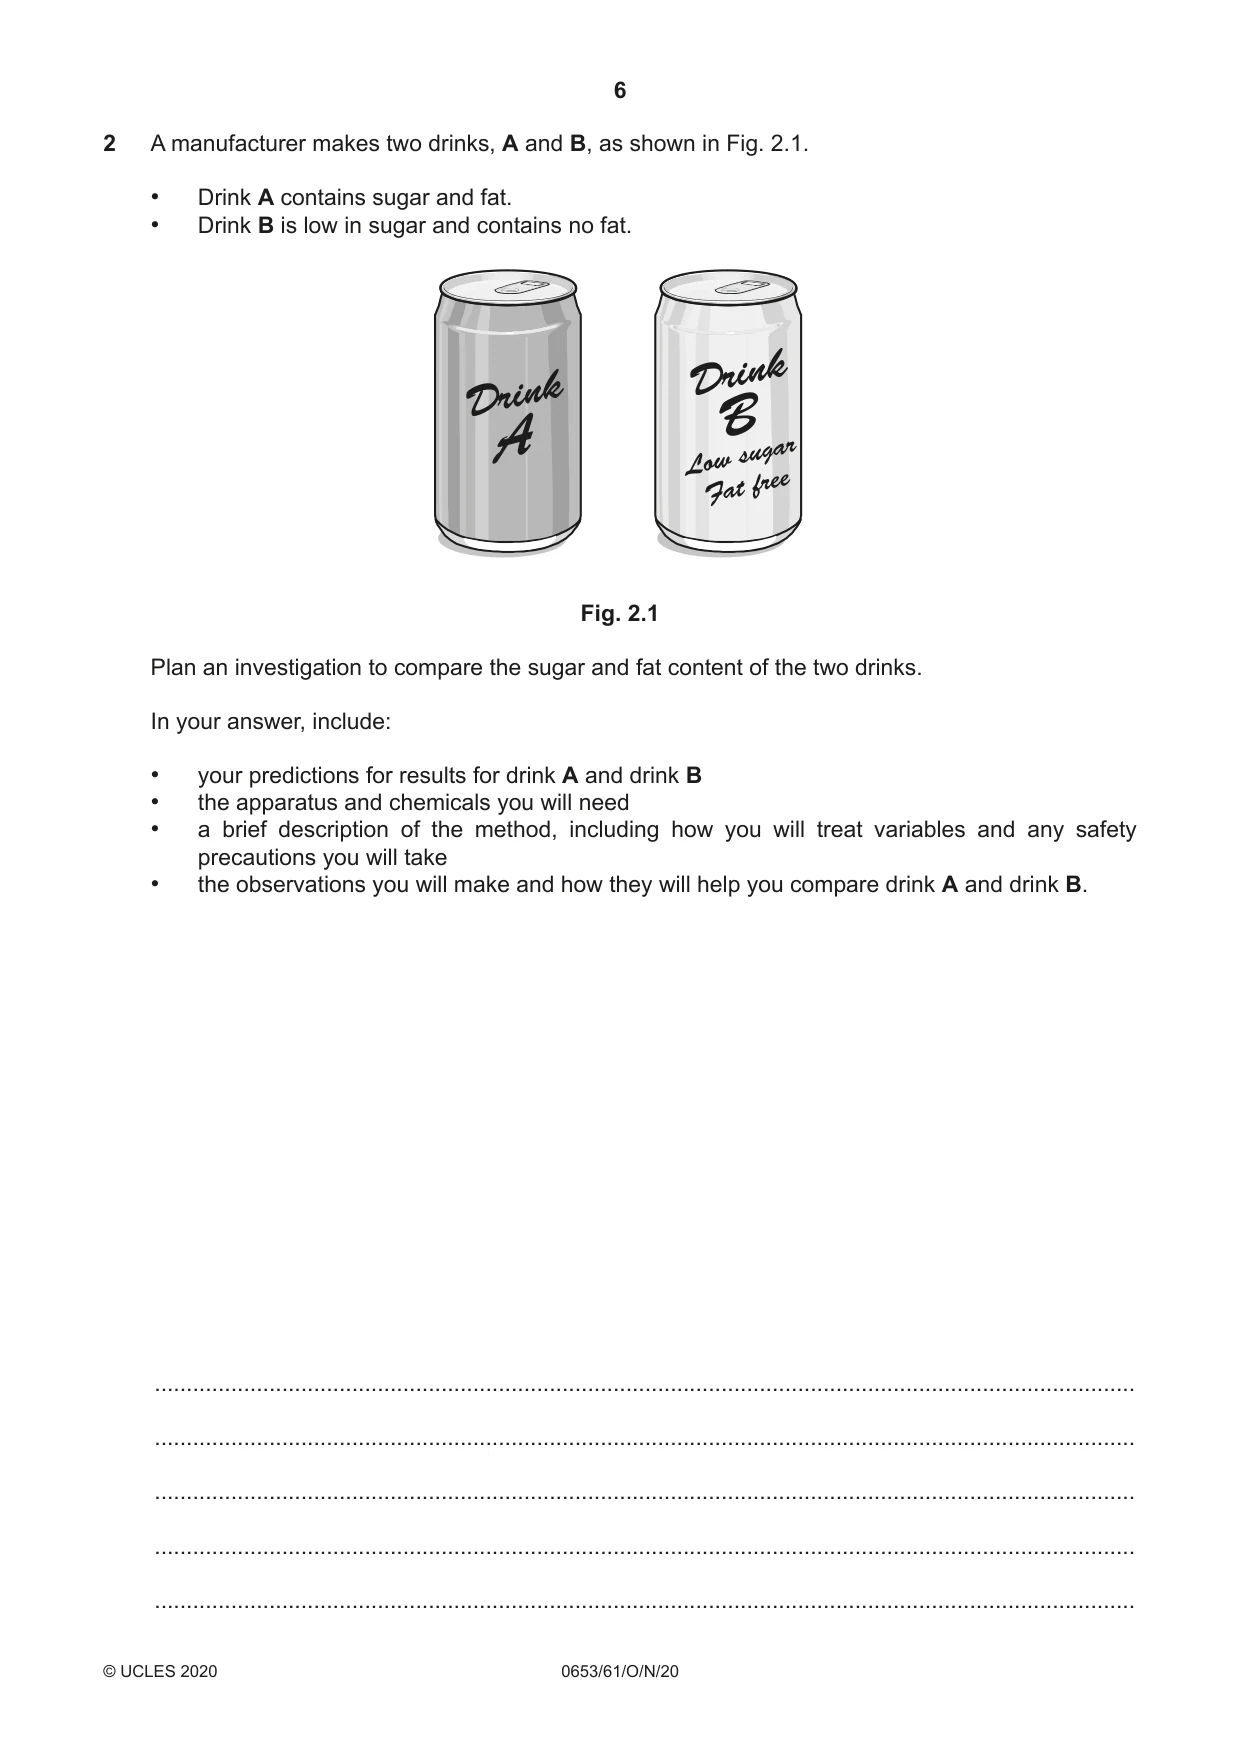
2 A manufacturer makes two drinks, A and B, as shown in Fig. 2.1. • Drink A contains sugar and fat. • Drink B is low in sugar and contains no fat. Drink Drink B A sugar Low free Fat Fig. 2.1 Plan an investigation to compare the sugar and fat content of the two drinks. In your answer, include: • your predictions for results for drink A and drink B • the apparatus and chemicals you will need • a brief description of the method, including how you will treat variables and any safety precautions you will take • the observations you will make and how they will help you compare drink A and drink B. .......................................................................................................................................................... .......................................................................................................................................................... .......................................................................................................................................................... .......................................................................................................................................................... .......................................................................................................................................................... .......................................................................................................................................................... .......................................................................................................................................................... .......................................................................................................................................................... .......................................................................................................................................................... .......................................................................................................................................................... .......................................................................................................................................................... .......................................................................................................................................................... .......................................................................................................................................................... .......................................................................................................................................................... .................................................................................................................................................... [7]
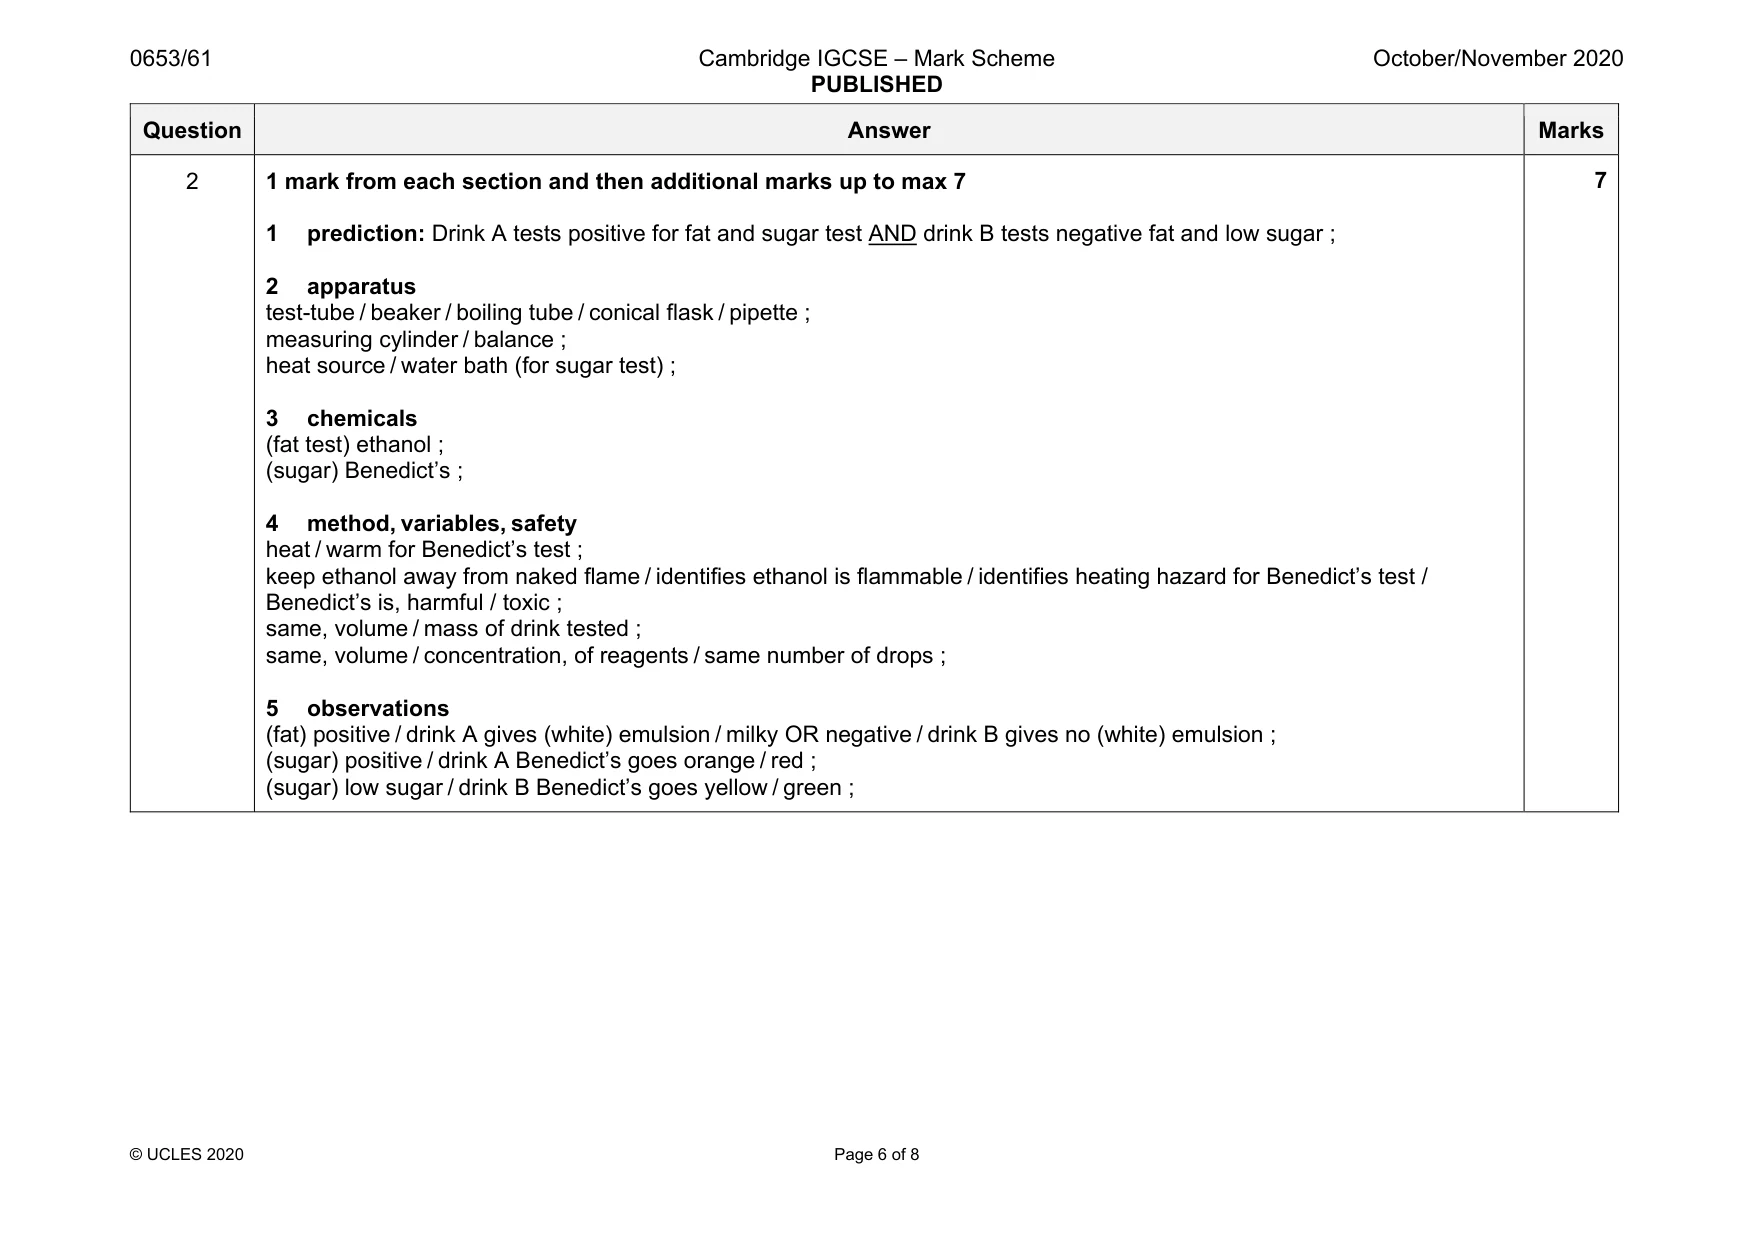
Mark scheme: 2 1 mark from each section and then additional marks up to max 7 1 prediction: Drink A tests positive for fat and sugar test AND drink B tests negative fat and low sugar ; 2 apparatus test-tube / beaker / boiling tube / conical flask / pipette ; measuring cylinder / balance ; heat source / water bath (for sugar test) ; 3 chemicals (fat test) ethanol ; (sugar) Benedict’s ; 4 method, variables, safety heat / warm for Benedict’s test ; keep ethanol away from naked flame / identifies ethanol is flammable / identifies heating hazard for Benedict’s test / Benedict’s is, harmful / toxic ; same, volume / mass of drink tested ; same, volume / concentration, of reagents / same number of drops ; 5 observations (fat) positive / drink A gives (white) emulsion / milky OR negative / drink B gives no (white) emulsion ; (sugar) positive / drink A Benedict’s goes orange / red ; (sugar) low sugar / drink B Benedict’s goes yellow / green ;
Q3 · When magnesium ribbon is added to hydrochloric acid, bubbles of hydrogen gas are produced
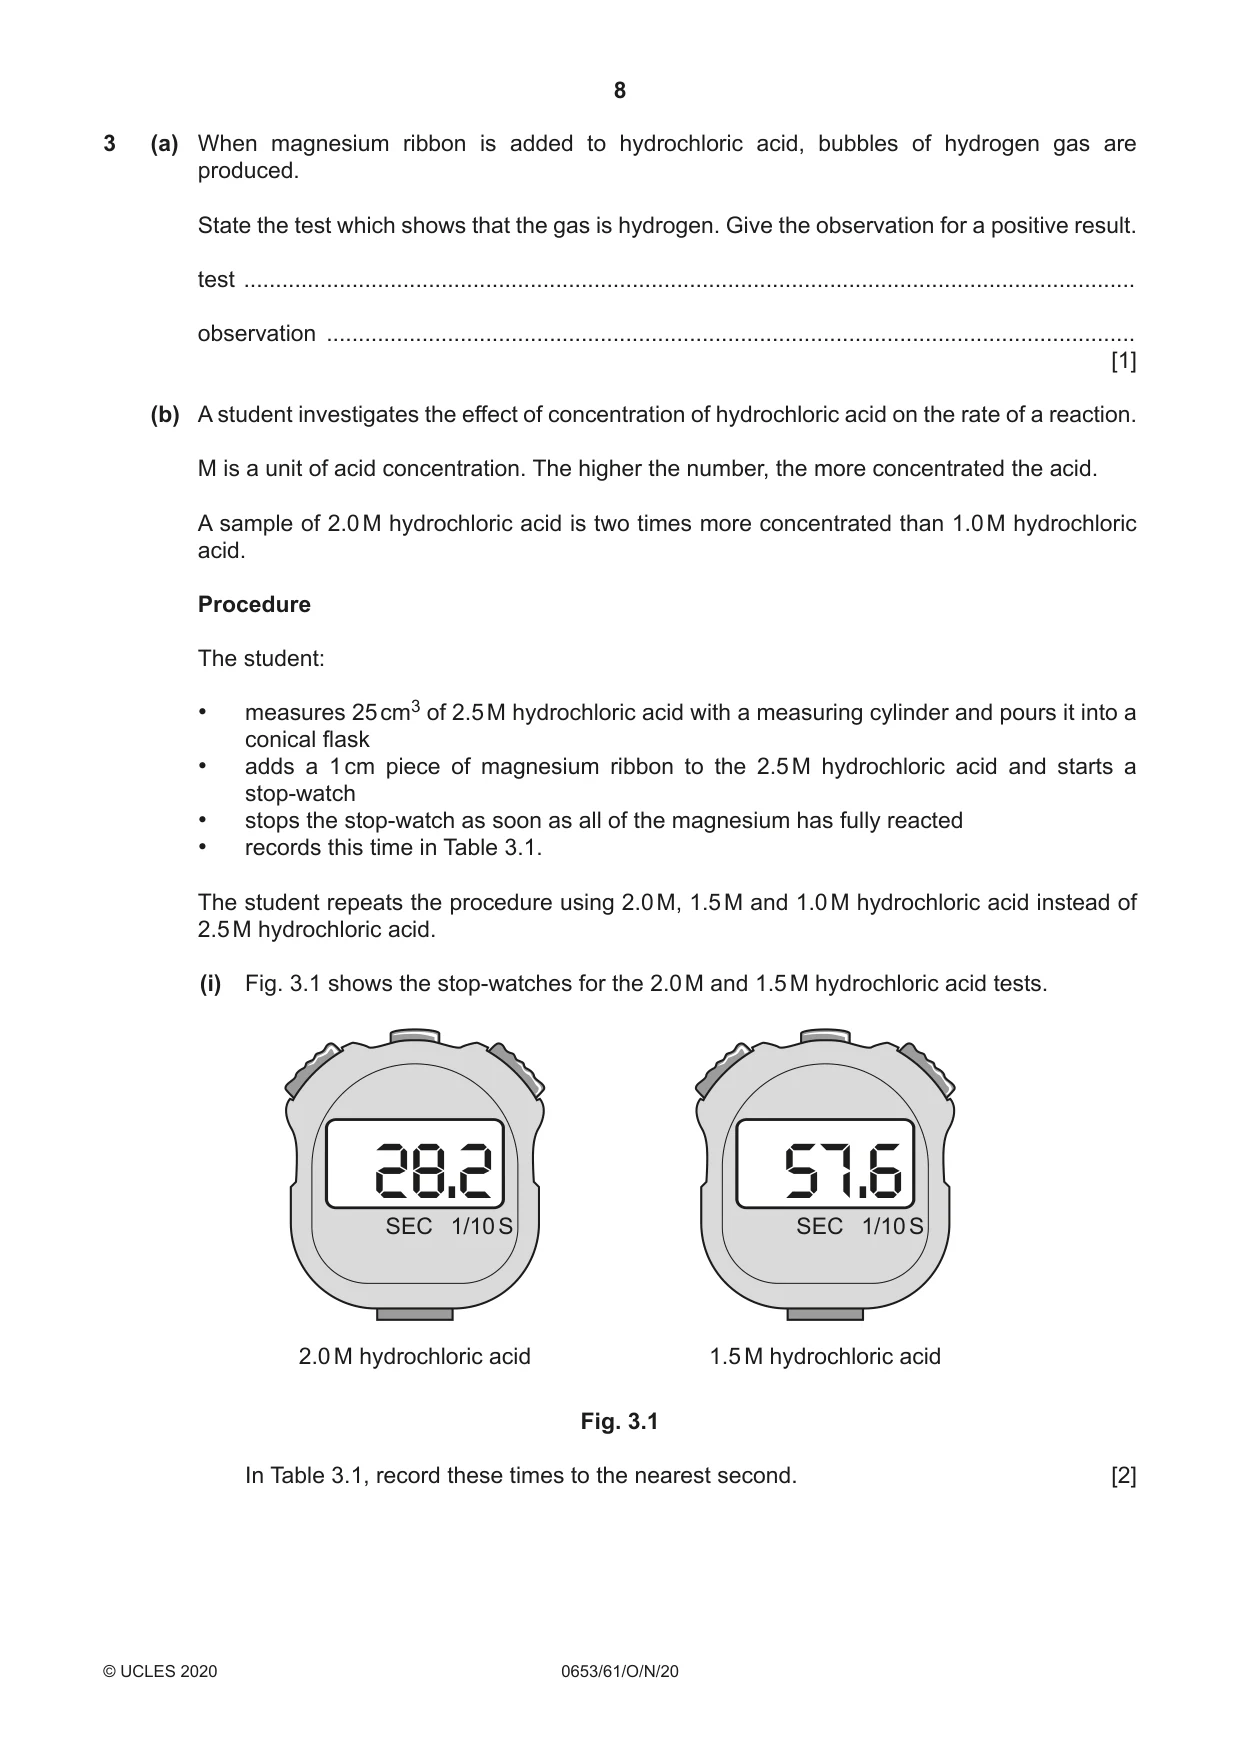
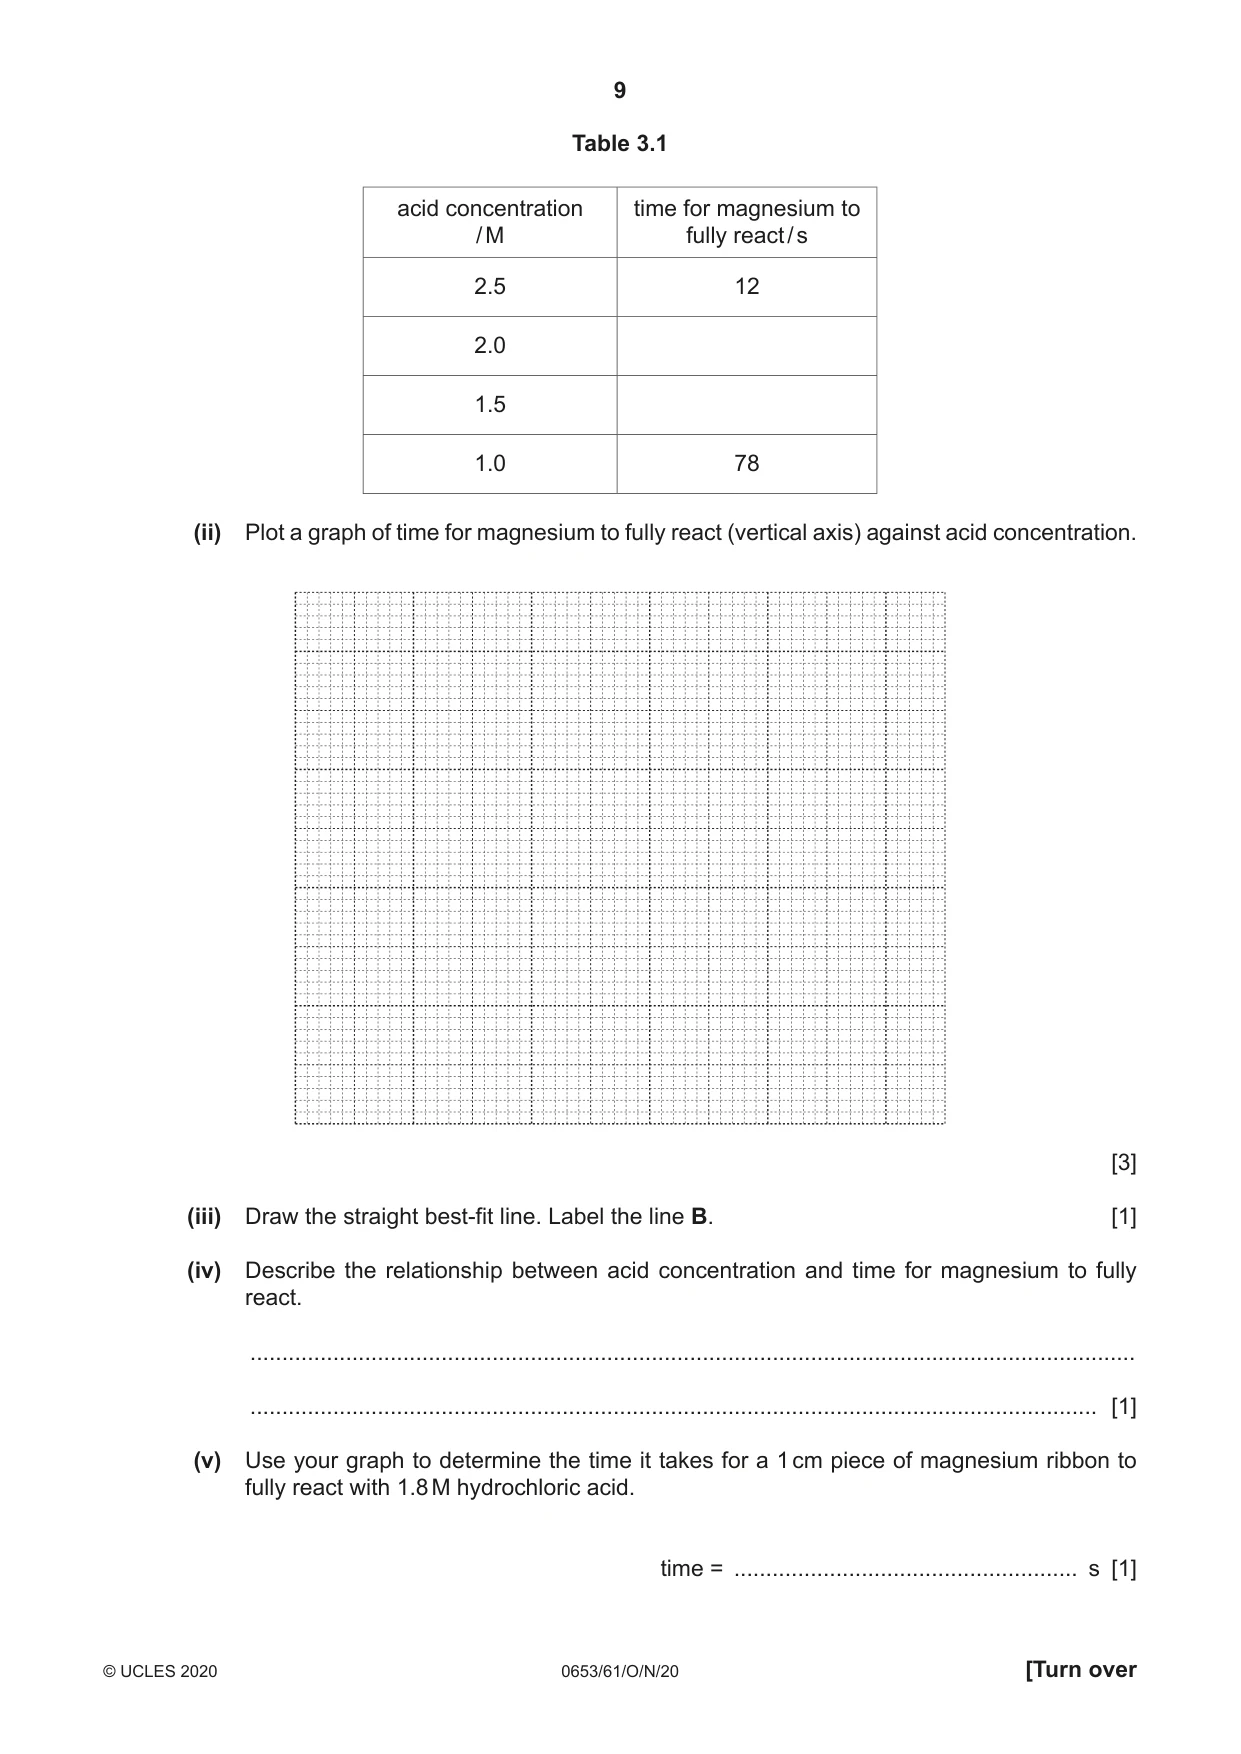
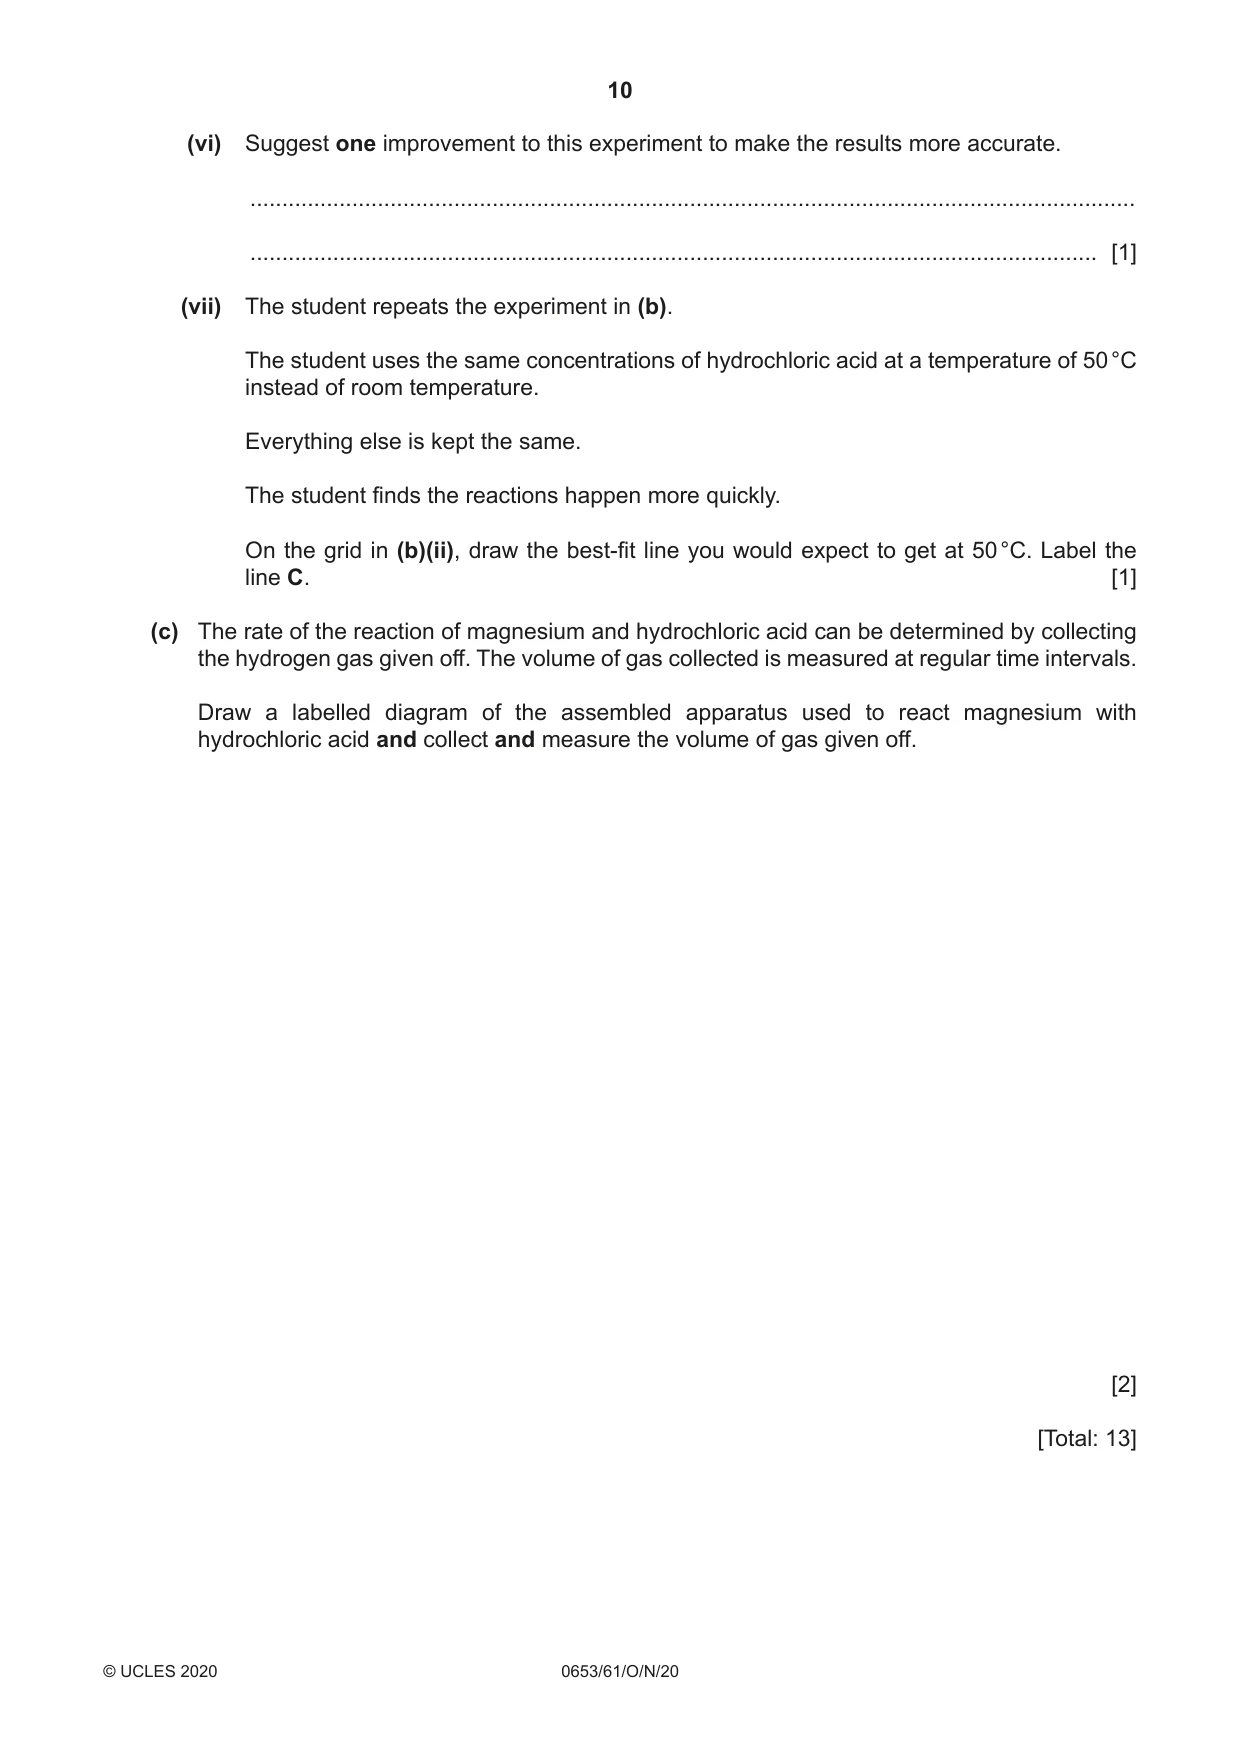
3 (a) When magnesium ribbon is added to hydrochloric acid, bubbles of hydrogen gas are produced. State the test which shows that the gas is hydrogen. Give the observation for a positive result. test ............................................................................................................................................ observation ............................................................................................................................... [1] (b) A student investigates the effect of concentration of hydrochloric acid on the rate of a reaction. M is a unit of acid concentration. The higher the number, the more concentrated the acid. A sample of 2.0 M hydrochloric acid is two times more concentrated than 1.0 M hydrochloric acid. Procedure The student: • measures 25 cm3 of 2.5 M hydrochloric acid with a measuring cylinder and pours it into a conical flask • adds a 1 cm piece of magnesium ribbon to the 2.5 M hydrochloric acid and starts a stop-watch • stops the stop-watch as soon as all of the magnesium has fully reacted • records this time in Table 3.1. The student repeats the procedure using 2.0 M, 1.5 M and 1.0 M hydrochloric acid instead of 2.5 M hydrochloric acid. (i) Fig. 3.1 shows the stop-watches for the 2.0 M and 1.5 M hydrochloric acid tests. 28.2 57.6 SEC 1/10 S SEC 1/10 S 2.0 M hydrochloric acid 1.5 M hydrochloric acid Fig. 3.1 In Table 3.1, record these times to the nearest second. [2] Table 3.1 acid concentration time for magnesium to / M fully react / s 2.5 12 2.0 1.5 1.0 78 (ii) Plot a graph of time for magnesium to fully react (vertical axis) against acid concentration. [3] (iii) Draw the straight best-fit line. Label the line B. [1] (iv) Describe the relationship between acid concentration and time for magnesium to fully react. ........................................................................................................................................... ..................................................................................................................................... [1] (v) Use your graph to determine the time it takes for a 1 cm piece of magnesium ribbon to fully react with 1.8 M hydrochloric acid. time = ...................................................... s [1] (vi) Suggest one improvement to this experiment to make the results more accurate. ........................................................................................................................................... ..................................................................................................................................... [1] (vii) The student repeats the experiment in (b). The student uses the same concentrations of hydrochloric acid at a temperature of 50 °C instead of room temperature. Everything else is kept the same. The student finds the reactions happen more quickly. On the grid in (b)(ii), draw the best-fit line you would expect to get at 50 °C. Label the line C. [1] (c) The rate of the reaction of magnesium and hydrochloric acid can be determined by collecting the hydrogen gas given off. The volume of gas collected is measured at regular time intervals. Draw a labelled diagram of the assembled apparatus used to react magnesium with hydrochloric acid and collect and measure the volume of gas given off. [2] [Total: 13]
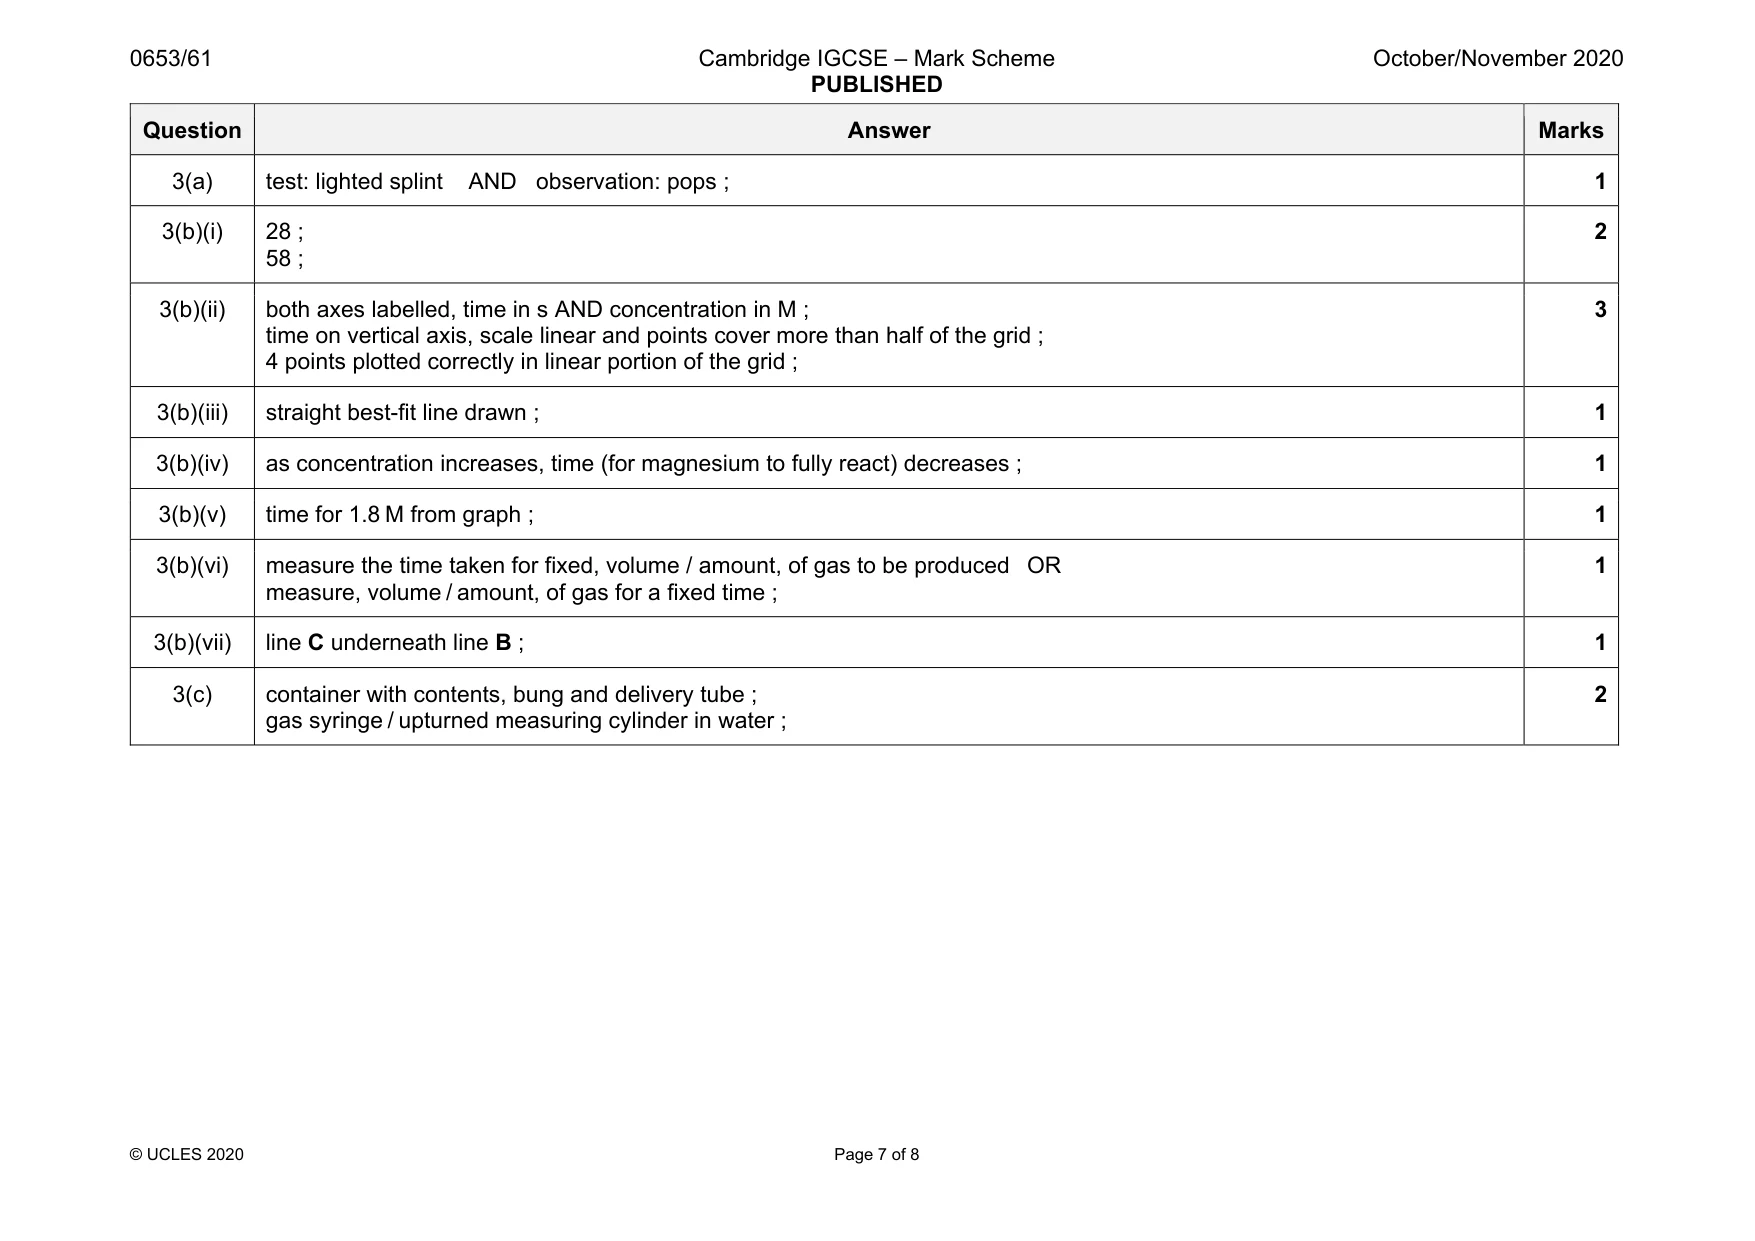
Mark scheme: 3(a) test: lighted splint AND observation: pops ; 1 3(b)(i) 28 ; 58 ; 2 3(b)(ii) both axes labelled, time in s AND concentration in M ; time on vertical axis, scale linear and points cover more than half of the grid ; 4 points plotted correctly in linear portion of the grid ; 3 3(b)(iii) straight best-fit line drawn ; 1 3(b)(iv) as concentration increases, time (for magnesium to fully react) decreases ; 1 3(b)(v) time for 1.8 M from graph ; 1 3(b)(vi) measure the time taken for fixed, volume / amount, of gas to be produced OR measure, volume / amount, of gas for a fixed time ; 1 3(b)(vii) line C underneath line B ; 1 3(c) container with contents, bung and delivery tube ; gas syringe / upturned measuring cylinder in water ; 2
Q4 · A student determines the density of a glass block
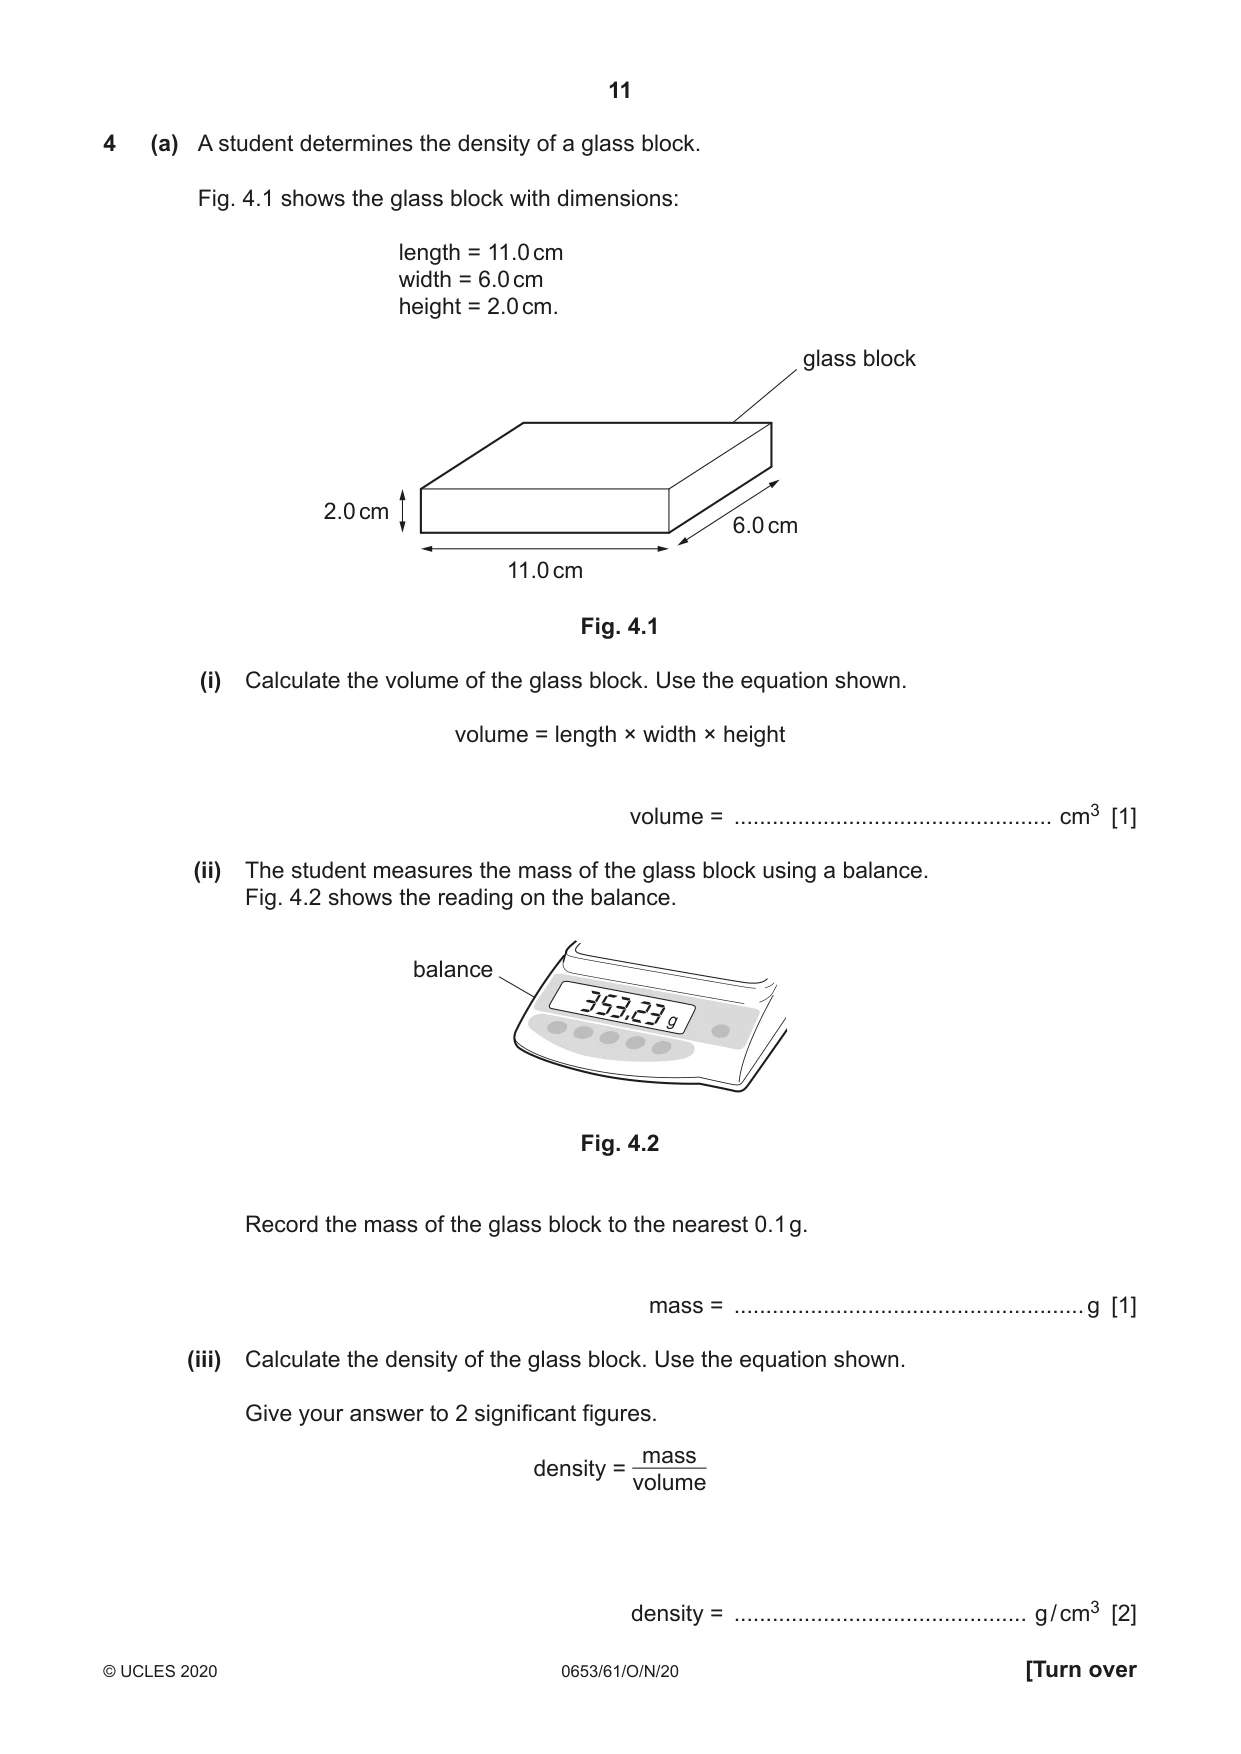
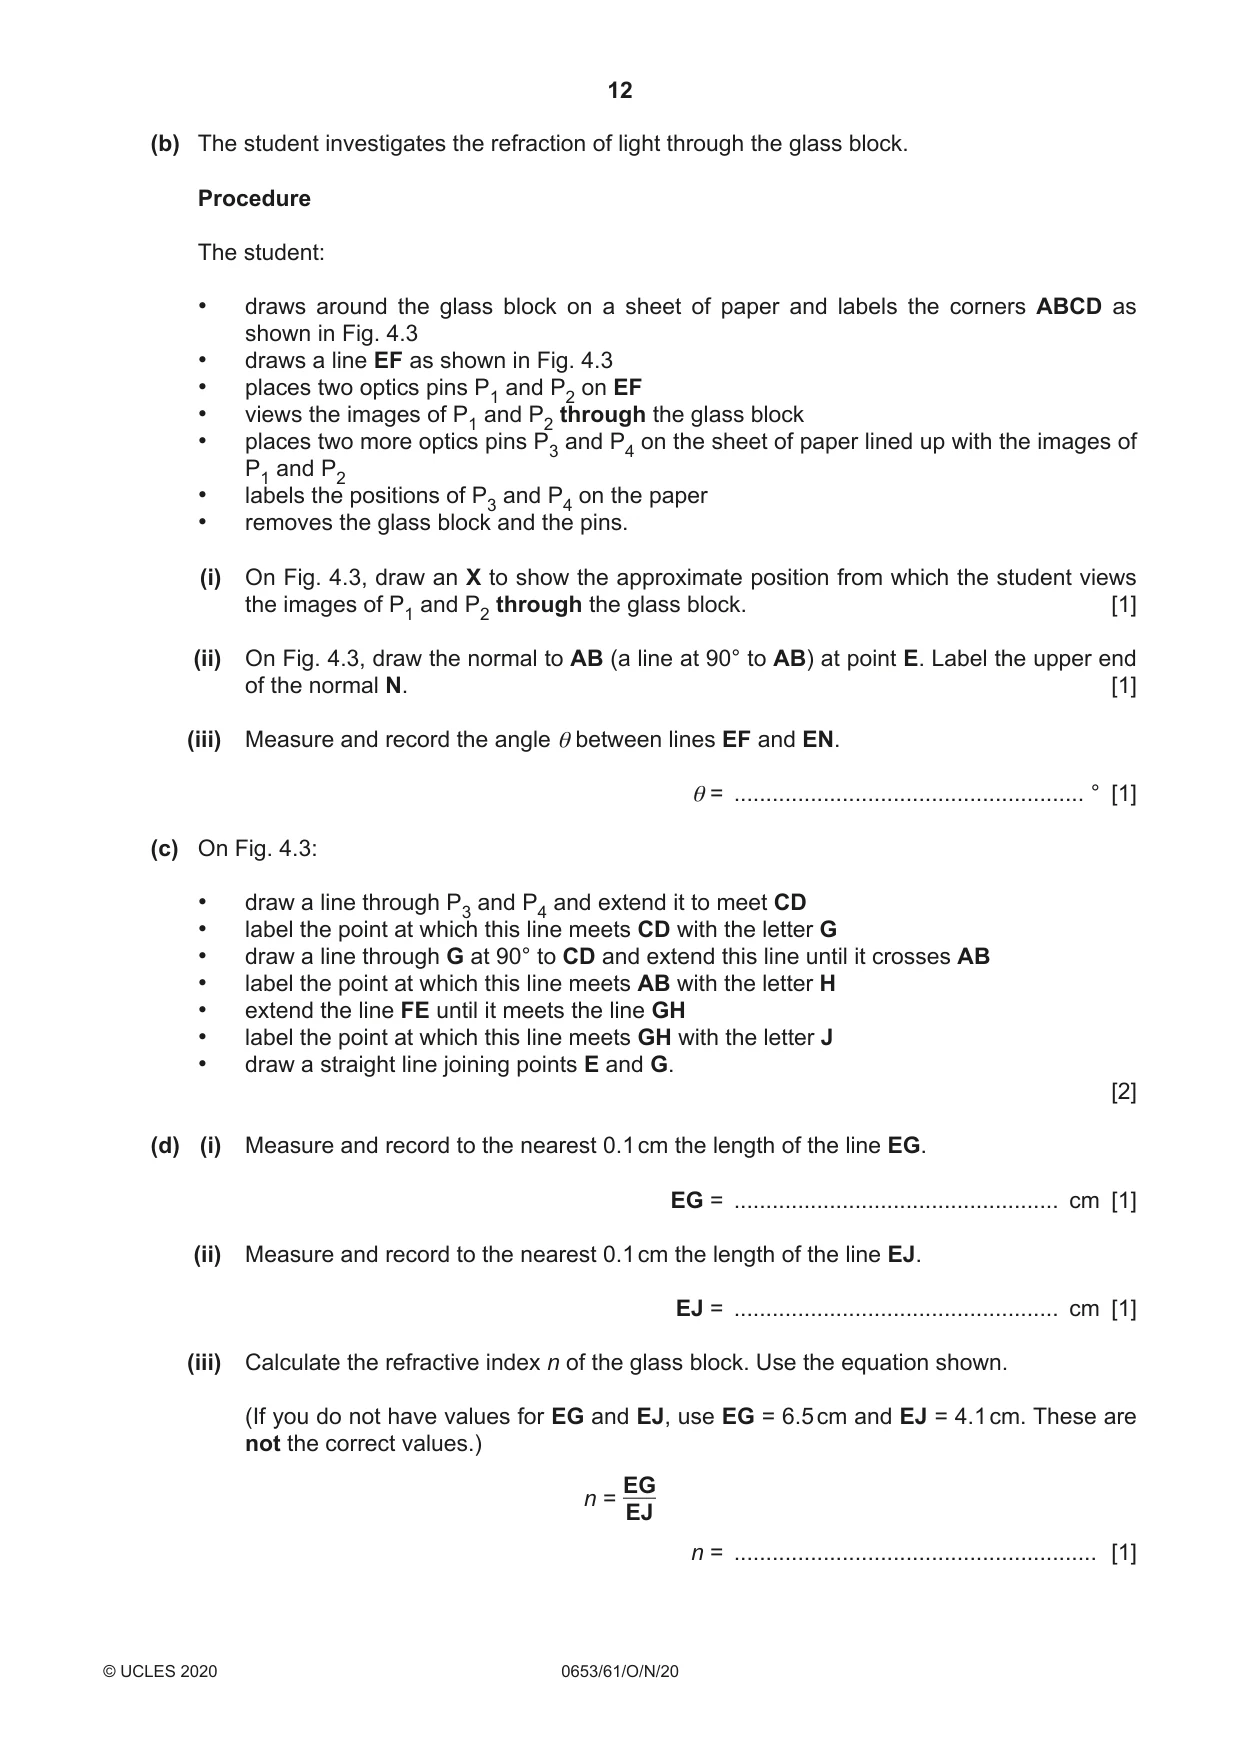
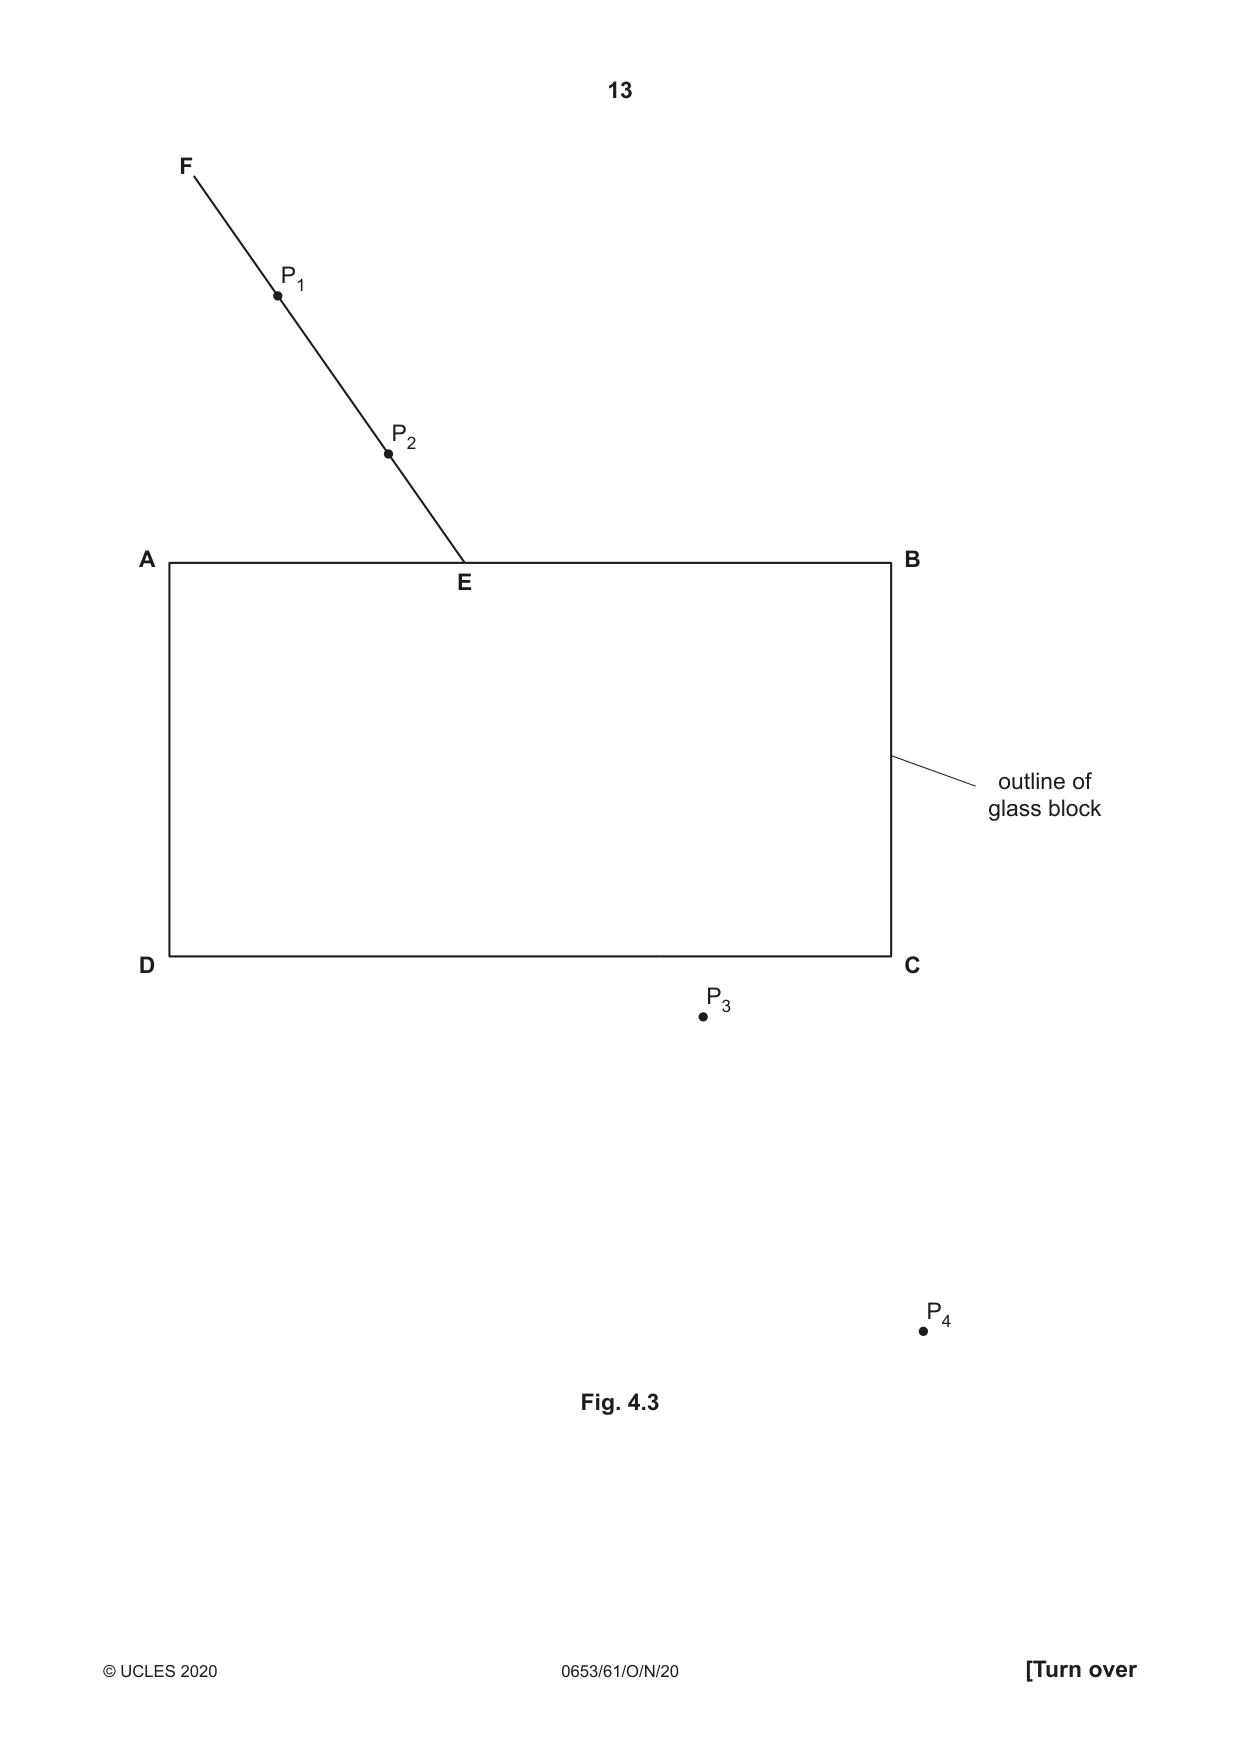
4 (a) A student determines the density of a glass block. Fig. 4.1 shows the glass block with dimensions: length = 11.0 cm width = 6.0 cm height = 2.0 cm. glass block 2.0 cm 6.0 cm 11.0 cm Fig. 4.1 (i) Calculate the volume of the glass block. Use the equation shown. volume = length × width × height volume = .................................................. cm3 [1] (ii) The student measures the mass of the glass block using a balance. Fig. 4.2 shows the reading on the balance. balance 353.23 Fig. 4.2 Record the mass of the glass block to the nearest 0.1 g. mass = .......................................................g [1] (iii) Calculate the density of the glass block. Use the equation shown. Give your answer to 2 significant figures. mass density = volume density = .............................................. g / cm3 [2] (b) The student investigates the refraction of light through the glass block. Procedure The student: • draws around the glass block on a sheet of paper and labels the corners ABCD as shown in Fig. 4.3 • draws a line EF as shown in Fig. 4.3 • places two optics pins P1 and P2 on EF • views the images of P1 and P2 through the glass block • places two more optics pins P3 and P4 on the sheet of paper lined up with the images of P1 and P2 • labels the positions of P3 and P4 on the paper • removes the glass block and the pins. (i) On Fig. 4.3, draw an X to show the approximate position from which the student views the images of P1 and P2 through the glass block. [1] (ii) On Fig. 4.3, draw the normal to AB (a line at 90° to AB) at point E. Label the upper end of the normal N. [1] (iii) Measure and record the angle θ between lines EF and EN. θ = ....................................................... ° [1] (c) On Fig. 4.3: • draw a line through P3 and P4 and extend it to meet CD • label the point at which this line meets CD with the letter G • draw a line through G at 90° to CD and extend this line until it crosses AB • label the point at which this line meets AB with the letter H • extend the line FE until it meets the line GH • label the point at which this line meets GH with the letter J • draw a straight line joining points E and G. [2] (d) (i) Measure and record to the nearest 0.1 cm the length of the line EG. EG = ................................................... cm [1] (ii) Measure and record to the nearest 0.1 cm the length of the line EJ. EJ = ................................................... cm [1] (iii) Calculate the refractive index n of the glass block. Use the equation shown. (If you do not have values for EG and EJ, use EG = 6.5 cm and EJ = 4.1 cm. These are not the correct values.) EG n = EJ n = ......................................................... [1] F P1 P2 A B E outline of glass block D C P3 P4 Fig. 4.3
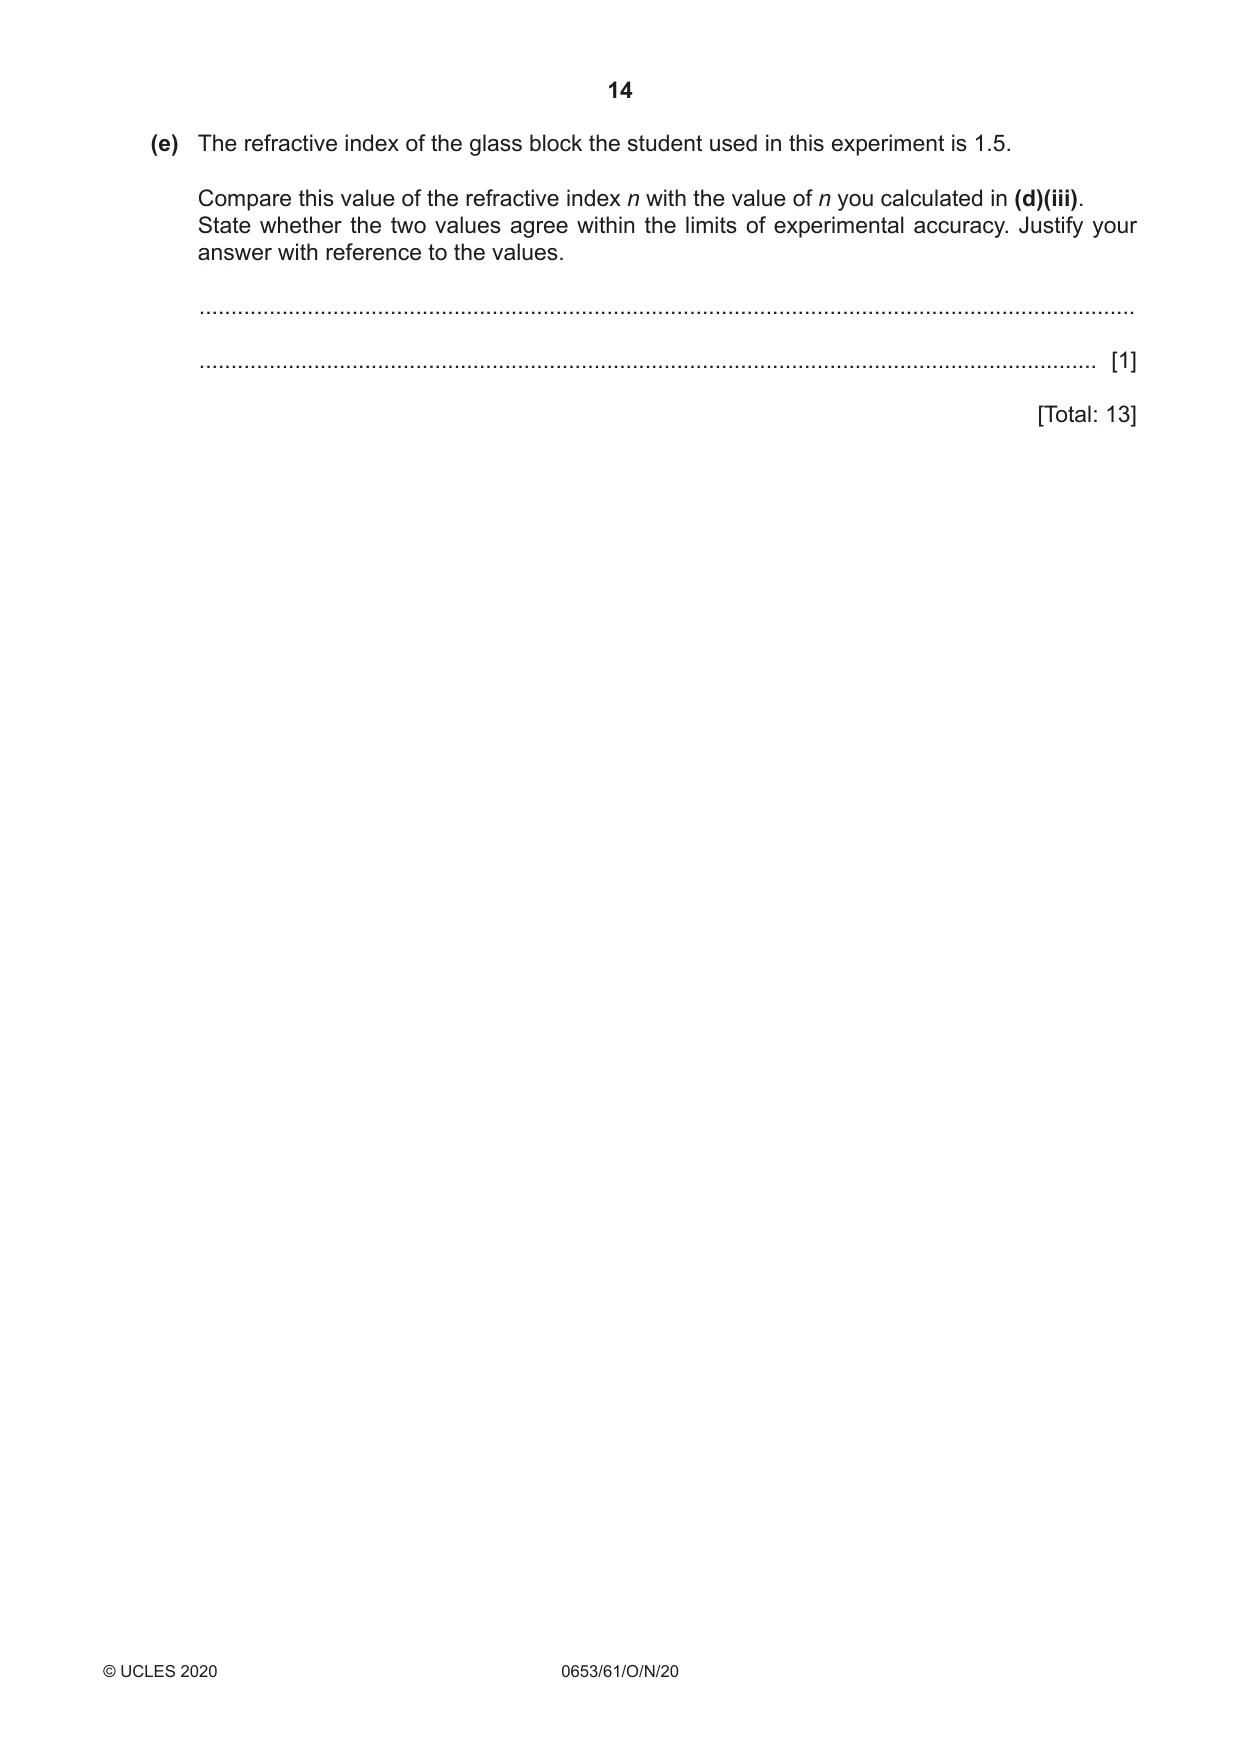
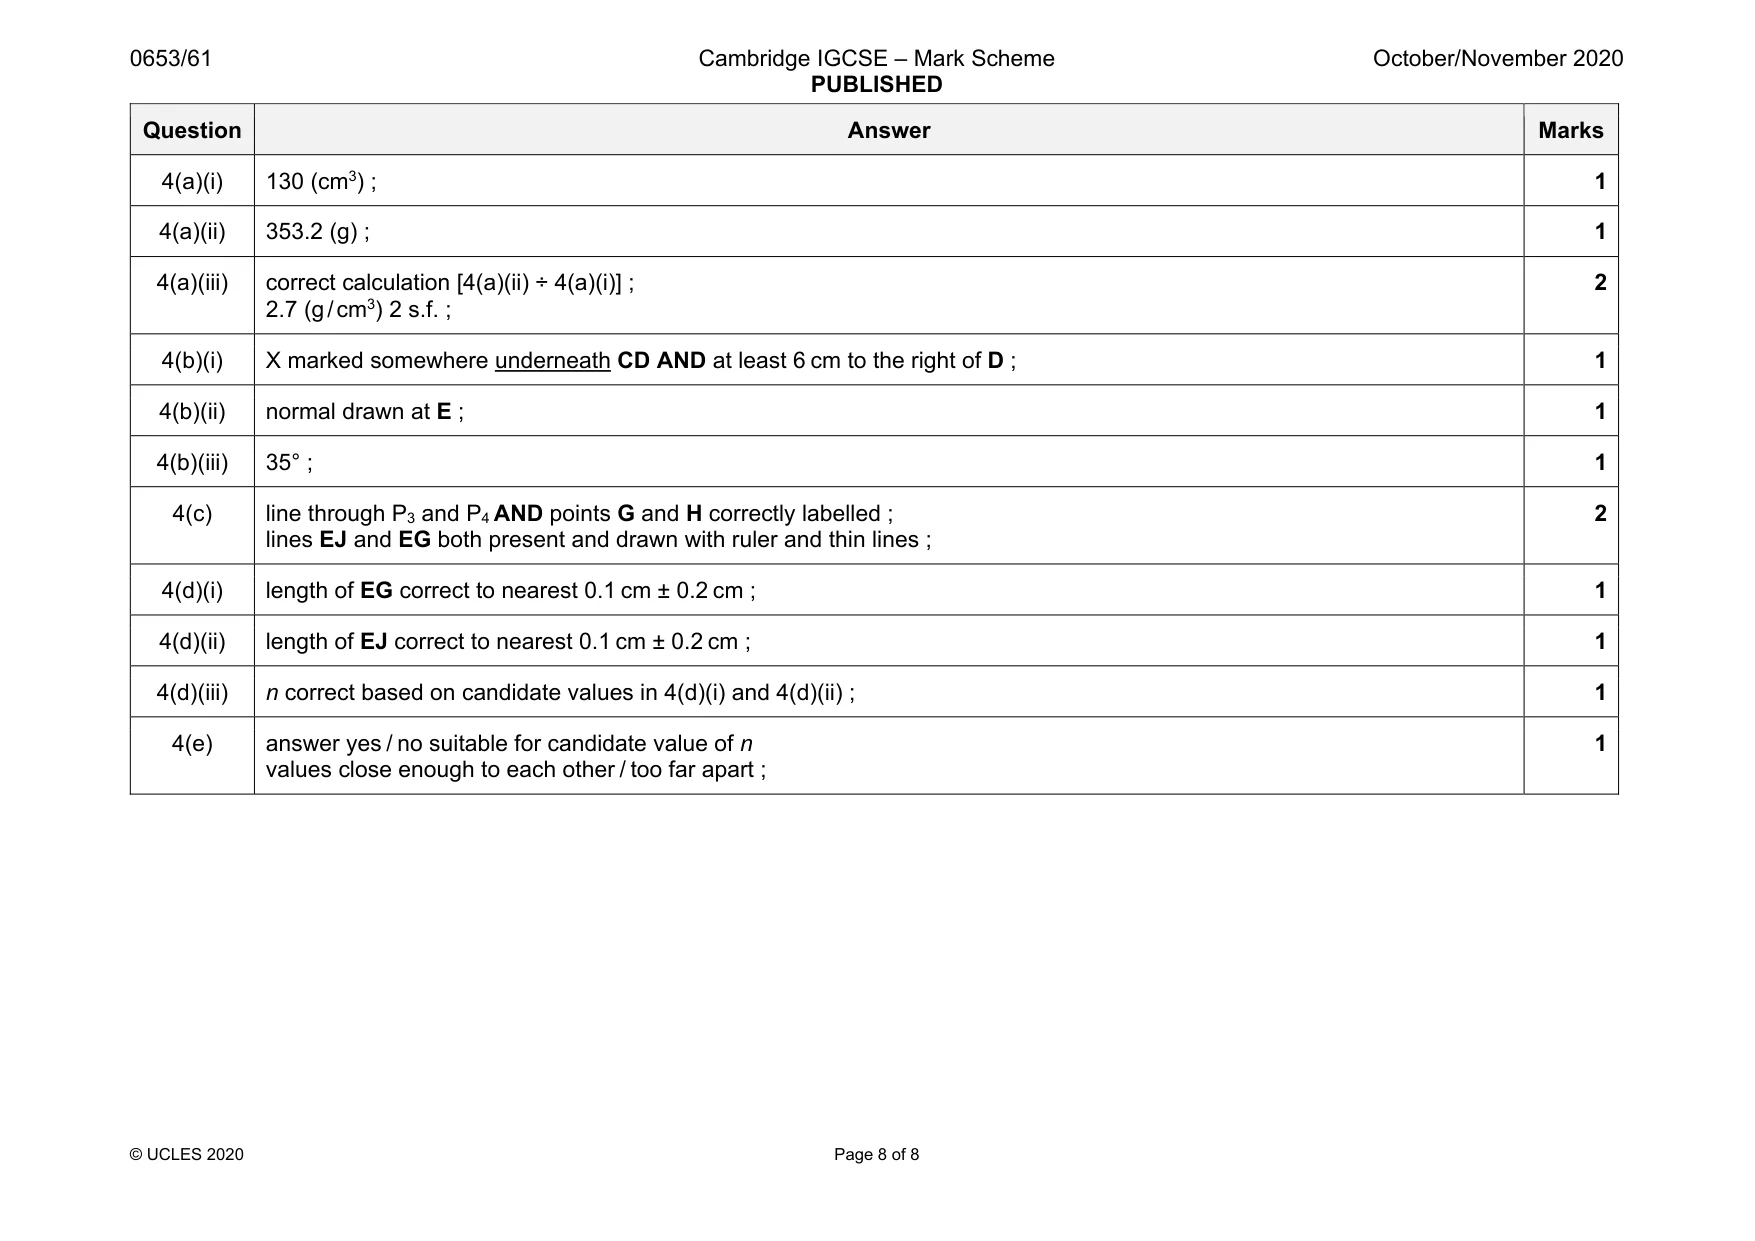
Mark scheme: 4(a)(i) 130 (cm3) ; 1 4(a)(ii) 353.2 (g) ; 1 4(a)(iii) correct calculation [4(a)(ii) ÷ 4(a)(i)] ; 2.7 (g / cm3) 2 s.f. ; 2 4(b)(i) X marked somewhere underneath CD AND at least 6 cm to the right of D ; 1 4(b)(ii) normal drawn at E ; 1 4(b)(iii) 35° ; 1 4(c) line through P3 and P4 AND points G and H correctly labelled ; lines EJ and EG both present and drawn with ruler and thin lines ; 2 4(d)(i) length of EG correct to nearest 0.1 cm ± 0.2 cm ; 1 4(d)(ii) length of EJ correct to nearest 0.1 cm ± 0.2 cm ; 1 4(d)(iii) n correct based on candidate values in 4(d)(i) and 4(d)(ii) ; 1 4(e) answer yes / no suitable for candidate value of n values close enough to each other / too far apart ; 1
What was in this paper
The subtopics covered by these 4 questions, and how many questions each got. Open one in a new tab to see every Cambridge question on it.
What you needed in this session
Cambridge’s own grade thresholds for 2020 Oct/Nov, Paper 6 · Variant 1. A higher threshold means an easier paper — the bar moves with how the cohort did.