Cambridge IGCSE Science - Combined 0653 — 2013 May/June Paper 6 · Variant 3
0653/63/M/J/13 · 60 marks · ≈68 min
The question paper and its mark scheme, free to read here and free to download. This is Cambridge’s own paper, exactly as it was sat.
Question paper20 pages
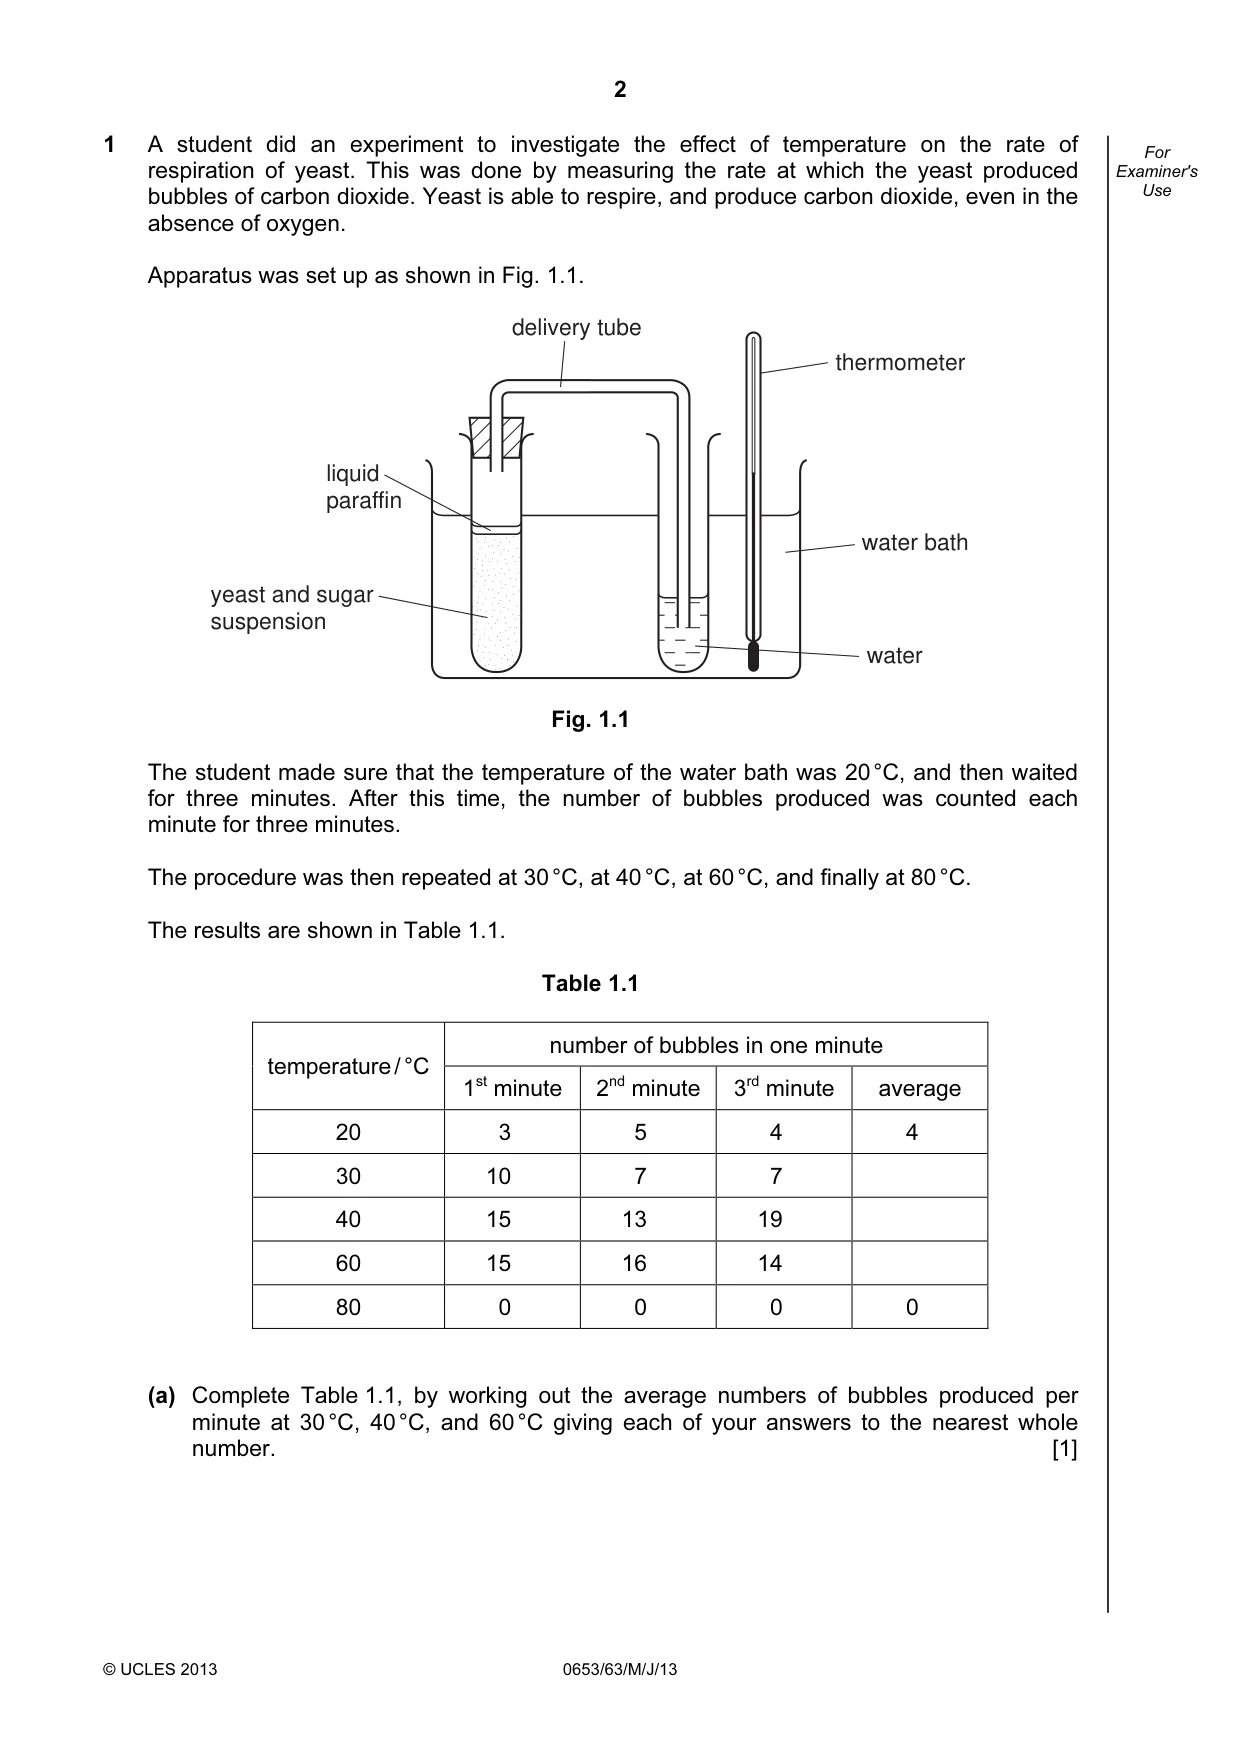
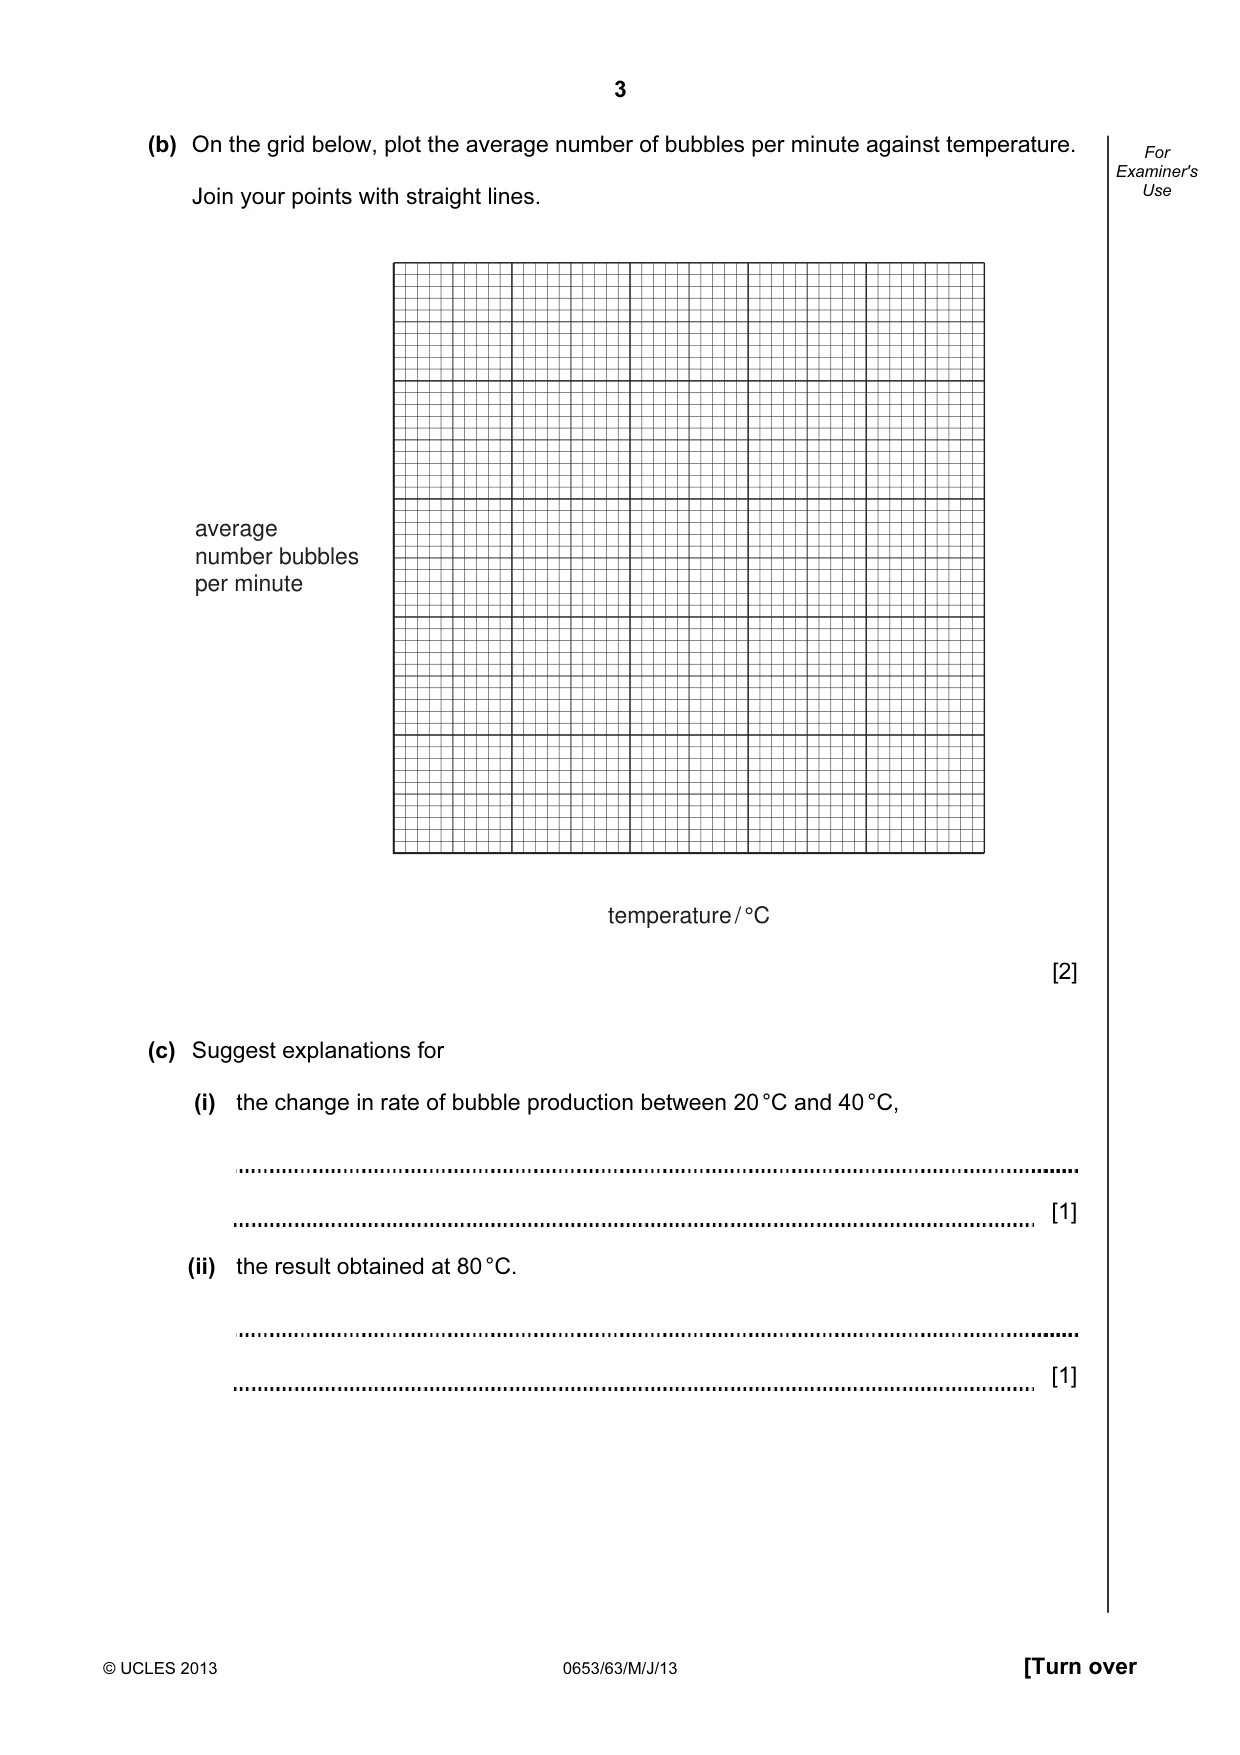
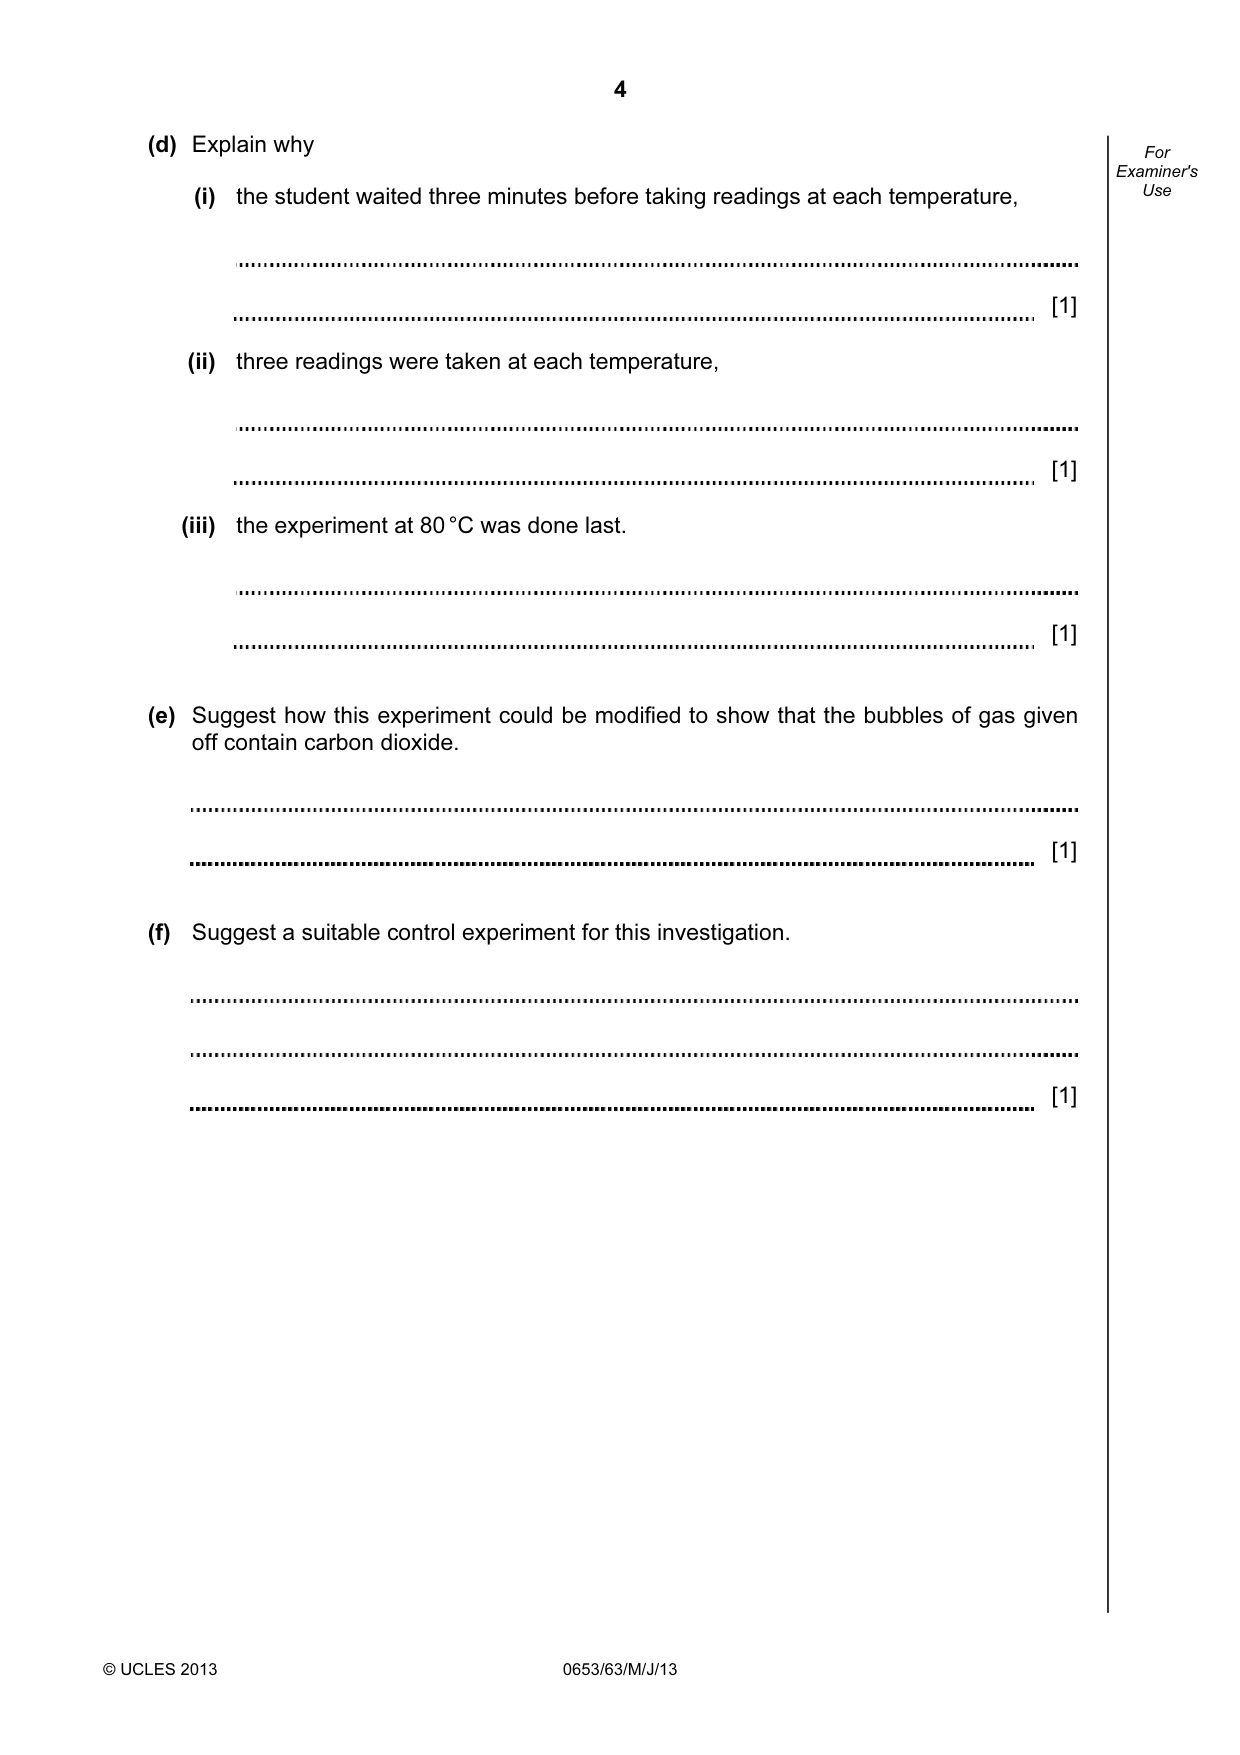


Mark scheme5 pages
Answers below. Sit the paper first if you are practising.
Paper as text
Question paper, page 1
This document consists of 19 printed pages and 1 blank page. IB13 06_0653_63/2RP © UCLES 2013 [Turn over *2062879771* For Examiner's Use 1 2 3 4 5 6 Total UNIVERSITY OF CAMBRIDGE INTERNATIONAL EXAMINATIONS International General Certificate of Secondary Education COMBINED SCIENCE 0653/63 Paper 6 Alternative to Practical May/June 2013 1 hour Candidates answer on the Question paper. No Additional Materials are required. READ THESE INSTRUCTIONS FIRST Write your Centre number, candidate number and name on all the work you hand in. Write in dark blue or black pen. You may use a pencil for any diagrams or graphs. Do not use staples, paper clips, glue or correction fluid. DO NOT WRITE IN ANY BARCODES. Answer all questions. Electronic calculators may be used. You may lose marks if you do not show your working or if you do not use appropriate units. At the end of the examination, fasten all your work securely together. The number of marks is given in brackets [ ] at the end of each question or part question. www.XtremePapers.com
Question paper, page 2
2 © UCLES 2013 0653/63/M/J/13 For Examiner's Use 1 A student did an experiment to investigate the effect of temperature on the rate of respiration of yeast. This was done by measuring the rate at which the yeast produced bubbles of carbon dioxide. Yeast is able to respire, and produce carbon dioxide, even in the absence of oxygen. Apparatus was set up as shown in Fig. 1.1. yeast and sugar suspension liquid paraffin delivery tube thermometer water bath water Fig. 1.1 The student made sure that the temperature of the water bath was 20 °C, and then waited for three minutes. After this time, the number of bubbles produced was counted each minute for three minutes. The procedure was then repeated at 30 °C, at 40 °C, at 60 °C, and finally at 80 °C. The results are shown in Table 1.1. Table 1.1 number of bubbles in one minute temperature / °C 1st minute 2nd minute 3rd minute average 20 3 5 4 4 30 10 7 7 40 15 13 19 60 15 16 14 80 0 0 0 0 (a) Complete Table 1.1, by working out the average numbers of bubbles produced per minute at 30 °C, 40 °C, and 60 °C giving each of your answers to the nearest whole number. [1]
Question paper, page 3
3 © UCLES 2013 0653/63/M/J/13 [Turn over For Examiner's Use (b) On the grid below, plot the average number of bubbles per minute against temperature. Join your points with straight lines. average number bubbles per minute temperature / °C [2] (c) Suggest explanations for (i) the change in rate of bubble production between 20 °C and 40 °C, [1] (ii) the result obtained at 80 °C. [1]
Question paper, page 4
4 © UCLES 2013 0653/63/M/J/13 For Examiner's Use (d) Explain why (i) the student waited three minutes before taking readings at each temperature, [1] (ii) three readings were taken at each temperature, [1] (iii) the experiment at 80 °C was done last. [1] (e) Suggest how this experiment could be modified to show that the bubbles of gas given off contain carbon dioxide. [1] (f) Suggest a suitable control experiment for this investigation. [1]
Question paper, page 5
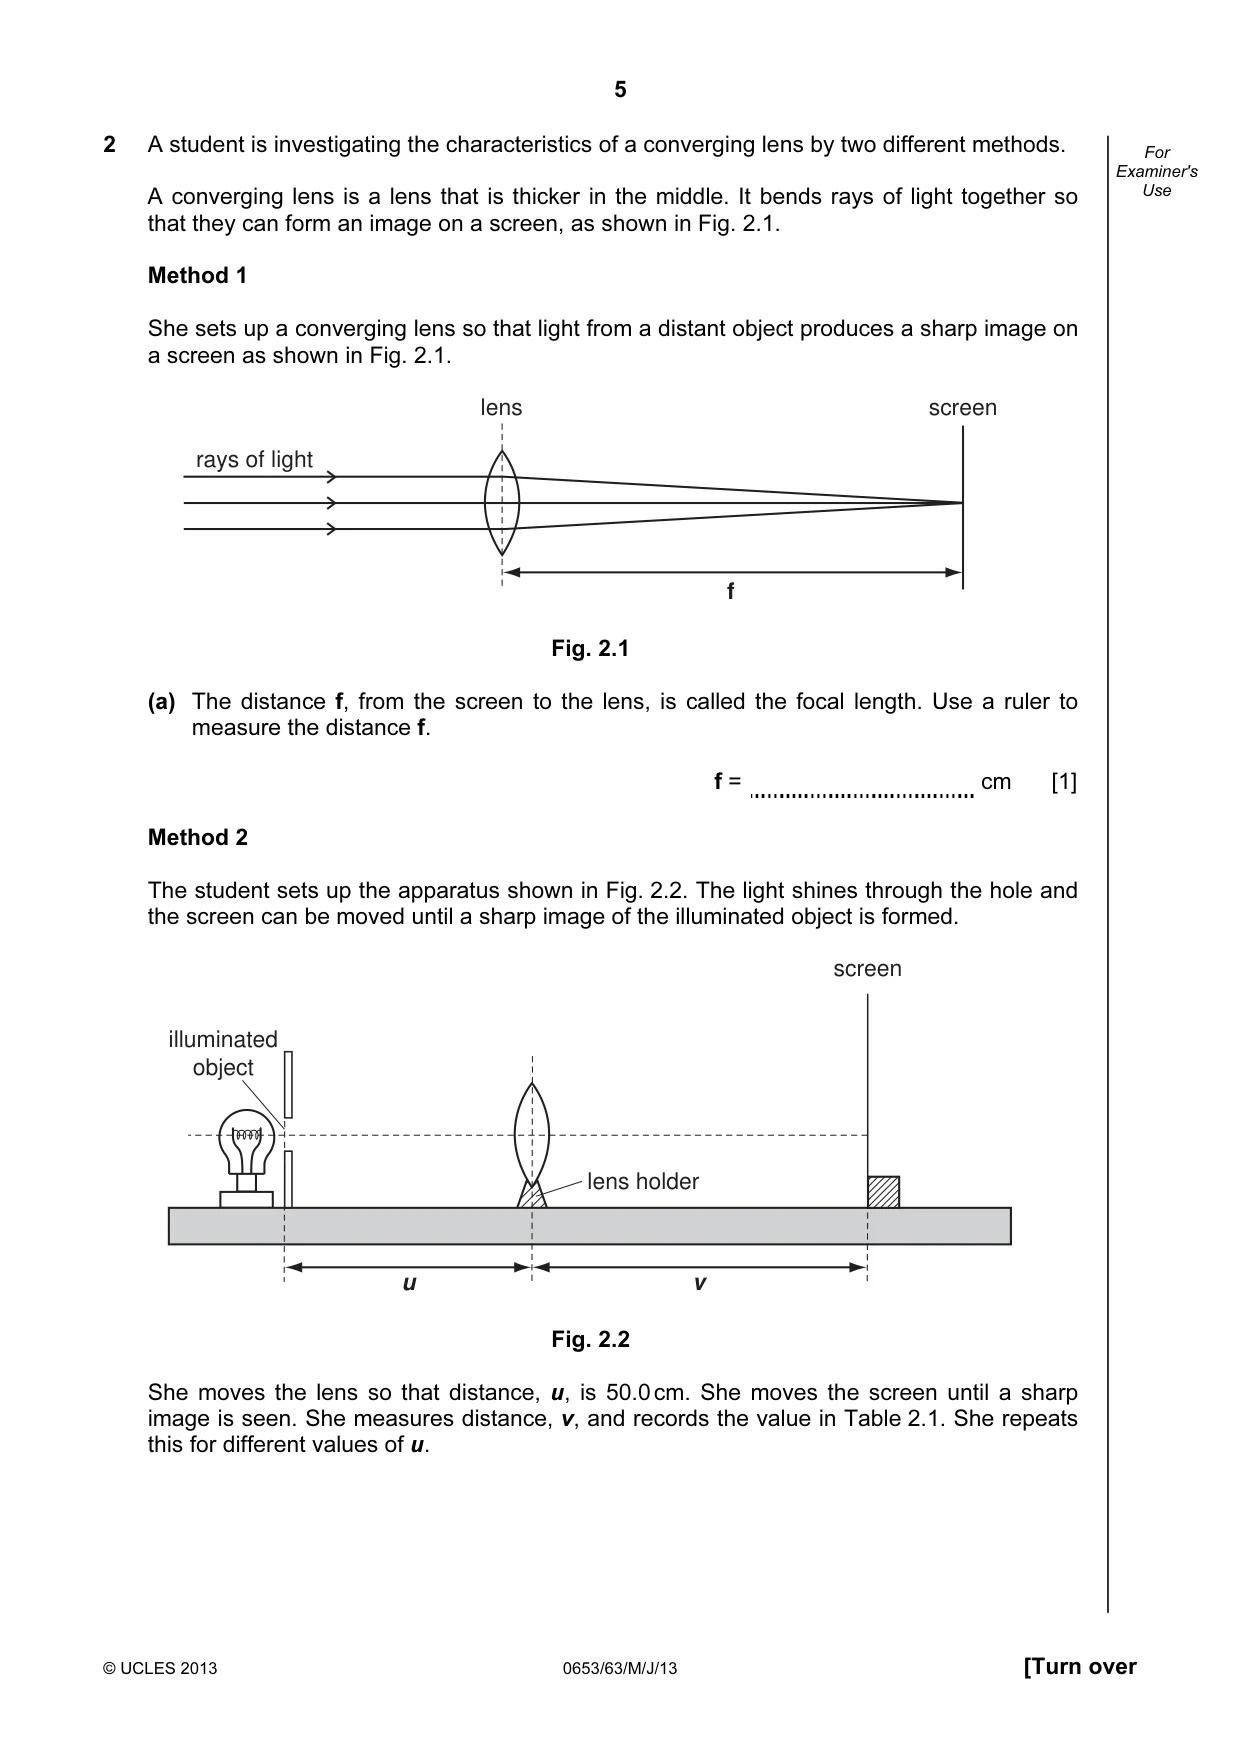
5 © UCLES 2013 0653/63/M/J/13 [Turn over For Examiner's Use 2 A student is investigating the characteristics of a converging lens by two different methods. A converging lens is a lens that is thicker in the middle. It bends rays of light together so that they can form an image on a screen, as shown in Fig. 2.1. Method 1 She sets up a converging lens so that light from a distant object produces a sharp image on a screen as shown in Fig. 2.1. f screen lens rays of light Fig. 2.1 (a) The distance f, from the screen to the lens, is called the focal length. Use a ruler to measure the distance f. f = cm [1] Method 2 The student sets up the apparatus shown in Fig. 2.2. The light shines through the hole and the screen can be moved until a sharp image of the illuminated object is formed. illuminated object u v lens holder screen Fig. 2.2 She moves the lens so that distance, u, is 50.0 cm. She moves the screen until a sharp image is seen. She measures distance, v, and records the value in Table 2.1. She repeats this for different values of u.
Question paper, page 6
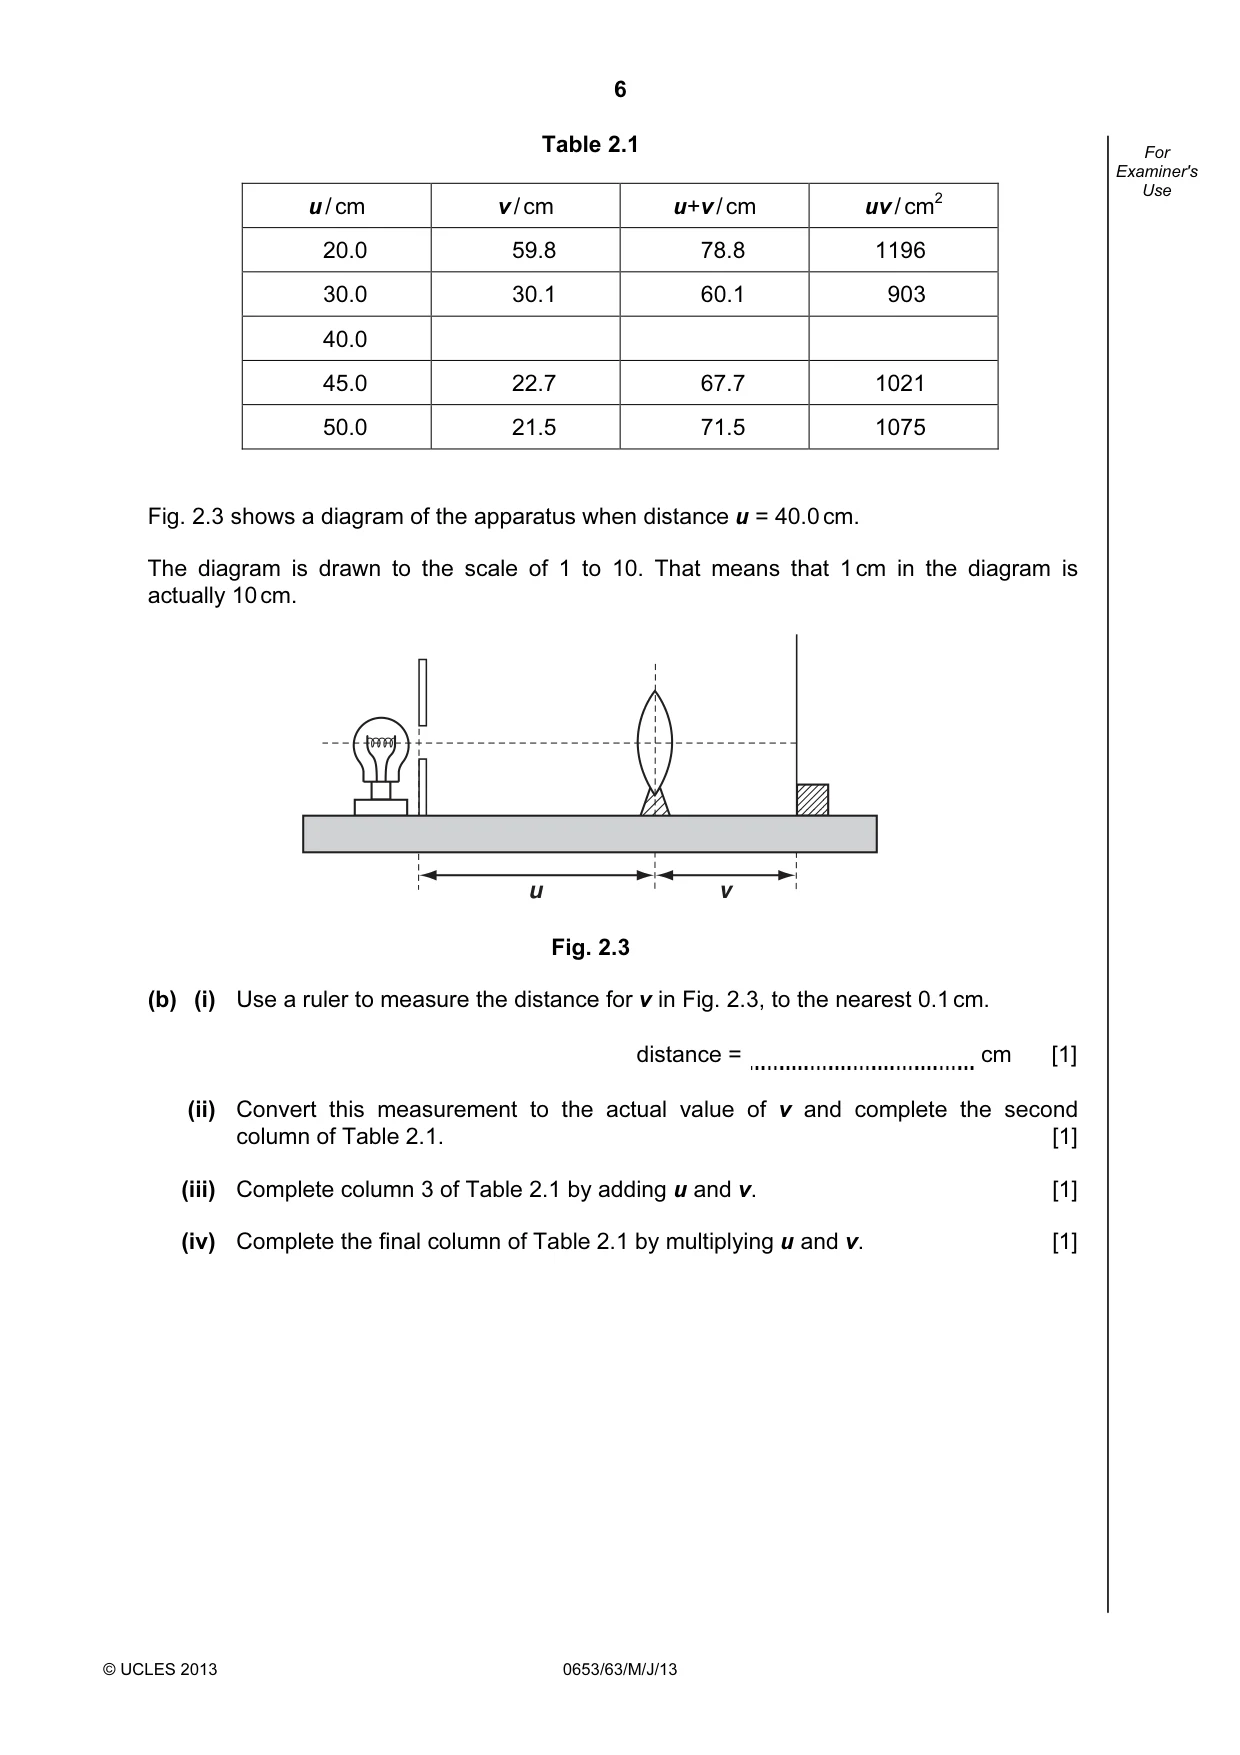
6 © UCLES 2013 0653/63/M/J/13 For Examiner's Use Table 2.1 u / cm v / cm u+v / cm uv / cm2 20.0 59.8 78.8 1196 30.0 30.1 60.1 903 40.0 45.0 22.7 67.7 1021 50.0 21.5 71.5 1075 Fig. 2.3 shows a diagram of the apparatus when distance u = 40.0 cm. The diagram is drawn to the scale of 1 to 10. That means that 1 cm in the diagram is actually 10 cm. u v Fig. 2.3 (b) (i) Use a ruler to measure the distance for v in Fig. 2.3, to the nearest 0.1 cm. distance = cm [1] (ii) Convert this measurement to the actual value of v and complete the second column of Table 2.1. [1] (iii) Complete column 3 of Table 2.1 by adding u and v. [1] (iv) Complete the final column of Table 2.1 by multiplying u and v. [1]
Question paper, page 7
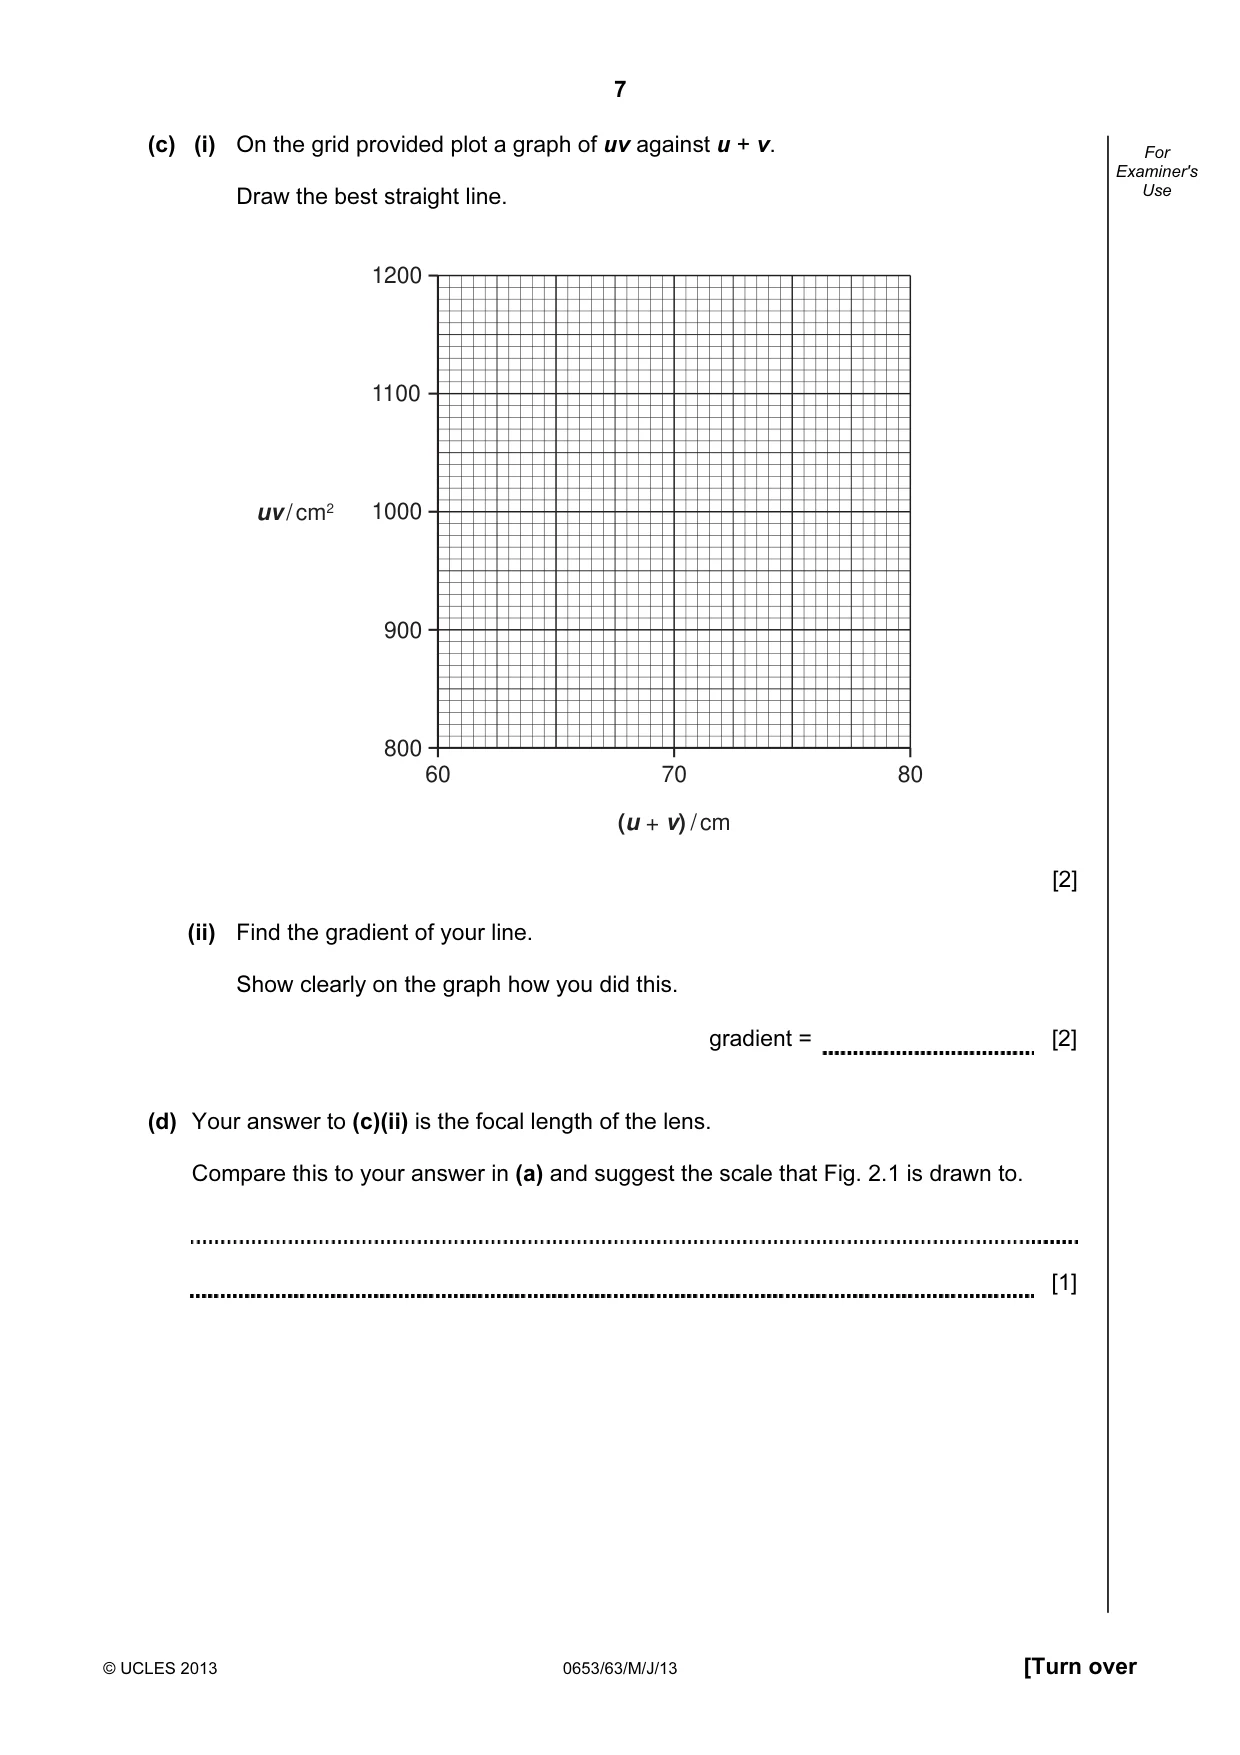
7 © UCLES 2013 0653/63/M/J/13 [Turn over For Examiner's Use (c) (i) On the grid provided plot a graph of uv against u + v. Draw the best straight line. 60 70 (u + v) / cm 80 1200 1100 1000 900 800 uv / cm2 [2] (ii) Find the gradient of your line. Show clearly on the graph how you did this. gradient = [2] (d) Your answer to (c)(ii) is the focal length of the lens. Compare this to your answer in (a) and suggest the scale that Fig. 2.1 is drawn to. [1]
Question paper, page 8
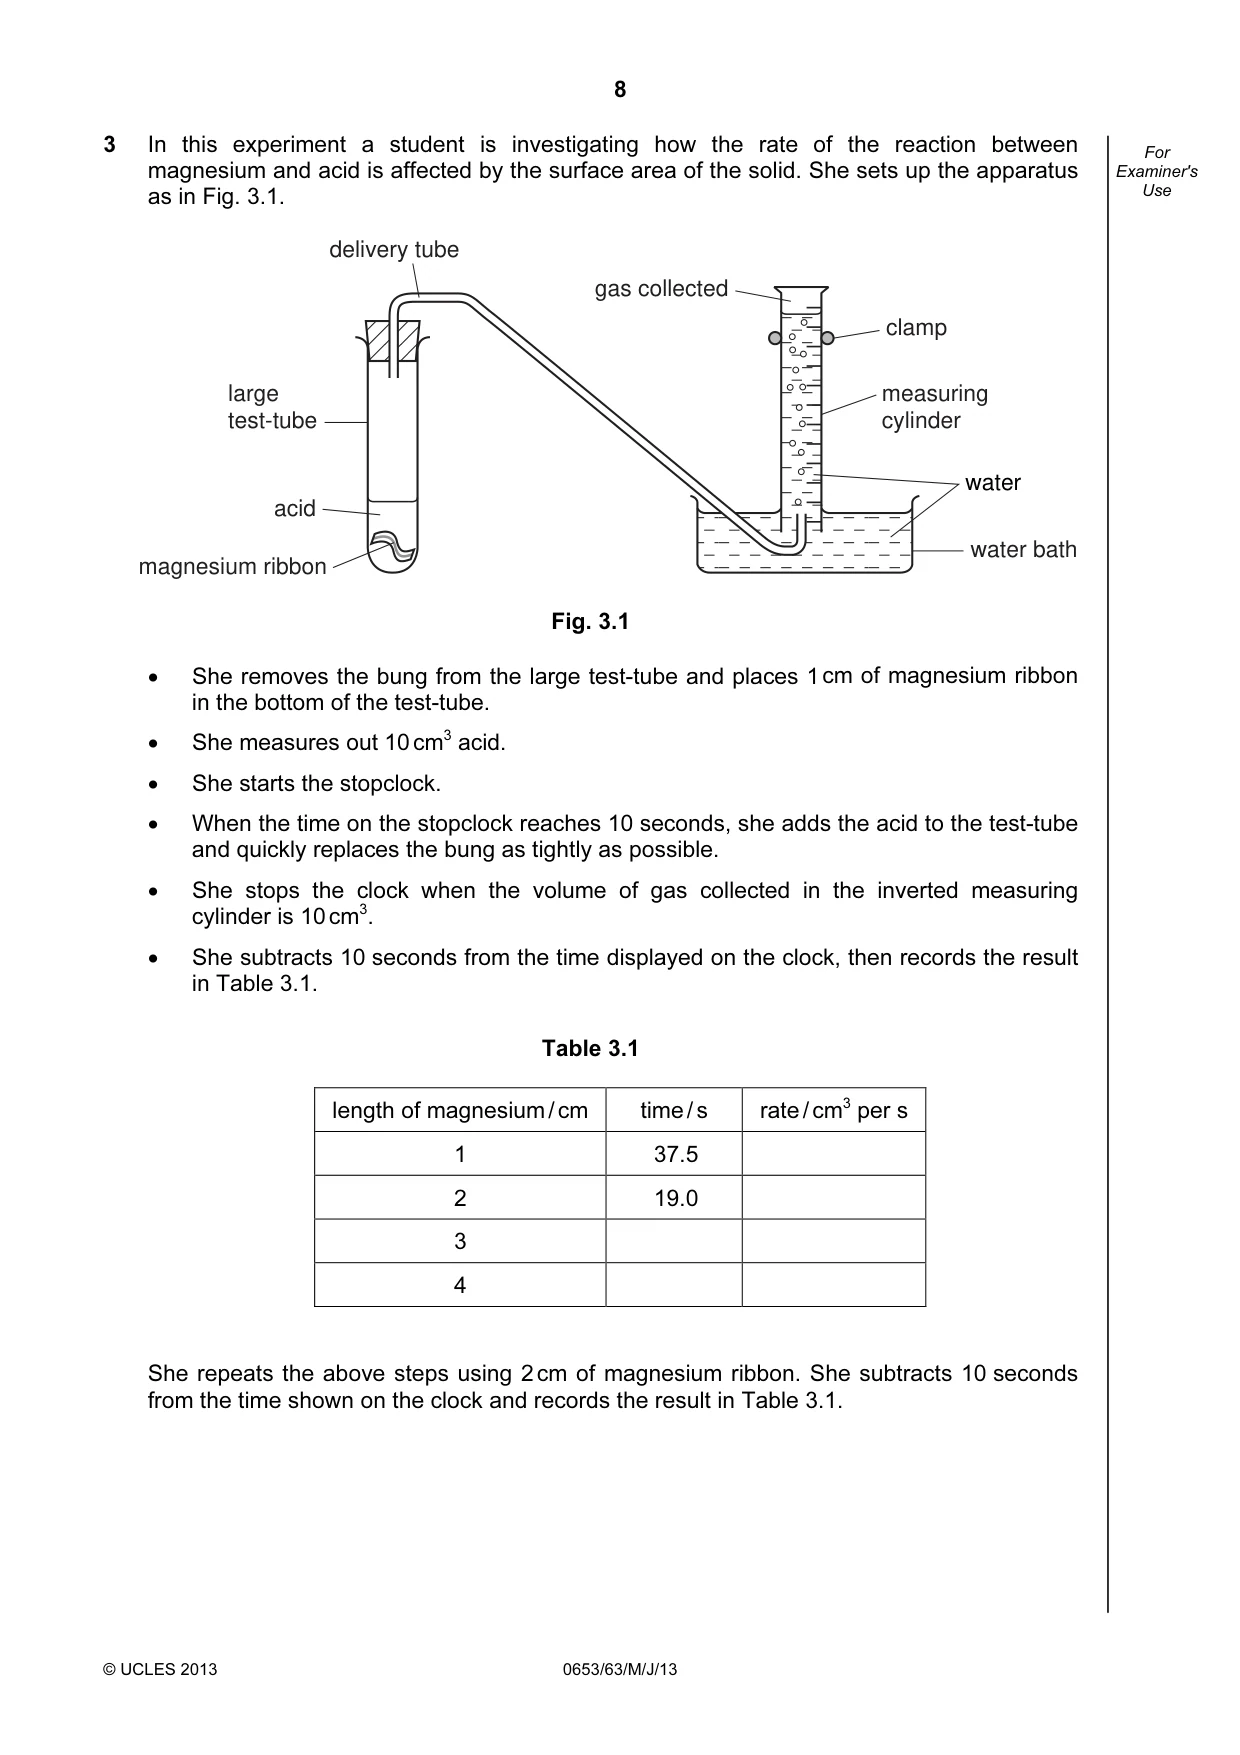
8 © UCLES 2013 0653/63/M/J/13 For Examiner's Use 3 In this experiment a student is investigating how the rate of the reaction between magnesium and acid is affected by the surface area of the solid. She sets up the apparatus as in Fig. 3.1. water gas collected measuring cylinder water bath clamp delivery tube large test-tube acid magnesium ribbon Fig. 3.1 • She removes the bung from the large test-tube and places 1 cm of magnesium ribbon in the bottom of the test-tube. • She measures out 10 cm3 acid. • She starts the stopclock. • When the time on the stopclock reaches 10 seconds, she adds the acid to the test-tube and quickly replaces the bung as tightly as possible. • She stops the clock when the volume of gas collected in the inverted measuring cylinder is 10 cm3. • She subtracts 10 seconds from the time displayed on the clock, then records the result in Table 3.1. Table 3.1 length of magnesium / cm time / s rate / cm3 per s 1 37.5 2 19.0 3 4 She repeats the above steps using 2 cm of magnesium ribbon. She subtracts 10 seconds from the time shown on the clock and records the result in Table 3.1.
Question paper, page 9
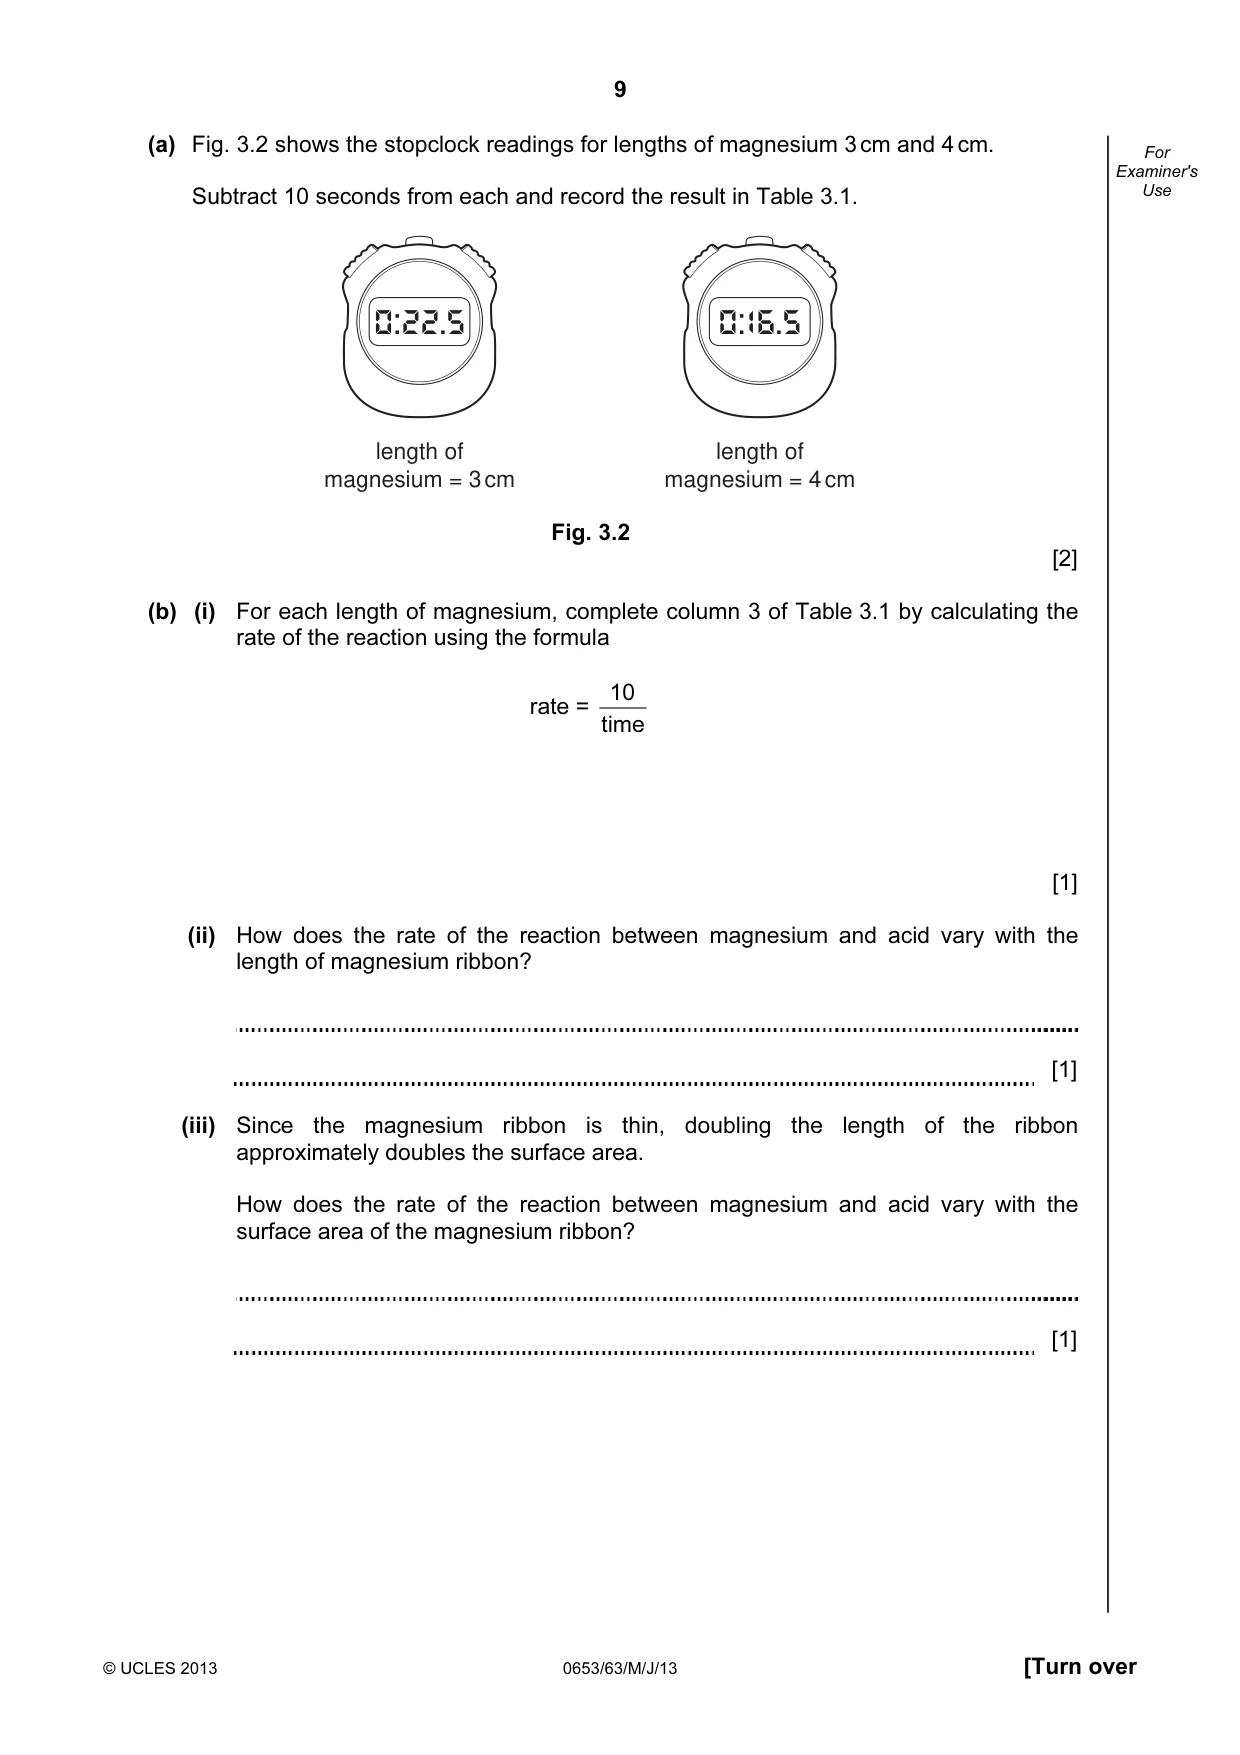
9 © UCLES 2013 0653/63/M/J/13 [Turn over For Examiner's Use (a) Fig. 3.2 shows the stopclock readings for lengths of magnesium 3 cm and 4 cm. Subtract 10 seconds from each and record the result in Table 3.1. length of magnesium = 3 cm length of magnesium = 4 cm Fig. 3.2 [2] (b) (i) For each length of magnesium, complete column 3 of Table 3.1 by calculating the rate of the reaction using the formula rate = time 10 [1] (ii) How does the rate of the reaction between magnesium and acid vary with the length of magnesium ribbon? [1] (iii) Since the magnesium ribbon is thin, doubling the length of the ribbon approximately doubles the surface area. How does the rate of the reaction between magnesium and acid vary with the surface area of the magnesium ribbon? [1]
Question paper, page 10
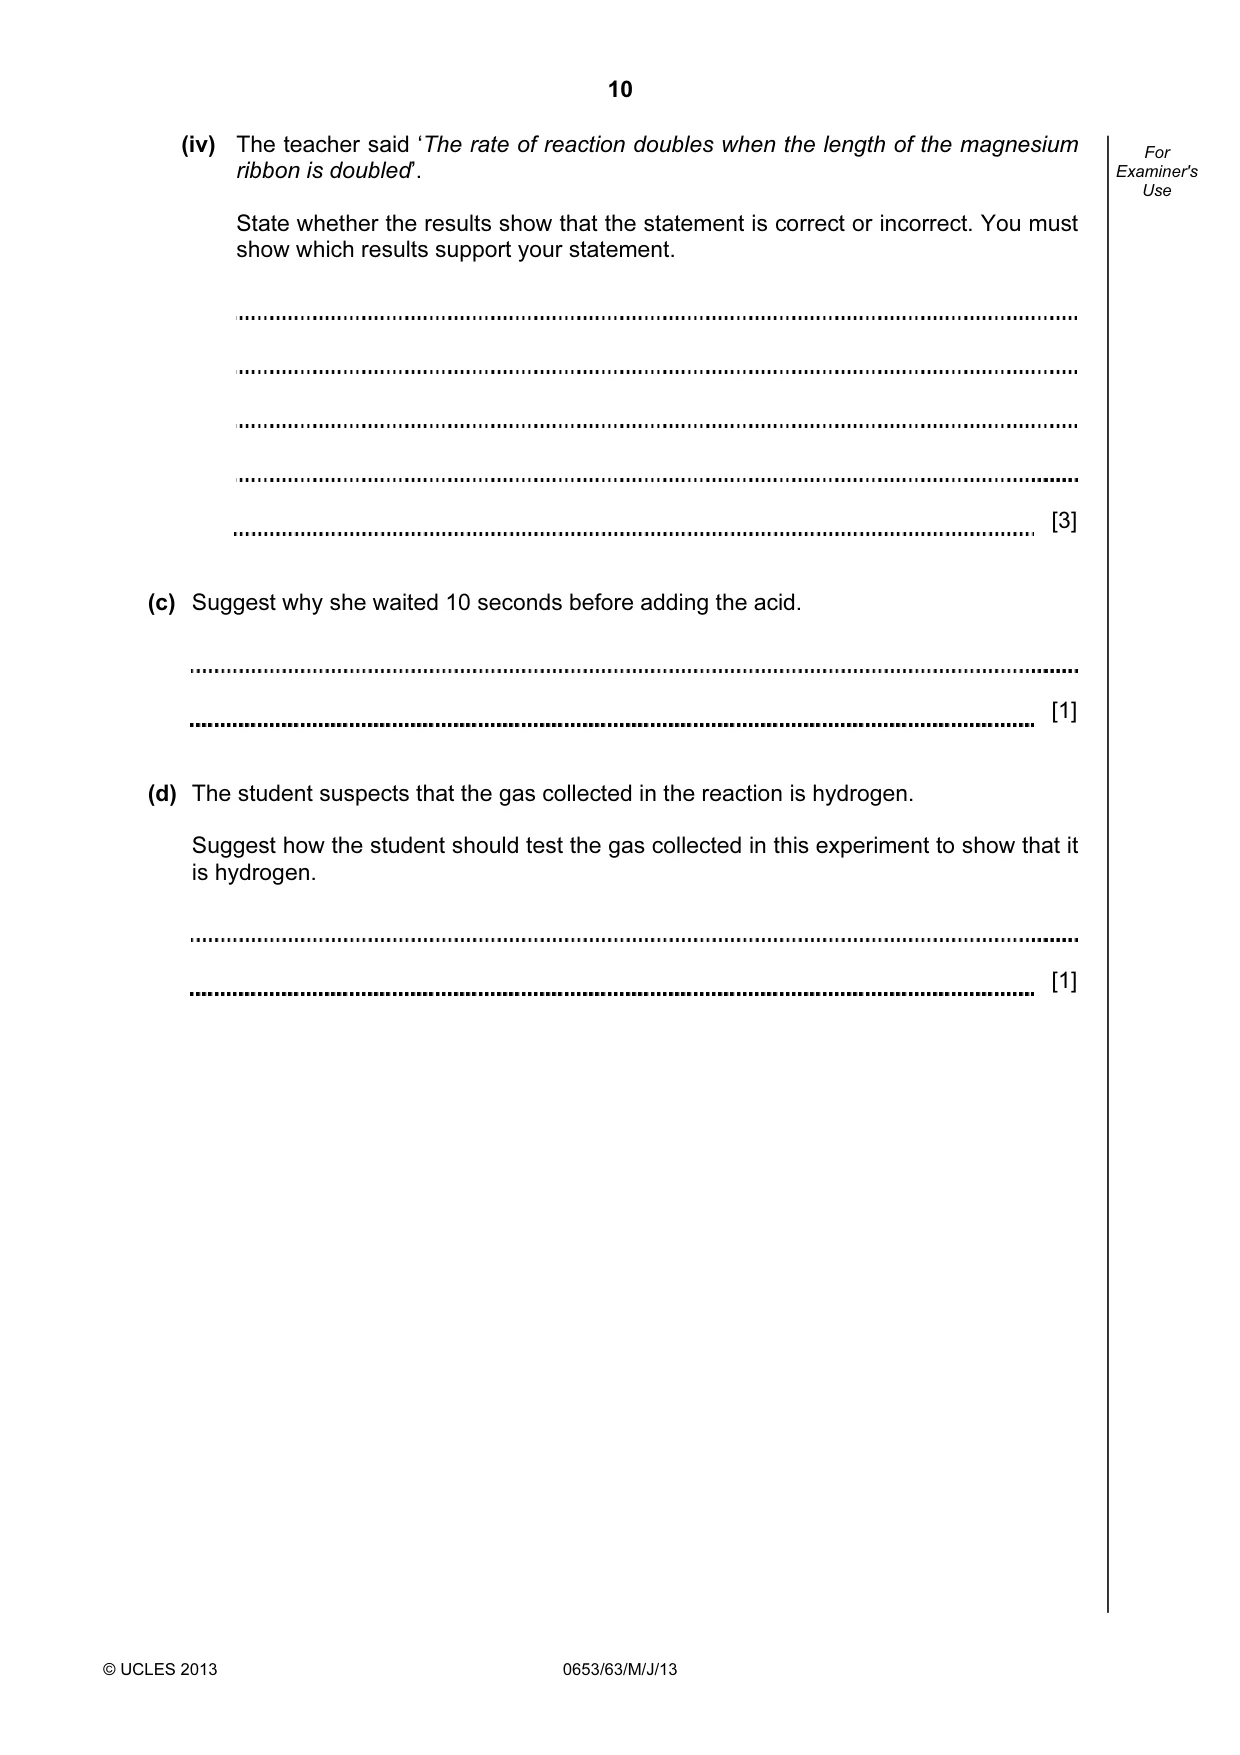
10 © UCLES 2013 0653/63/M/J/13 For Examiner's Use (iv) The teacher said ‘The rate of reaction doubles when the length of the magnesium ribbon is doubled’. State whether the results show that the statement is correct or incorrect. You must show which results support your statement. [3] (c) Suggest why she waited 10 seconds before adding the acid. [1] (d) The student suspects that the gas collected in the reaction is hydrogen. Suggest how the student should test the gas collected in this experiment to show that it is hydrogen. [1]
Question paper, page 11
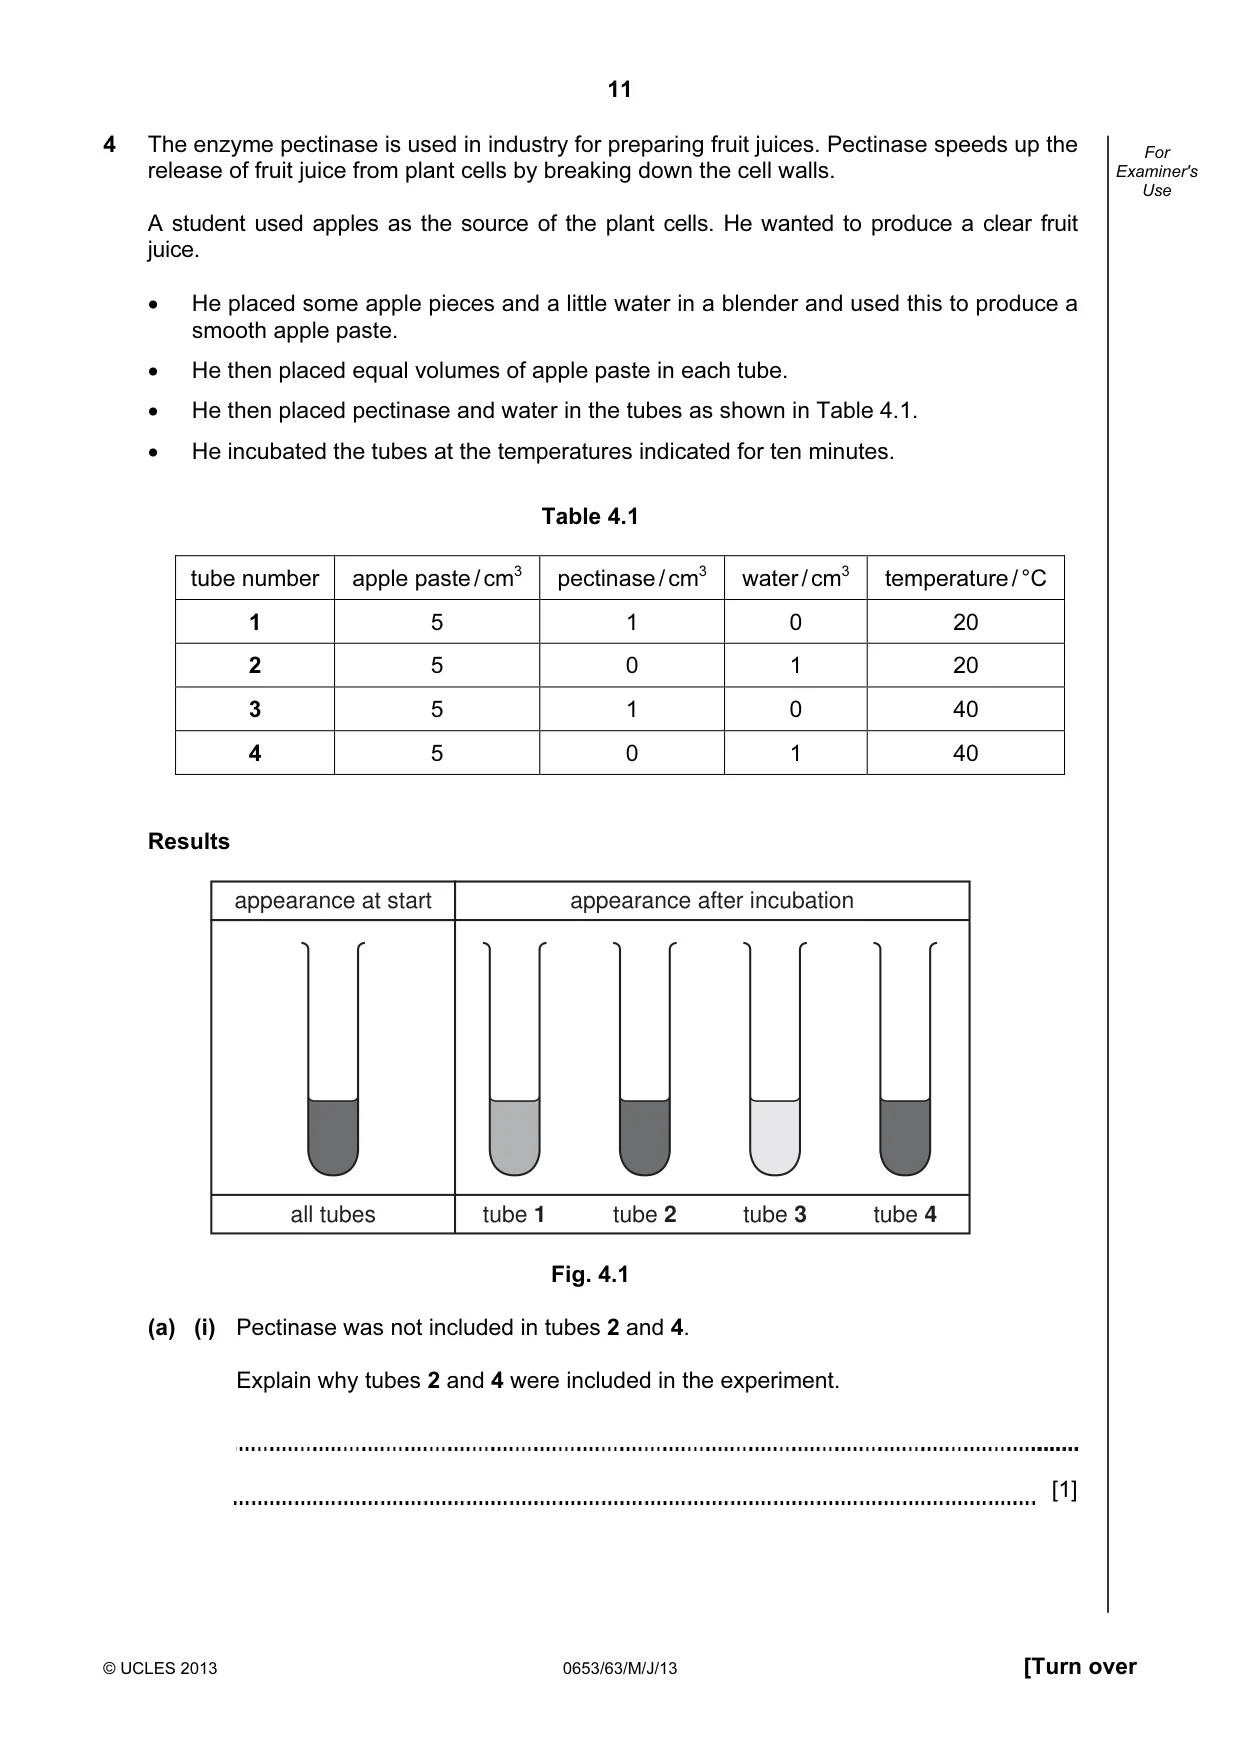
11 © UCLES 2013 0653/63/M/J/13 [Turn over For Examiner's Use 4 The enzyme pectinase is used in industry for preparing fruit juices. Pectinase speeds up the release of fruit juice from plant cells by breaking down the cell walls. A student used apples as the source of the plant cells. He wanted to produce a clear fruit juice. • He placed some apple pieces and a little water in a blender and used this to produce a smooth apple paste. • He then placed equal volumes of apple paste in each tube. • He then placed pectinase and water in the tubes as shown in Table 4.1. • He incubated the tubes at the temperatures indicated for ten minutes. Table 4.1 tube number apple paste / cm3 pectinase / cm3 water / cm3 temperature / °C 1 5 1 0 20 2 5 0 1 20 3 5 1 0 40 4 5 0 1 40 Results appearance at start all tubes tube 1 tube 2 tube 3 tube 4 appearance after incubation Fig. 4.1 (a) (i) Pectinase was not included in tubes 2 and 4. Explain why tubes 2 and 4 were included in the experiment. [1]
Question paper, page 12
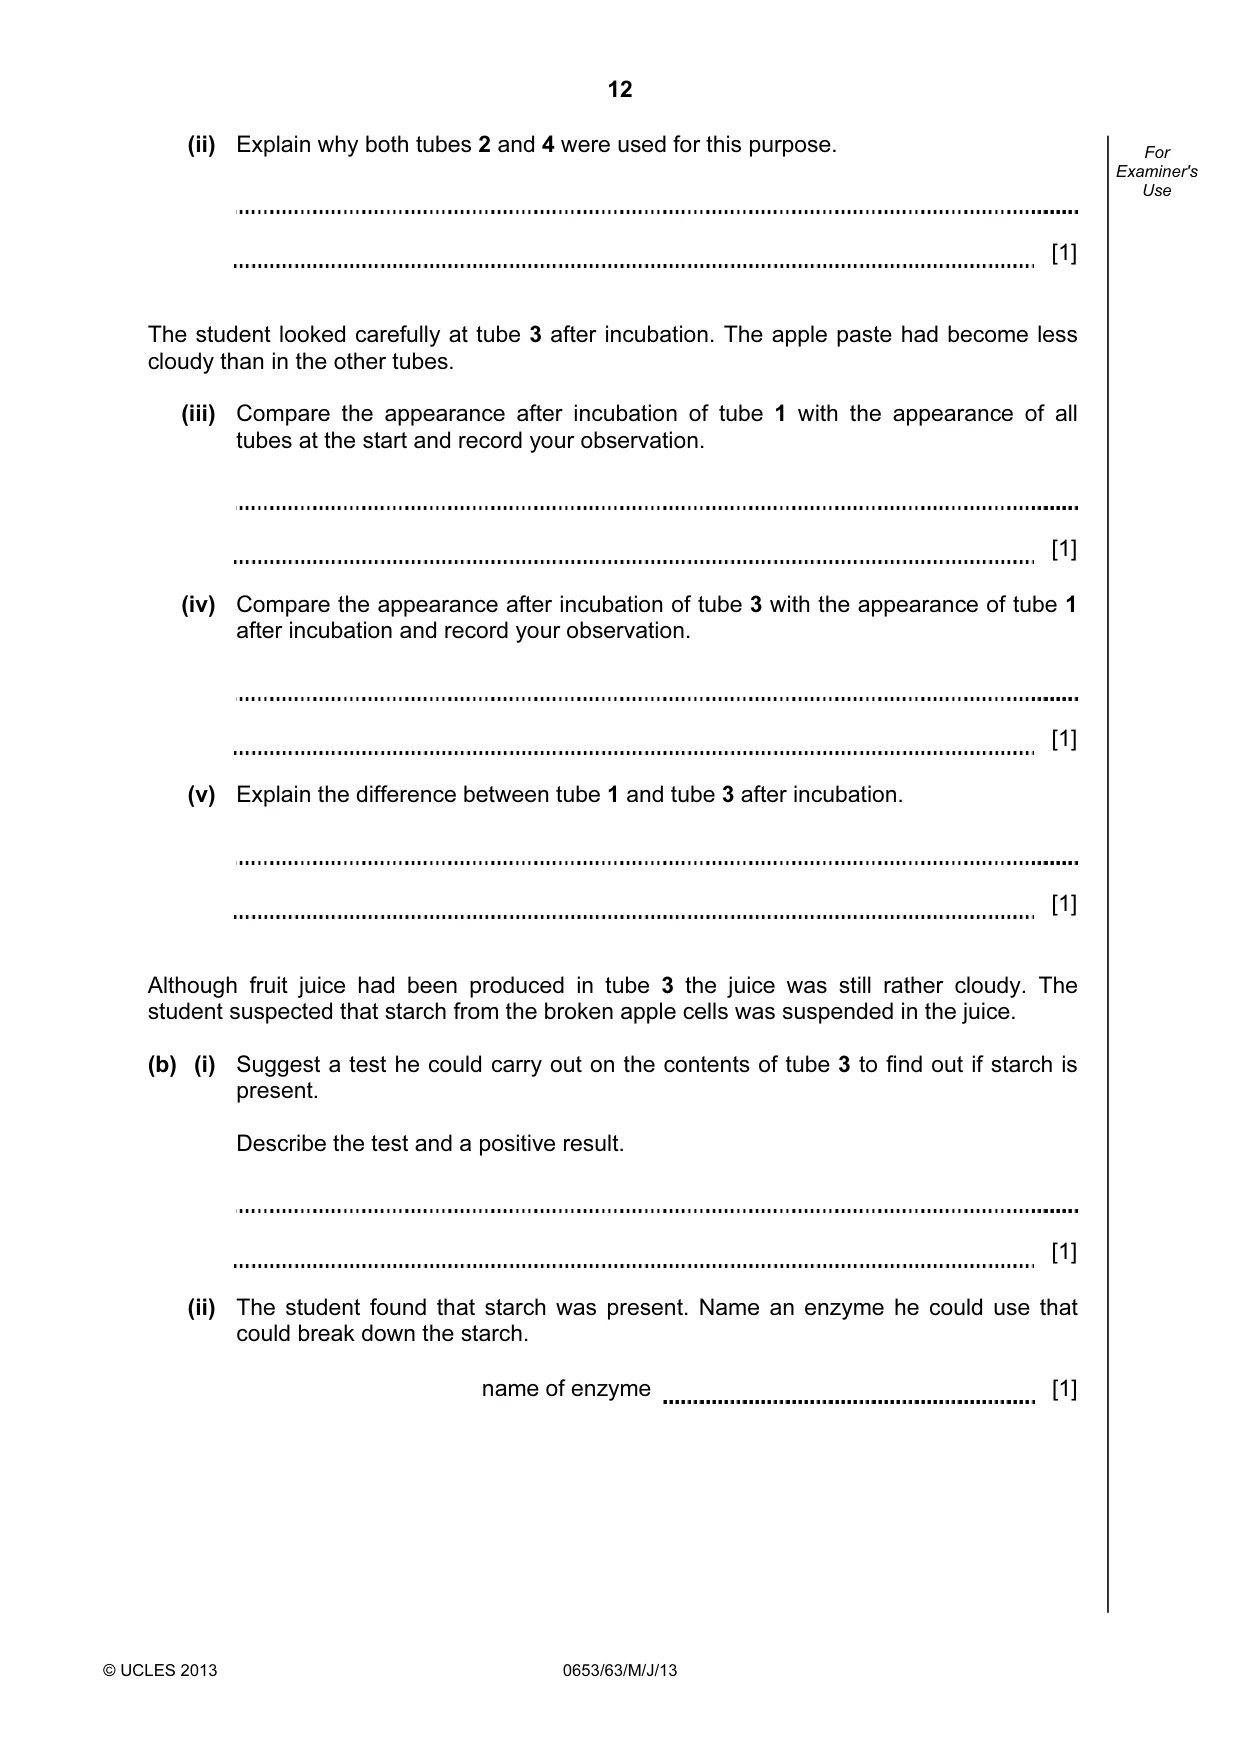
12 © UCLES 2013 0653/63/M/J/13 For Examiner's Use (ii) Explain why both tubes 2 and 4 were used for this purpose. [1] The student looked carefully at tube 3 after incubation. The apple paste had become less cloudy than in the other tubes. (iii) Compare the appearance after incubation of tube 1 with the appearance of all tubes at the start and record your observation. [1] (iv) Compare the appearance after incubation of tube 3 with the appearance of tube 1 after incubation and record your observation. [1] (v) Explain the difference between tube 1 and tube 3 after incubation. [1] Although fruit juice had been produced in tube 3 the juice was still rather cloudy. The student suspected that starch from the broken apple cells was suspended in the juice. (b) (i) Suggest a test he could carry out on the contents of tube 3 to find out if starch is present. Describe the test and a positive result. [1] (ii) The student found that starch was present. Name an enzyme he could use that could break down the starch. name of enzyme [1]
Question paper, page 13
13 © UCLES 2013 0653/63/M/J/13 [Turn over For Examiner's Use (iii) The student modified his original experiment to make the fruit juice as clear as possible. Describe in detail what he did and how he could prove that the enzyme named in (b)(ii) was effective. [3]
Question paper, page 14
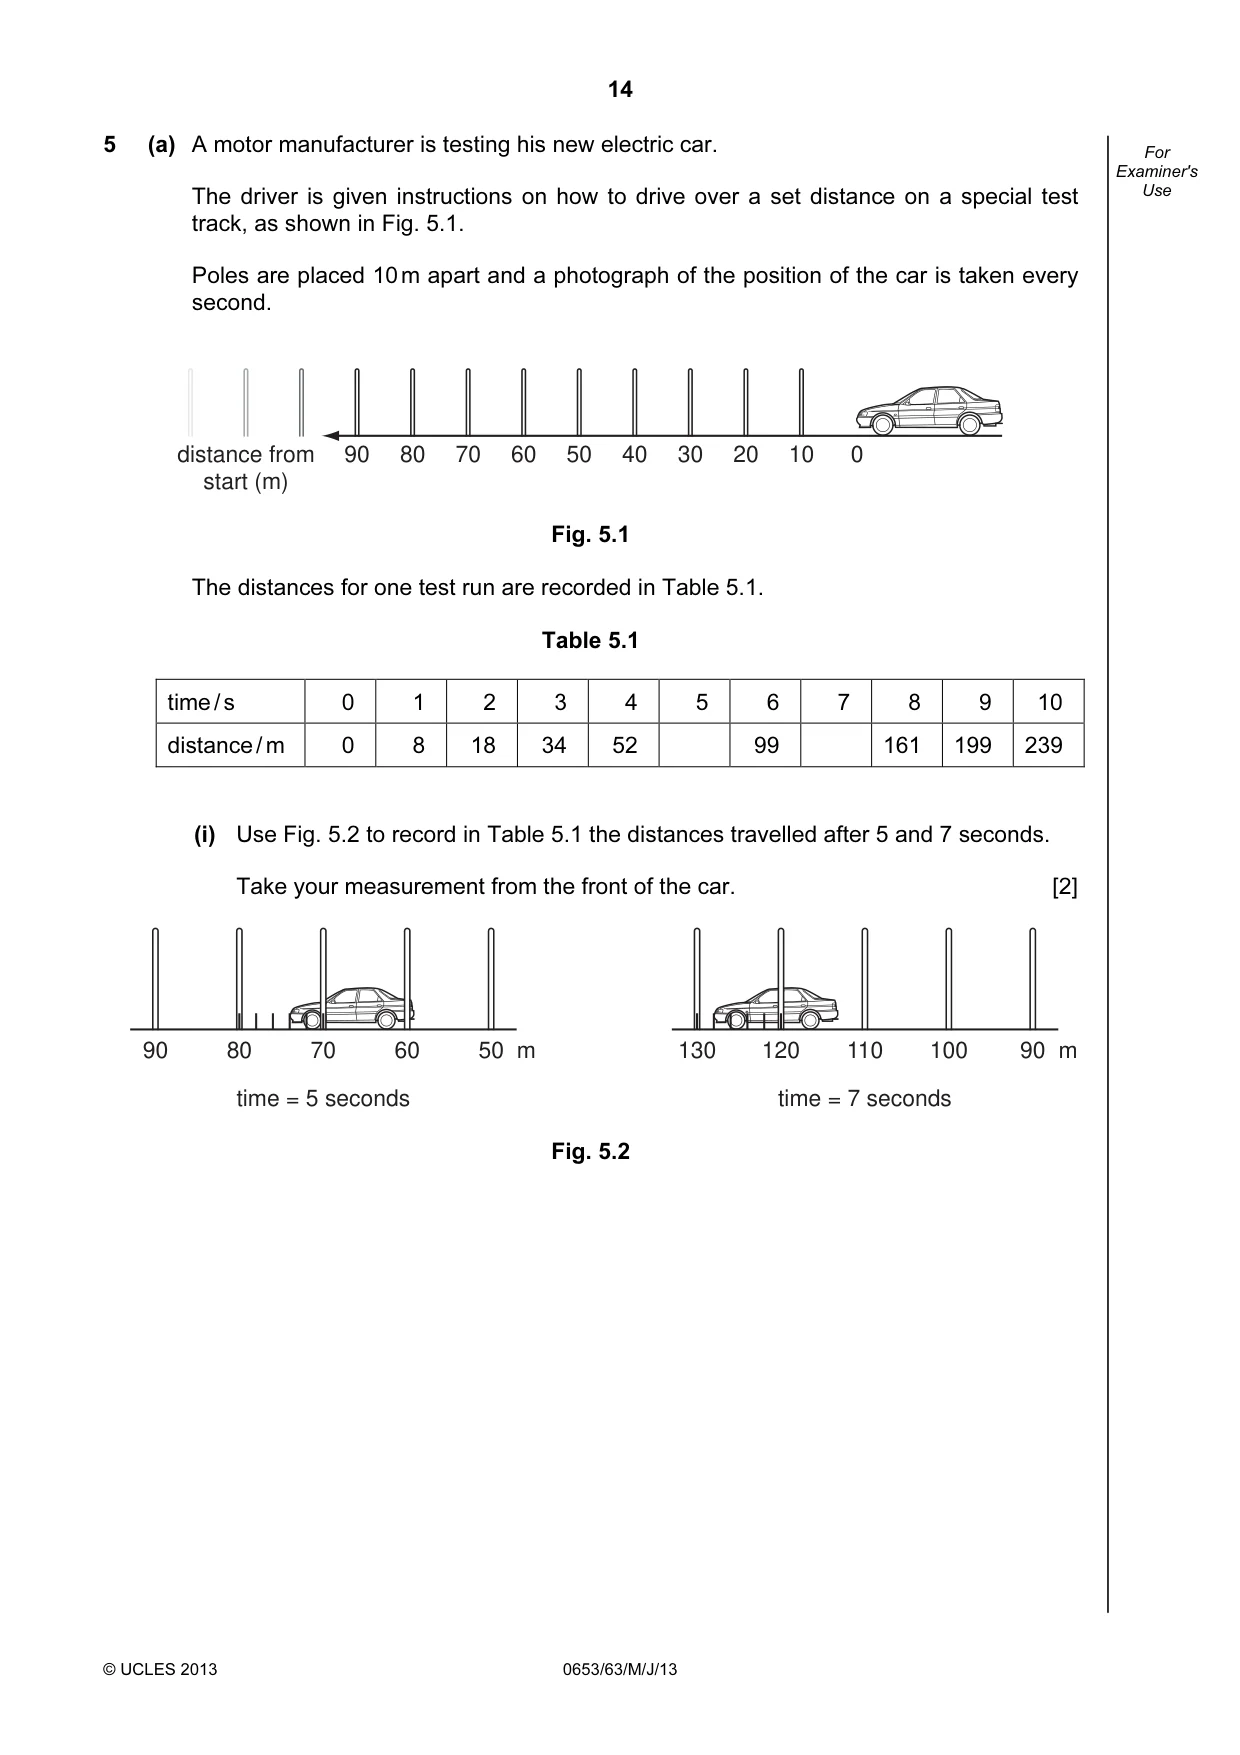
14 © UCLES 2013 0653/63/M/J/13 For Examiner's Use 5 (a) A motor manufacturer is testing his new electric car. The driver is given instructions on how to drive over a set distance on a special test track, as shown in Fig. 5.1. Poles are placed 10 m apart and a photograph of the position of the car is taken every second. 0 10 20 30 40 50 60 70 80 90 distance from start (m) Fig. 5.1 The distances for one test run are recorded in Table 5.1. Table 5.1 time / s 0 1 2 3 4 5 6 7 8 9 10 distance / m 0 8 18 34 52 99 161 199 239 (i) Use Fig. 5.2 to record in Table 5.1 the distances travelled after 5 and 7 seconds. Take your measurement from the front of the car. [2] 50 m 60 70 time = 5 seconds 80 90 90 m 100 110 time = 7 seconds 120 130 Fig. 5.2
Question paper, page 15
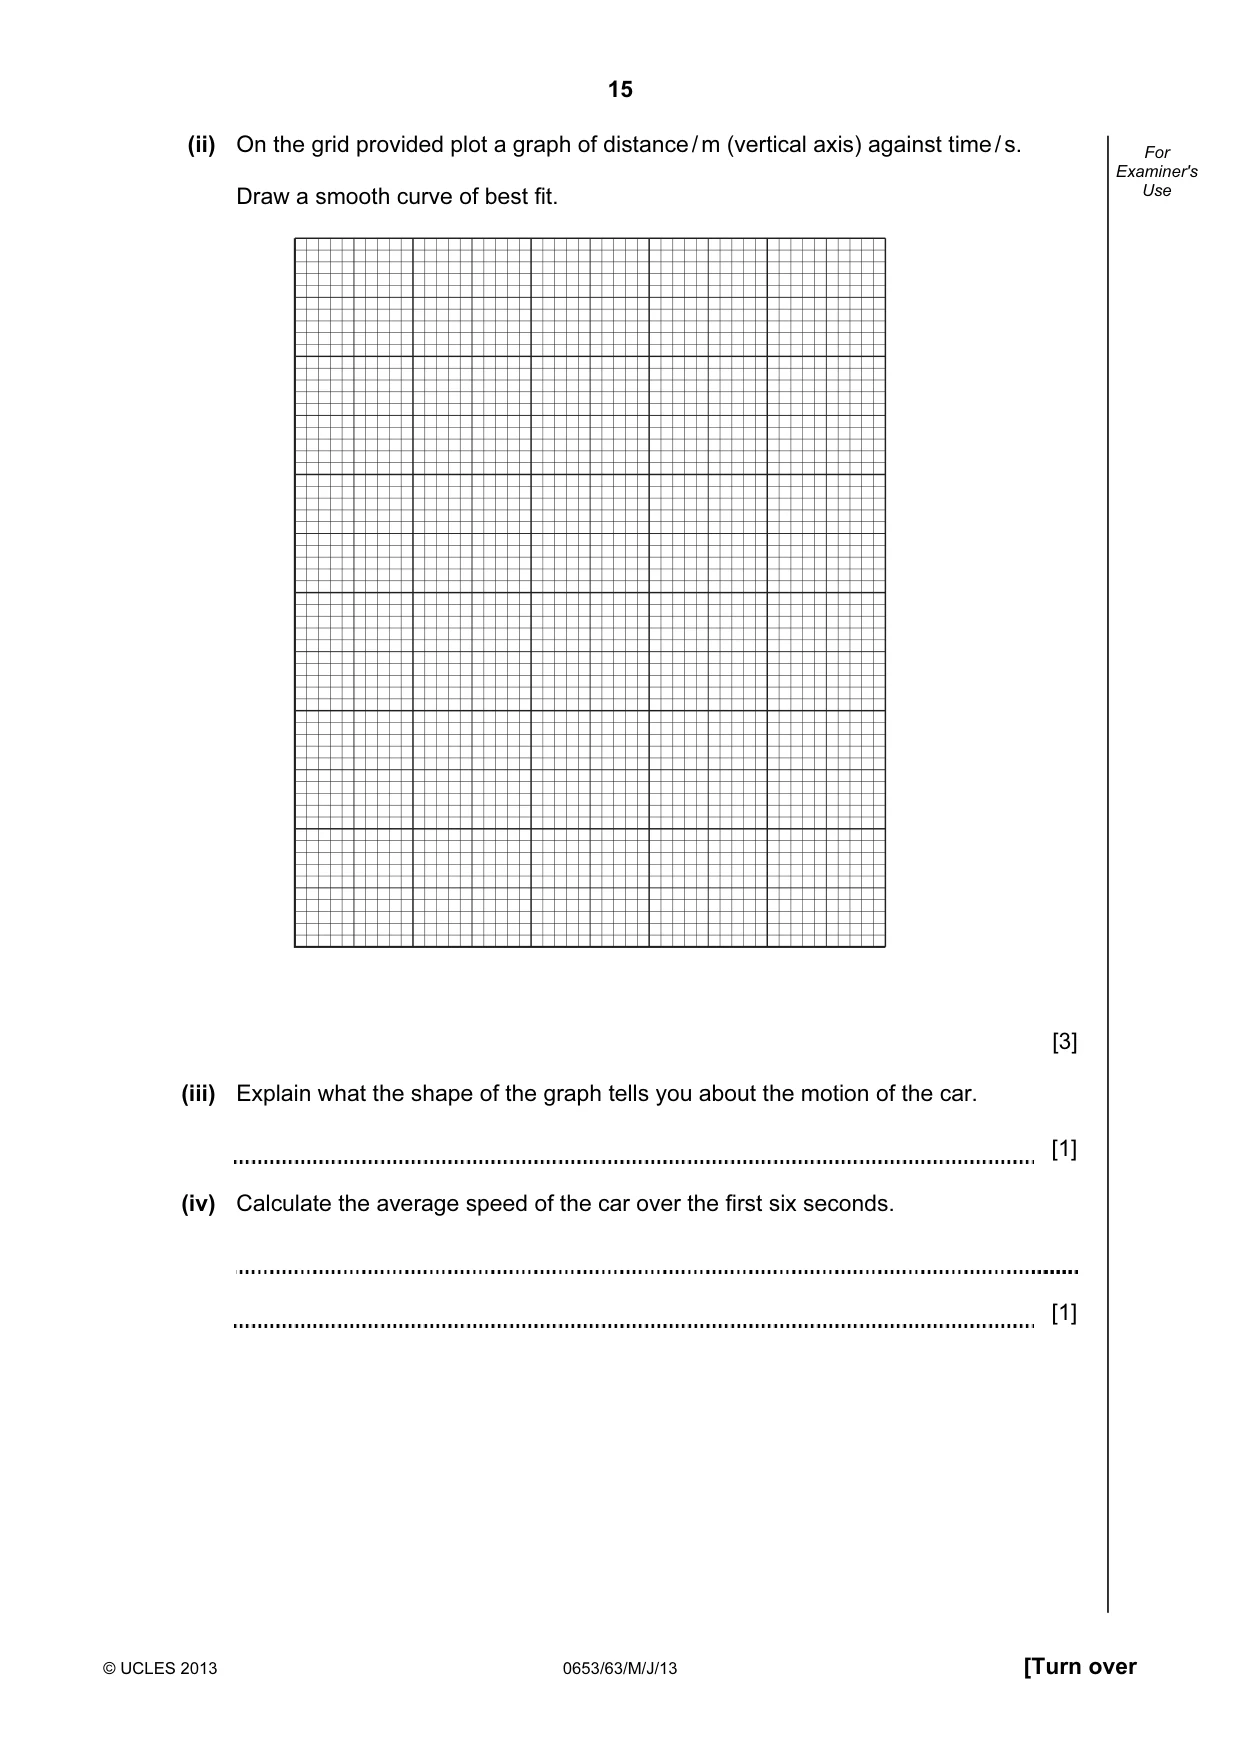
15 © UCLES 2013 0653/63/M/J/13 [Turn over For Examiner's Use (ii) On the grid provided plot a graph of distance / m (vertical axis) against time / s. Draw a smooth curve of best fit. [3] (iii) Explain what the shape of the graph tells you about the motion of the car. [1] (iv) Calculate the average speed of the car over the first six seconds. [1]
Question paper, page 16
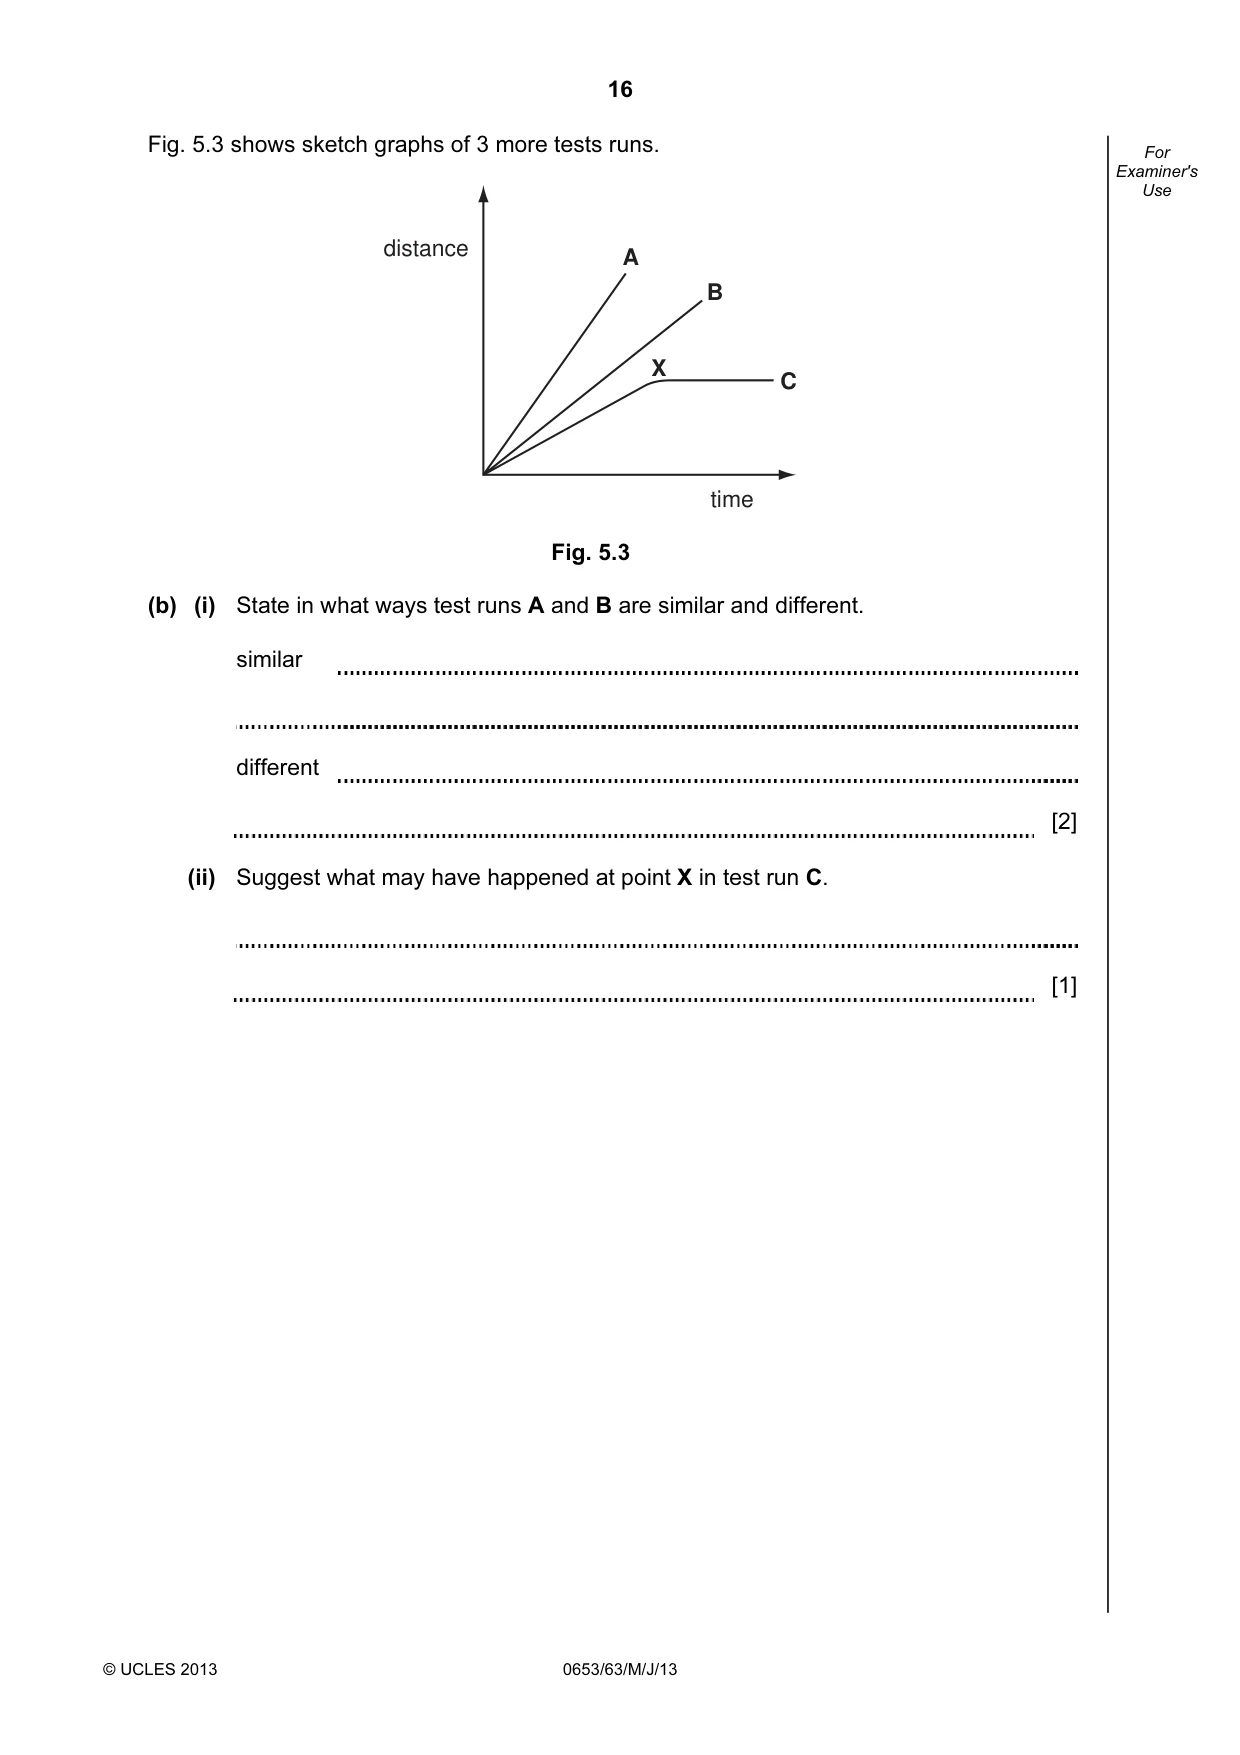
16 © UCLES 2013 0653/63/M/J/13 For Examiner's Use Fig. 5.3 shows sketch graphs of 3 more tests runs. A B C X distance time Fig. 5.3 (b) (i) State in what ways test runs A and B are similar and different. similar different [2] (ii) Suggest what may have happened at point X in test run C. [1]
Question paper, page 17
17 © UCLES 2013 0653/63/M/J/13 [Turn over Please turn over for Question 6.
Question paper, page 18
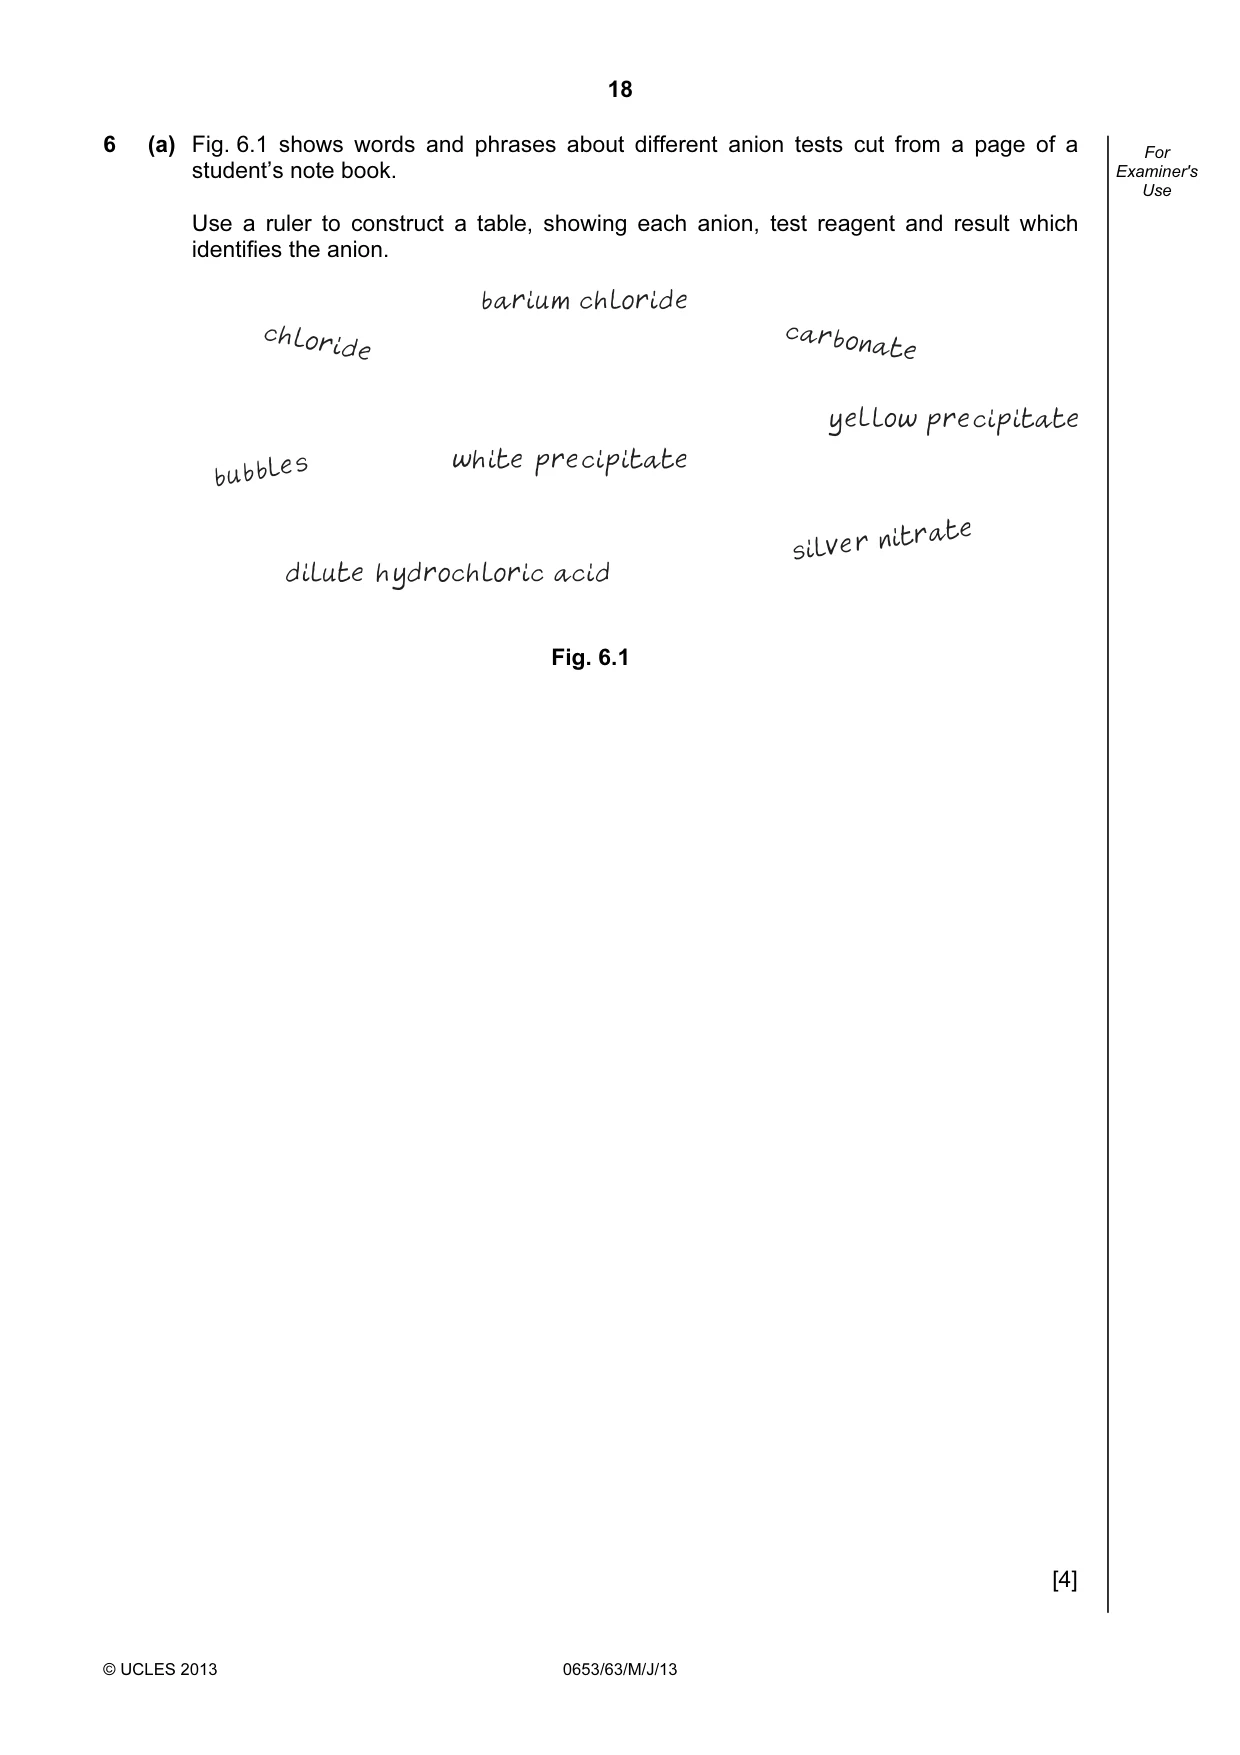
18 © UCLES 2013 0653/63/M/J/13 For Examiner's Use 6 (a) Fig. 6.1 shows words and phrases about different anion tests cut from a page of a student’s note book. Use a ruler to construct a table, showing each anion, test reagent and result which identifies the anion. Fig. 6.1 [4]
Question paper, page 19
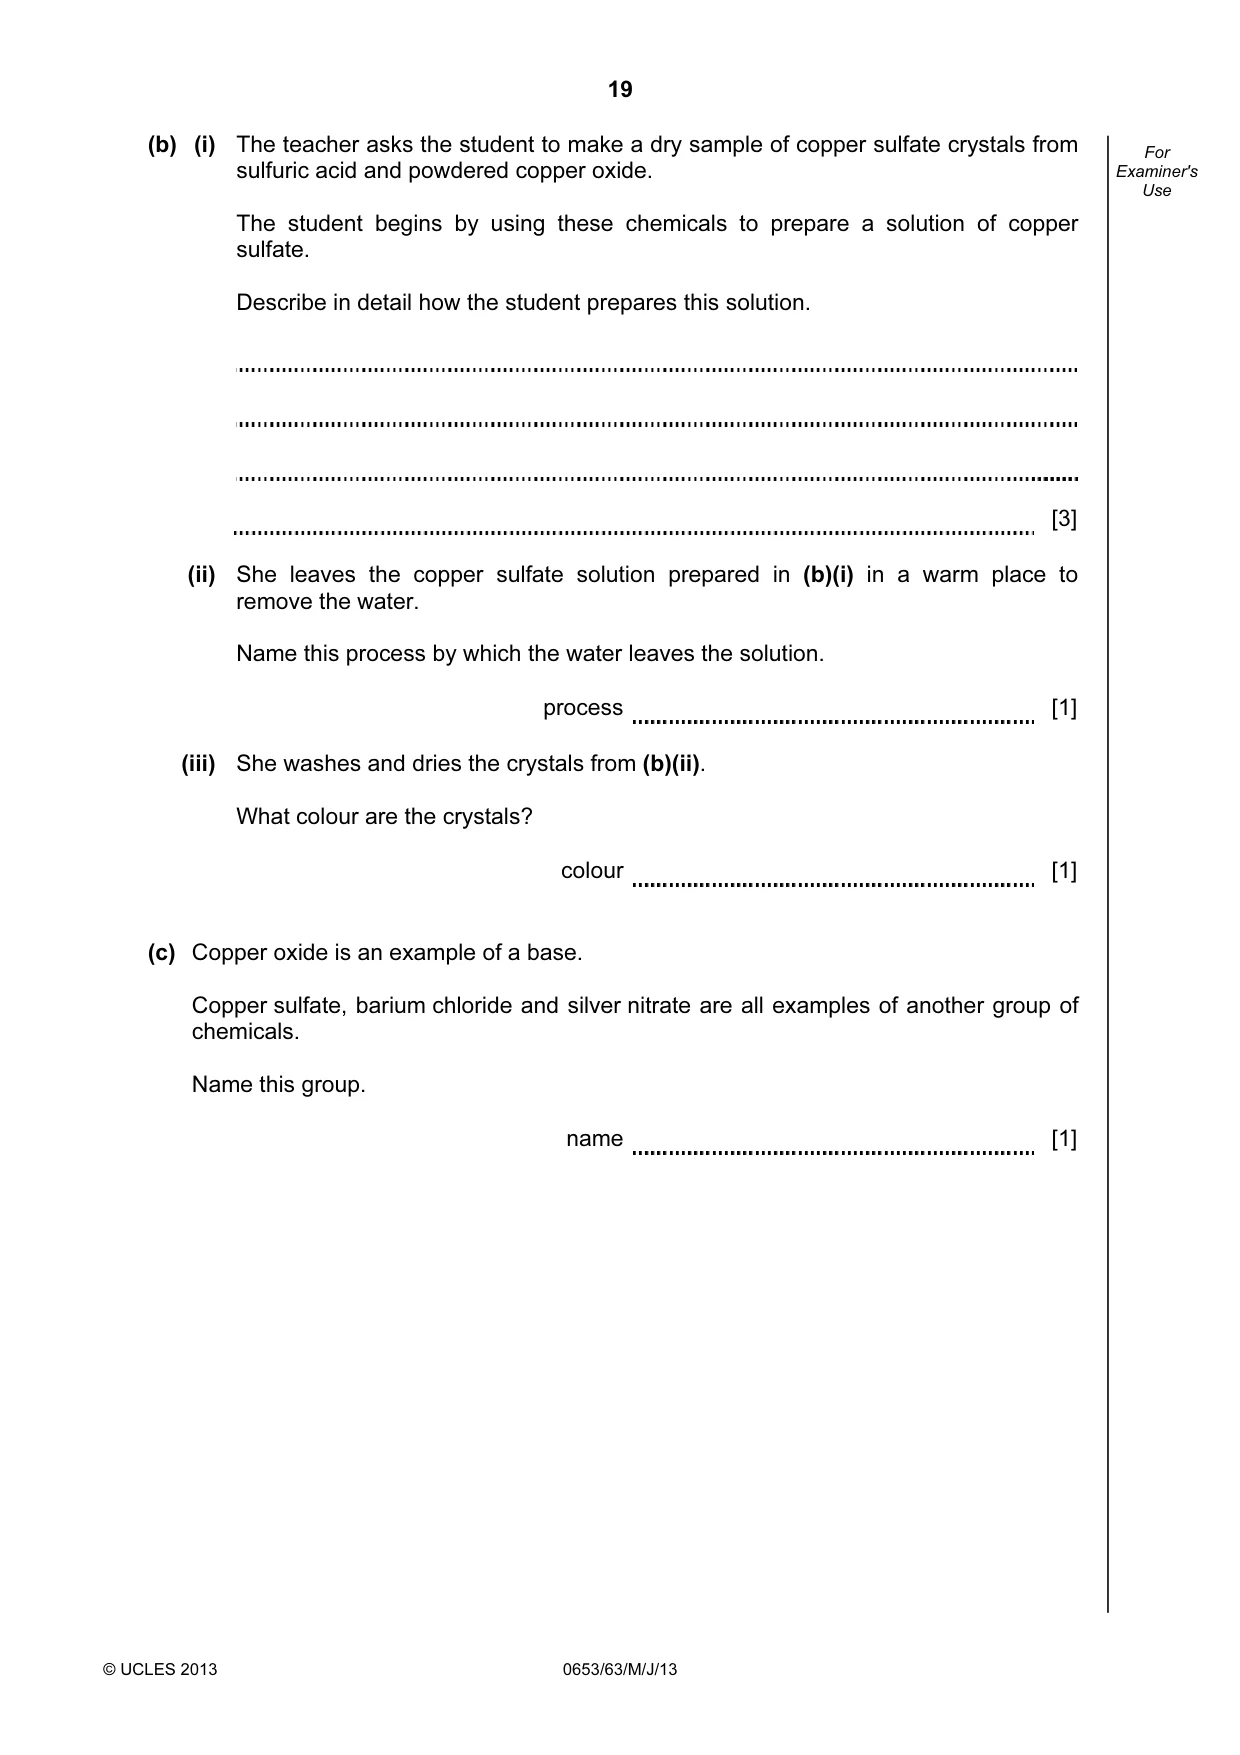
19 © UCLES 2013 0653/63/M/J/13 For Examiner's Use (b) (i) The teacher asks the student to make a dry sample of copper sulfate crystals from sulfuric acid and powdered copper oxide. The student begins by using these chemicals to prepare a solution of copper sulfate. Describe in detail how the student prepares this solution. [3] (ii) She leaves the copper sulfate solution prepared in (b)(i) in a warm place to remove the water. Name this process by which the water leaves the solution. process [1] (iii) She washes and dries the crystals from (b)(ii). What colour are the crystals? colour [1] (c) Copper oxide is an example of a base. Copper sulfate, barium chloride and silver nitrate are all examples of another group of chemicals. Name this group. name [1]
Question paper, page 20
20 Permission to reproduce items where third-party owned material protected by copyright is included has been sought and cleared where possible. Every reasonable effort has been made by the publisher (UCLES) to trace copyright holders, but if any items requiring clearance have unwittingly been included, the publisher will be pleased to make amends at the earliest possible opportunity. University of Cambridge International Examinations is part of the Cambridge Assessment Group. Cambridge Assessment is the brand name of University of Cambridge Local Examinations Syndicate (UCLES), which is itself a department of the University of Cambridge. © UCLES 2013 0653/63/M/J/13 BLANK PAGE
Mark scheme, page 1
CAMBRIDGE INTERNATIONAL EXAMINATIONS International General Certificate of Secondary Education MARK SCHEME for the May/June 2013 series 0653 COMBINED SCIENCE 0653/63 Paper 6 (Alternative to Practical), maximum raw mark 60 This mark scheme is published as an aid to teachers and candidates, to indicate the requirements of the examination. It shows the basis on which Examiners were instructed to award marks. It does not indicate the details of the discussions that took place at an Examiners’ meeting before marking began, which would have considered the acceptability of alternative answers. Mark schemes should be read in conjunction with the question paper and the Principal Examiner Report for Teachers. Cambridge will not enter into discussions about these mark schemes. Cambridge is publishing the mark schemes for the May/June 2013 series for most IGCSE, GCE Advanced Level and Advanced Subsidiary Level components and some Ordinary Level components. www.XtremePapers.com
Mark scheme, page 2
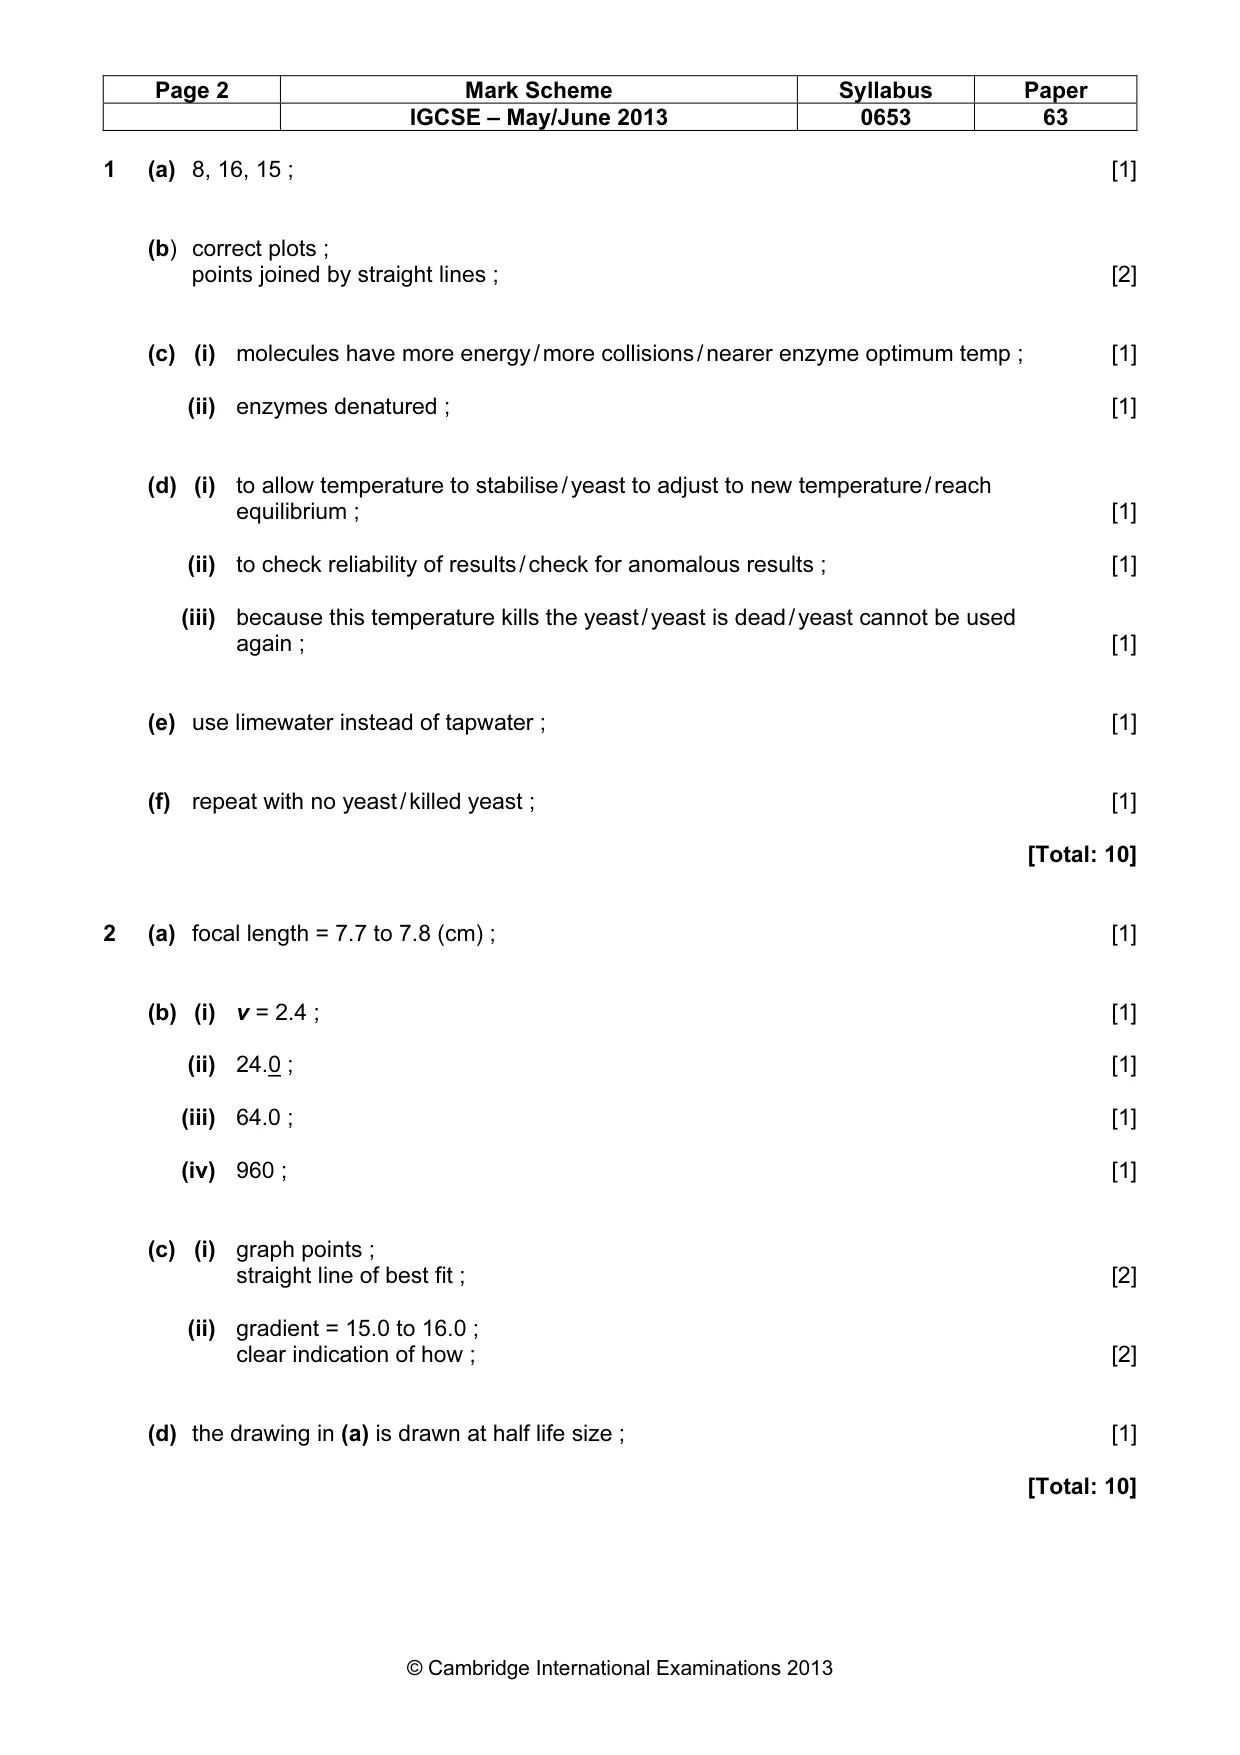
Page 2 Mark Scheme Syllabus Paper IGCSE – May/June 2013 0653 63 © Cambridge International Examinations 2013 1 (a) 8, 16, 15 ; [1] (b) correct plots ; points joined by straight lines ; [2] (c) (i) molecules have more energy / more collisions / nearer enzyme optimum temp ; [1] (ii) enzymes denatured ; [1] (d) (i) to allow temperature to stabilise / yeast to adjust to new temperature / reach equilibrium ; [1] (ii) to check reliability of results / check for anomalous results ; [1] (iii) because this temperature kills the yeast / yeast is dead / yeast cannot be used again ; [1] (e) use limewater instead of tapwater ; [1] (f) repeat with no yeast / killed yeast ; [1] [Total: 10] 2 (a) focal length = 7.7 to 7.8 (cm) ; [1] (b) (i) v = 2.4 ; [1] (ii) 24.0 ; [1] (iii) 64.0 ; [1] (iv) 960 ; [1] (c) (i) graph points ; straight line of best fit ; [2] (ii) gradient = 15.0 to 16.0 ; clear indication of how ; [2] (d) the drawing in (a) is drawn at half life size ; [1] [Total: 10]
Mark scheme, page 3
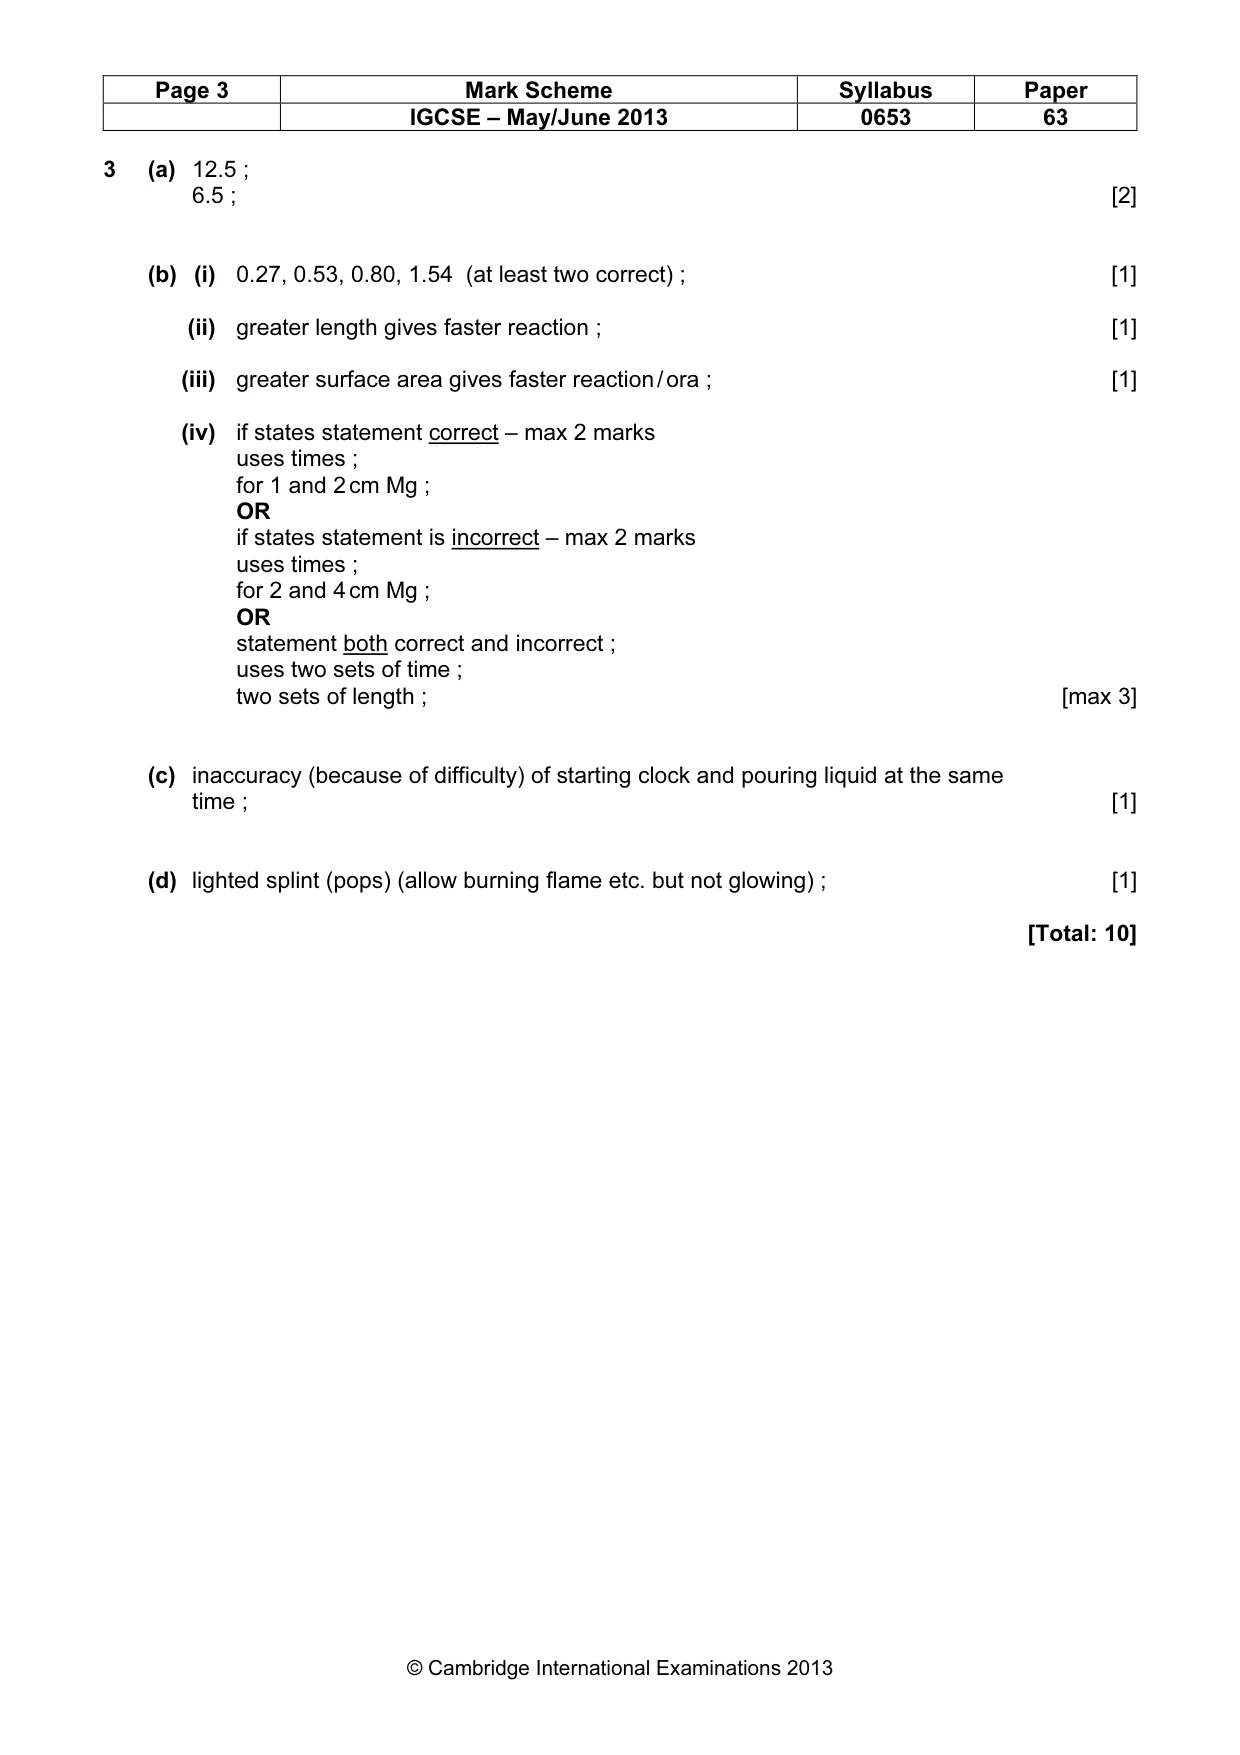
Page 3 Mark Scheme Syllabus Paper IGCSE – May/June 2013 0653 63 © Cambridge International Examinations 2013 3 (a) 12.5 ; 6.5 ; [2] (b) (i) 0.27, 0.53, 0.80, 1.54 (at least two correct) ; [1] (ii) greater length gives faster reaction ; [1] (iii) greater surface area gives faster reaction / ora ; [1] (iv) if states statement correct – max 2 marks uses times ; for 1 and 2 cm Mg ; OR if states statement is incorrect – max 2 marks uses times ; for 2 and 4 cm Mg ; OR statement both correct and incorrect ; uses two sets of time ; two sets of length ; [max 3] (c) inaccuracy (because of difficulty) of starting clock and pouring liquid at the same time ; [1] (d) lighted splint (pops) (allow burning flame etc. but not glowing) ; [1] [Total: 10]
Mark scheme, page 4
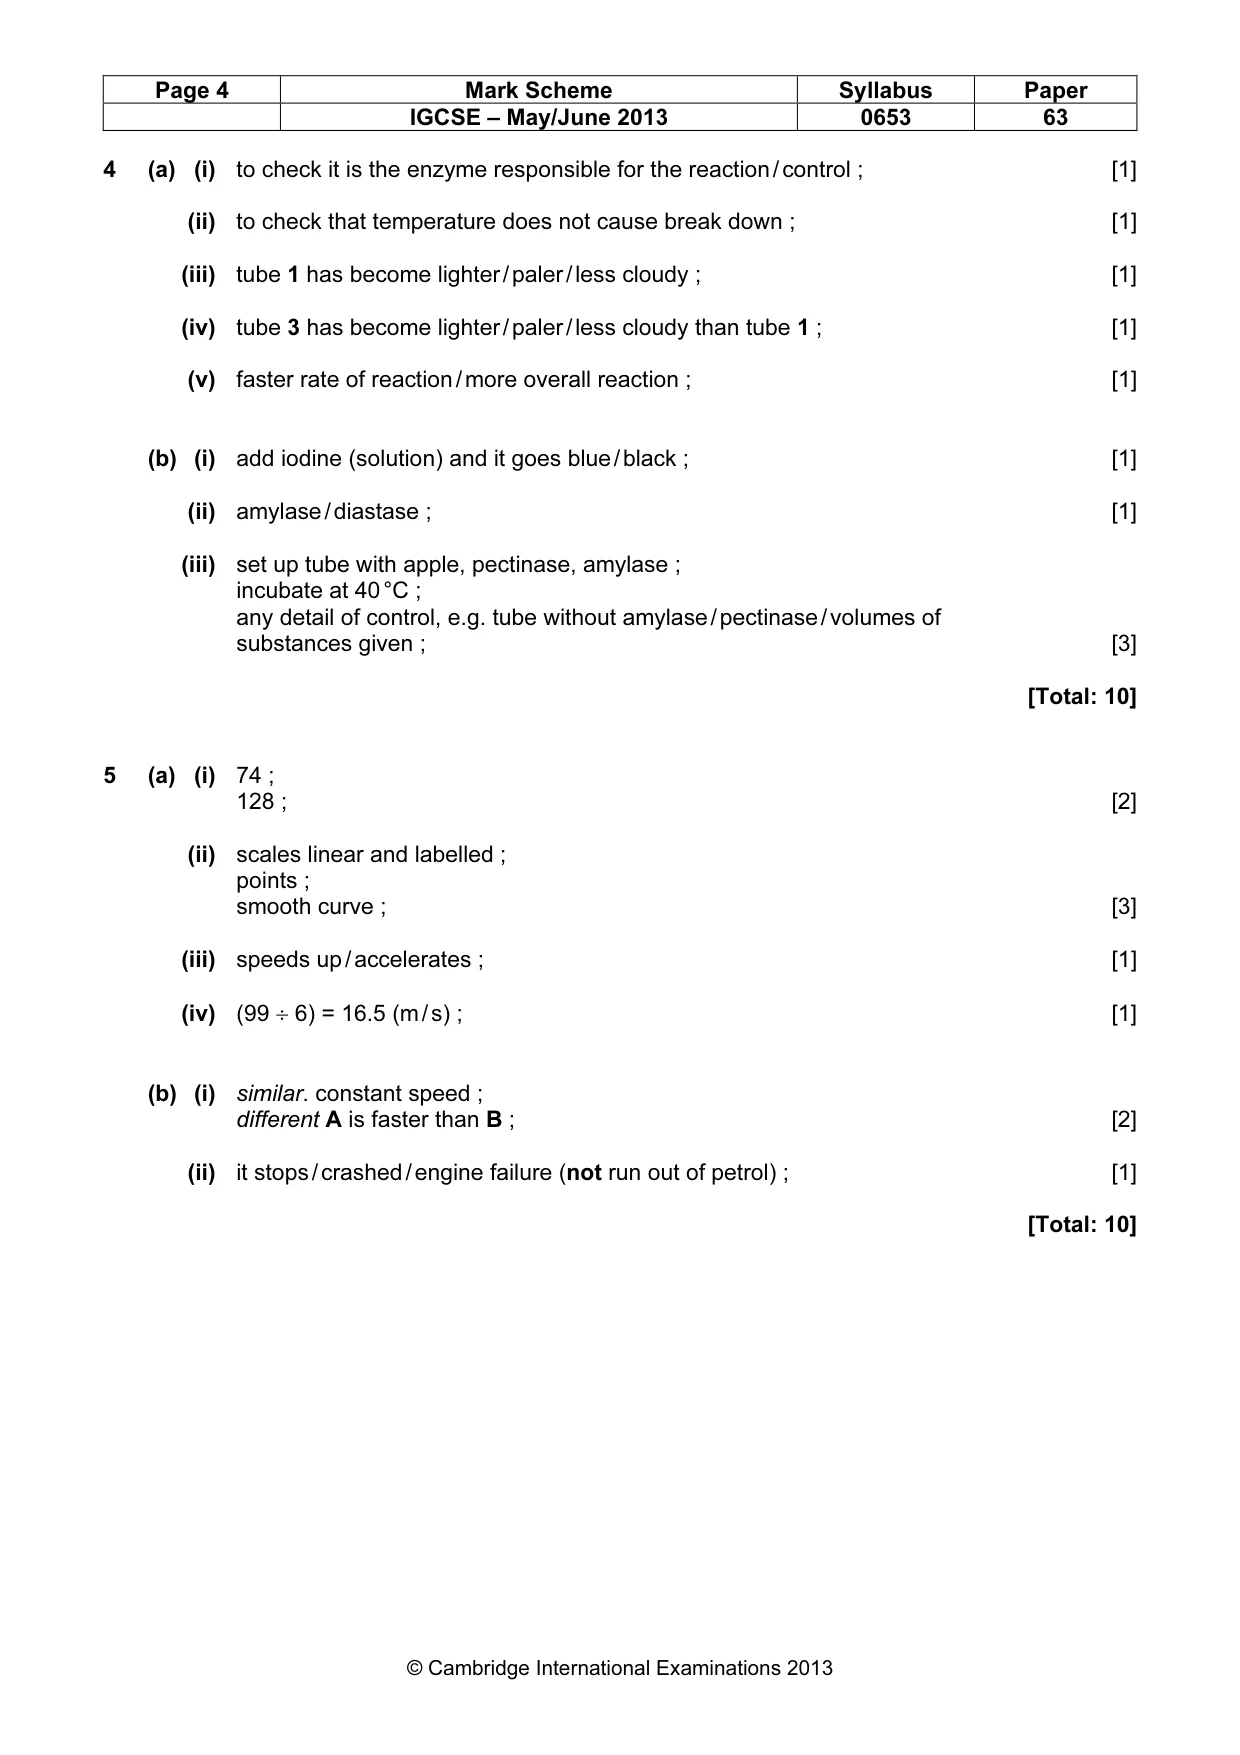
Page 4 Mark Scheme Syllabus Paper IGCSE – May/June 2013 0653 63 © Cambridge International Examinations 2013 4 (a) (i) to check it is the enzyme responsible for the reaction / control ; [1] (ii) to check that temperature does not cause break down ; [1] (iii) tube 1 has become lighter / paler / less cloudy ; [1] (iv) tube 3 has become lighter / paler / less cloudy than tube 1 ; [1] (v) faster rate of reaction / more overall reaction ; [1] (b) (i) add iodine (solution) and it goes blue / black ; [1] (ii) amylase / diastase ; [1] (iii) set up tube with apple, pectinase, amylase ; incubate at 40 °C ; any detail of control, e.g. tube without amylase / pectinase / volumes of substances given ; [3] [Total: 10] 5 (a) (i) 74 ; 128 ; [2] (ii) scales linear and labelled ; points ; smooth curve ; [3] (iii) speeds up / accelerates ; [1] (iv) (99 ÷ 6) = 16.5 (m / s) ; [1] (b) (i) similar. constant speed ; different A is faster than B ; [2] (ii) it stops / crashed / engine failure (not run out of petrol) ; [1] [Total: 10]
Mark scheme, page 5
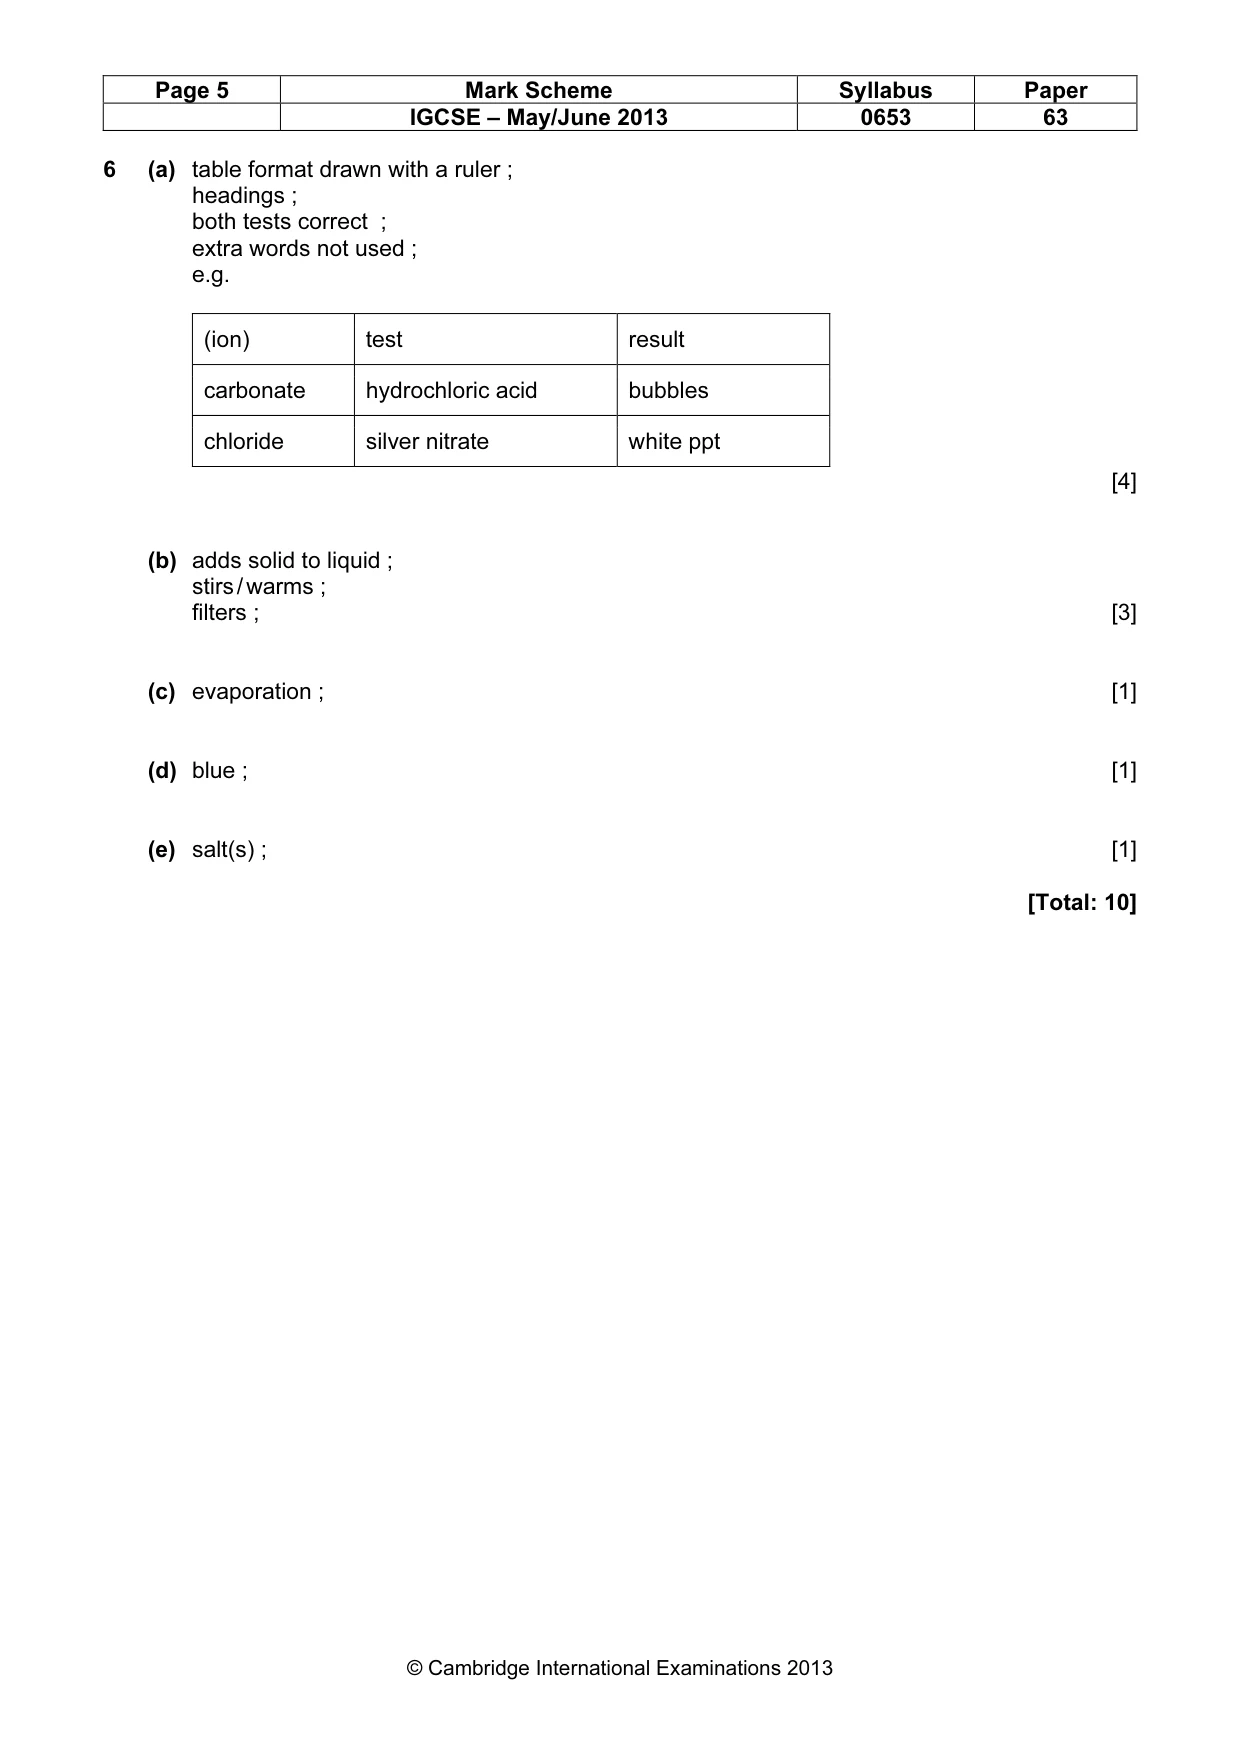
Page 5 Mark Scheme Syllabus Paper IGCSE – May/June 2013 0653 63 © Cambridge International Examinations 2013 6 (a) table format drawn with a ruler ; headings ; both tests correct ; extra words not used ; e.g. (ion) test result carbonate hydrochloric acid bubbles chloride silver nitrate white ppt [4] (b) adds solid to liquid ; stirs / warms ; filters ; [3] (c) evaporation ; [1] (d) blue ; [1] (e) salt(s) ; [1] [Total: 10]
What you needed in this session
Cambridge’s own grade thresholds for 2013 May/June, Paper 6 · Variant 3. A higher threshold means an easier paper — the bar moves with how the cohort did.