Cambridge IGCSE Science - Combined 0653 — 2013 May/June Paper 6 · Variant 2
0653/62/M/J/13 · 60 marks · ≈68 min
The question paper and its mark scheme, free to read here and free to download. This is Cambridge’s own paper, exactly as it was sat.
Question paper20 pages





Mark scheme5 pages
Answers below. Sit the paper first if you are practising.
Paper as text
Question paper, page 1
This document consists of 18 printed pages and 2 blank pages. IB13 06_0653_62/RP © UCLES 2013 [Turn over *5497976500* For Examiner's Use 1 2 3 4 5 6 Total UNIVERSITY OF CAMBRIDGE INTERNATIONAL EXAMINATIONS International General Certificate of Secondary Education COMBINED SCIENCE 0653/62 Paper 6 Alternative to Practical May/June 2013 1 hour Candidates answer on the Question paper. No Additional Materials are required. READ THESE INSTRUCTIONS FIRST Write your Centre number, candidate number and name on all the work you hand in. Write in dark blue or black pen. You may use a pencil for any diagrams or graphs. Do not use staples, paper clips, glue or correction fluid. DO NOT WRITE IN ANY BARCODES. Answer all questions. Electronic calculators may be used. You may lose marks if you do not show your working or if you do not use appropriate units. At the end of the examination, fasten all your work securely together. The number of marks is given in brackets [ ] at the end of each question or part question. www.XtremePapers.com
Question paper, page 2
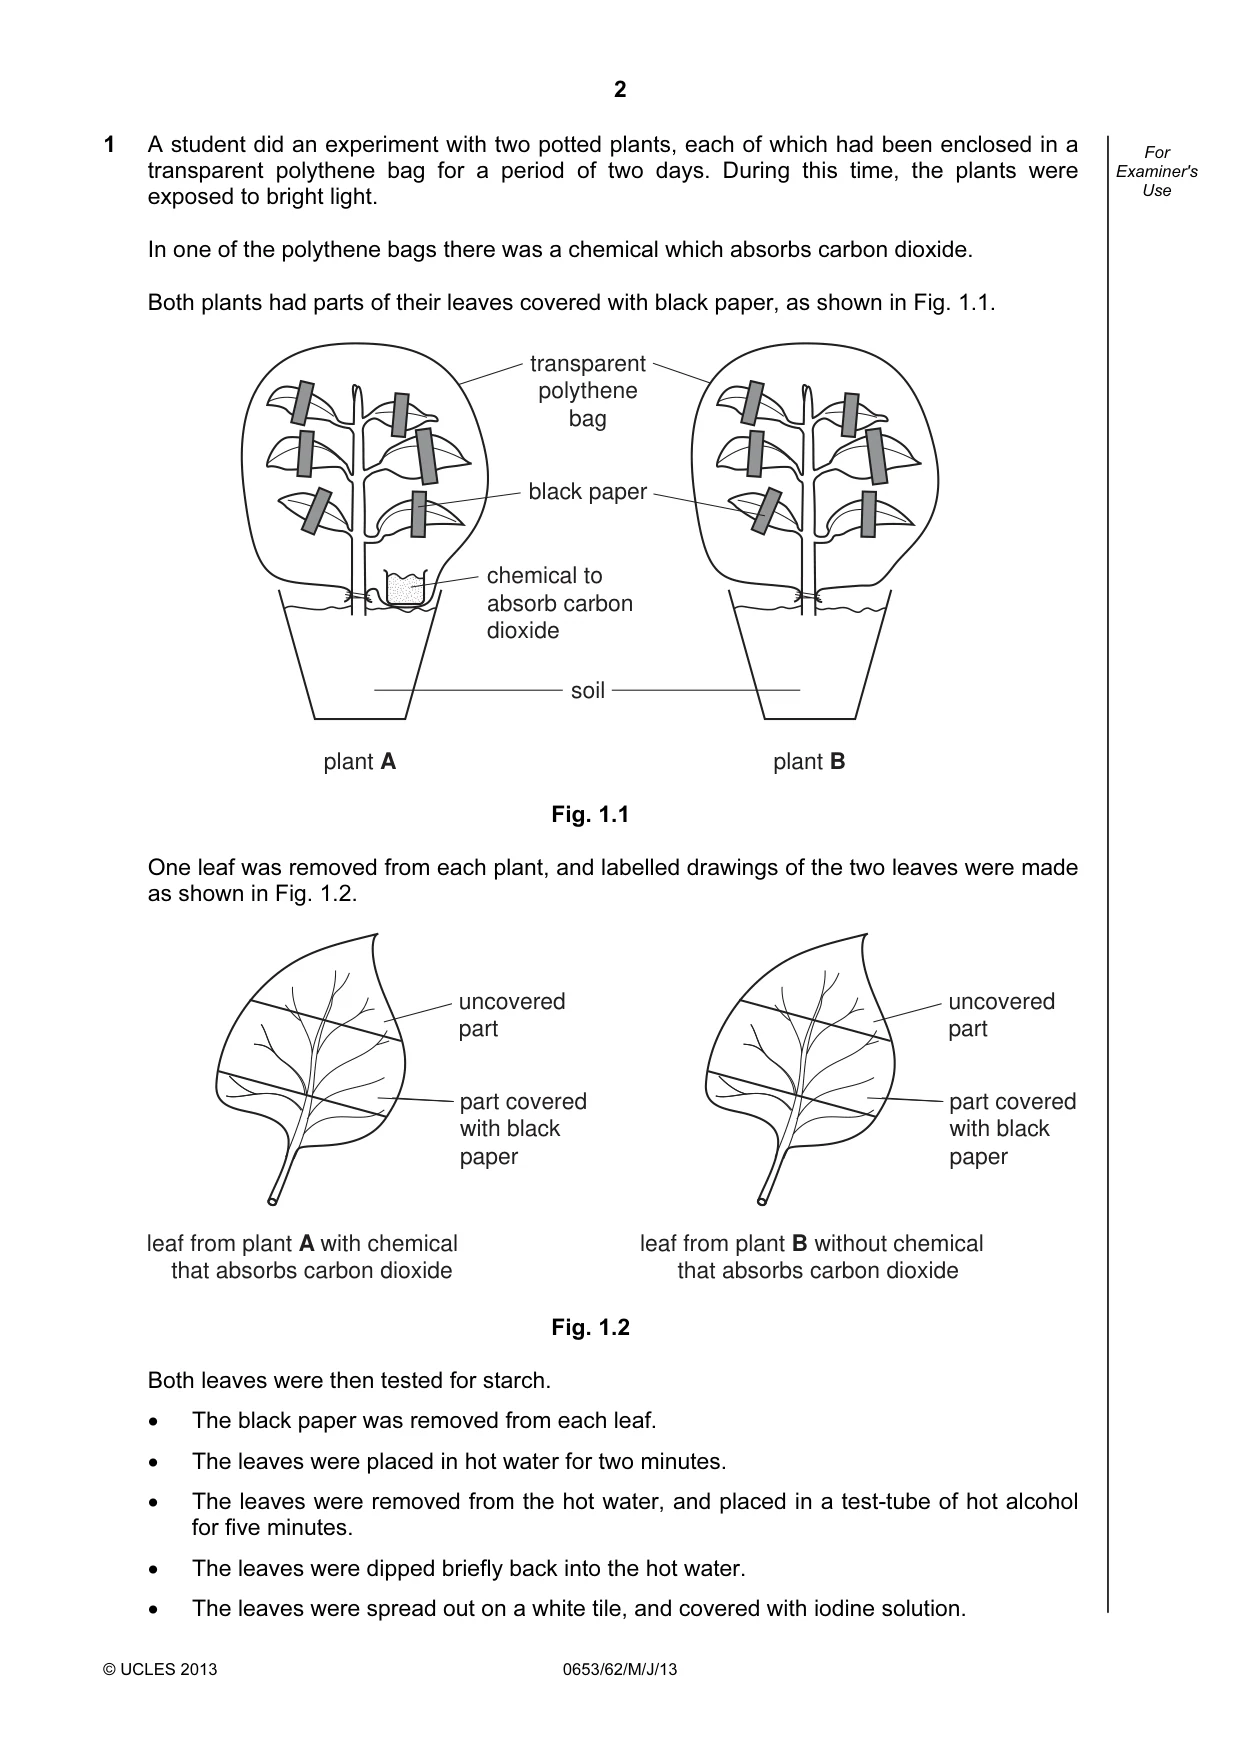
2 © UCLES 2013 0653/62/M/J/13 For Examiner's Use 1 A student did an experiment with two potted plants, each of which had been enclosed in a transparent polythene bag for a period of two days. During this time, the plants were exposed to bright light. In one of the polythene bags there was a chemical which absorbs carbon dioxide. Both plants had parts of their leaves covered with black paper, as shown in Fig. 1.1. plant A plant B soil black paper chemical to absorb carbon dioxide transparent polythene bag Fig. 1.1 One leaf was removed from each plant, and labelled drawings of the two leaves were made as shown in Fig. 1.2. leaf from plant B without chemical that absorbs carbon dioxide part covered with black paper leaf from plant A with chemical that absorbs carbon dioxide uncovered part part covered with black paper uncovered part Fig. 1.2 Both leaves were then tested for starch. • The black paper was removed from each leaf. • The leaves were placed in hot water for two minutes. • The leaves were removed from the hot water, and placed in a test-tube of hot alcohol for five minutes. • The leaves were dipped briefly back into the hot water. • The leaves were spread out on a white tile, and covered with iodine solution.
Question paper, page 3
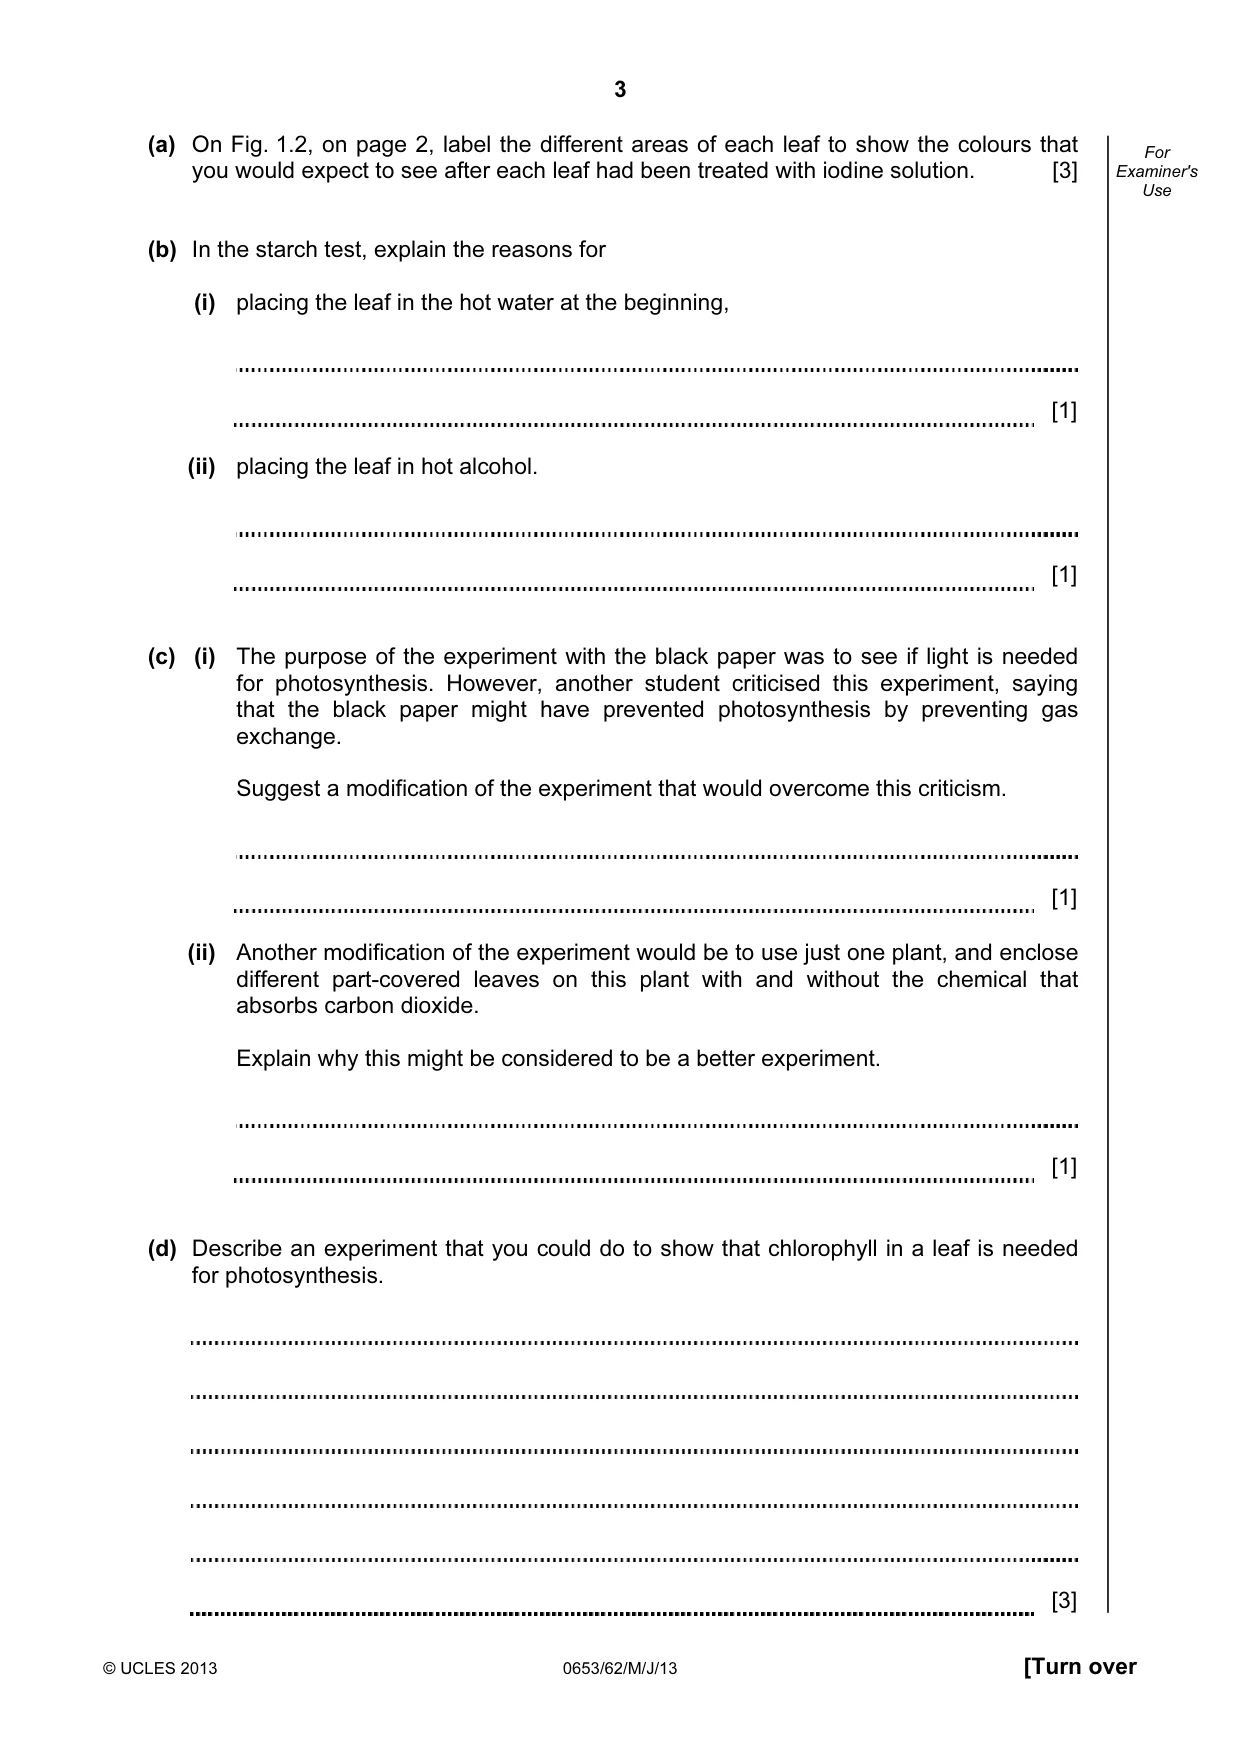
3 © UCLES 2013 0653/62/M/J/13 [Turn over For Examiner's Use (a) On Fig. 1.2, on page 2, label the different areas of each leaf to show the colours that you would expect to see after each leaf had been treated with iodine solution. [3] (b) In the starch test, explain the reasons for (i) placing the leaf in the hot water at the beginning, [1] (ii) placing the leaf in hot alcohol. [1] (c) (i) The purpose of the experiment with the black paper was to see if light is needed for photosynthesis. However, another student criticised this experiment, saying that the black paper might have prevented photosynthesis by preventing gas exchange. Suggest a modification of the experiment that would overcome this criticism. [1] (ii) Another modification of the experiment would be to use just one plant, and enclose different part-covered leaves on this plant with and without the chemical that absorbs carbon dioxide. Explain why this might be considered to be a better experiment. [1] (d) Describe an experiment that you could do to show that chlorophyll in a leaf is needed for photosynthesis. [3]
Question paper, page 4
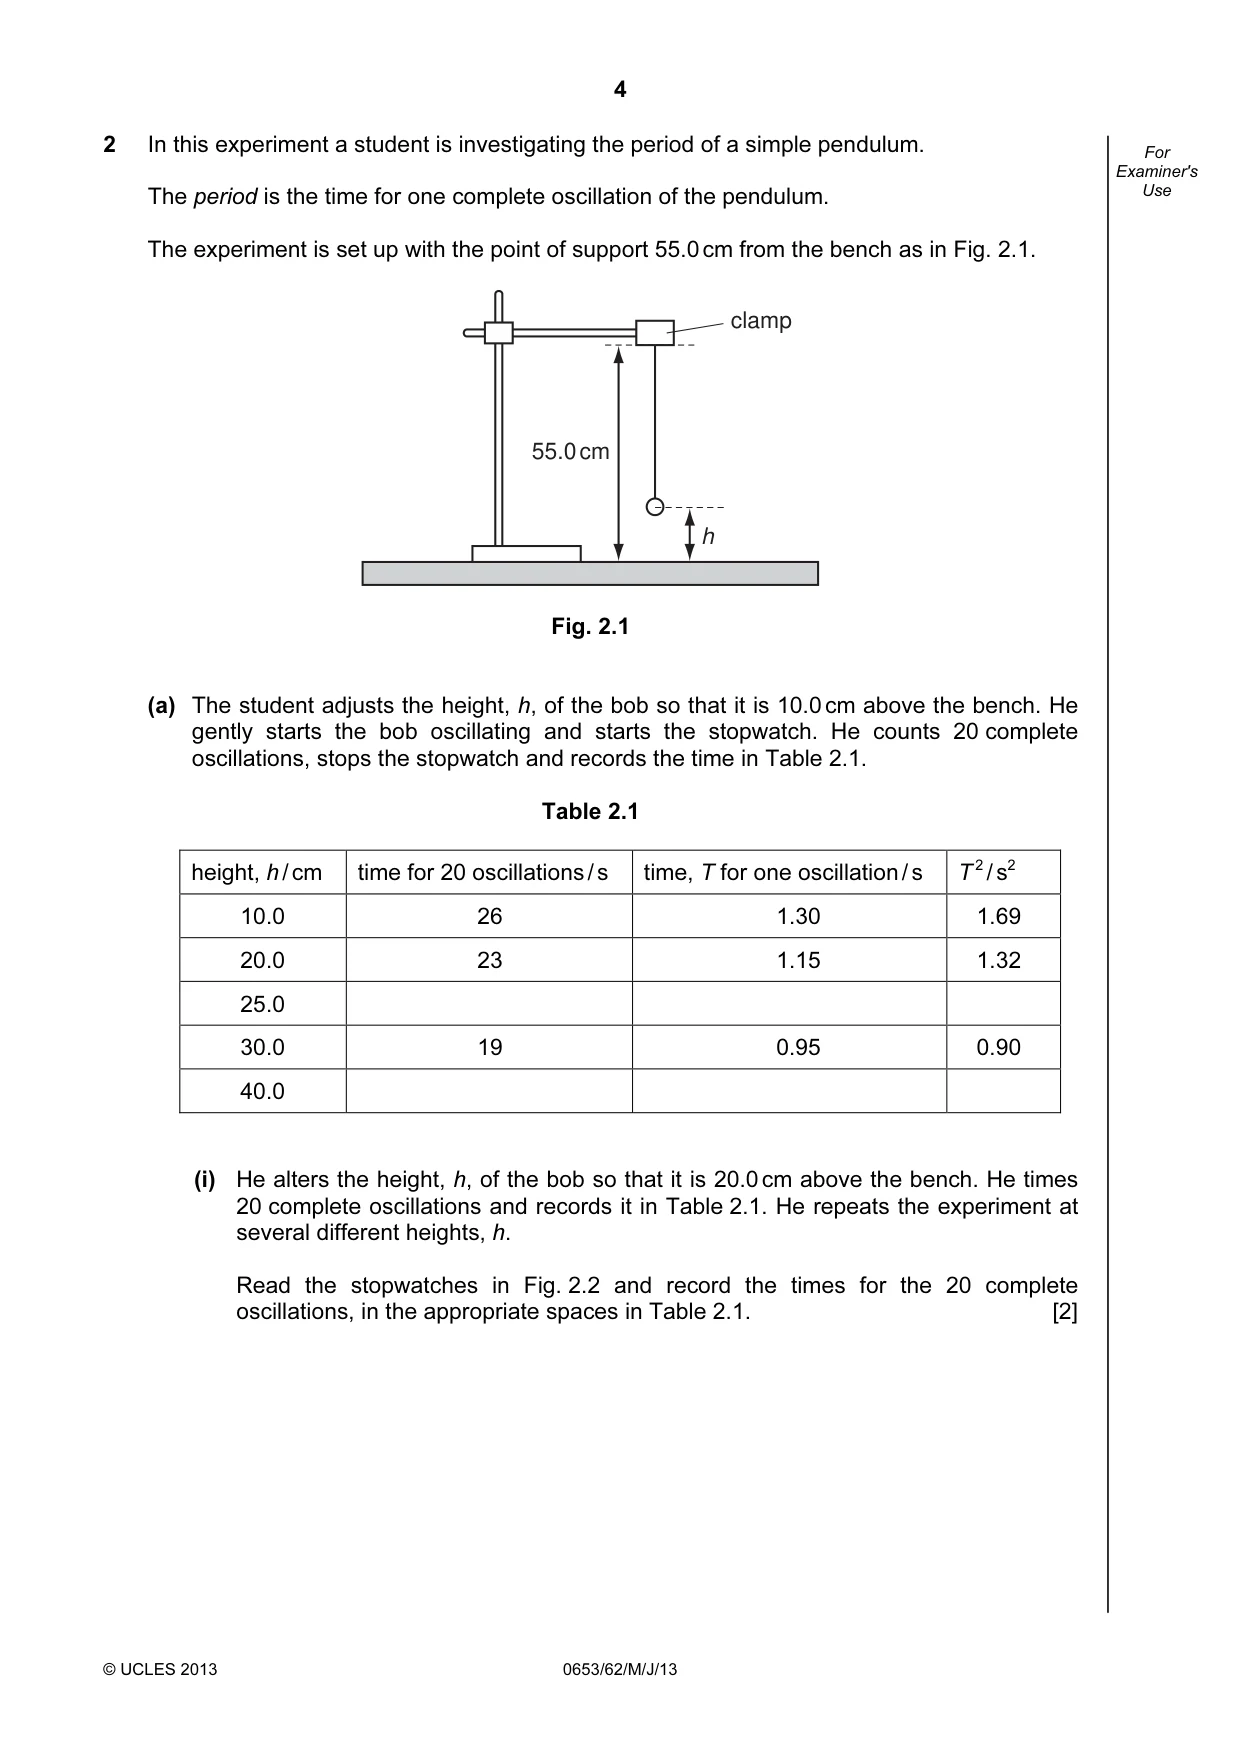
4 © UCLES 2013 0653/62/M/J/13 For Examiner's Use 2 In this experiment a student is investigating the period of a simple pendulum. The period is the time for one complete oscillation of the pendulum. The experiment is set up with the point of support 55.0 cm from the bench as in Fig. 2.1. clamp 55.0 cm h Fig. 2.1 (a) The student adjusts the height, h, of the bob so that it is 10.0 cm above the bench. He gently starts the bob oscillating and starts the stopwatch. He counts 20 complete oscillations, stops the stopwatch and records the time in Table 2.1. Table 2.1 height, h / cm time for 20 oscillations / s time, T for one oscillation / s T 2 / s2 10.0 26 1.30 1.69 20.0 23 1.15 1.32 25.0 30.0 19 0.95 0.90 40.0 (i) He alters the height, h, of the bob so that it is 20.0 cm above the bench. He times 20 complete oscillations and records it in Table 2.1. He repeats the experiment at several different heights, h. Read the stopwatches in Fig. 2.2 and record the times for the 20 complete oscillations, in the appropriate spaces in Table 2.1. [2]
Question paper, page 5
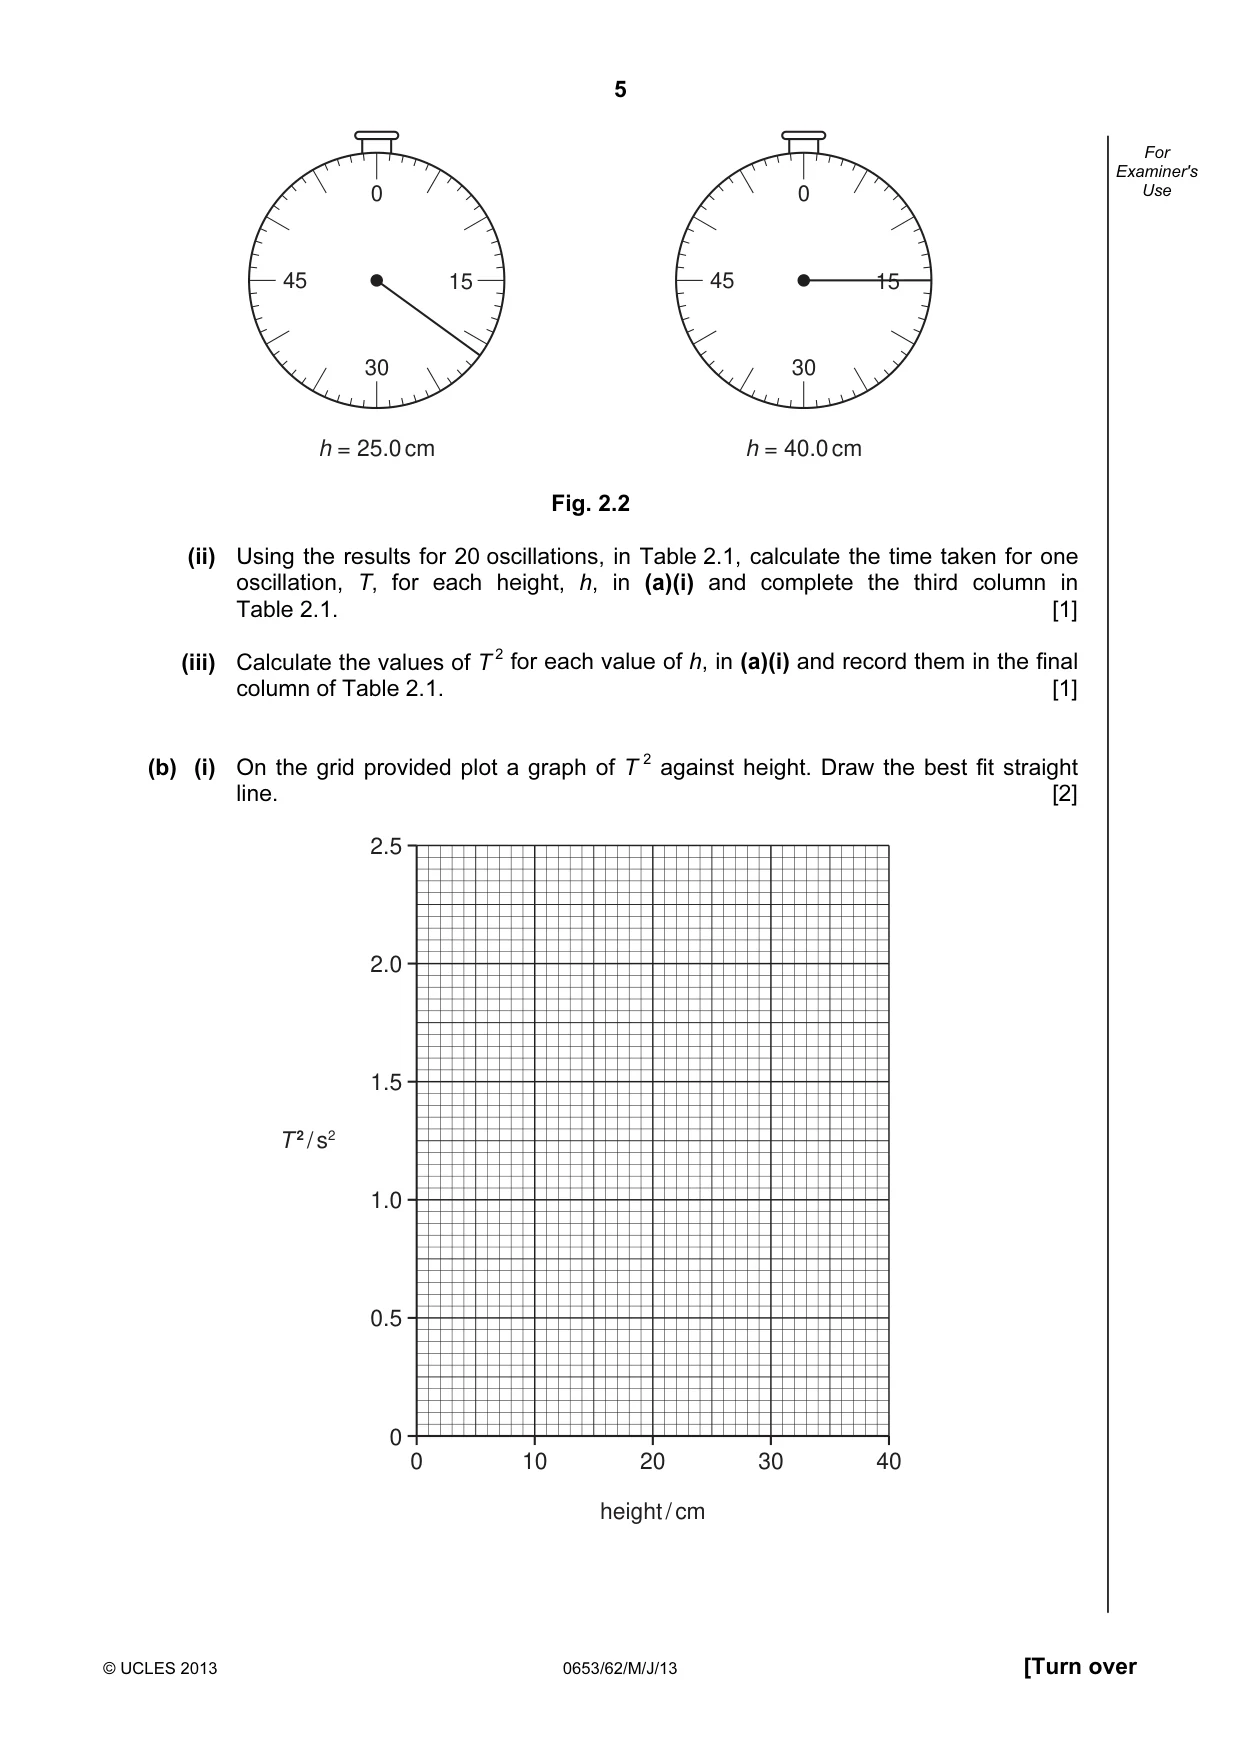
5 © UCLES 2013 0653/62/M/J/13 [Turn over For Examiner's Use 0 15 30 45 h = 25.0 cm 0 15 30 45 h = 40.0 cm Fig. 2.2 (ii) Using the results for 20 oscillations, in Table 2.1, calculate the time taken for one oscillation, T, for each height, h, in (a)(i) and complete the third column in Table 2.1. [1] (iii) Calculate the values of T 2 for each value of h, in (a)(i) and record them in the final column of Table 2.1. [1] (b) (i) On the grid provided plot a graph of T 2 against height. Draw the best fit straight line. [2] 0 10 20 height / cm 30 40 2.5 2.0 1.5 1.0 0.5 0 T 2 / s2
Question paper, page 6
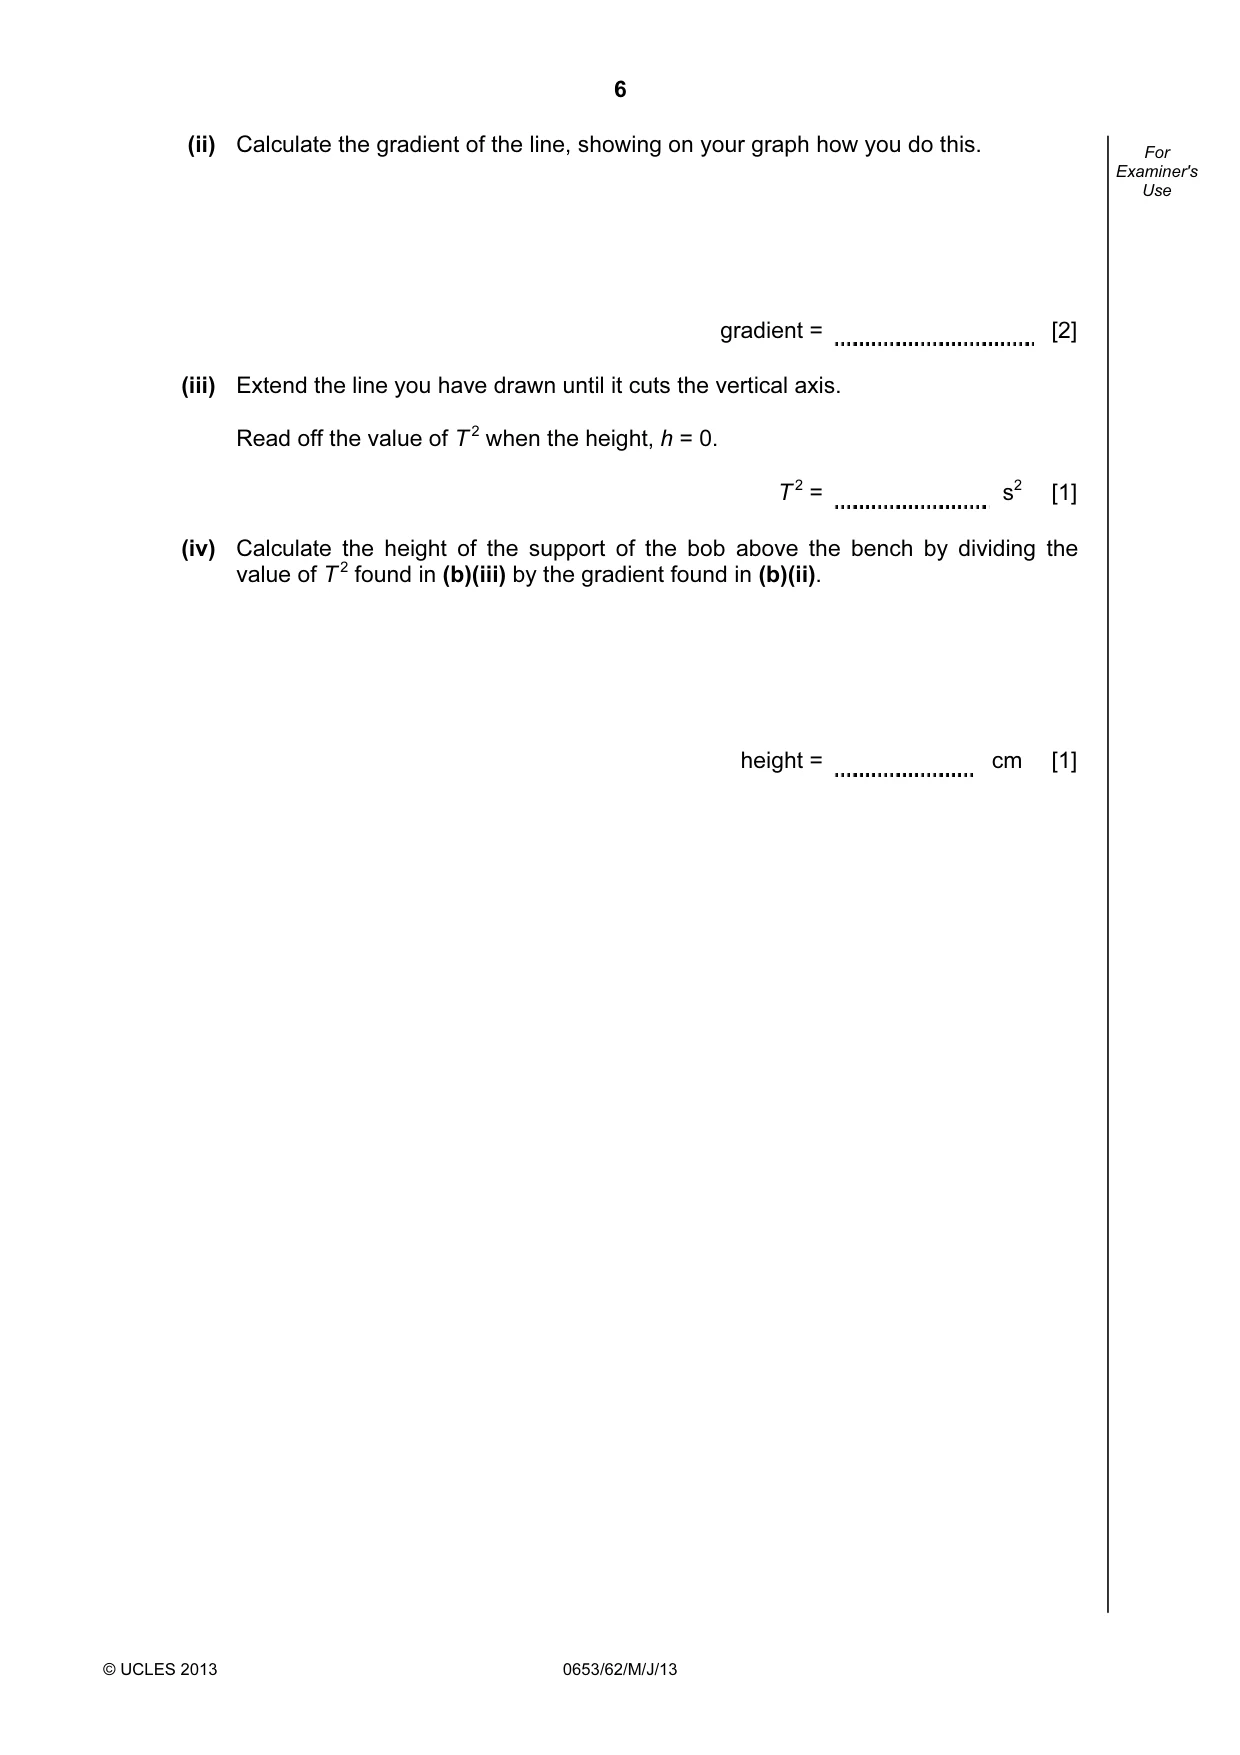
6 © UCLES 2013 0653/62/M/J/13 For Examiner's Use (ii) Calculate the gradient of the line, showing on your graph how you do this. gradient = [2] (iii) Extend the line you have drawn until it cuts the vertical axis. Read off the value of T 2 when the height, h = 0. T 2 = s2 [1] (iv) Calculate the height of the support of the bob above the bench by dividing the value of T 2 found in (b)(iii) by the gradient found in (b)(ii). height = cm [1]
Question paper, page 7
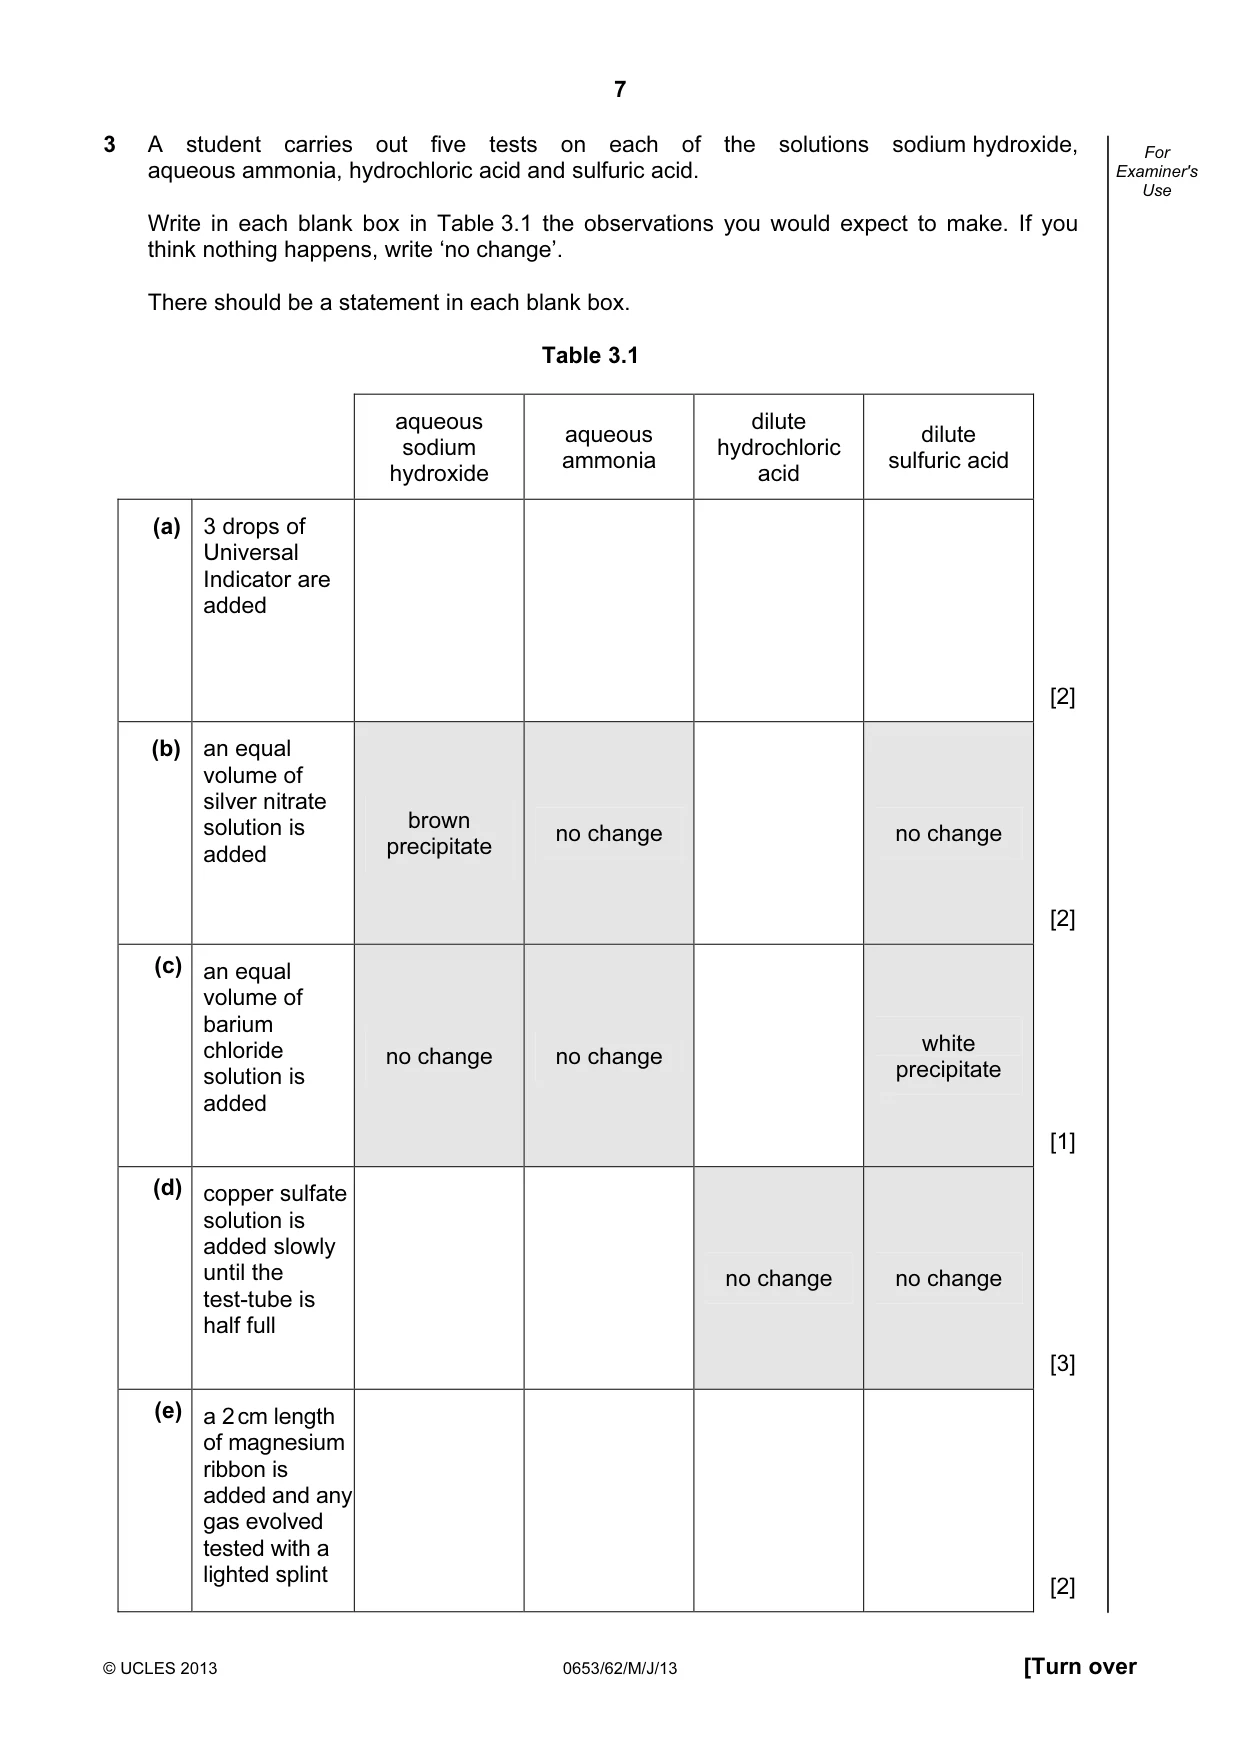
7 © UCLES 2013 0653/62/M/J/13 [Turn over For Examiner's Use 3 A student carries out five tests on each of the solutions sodium hydroxide, aqueous ammonia, hydrochloric acid and sulfuric acid. Write in each blank box in Table 3.1 the observations you would expect to make. If you think nothing happens, write ‘no change’. There should be a statement in each blank box. Table 3.1 aqueous sodium hydroxide aqueous ammonia dilute hydrochloric acid dilute sulfuric acid (a) 3 drops of Universal Indicator are added [2] (b) an equal volume of silver nitrate solution is added brown precipitate no change no change [2] (c) an equal volume of barium chloride solution is added no change no change white precipitate [1] (d) copper sulfate solution is added slowly until the test-tube is half full no change no change [3] (e) a 2 cm length of magnesium ribbon is added and any gas evolved tested with a lighted splint [2]
Question paper, page 8
8 © UCLES 2013 0653/62/M/J/13 BLANK PAGE
Question paper, page 9
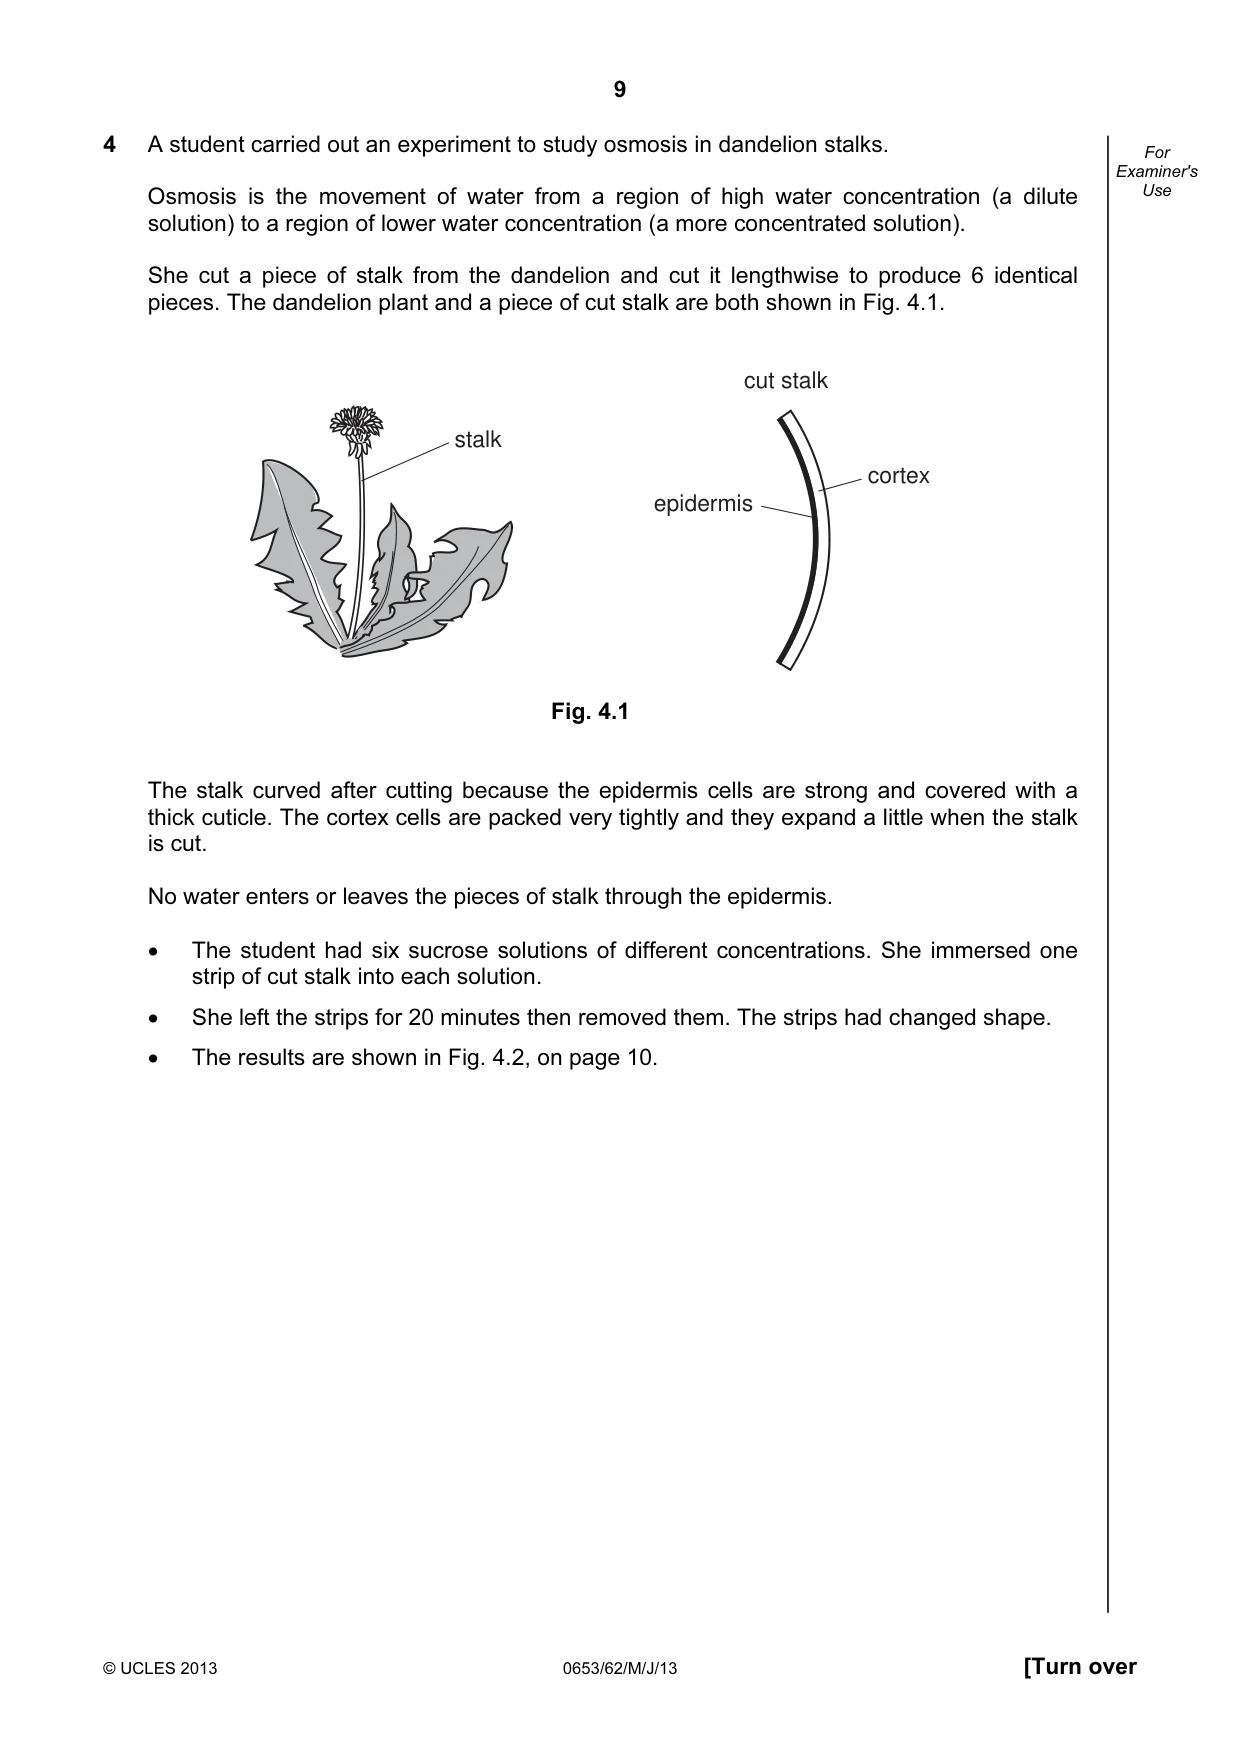
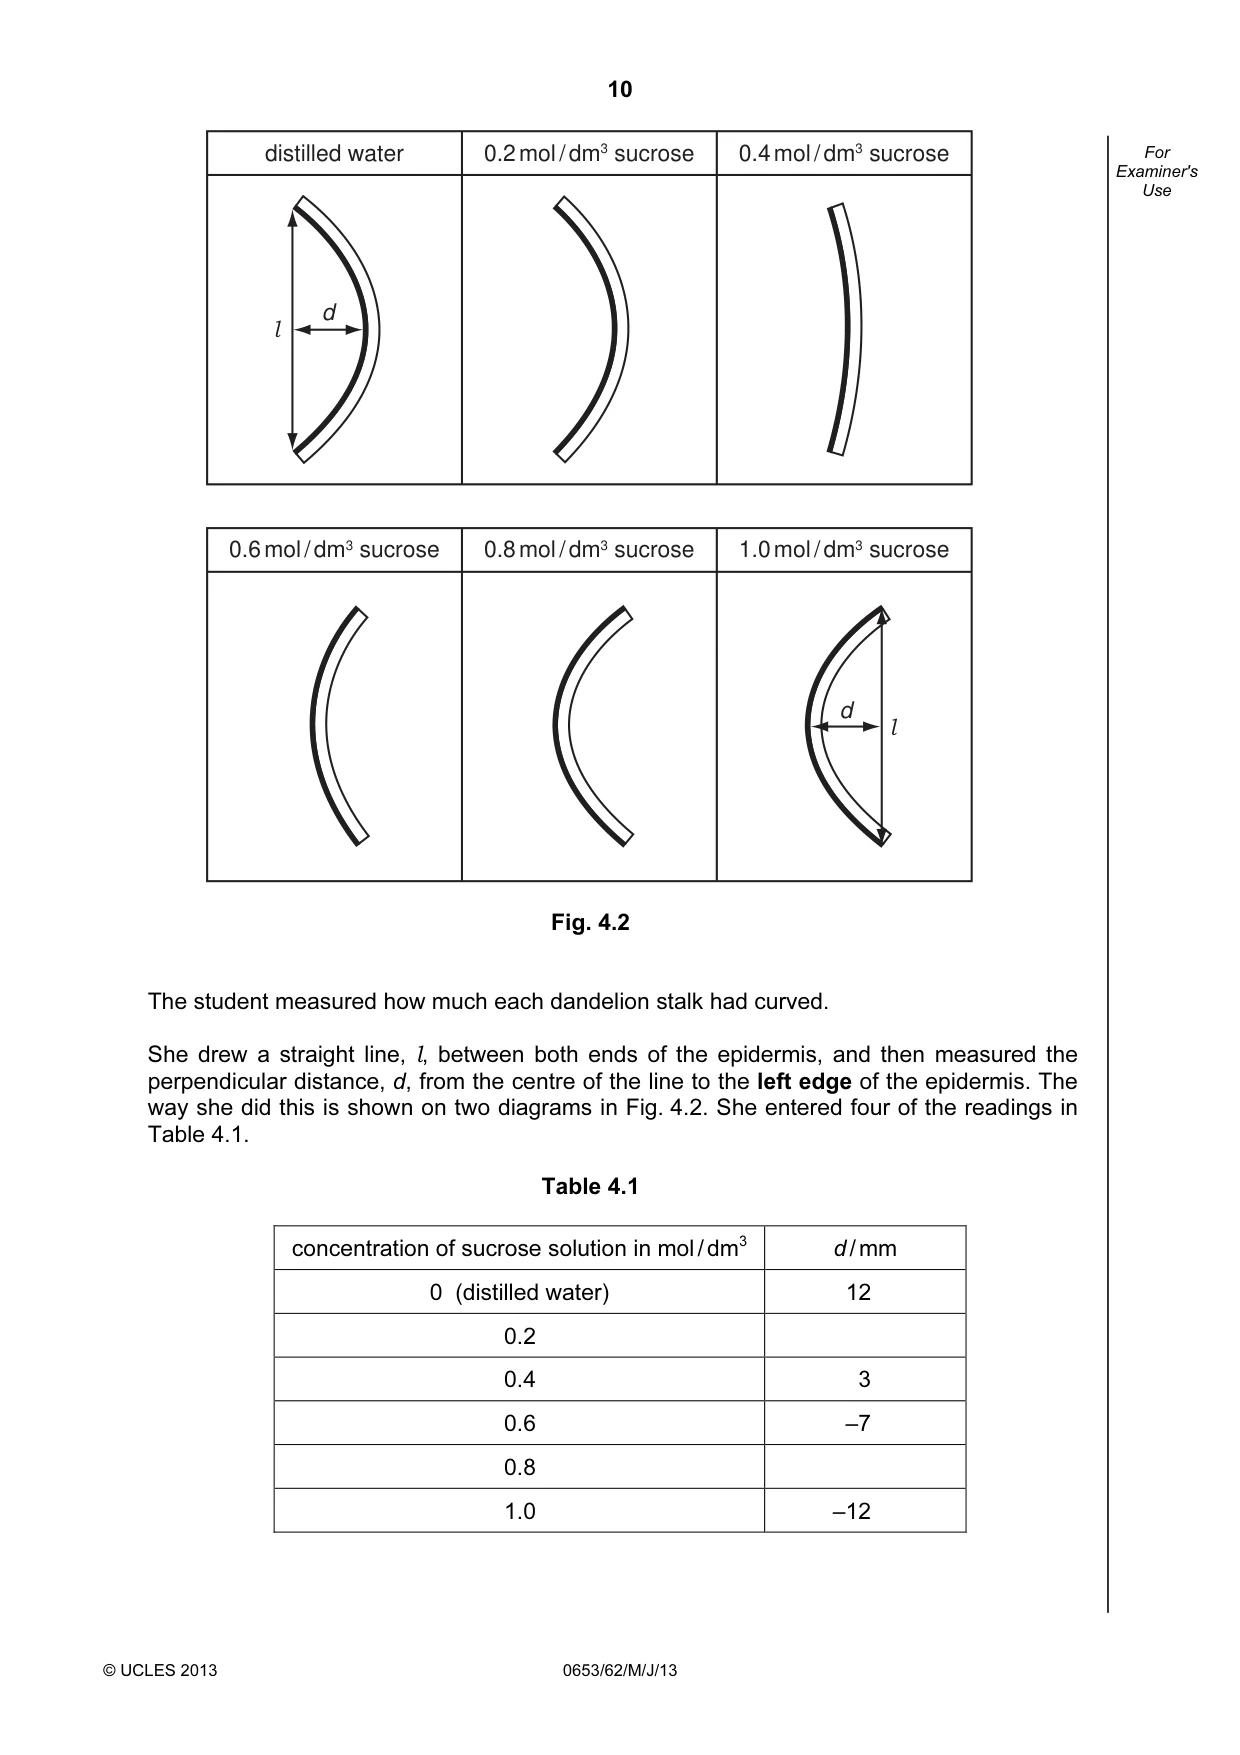
9 © UCLES 2013 0653/62/M/J/13 [Turn over For Examiner's Use 4 A student carried out an experiment to study osmosis in dandelion stalks. Osmosis is the movement of water from a region of high water concentration (a dilute solution) to a region of lower water concentration (a more concentrated solution). She cut a piece of stalk from the dandelion and cut it lengthwise to produce 6 identical pieces. The dandelion plant and a piece of cut stalk are both shown in Fig. 4.1. stalk cut stalk epidermis cortex Fig. 4.1 The stalk curved after cutting because the epidermis cells are strong and covered with a thick cuticle. The cortex cells are packed very tightly and they expand a little when the stalk is cut. No water enters or leaves the pieces of stalk through the epidermis. • The student had six sucrose solutions of different concentrations. She immersed one strip of cut stalk into each solution. • She left the strips for 20 minutes then removed them. The strips had changed shape. • The results are shown in Fig. 4.2, on page 10.
Question paper, page 10
10 © UCLES 2013 0653/62/M/J/13 For Examiner's Use distilled water 0.2 mol / dm3 sucrose 0.4 mol / dm3 sucrose 0.6 mol / dm3 sucrose 0.8 mol / dm3 sucrose 1.0 mol / dm3 sucrose l d l d Fig. 4.2 The student measured how much each dandelion stalk had curved. She drew a straight line, l, between both ends of the epidermis, and then measured the perpendicular distance, d, from the centre of the line to the left edge of the epidermis. The way she did this is shown on two diagrams in Fig. 4.2. She entered four of the readings in Table 4.1. Table 4.1 concentration of sucrose solution in mol / dm3 d / mm 0 (distilled water) 12 0.2 0.4 3 0.6 –7 0.8 1.0 –12
Question paper, page 11
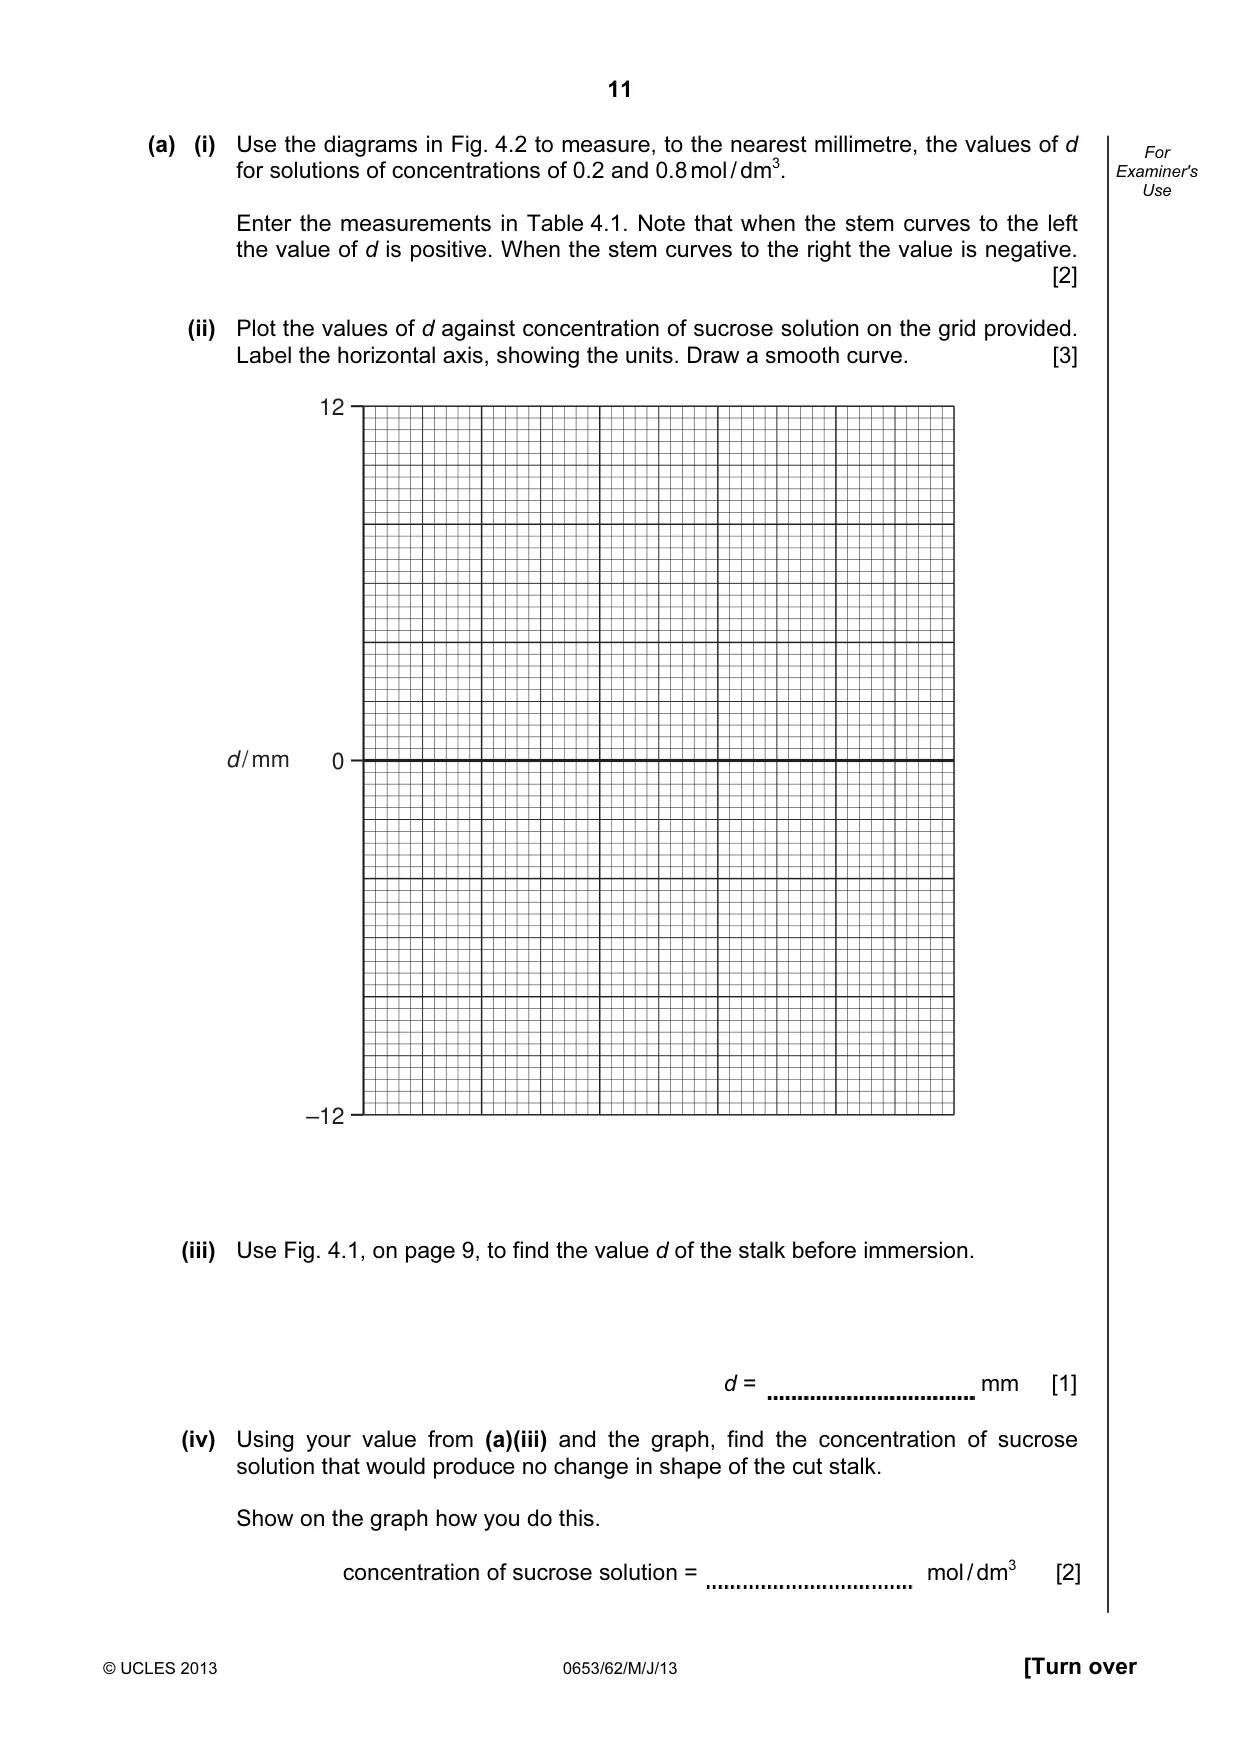
11 © UCLES 2013 0653/62/M/J/13 [Turn over For Examiner's Use (a) (i) Use the diagrams in Fig. 4.2 to measure, to the nearest millimetre, the values of d for solutions of concentrations of 0.2 and 0.8 mol / dm3. Enter the measurements in Table 4.1. Note that when the stem curves to the left the value of d is positive. When the stem curves to the right the value is negative. [2] (ii) Plot the values of d against concentration of sucrose solution on the grid provided. Label the horizontal axis, showing the units. Draw a smooth curve. [3] 12 0 –12 d / mm (iii) Use Fig. 4.1, on page 9, to find the value d of the stalk before immersion. d = mm [1] (iv) Using your value from (a)(iii) and the graph, find the concentration of sucrose solution that would produce no change in shape of the cut stalk. Show on the graph how you do this. concentration of sucrose solution = mol / dm3 [2]
Question paper, page 12
12 © UCLES 2013 0653/62/M/J/13 For Examiner's Use (b) In terms of osmosis explain what has happened to the cortex cells of the dandelion stalks during immersion in the 1.0 mol / dm3 sucrose. [2]
Question paper, page 13
13 © UCLES 2013 0653/62/M/J/13 [Turn over Please turn over for Question 5.
Question paper, page 14
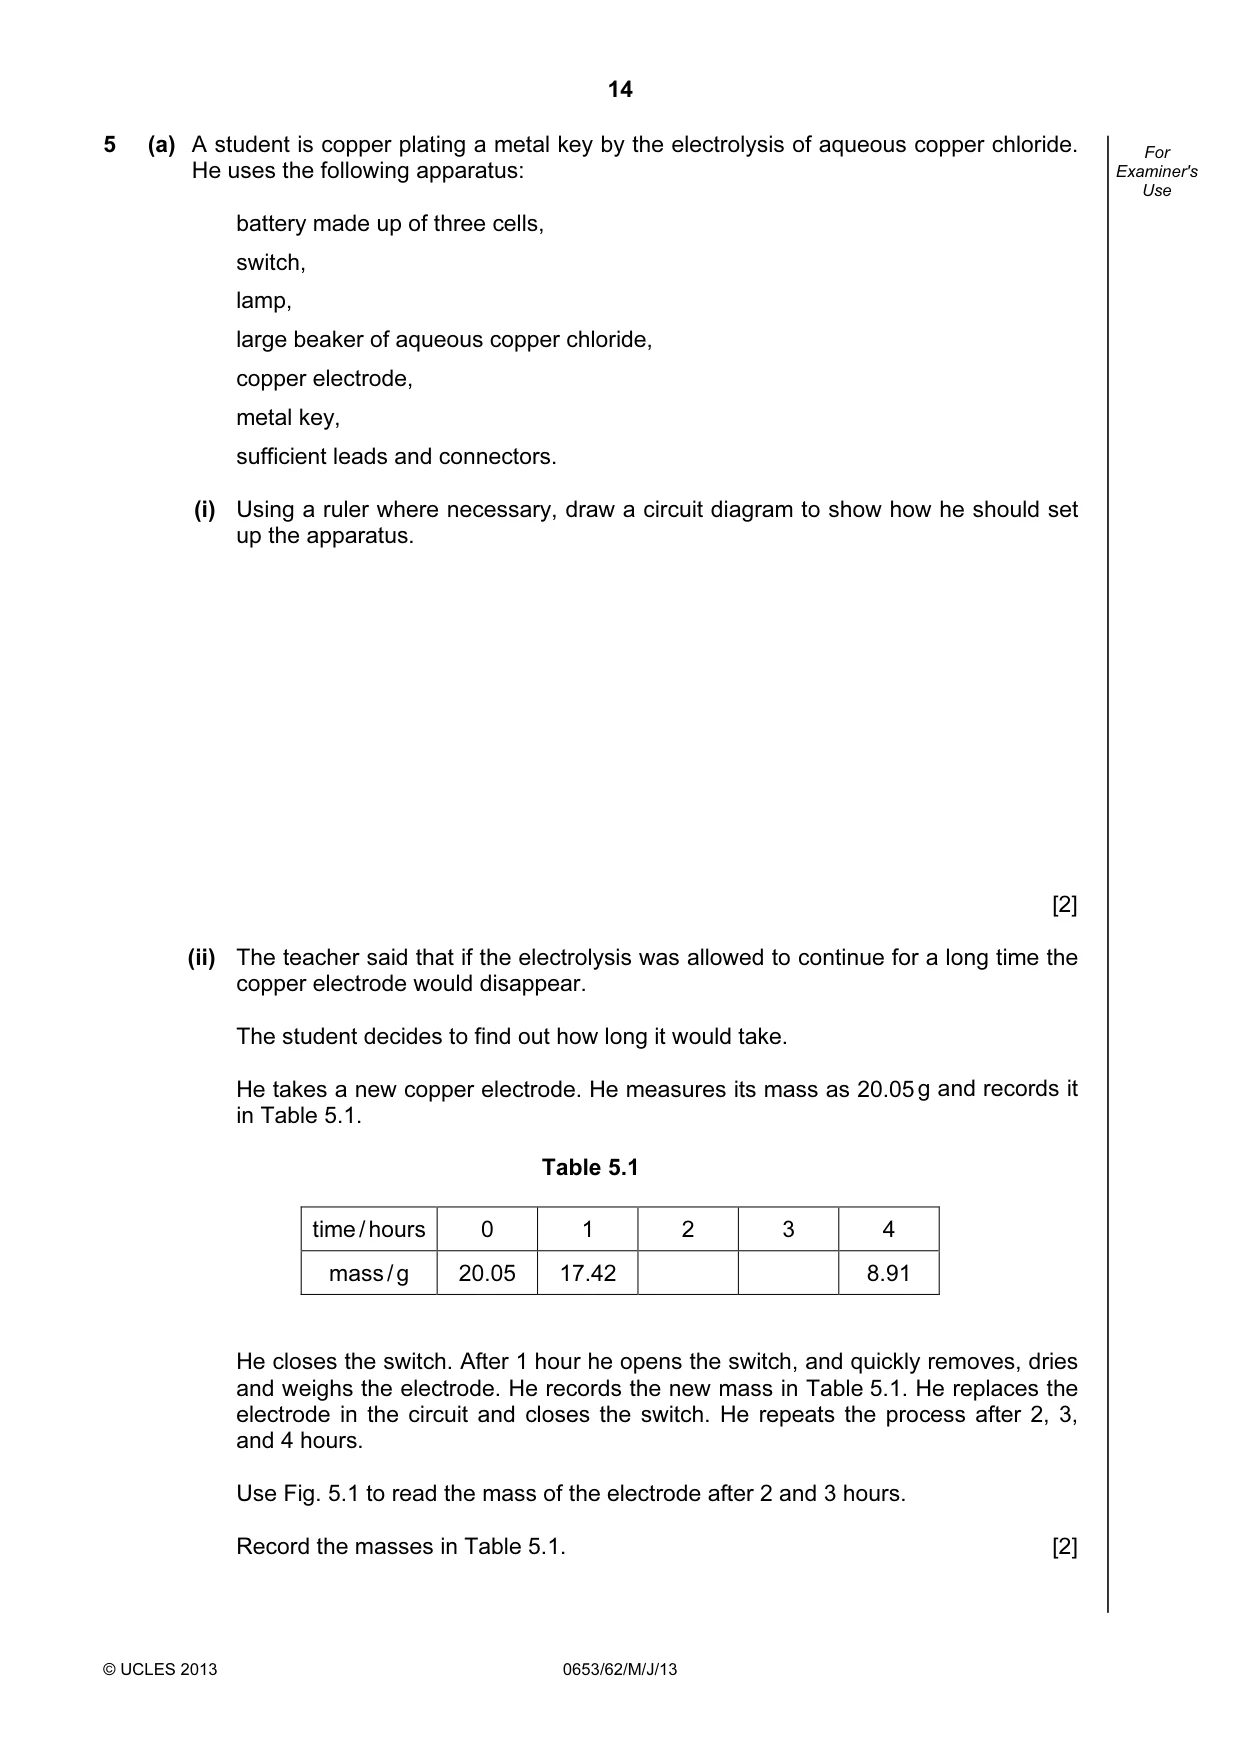
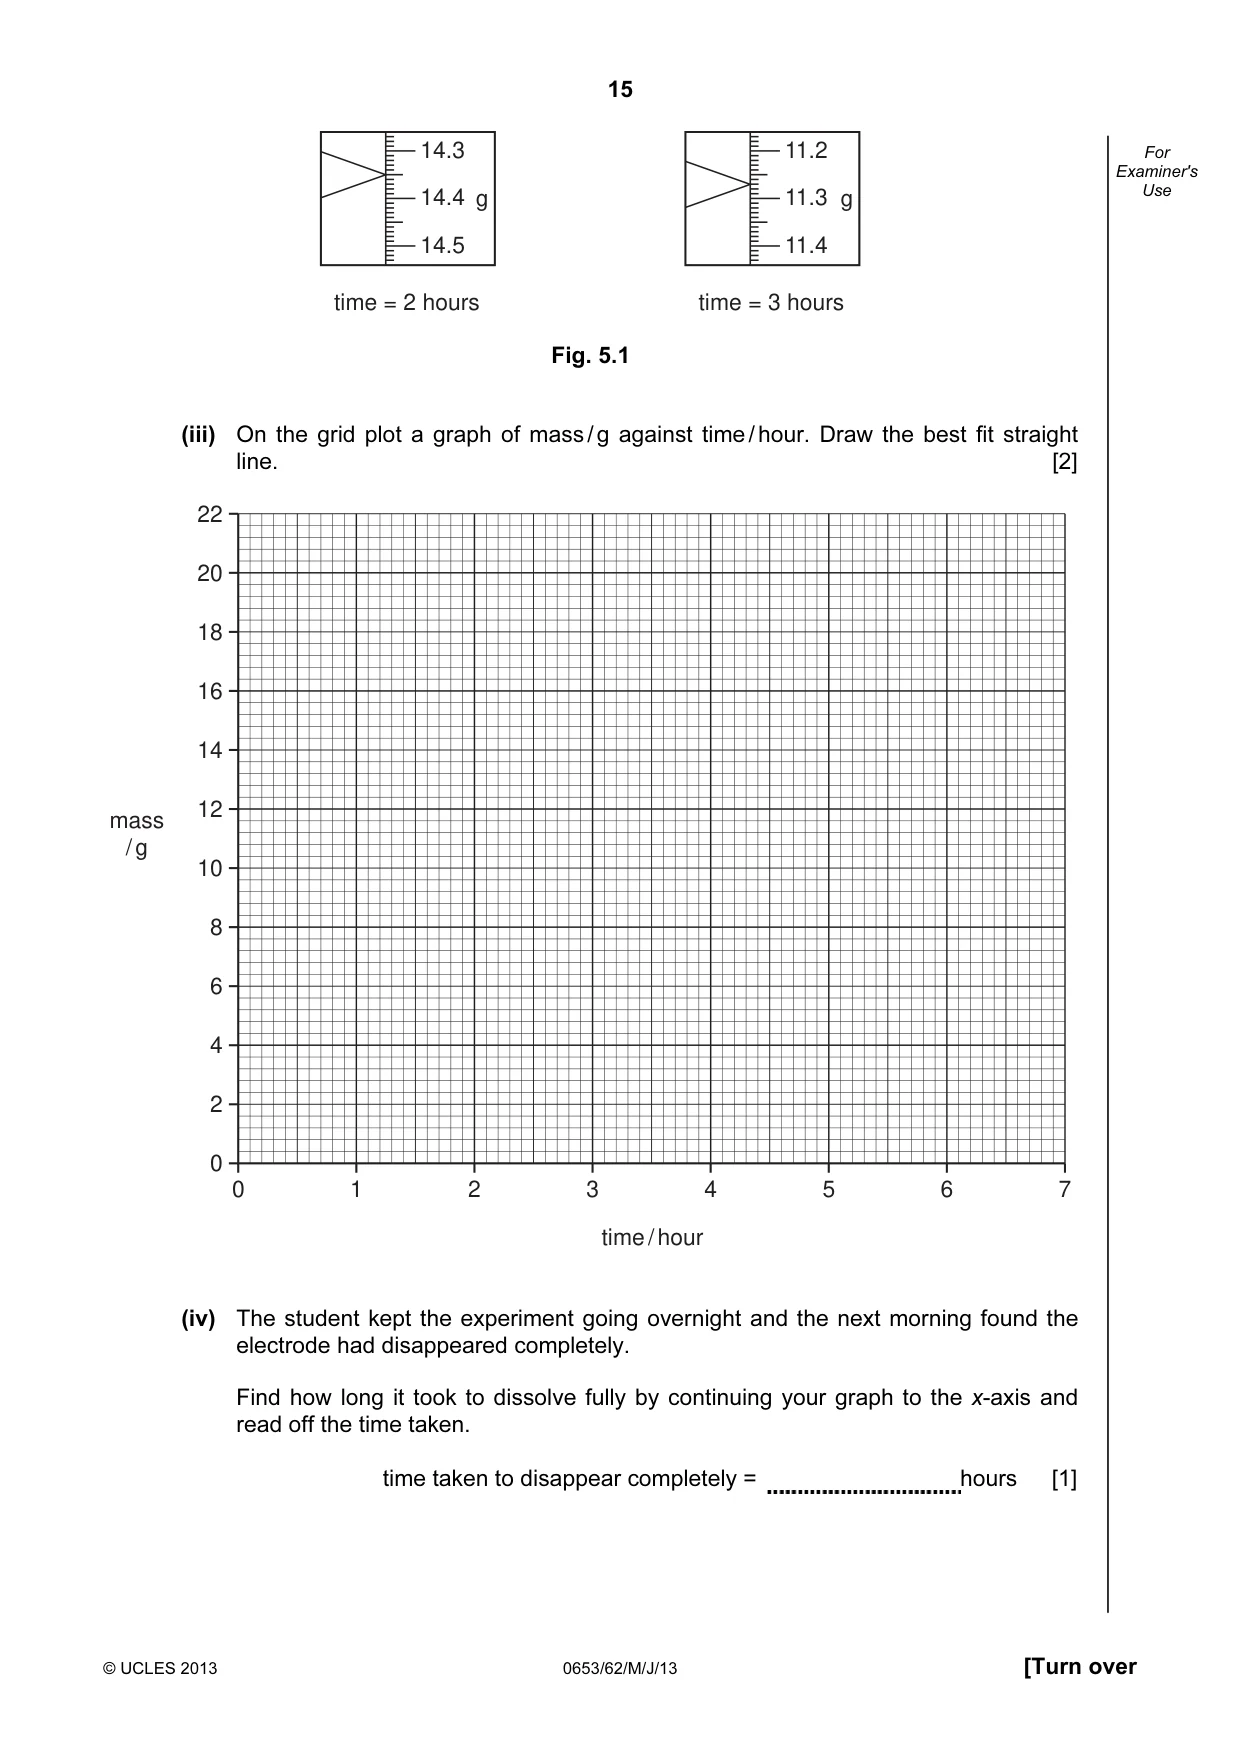
14 © UCLES 2013 0653/62/M/J/13 For Examiner's Use 5 (a) A student is copper plating a metal key by the electrolysis of aqueous copper chloride. He uses the following apparatus: battery made up of three cells, switch, lamp, large beaker of aqueous copper chloride, copper electrode, metal key, sufficient leads and connectors. (i) Using a ruler where necessary, draw a circuit diagram to show how he should set up the apparatus. [2] (ii) The teacher said that if the electrolysis was allowed to continue for a long time the copper electrode would disappear. The student decides to find out how long it would take. He takes a new copper electrode. He measures its mass as 20.05 g and records it in Table 5.1. Table 5.1 time / hours 0 1 2 3 4 mass / g 20.05 17.42 8.91 He closes the switch. After 1 hour he opens the switch, and quickly removes, dries and weighs the electrode. He records the new mass in Table 5.1. He replaces the electrode in the circuit and closes the switch. He repeats the process after 2, 3, and 4 hours. Use Fig. 5.1 to read the mass of the electrode after 2 and 3 hours. Record the masses in Table 5.1. [2]
Question paper, page 15
15 © UCLES 2013 0653/62/M/J/13 [Turn over For Examiner's Use 14.3 14.4 14.5 g time = 2 hours 11.2 11.3 11.4 g time = 3 hours Fig. 5.1 (iii) On the grid plot a graph of mass / g against time / hour. Draw the best fit straight line. [2] 0 1 2 time / hour mass / g 3 4 5 6 7 22 20 18 16 14 12 10 8 6 4 2 0 (iv) The student kept the experiment going overnight and the next morning found the electrode had disappeared completely. Find how long it took to dissolve fully by continuing your graph to the x-axis and read off the time taken. time taken to disappear completely = hours [1]
Question paper, page 16
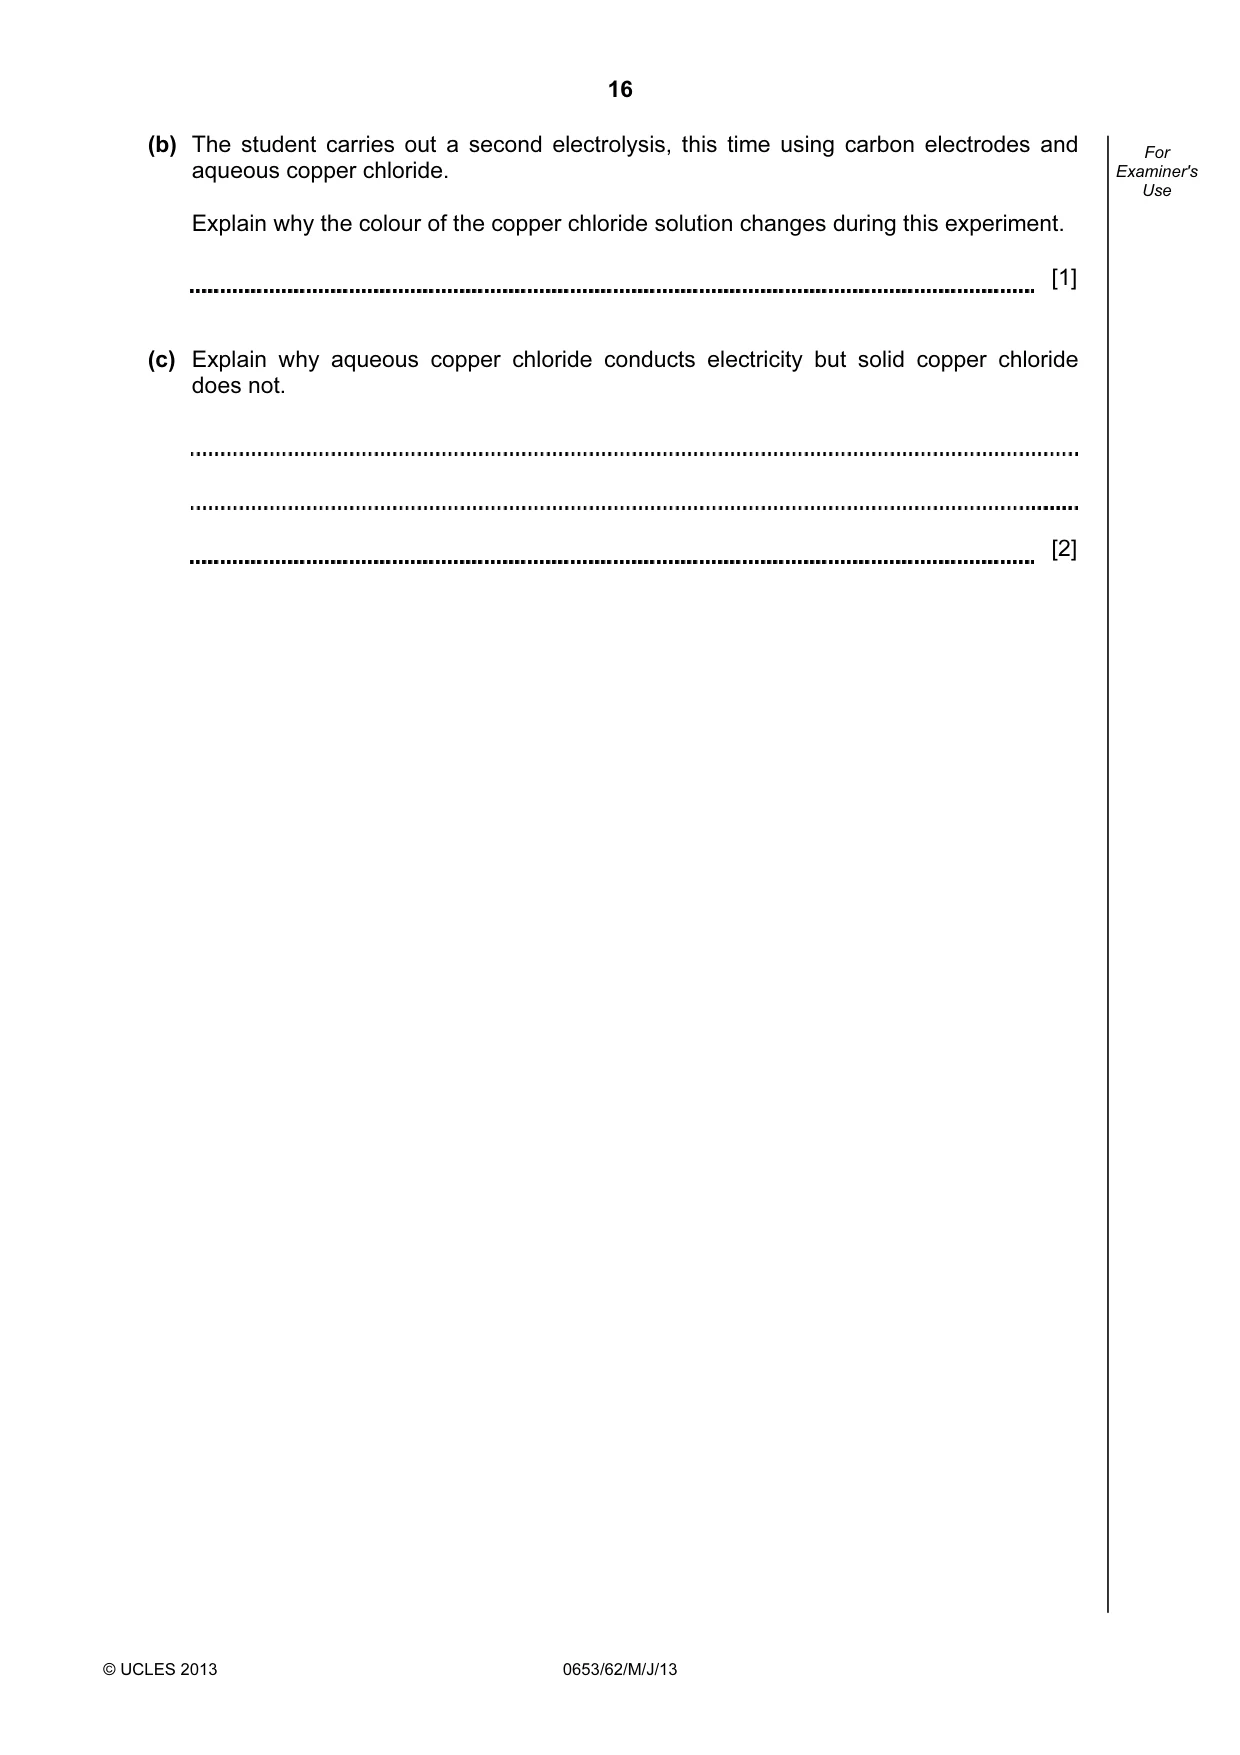
16 © UCLES 2013 0653/62/M/J/13 For Examiner's Use (b) The student carries out a second electrolysis, this time using carbon electrodes and aqueous copper chloride. Explain why the colour of the copper chloride solution changes during this experiment. [1] (c) Explain why aqueous copper chloride conducts electricity but solid copper chloride does not. [2]
Question paper, page 17
17 © UCLES 2013 0653/62/M/J/13 [Turn over Please turn over for Question 6.
Question paper, page 18
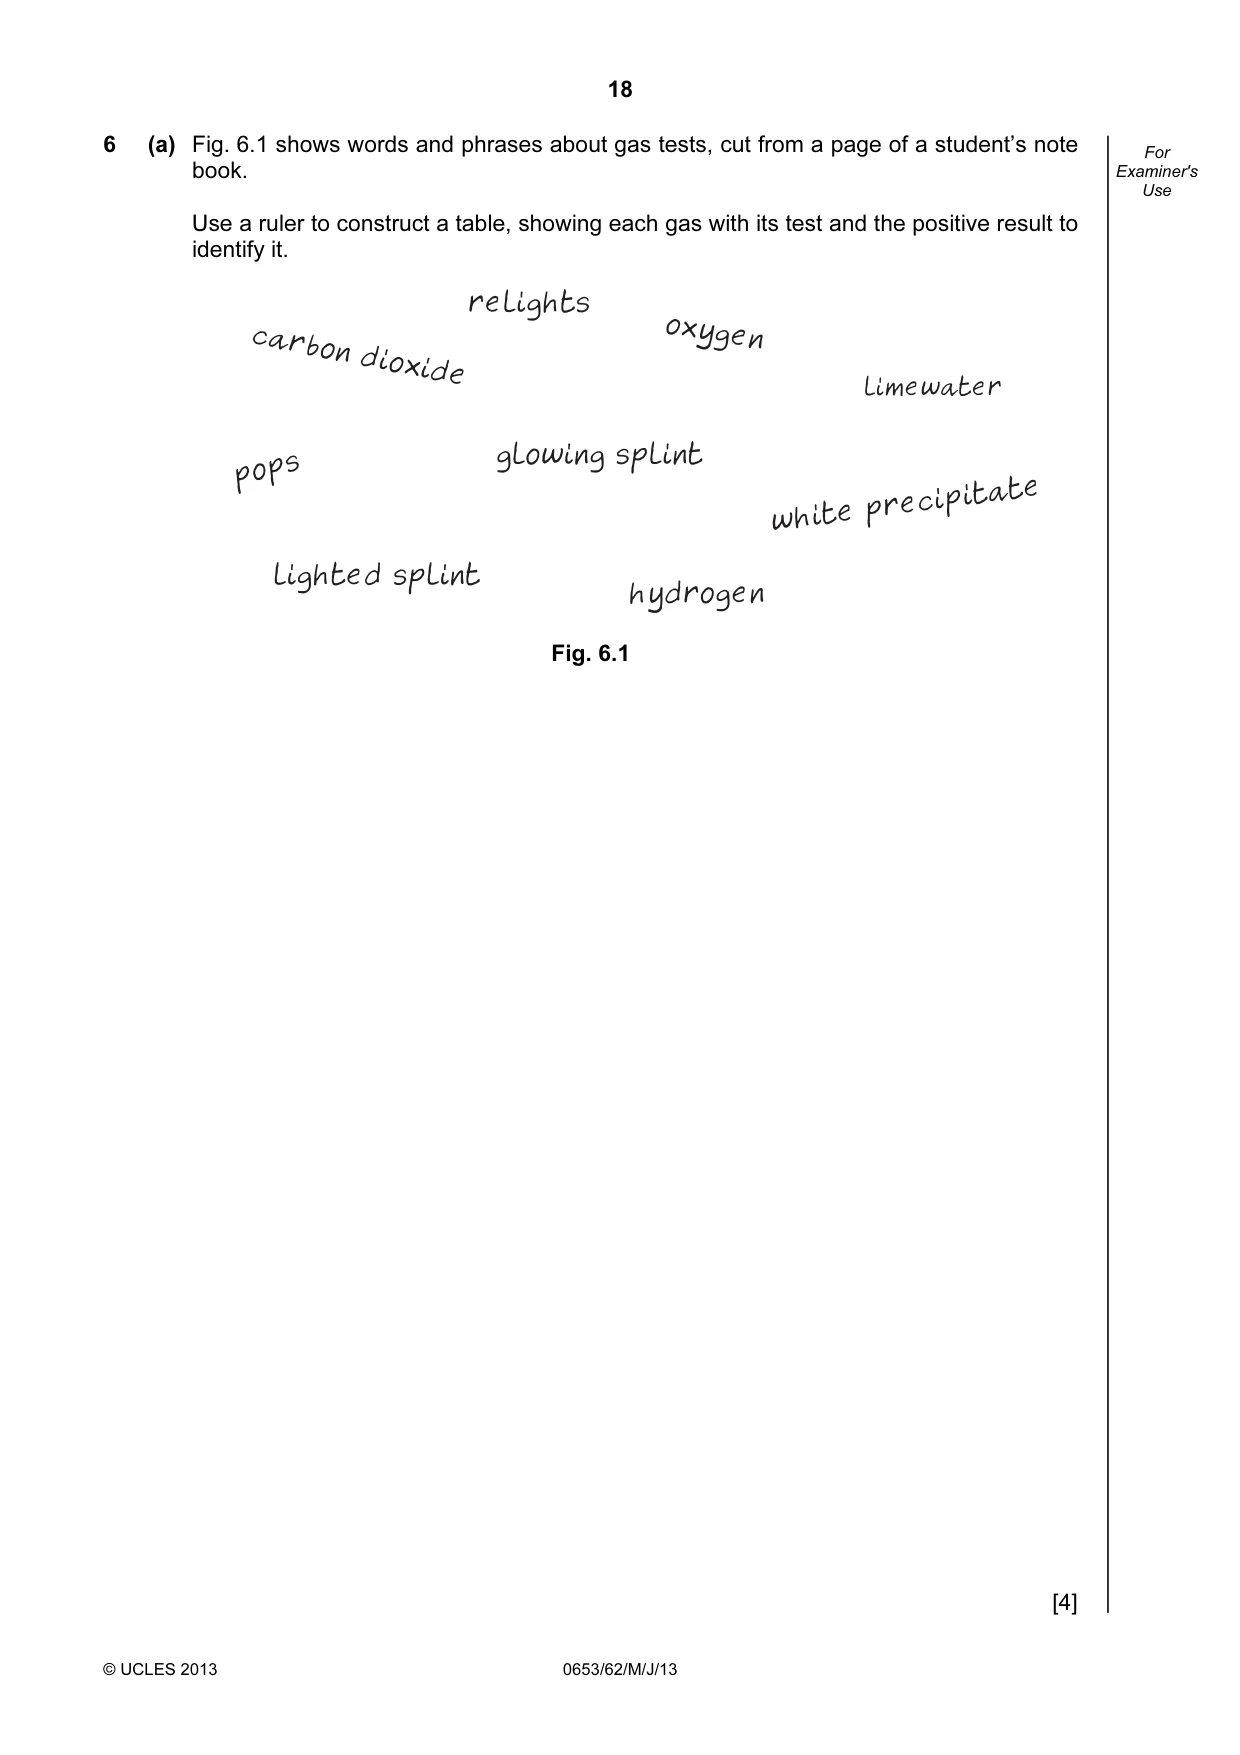
18 © UCLES 2013 0653/62/M/J/13 For Examiner's Use 6 (a) Fig. 6.1 shows words and phrases about gas tests, cut from a page of a student’s note book. Use a ruler to construct a table, showing each gas with its test and the positive result to identify it. Fig. 6.1 [4]
Question paper, page 19
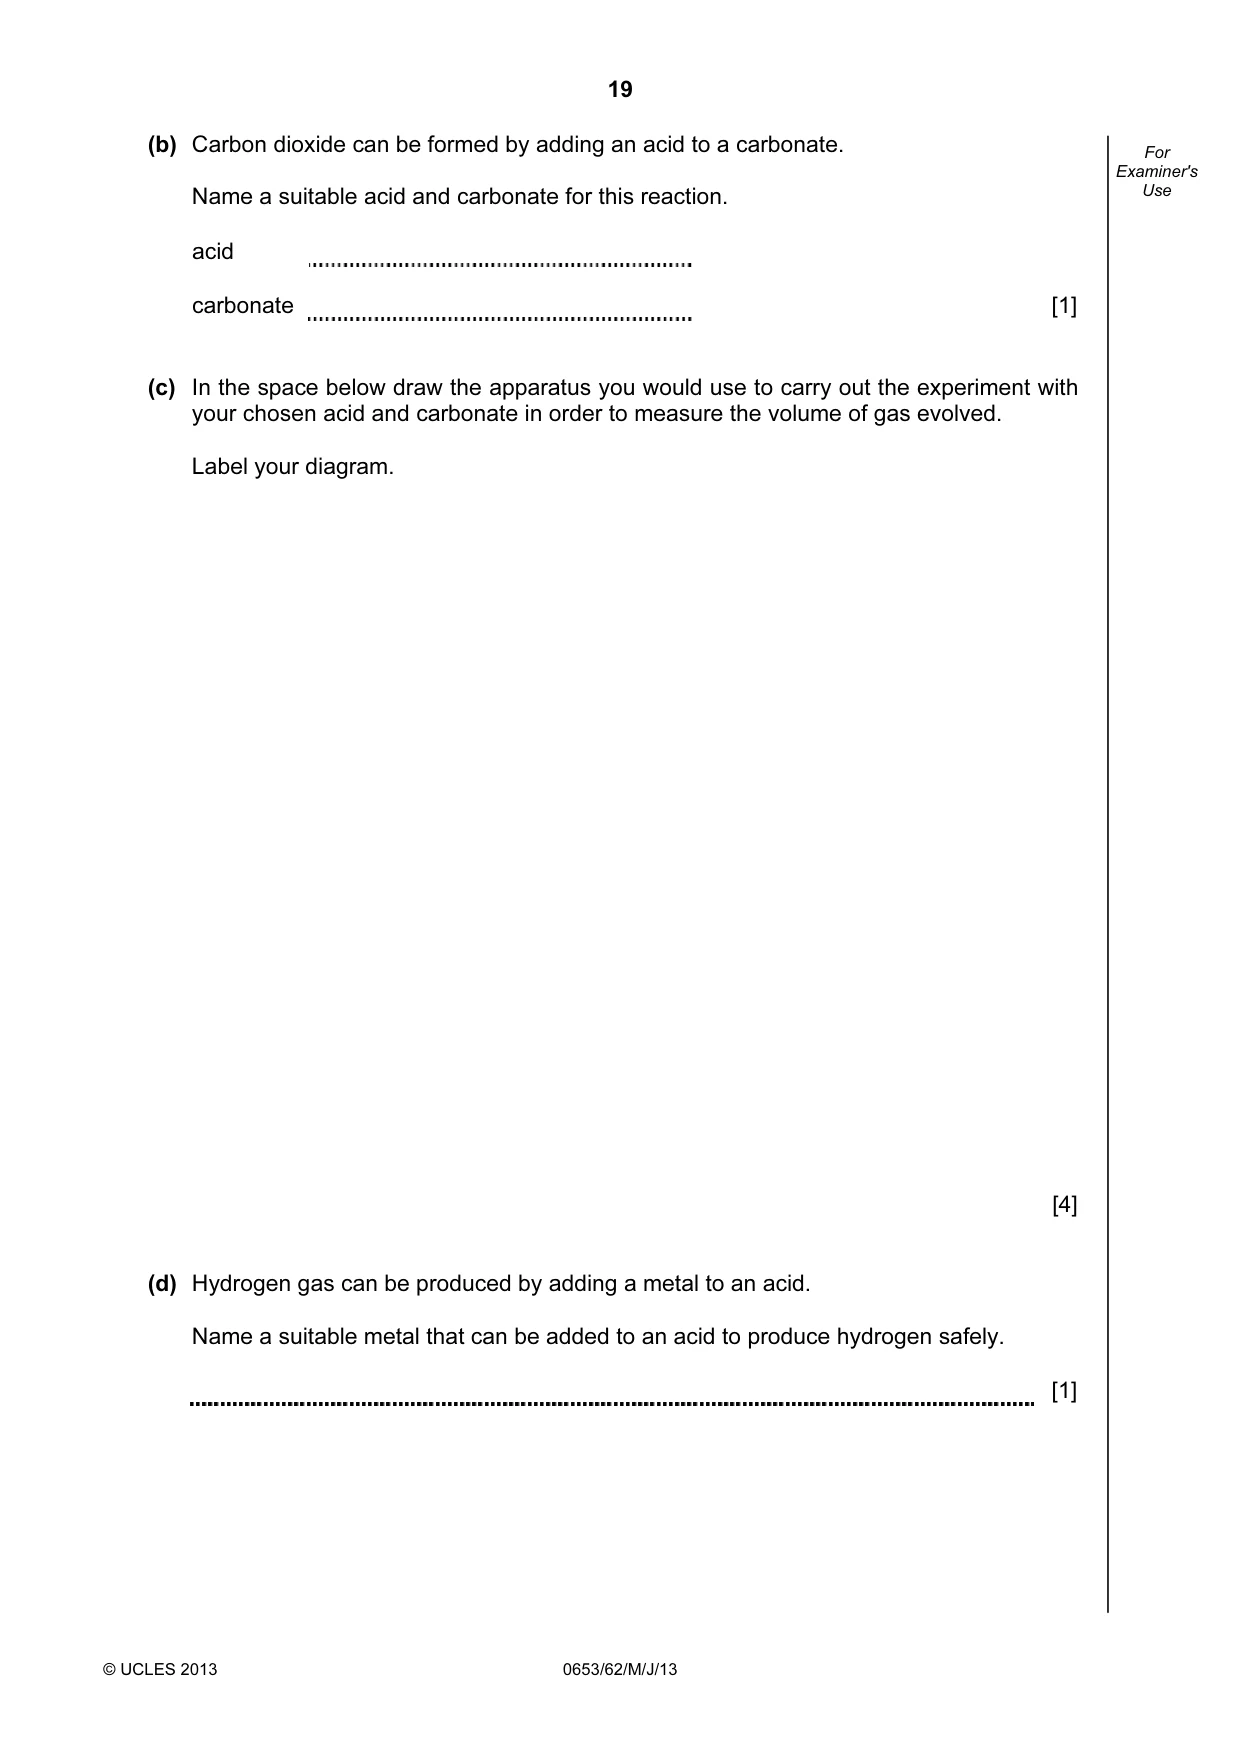
19 © UCLES 2013 0653/62/M/J/13 For Examiner's Use (b) Carbon dioxide can be formed by adding an acid to a carbonate. Name a suitable acid and carbonate for this reaction. acid carbonate [1] (c) In the space below draw the apparatus you would use to carry out the experiment with your chosen acid and carbonate in order to measure the volume of gas evolved. Label your diagram. [4] (d) Hydrogen gas can be produced by adding a metal to an acid. Name a suitable metal that can be added to an acid to produce hydrogen safely. [1]
Question paper, page 20
20 Permission to reproduce items where third-party owned material protected by copyright is included has been sought and cleared where possible. Every reasonable effort has been made by the publisher (UCLES) to trace copyright holders, but if any items requiring clearance have unwittingly been included, the publisher will be pleased to make amends at the earliest possible opportunity. University of Cambridge International Examinations is part of the Cambridge Assessment Group. Cambridge Assessment is the brand name of University of Cambridge Local Examinations Syndicate (UCLES), which is itself a department of the University of Cambridge. © UCLES 2013 0653/62/M/J/13 BLANK PAGE
Mark scheme, page 1
CAMBRIDGE INTERNATIONAL EXAMINATIONS International General Certificate of Secondary Education MARK SCHEME for the May/June 2013 series 0653 COMBINED SCIENCE 0653/62 Paper 6 (Alternative to Practical), maximum raw mark 60 This mark scheme is published as an aid to teachers and candidates, to indicate the requirements of the examination. It shows the basis on which Examiners were instructed to award marks. It does not indicate the details of the discussions that took place at an Examiners’ meeting before marking began, which would have considered the acceptability of alternative answers. Mark schemes should be read in conjunction with the question paper and the Principal Examiner Report for Teachers. Cambridge will not enter into discussions about these mark schemes. Cambridge is publishing the mark schemes for the May/June 2013 series for most IGCSE, GCE Advanced Level and Advanced Subsidiary Level components and some Ordinary Level components. www.XtremePapers.com
Mark scheme, page 2
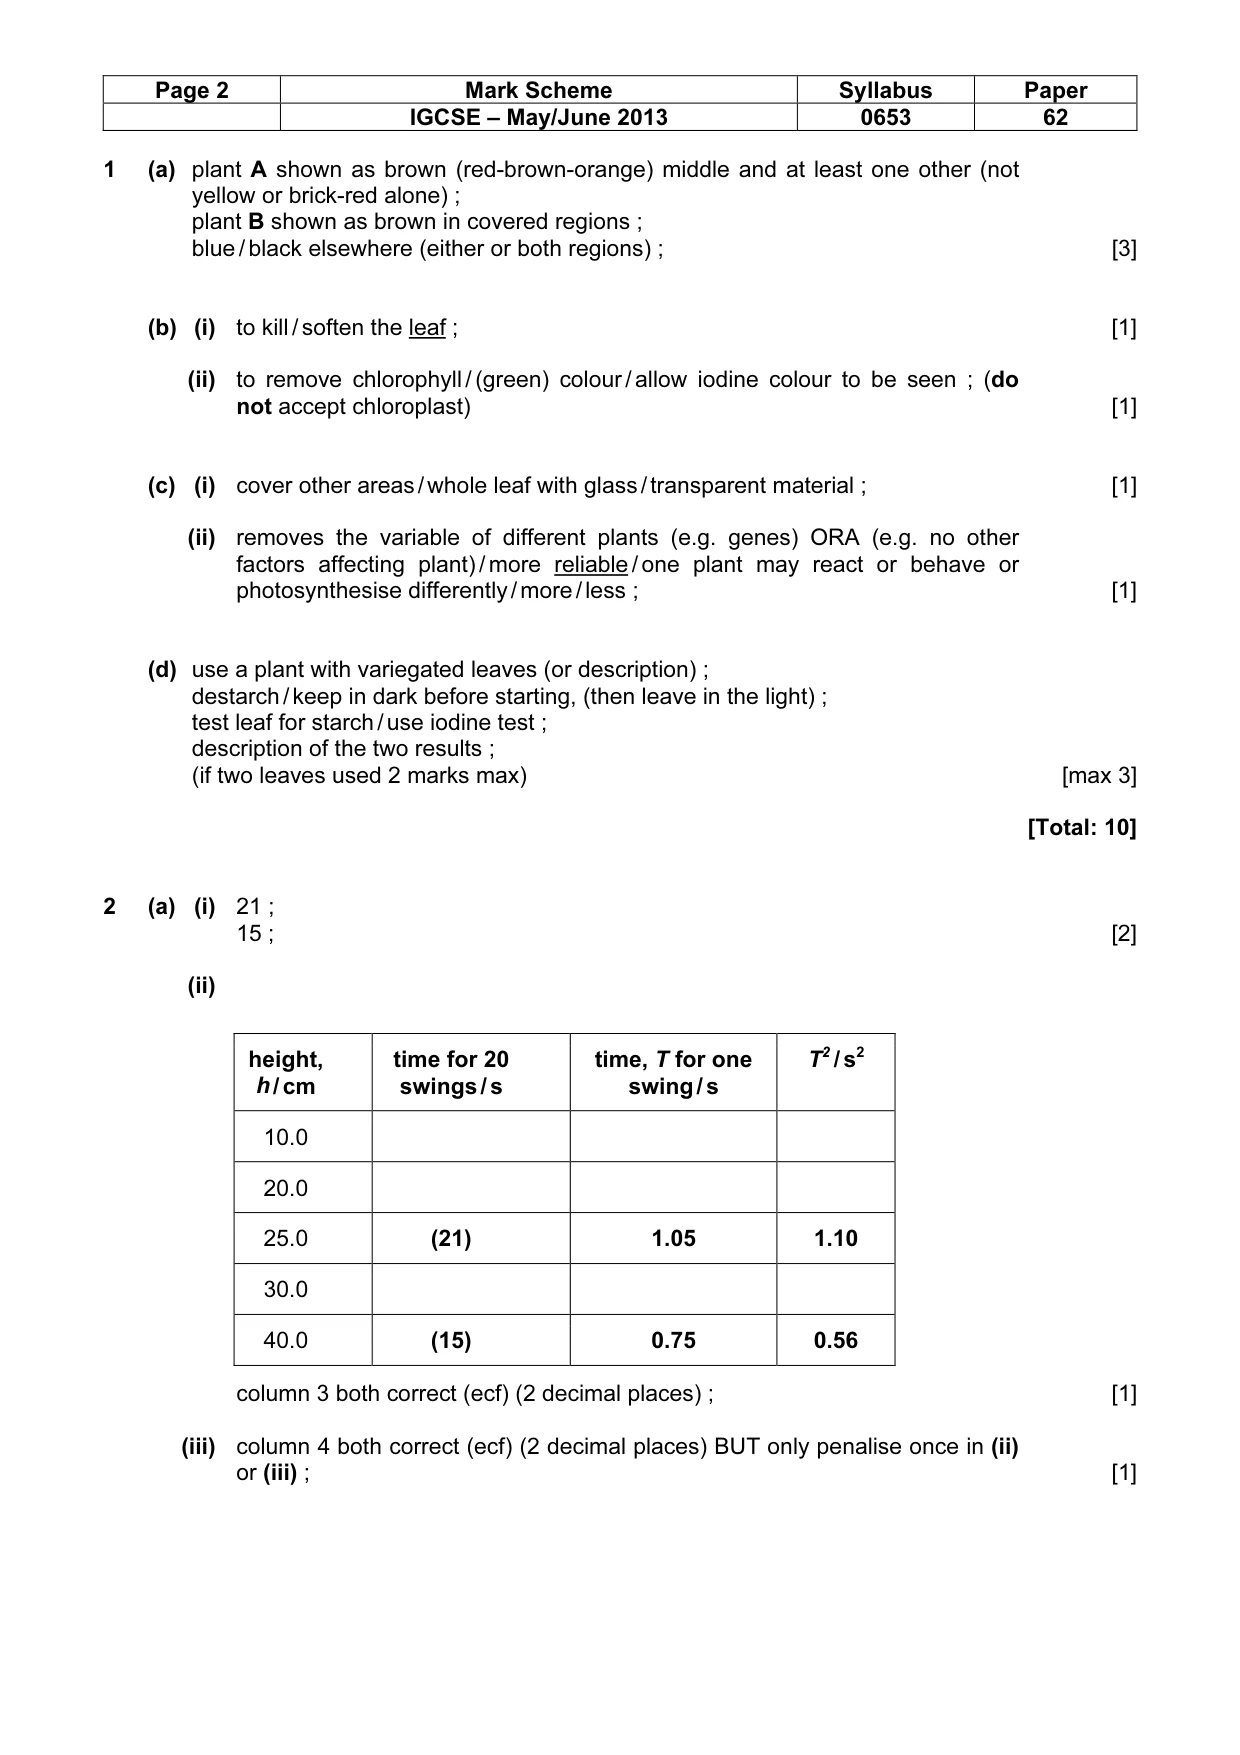
Page 2 Mark Scheme Syllabus Paper IGCSE – May/June 2013 0653 62 1 (a) plant A shown as brown (red-brown-orange) middle and at least one other (not yellow or brick-red alone) ; plant B shown as brown in covered regions ; blue / black elsewhere (either or both regions) ; [3] (b) (i) to kill / soften the leaf ; [1] (ii) to remove chlorophyll / (green) colour / allow iodine colour to be seen ; (do not accept chloroplast) [1] (c) (i) cover other areas / whole leaf with glass / transparent material ; [1] (ii) removes the variable of different plants (e.g. genes) ORA (e.g. no other factors affecting plant) / more reliable / one plant may react or behave or photosynthesise differently / more / less ; [1] (d) use a plant with variegated leaves (or description) ; destarch / keep in dark before starting, (then leave in the light) ; test leaf for starch / use iodine test ; description of the two results ; (if two leaves used 2 marks max) [max 3] [Total: 10] 2 (a) (i) 21 ; 15 ; [2] (ii) column 3 both correct (ecf) (2 decimal places) ; [1] (iii) column 4 both correct (ecf) (2 decimal places) BUT only penalise once in (ii) or (iii) ; [1] height, h / cm time for 20 swings / s time, T for one swing / s T2 / s2 10.0 20.0 25.0 (21) 1.05 1.10 30.0 40.0 (15) 0.75 0.56
Mark scheme, page 3
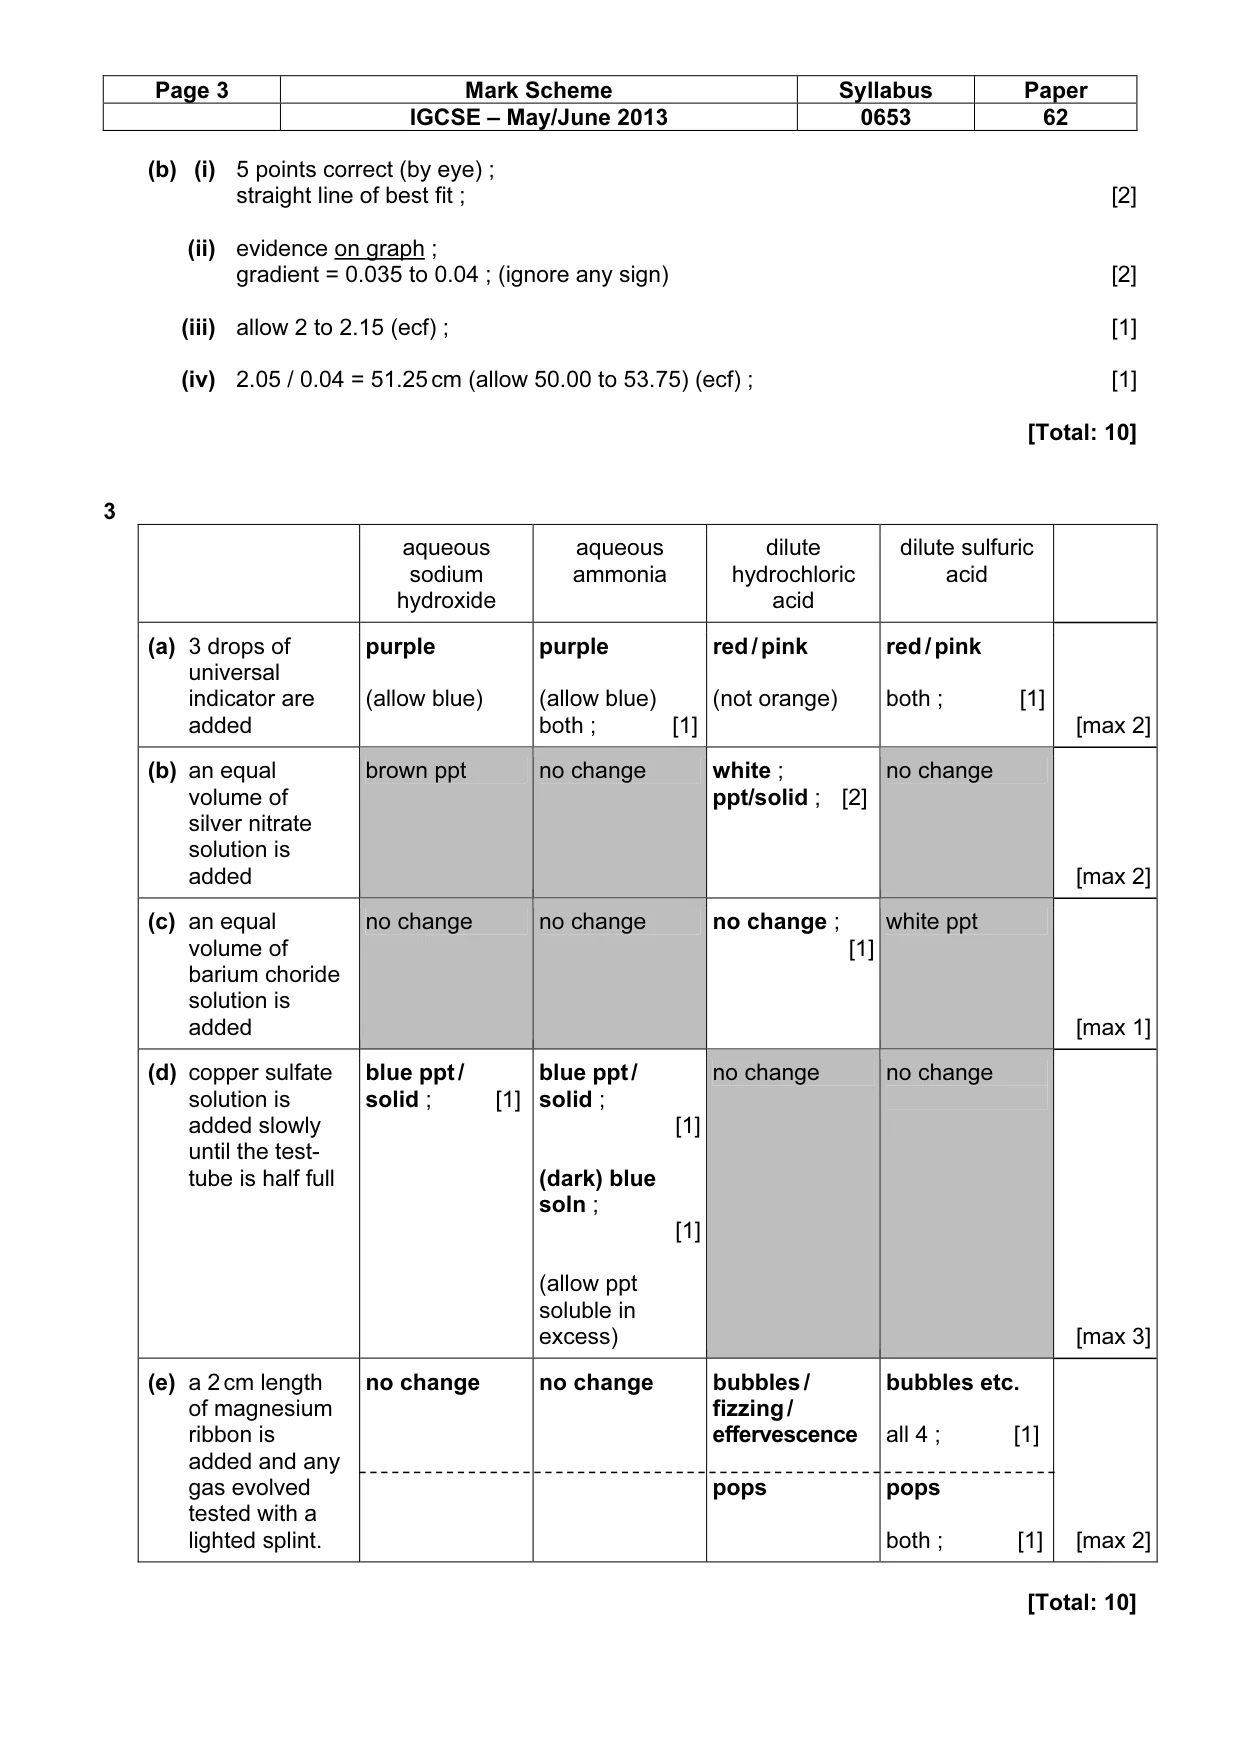
Page 3 Mark Scheme Syllabus Paper IGCSE – May/June 2013 0653 62 (b) (i) 5 points correct (by eye) ; straight line of best fit ; [2] (ii) evidence on graph ; gradient = 0.035 to 0.04 ; (ignore any sign) [2] (iii) allow 2 to 2.15 (ecf) ; [1] (iv) 2.05 / 0.04 = 51.25 cm (allow 50.00 to 53.75) (ecf) ; [1] [Total: 10] 3 aqueous sodium hydroxide aqueous ammonia dilute hydrochloric acid dilute sulfuric acid (a) 3 drops of universal indicator are added purple (allow blue) purple (allow blue) both ; [1] red / pink (not orange) red / pink both ; [1] [max 2] (b) an equal volume of silver nitrate solution is added brown ppt no change white ; ppt/solid ; [2] no change [max 2] (c) an equal volume of barium choride solution is added no change no change no change ; [1] white ppt [max 1] (d) copper sulfate solution is added slowly until the test- tube is half full blue ppt / solid ; [1] blue ppt / solid ; [1] (dark) blue soln ; [1] (allow ppt soluble in excess) no change no change [max 3] (e) a 2 cm length of magnesium ribbon is added and any gas evolved tested with a lighted splint. no change no change bubbles / fizzing / effervescence pops bubbles etc. all 4 ; [1] pops both ; [1] [max 2] [Total: 10]
Mark scheme, page 4
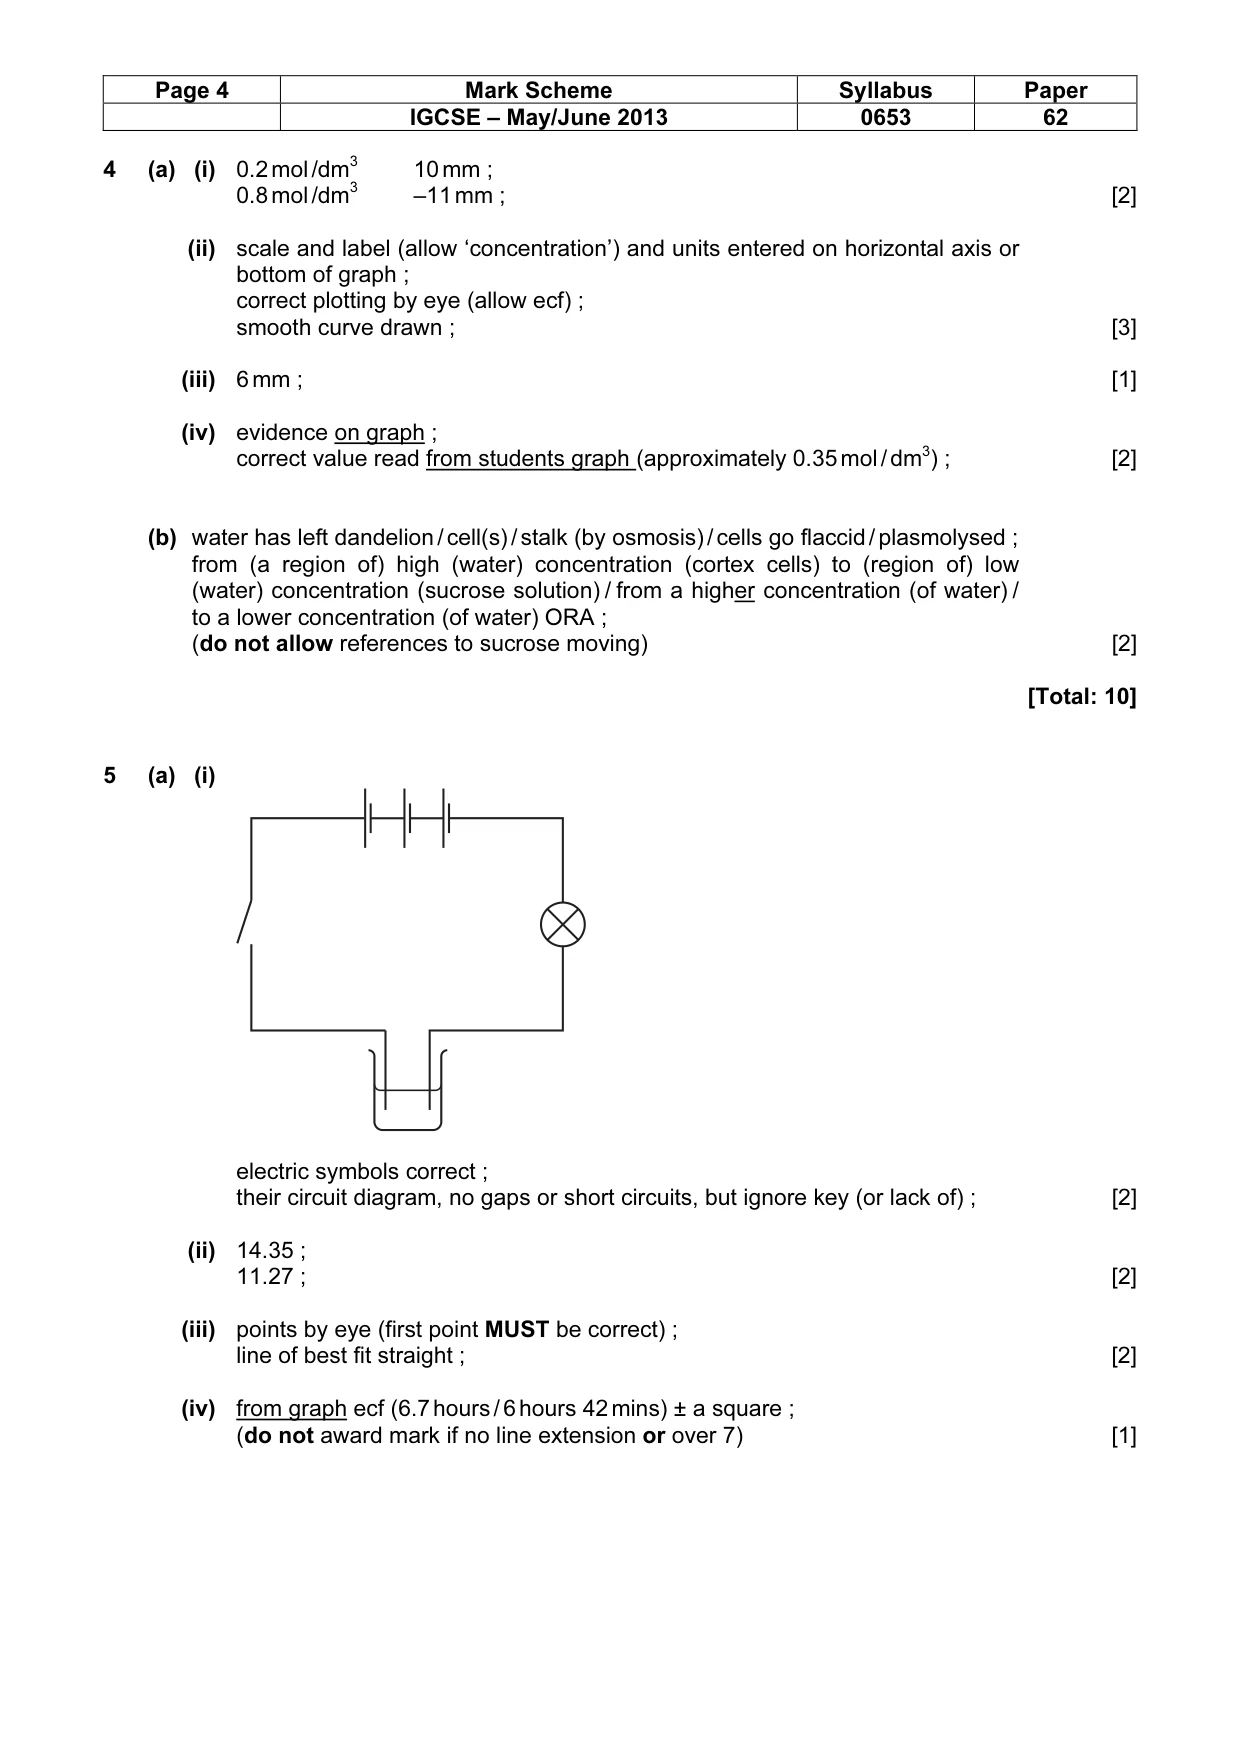
Page 4 Mark Scheme Syllabus Paper IGCSE – May/June 2013 0653 62 4 (a) (i) 0.2 mol /dm3 10 mm ; 0.8 mol /dm3 –11 mm ; [2] (ii) scale and label (allow ‘concentration’) and units entered on horizontal axis or bottom of graph ; correct plotting by eye (allow ecf) ; smooth curve drawn ; [3] (iii) 6 mm ; [1] (iv) evidence on graph ; correct value read from students graph (approximately 0.35 mol / dm3) ; [2] (b) water has left dandelion / cell(s) / stalk (by osmosis) / cells go flaccid / plasmolysed ; from (a region of) high (water) concentration (cortex cells) to (region of) low (water) concentration (sucrose solution) / from a higher concentration (of water) / to a lower concentration (of water) ORA ; (do not allow references to sucrose moving) [2] [Total: 10] 5 (a) (i) electric symbols correct ; their circuit diagram, no gaps or short circuits, but ignore key (or lack of) ; [2] (ii) 14.35 ; 11.27 ; [2] (iii) points by eye (first point MUST be correct) ; line of best fit straight ; [2] (iv) from graph ecf (6.7 hours / 6 hours 42 mins) ± a square ; (do not award mark if no line extension or over 7) [1]
Mark scheme, page 5
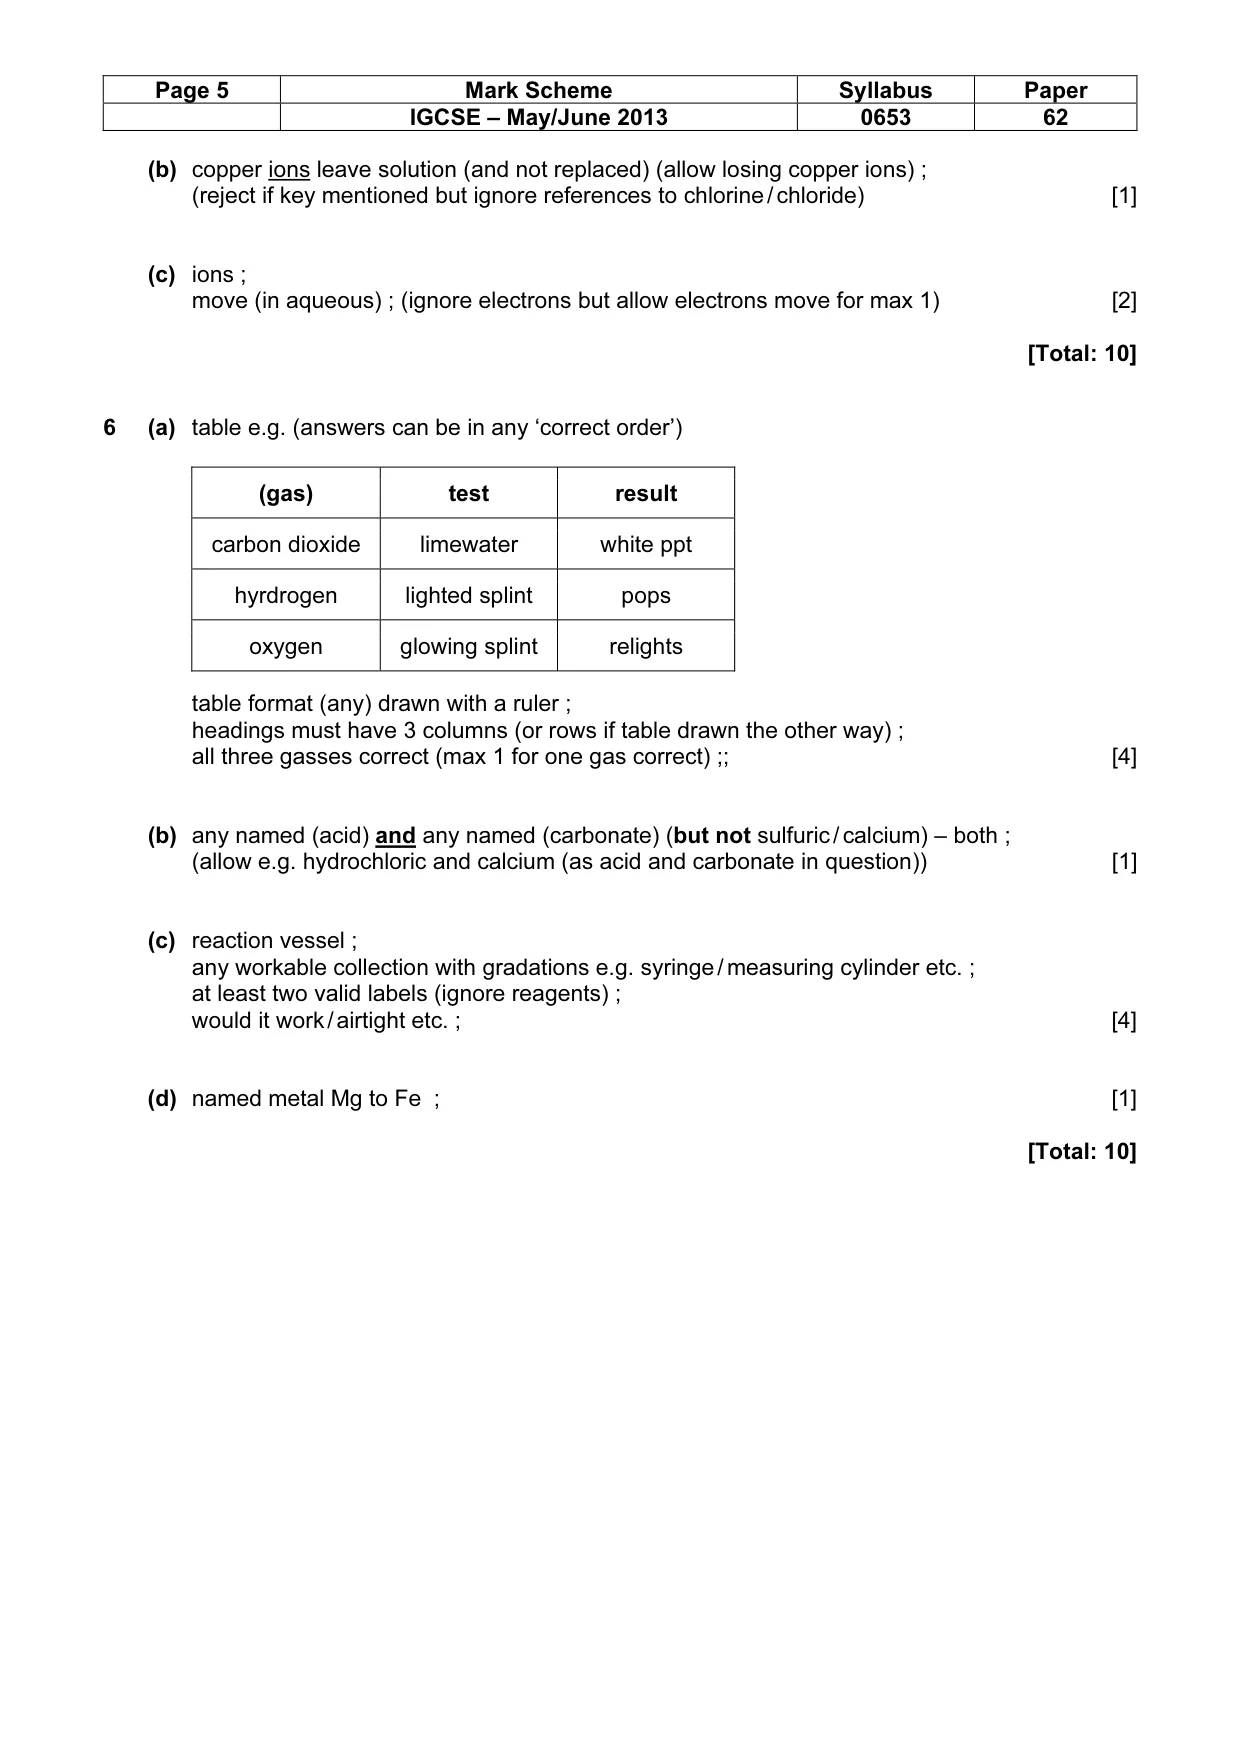
Page 5 Mark Scheme Syllabus Paper IGCSE – May/June 2013 0653 62 (b) copper ions leave solution (and not replaced) (allow losing copper ions) ; (reject if key mentioned but ignore references to chlorine / chloride) [1] (c) ions ; move (in aqueous) ; (ignore electrons but allow electrons move for max 1) [2] [Total: 10] 6 (a) table e.g. (answers can be in any ‘correct order’) table format (any) drawn with a ruler ; headings must have 3 columns (or rows if table drawn the other way) ; all three gasses correct (max 1 for one gas correct) ;; [4] (b) any named (acid) and any named (carbonate) (but not sulfuric / calcium) – both ; (allow e.g. hydrochloric and calcium (as acid and carbonate in question)) [1] (c) reaction vessel ; any workable collection with gradations e.g. syringe / measuring cylinder etc. ; at least two valid labels (ignore reagents) ; would it work / airtight etc. ; [4] (d) named metal Mg to Fe ; [1] [Total: 10] (gas) test result carbon dioxide limewater white ppt hyrdrogen lighted splint pops oxygen glowing splint relights
What you needed in this session
Cambridge’s own grade thresholds for 2013 May/June, Paper 6 · Variant 2. A higher threshold means an easier paper — the bar moves with how the cohort did.