Cambridge IGCSE Science - Combined 0653 — 2013 May/June Paper 6 · Variant 1
0653/61/M/J/13 · 60 marks · ≈68 min
The question paper and its mark scheme, free to read here and free to download. This is Cambridge’s own paper, exactly as it was sat.
Question paper20 pages


Mark scheme5 pages
Answers below. Sit the paper first if you are practising.
Paper as text
Question paper, page 1
This document consists of 20 printed pages. IB13 06_0653_61/RP © UCLES 2013 [Turn over For Examiner's Use 1 2 3 4 5 6 Total *6301329277* UNIVERSITY OF CAMBRIDGE INTERNATIONAL EXAMINATIONS International General Certificate of Secondary Education COMBINED SCIENCE 0653/61 Paper 6 Alternative to Practical May/June 2013 1 hour Candidates answer on the Question paper. No Additional Materials are required. READ THESE INSTRUCTIONS FIRST Write your Centre number, candidate number and name on all the work you hand in. Write in dark blue or black pen. You may use a soft pencil for any diagrams or graphs. Do not use staples, paper clips, glue or correction fluid. DO NOT WRITE IN ANY BARCODES. Answer all questions. Electronic calculators may be used. You may lose marks if you do not show your working or if you do not use appropriate units. At the end of the examination, fasten all your work securely together. The number of marks is given in brackets [ ] at the end of each question or part question. www.XtremePapers.com
Question paper, page 2
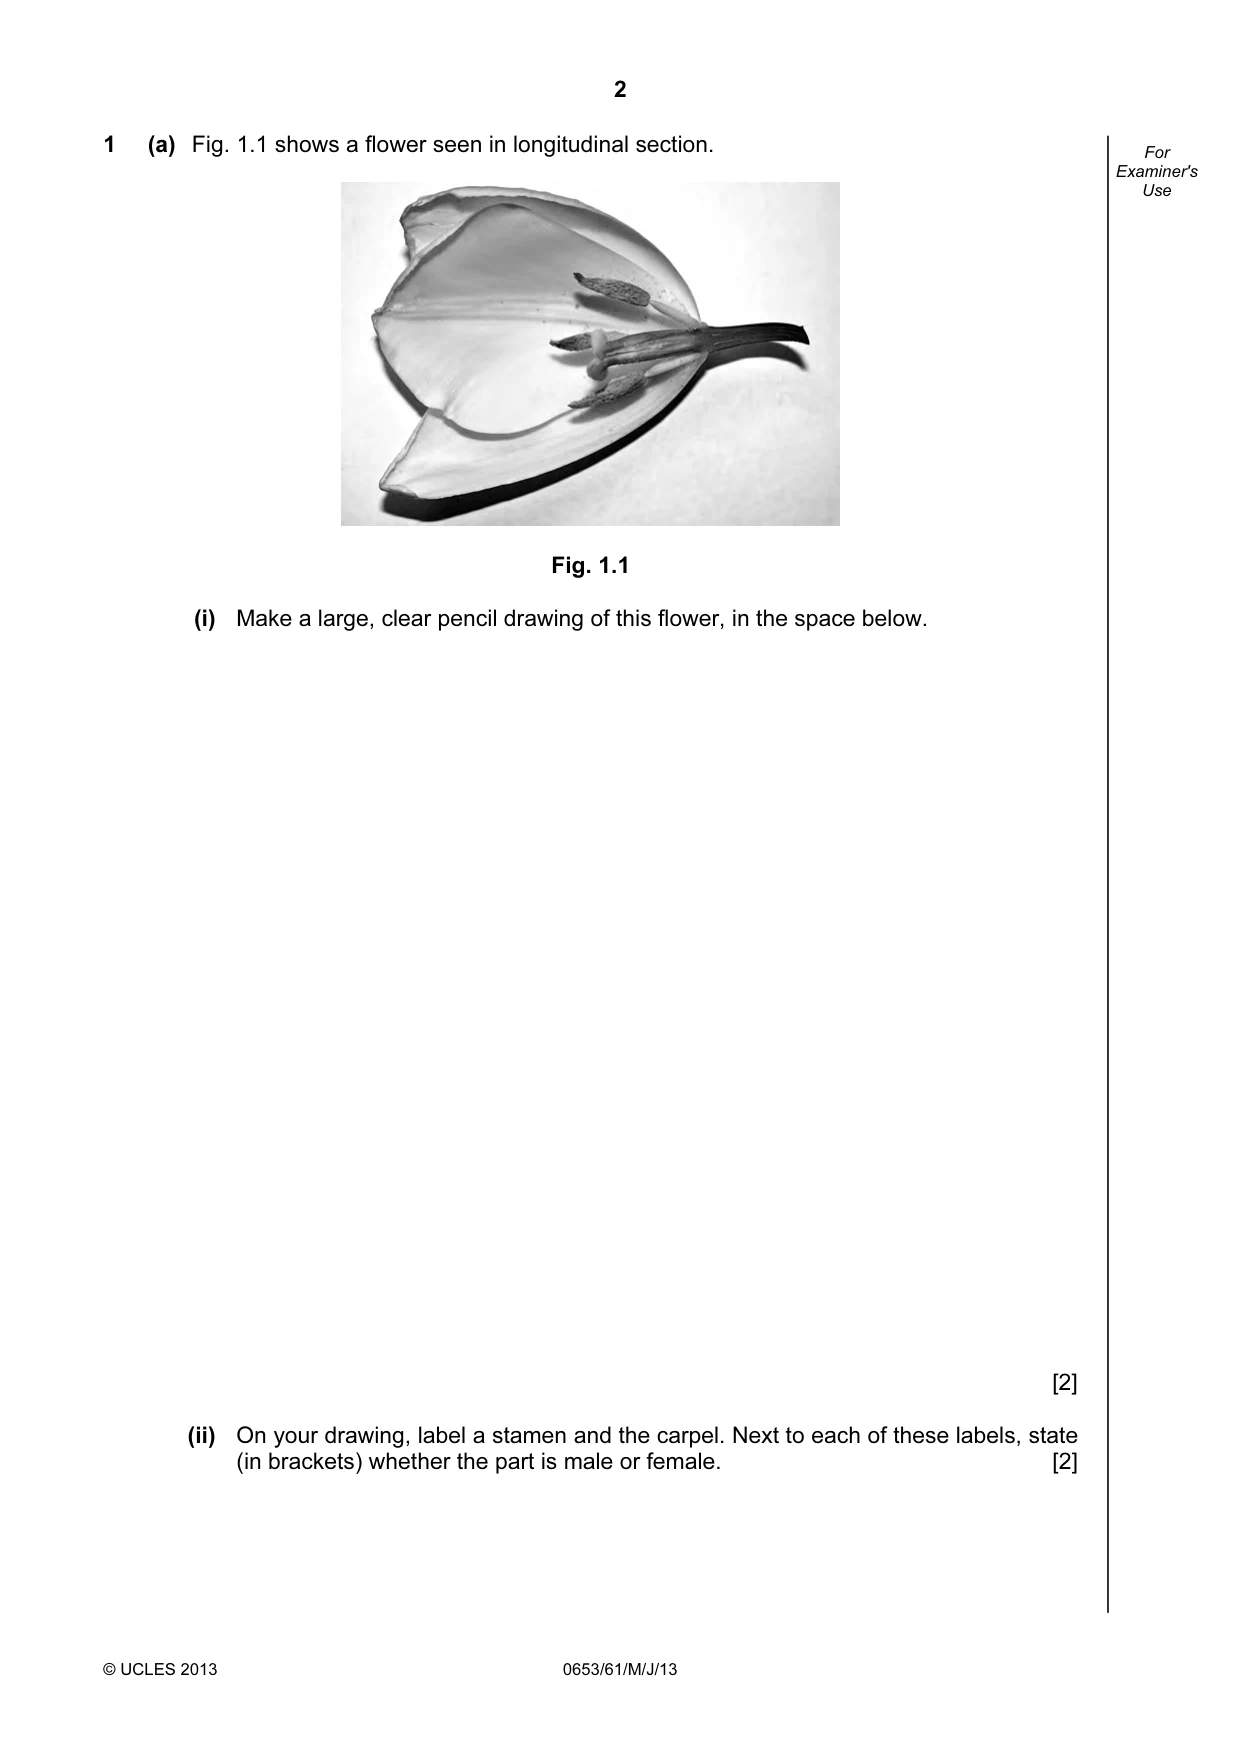
2 © UCLES 2013 0653/61/M/J/13 For Examiner's Use 1 (a) Fig. 1.1 shows a flower seen in longitudinal section. Fig. 1.1 (i) Make a large, clear pencil drawing of this flower, in the space below. [2] (ii) On your drawing, label a stamen and the carpel. Next to each of these labels, state (in brackets) whether the part is male or female. [2]
Question paper, page 3
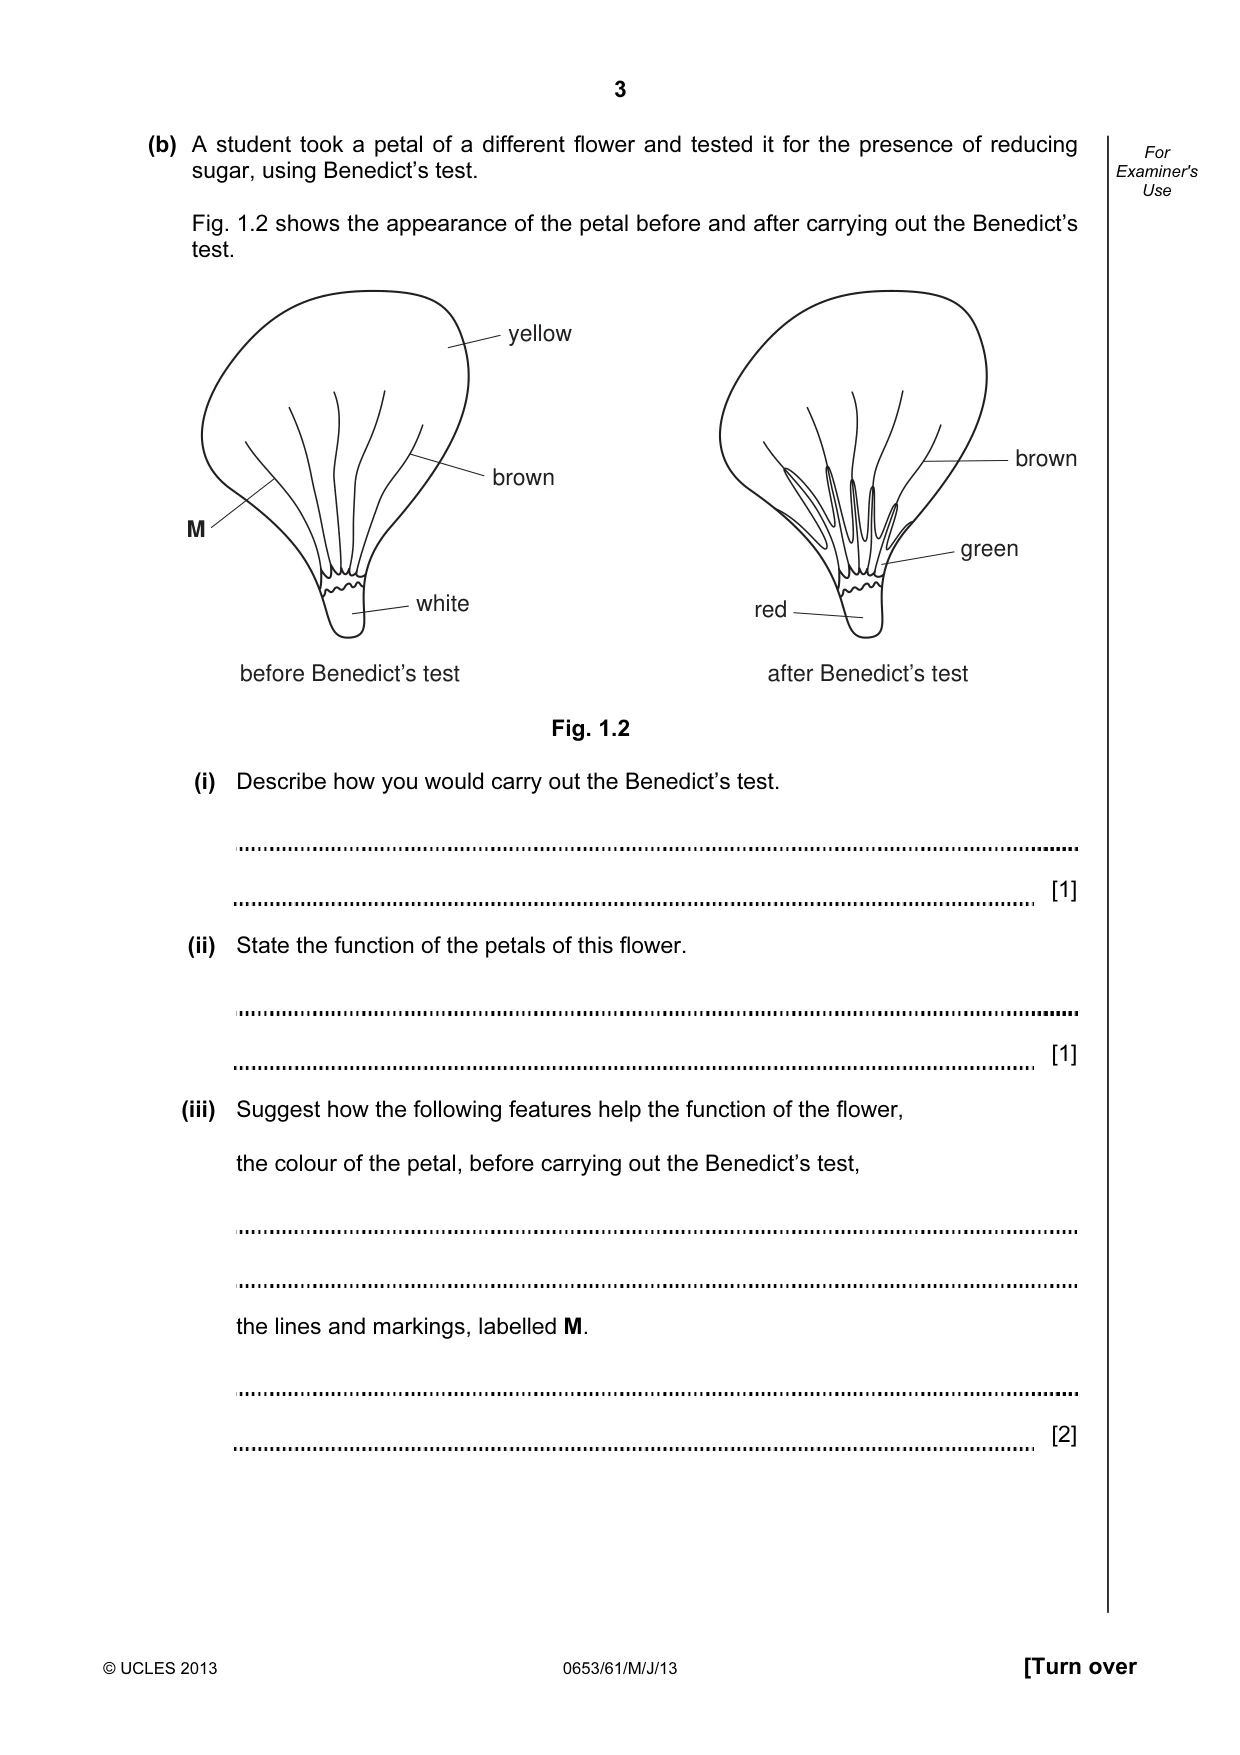
3 © UCLES 2013 0653/61/M/J/13 [Turn over For Examiner's Use (b) A student took a petal of a different flower and tested it for the presence of reducing sugar, using Benedict’s test. Fig. 1.2 shows the appearance of the petal before and after carrying out the Benedict’s test. after Benedict’s test before Benedict’s test brown brown green red M yellow white Fig. 1.2 (i) Describe how you would carry out the Benedict’s test. [1] (ii) State the function of the petals of this flower. [1] (iii) Suggest how the following features help the function of the flower, the colour of the petal, before carrying out the Benedict’s test, the lines and markings, labelled M. [2]
Question paper, page 4
4 © UCLES 2013 0653/61/M/J/13 For Examiner's Use (iv) State your conclusion from the results of the Benedict’s test. Explain the significance of this in relation to your answers to (ii) and (iii). conclusion significance [2]
Question paper, page 5
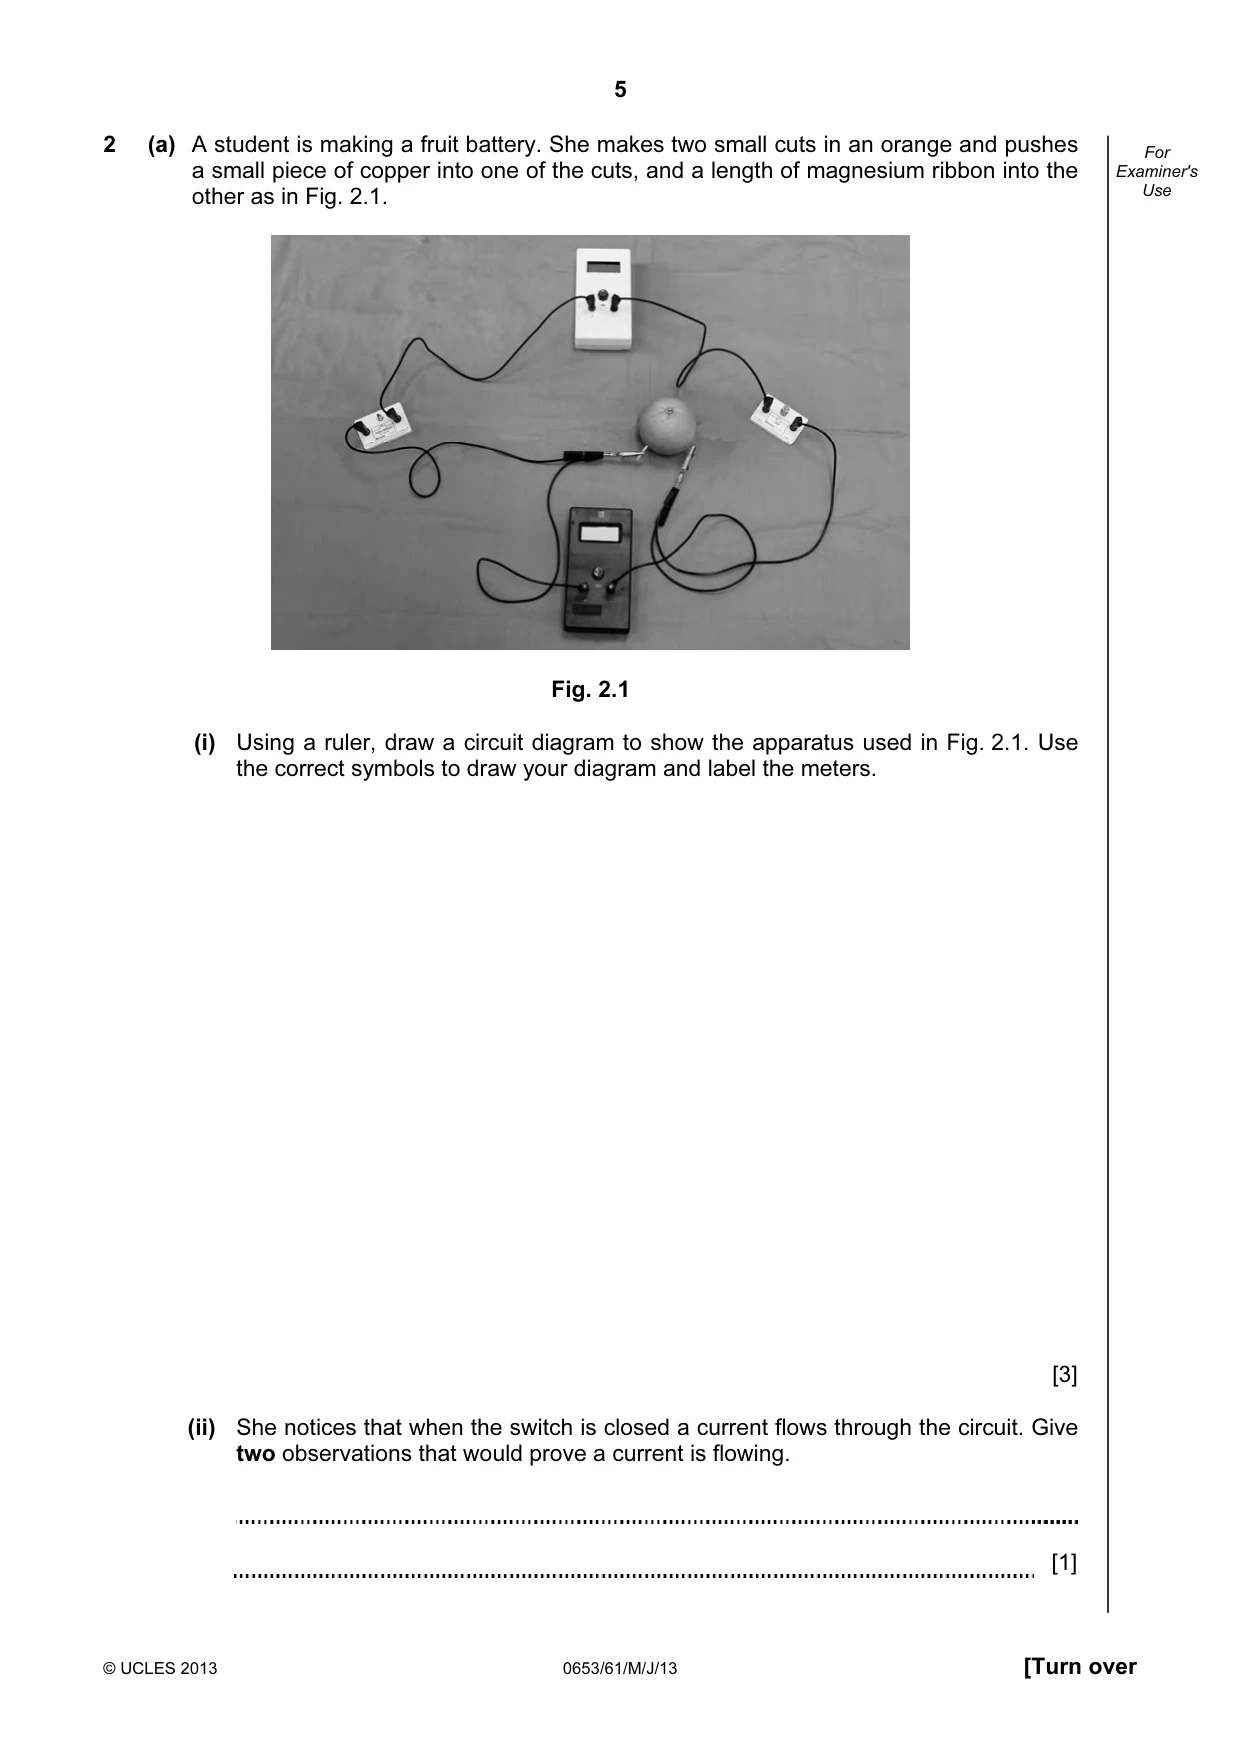
5 © UCLES 2013 0653/61/M/J/13 [Turn over For Examiner's Use 2 (a) A student is making a fruit battery. She makes two small cuts in an orange and pushes a small piece of copper into one of the cuts, and a length of magnesium ribbon into the other as in Fig. 2.1. Fig. 2.1 (i) Using a ruler, draw a circuit diagram to show the apparatus used in Fig. 2.1. Use the correct symbols to draw your diagram and label the meters. [3] (ii) She notices that when the switch is closed a current flows through the circuit. Give two observations that would prove a current is flowing. [1]
Question paper, page 6
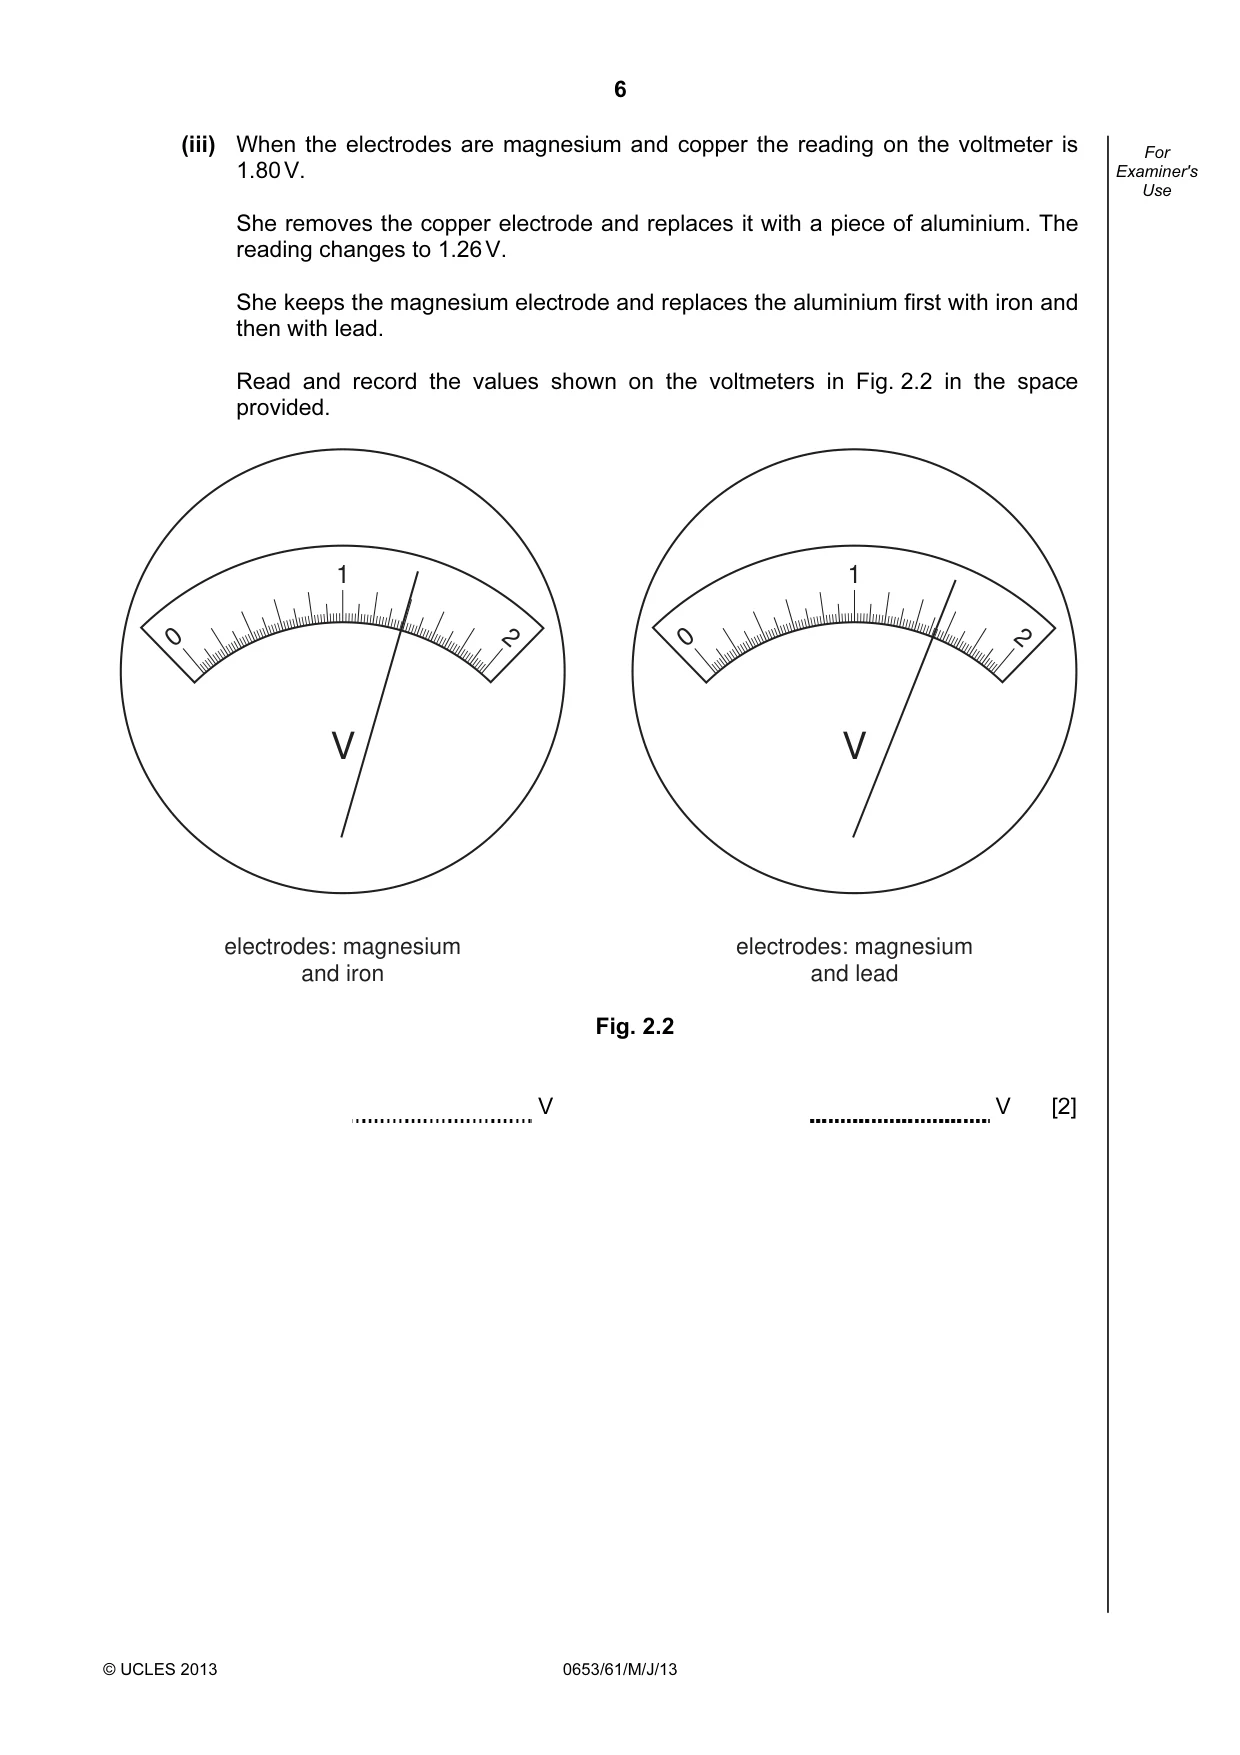
6 © UCLES 2013 0653/61/M/J/13 For Examiner's Use (iii) When the electrodes are magnesium and copper the reading on the voltmeter is 1.80 V. She removes the copper electrode and replaces it with a piece of aluminium. The reading changes to 1.26 V. She keeps the magnesium electrode and replaces the aluminium first with iron and then with lead. Read and record the values shown on the voltmeters in Fig. 2.2 in the space provided. V 1 electrodes: magnesium and iron 2 0 V 1 electrodes: magnesium and lead 2 0 Fig. 2.2 V V [2]
Question paper, page 7
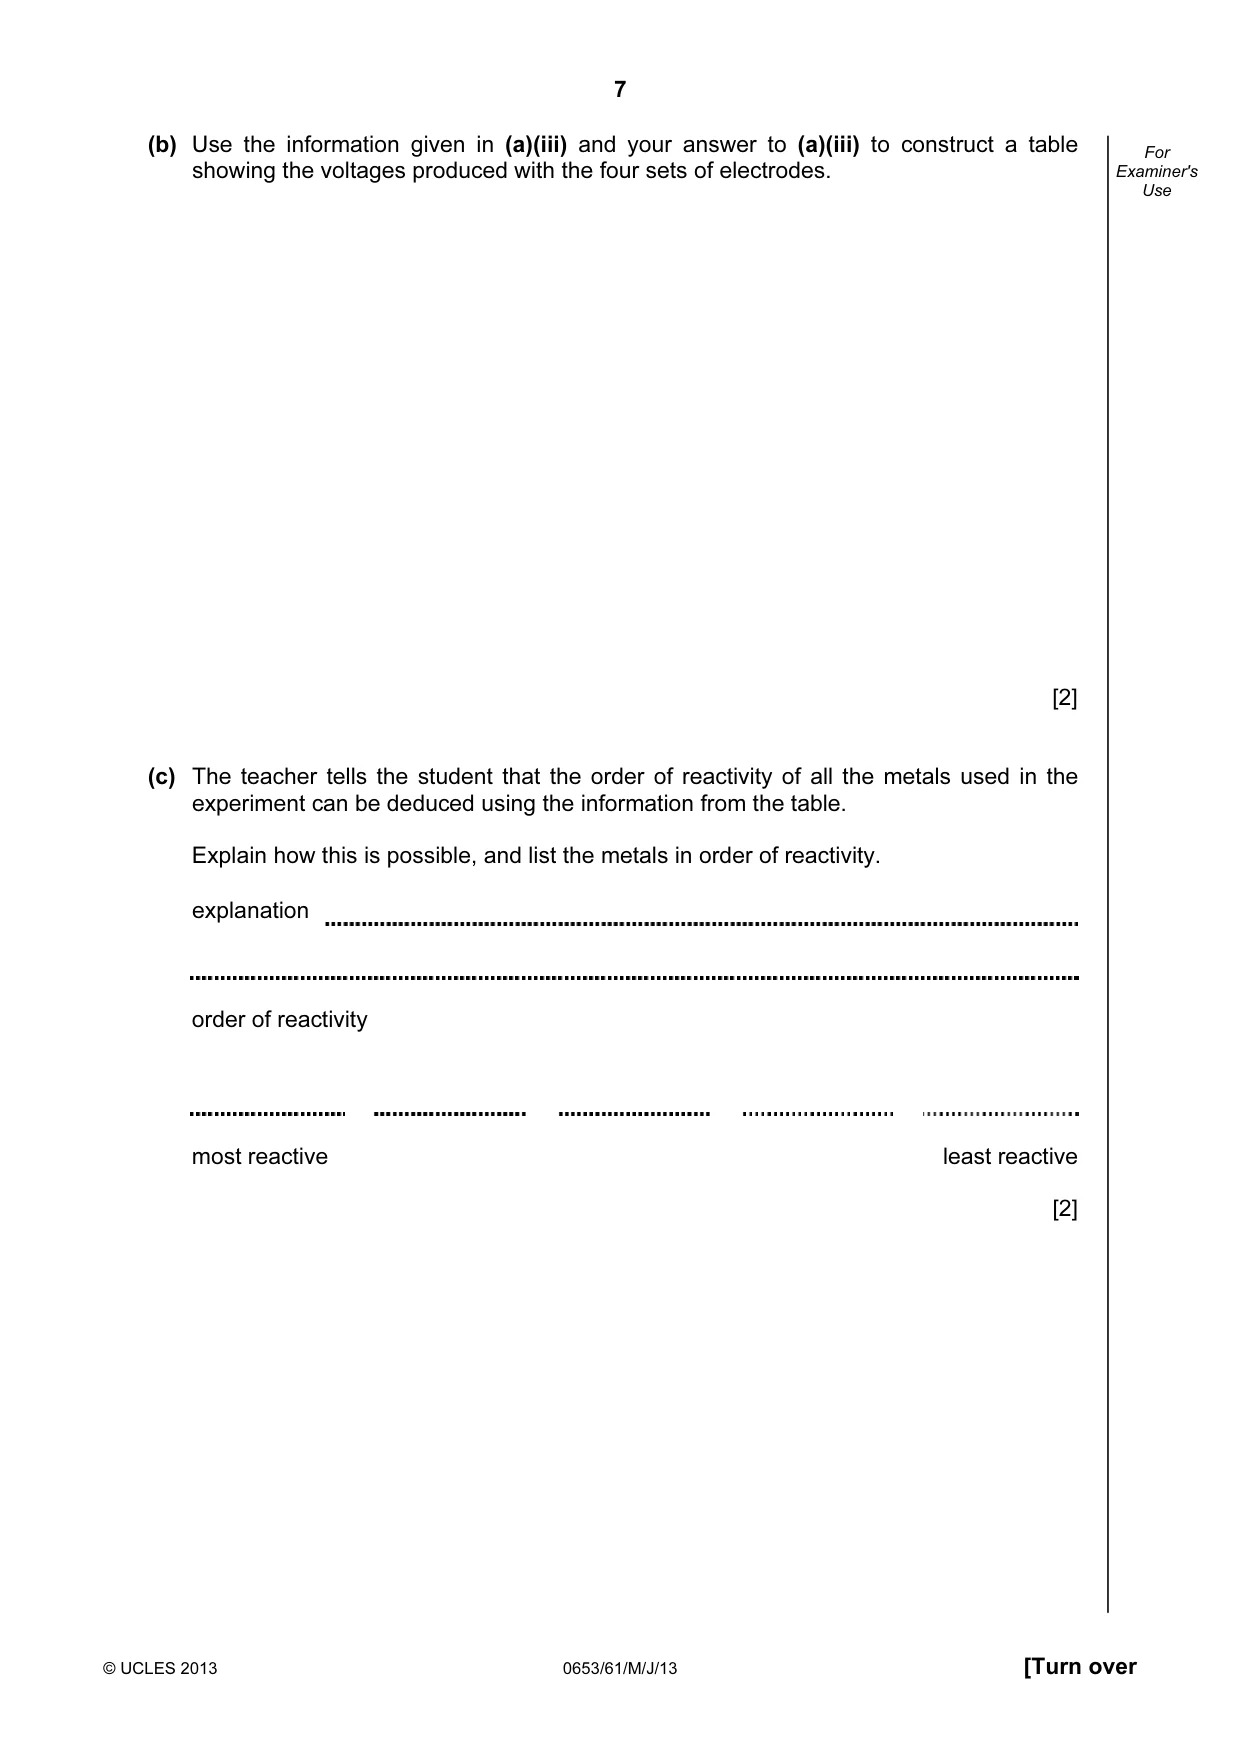
7 © UCLES 2013 0653/61/M/J/13 [Turn over For Examiner's Use (b) Use the information given in (a)(iii) and your answer to (a)(iii) to construct a table showing the voltages produced with the four sets of electrodes. [2] (c) The teacher tells the student that the order of reactivity of all the metals used in the experiment can be deduced using the information from the table. Explain how this is possible, and list the metals in order of reactivity. explanation order of reactivity most reactive least reactive [2]
Question paper, page 8
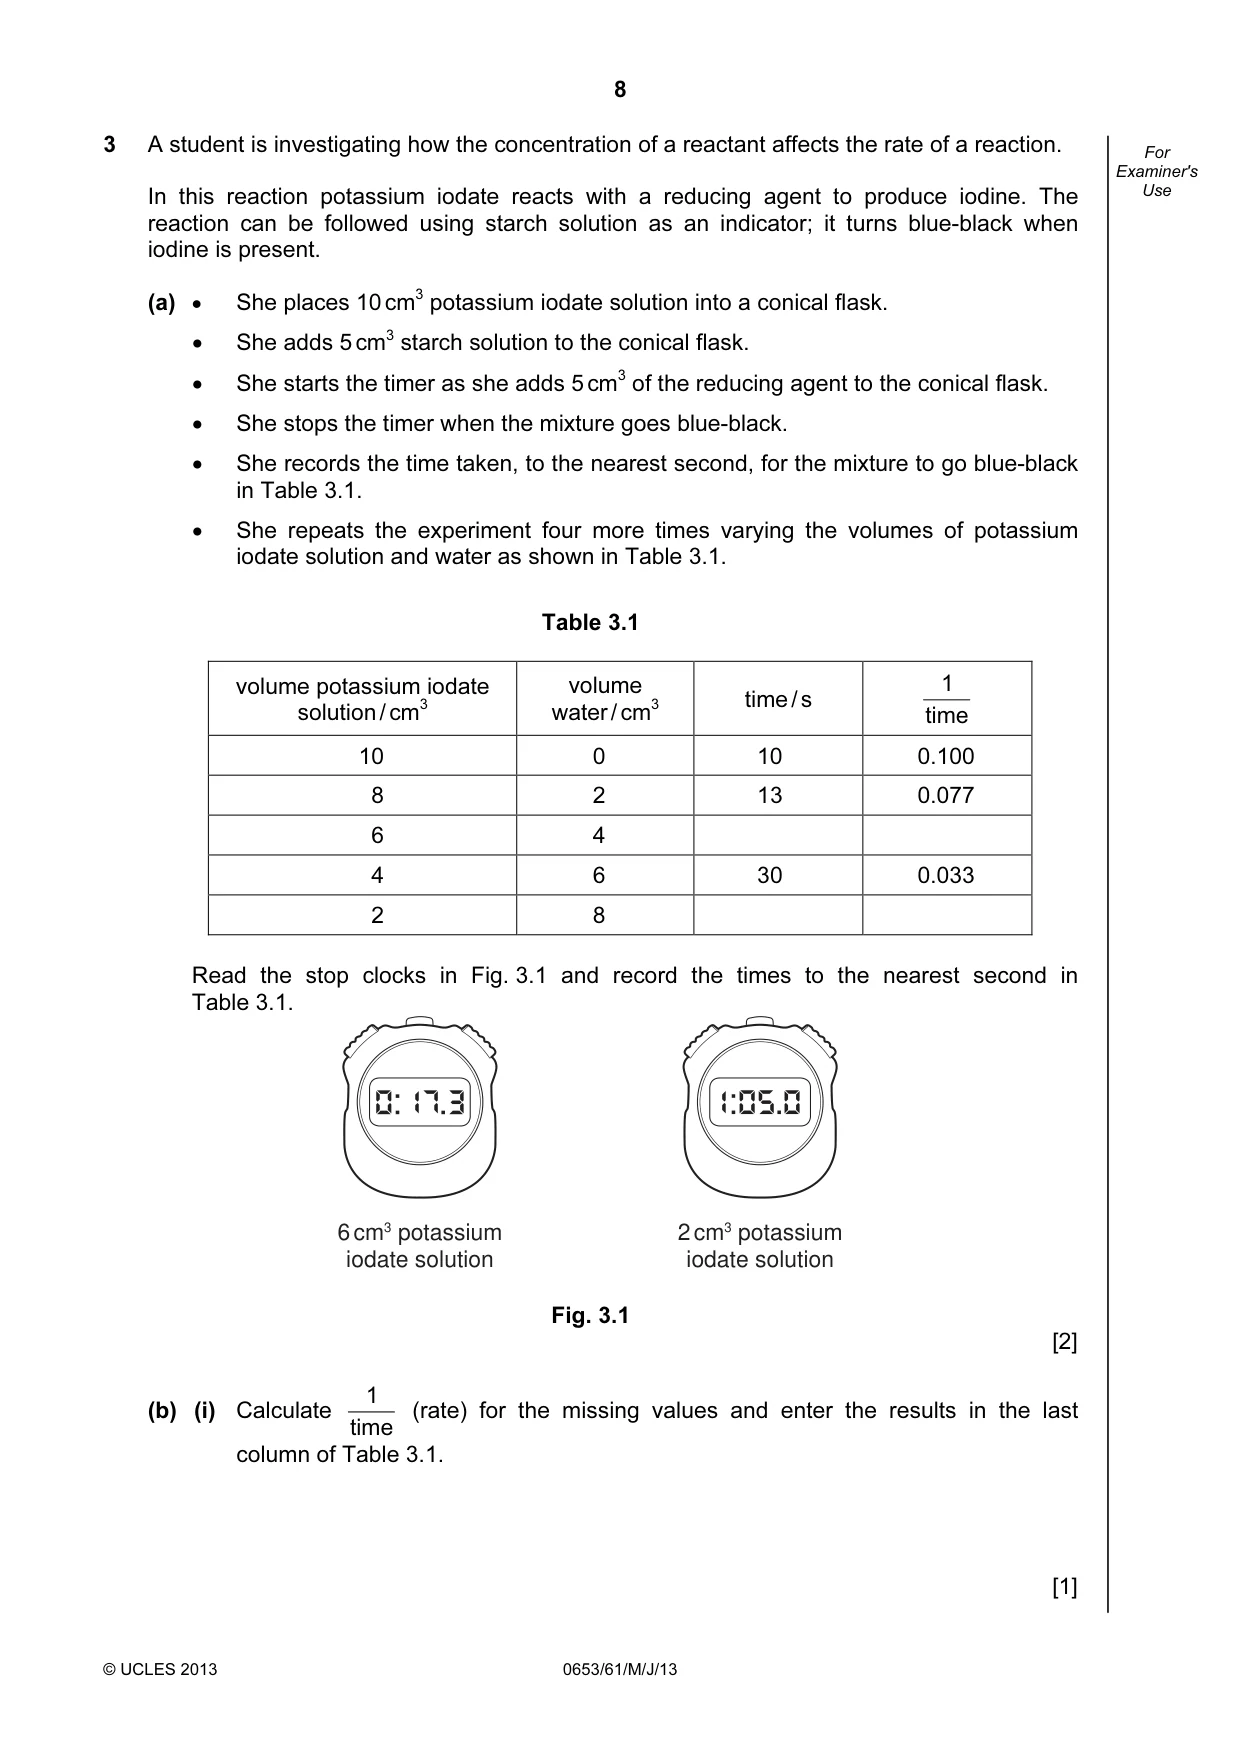
8 © UCLES 2013 0653/61/M/J/13 For Examiner's Use 3 A student is investigating how the concentration of a reactant affects the rate of a reaction. In this reaction potassium iodate reacts with a reducing agent to produce iodine. The reaction can be followed using starch solution as an indicator; it turns blue-black when iodine is present. (a) • She places 10 cm3 potassium iodate solution into a conical flask. • She adds 5 cm3 starch solution to the conical flask. • She starts the timer as she adds 5 cm3 of the reducing agent to the conical flask. • She stops the timer when the mixture goes blue-black. • She records the time taken, to the nearest second, for the mixture to go blue-black in Table 3.1. • She repeats the experiment four more times varying the volumes of potassium iodate solution and water as shown in Table 3.1. Table 3.1 volume potassium iodate solution / cm3 volume water / cm3 time / s time 1 10 0 10 0.100 8 2 13 0.077 6 4 4 6 30 0.033 2 8 Read the stop clocks in Fig. 3.1 and record the times to the nearest second in Table 3.1. 6 cm3 potassium iodate solution 2 cm3 potassium iodate solution Fig. 3.1 [2] (b) (i) Calculate time 1 (rate) for the missing values and enter the results in the last column of Table 3.1. [1]
Question paper, page 9
9 © UCLES 2013 0653/61/M/J/13 [Turn over For Examiner's Use (ii) Plot a graph of time 1 (vertical axis) against the volume of potassium iodate solution / cm3 drawing the best straight line through the origin. [4]
Question paper, page 10
10 © UCLES 2013 0653/61/M/J/13 For Examiner's Use (c) (i) State what your graph tells you about how the rate of the reaction depends upon the volume of potassium iodate solution present. [1] (ii) When the potassium iodate is reduced iodine is formed. What observation made by the student confirms this? [1] (iii) Why are different volumes of water used in each experiment? [1]
Question paper, page 11
11 © UCLES 2013 0654/61/M/J/13 [Turn over Please turn over for Question 4.
Question paper, page 12
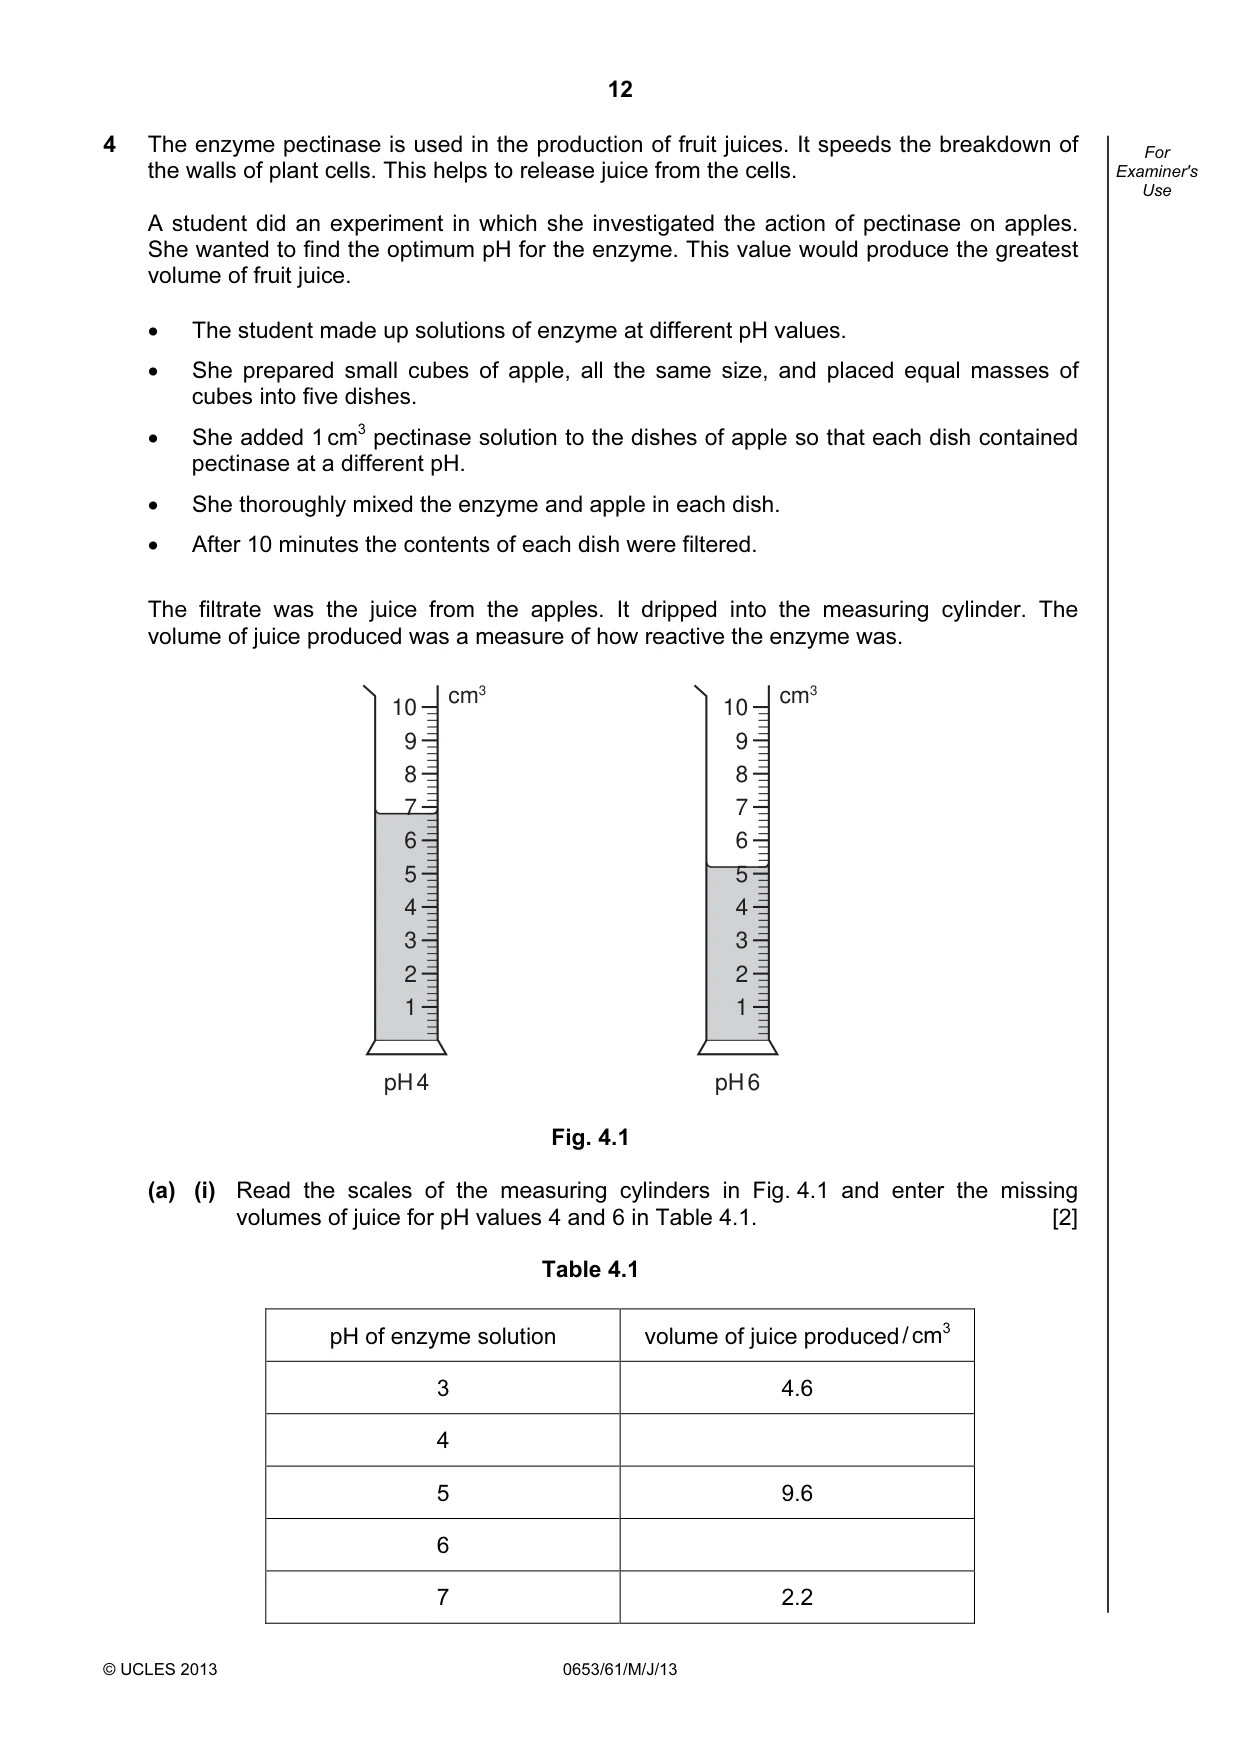
12 © UCLES 2013 0653/61/M/J/13 For Examiner's Use 4 The enzyme pectinase is used in the production of fruit juices. It speeds the breakdown of the walls of plant cells. This helps to release juice from the cells. A student did an experiment in which she investigated the action of pectinase on apples. She wanted to find the optimum pH for the enzyme. This value would produce the greatest volume of fruit juice. • The student made up solutions of enzyme at different pH values. • She prepared small cubes of apple, all the same size, and placed equal masses of cubes into five dishes. • She added 1 cm3 pectinase solution to the dishes of apple so that each dish contained pectinase at a different pH. • She thoroughly mixed the enzyme and apple in each dish. • After 10 minutes the contents of each dish were filtered. The filtrate was the juice from the apples. It dripped into the measuring cylinder. The volume of juice produced was a measure of how reactive the enzyme was. 10 9 8 7 6 5 4 3 2 1 pH 4 cm3 10 9 8 7 6 5 4 3 2 1 pH 6 cm3 Fig. 4.1 (a) (i) Read the scales of the measuring cylinders in Fig. 4.1 and enter the missing volumes of juice for pH values 4 and 6 in Table 4.1. [2] Table 4.1 pH of enzyme solution volume of juice produced / cm3 3 4.6 4 5 9.6 6 7 2.2
Question paper, page 13
13 © UCLES 2013 0654/61/M/J/13 [Turn over For Examiner's Use (ii) Plot a graph of volume of juice produced / cm3 against pH of enzyme solution on the grid provided. Draw the best curve. [3] (iii) Suggest the optimum pH for the enzyme. optimum pH = [1] (iv) Explain why you cannot be sure of the exact optimum pH value. [1] (b) Describe a control experiment the student could do to prove that the enzyme was responsible for the production of fruit juice. [1]
Question paper, page 14
14 © UCLES 2013 0653/61/M/J/13 For Examiner's Use (c) Use your knowledge of the activity of enzymes to suggest one different method of increasing the activity of the enzyme. Explain why it would work. [2]
Question paper, page 15
15 © UCLES 2013 0653/61/M/J/13 [Turn over Please turn over for Question 5.
Question paper, page 16
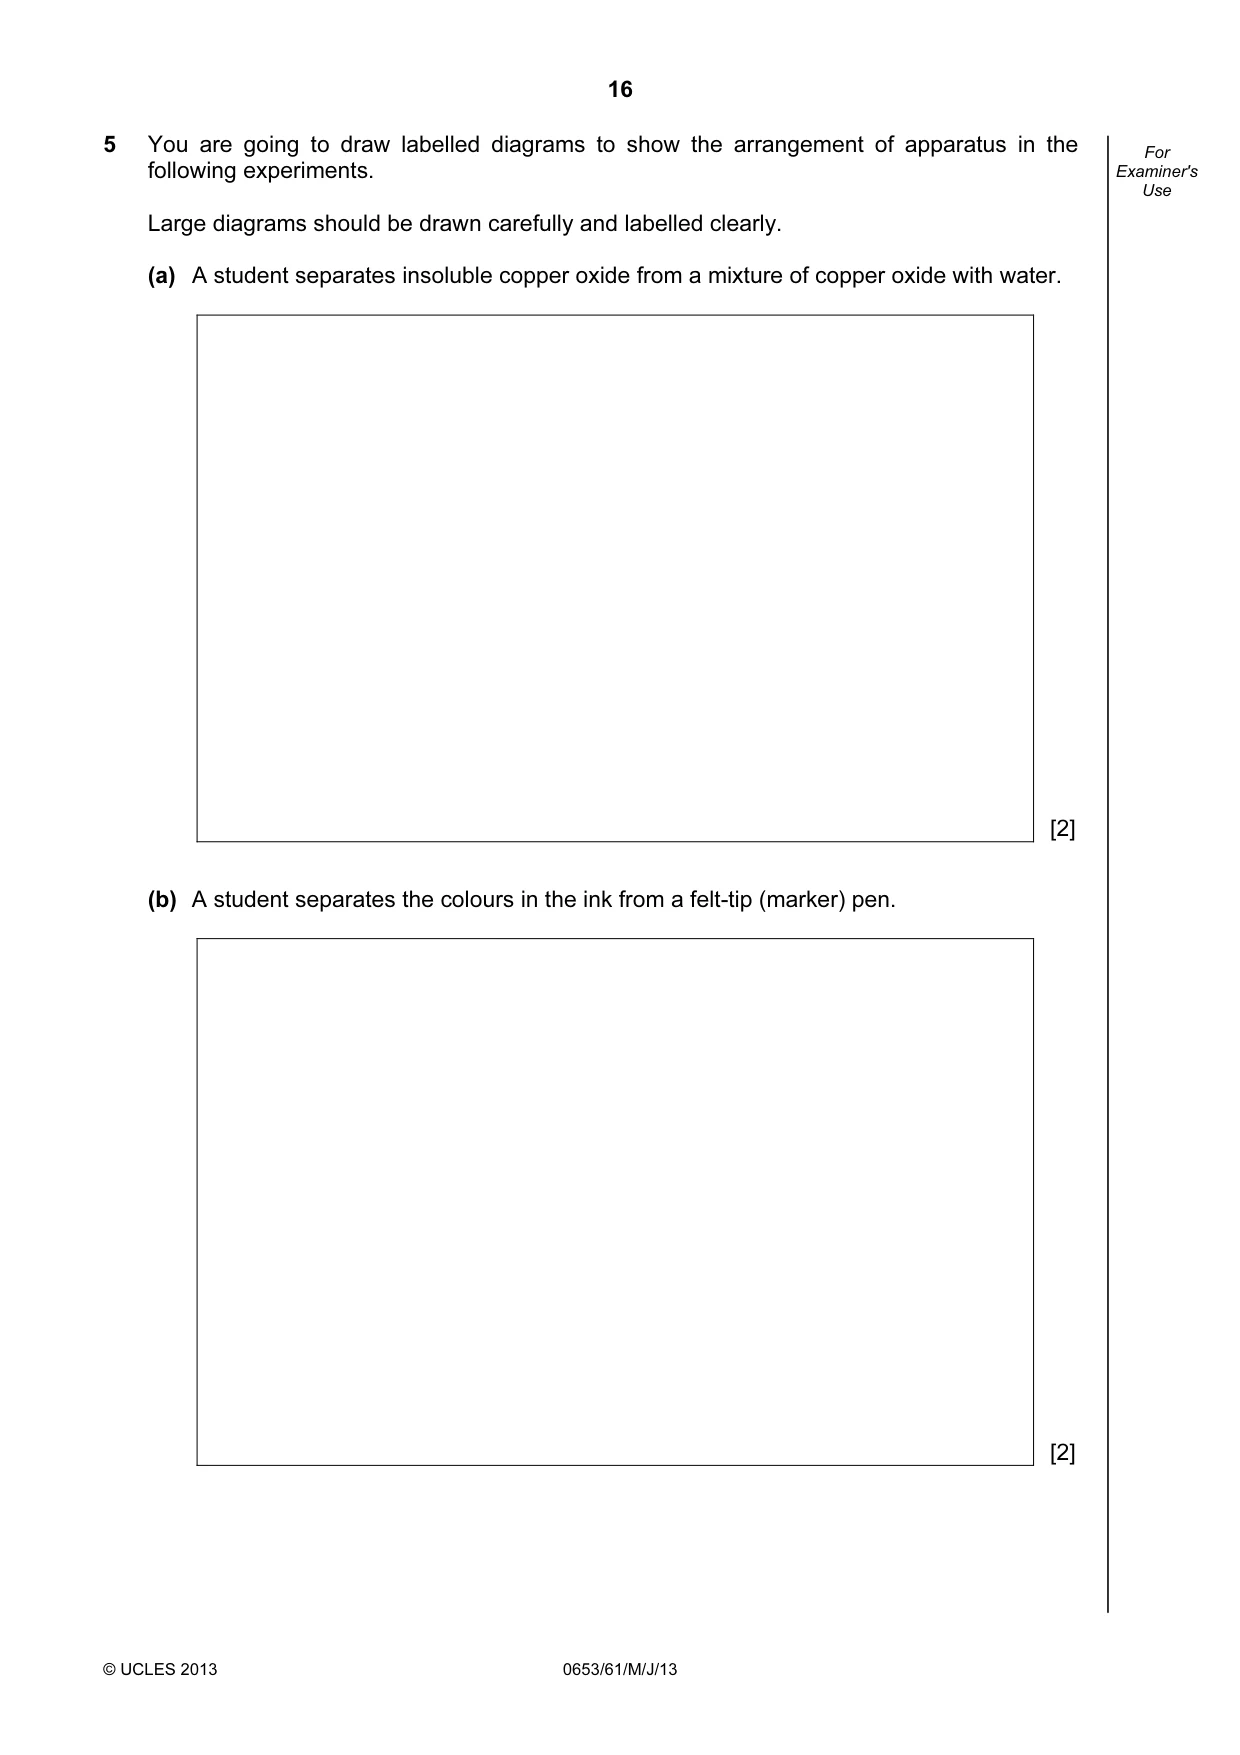
16 © UCLES 2013 0653/61/M/J/13 For Examiner's Use 5 You are going to draw labelled diagrams to show the arrangement of apparatus in the following experiments. Large diagrams should be drawn carefully and labelled clearly. (a) A student separates insoluble copper oxide from a mixture of copper oxide with water. [2] (b) A student separates the colours in the ink from a felt-tip (marker) pen. [2]
Question paper, page 17
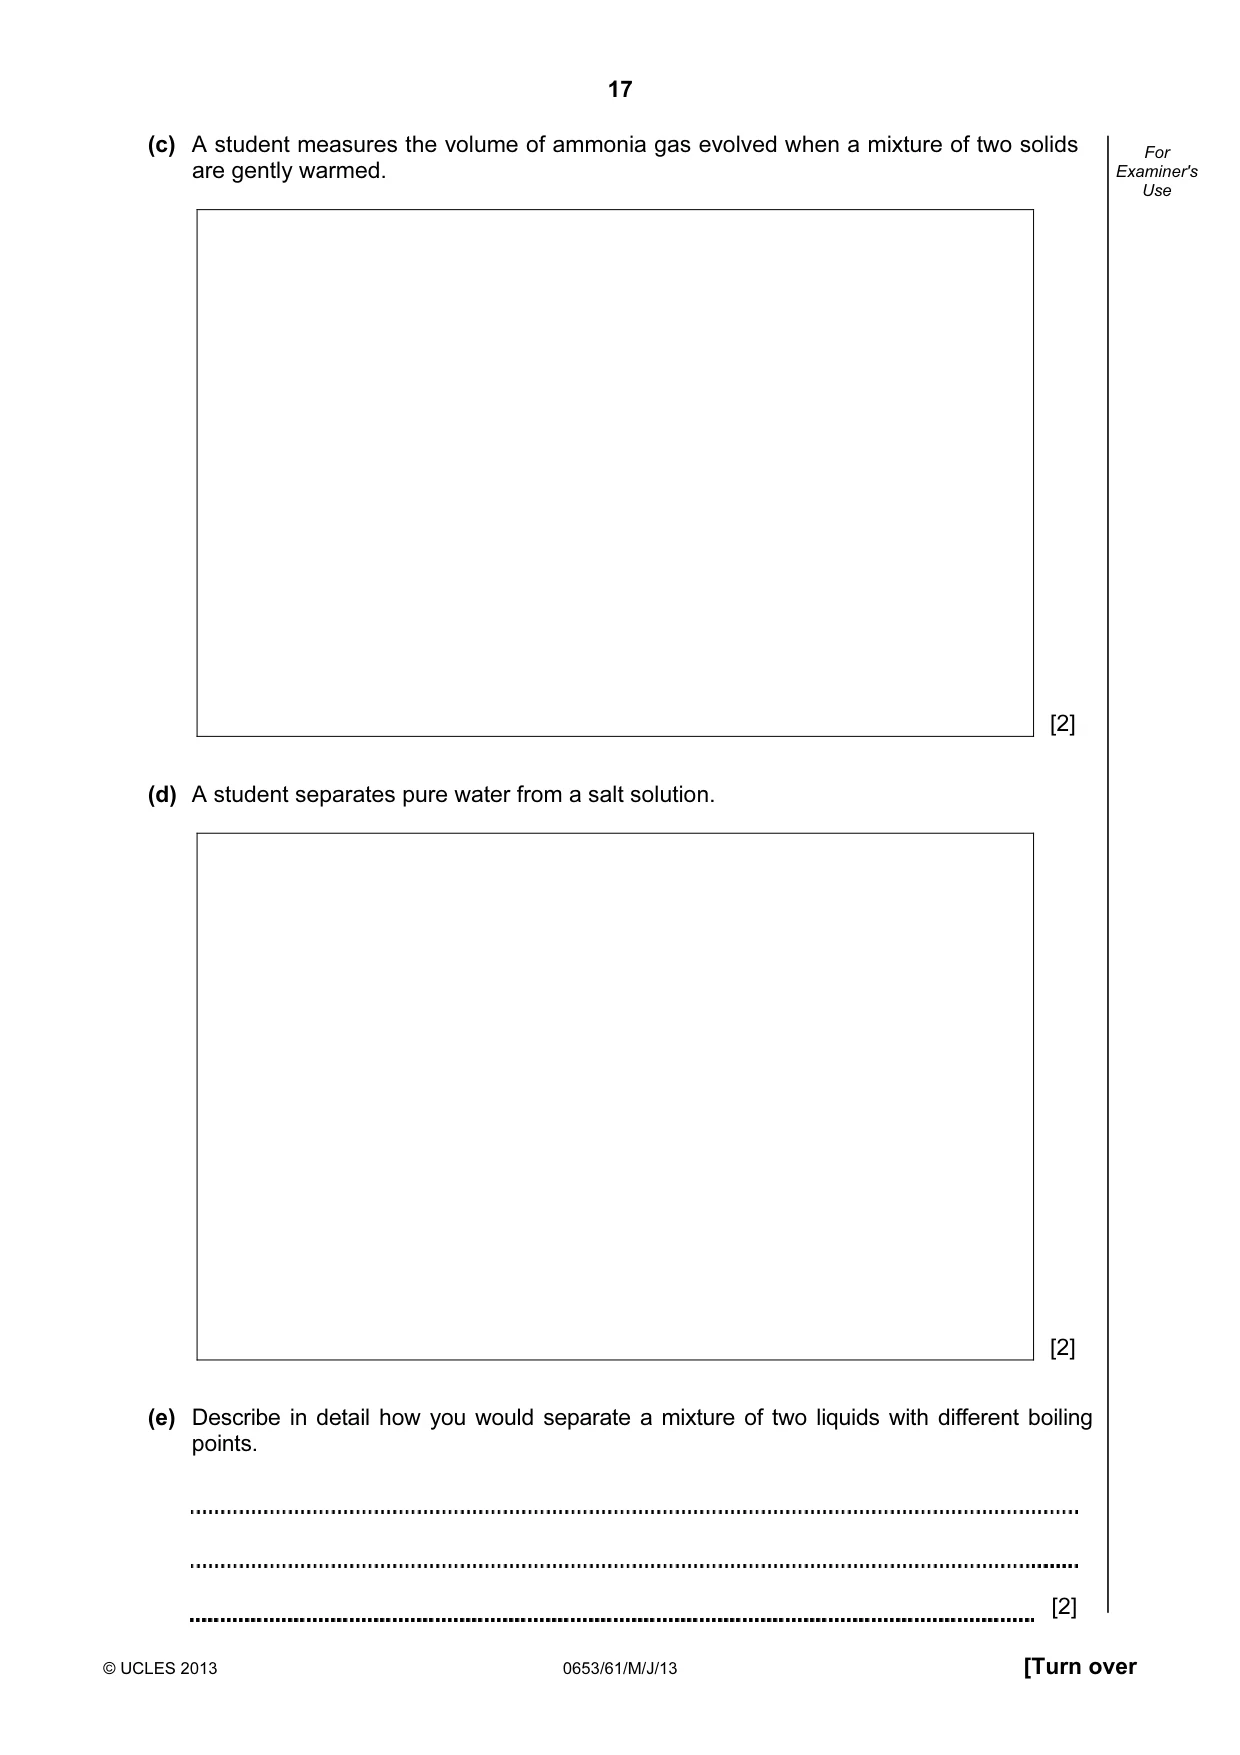
17 © UCLES 2013 0653/61/M/J/13 [Turn over For Examiner's Use (c) A student measures the volume of ammonia gas evolved when a mixture of two solids are gently warmed. [2] (d) A student separates pure water from a salt solution. [2] (e) Describe in detail how you would separate a mixture of two liquids with different boiling points. [2]
Question paper, page 18
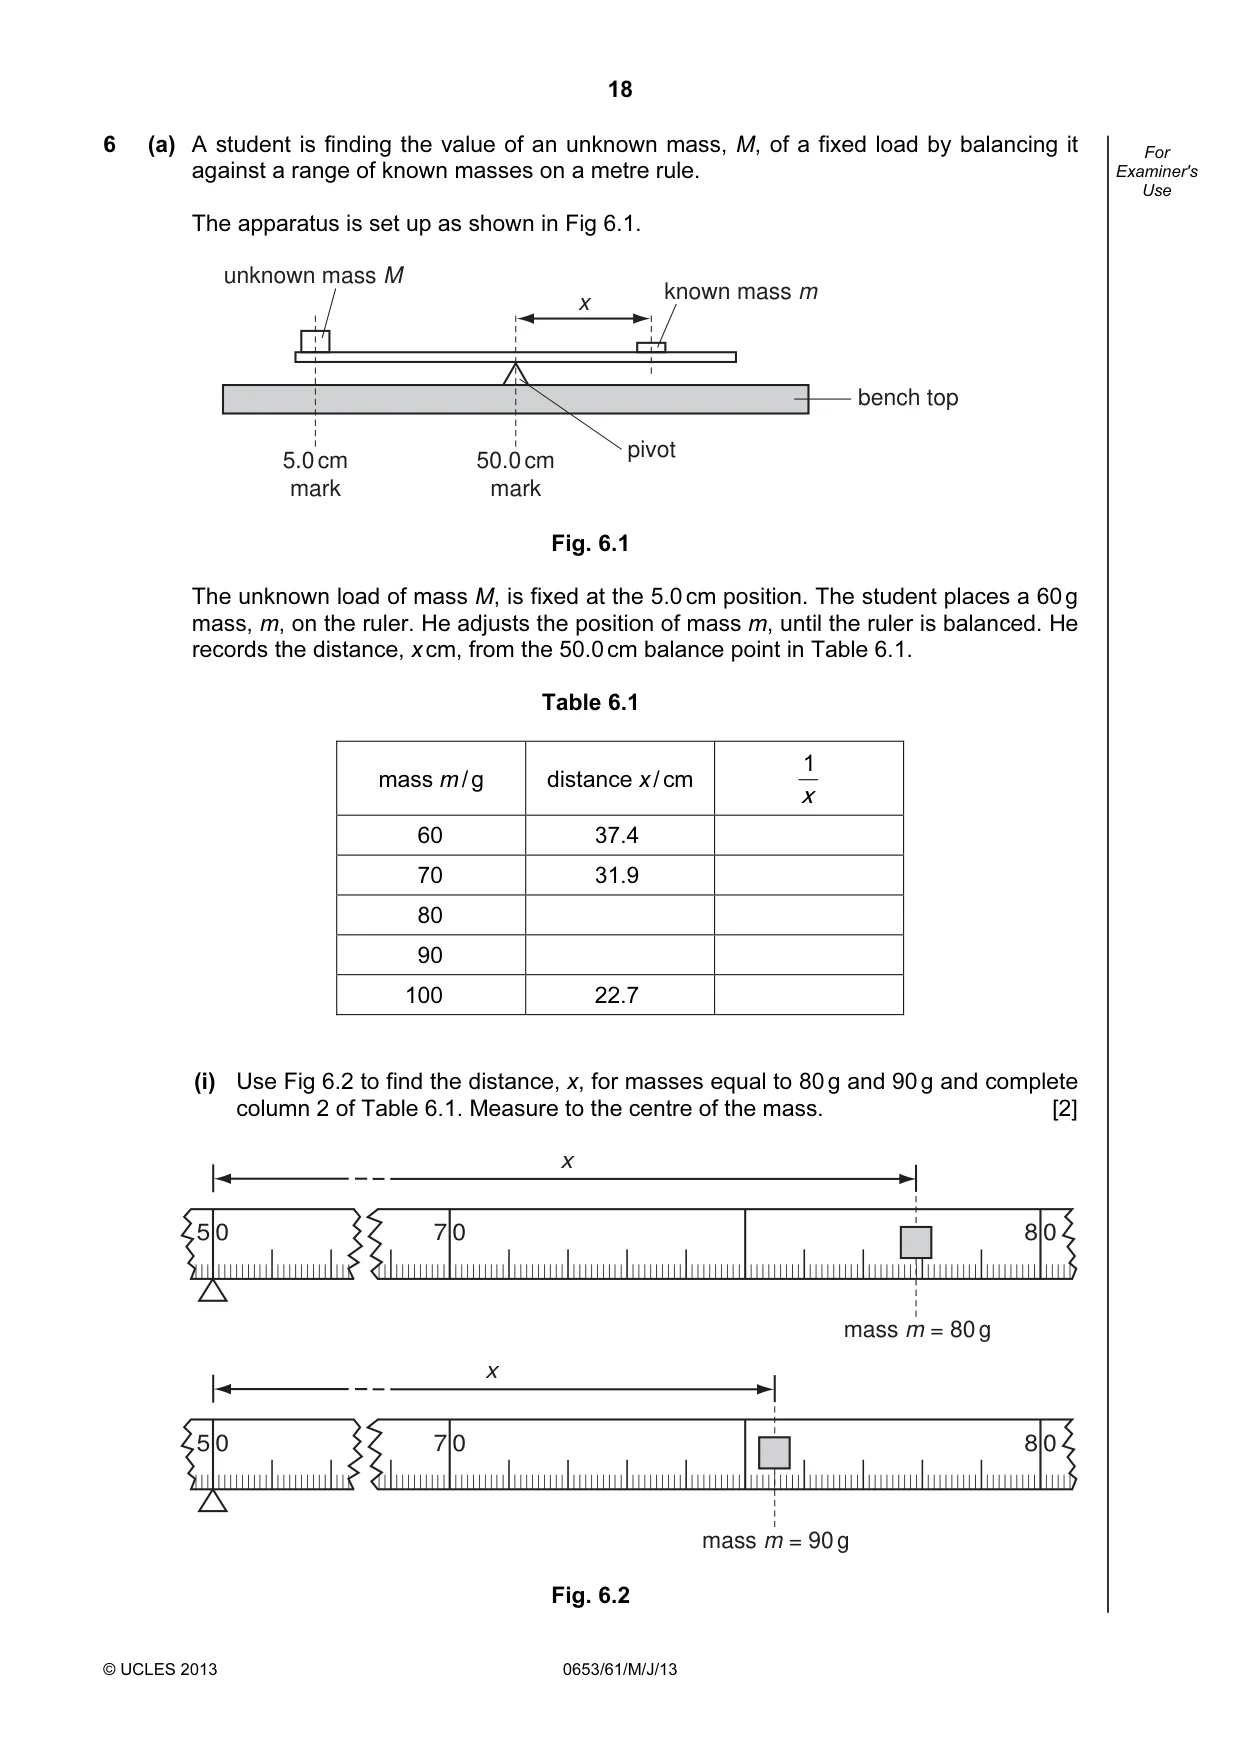
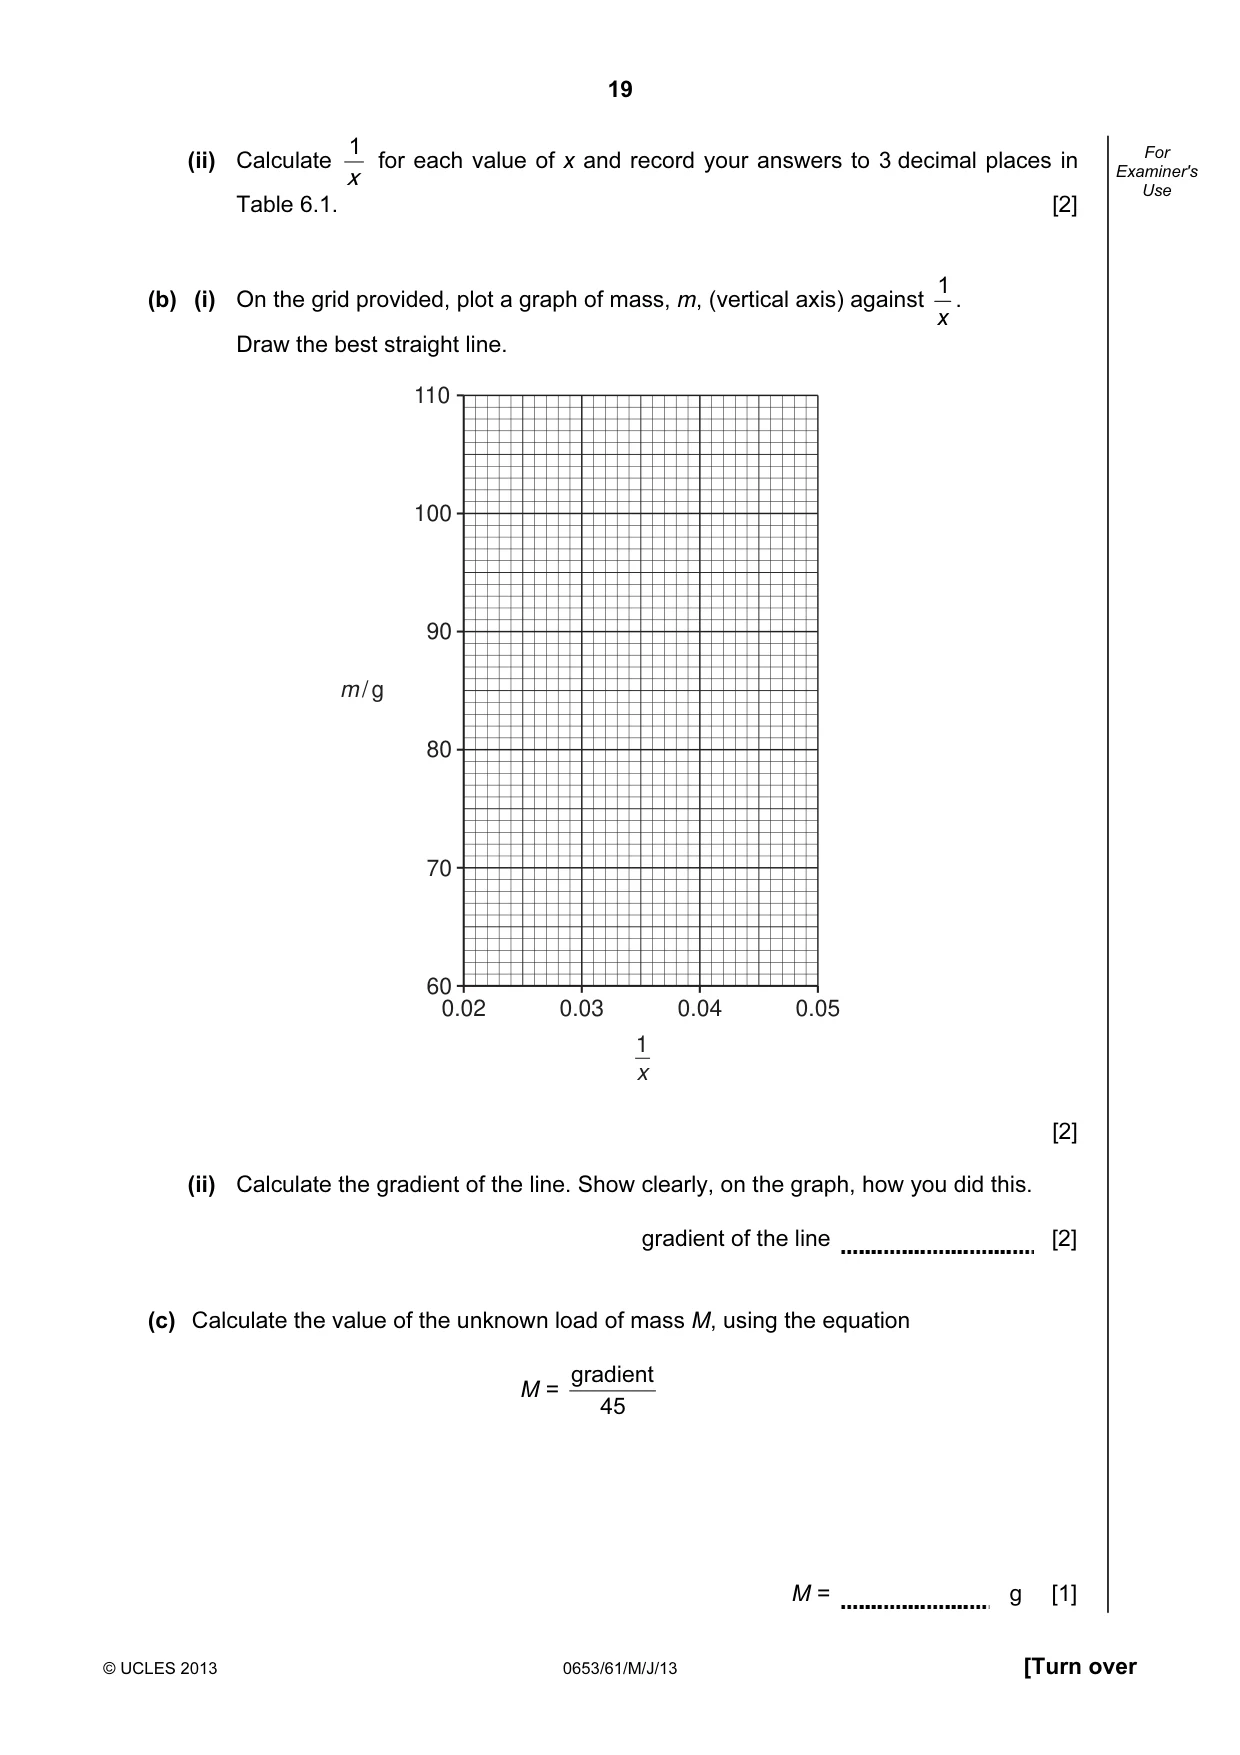
18 © UCLES 2013 0653/61/M/J/13 For Examiner's Use 6 (a) A student is finding the value of an unknown mass, M, of a fixed load by balancing it against a range of known masses on a metre rule. The apparatus is set up as shown in Fig 6.1. unknown mass M known mass m x pivot 5.0 cm mark 50.0 cm mark bench top Fig. 6.1 The unknown load of mass M, is fixed at the 5.0 cm position. The student places a 60 g mass, m, on the ruler. He adjusts the position of mass m, until the ruler is balanced. He records the distance, x cm, from the 50.0 cm balance point in Table 6.1. Table 6.1 mass m / g distance x / cm x 1 60 37.4 70 31.9 80 90 100 22.7 (i) Use Fig 6.2 to find the distance, x, for masses equal to 80 g and 90 g and complete column 2 of Table 6.1. Measure to the centre of the mass. [2] x 8 0 7 0 5 0 mass m = 80 g x 8 0 7 0 5 0 mass m = 90 g Fig. 6.2
Question paper, page 19
19 © UCLES 2013 0653/61/M/J/13 [Turn over For Examiner's Use (ii) Calculate x 1 for each value of x and record your answers to 3 decimal places in Table 6.1. [2] (b) (i) On the grid provided, plot a graph of mass, m, (vertical axis) against x 1 . Draw the best straight line. 110 100 90 80 70 60 0.02 0.03 m / g 0.04 0.05 1 x [2] (ii) Calculate the gradient of the line. Show clearly, on the graph, how you did this. gradient of the line [2] (c) Calculate the value of the unknown load of mass M, using the equation M = 45 gradient M = g [1]
Question paper, page 20
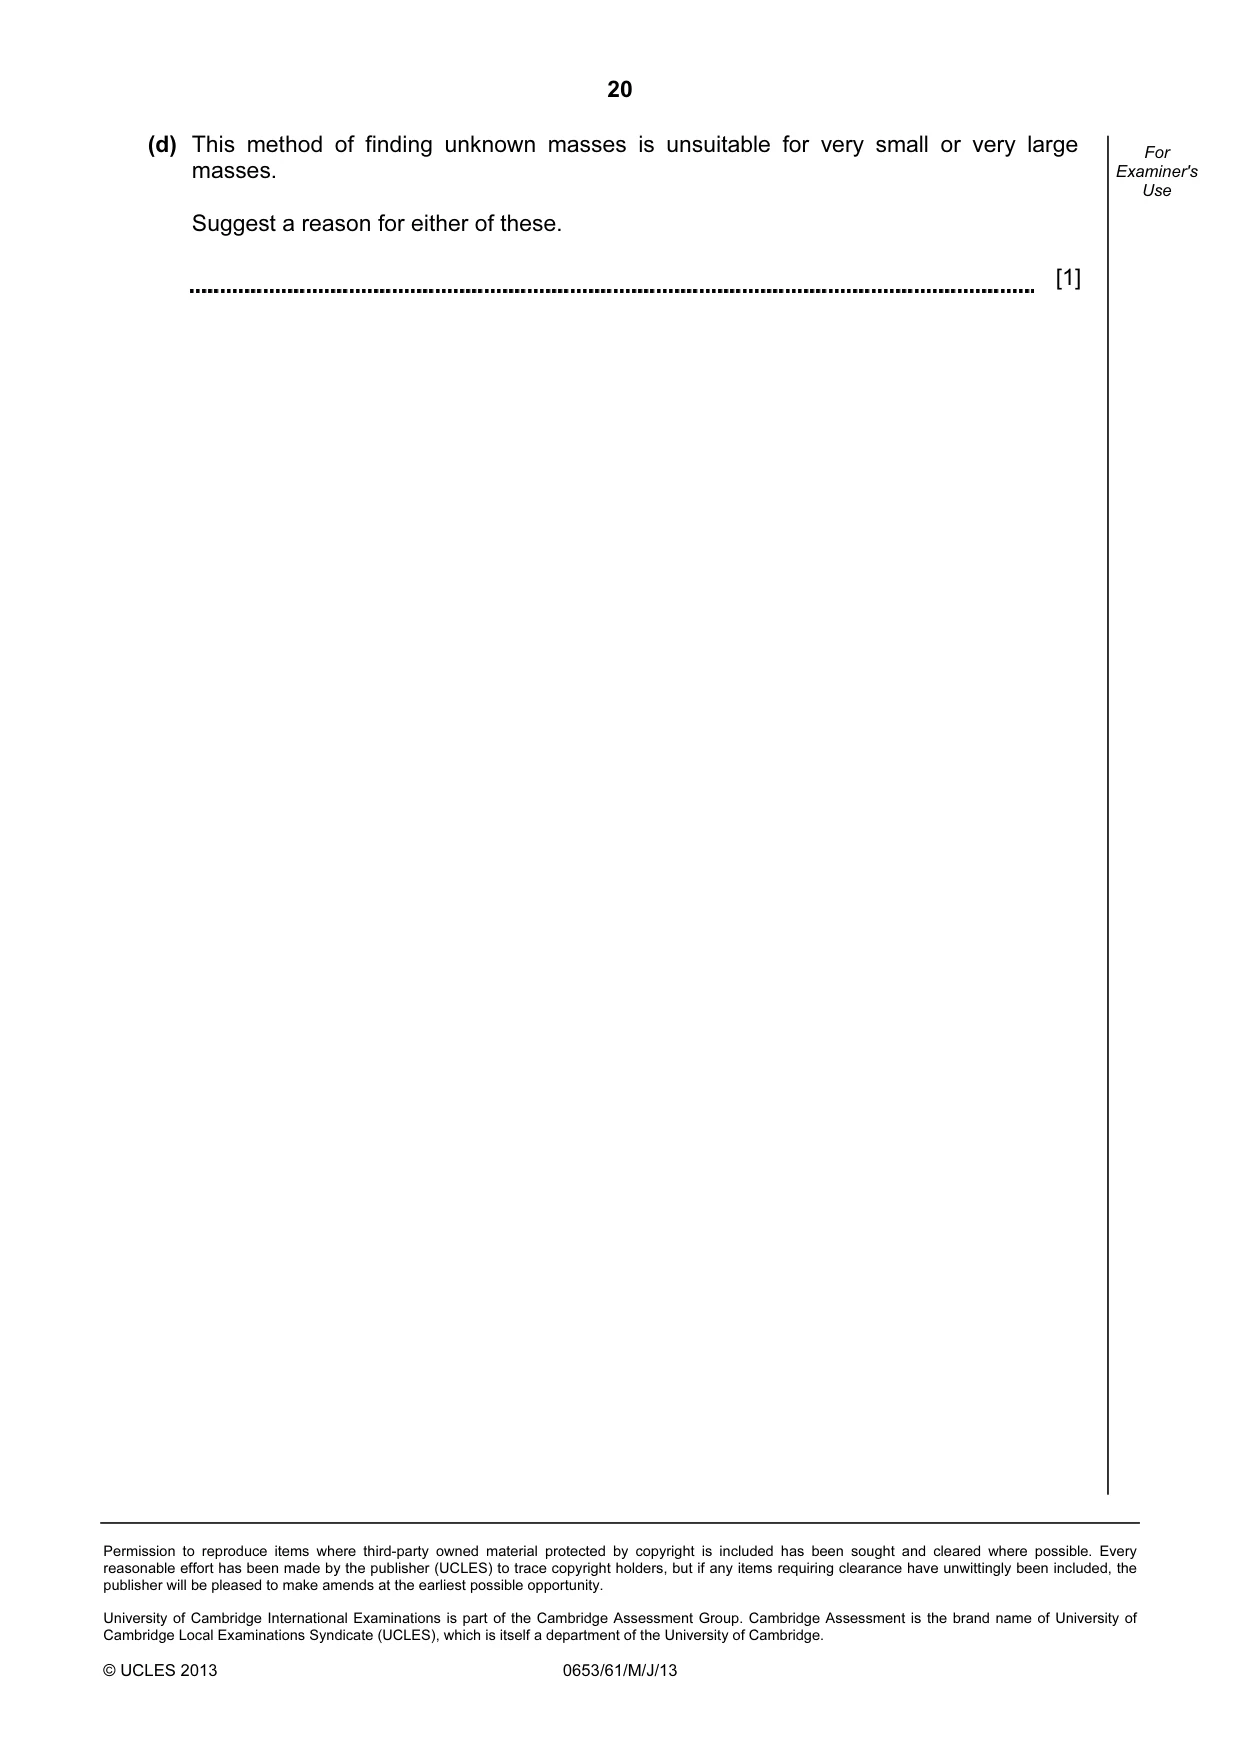
20 Permission to reproduce items where third-party owned material protected by copyright is included has been sought and cleared where possible. Every reasonable effort has been made by the publisher (UCLES) to trace copyright holders, but if any items requiring clearance have unwittingly been included, the publisher will be pleased to make amends at the earliest possible opportunity. University of Cambridge International Examinations is part of the Cambridge Assessment Group. Cambridge Assessment is the brand name of University of Cambridge Local Examinations Syndicate (UCLES), which is itself a department of the University of Cambridge. © UCLES 2013 0653/61/M/J/13 For Examiner's Use (d) This method of finding unknown masses is unsuitable for very small or very large masses. Suggest a reason for either of these. [1]
Mark scheme, page 1
CAMBRIDGE INTERNATIONAL EXAMINATIONS International General Certificate of Secondary Education MARK SCHEME for the May/June 2013 series 0653 COMBINED SCIENCE 0653/61 Paper 6 (Alternative to Practical), maximum raw mark 60 This mark scheme is published as an aid to teachers and candidates, to indicate the requirements of the examination. It shows the basis on which Examiners were instructed to award marks. It does not indicate the details of the discussions that took place at an Examiners’ meeting before marking began, which would have considered the acceptability of alternative answers. Mark schemes should be read in conjunction with the question paper and the Principal Examiner Report for Teachers. Cambridge will not enter into discussions about these mark schemes. Cambridge is publishing the mark schemes for the May/June 2013 series for most IGCSE, GCE Advanced Level and Advanced Subsidiary Level components and some Ordinary Level components. www.XtremePapers.com
Mark scheme, page 2
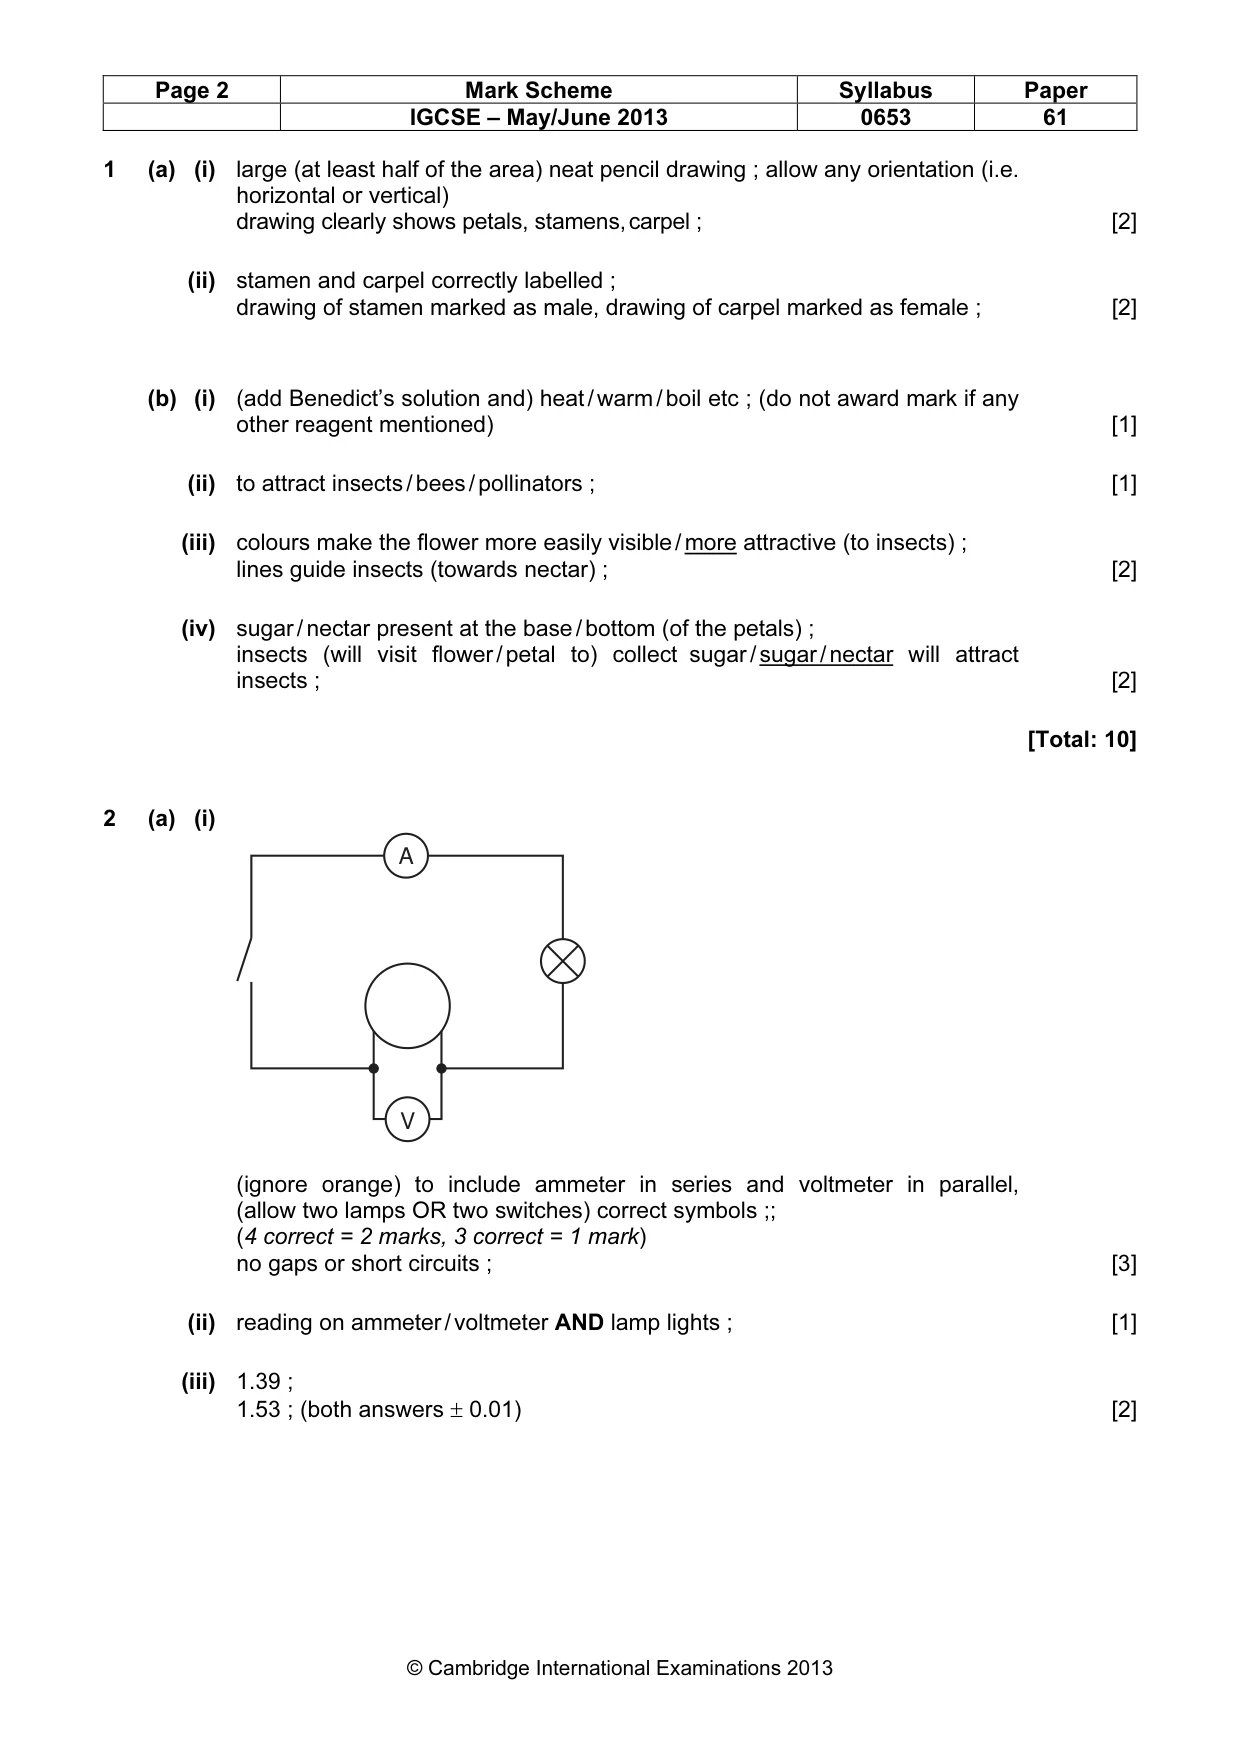
Page 2 Mark Scheme Syllabus Paper IGCSE – May/June 2013 0653 61 © Cambridge International Examinations 2013 1 (a) (i) large (at least half of the area) neat pencil drawing ; allow any orientation (i.e. horizontal or vertical) drawing clearly shows petals, stamens, carpel ; [2] (ii) stamen and carpel correctly labelled ; drawing of stamen marked as male, drawing of carpel marked as female ; [2] (b) (i) (add Benedict’s solution and) heat / warm / boil etc ; (do not award mark if any other reagent mentioned) [1] (ii) to attract insects / bees / pollinators ; [1] (iii) colours make the flower more easily visible / more attractive (to insects) ; lines guide insects (towards nectar) ; [2] (iv) sugar / nectar present at the base / bottom (of the petals) ; insects (will visit flower / petal to) collect sugar / sugar / nectar will attract insects ; [2] [Total: 10] (ignore orange) to include ammeter in series and voltmeter in parallel, (allow two lamps OR two switches) correct symbols ;; (4 correct = 2 marks, 3 correct = 1 mark) no gaps or short circuits ; [3] (ii) reading on ammeter / voltmeter AND lamp lights ; [1] (iii) 1.39 ; 1.53 ; (both answers ± 0.01) [2] 2 (a) (i) A V
Mark scheme, page 3
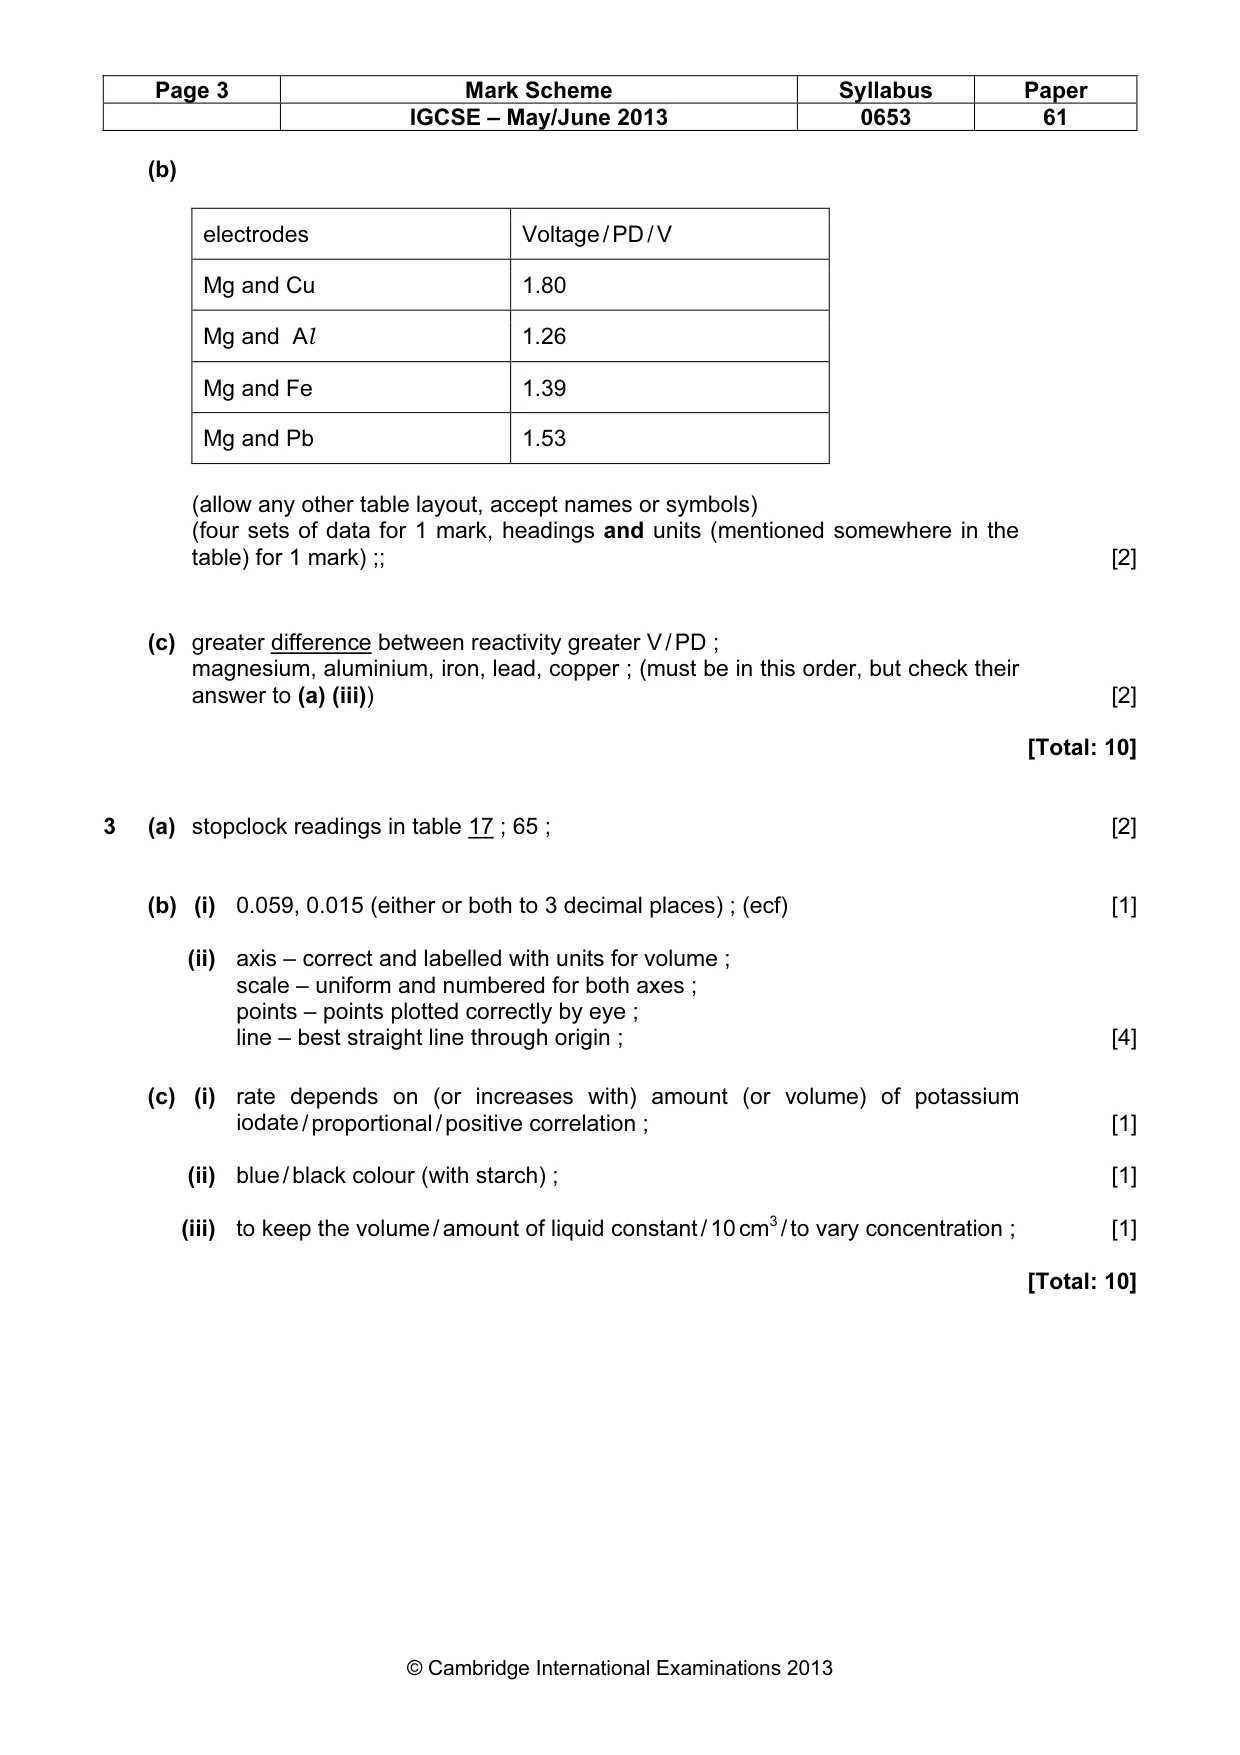
Page 3 Mark Scheme Syllabus Paper IGCSE – May/June 2013 0653 61 © Cambridge International Examinations 2013 [Total: 10] 3 (a) stopclock readings in table 17 ; 65 ; [2] (b) (i) 0.059, 0.015 (either or both to 3 decimal places) ; (ecf) [1] (ii) axis – correct and labelled with units for volume ; scale – uniform and numbered for both axes ; points – points plotted correctly by eye ; line – best straight line through origin ; [4] (c) (i) rate depends on (or increases with) amount (or volume) of potassium iodate / proportional / positive correlation ; [1] (ii) blue / black colour (with starch) ; [1] (iii) to keep the volume / amount of liquid constant / 10 cm3 / to vary concentration ; [1] [Total: 10] (b) electrodes Voltage / PD / V Mg and Cu 1.80 Mg and Al 1.26 Mg and Fe 1.39 Mg and Pb 1.53 (allow any other table layout, accept names or symbols) (four sets of data for 1 mark, headings and units (mentioned somewhere in the table) for 1 mark) ;; [2] (c) greater difference between reactivity greater V / PD ; magnesium, aluminium, iron, lead, copper ; (must be in this order, but check their answer to (a) (iii)) [2]
Mark scheme, page 4
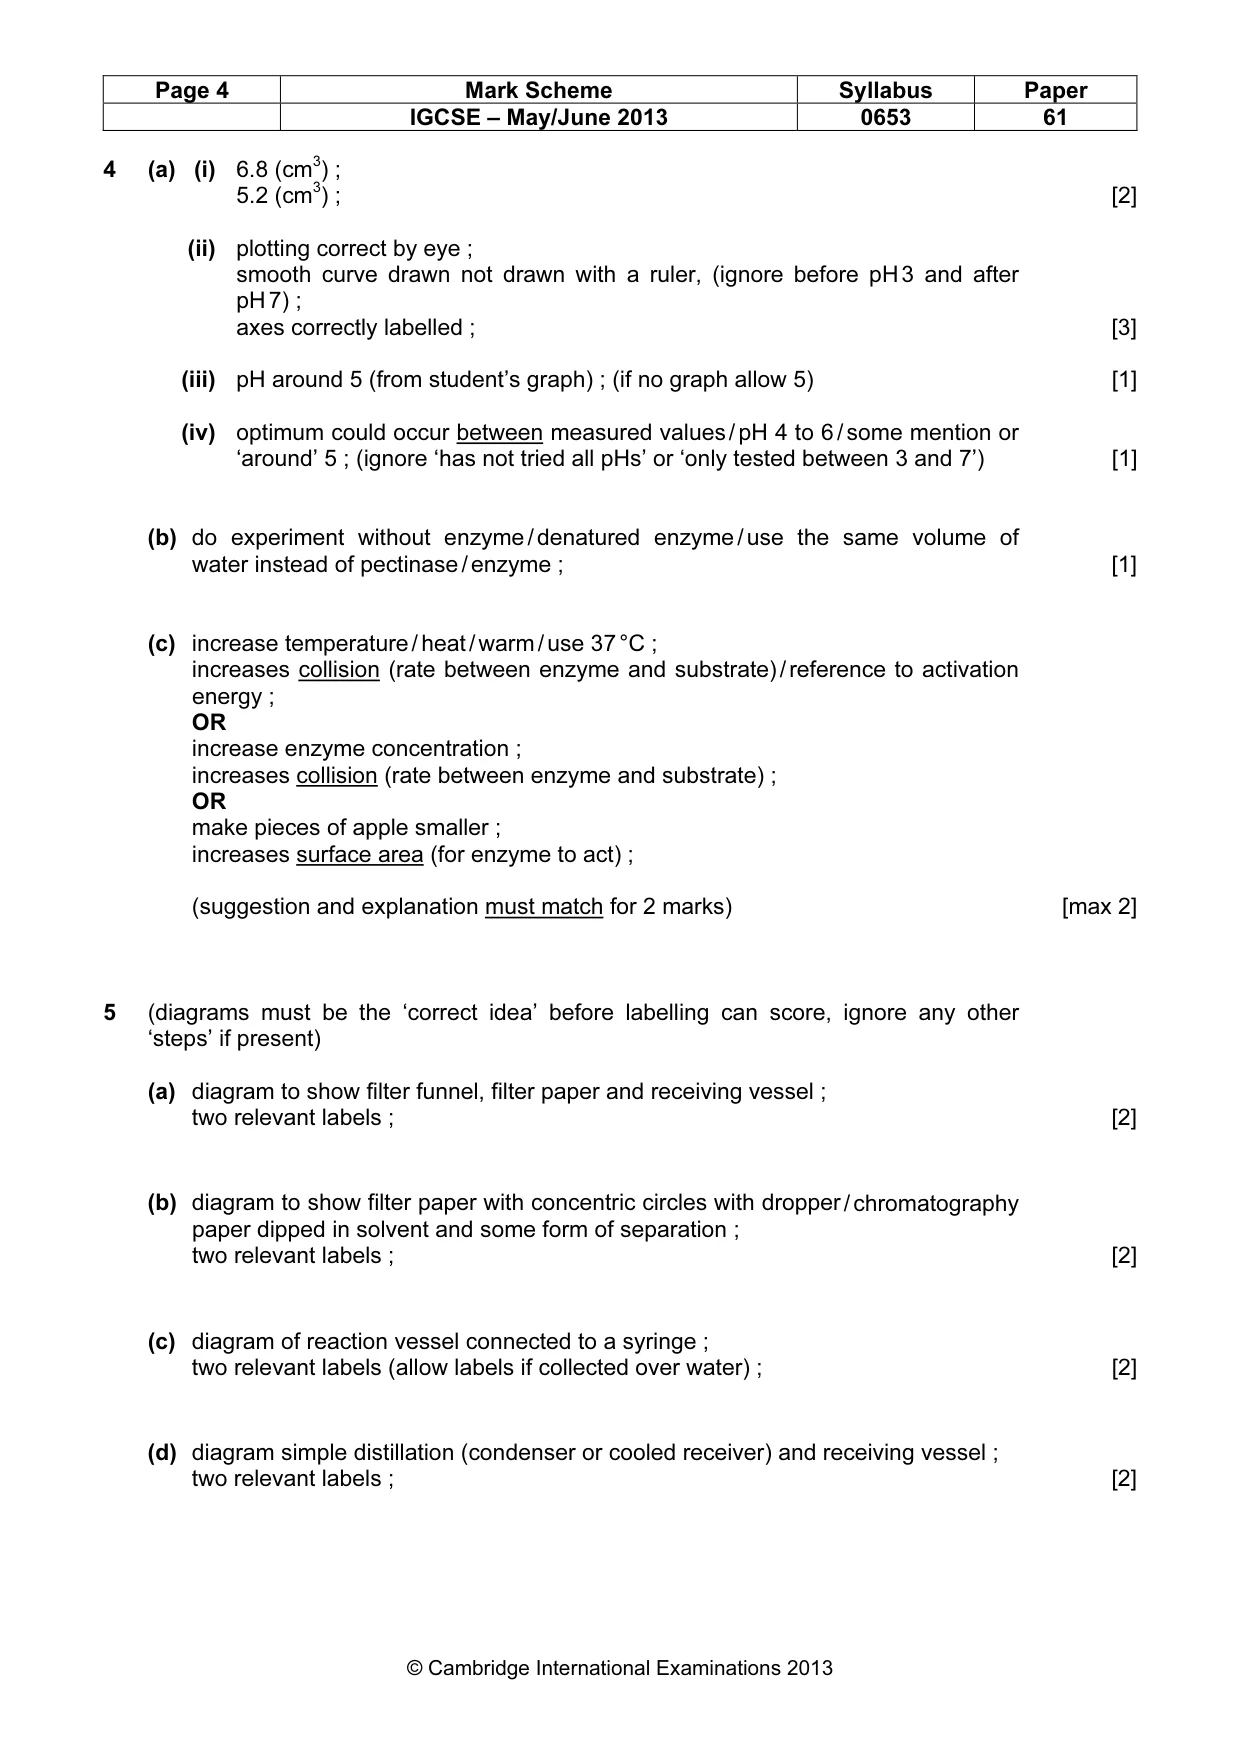
Page 4 Mark Scheme Syllabus Paper IGCSE – May/June 2013 0653 61 © Cambridge International Examinations 2013 4 (a) (i) 6.8 (cm3) ; 5.2 (cm3) ; [2] (ii) plotting correct by eye ; smooth curve drawn not drawn with a ruler, (ignore before pH 3 and after pH 7) ; axes correctly labelled ; [3] (iii) pH around 5 (from student’s graph) ; (if no graph allow 5) [1] (iv) optimum could occur between measured values / pH 4 to 6 / some mention or ‘around’ 5 ; (ignore ‘has not tried all pHs’ or ‘only tested between 3 and 7’) [1] (b) do experiment without enzyme / denatured enzyme / use the same volume of water instead of pectinase / enzyme ; [1] (c) increase temperature / heat / warm / use 37 °C ; increases collision (rate between enzyme and substrate) / reference to activation energy ; OR increase enzyme concentration ; increases collision (rate between enzyme and substrate) ; OR make pieces of apple smaller ; increases surface area (for enzyme to act) ; (suggestion and explanation must match for 2 marks) [max 2] 5 (diagrams must be the ‘correct idea’ before labelling can score, ignore any other ‘steps’ if present) (a) diagram to show filter funnel, filter paper and receiving vessel ; two relevant labels ; [2] (b) diagram to show filter paper with concentric circles with dropper / chromatography paper dipped in solvent and some form of separation ; two relevant labels ; [2] (c) diagram of reaction vessel connected to a syringe ; two relevant labels (allow labels if collected over water) ; [2] (d) diagram simple distillation (condenser or cooled receiver) and receiving vessel ; two relevant labels ; [2]
Mark scheme, page 5
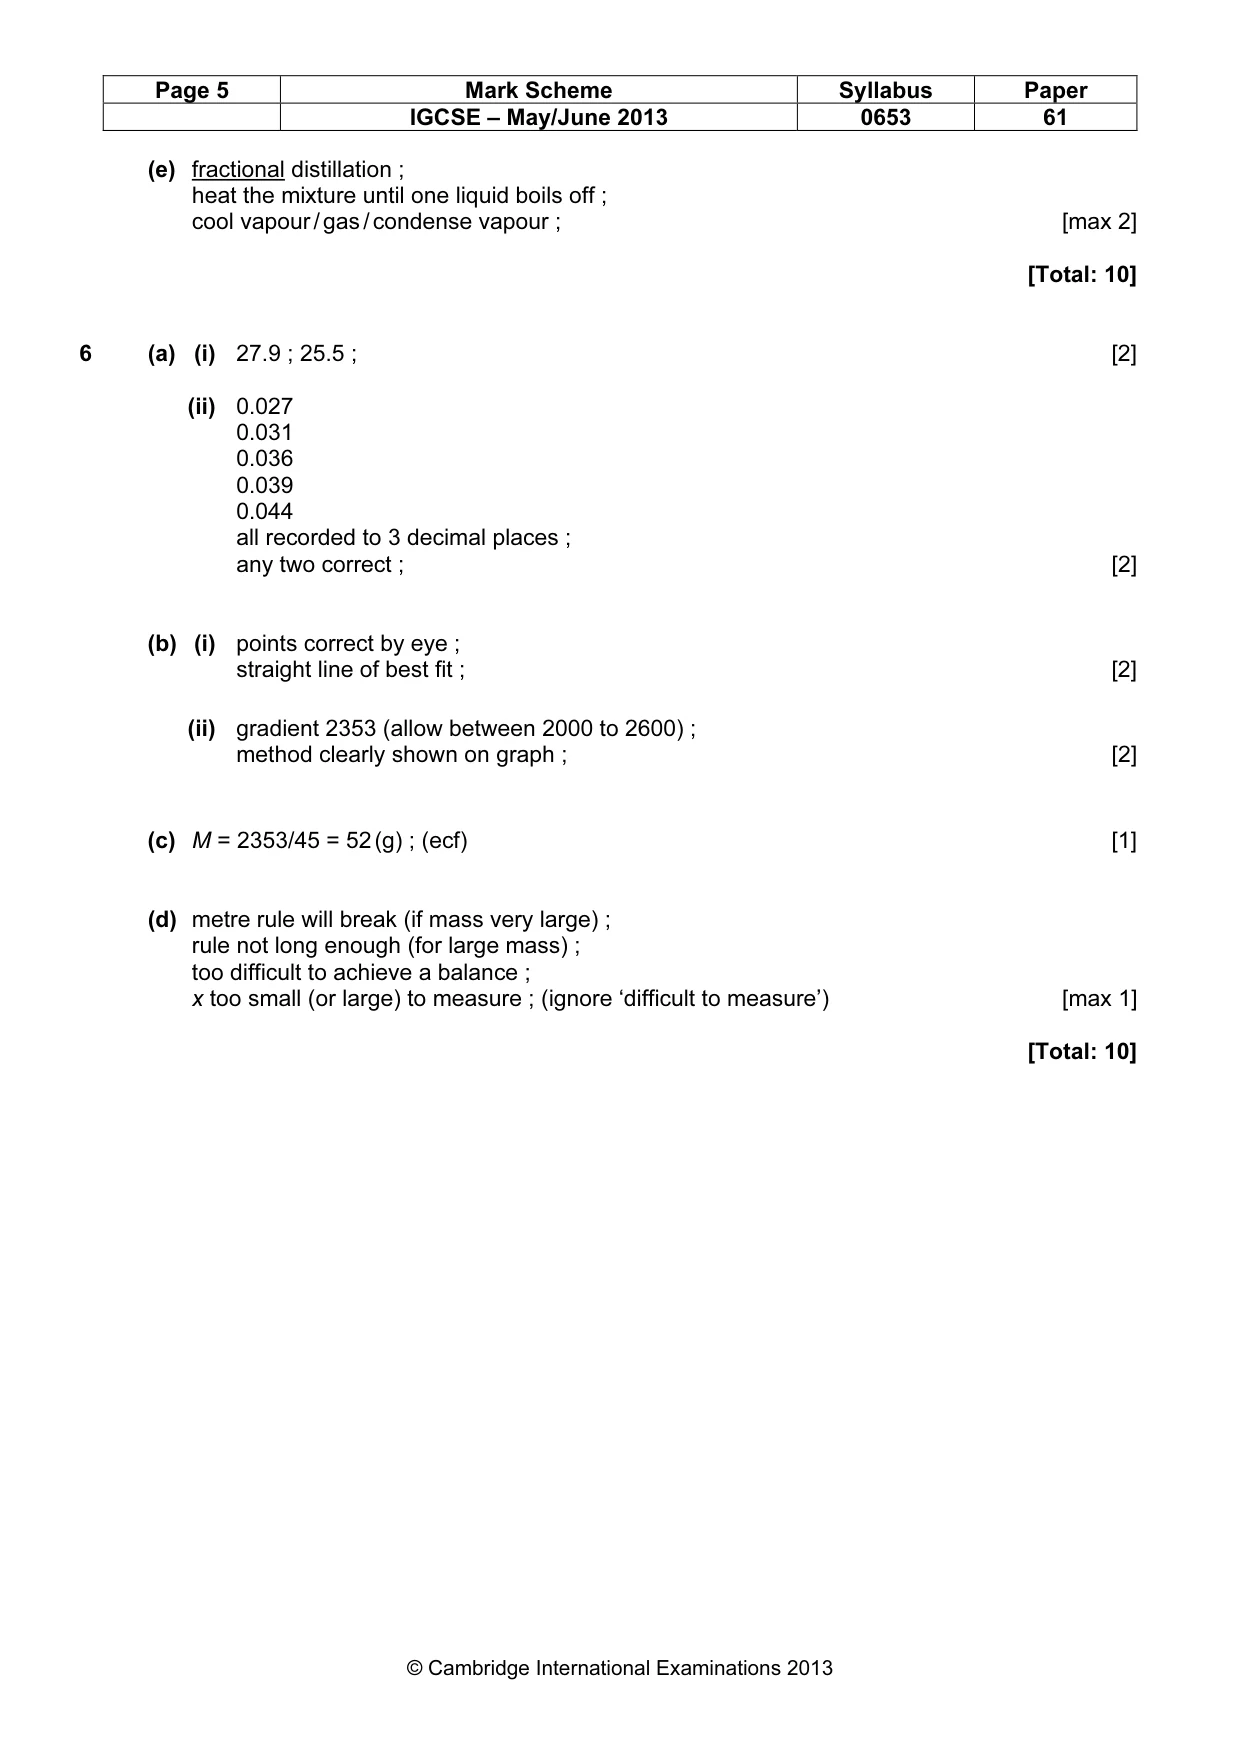
Page 5 Mark Scheme Syllabus Paper IGCSE – May/June 2013 0653 61 © Cambridge International Examinations 2013 (e) fractional distillation ; heat the mixture until one liquid boils off ; cool vapour / gas / condense vapour ; [max 2] [Total: 10] 6 (a) (i) 27.9 ; 25.5 ; [2] (ii) 0.027 0.031 0.036 0.039 0.044 all recorded to 3 decimal places ; any two correct ; [2] (b) (i) points correct by eye ; straight line of best fit ; [2] (ii) gradient 2353 (allow between 2000 to 2600) ; method clearly shown on graph ; [2] (c) M = 2353/45 = 52 (g) ; (ecf) [1] (d) metre rule will break (if mass very large) ; rule not long enough (for large mass) ; too difficult to achieve a balance ; x too small (or large) to measure ; (ignore ‘difficult to measure’) [max 1] [Total: 10]
What you needed in this session
Cambridge’s own grade thresholds for 2013 May/June, Paper 6 · Variant 1. A higher threshold means an easier paper — the bar moves with how the cohort did.