Cambridge IGCSE Science - Combined 0653 — 2010 Oct/Nov Paper 6 · Variant 3
0653/63/O/N/10
The question paper and its mark scheme, free to read here and free to download. This is Cambridge’s own paper, exactly as it was sat.
Question paper20 pages
Mark scheme4 pages
Answers below. Sit the paper first if you are practising.
Paper as text
Question paper, page 1
This document consists of 18 printed pages and 2 blank pages. IB10 11_0653_63/3RP © UCLES 2010 [Turn over *6753955563* For Examiner's Use 1 2 3 4 5 6 Total UNIVERSITY OF CAMBRIDGE INTERNATIONAL EXAMINATIONS International General Certificate of Secondary Education COMBINED SCIENCE 0653/63 Paper 6 Alternative to Practical October/November 2010 1 hour Candidates answer on the Question paper No Additional Materials are required. READ THESE INSTRUCTIONS FIRST Write your Centre number, candidate number and name on all the work you hand in. Write in dark blue or black pen. You may use a soft pencil for any diagrams, graphs, tables or rough working. Do not use staples, paper clips, highlighters, glue or correction fluid. DO NOT WRITE IN ANY BARCODES. Answer all questions. At the end of the examination, fasten all your work securely together. The number of marks is given in brackets [ ] at the end of each question or part question. www.XtremePapers.com
Question paper, page 2
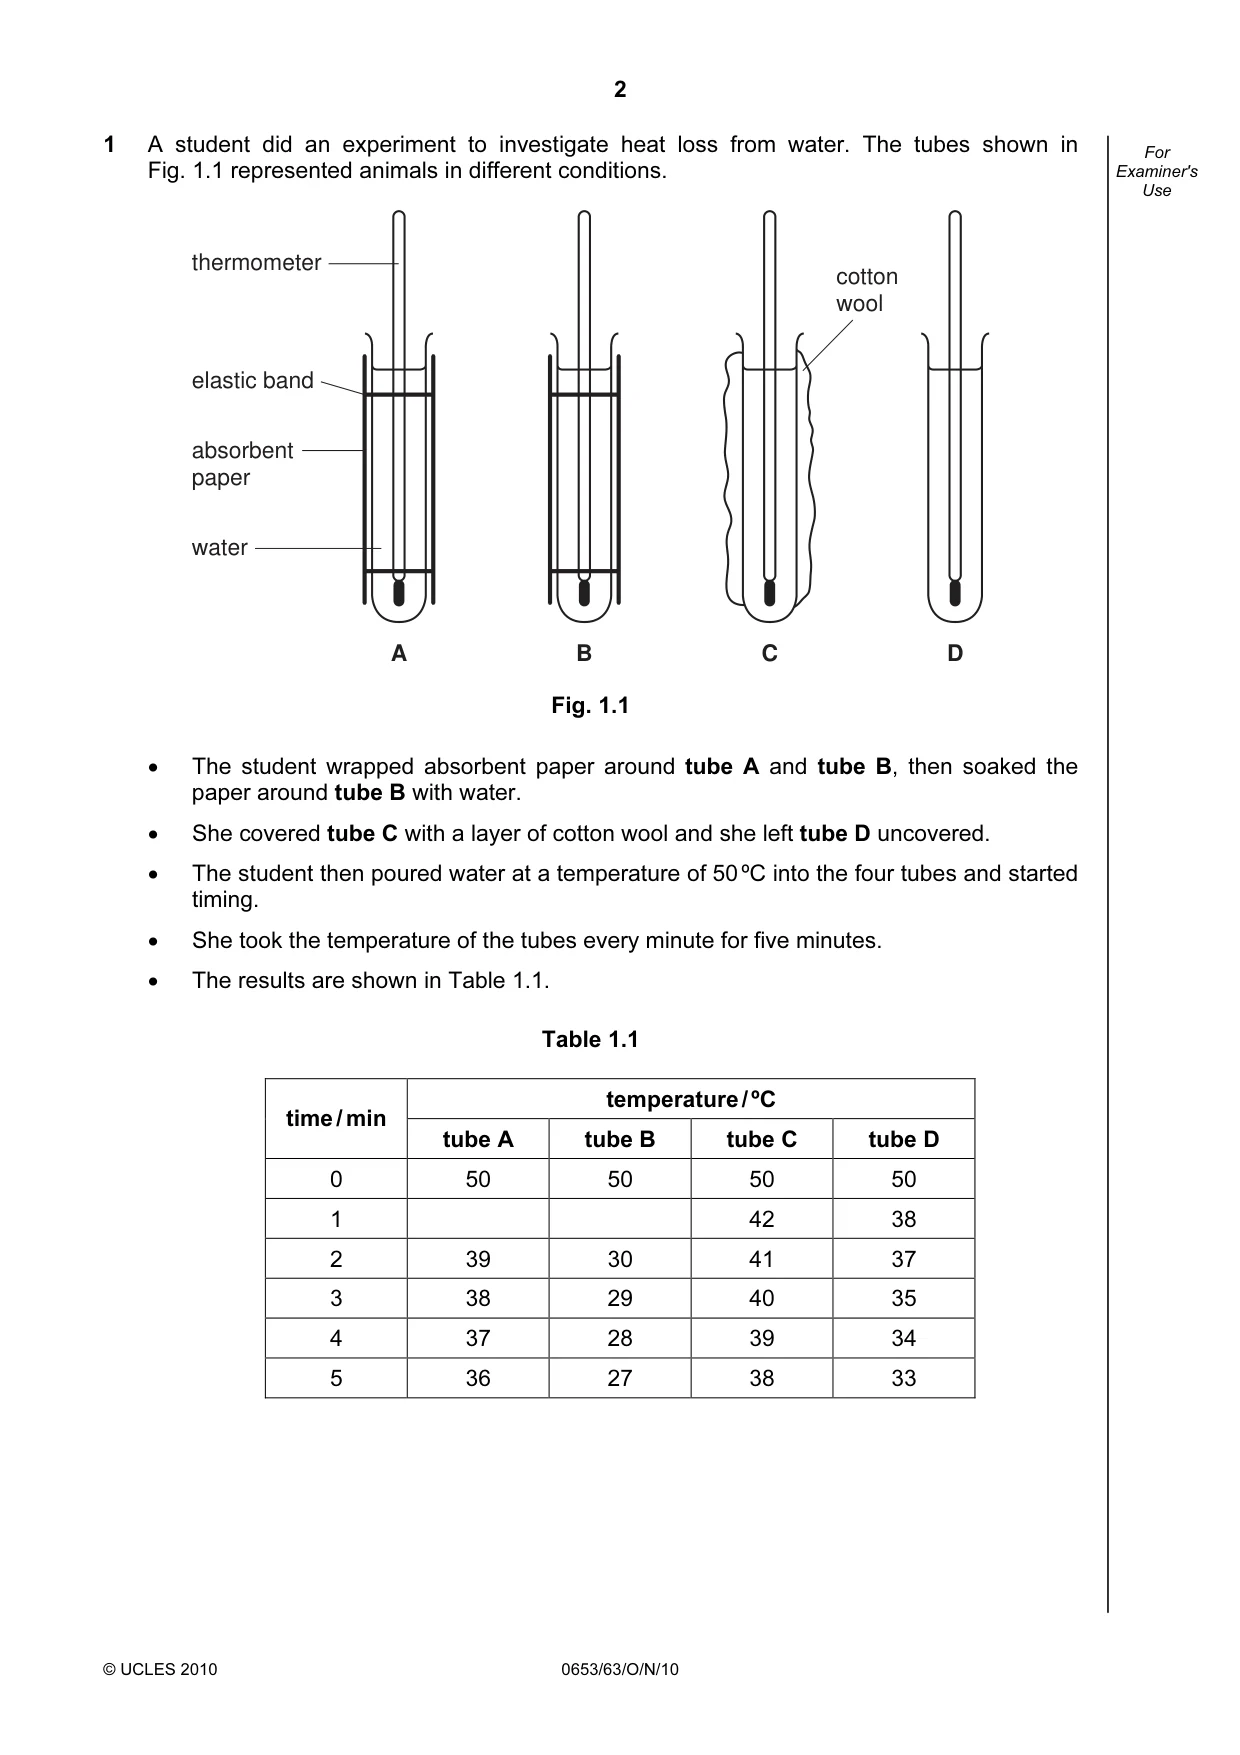
2 © UCLES 2010 0653/63/O/N/10 For Examiner's Use 1 A student did an experiment to investigate heat loss from water. The tubes shown in Fig. 1.1 represented animals in different conditions. A B C D thermometer elastic band absorbent paper water cotton wool Fig. 1.1 • The student wrapped absorbent paper around tube A and tube B, then soaked the paper around tube B with water. • She covered tube C with a layer of cotton wool and she left tube D uncovered. • The student then poured water at a temperature of 50 ºC into the four tubes and started timing. • She took the temperature of the tubes every minute for five minutes. • The results are shown in Table 1.1. Table 1.1 temperature / ºC time / min tube A tube B tube C tube D 0 50 50 50 50 1 42 38 2 39 30 41 37 3 38 29 40 35 4 37 28 39 34 5 36 27 38 33
Question paper, page 3
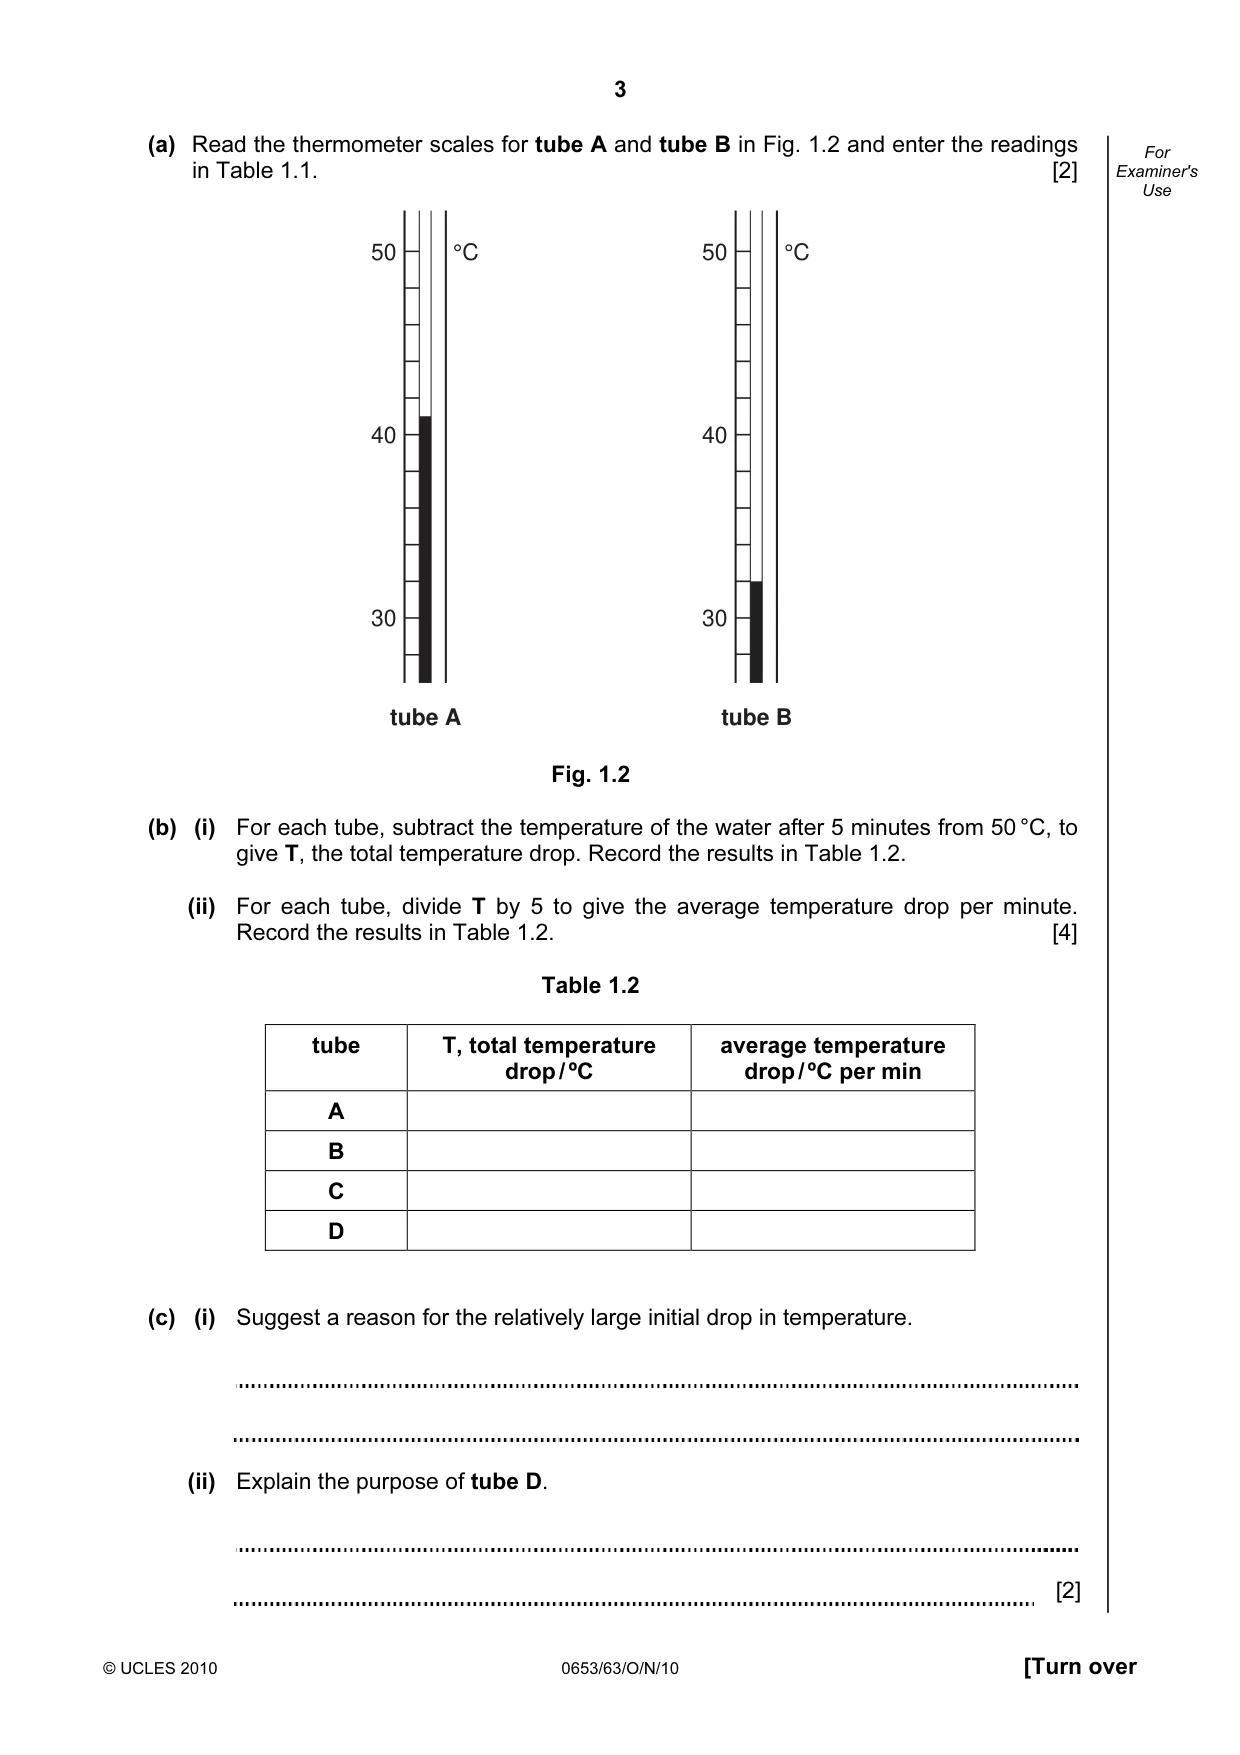
3 © UCLES 2010 0653/63/O/N/10 [Turn over For Examiner's Use (a) Read the thermometer scales for tube A and tube B in Fig. 1.2 and enter the readings in Table 1.1. [2] 50 °C 40 30 tube A 50 °C 40 30 tube B Fig. 1.2 (b) (i) For each tube, subtract the temperature of the water after 5 minutes from 50 °C, to give T, the total temperature drop. Record the results in Table 1.2. (ii) For each tube, divide T by 5 to give the average temperature drop per minute. Record the results in Table 1.2. [4] Table 1.2 tube T, total temperature drop / ºC average temperature drop / ºC per min A B C D (c) (i) Suggest a reason for the relatively large initial drop in temperature. (ii) Explain the purpose of tube D. [2]
Question paper, page 4
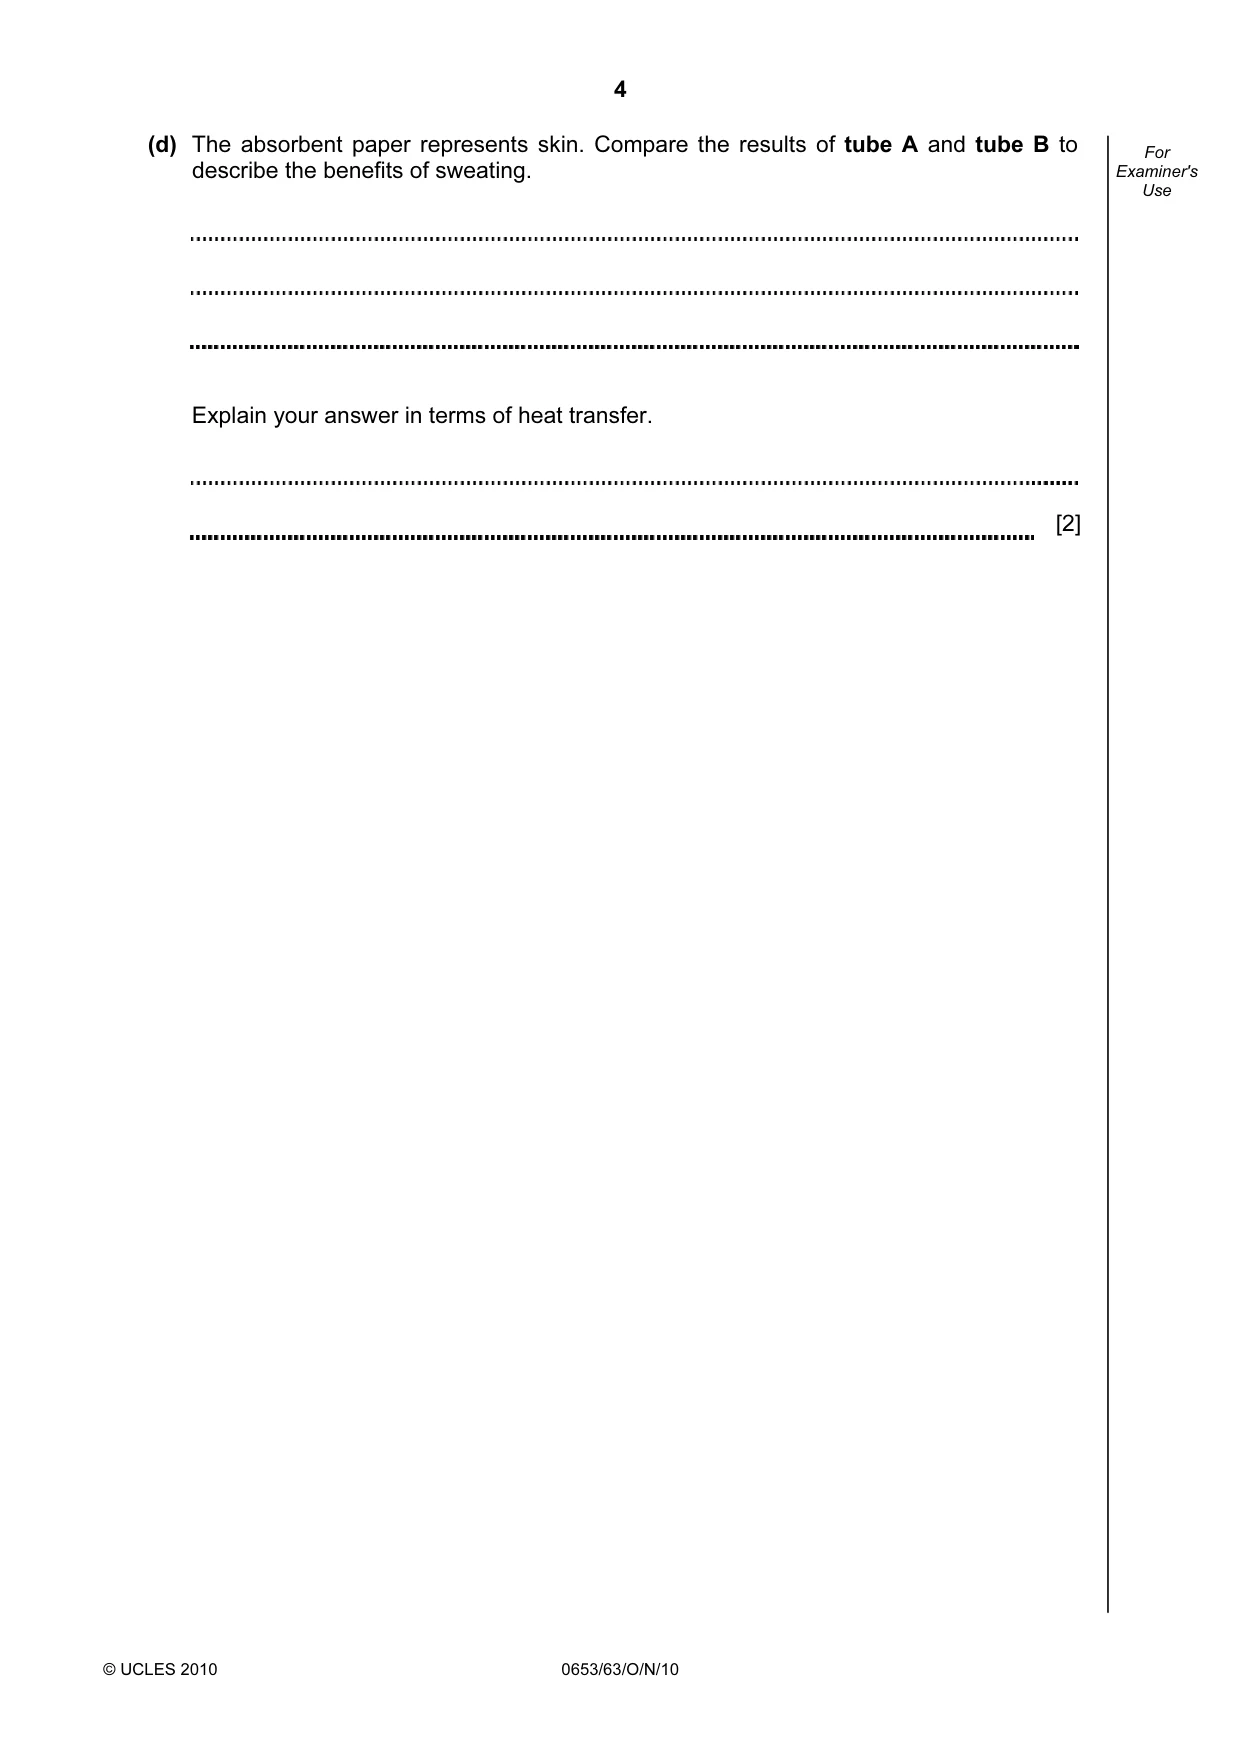
4 © UCLES 2010 0653/63/O/N/10 For Examiner's Use (d) The absorbent paper represents skin. Compare the results of tube A and tube B to describe the benefits of sweating. Explain your answer in terms of heat transfer. [2]
Question paper, page 5
5 © UCLES 2010 0653/63/O/N/10 [Turn over BLANK PAGE Please turn over for Question 2.
Question paper, page 6
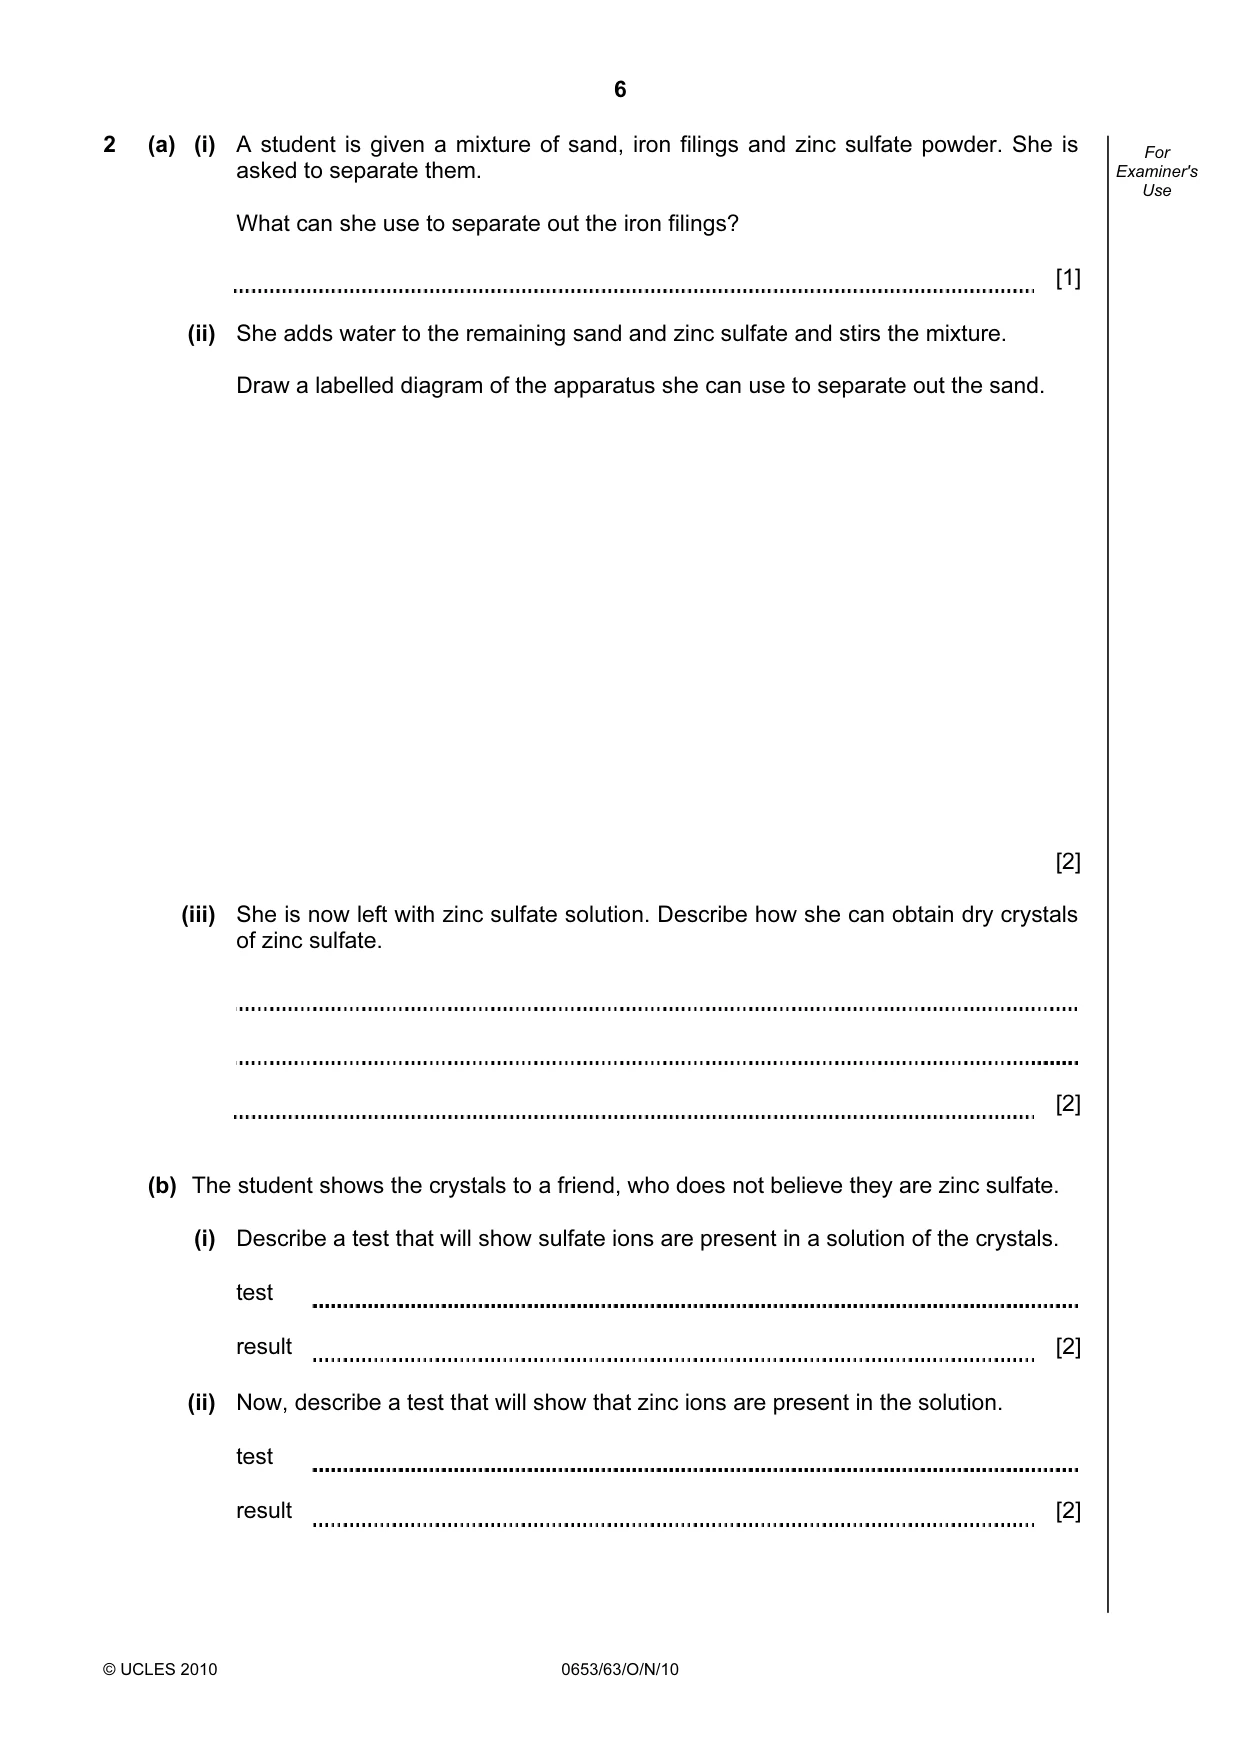
6 © UCLES 2010 0653/63/O/N/10 For Examiner's Use 2 (a) (i) A student is given a mixture of sand, iron filings and zinc sulfate powder. She is asked to separate them. What can she use to separate out the iron filings? [1] (ii) She adds water to the remaining sand and zinc sulfate and stirs the mixture. Draw a labelled diagram of the apparatus she can use to separate out the sand. [2] (iii) She is now left with zinc sulfate solution. Describe how she can obtain dry crystals of zinc sulfate. [2] (b) The student shows the crystals to a friend, who does not believe they are zinc sulfate. (i) Describe a test that will show sulfate ions are present in a solution of the crystals. test result [2] (ii) Now, describe a test that will show that zinc ions are present in the solution. test result [2]
Question paper, page 7
7 © UCLES 2010 0653/63/O/N/10 [Turn over For Examiner's Use (c) The separation in (a)(ii) will not work if the mixture contains sand and lead sulfate instead of zinc sulfate. Suggest a reason for this. [1]
Question paper, page 8
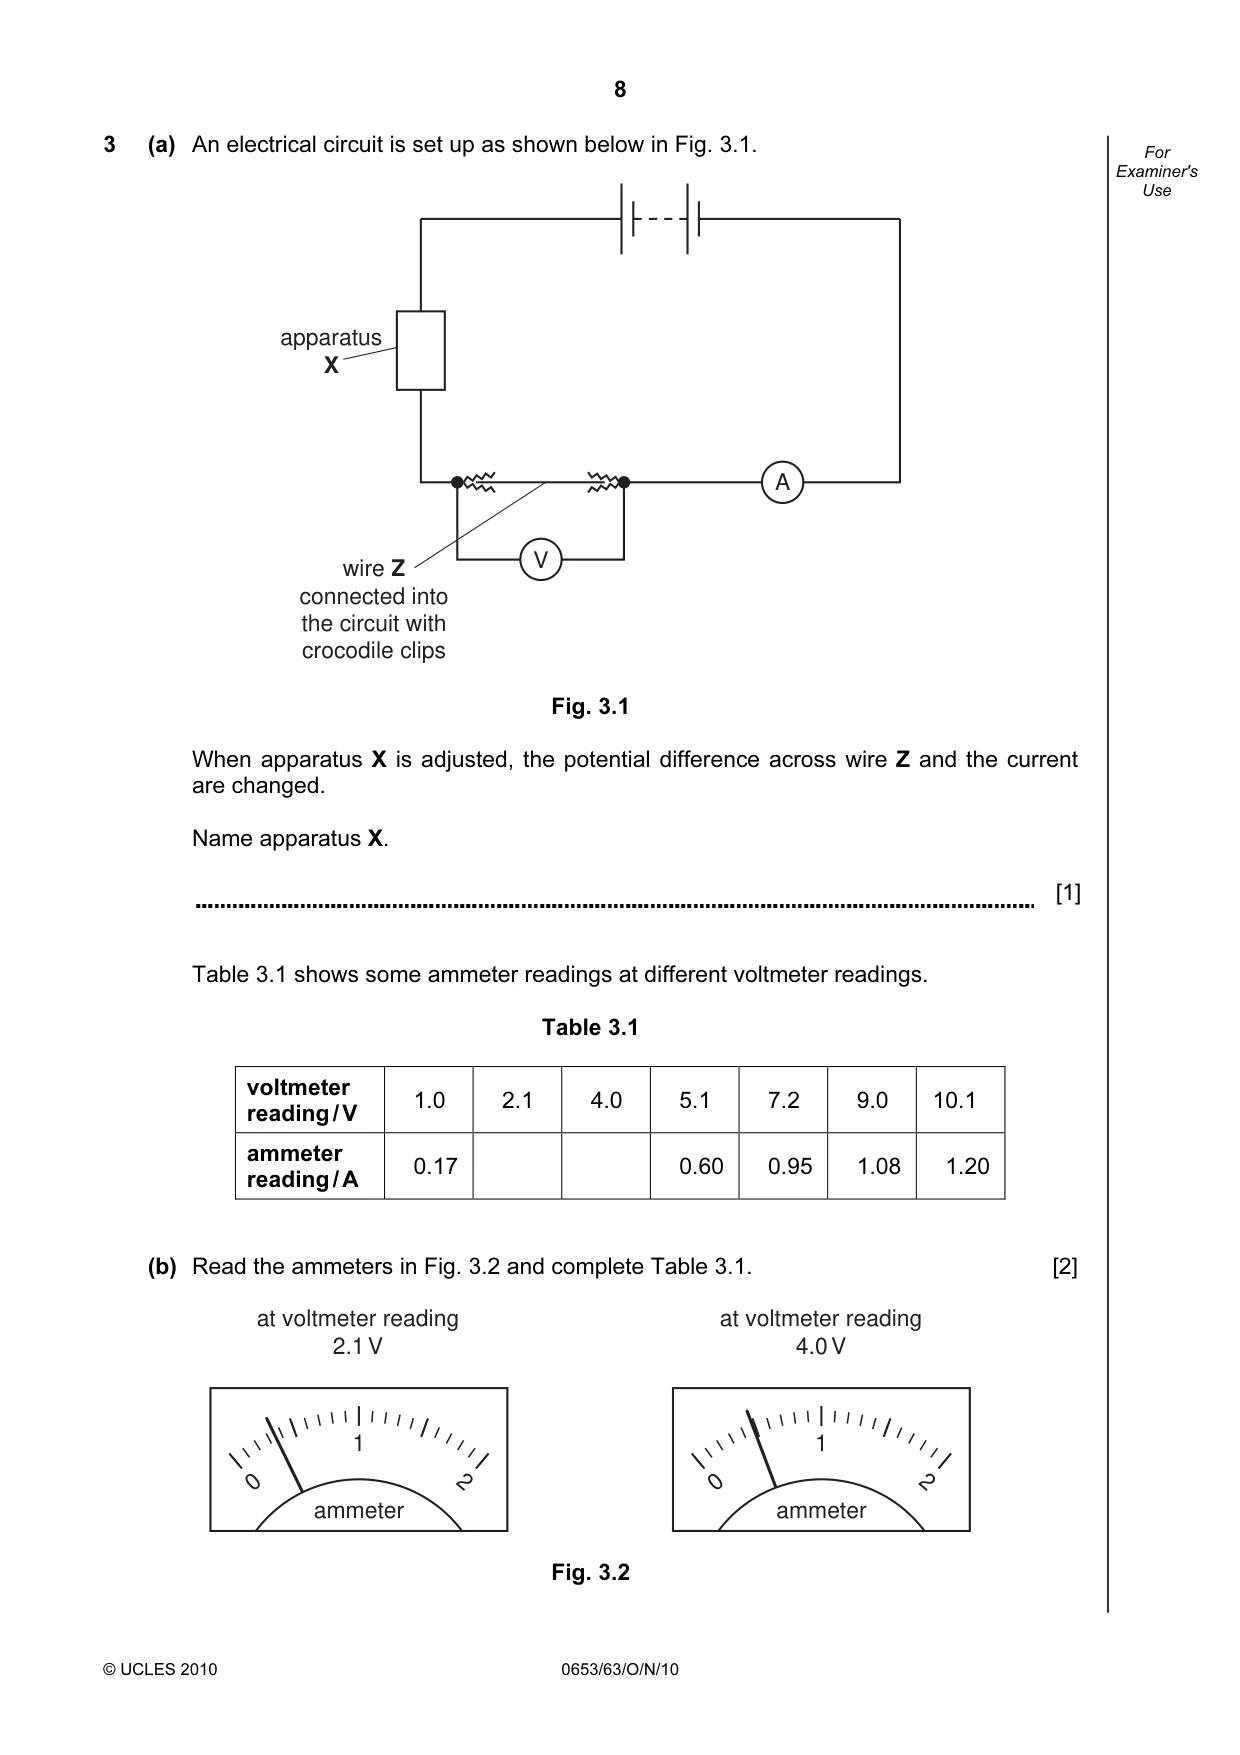
8 © UCLES 2010 0653/63/O/N/10 For Examiner's Use 3 (a) An electrical circuit is set up as shown below in Fig. 3.1. apparatus X A V wire Z connected into the circuit with crocodile clips Fig. 3.1 When apparatus X is adjusted, the potential difference across wire Z and the current are changed. Name apparatus X. [1] Table 3.1 shows some ammeter readings at different voltmeter readings. Table 3.1 voltmeter reading / V 1.0 2.1 4.0 5.1 7.2 9.0 10.1 ammeter reading / A 0.17 0.60 0.95 1.08 1.20 (b) Read the ammeters in Fig. 3.2 and complete Table 3.1. [2] at voltmeter reading 4.0 V 1 2 0 ammeter at voltmeter reading 2.1 V 1 2 0 ammeter Fig. 3.2
Question paper, page 9
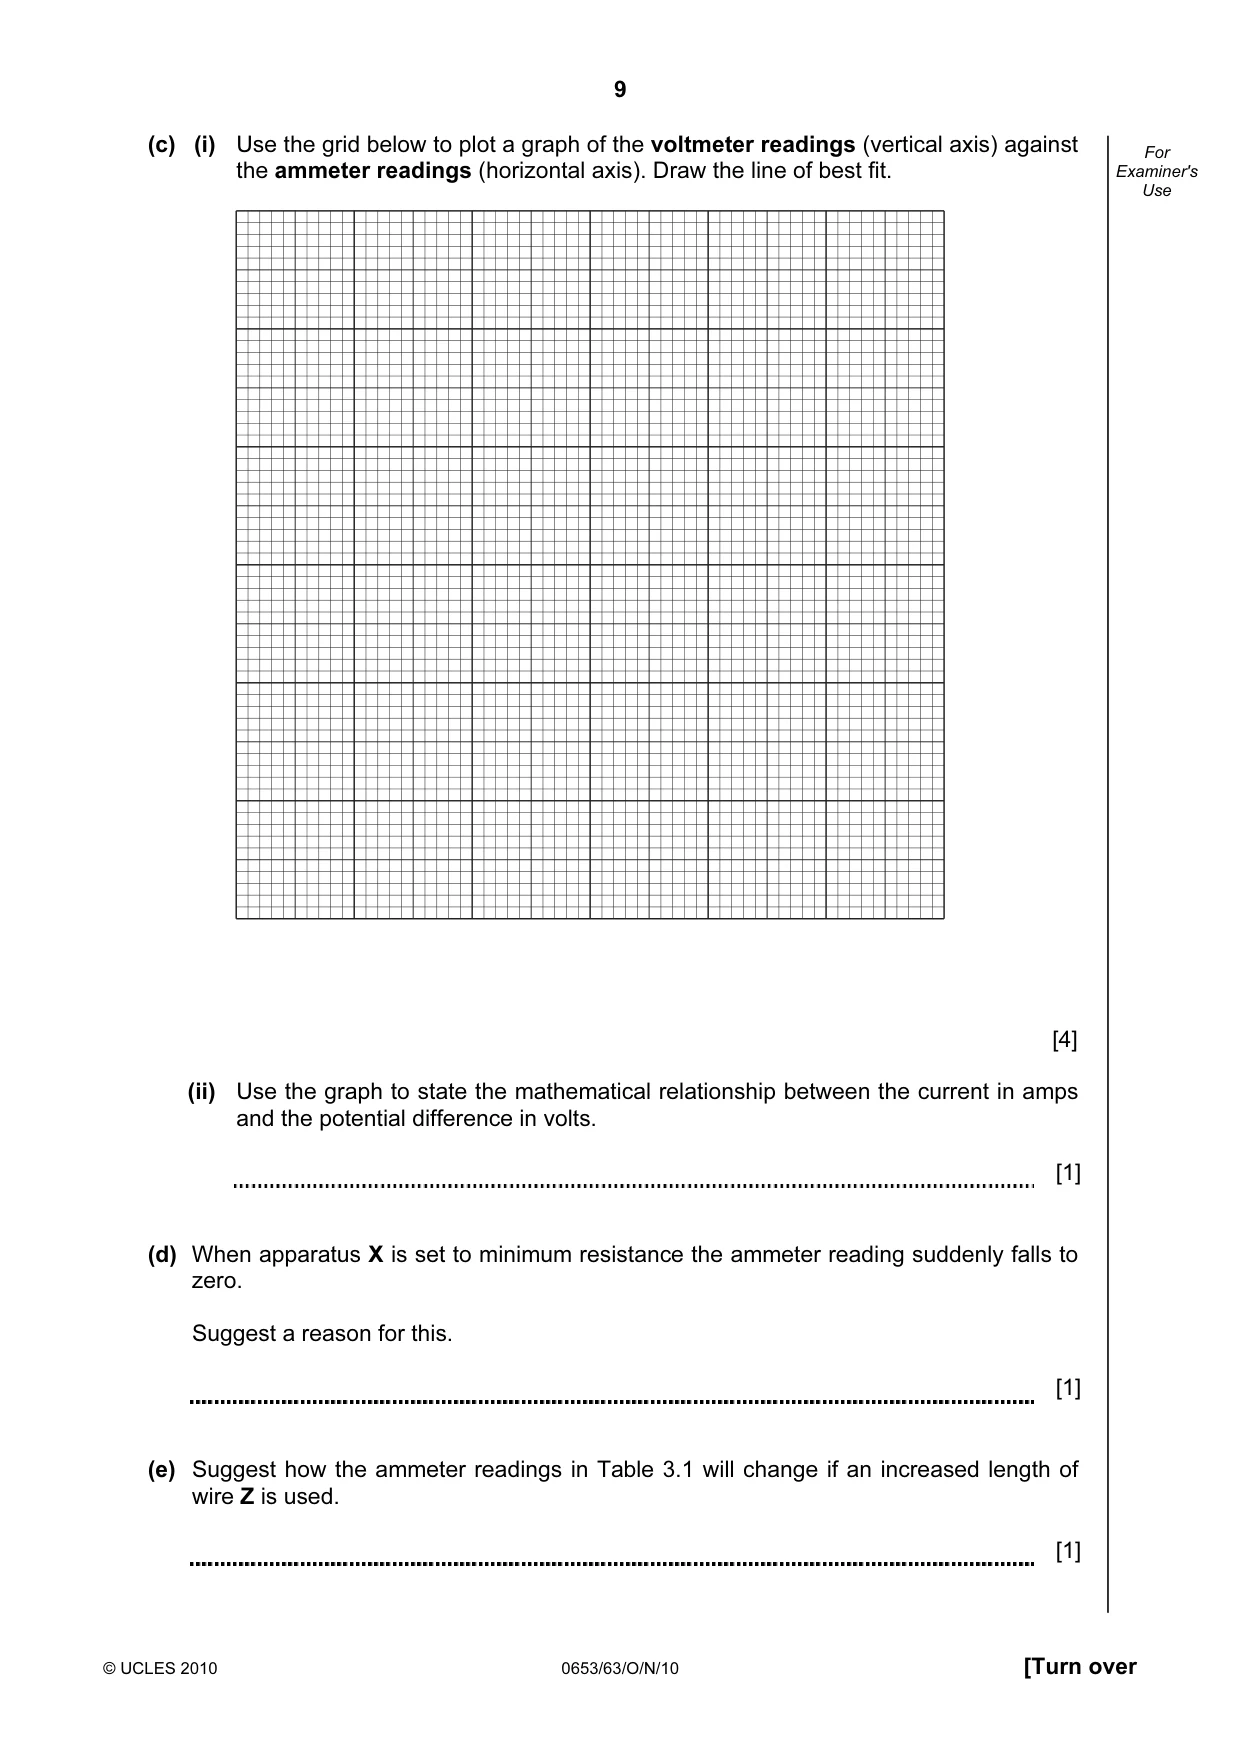
9 © UCLES 2010 0653/63/O/N/10 [Turn over For Examiner's Use (c) (i) Use the grid below to plot a graph of the voltmeter readings (vertical axis) against the ammeter readings (horizontal axis). Draw the line of best fit. [4] (ii) Use the graph to state the mathematical relationship between the current in amps and the potential difference in volts. [1] (d) When apparatus X is set to minimum resistance the ammeter reading suddenly falls to zero. Suggest a reason for this. [1] (e) Suggest how the ammeter readings in Table 3.1 will change if an increased length of wire Z is used. [1]
Question paper, page 10
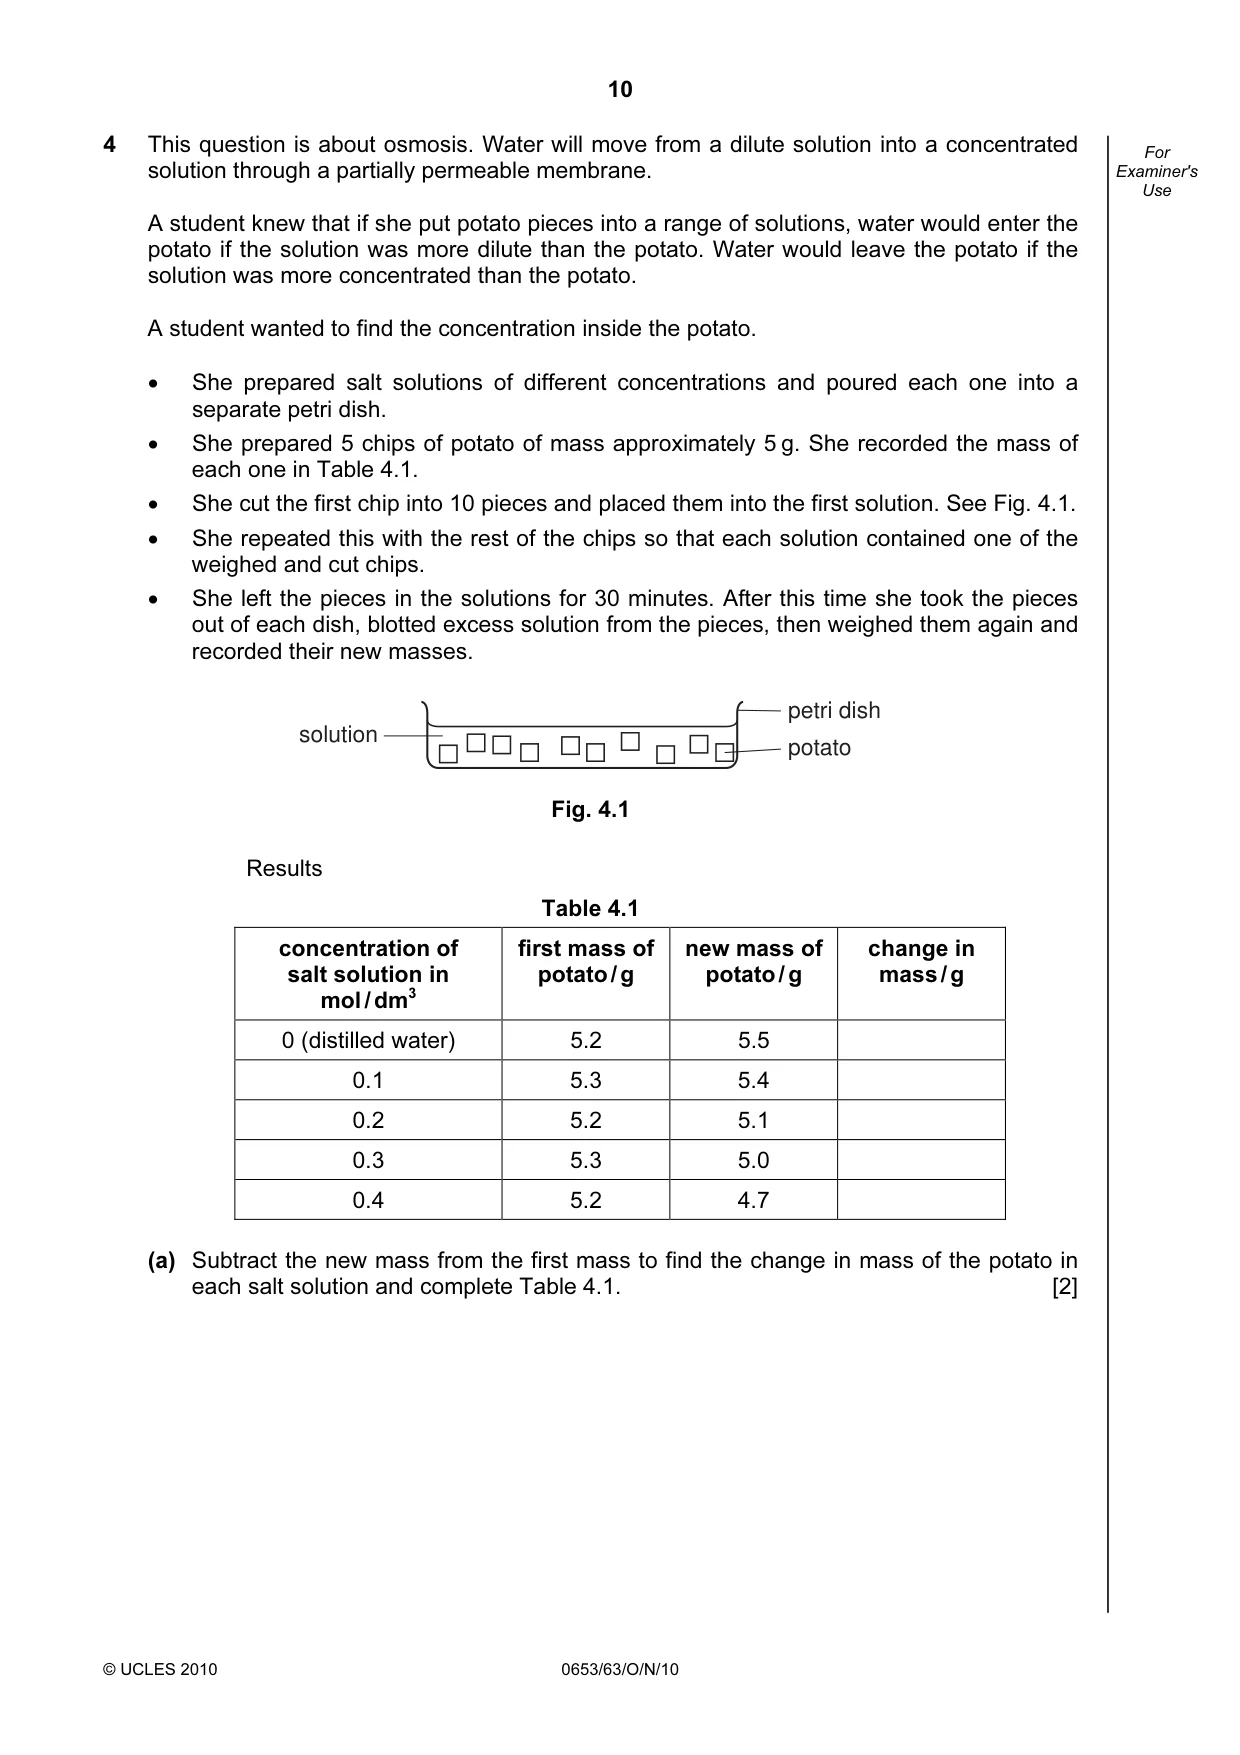
10 © UCLES 2010 0653/63/O/N/10 For Examiner's Use 4 This question is about osmosis. Water will move from a dilute solution into a concentrated solution through a partially permeable membrane. A student knew that if she put potato pieces into a range of solutions, water would enter the potato if the solution was more dilute than the potato. Water would leave the potato if the solution was more concentrated than the potato. A student wanted to find the concentration inside the potato. • She prepared salt solutions of different concentrations and poured each one into a separate petri dish. • She prepared 5 chips of potato of mass approximately 5 g. She recorded the mass of each one in Table 4.1. • She cut the first chip into 10 pieces and placed them into the first solution. See Fig. 4.1. • She repeated this with the rest of the chips so that each solution contained one of the weighed and cut chips. • She left the pieces in the solutions for 30 minutes. After this time she took the pieces out of each dish, blotted excess solution from the pieces, then weighed them again and recorded their new masses. petri dish potato solution Fig. 4.1 Results Table 4.1 concentration of salt solution in mol / dm3 first mass of potato / g new mass of potato / g change in mass / g 0 (distilled water) 5.2 5.5 0.1 5.3 5.4 0.2 5.2 5.1 0.3 5.3 5.0 0.4 5.2 4.7 (a) Subtract the new mass from the first mass to find the change in mass of the potato in each salt solution and complete Table 4.1. [2]
Question paper, page 11
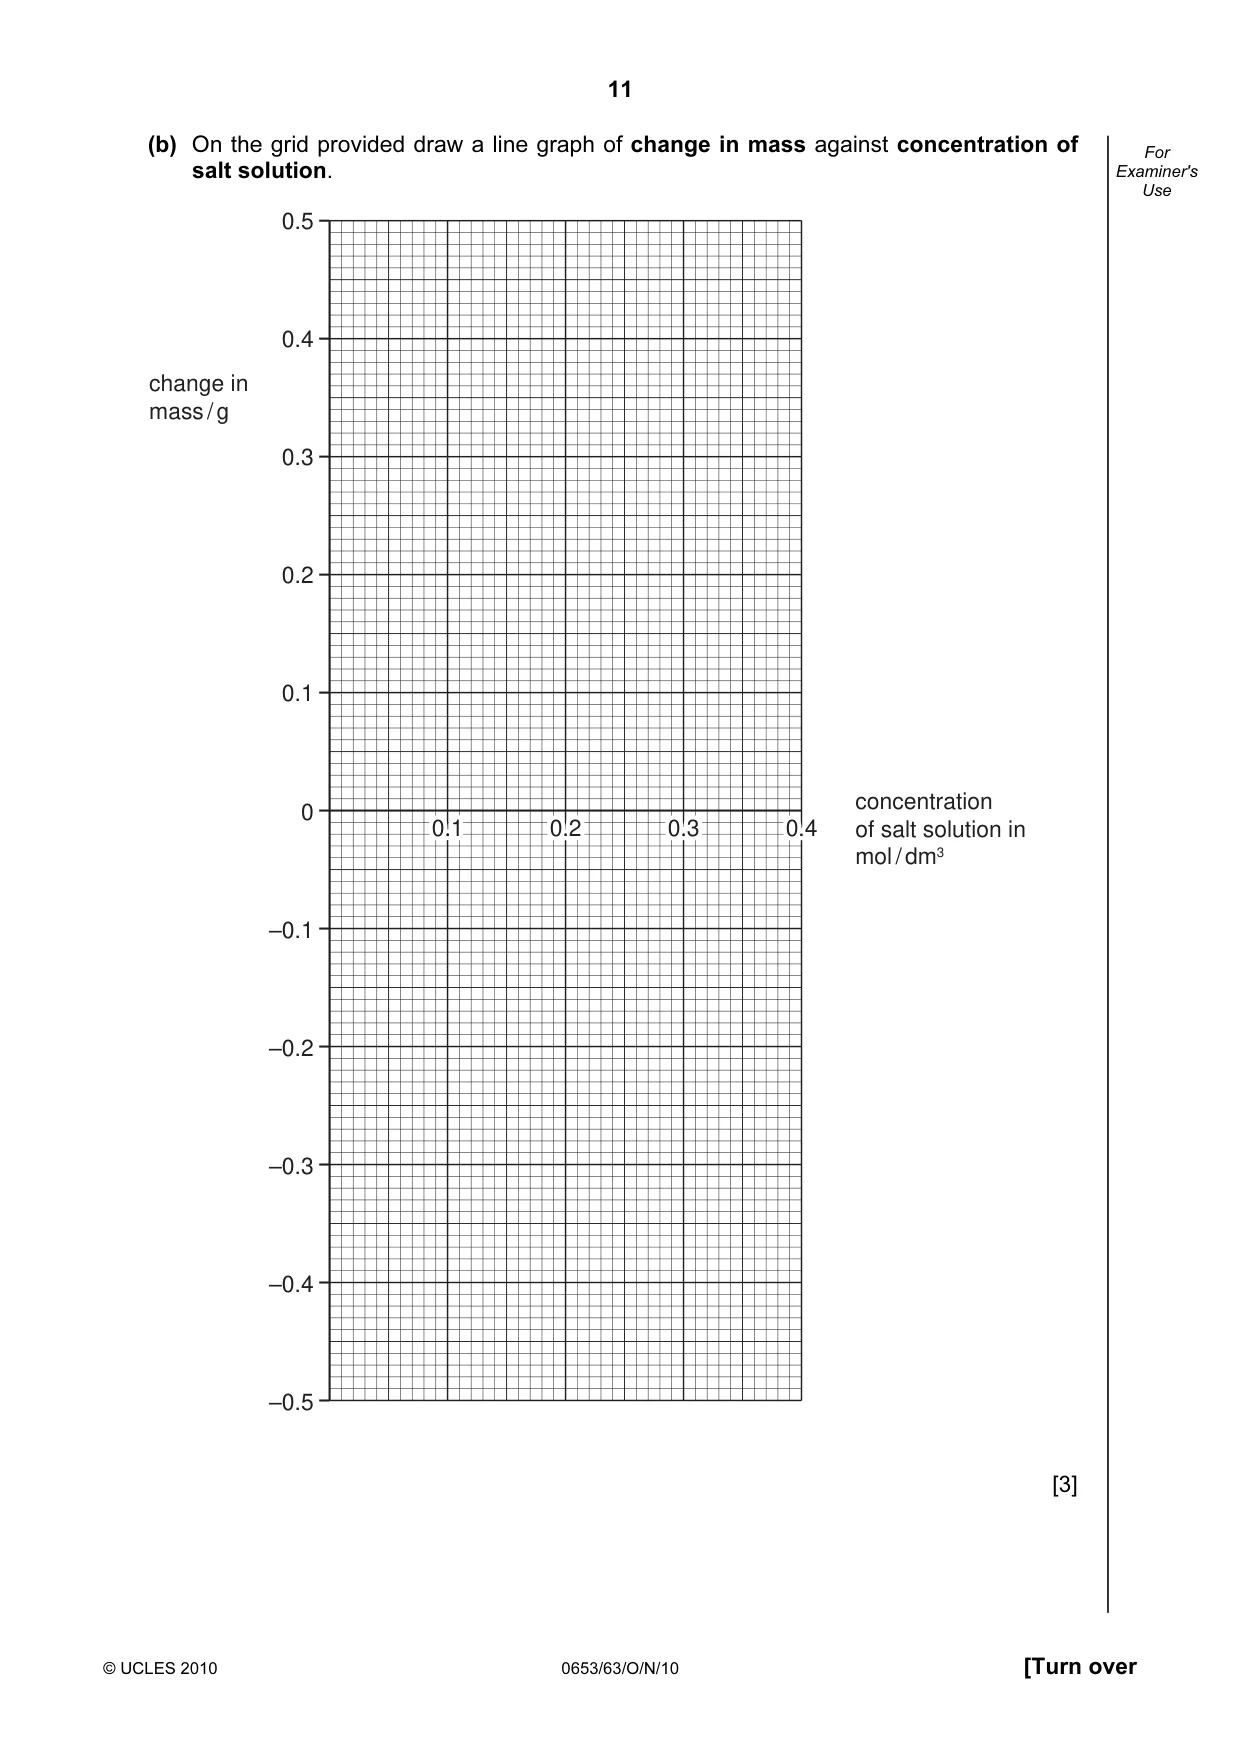
11 © UCLES 2010 0653/63/O/N/10 [Turn over For Examiner's Use (b) On the grid provided draw a line graph of change in mass against concentration of salt solution. 0.5 0.4 0.3 0.2 0.1 0 –0.1 –0.2 –0.3 –0.4 –0.5 0.1 0.1 0.2 0.2 0.3 0.3 0.4 0.4 0.1 0.2 0.3 0.4 change in mass / g concentration of salt solution in mol / dm3 [3]
Question paper, page 12
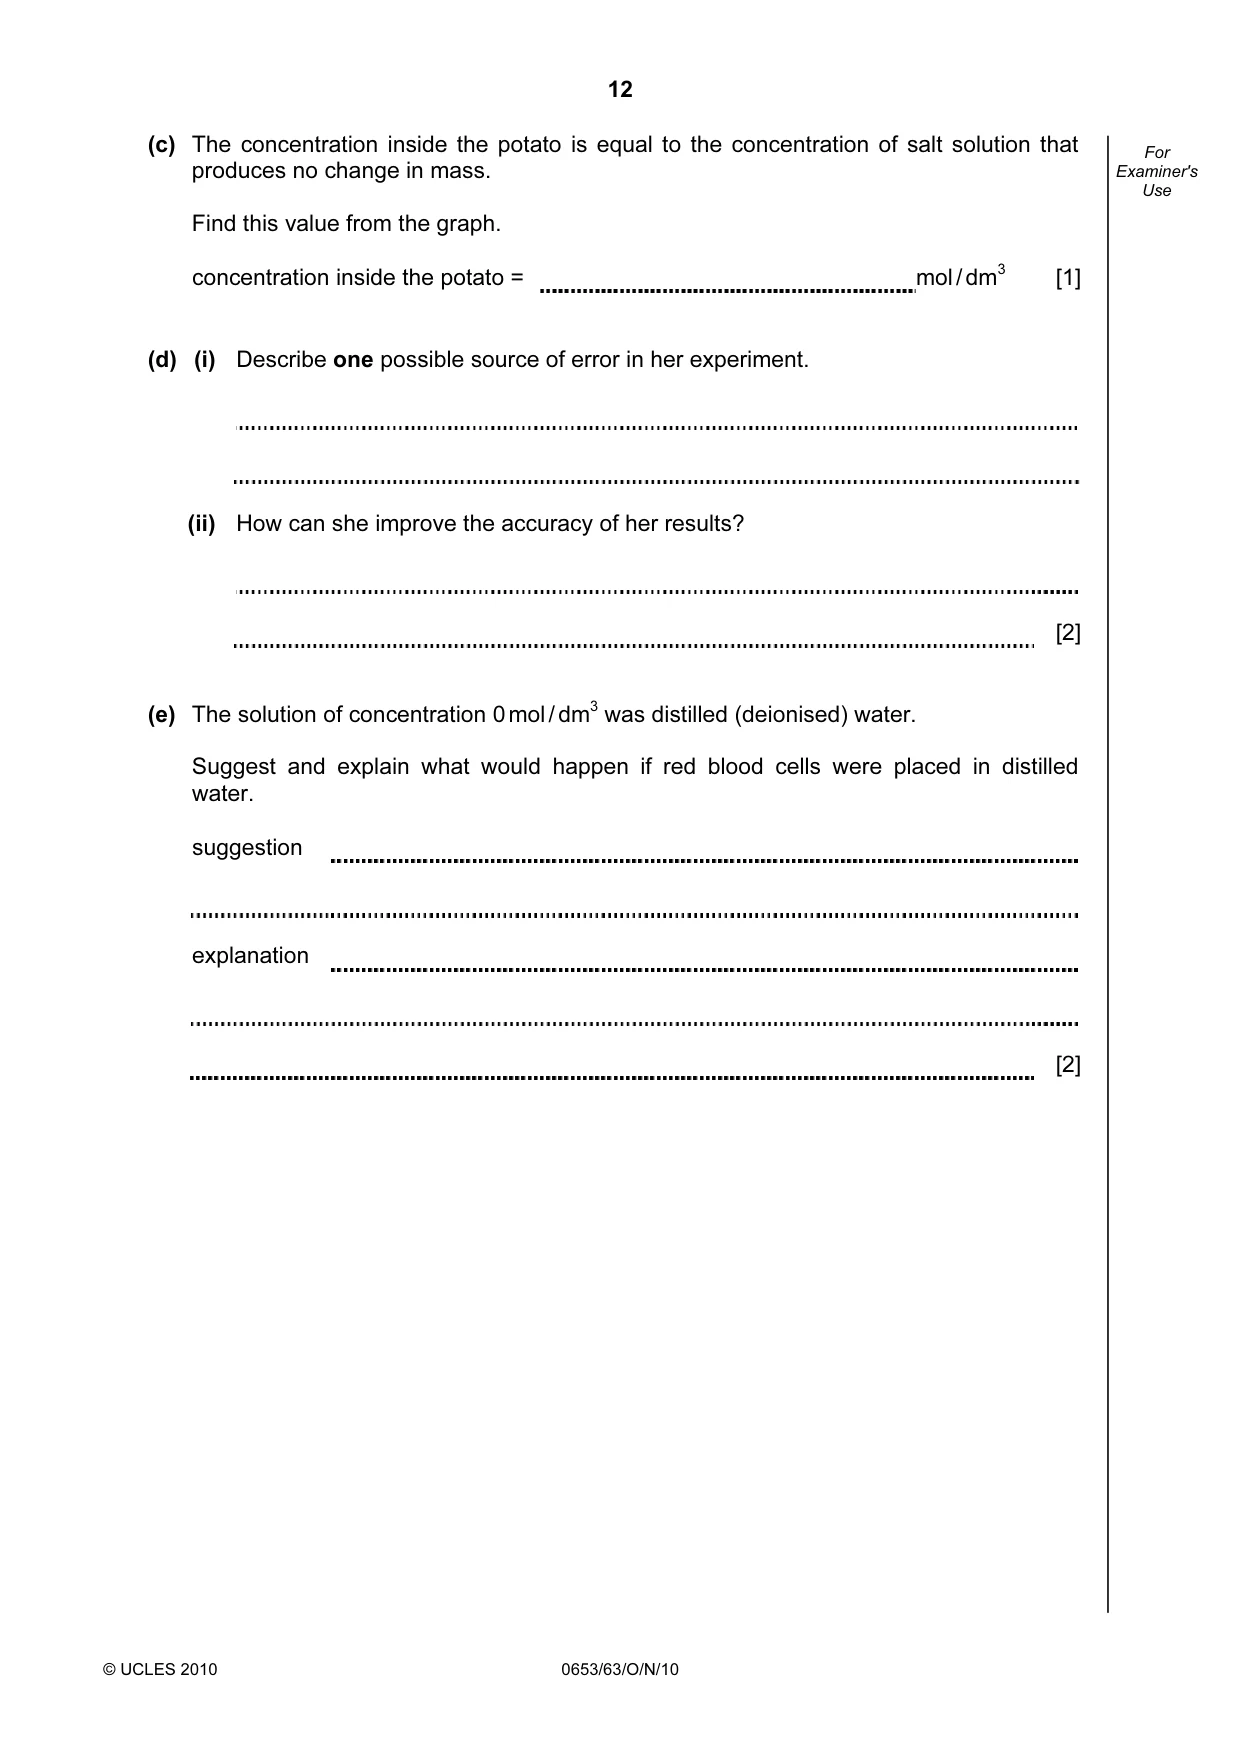
12 © UCLES 2010 0653/63/O/N/10 For Examiner's Use (c) The concentration inside the potato is equal to the concentration of salt solution that produces no change in mass. Find this value from the graph. concentration inside the potato = mol / dm3 [1] (d) (i) Describe one possible source of error in her experiment. (ii) How can she improve the accuracy of her results? [2] (e) The solution of concentration 0 mol / dm3 was distilled (deionised) water. Suggest and explain what would happen if red blood cells were placed in distilled water. suggestion explanation [2]
Question paper, page 13
13 © UCLES 2010 0653/63/O/N/10 [Turn over BLANK PAGE Please turn over for Question 5.
Question paper, page 14
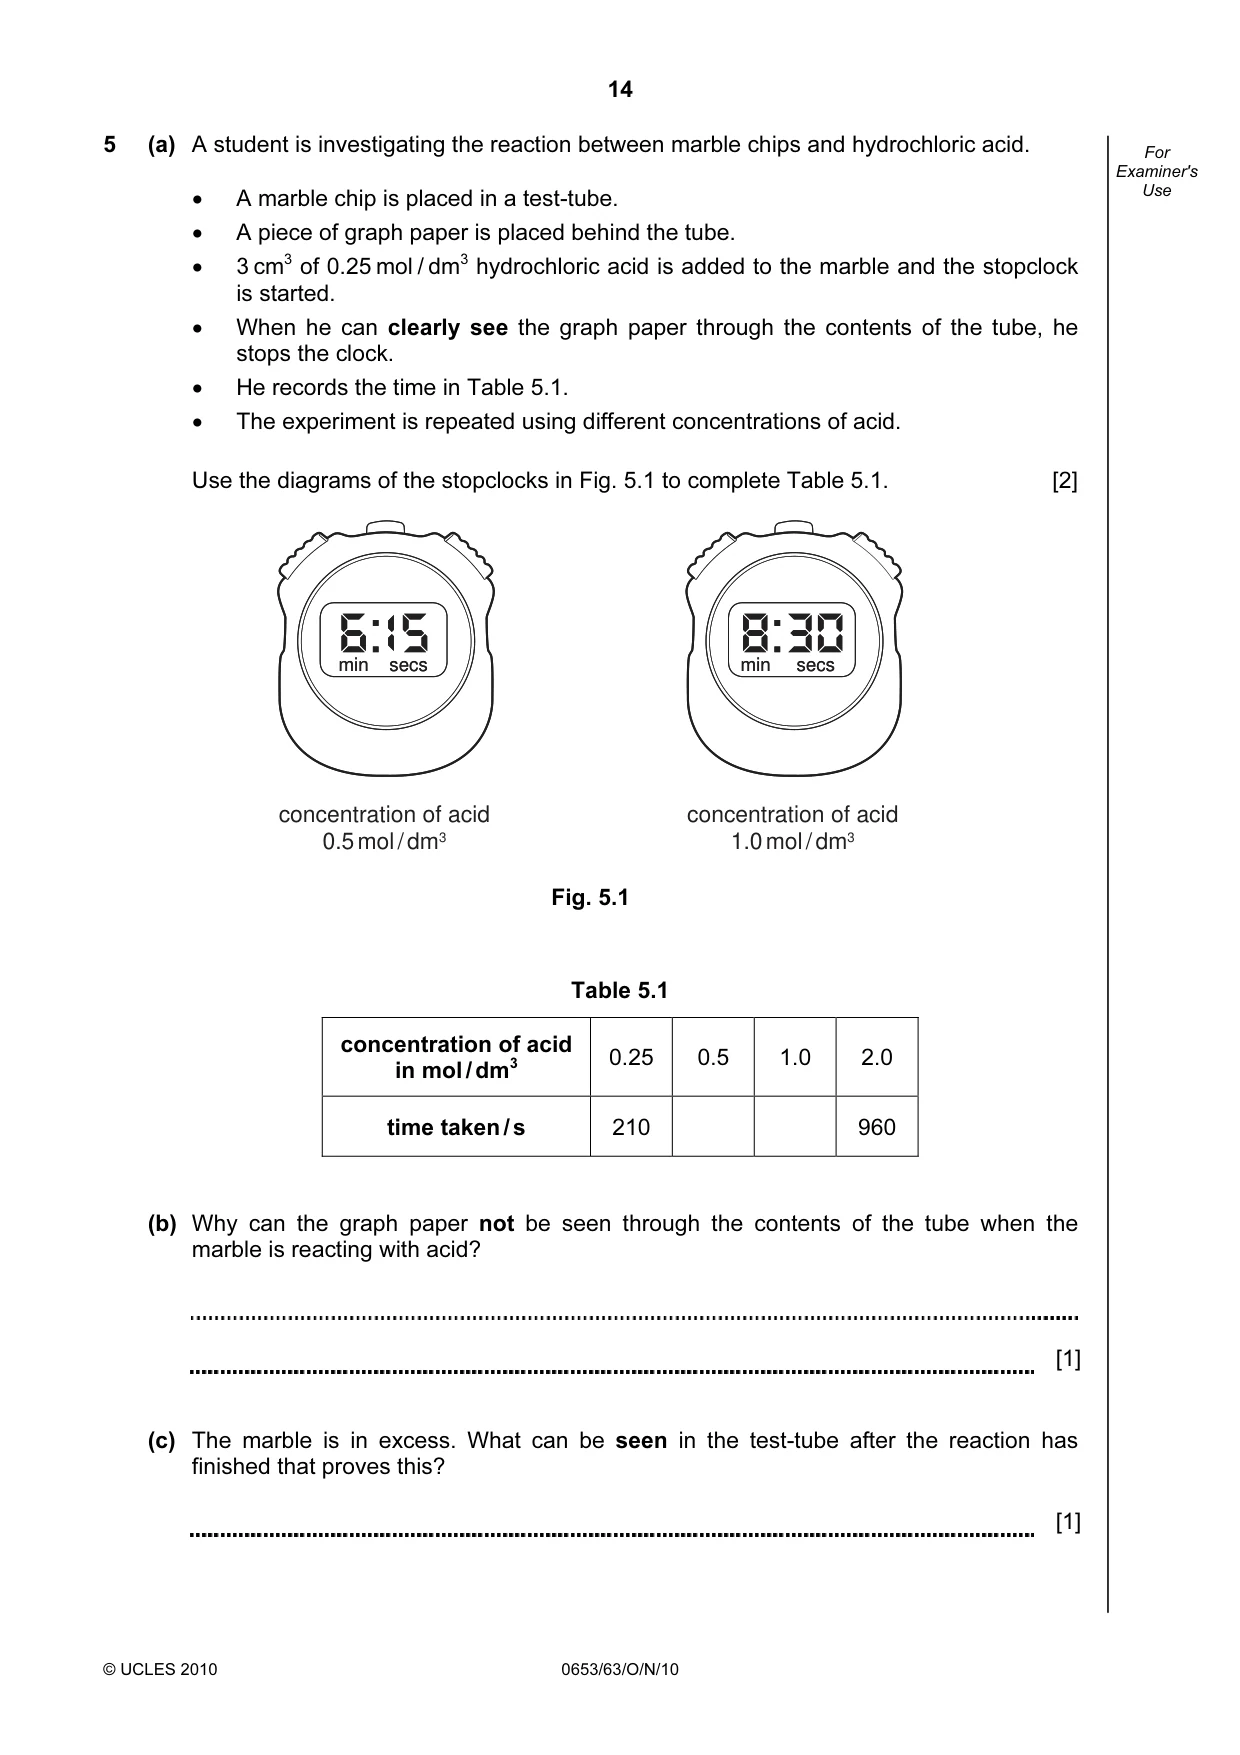
14 © UCLES 2010 0653/63/O/N/10 For Examiner's Use 5 (a) A student is investigating the reaction between marble chips and hydrochloric acid. • A marble chip is placed in a test-tube. • A piece of graph paper is placed behind the tube. • 3 cm3 of 0.25 mol / dm3 hydrochloric acid is added to the marble and the stopclock is started. • When he can clearly see the graph paper through the contents of the tube, he stops the clock. • He records the time in Table 5.1. • The experiment is repeated using different concentrations of acid. Use the diagrams of the stopclocks in Fig. 5.1 to complete Table 5.1. [2] min secs min secs concentration of acid 0.5 mol / dm3 min secs concentration of acid 1.0 mol / dm3 min secs Fig. 5.1 Table 5.1 concentration of acid in mol / dm3 0.25 0.5 1.0 2.0 time taken / s 210 960 (b) Why can the graph paper not be seen through the contents of the tube when the marble is reacting with acid? [1] (c) The marble is in excess. What can be seen in the test-tube after the reaction has finished that proves this? [1]
Question paper, page 15
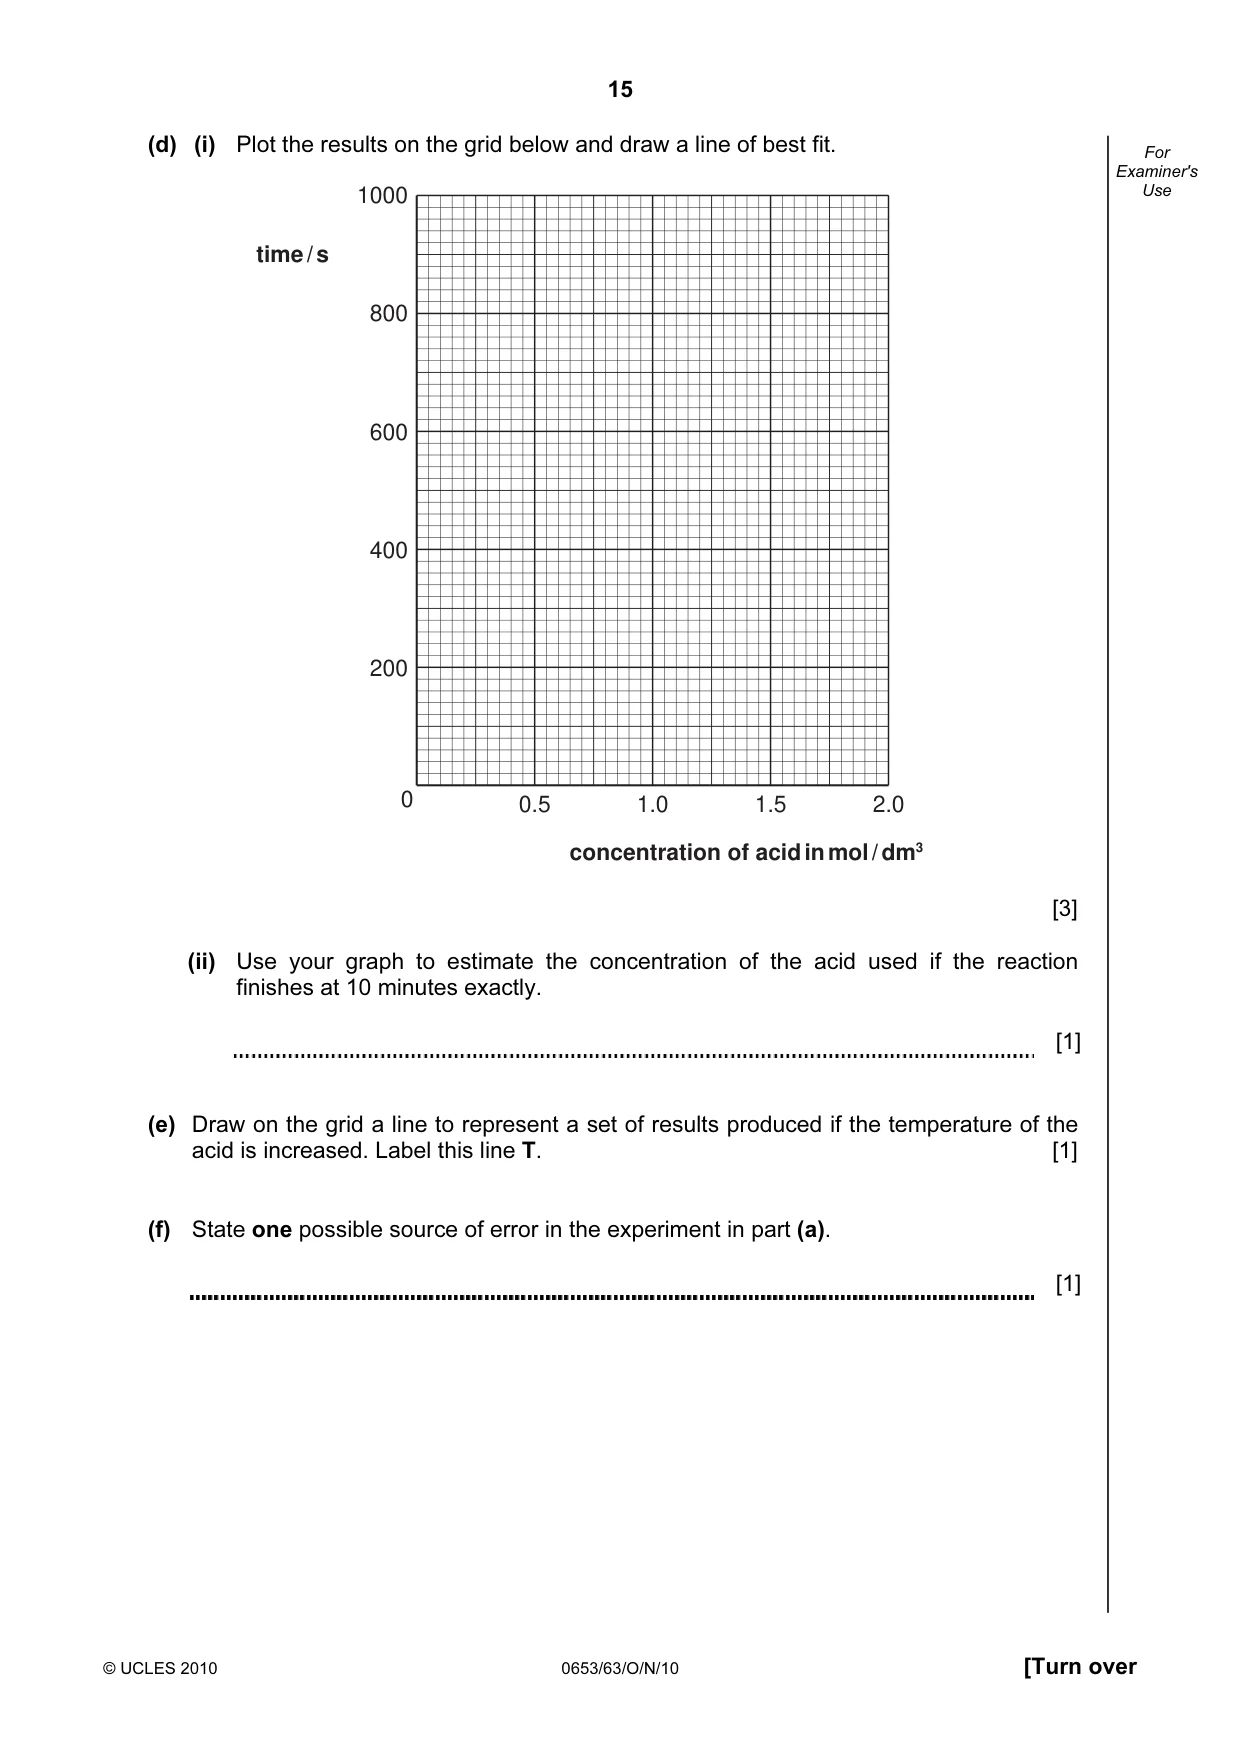
15 © UCLES 2010 0653/63/O/N/10 [Turn over For Examiner's Use (d) (i) Plot the results on the grid below and draw a line of best fit. 0 0.5 1.0 1.5 2.0 1000 800 600 400 200 time / s concentration of acid in mol / dm3 [3] (ii) Use your graph to estimate the concentration of the acid used if the reaction finishes at 10 minutes exactly. [1] (e) Draw on the grid a line to represent a set of results produced if the temperature of the acid is increased. Label this line T. [1] (f) State one possible source of error in the experiment in part (a). [1]
Question paper, page 16
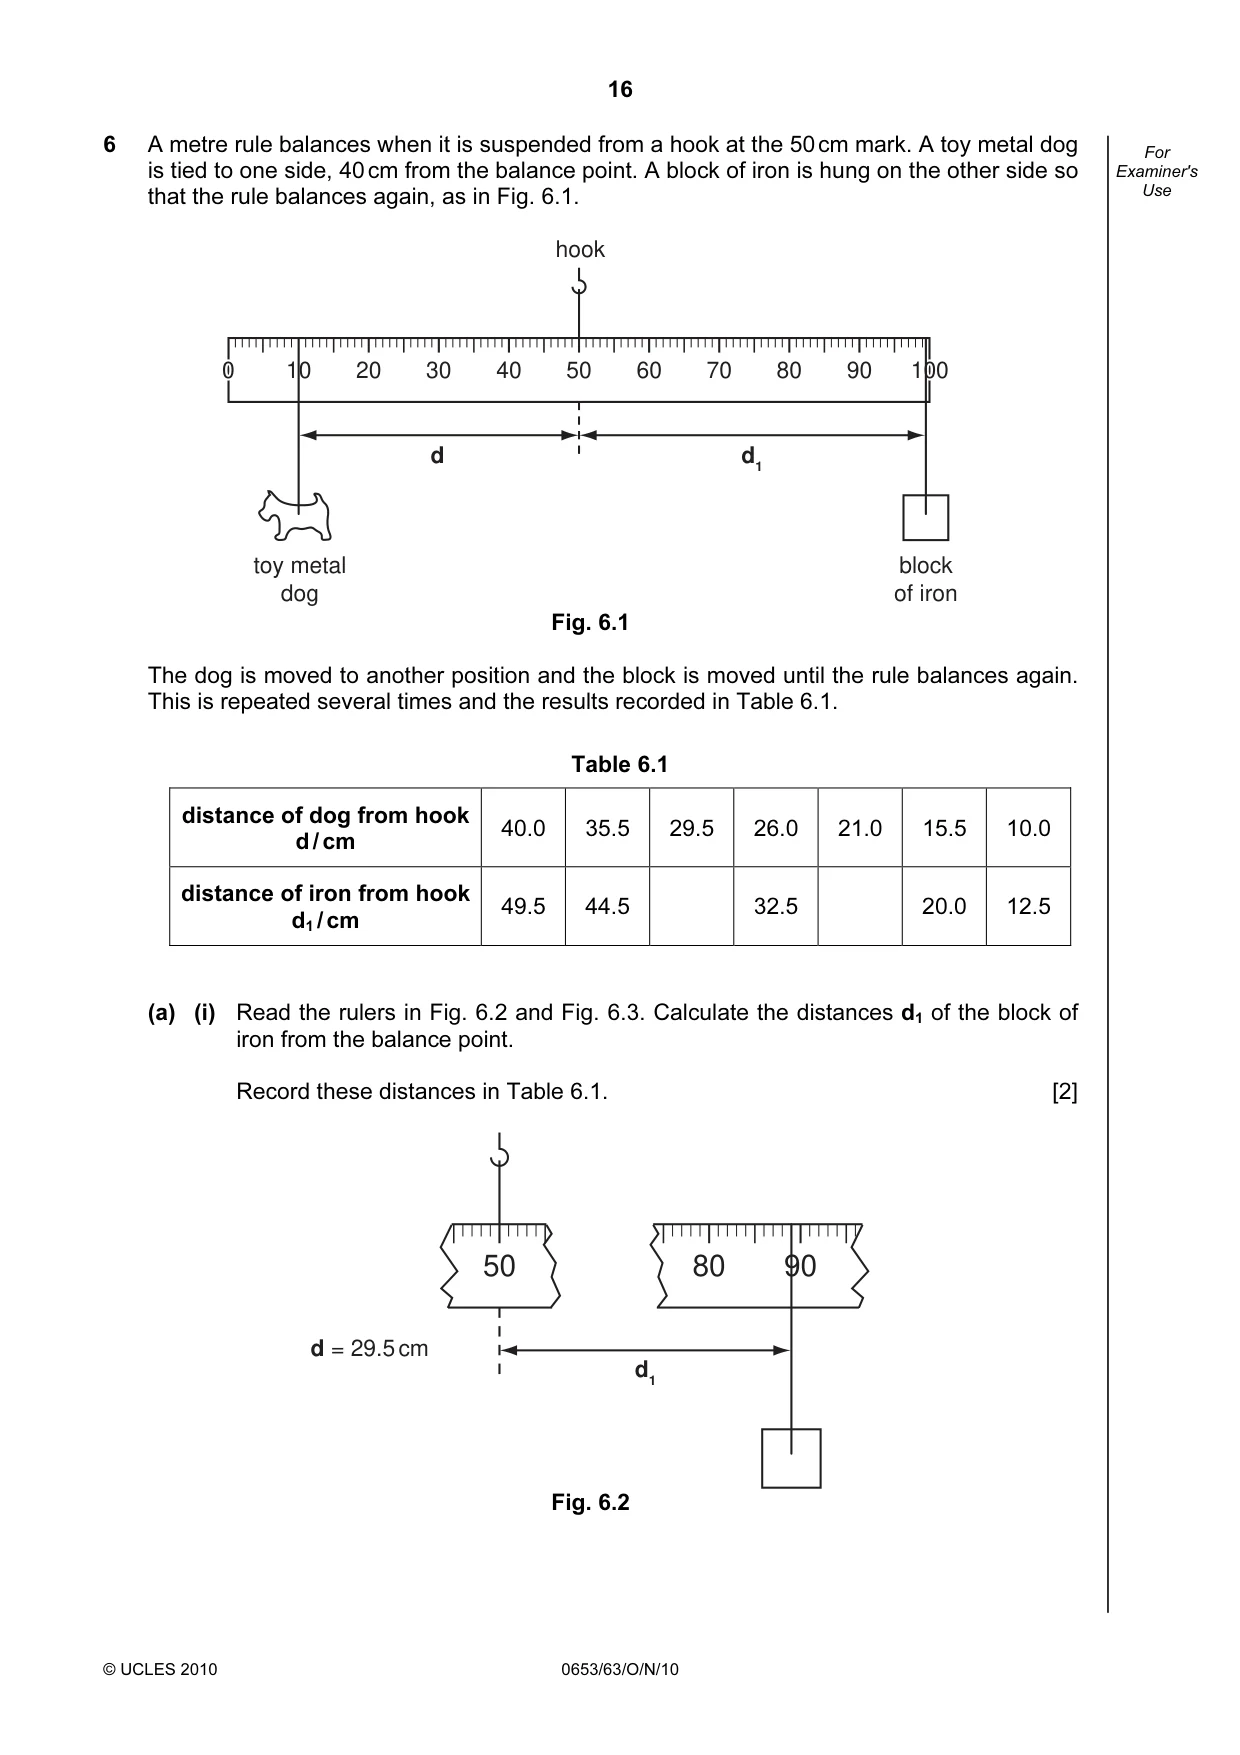
16 © UCLES 2010 0653/63/O/N/10 For Examiner's Use 6 A metre rule balances when it is suspended from a hook at the 50 cm mark. A toy metal dog is tied to one side, 40 cm from the balance point. A block of iron is hung on the other side so that the rule balances again, as in Fig. 6.1. 10 20 30 40 50 60 70 80 90 0 100 100 100 0 block of iron toy metal dog d d1 hook Fig. 6.1 The dog is moved to another position and the block is moved until the rule balances again. This is repeated several times and the results recorded in Table 6.1. Table 6.1 distance of dog from hook d / cm 40.0 35.5 29.5 26.0 21.0 15.5 10.0 distance of iron from hook d1 / cm 49.5 44.5 32.5 20.0 12.5 (a) (i) Read the rulers in Fig. 6.2 and Fig. 6.3. Calculate the distances d1 of the block of iron from the balance point. Record these distances in Table 6.1. [2] 50 80 90 d1 d = 29.5 cm Fig. 6.2
Question paper, page 17
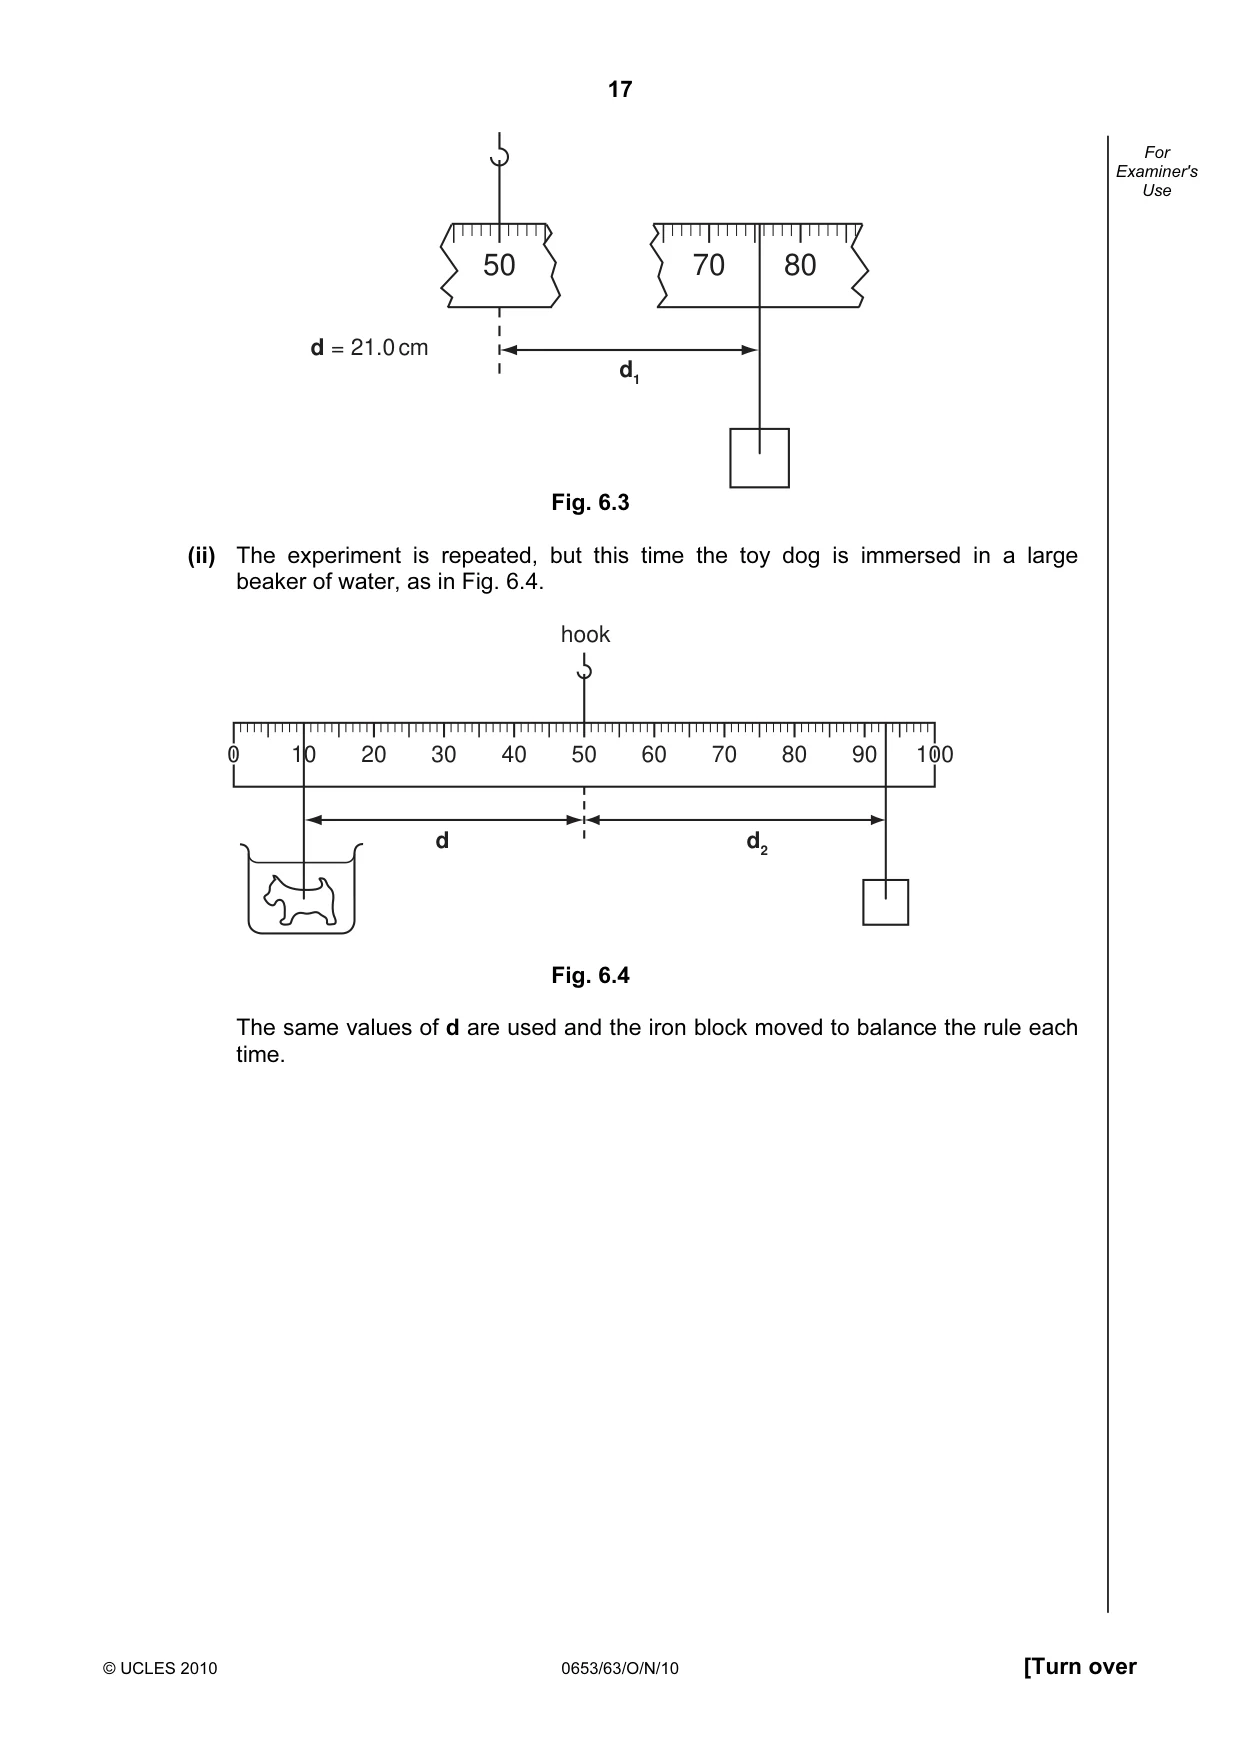
17 © UCLES 2010 0653/63/O/N/10 [Turn over For Examiner's Use 50 70 80 d1 d = 21.0 cm Fig. 6.3 (ii) The experiment is repeated, but this time the toy dog is immersed in a large beaker of water, as in Fig. 6.4. 10 20 30 40 50 60 70 80 90 0 100 100 100 0 d d2 hook Fig. 6.4 The same values of d are used and the iron block moved to balance the rule each time.
Question paper, page 18
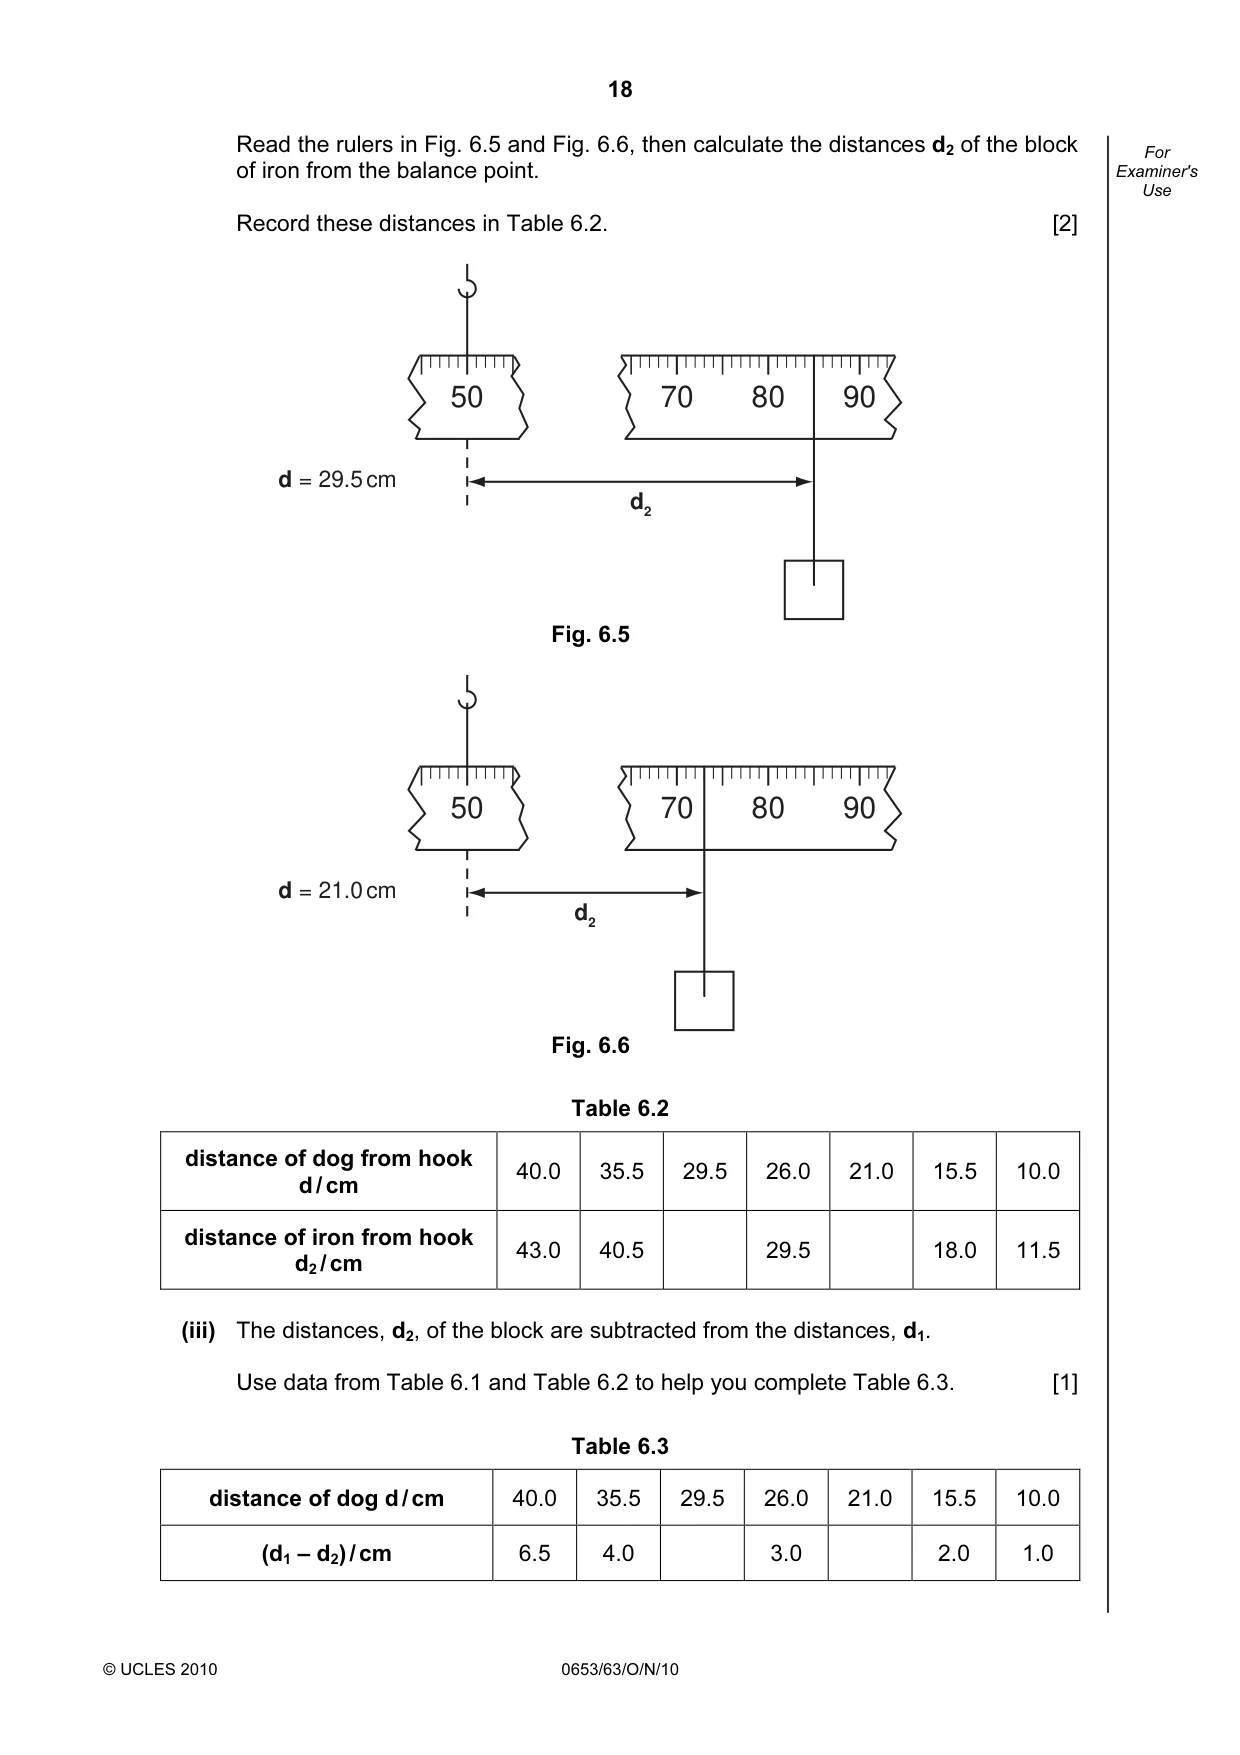
18 © UCLES 2010 0653/63/O/N/10 For Examiner's Use Read the rulers in Fig. 6.5 and Fig. 6.6, then calculate the distances d2 of the block of iron from the balance point. Record these distances in Table 6.2. [2] 50 70 80 90 d2 d = 29.5 cm Fig. 6.5 50 70 80 90 d2 d = 21.0 cm Fig. 6.6 Table 6.2 distance of dog from hook d / cm 40.0 35.5 29.5 26.0 21.0 15.5 10.0 distance of iron from hook d2 / cm 43.0 40.5 29.5 18.0 11.5 (iii) The distances, d2, of the block are subtracted from the distances, d1. Use data from Table 6.1 and Table 6.2 to help you complete Table 6.3. [1] Table 6.3 distance of dog d / cm 40.0 35.5 29.5 26.0 21.0 15.5 10.0 (d1 – d2) / cm 6.5 4.0 3.0 2.0 1.0
Question paper, page 19
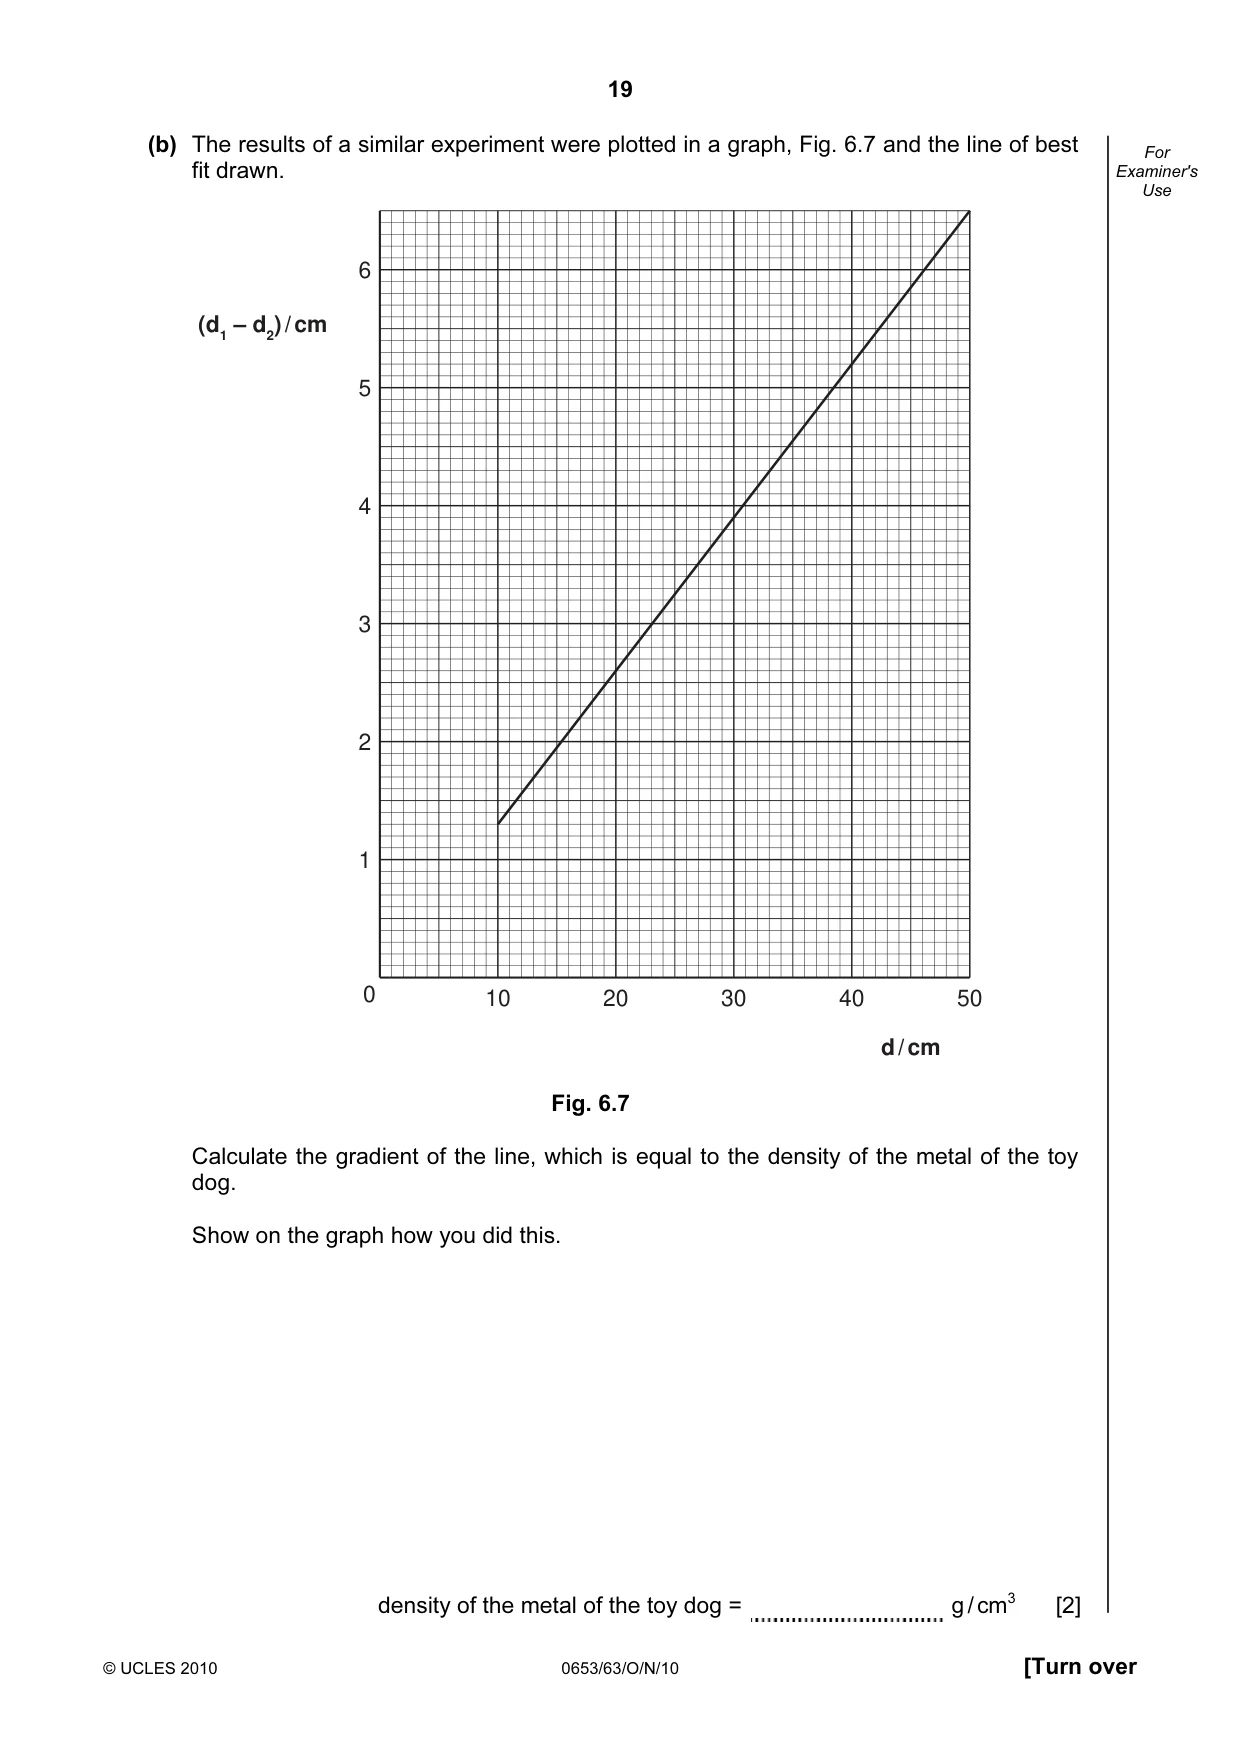
19 © UCLES 2010 0653/63/O/N/10 [Turn over For Examiner's Use (b) The results of a similar experiment were plotted in a graph, Fig. 6.7 and the line of best fit drawn. 0 10 20 30 40 50 6 5 4 3 2 1 (d1 – d2) / cm d / cm Fig. 6.7 Calculate the gradient of the line, which is equal to the density of the metal of the toy dog. Show on the graph how you did this. density of the metal of the toy dog = g / cm3 [2]
Question paper, page 20
20 Permission to reproduce items where third-party owned material protected by copyright is included has been sought and cleared where possible. Every reasonable effort has been made by the publisher (UCLES) to trace copyright holders, but if any items requiring clearance have unwittingly been included, the publisher will be pleased to make amends at the earliest possible opportunity. University of Cambridge International Examinations is part of the Cambridge Assessment Group. Cambridge Assessment is the brand name of University of Cambridge Local Examinations Syndicate (UCLES), which is itself a department of the University of Cambridge. © UCLES 2010 0653/63/O/N/10 For Examiner's Use (c) The density can also be found using the mass of the toy dog in grams, and its volume in cubic centimetres. Describe in detail how you would find the volume of the toy dog. [3]
Mark scheme, page 1
UNIVERSITY OF CAMBRIDGE INTERNATIONAL EXAMINATIONS International General Certificate of Secondary Education MARK SCHEME for the October/November 2010 question paper for the guidance of teachers 0653 COMBINED SCIENCE 0653/63 Paper 6 (Alternative to Practical), maximum raw mark 60 This mark scheme is published as an aid to teachers and candidates, to indicate the requirements of the examination. It shows the basis on which Examiners were instructed to award marks. It does not indicate the details of the discussions that took place at an Examiners’ meeting before marking began, which would have considered the acceptability of alternative answers. Mark schemes must be read in conjunction with the question papers and the report on the examination. • CIE will not enter into discussions or correspondence in connection with these mark schemes. CIE is publishing the mark schemes for the October/November 2010 question papers for most IGCSE, GCE Advanced Level and Advanced Subsidiary Level syllabuses and some Ordinary Level syllabuses. www.XtremePapers.com
Mark scheme, page 2
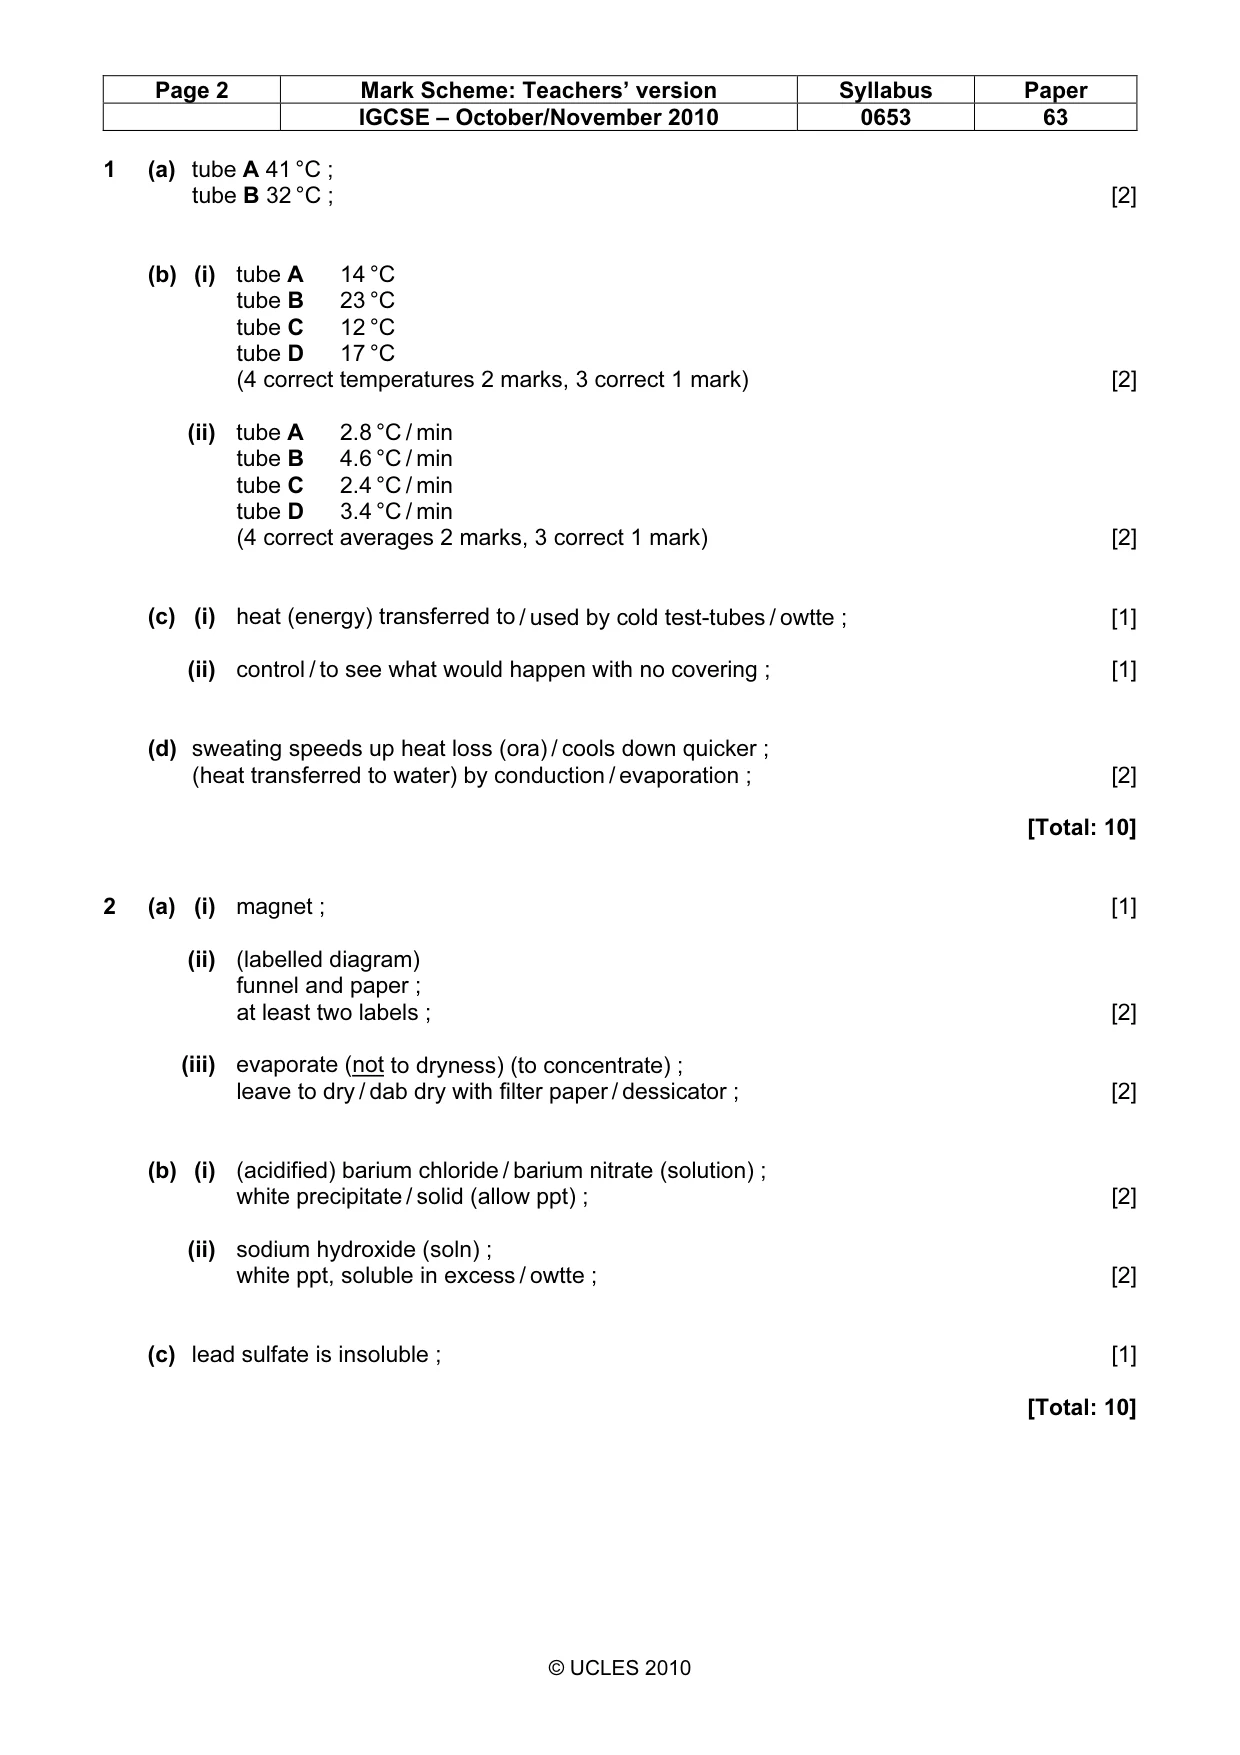
Page 2 Mark Scheme: Teachers’ version Syllabus Paper IGCSE – October/November 2010 0653 63 © UCLES 2010 1 (a) tube A 41 °C ; tube B 32 °C ; [2] (b) (i) tube A 14 °C tube B 23 °C tube C 12 °C tube D 17 °C (4 correct temperatures 2 marks, 3 correct 1 mark) [2] (ii) tube A 2.8 °C / min tube B 4.6 °C / min tube C 2.4 °C / min tube D 3.4 °C / min (4 correct averages 2 marks, 3 correct 1 mark) [2] (c) (i) heat (energy) transferred to / used by cold test-tubes / owtte ; [1] (ii) control / to see what would happen with no covering ; [1] (d) sweating speeds up heat loss (ora) / cools down quicker ; (heat transferred to water) by conduction / evaporation ; [2] [Total: 10] 2 (a) (i) magnet ; [1] (ii) (labelled diagram) funnel and paper ; at least two labels ; [2] (iii) evaporate (not to dryness) (to concentrate) ; leave to dry / dab dry with filter paper / dessicator ; [2] (b) (i) (acidified) barium chloride / barium nitrate (solution) ; white precipitate / solid (allow ppt) ; [2] (ii) sodium hydroxide (soln) ; white ppt, soluble in excess / owtte ; [2] (c) lead sulfate is insoluble ; [1] [Total: 10]
Mark scheme, page 3
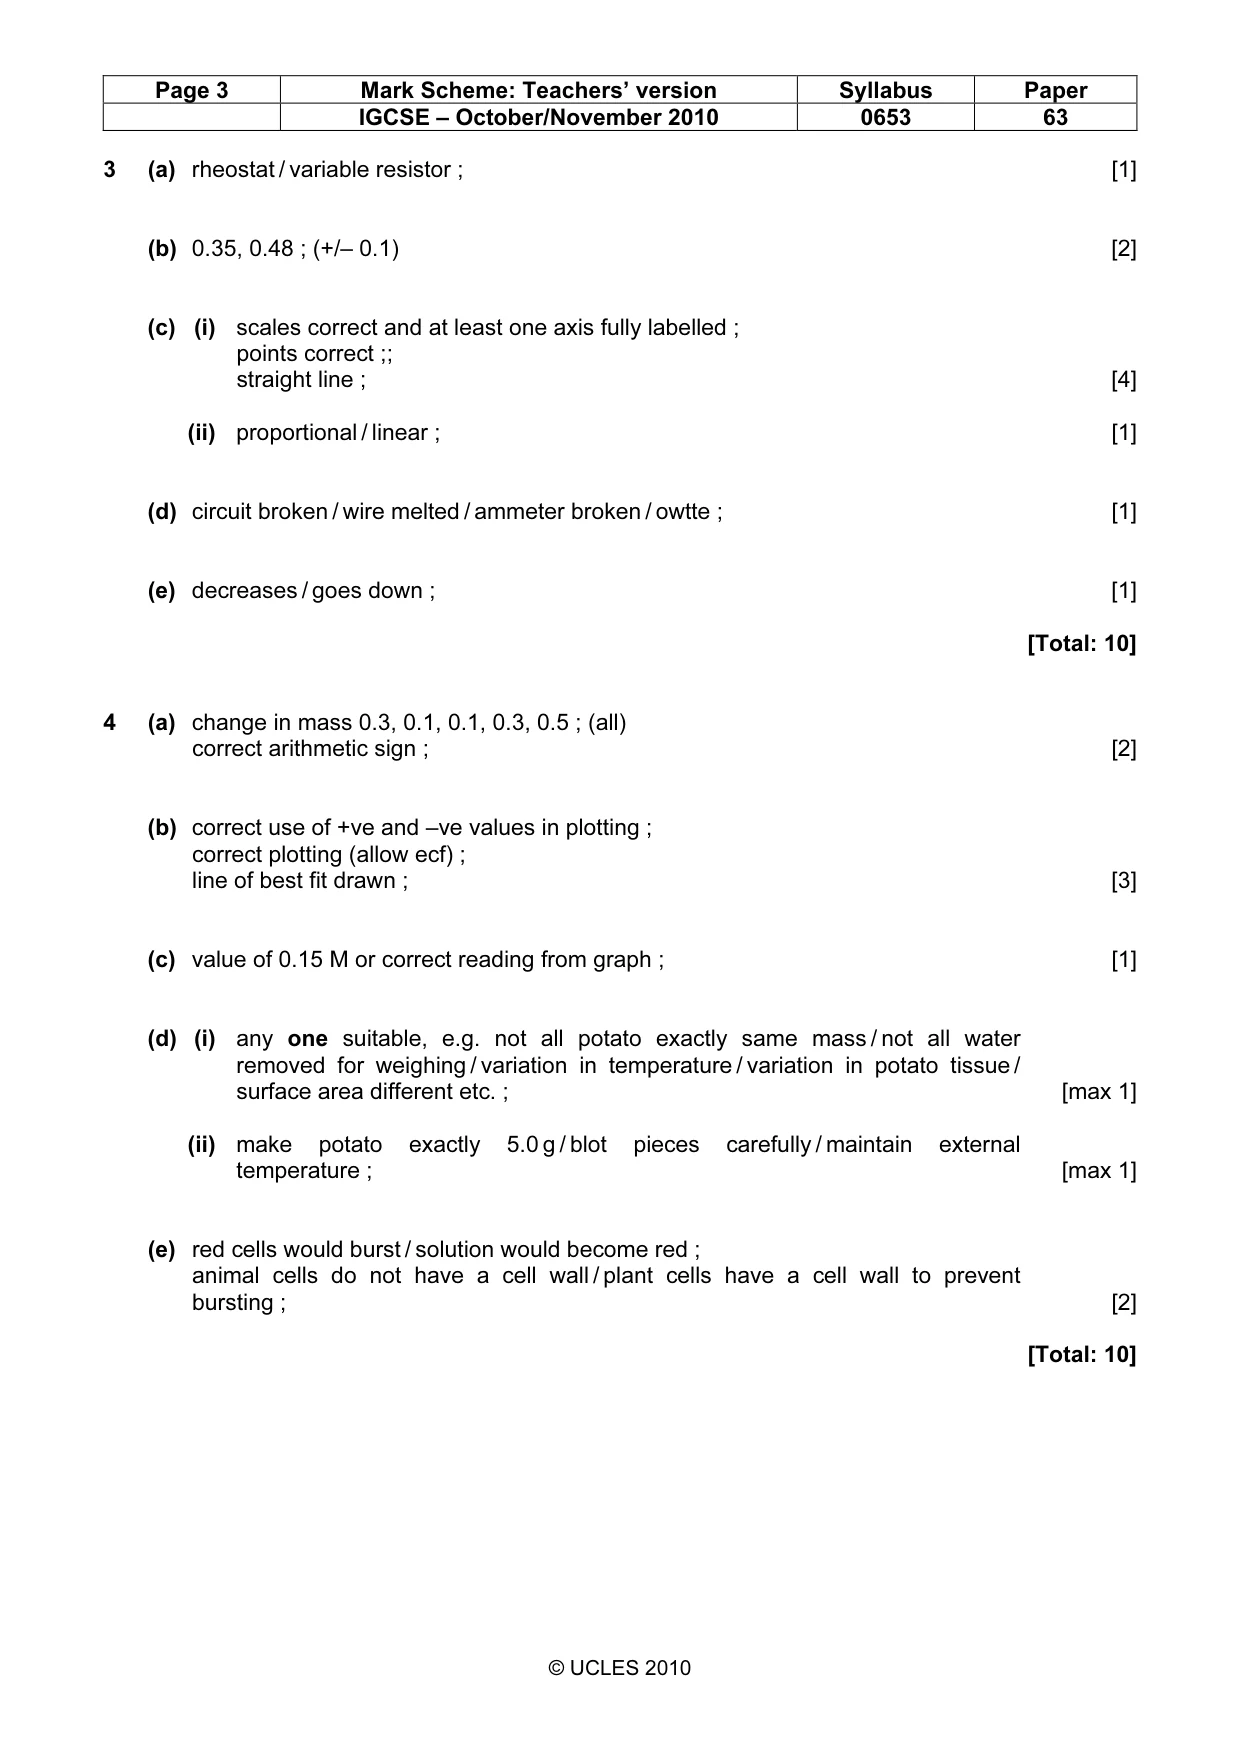
Page 3 Mark Scheme: Teachers’ version Syllabus Paper IGCSE – October/November 2010 0653 63 © UCLES 2010 3 (a) rheostat / variable resistor ; [1] (b) 0.35, 0.48 ; (+/– 0.1) [2] (c) (i) scales correct and at least one axis fully labelled ; points correct ;; straight line ; [4] (ii) proportional / linear ; [1] (d) circuit broken / wire melted / ammeter broken / owtte ; [1] (e) decreases / goes down ; [1] [Total: 10] 4 (a) change in mass 0.3, 0.1, 0.1, 0.3, 0.5 ; (all) correct arithmetic sign ; [2] (b) correct use of +ve and –ve values in plotting ; correct plotting (allow ecf) ; line of best fit drawn ; [3] (c) value of 0.15 M or correct reading from graph ; [1] (d) (i) any one suitable, e.g. not all potato exactly same mass / not all water removed for weighing / variation in temperature / variation in potato tissue / surface area different etc. ; [max 1] (ii) make potato exactly 5.0 g / blot pieces carefully / maintain external temperature ; [max 1] (e) red cells would burst / solution would become red ; animal cells do not have a cell wall / plant cells have a cell wall to prevent bursting ; [2] [Total: 10]
Mark scheme, page 4
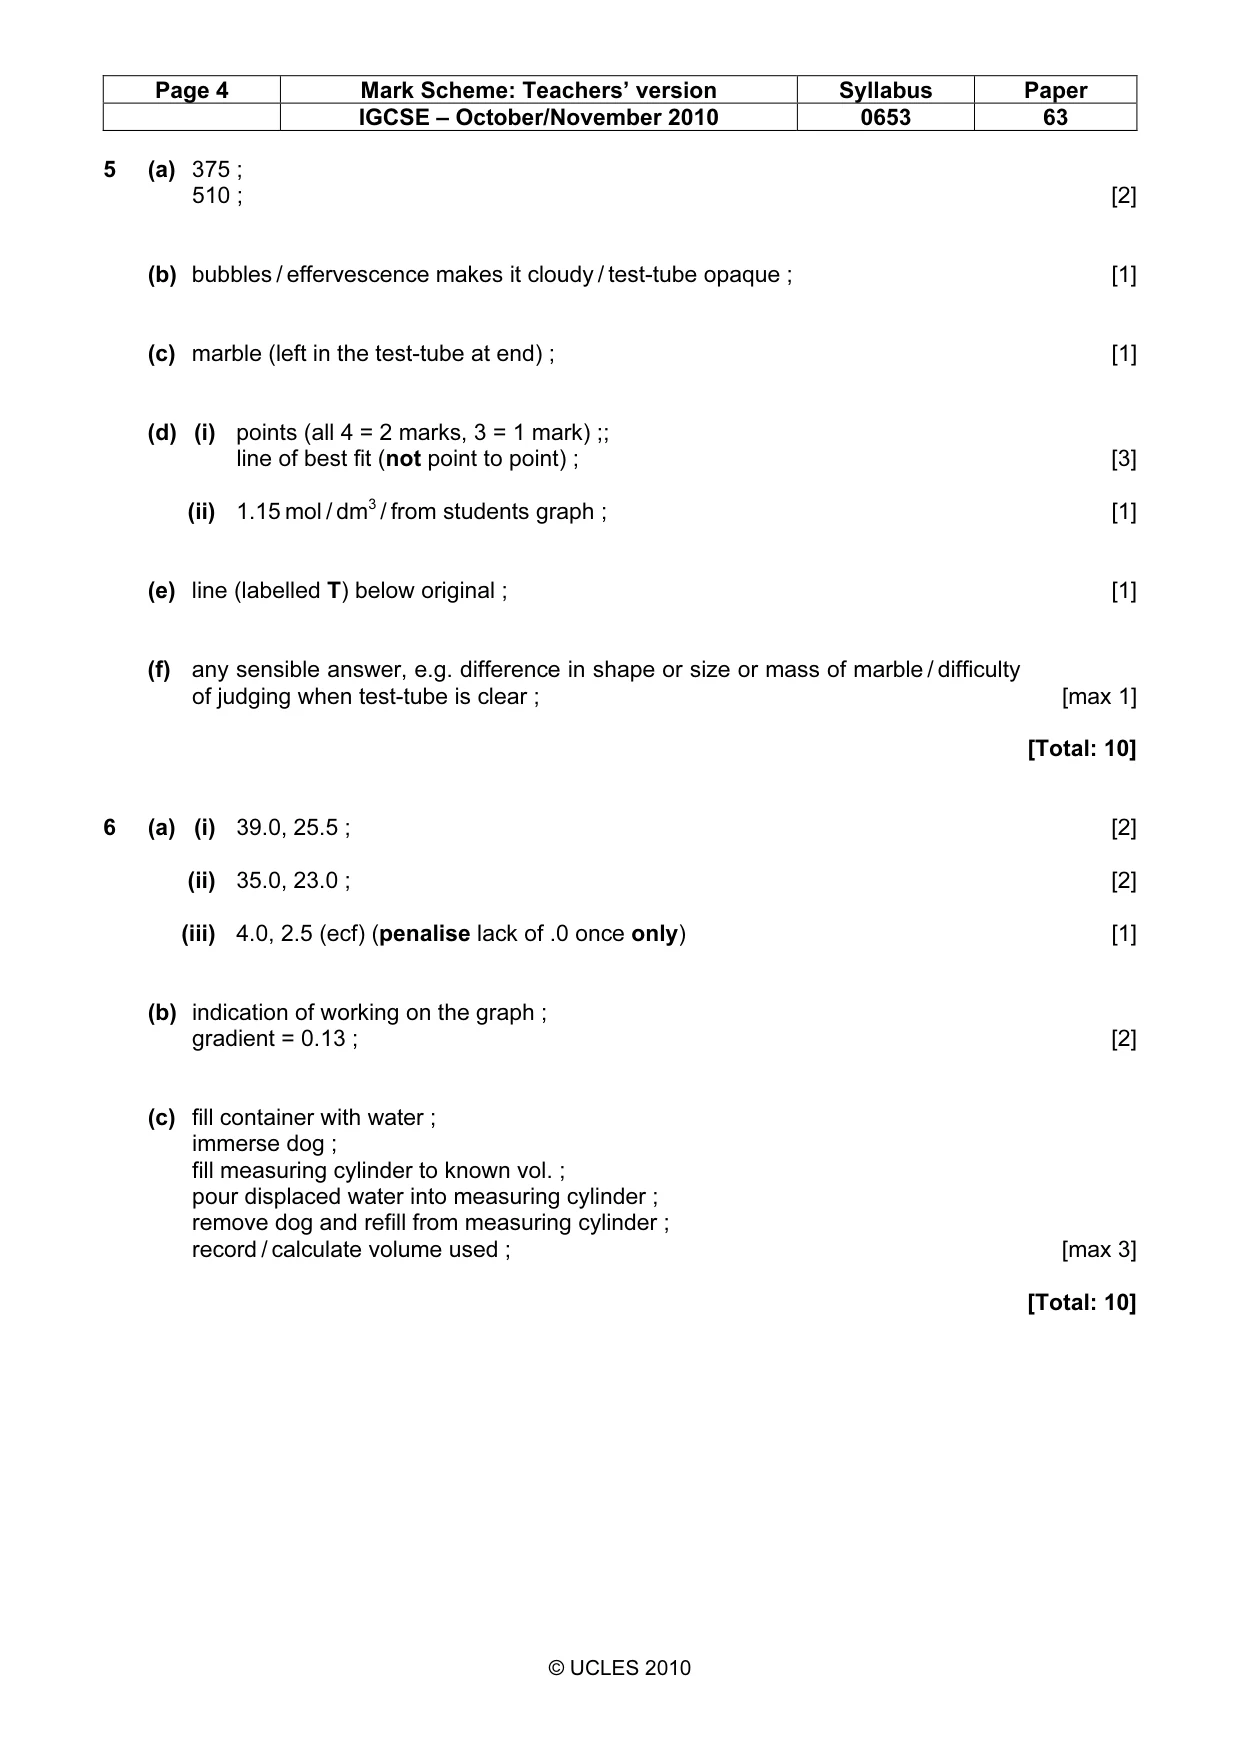
Page 4 Mark Scheme: Teachers’ version Syllabus Paper IGCSE – October/November 2010 0653 63 © UCLES 2010 5 (a) 375 ; 510 ; [2] (b) bubbles / effervescence makes it cloudy / test-tube opaque ; [1] (c) marble (left in the test-tube at end) ; [1] (d) (i) points (all 4 = 2 marks, 3 = 1 mark) ;; line of best fit (not point to point) ; [3] (ii) 1.15 mol / dm3 / from students graph ; [1] (e) line (labelled T) below original ; [1] (f) any sensible answer, e.g. difference in shape or size or mass of marble / difficulty of judging when test-tube is clear ; [max 1] [Total: 10] 6 (a) (i) 39.0, 25.5 ; [2] (ii) 35.0, 23.0 ; [2] (iii) 4.0, 2.5 (ecf) (penalise lack of .0 once only) [1] (b) indication of working on the graph ; gradient = 0.13 ; [2] (c) fill container with water ; immerse dog ; fill measuring cylinder to known vol. ; pour displaced water into measuring cylinder ; remove dog and refill from measuring cylinder ; record / calculate volume used ; [max 3] [Total: 10]