Cambridge IGCSE Geography 0460 — 2025 Oct/Nov Paper 4 · Variant 3
0460/43/O/N/25 · 2 questions · 60 marks · 90 min
The question paper and its mark scheme, free to read here and free to download. This is Cambridge’s own paper, exactly as it was sat.
Question paper16 pages
Mark scheme10 pages
Answers below. Sit the paper first if you are practising.
Questions as text
Q1 · Students in Dubai, a city in the United Arab Emirates (UAE), were studying tourism
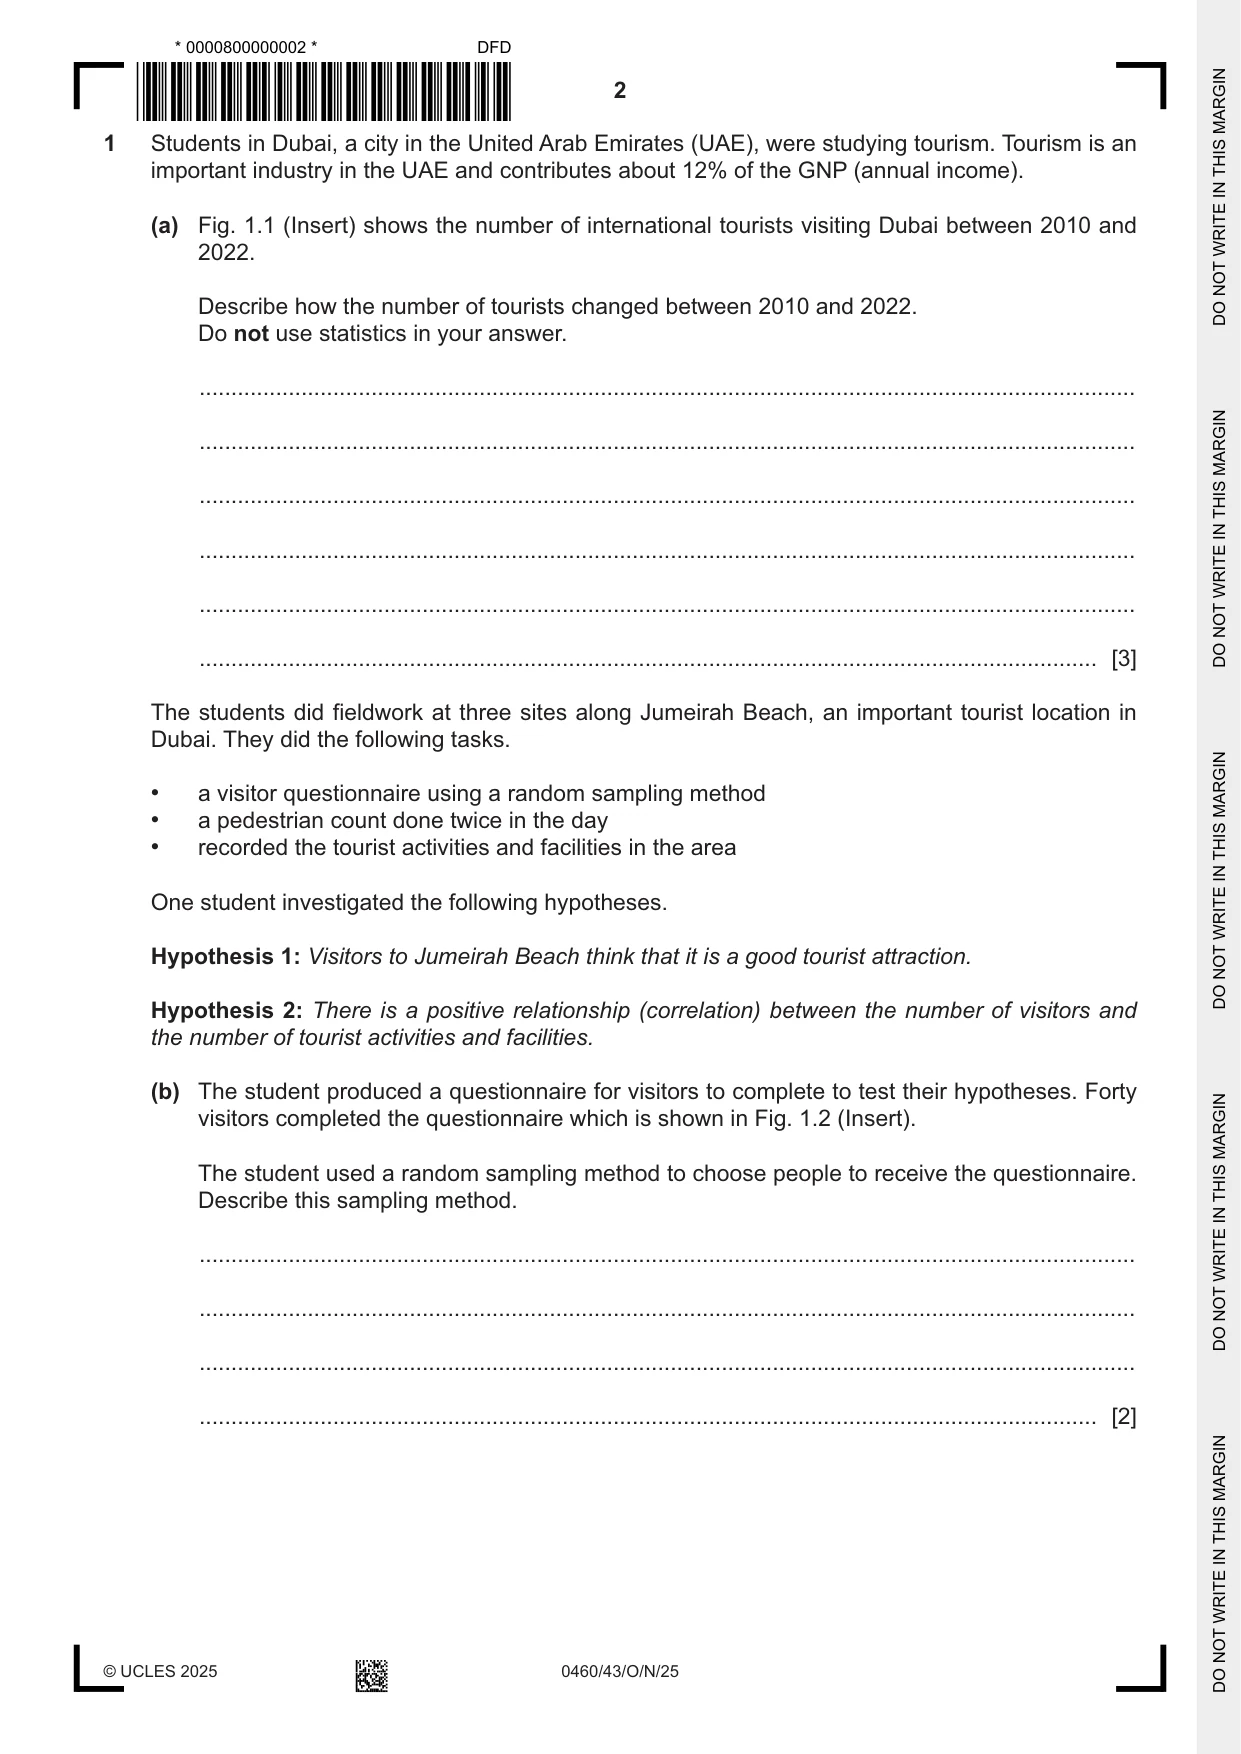
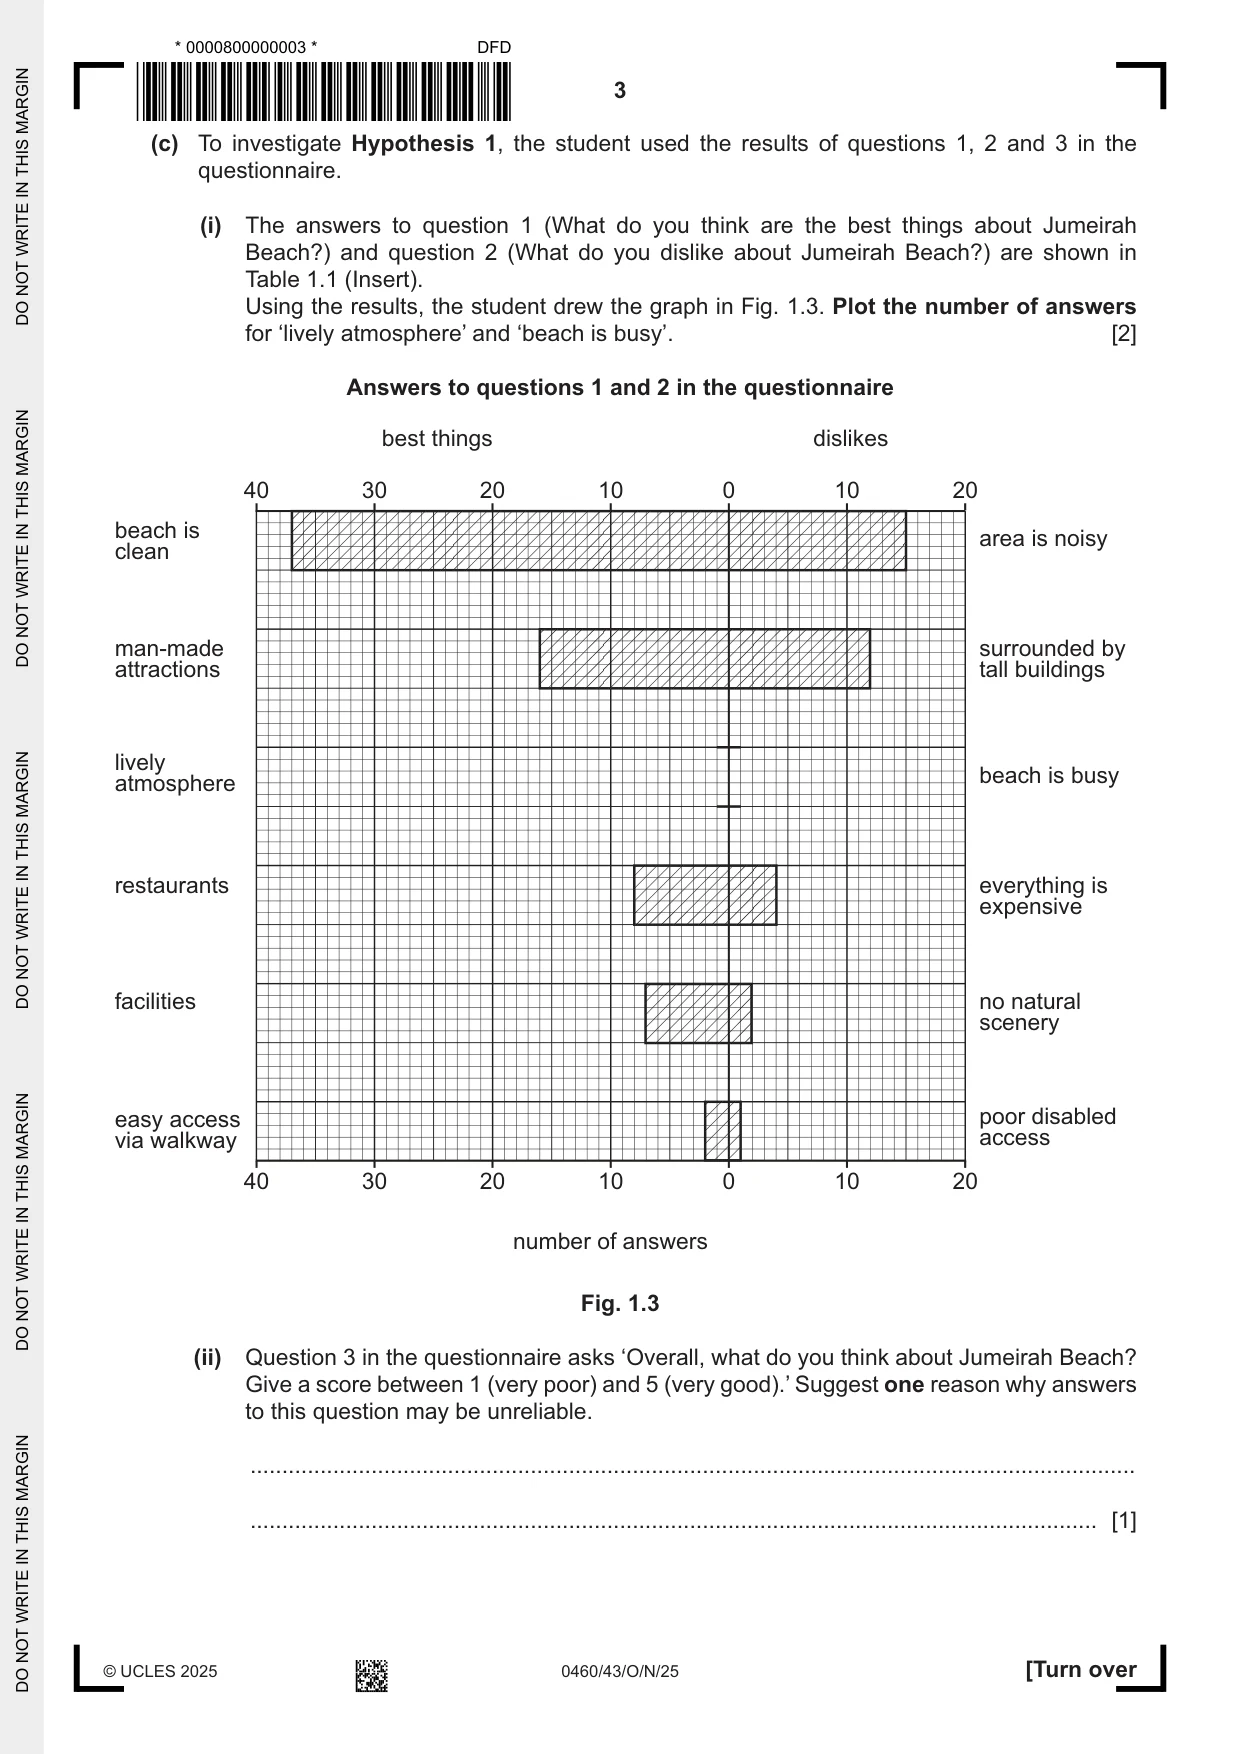
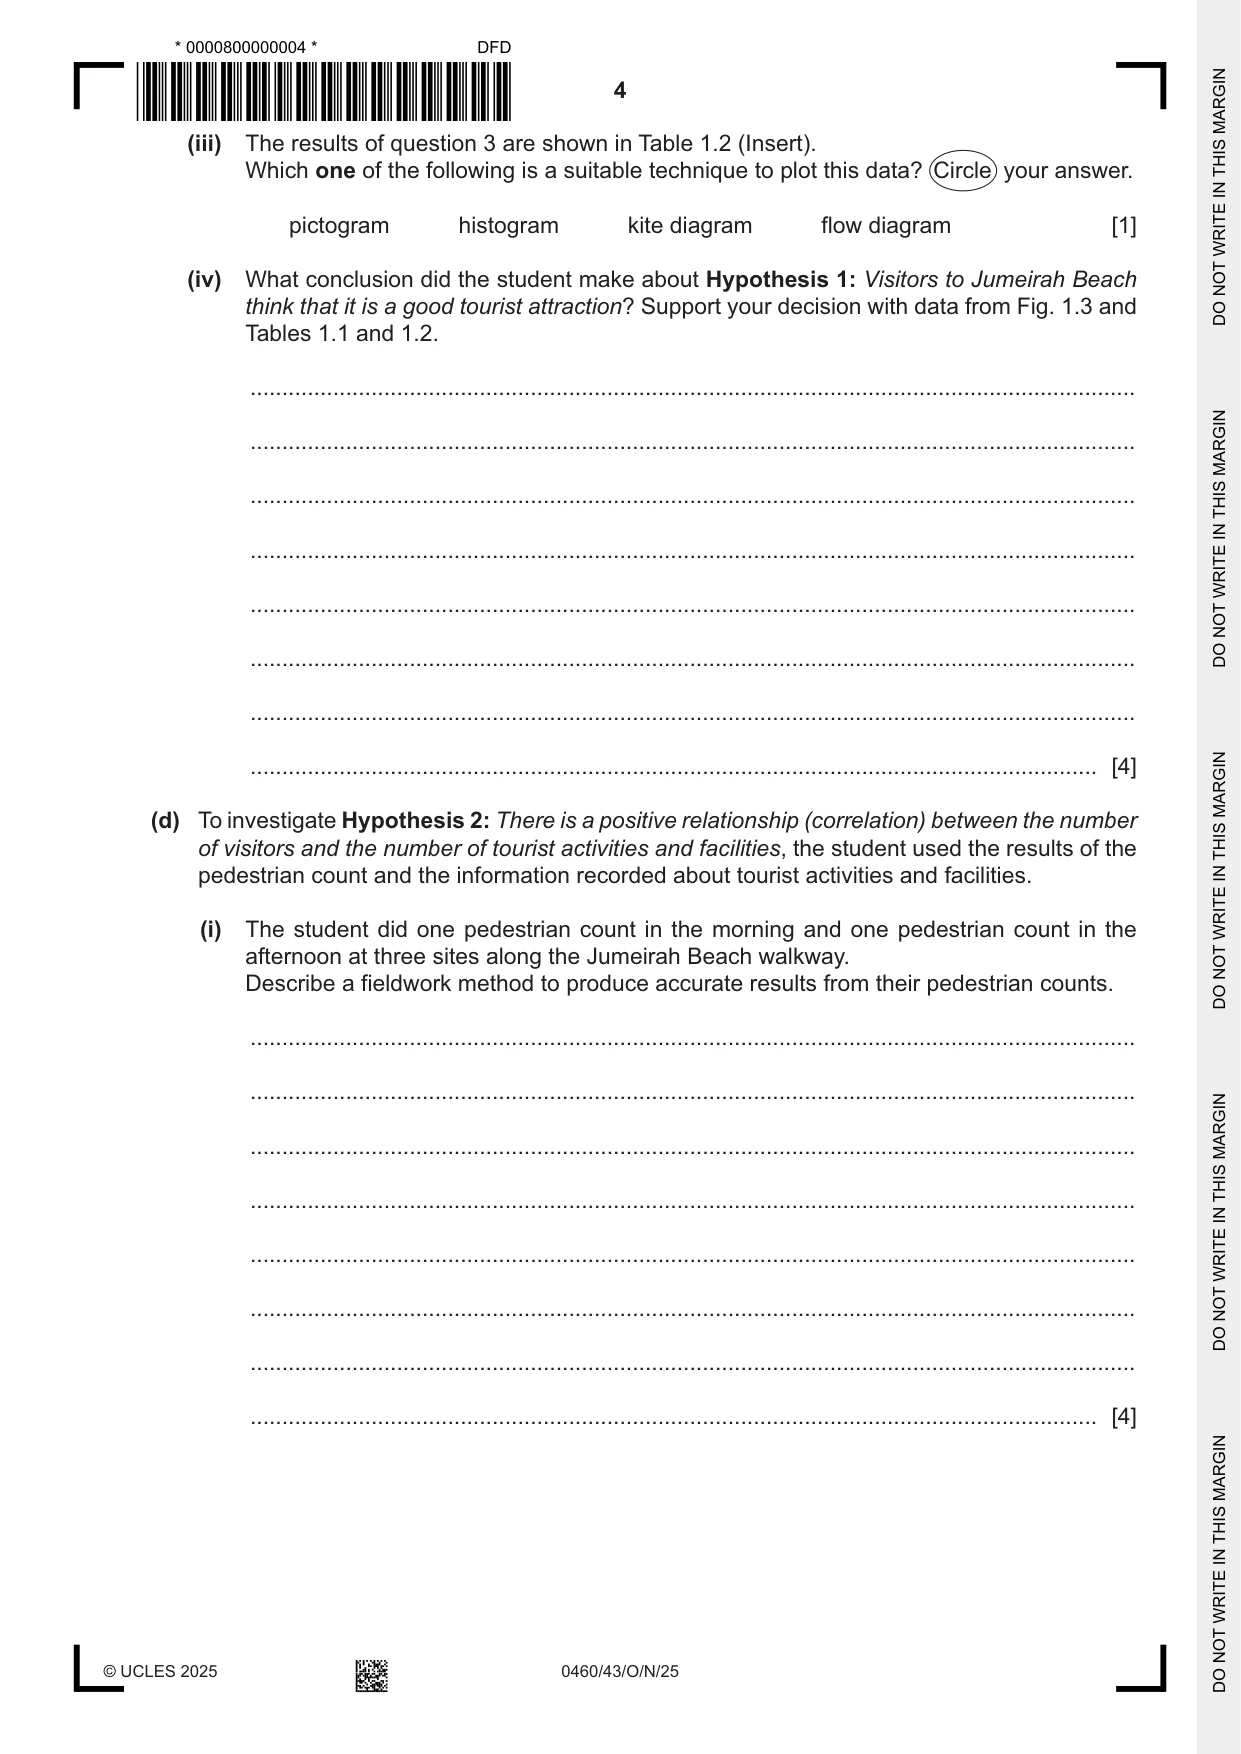
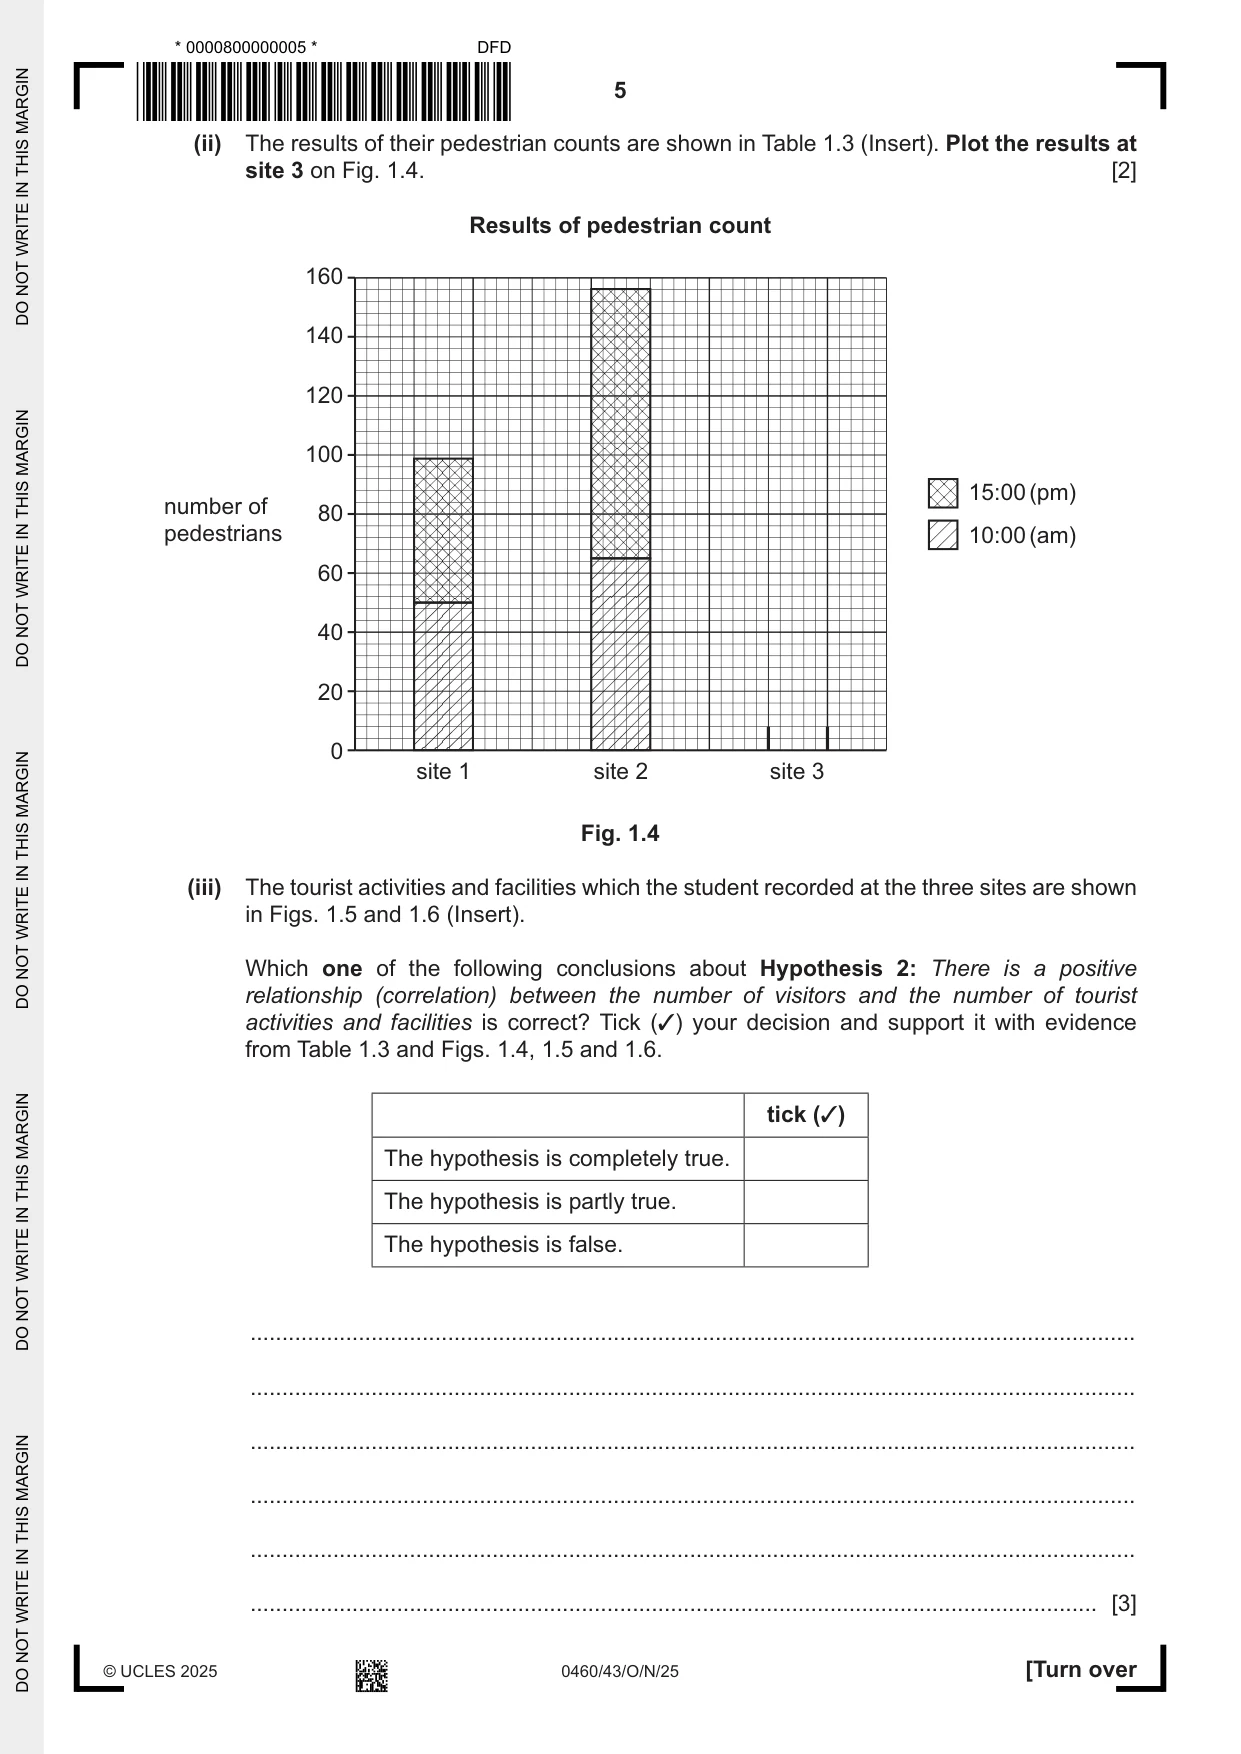
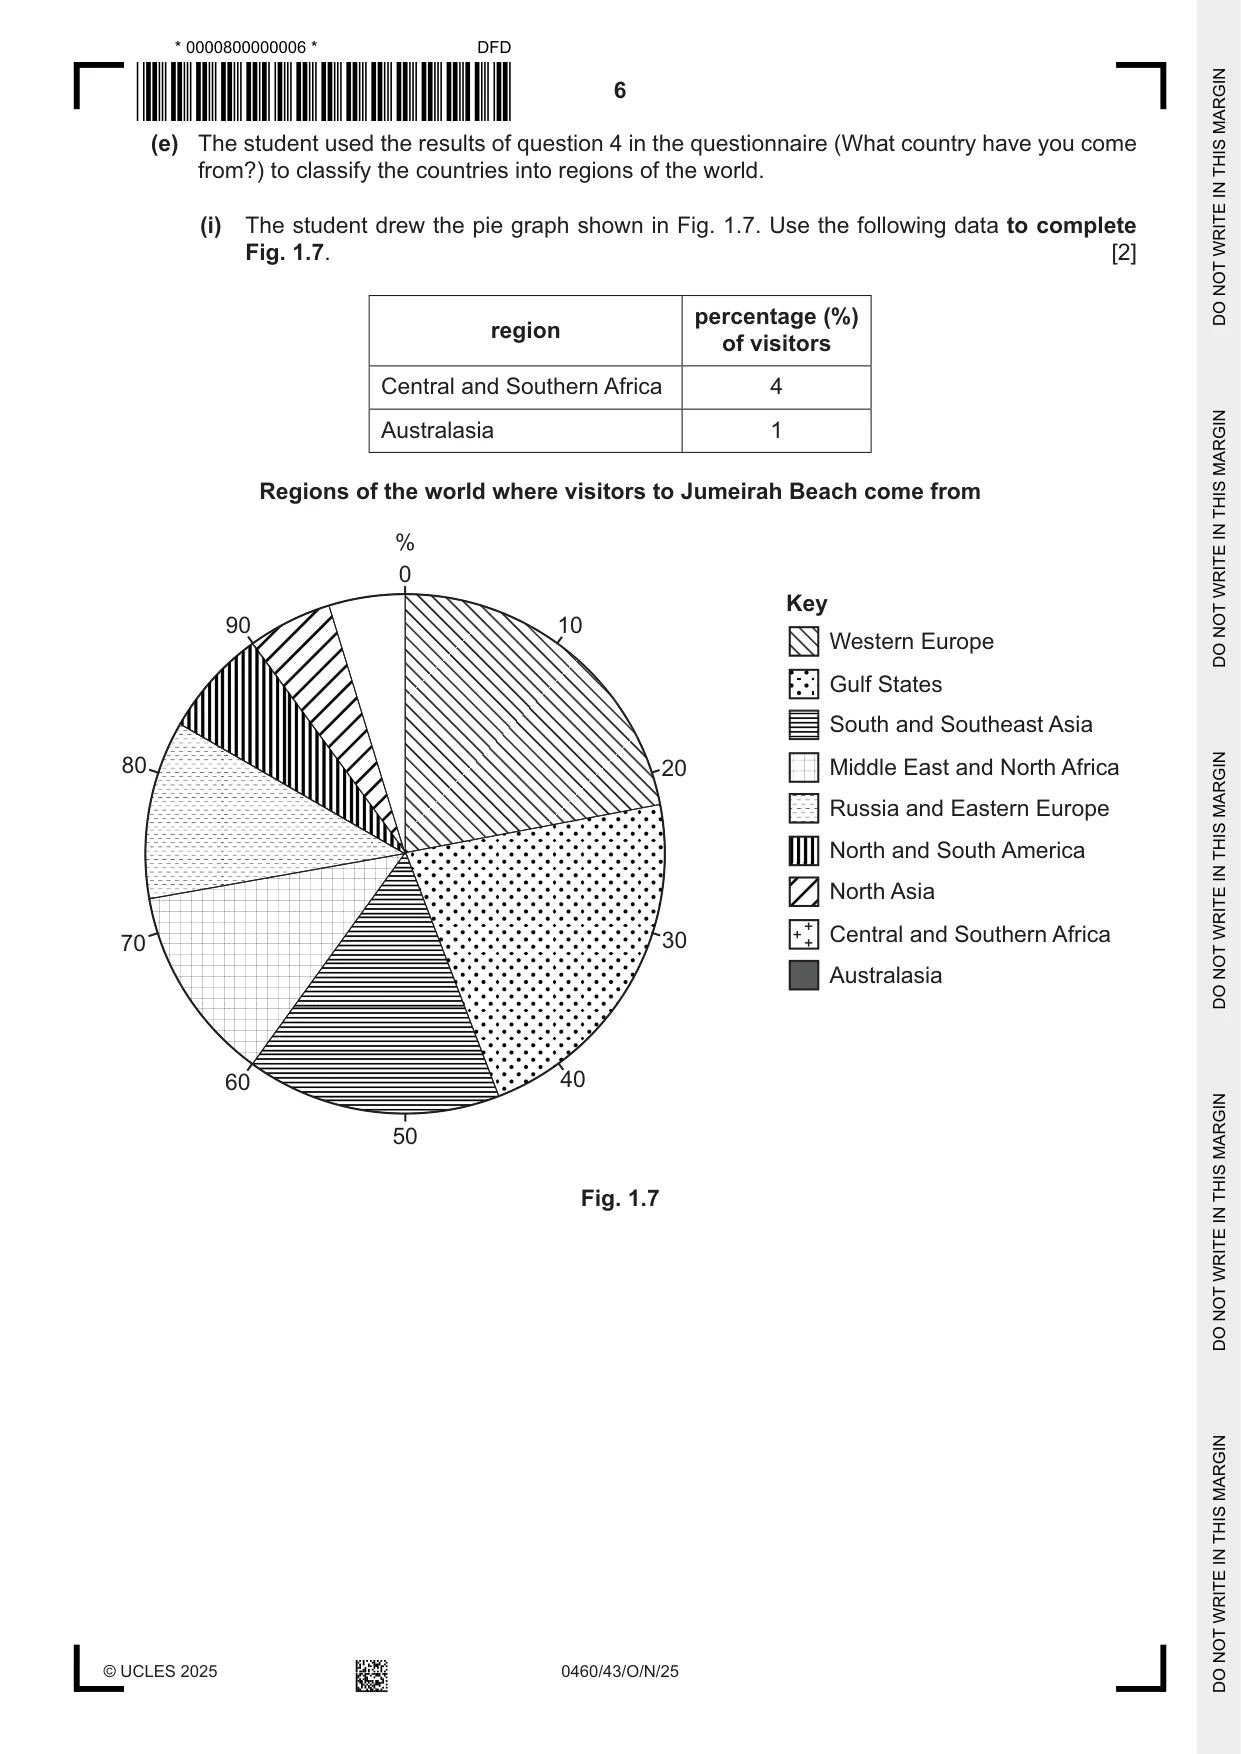
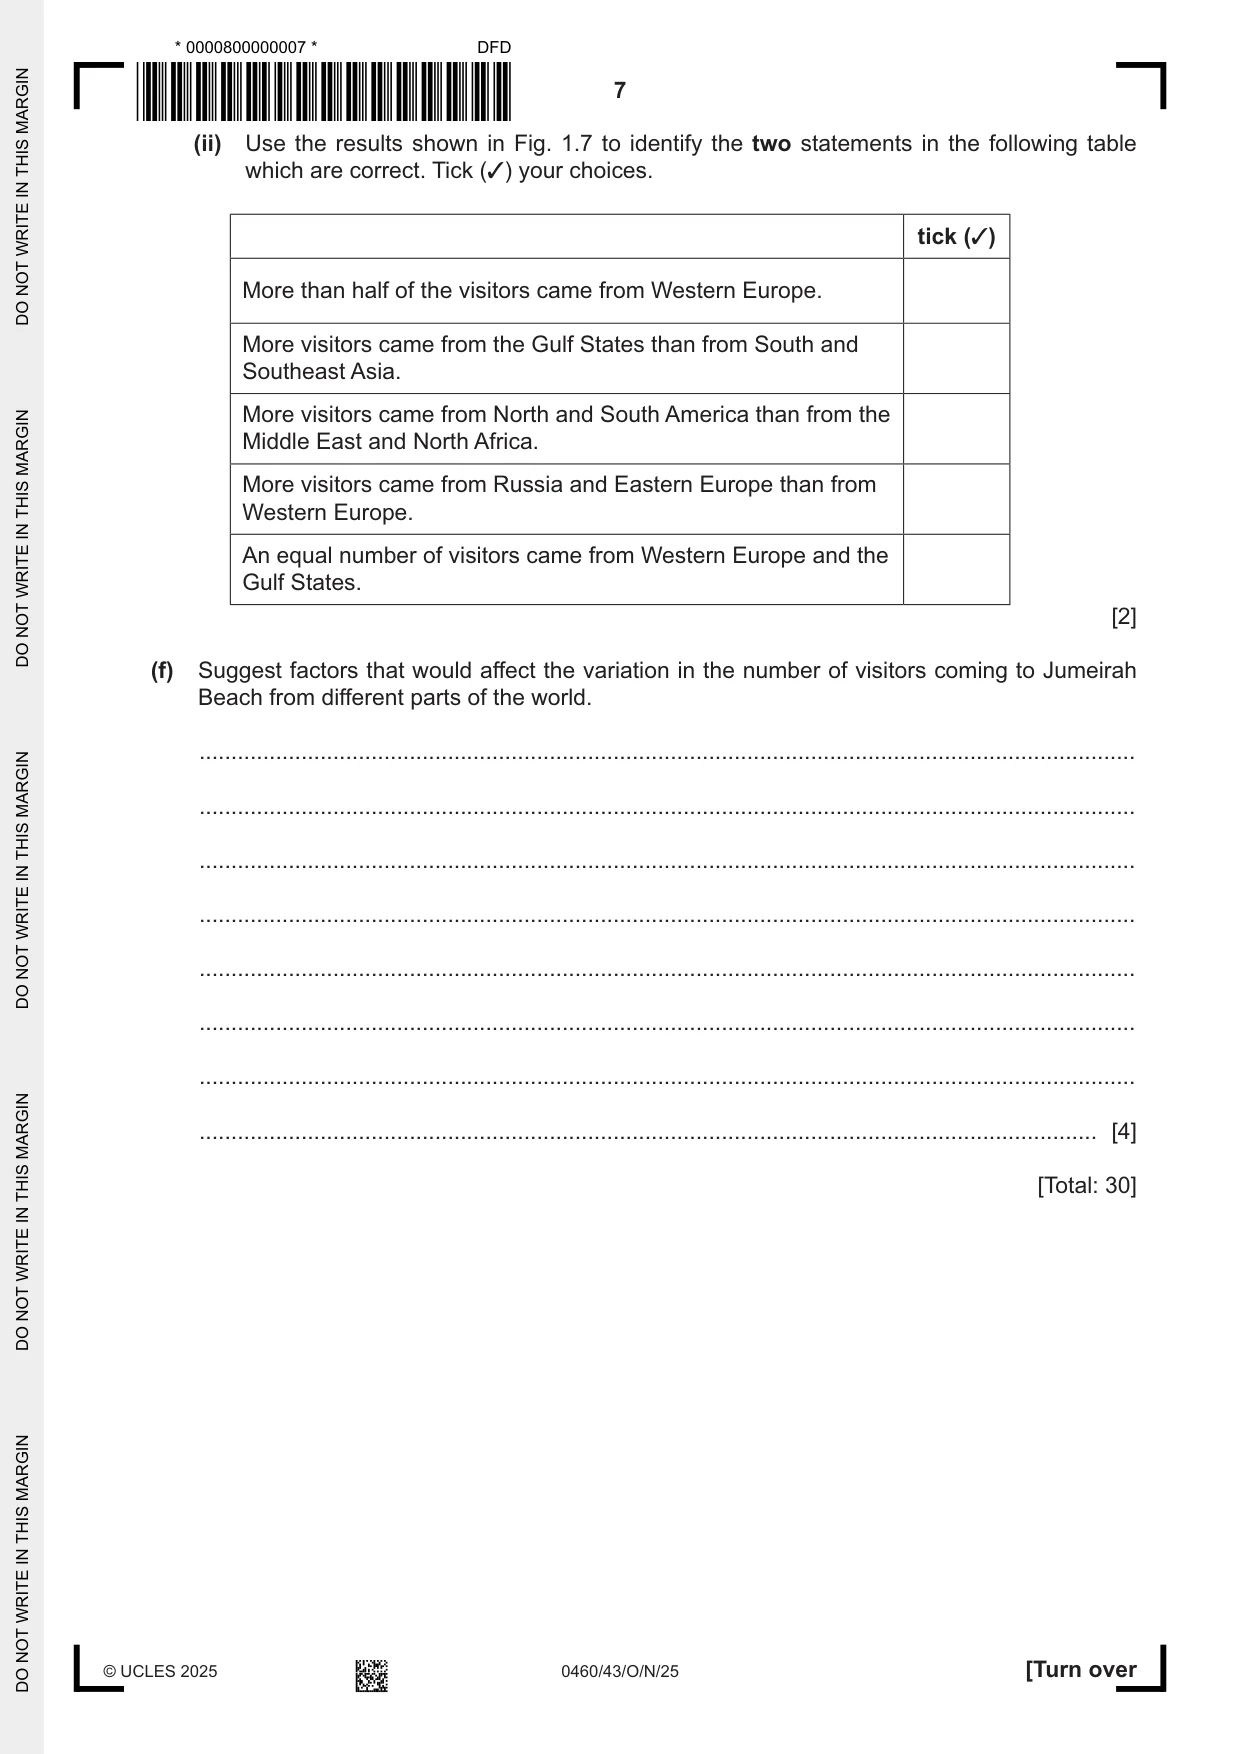
1 Students in Dubai, a city in the United Arab Emirates (UAE), were studying tourism. Tourism is an important industry in the UAE and contributes about 12% of the GNP (annual income). (a) Fig. 1.1 (Insert) shows the number of international tourists visiting Dubai between 2010 and 2022. Describe how the number of tourists changed between 2010 and 2022. Do not use statistics in your answer. ................................................................................................................................................... ................................................................................................................................................... ................................................................................................................................................... ................................................................................................................................................... ................................................................................................................................................... ............................................................................................................................................. [3] The students did fieldwork at three sites along Jumeirah Beach, an important tourist location in Dubai. They did the following tasks. • a visitor questionnaire using a random sampling method • a pedestrian count done twice in the day • recorded the tourist activities and facilities in the area One student investigated the following hypotheses. Hypothesis 1: Visitors to Jumeirah Beach think that it is a good tourist attraction. Hypothesis 2: There is a positive relationship (correlation) between the number of visitors and the number of tourist activities and facilities. (b) The student produced a questionnaire for visitors to complete to test their hypotheses. Forty visitors completed the questionnaire which is shown in Fig. 1.2 (Insert). The student used a random sampling method to choose people to receive the questionnaire. Describe this sampling method. ................................................................................................................................................... ................................................................................................................................................... ................................................................................................................................................... ............................................................................................................................................. [2] (c) To investigate Hypothesis 1, the student used the results of questions 1, 2 and 3 in the questionnaire. (i) The answers to question 1 (What do you think are the best things about Jumeirah Beach?) and question 2 (What do you dislike about Jumeirah Beach?) are shown in Table 1.1 (Insert). Using the results, the student drew the graph in Fig. 1.3. Plot the number of answers for ‘lively atmosphere’ and ‘beach is busy’. [2] Answers to questions 1 and 2 in the questionnaire best things dislikes 40 30 20 10 0 10 20 beach is area is noisy clean man-made surrounded by attractions tall buildings lively beach is busyatmosphere restaurants everything is expensive facilities no natural scenery easy access poor disabled via walkway access 40 30 20 10 0 10 20 number of answers Fig. 1.3 (ii) Question 3 in the questionnaire asks ‘Overall, what do you think about Jumeirah Beach? Give a score between 1 (very poor) and 5 (very good).’ Suggest one reason why answers to this question may be unreliable. ........................................................................................................................................... ..................................................................................................................................... [1] (iii) The results of question 3 are shown in Table 1.2 (Insert). Which one of the following is a suitable technique to plot this data? Circle your answer. pictogram histogram kite diagram flow diagram [1] (iv) What conclusion did the student make about Hypothesis 1: Visitors to Jumeirah Beach think that it is a good tourist attraction? Support your decision with data from Fig. 1.3 and Tables 1.1 and 1.2. ........................................................................................................................................... ........................................................................................................................................... ........................................................................................................................................... ........................................................................................................................................... ........................................................................................................................................... ........................................................................................................................................... ........................................................................................................................................... ..................................................................................................................................... [4] (d) To investigate Hypothesis 2: There is a positive relationship (correlation) between the number of visitors and the number of tourist activities and facilities, the student used the results of the pedestrian count and the information recorded about tourist activities and facilities. (i) The student did one pedestrian count in the morning and one pedestrian count in the afternoon at three sites along the Jumeirah Beach walkway. Describe a fieldwork method to produce accurate results from their pedestrian counts. ........................................................................................................................................... ........................................................................................................................................... ........................................................................................................................................... ........................................................................................................................................... ........................................................................................................................................... ........................................................................................................................................... ........................................................................................................................................... ..................................................................................................................................... [4] (ii) The results of their pedestrian counts are shown in Table 1.3 (Insert). Plot the results at site 3 on Fig. 1.4. [2] Results of pedestrian count 160 140 120 100 15:00 (pm) number of 80 pedestrians 10:00 (am) 60 40 20 0 site 1 site 2 site 3 Fig. 1.4 (iii) The tourist activities and facilities which the student recorded at the three sites are shown in Figs. 1.5 and 1.6 (Insert). Which one of the following conclusions about Hypothesis 2: There is a positive relationship (correlation) between the number of visitors and the number of tourist activities and facilities is correct? Tick (✓) your decision and support it with evidence from Table 1.3 and Figs. 1.4, 1.5 and 1.6. tick (✓) The hypothesis is completely true. The hypothesis is partly true. The hypothesis is false. ........................................................................................................................................... ........................................................................................................................................... ........................................................................................................................................... ........................................................................................................................................... ........................................................................................................................................... ..................................................................................................................................... [3] (e) The student used the results of question 4 in the questionnaire (What country have you come from?) to classify the countries into regions of the world. (i) The student drew the pie graph shown in Fig. 1.7. Use the following data to complete Fig. 1.7. [2] percentage (%) region of visitors Central and Southern Africa 4 Australasia 1 Regions of the world where visitors to Jumeirah Beach come from % 0 Key 90 10 Western Europe Gulf States South and Southeast Asia 80 20 Middle East and North Africa Russia and Eastern Europe North and South America North Asia Central and Southern Africa70 30 Australasia 60 40 50 Fig. 1.7 (ii) Use the results shown in Fig. 1.7 to identify the two statements in the following table which are correct. Tick (✓) your choices. tick (✓) More than half of the visitors came from Western Europe. More visitors came from the Gulf States than from South and Southeast Asia. More visitors came from North and South America than from the Middle East and North Africa. More visitors came from Russia and Eastern Europe than from Western Europe. An equal number of visitors came from Western Europe and the Gulf States. [2] (f) Suggest factors that would affect the variation in the number of visitors coming to Jumeirah Beach from different parts of the world. ................................................................................................................................................... ................................................................................................................................................... ................................................................................................................................................... ................................................................................................................................................... ................................................................................................................................................... ................................................................................................................................................... ................................................................................................................................................... ............................................................................................................................................. [4] [Total: 30]
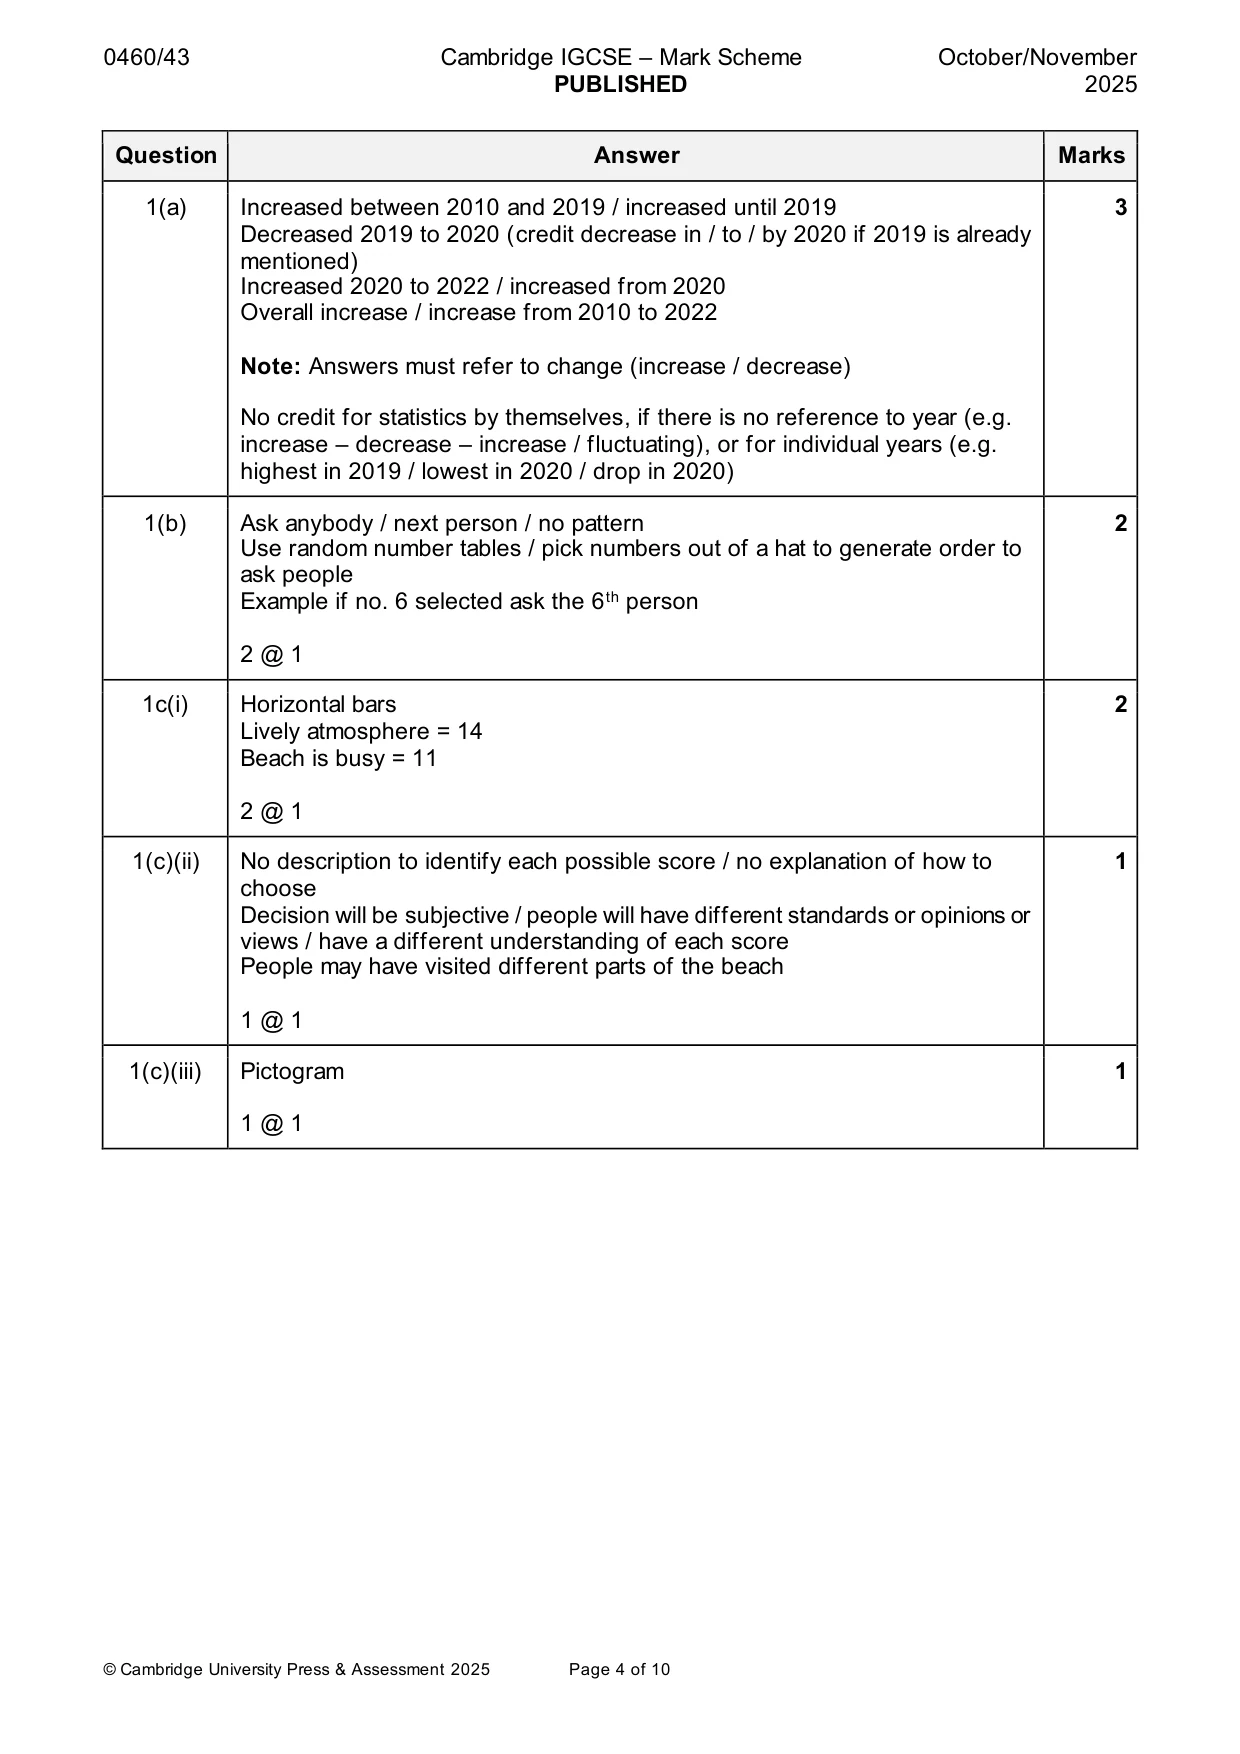
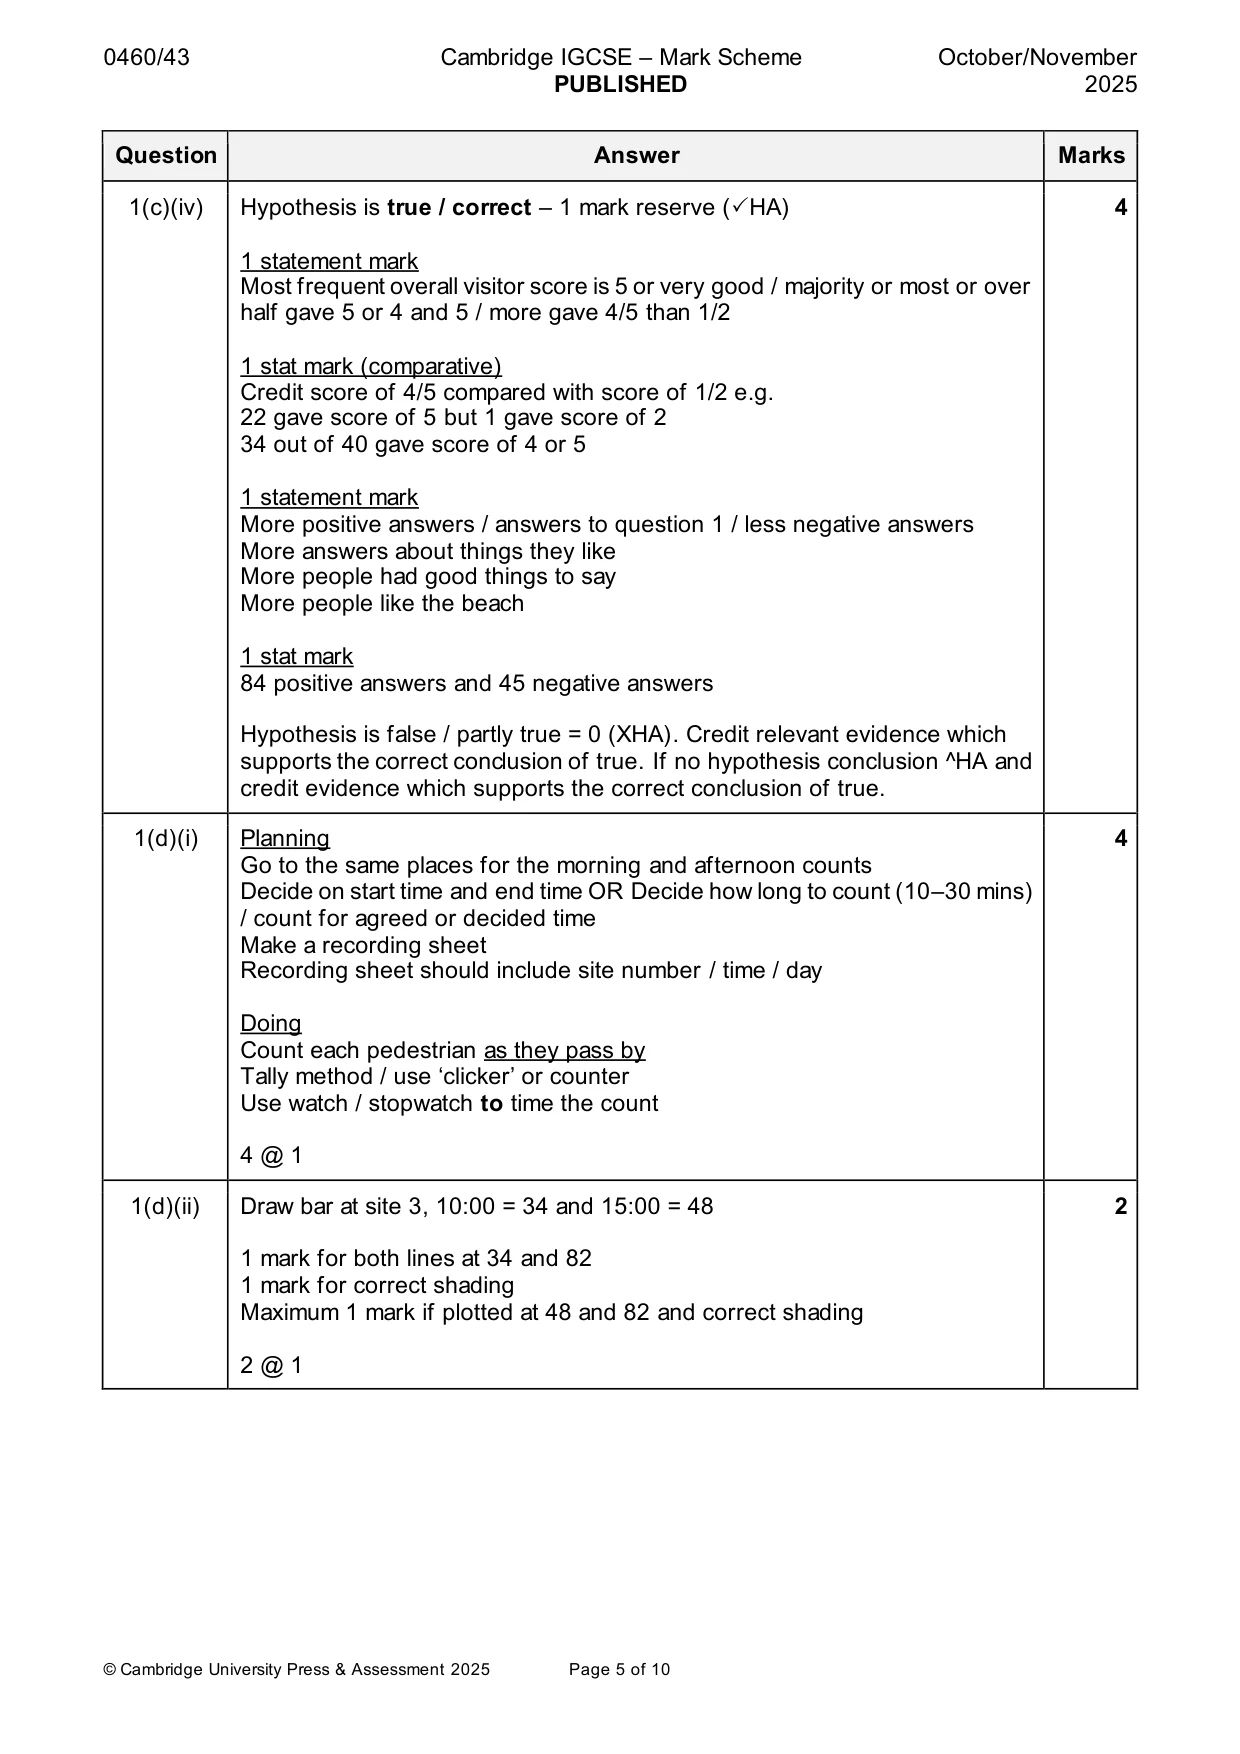
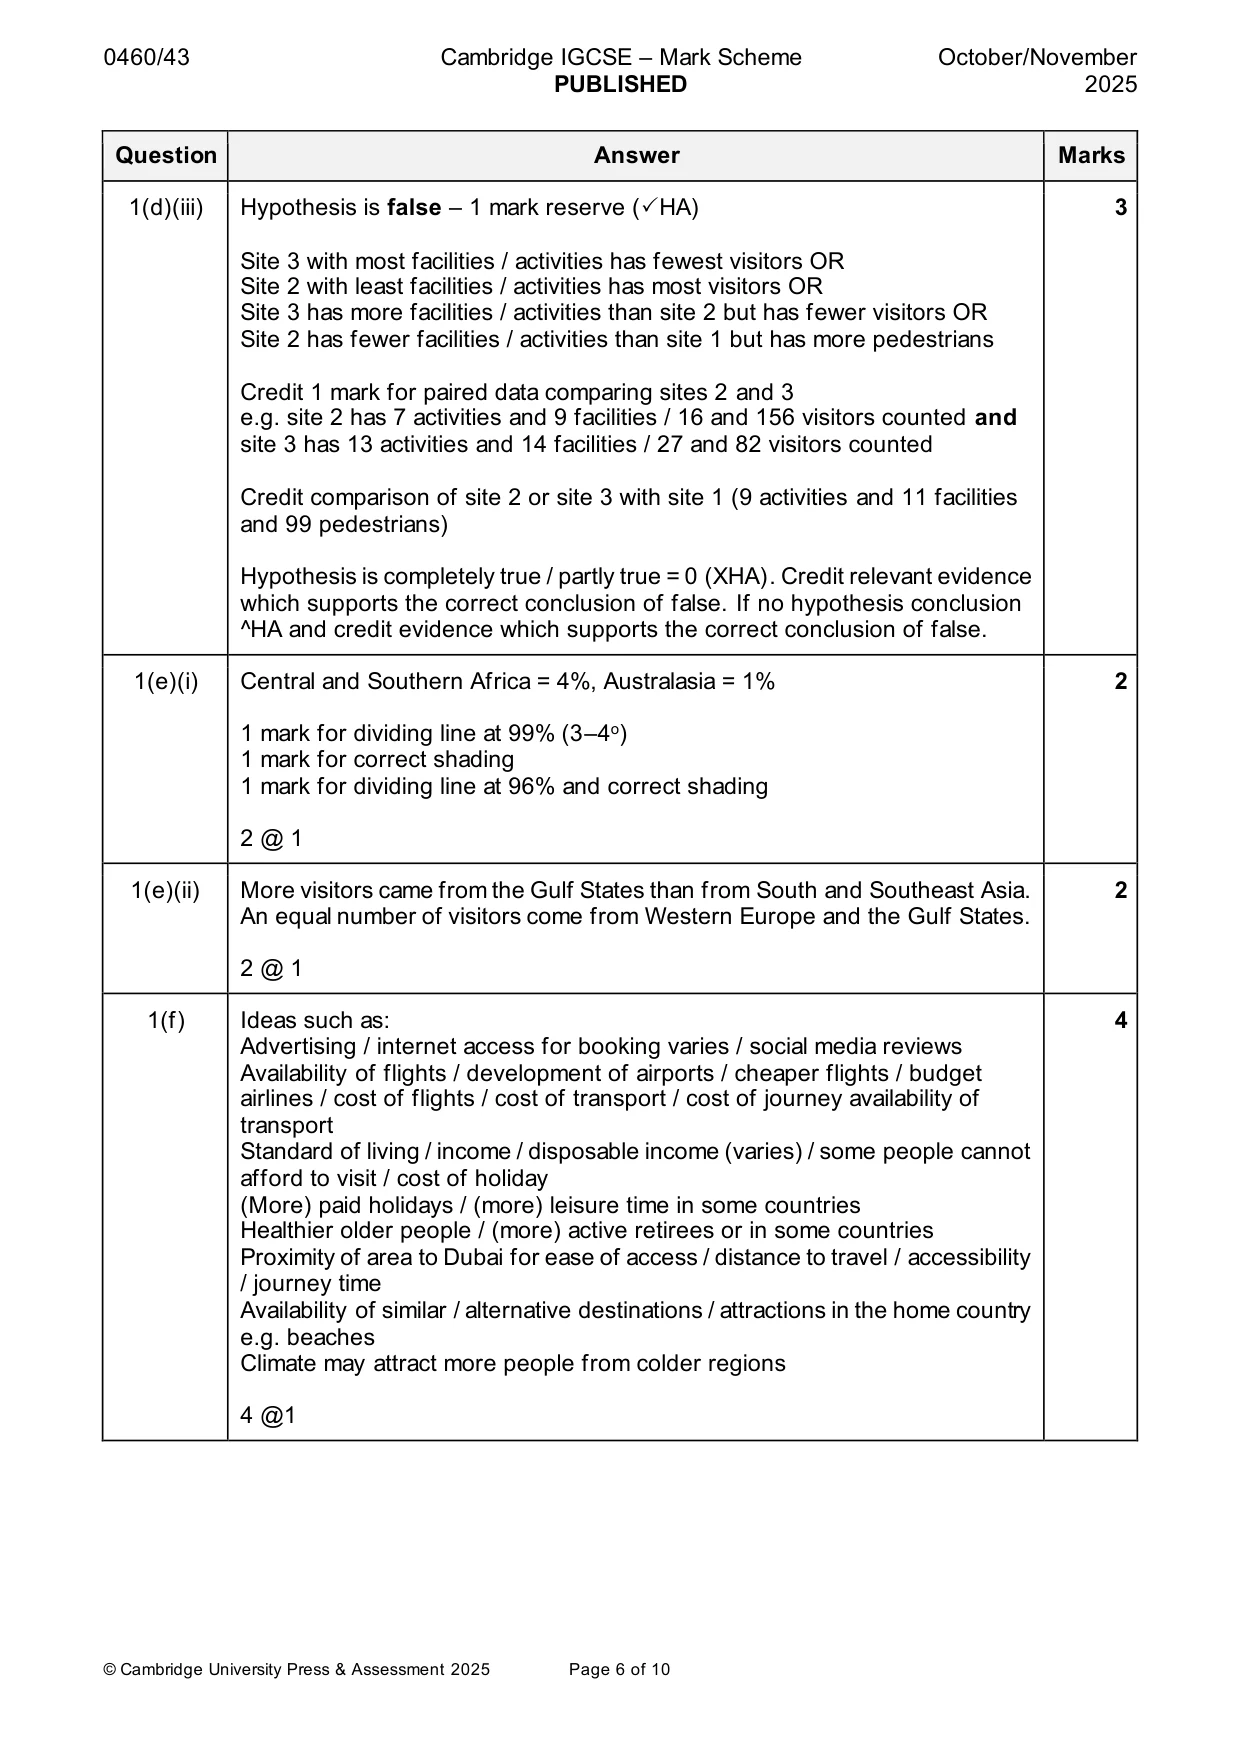
Mark scheme: Question Answer Marks 1(a) Increased between 2010 and 2019 / increased until 2019 3 Decreased 2019 to 2020 (credit decrease in / to / by 2020 if 2019 is already mentioned) Increased 2020 to 2022 / increased from 2020 Overall increase / increase from 2010 to 2022 Note: Answers must refer to change (increase / decrease) No credit for statistics by themselves, if there is no reference to year (e.g. increase – decrease – increase / fluctuating), or for individual years (e.g. highest in 2019 / lowest in 2020 / drop in 2020) 1(b) Ask anybody / next person / no pattern 2 Use random number tables / pick numbers out of a hat to generate order to ask people Example if no. 6 selected ask the 6th person 2 @ 1 1c(i) Horizontal bars 2 Lively atmosphere = 14 Beach is busy = 11 2 @ 1 1(c)(ii) No description to identify each possible score / no explanation of how to 1 choose Decision will be subjective / people will have different standards or opinions or views / have a different understanding of each score People may have visited different parts of the beach 1 @ 1 1(c)(iii) Pictogram 1 1 @ 1 1(c)(iv) Hypothesis is true / correct – 1 mark reserve (HA) 4 1 statement mark Most frequent overall visitor score is 5 or very good / majority or most or over half gave 5 or 4 and 5 / more gave 4/5 than 1/2 1 stat mark (comparative) Credit score of 4/5 compared with score of 1/2 e.g. 22 gave score of 5 but 1 gave score of 2 34 out of 40 gave score of 4 or 5 1 statement mark More positive answers / answers to question 1 / less negative answers More answers about things they like More people had good things to say More people like the beach 1 stat mark 84 positive answers and 45 negative answers Hypothesis is false / partly true = 0 (XHA). Credit relevant evidence which supports the correct conclusion of true. If no hypothesis conclusion ^HA and credit evidence which supports the correct conclusion of true. 1(d)(i) Planning 4 Go to the same places for the morning and afternoon counts Decide on start time and end time OR Decide how long to count (10–30 mins) / count for agreed or decided time Make a recording sheet Recording sheet should include site number / time / day Doing Count each pedestrian as they pass by Tally method / use ‘clicker’ or counter Use watch / stopwatch to time the count 4 @ 1 1(d)(ii) Draw bar at site 3, 10:00 = 34 and 15:00 = 48 2 1 mark for both lines at 34 and 82 1 mark for correct shading Maximum 1 mark if plotted at 48 and 82 and correct shading 2 @ 1 1(d)(iii) Hypothesis is false – 1 mark reserve (HA) 3 Site 3 with most facilities / activities has fewest visitors OR Site 2 with least facilities / activities has most visitors OR Site 3 has more facilities / activities than site 2 but has fewer visitors OR Site 2 has fewer facilities / activities than site 1 but has more pedestrians Credit 1 mark for paired data comparing sites 2 and 3 e.g. site 2 has 7 activities and 9 facilities / 16 and 156 visitors counted and site 3 has 13 activities and 14 facilities / 27 and 82 visitors counted Credit comparison of site 2 or site 3 with site 1 (9 activities and 11 facilities and 99 pedestrians) Hypothesis is completely true / partly true = 0 (XHA). Credit relevant evidence which supports the correct conclusion of false. If no hypothesis conclusion ^HA and credit evidence which supports the correct conclusion of false. 1(e)(i) Central and Southern Africa = 4%, Australasia = 1% 2 1 mark for dividing line at 99% (3–4o) 1 mark for correct shading 1 mark for dividing line at 96% and correct shading 2 @ 1 1(e)(ii) More visitors came from the Gulf States than from South and Southeast Asia. 2 An equal number of visitors come from Western Europe and the Gulf States. 2 @ 1 1(f) Ideas such as: 4 Advertising / internet access for booking varies / social media reviews Availability of flights / development of airports / cheaper flights / budget airlines / cost of flights / cost of transport / cost of journey availability of transport Standard of living / income / disposable income (varies) / some people cannot afford to visit / cost of holiday (More) paid holidays / (more) leisure time in some countries Healthier older people / (more) active retirees or in some countries Proximity of area to Dubai for ease of access / distance to travel / accessibility / journey time Availability of similar / alternative destinations / attractions in the home country e.g. beaches Climate may attract more people from colder regions 4 @1
Q2 · Students at a school in the UK did fieldwork on a local river
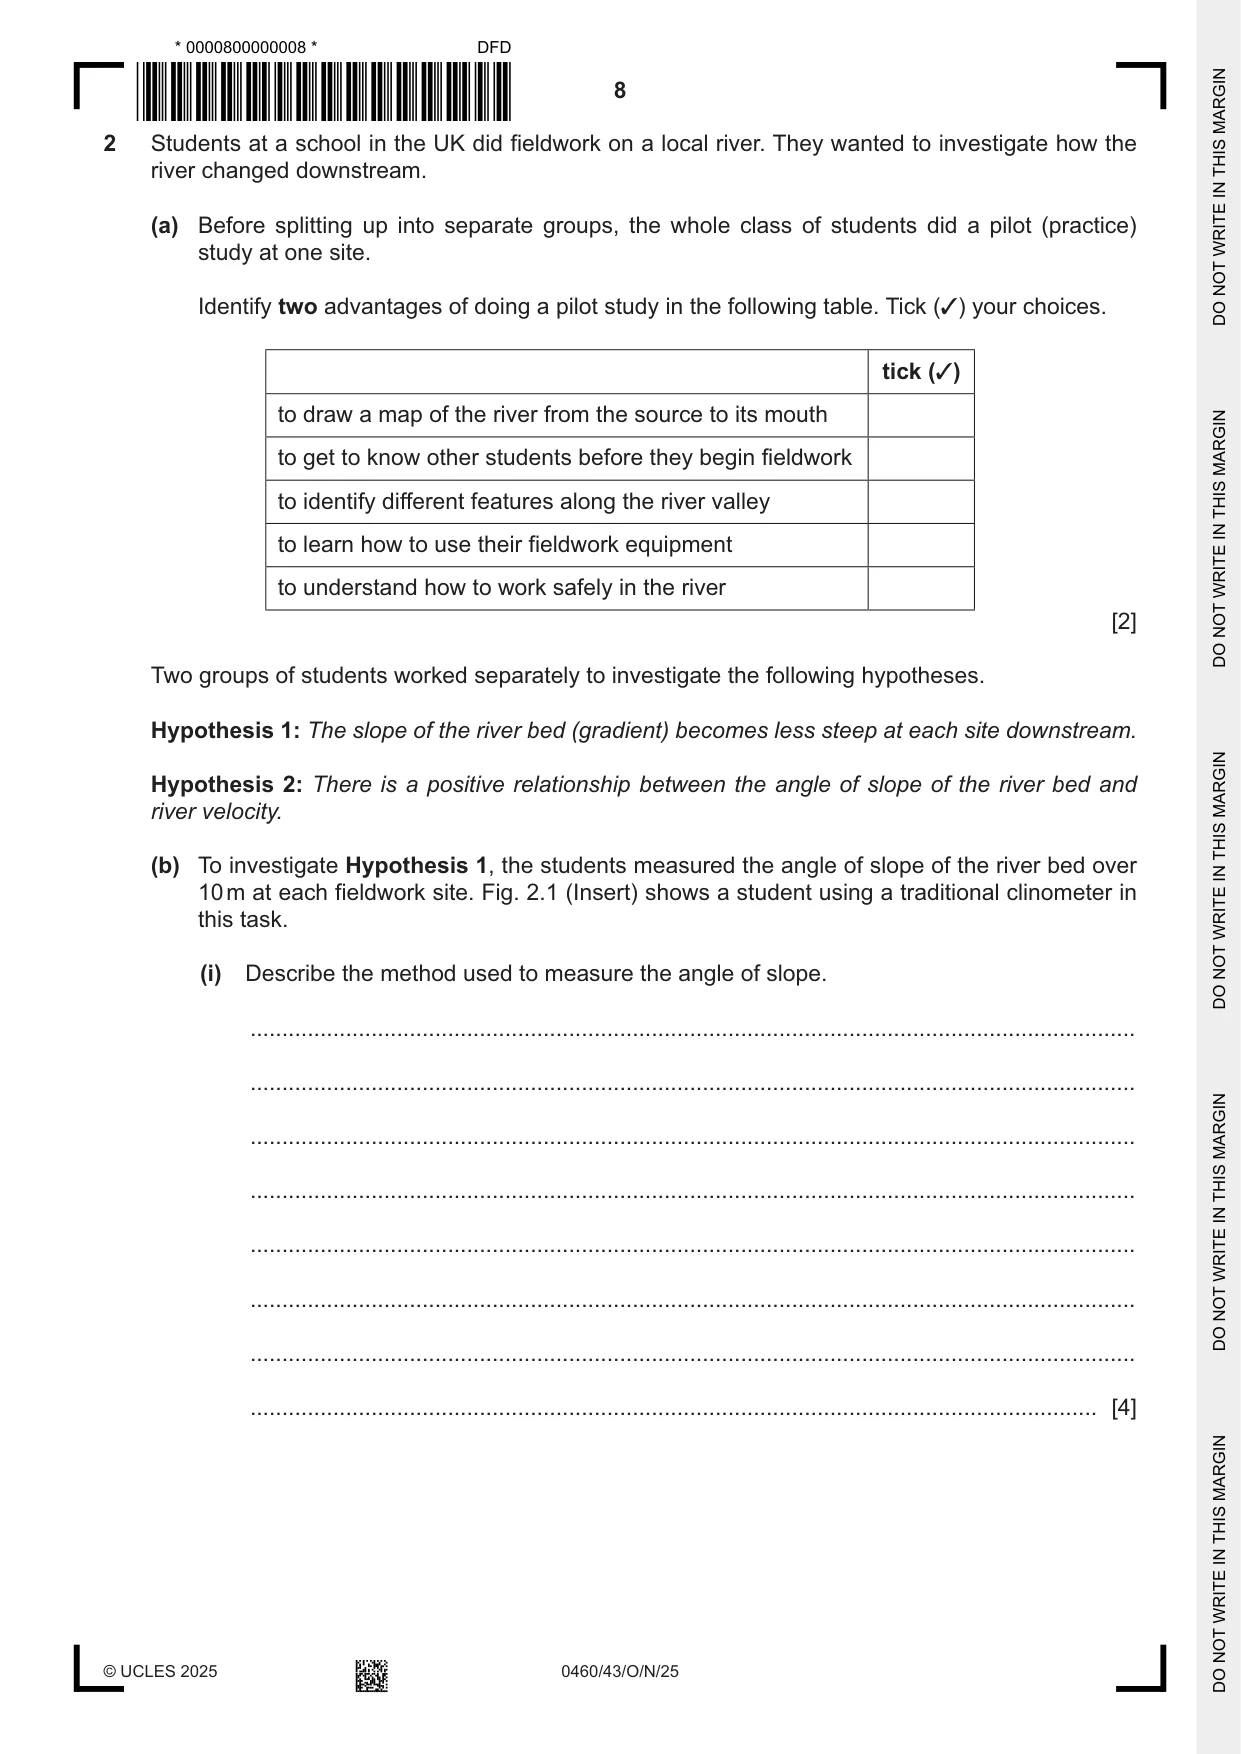
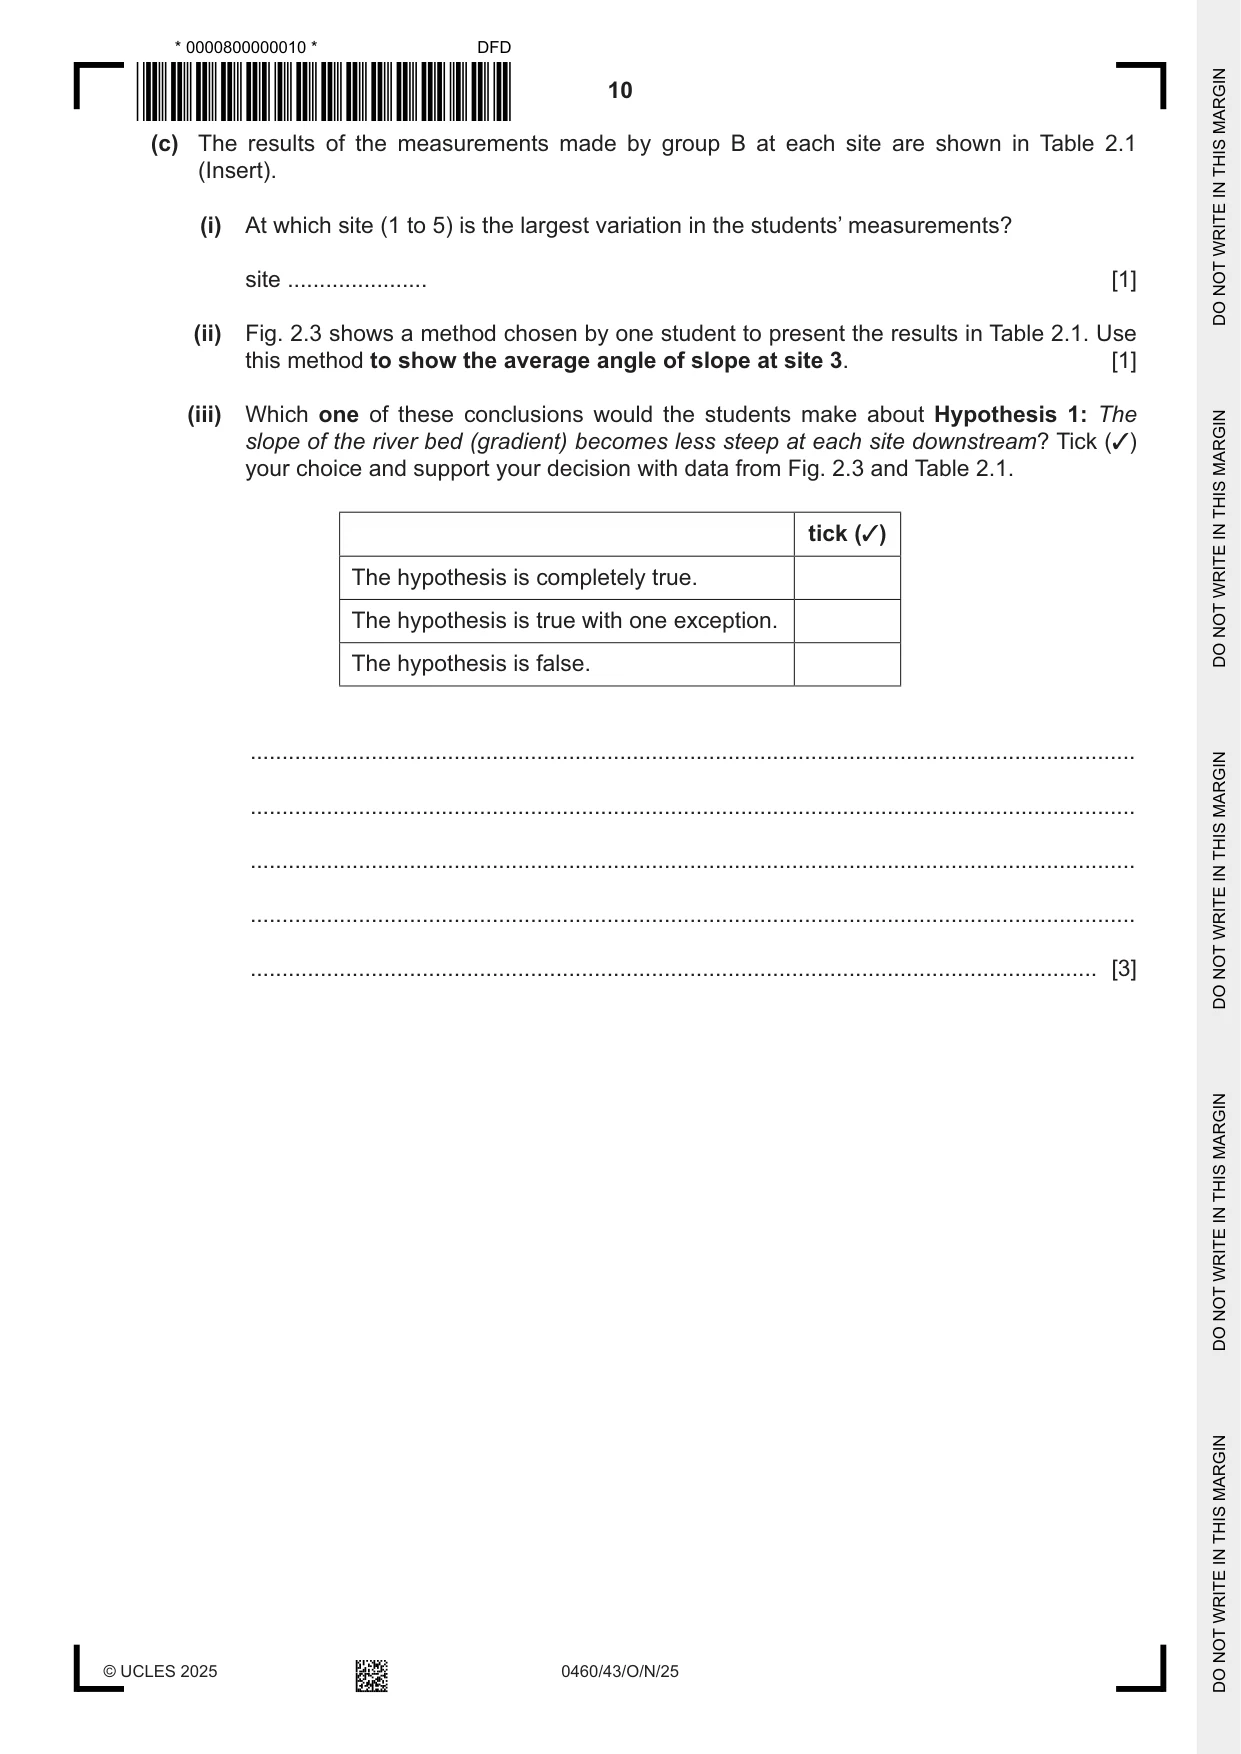
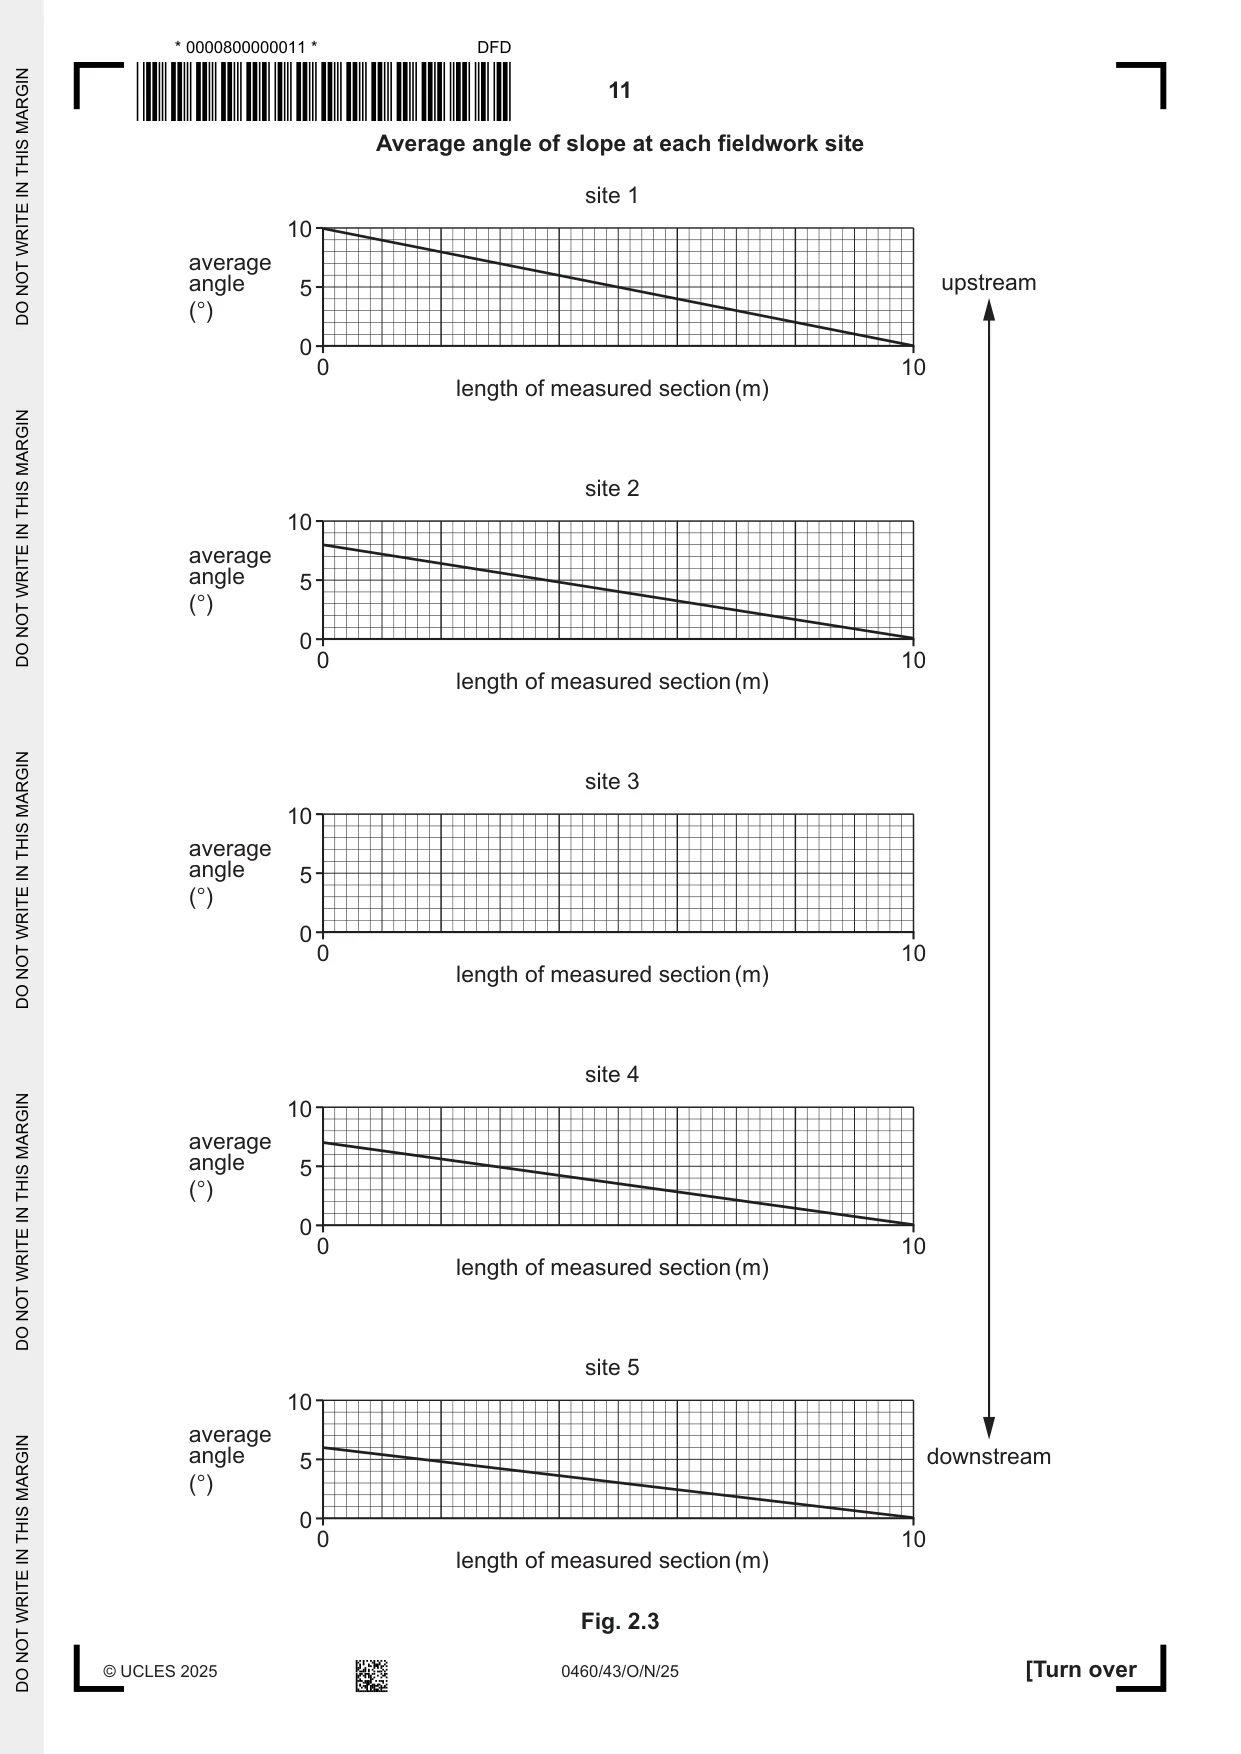
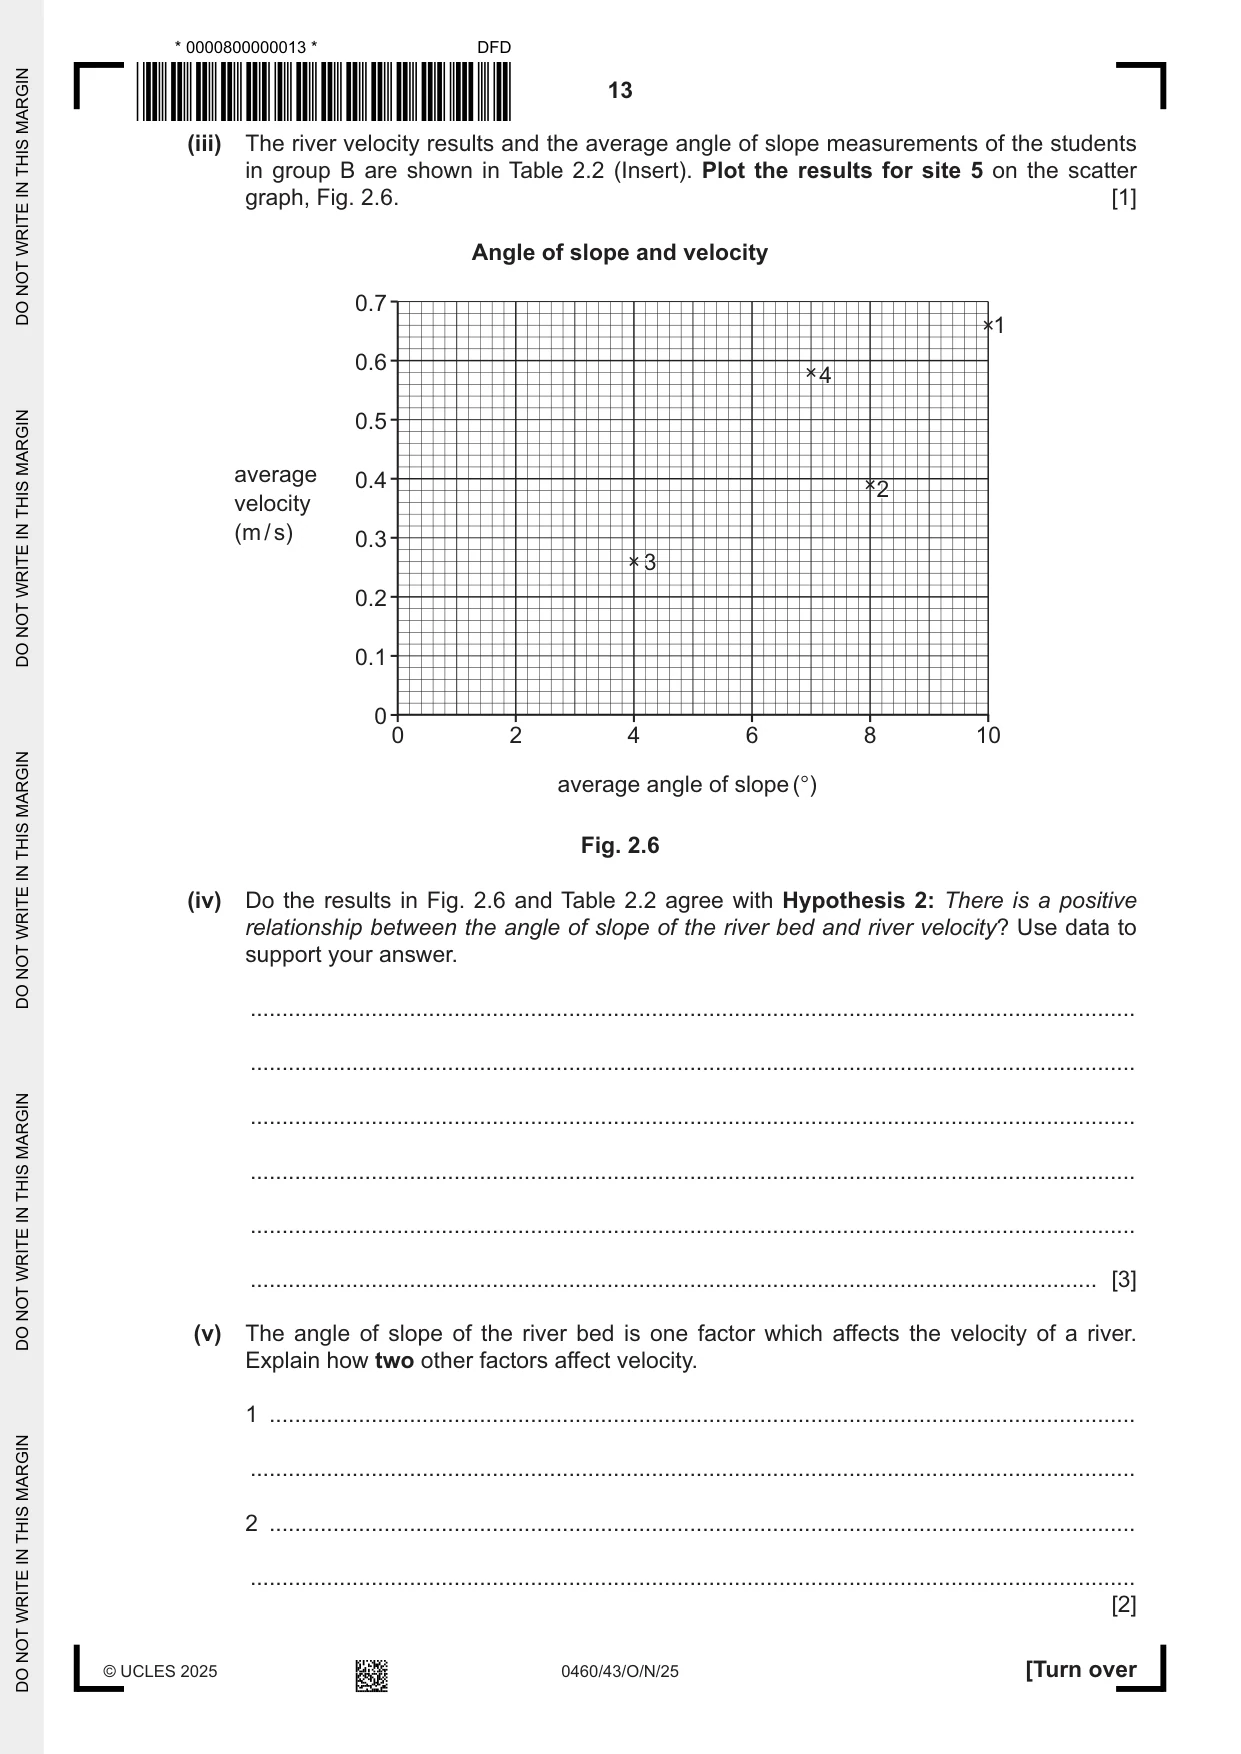
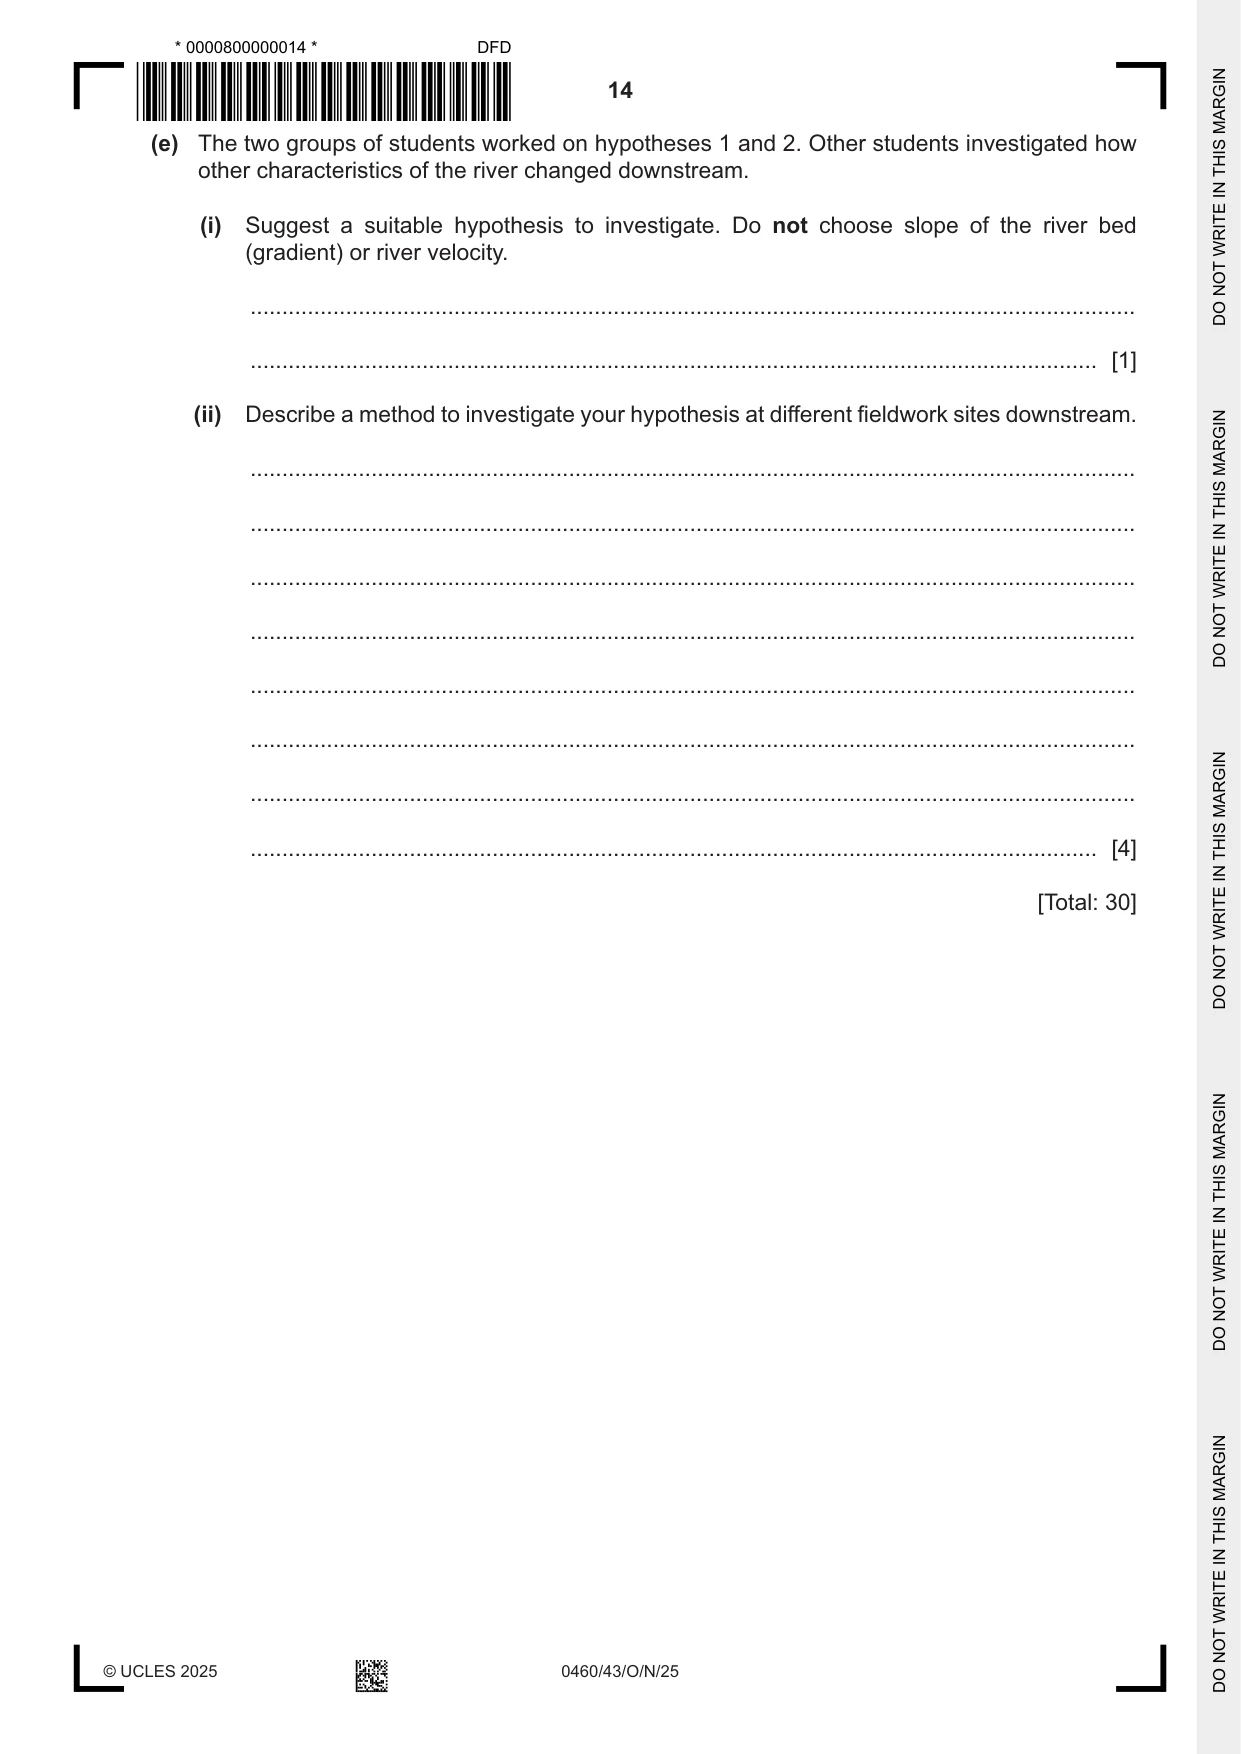
2 Students at a school in the UK did fieldwork on a local river. They wanted to investigate how the river changed downstream. (a) Before splitting up into separate groups, the whole class of students did a pilot (practice) study at one site. Identify two advantages of doing a pilot study in the following table. Tick (✓) your choices. tick (✓) to draw a map of the river from the source to its mouth to get to know other students before they begin fieldwork to identify different features along the river valley to learn how to use their fieldwork equipment to understand how to work safely in the river [2] Two groups of students worked separately to investigate the following hypotheses. Hypothesis 1: The slope of the river bed (gradient) becomes less steep at each site downstream. Hypothesis 2: There is a positive relationship between the angle of slope of the river bed and river velocity. (b) To investigate Hypothesis 1, the students measured the angle of slope of the river bed over 10 m at each fieldwork site. Fig. 2.1 (Insert) shows a student using a traditional clinometer in this task. (i) Describe the method used to measure the angle of slope. ........................................................................................................................................... ........................................................................................................................................... ........................................................................................................................................... ........................................................................................................................................... ........................................................................................................................................... ........................................................................................................................................... ........................................................................................................................................... ..................................................................................................................................... [4] (ii) One group of students (group A) made one measurement at each site and the other group (group B) made four measurements. Give one reason why group B’s results would be more reliable. ........................................................................................................................................... ..................................................................................................................................... [1] (iii) One student in group B then used a digital clinometer ‘app’ on their mobile phone to check the accuracy of some measurements. The digital clinometer is shown in Fig. 2.2 (Insert). Suggest two advantages of a digital clinometer compared with the traditional clinometer shown in Fig. 2.1. 1 ........................................................................................................................................ ........................................................................................................................................... 2 ........................................................................................................................................ ........................................................................................................................................... [2] (c) The results of the measurements made by group B at each site are shown in Table 2.1 (Insert). (i) At which site (1 to 5) is the largest variation in the students’ measurements? site ...................... [1] (ii) Fig. 2.3 shows a method chosen by one student to present the results in Table 2.1. Use this method to show the average angle of slope at site 3. [1] (iii) Which one of these conclusions would the students make about Hypothesis 1: The slope of the river bed (gradient) becomes less steep at each site downstream? Tick (✓) your choice and support your decision with data from Fig. 2.3 and Table 2.1. tick (✓) The hypothesis is completely true. The hypothesis is true with one exception. The hypothesis is false. ........................................................................................................................................... ........................................................................................................................................... ........................................................................................................................................... ........................................................................................................................................... ..................................................................................................................................... [3]
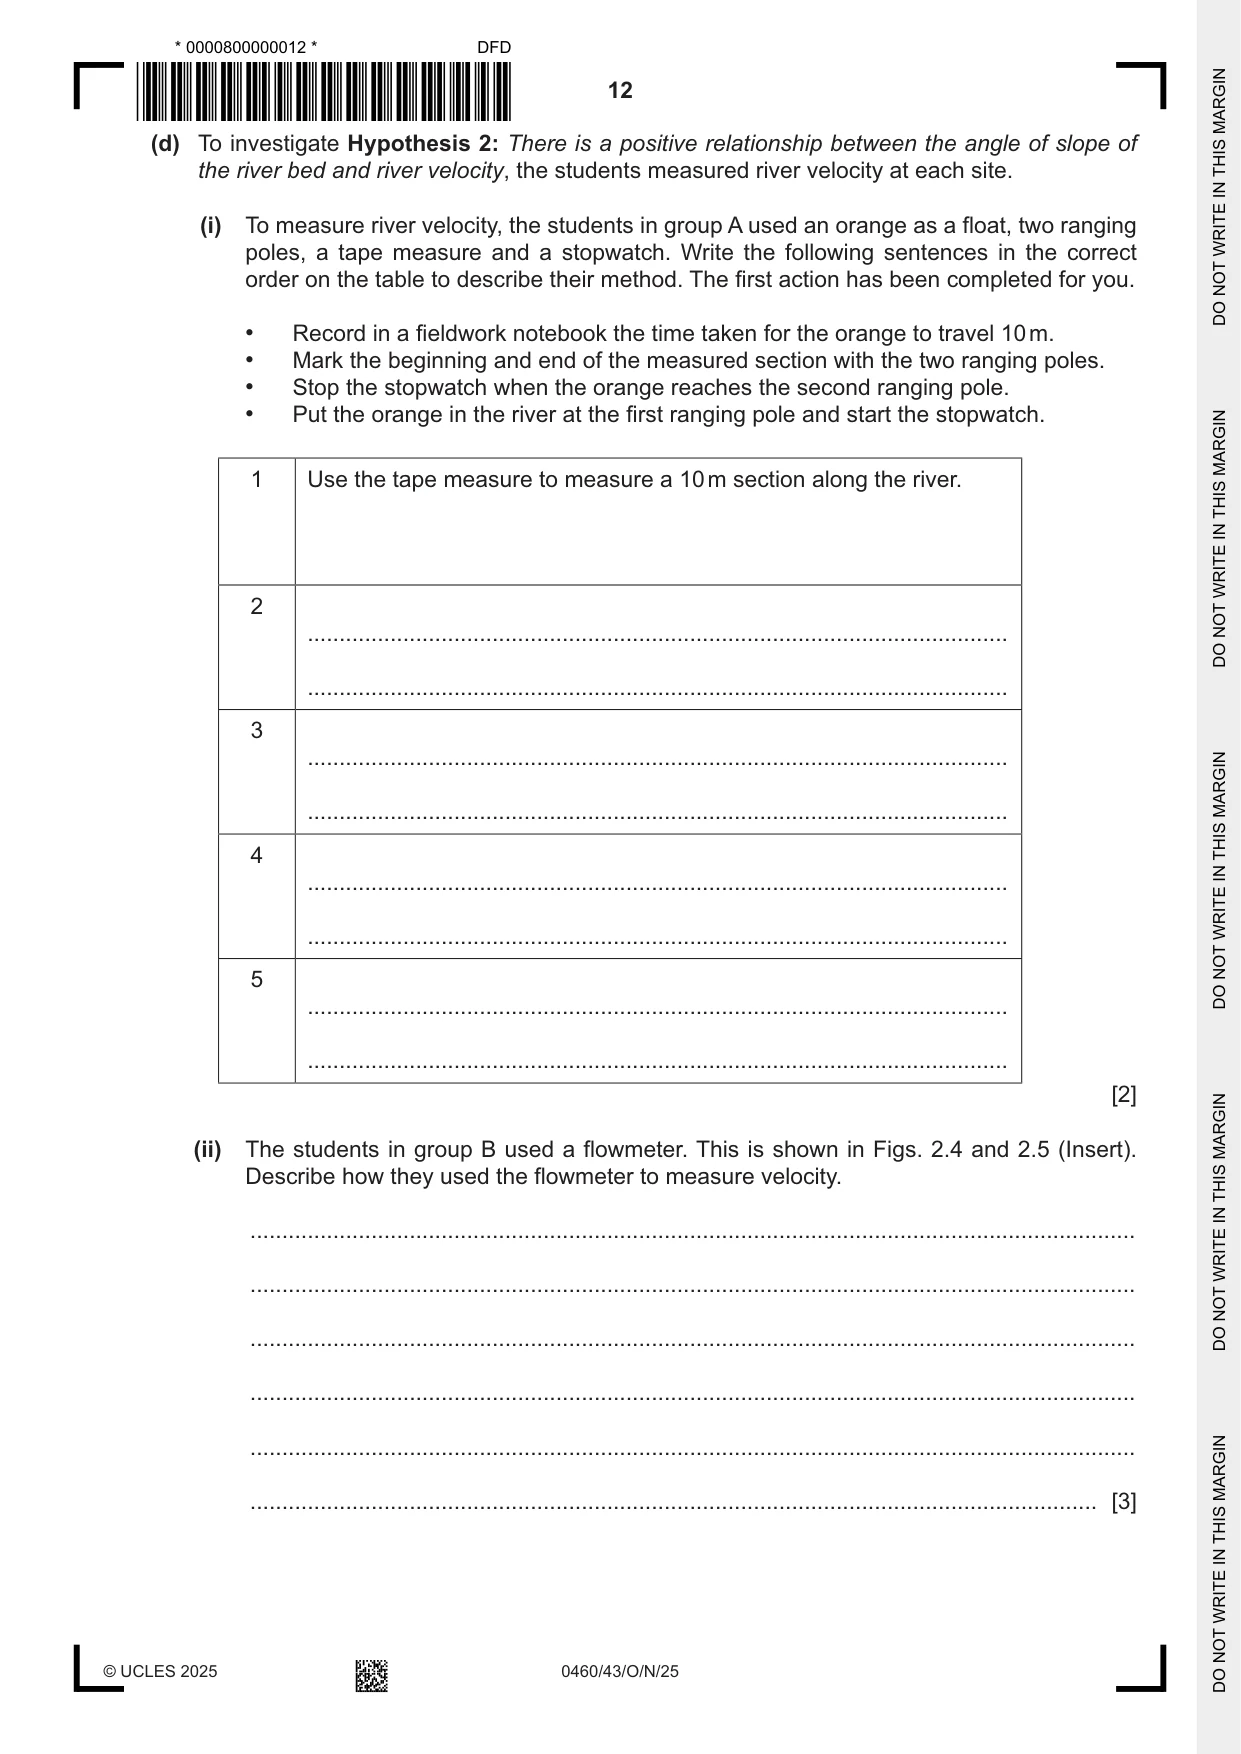
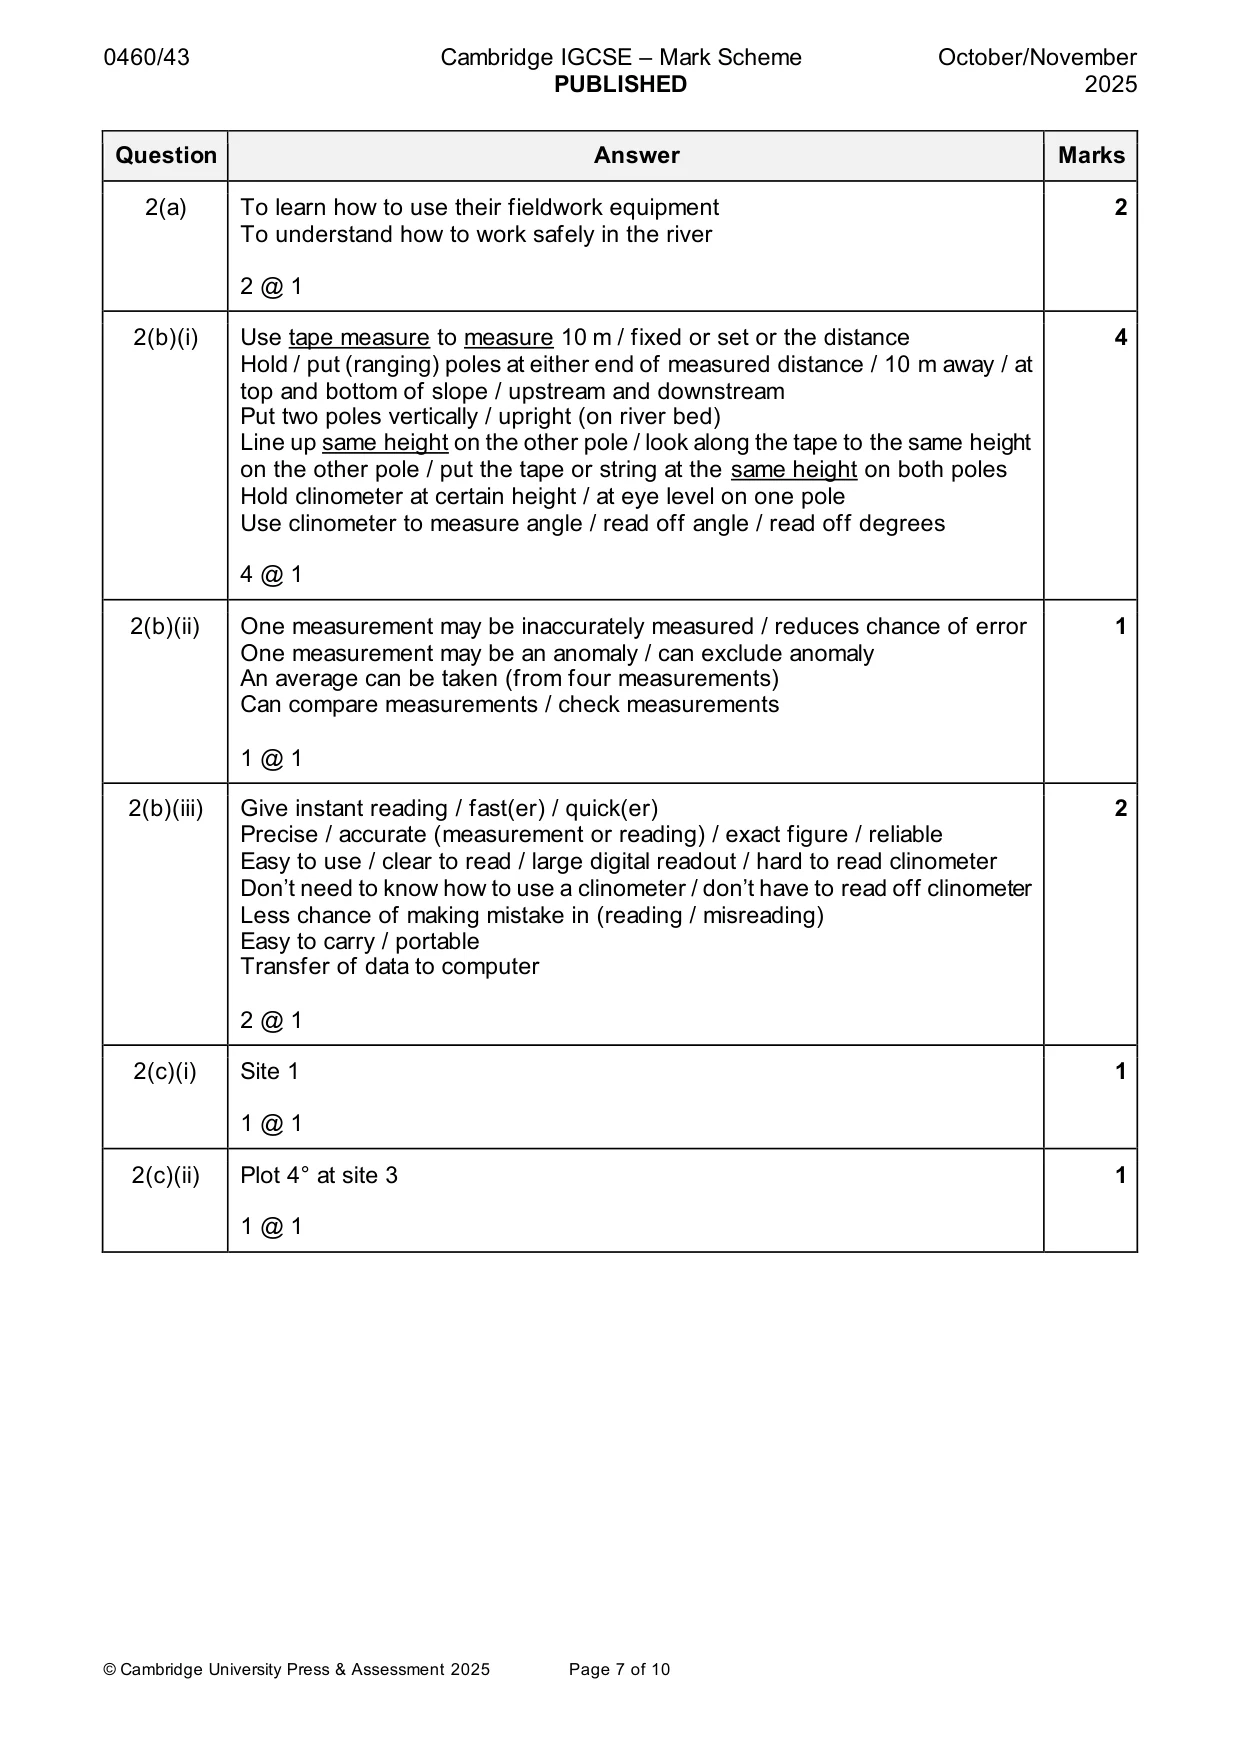
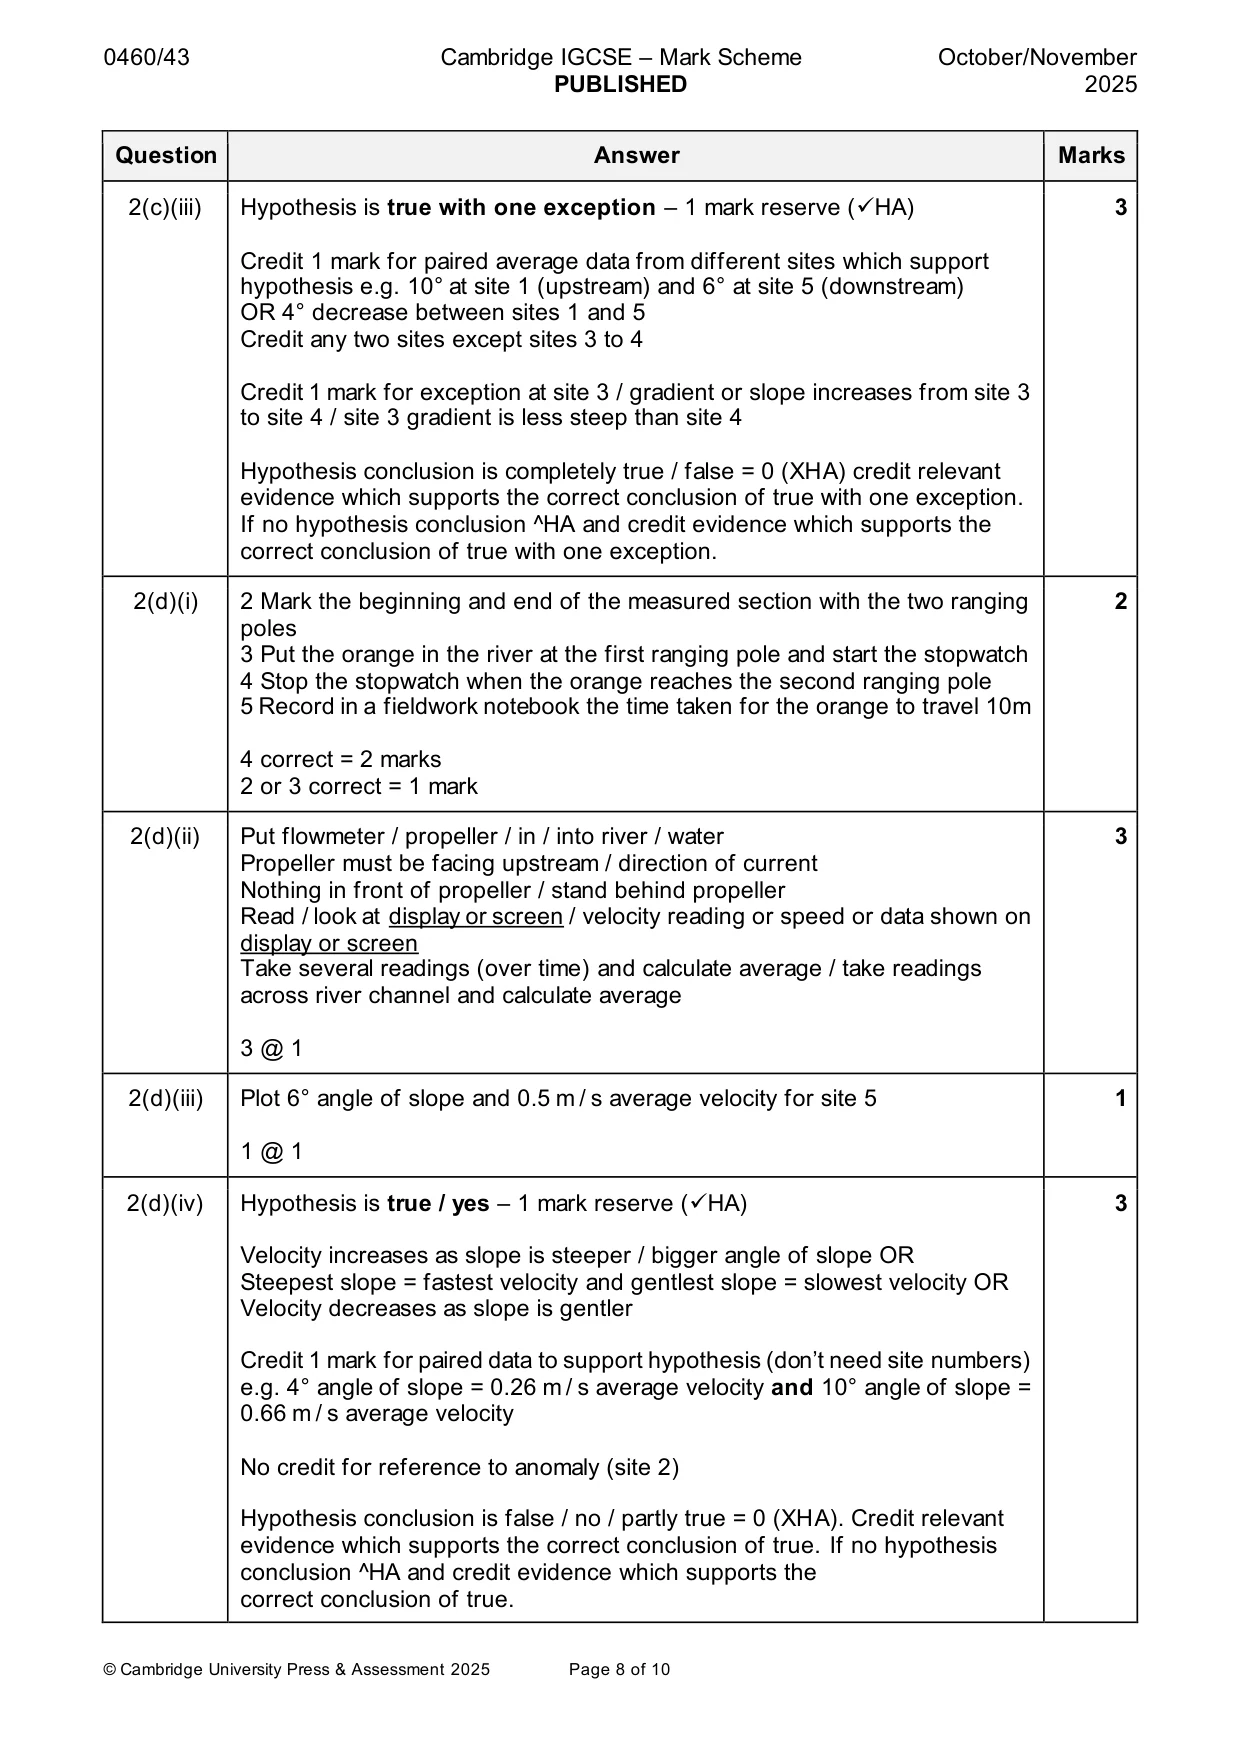
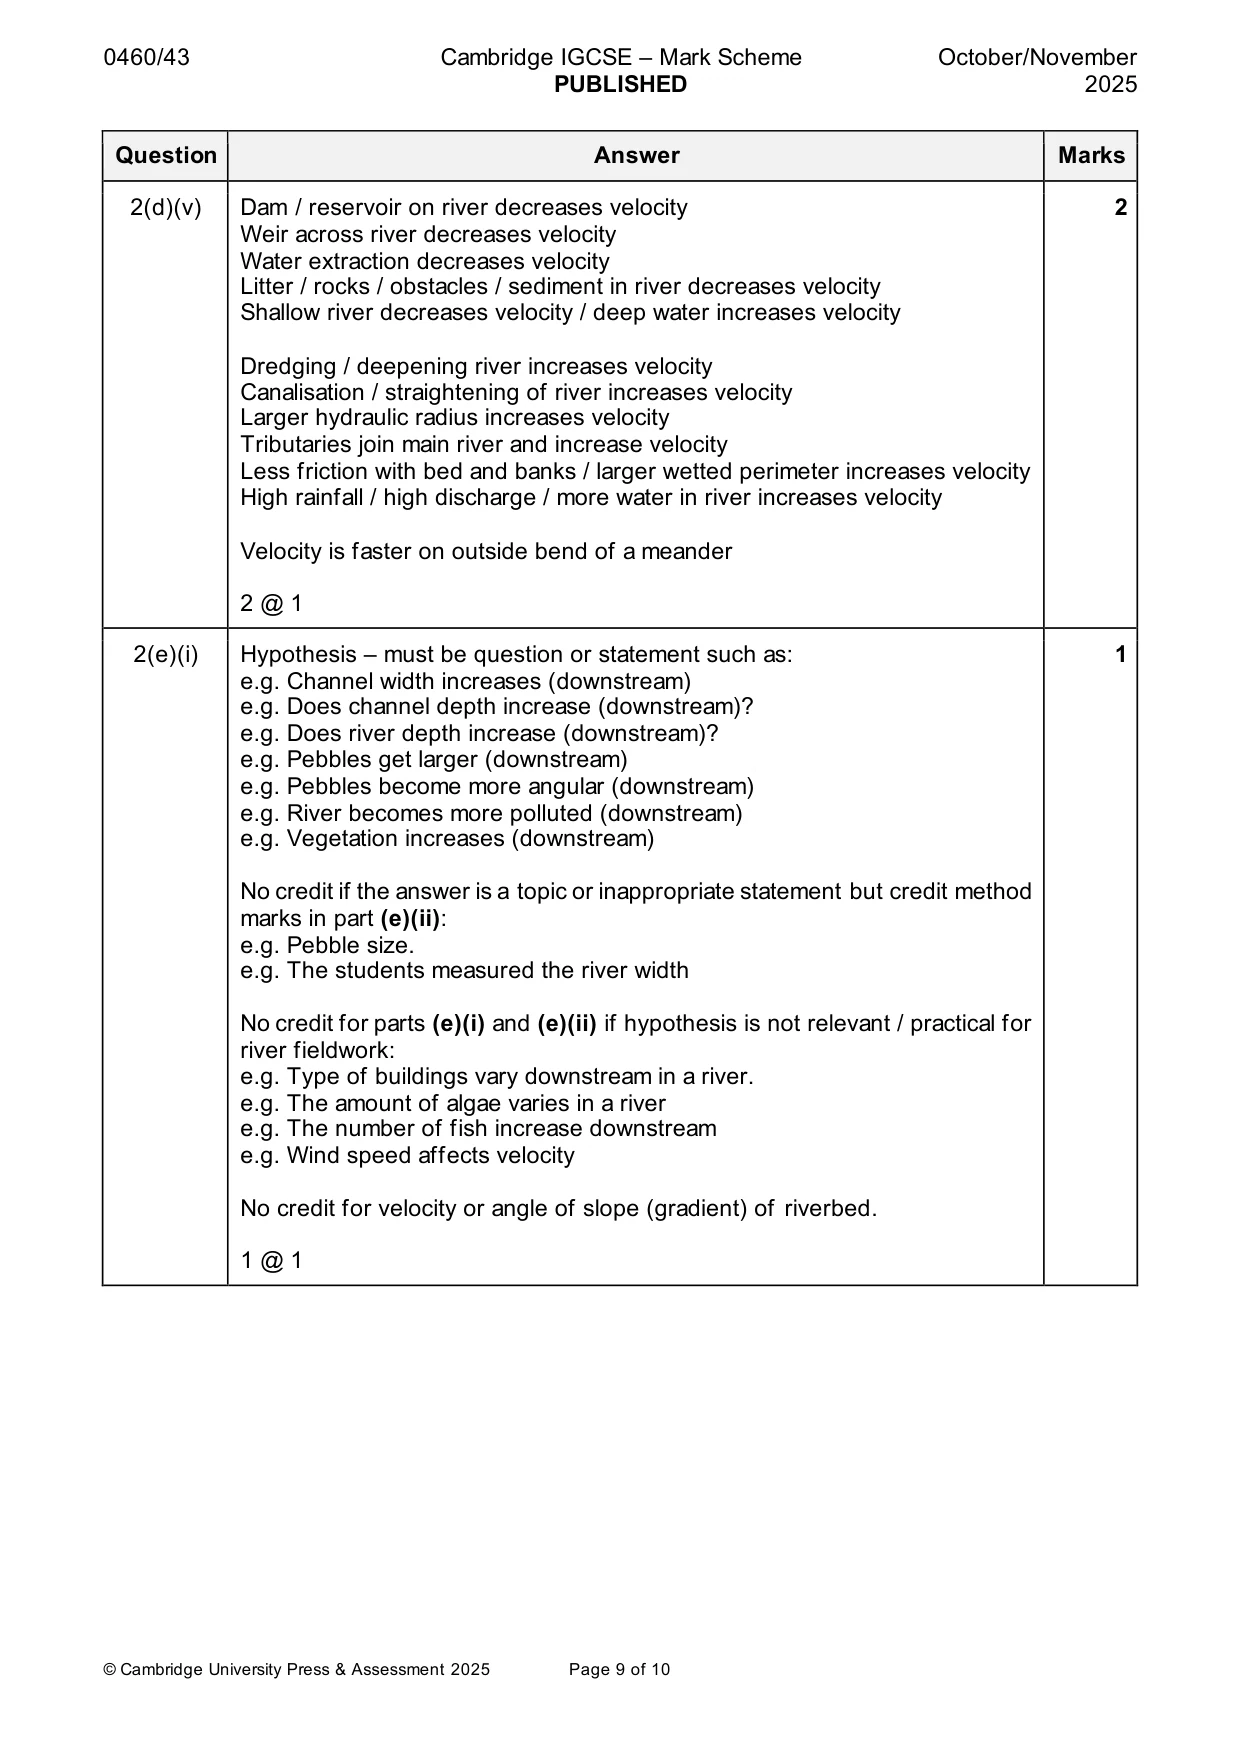
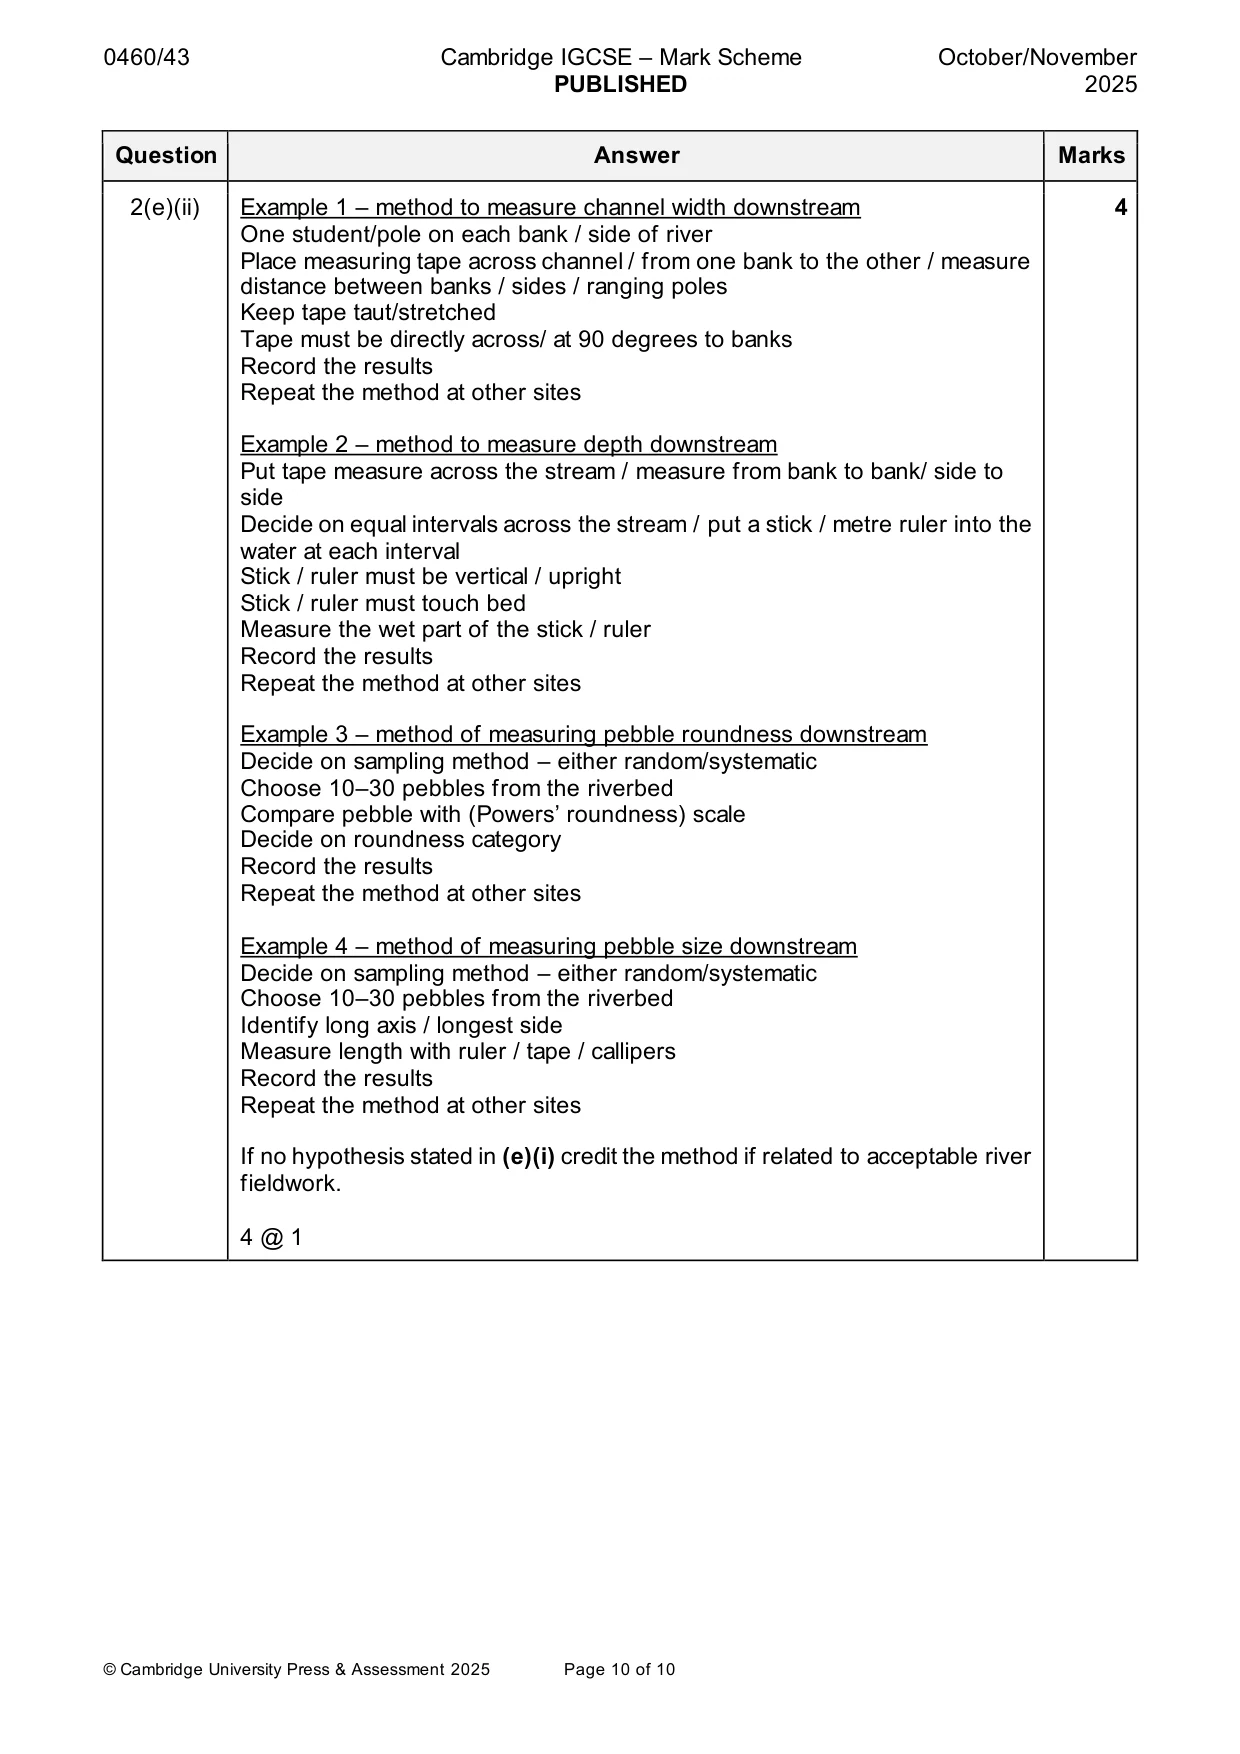
Mark scheme: 2(a) To learn how to use their fieldwork equipment 2 To understand how to work safely in the river 2 @ 1 2(b)(i) Use tape measure to measure 10 m / fixed or set or the distance 4 Hold / put (ranging) poles at either end of measured distance / 10 m away / at top and bottom of slope / upstream and downstream Put two poles vertically / upright (on river bed) Line up same height on the other pole / look along the tape to the same height on the other pole / put the tape or string at the same height on both poles Hold clinometer at certain height / at eye level on one pole Use clinometer to measure angle / read off angle / read off degrees 4 @ 1 2(b)(ii) One measurement may be inaccurately measured / reduces chance of error 1 One measurement may be an anomaly / can exclude anomaly An average can be taken (from four measurements) Can compare measurements / check measurements 1 @ 1 2(b)(iii) Give instant reading / fast(er) / quick(er) 2 Precise / accurate (measurement or reading) / exact figure / reliable Easy to use / clear to read / large digital readout / hard to read clinometer Don’t need to know how to use a clinometer / don’t have to read off clinometer Less chance of making mistake in (reading / misreading) Easy to carry / portable Transfer of data to computer 2 @ 1 2(c)(i) Site 1 1 1 @ 1 2(c)(ii) Plot 4° at site 3 1 1 @ 1 2(c)(iii) Hypothesis is true with one exception – 1 mark reserve (✓HA) 3 Credit 1 mark for paired average data from different sites which support hypothesis e.g. 10° at site 1 (upstream) and 6° at site 5 (downstream) OR 4° decrease between sites 1 and 5 Credit any two sites except sites 3 to 4 Credit 1 mark for exception at site 3 / gradient or slope increases from site 3 to site 4 / site 3 gradient is less steep than site 4 Hypothesis conclusion is completely true / false = 0 (XHA) credit relevant evidence which supports the correct conclusion of true with one exception. If no hypothesis conclusion ^HA and credit evidence which supports the correct conclusion of true with one exception. 2(d)(i) 2 Mark the beginning and end of the measured section with the two ranging 2 poles 3 Put the orange in the river at the first ranging pole and start the stopwatch 4 Stop the stopwatch when the orange reaches the second ranging pole 5 Record in a fieldwork notebook the time taken for the orange to travel 10m 4 correct = 2 marks 2 or 3 correct = 1 mark 2(d)(ii) Put flowmeter / propeller / in / into river / water 3 Propeller must be facing upstream / direction of current Nothing in front of propeller / stand behind propeller Read / look at display or screen / velocity reading or speed or data shown on display or screen Take several readings (over time) and calculate average / take readings across river channel and calculate average 3 @ 1 2(d)(iii) Plot 6° angle of slope and 0.5 m / s average velocity for site 5 1 1 @ 1 2(d)(iv) Hypothesis is true / yes – 1 mark reserve (✓HA) 3 Velocity increases as slope is steeper / bigger angle of slope OR Steepest slope = fastest velocity and gentlest slope = slowest velocity OR Velocity decreases as slope is gentler Credit 1 mark for paired data to support hypothesis (don’t need site numbers) e.g. 4° angle of slope = 0.26 m / s average velocity and 10° angle of slope = 0.66 m / s average velocity No credit for reference to anomaly (site 2) Hypothesis conclusion is false / no / partly true = 0 (XHA). Credit relevant evidence which supports the correct conclusion of true. If no hypothesis conclusion ^HA and credit evidence which supports the correct conclusion of true. 2(d)(v) Dam / reservoir on river decreases velocity 2 Weir across river decreases velocity Water extraction decreases velocity Litter / rocks / obstacles / sediment in river decreases velocity Shallow river decreases velocity / deep water increases velocity Dredging / deepening river increases velocity Canalisation / straightening of river increases velocity Larger hydraulic radius increases velocity Tributaries join main river and increase velocity Less friction with bed and banks / larger wetted perimeter increases velocity High rainfall / high discharge / more water in river increases velocity Velocity is faster on outside bend of a meander 2 @ 1 2(e)(i) Hypothesis – must be question or statement such as: 1 e.g. Channel width increases (downstream) e.g. Does channel depth increase (downstream)? e.g. Does river depth increase (downstream)? e.g. Pebbles get larger (downstream) e.g. Pebbles become more angular (downstream) e.g. River becomes more polluted (downstream) e.g. Vegetation increases (downstream) No credit if the answer is a topic or inappropriate statement but credit method marks in part (e)(ii): e.g. Pebble size. e.g. The students measured the river width No credit for parts (e)(i) and (e)(ii) if hypothesis is not relevant / practical for river fieldwork: e.g. Type of buildings vary downstream in a river. e.g. The amount of algae varies in a river e.g. The number of fish increase downstream e.g. Wind speed affects velocity No credit for velocity or angle of slope (gradient) of riverbed. 1 @ 1 2(e)(ii) Example 1 – method to measure channel width downstream 4 One student/pole on each bank / side of river Place measuring tape across channel / from one bank to the other / measure distance between banks / sides / ranging poles Keep tape taut/stretched Tape must be directly across/ at 90 degrees to banks Record the results Repeat the method at other sites Example 2 – method to measure depth downstream Put tape measure across the stream / measure from bank to bank/ side to side Decide on equal intervals across the stream / put a stick / metre ruler into the water at each interval Stick / ruler must be vertical / upright Stick / ruler must touch bed Measure the wet part of the stick / ruler Record the results Repeat the method at other sites Example 3 – method of measuring pebble roundness downstream Decide on sampling method – either random/systematic Choose 10–30 pebbles from the riverbed Compare pebble with (Powers’ roundness) scale Decide on roundness category Record the results Repeat the method at other sites Example 4 – method of measuring pebble size downstream Decide on sampling method – either random/systematic Choose 10–30 pebbles from the riverbed Identify long axis / longest side Measure length with ruler / tape / callipers Record the results Repeat the method at other sites If no hypothesis stated in (e)(i) credit the method if related to acceptable river fieldwork. 4 @ 1
What was in this paper
The subtopics covered by these 2 questions, and how many questions each got. Open one in a new tab to see every Cambridge question on it.
What you needed in this session
Cambridge’s own grade thresholds for 2025 Oct/Nov, Paper 4 · Variant 3. A higher threshold means an easier paper — the bar moves with how the cohort did.