Cambridge IGCSE Geography 0460 — 2025 Oct/Nov Paper 4 · Variant 1
0460/41/O/N/25 · 2 questions · 60 marks · 90 min
The question paper and its mark scheme, free to read here and free to download. This is Cambridge’s own paper, exactly as it was sat.
Question paper20 pages


Mark scheme10 pages
Answers below. Sit the paper first if you are practising.
Questions as text
Q1 · Students in Bangkok, Thailand (a country in Asia), investigated how land use and quality…
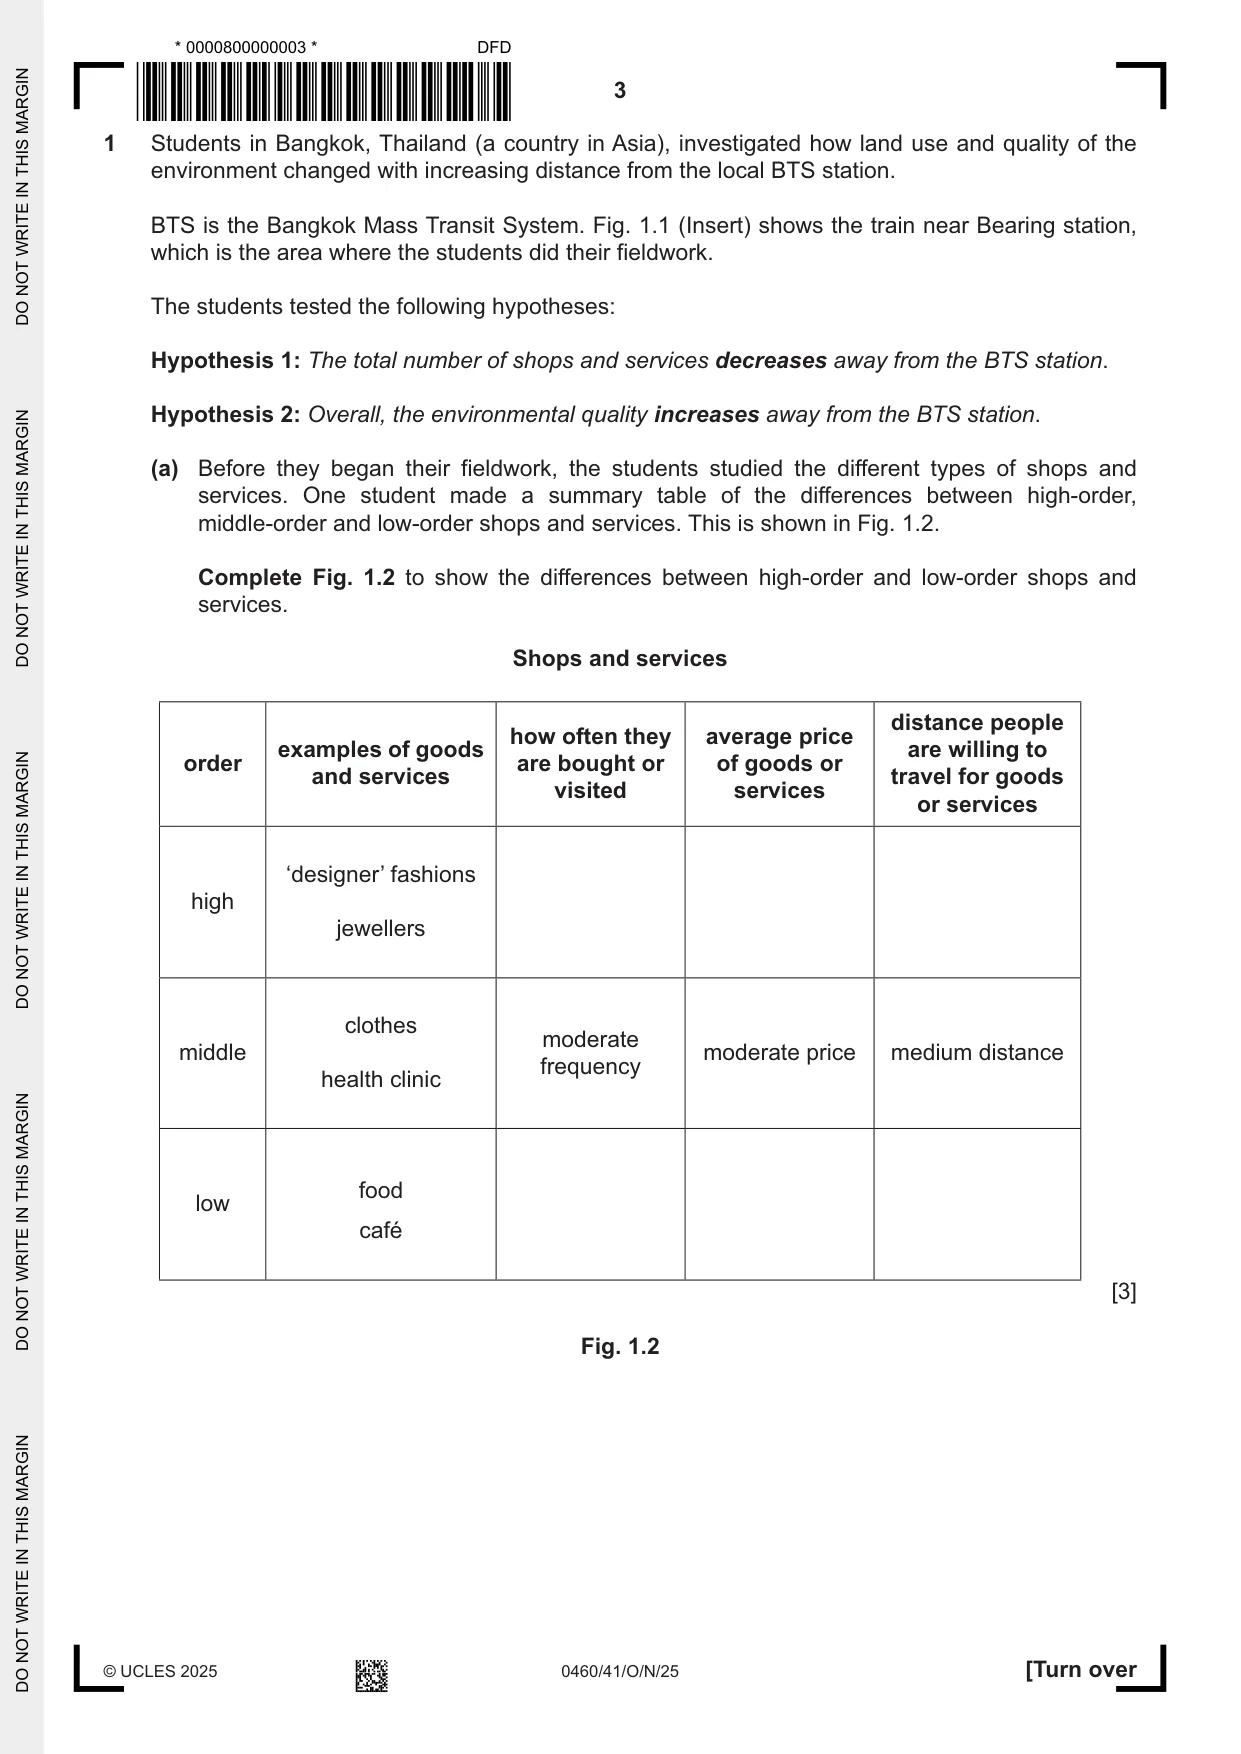
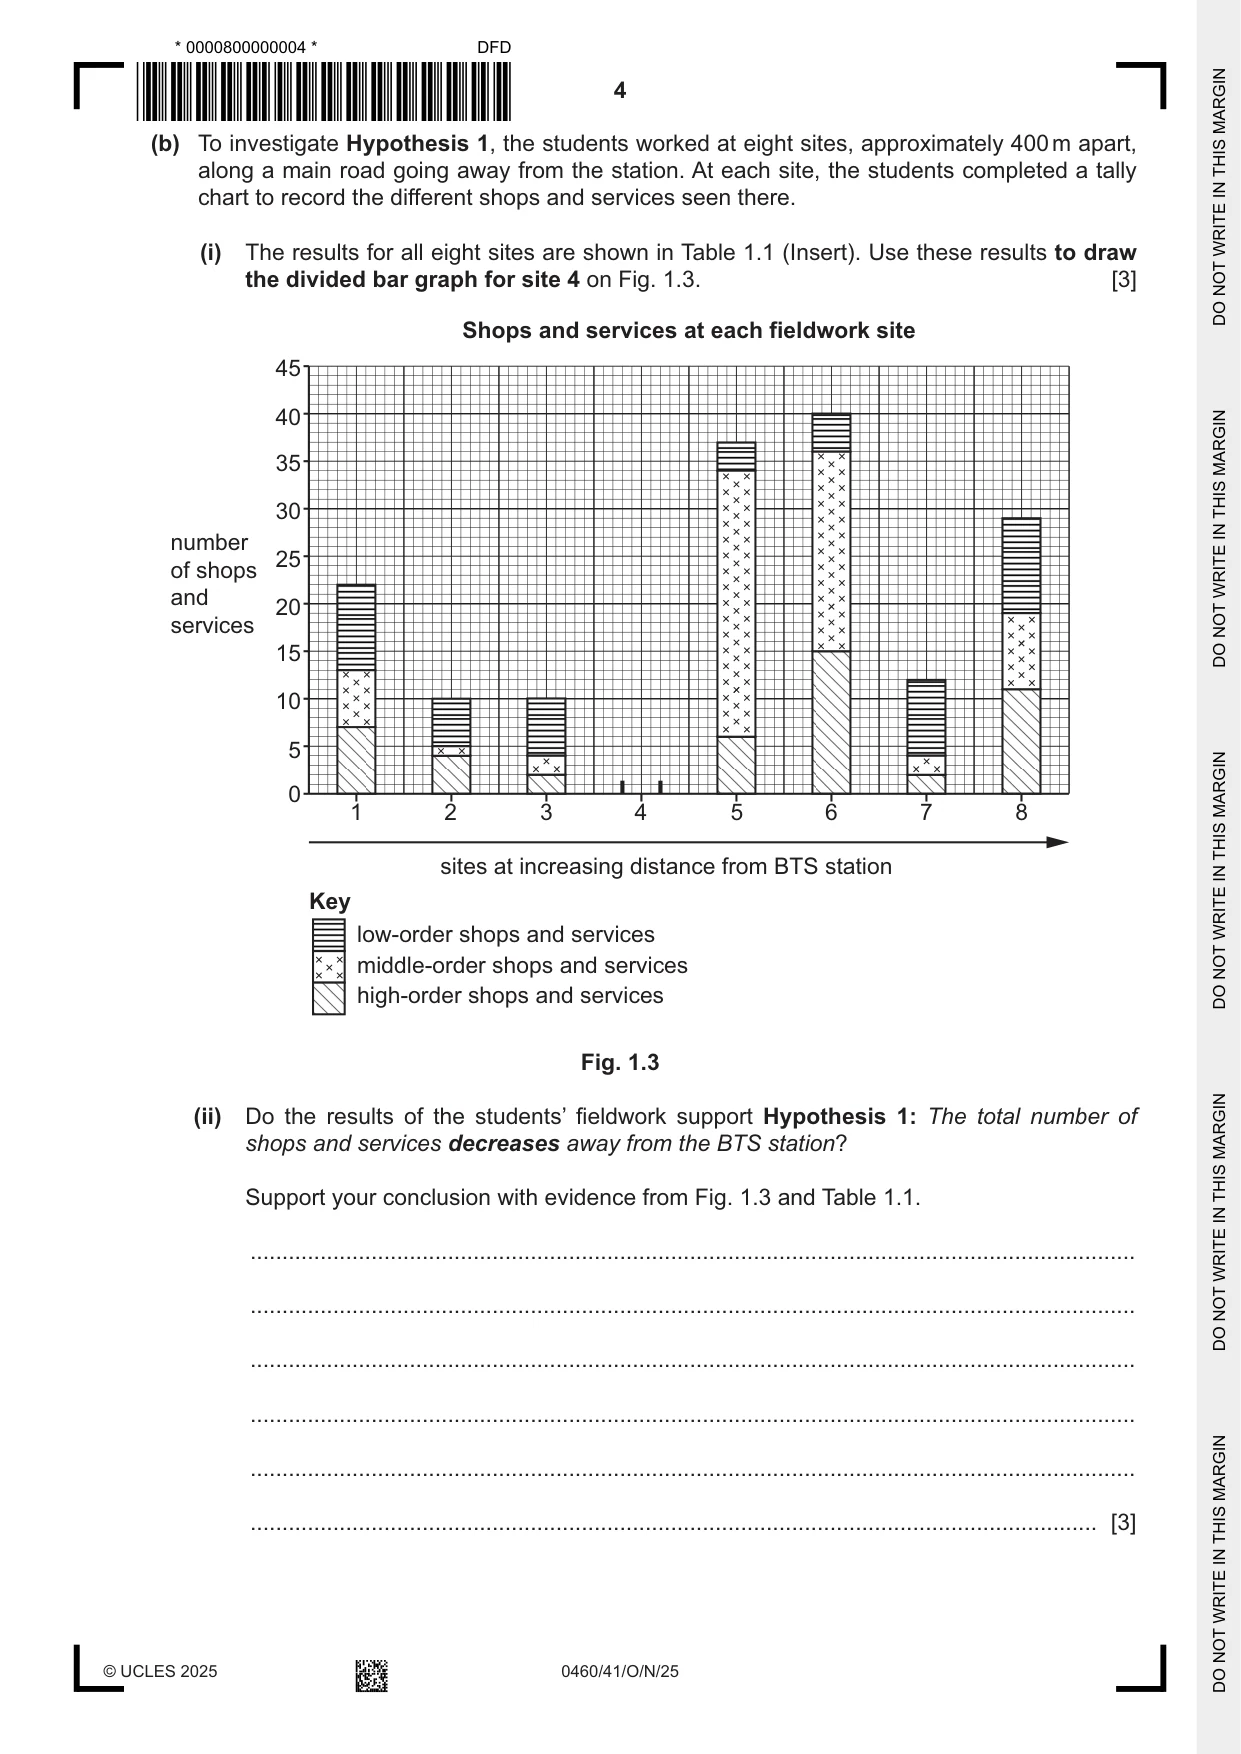
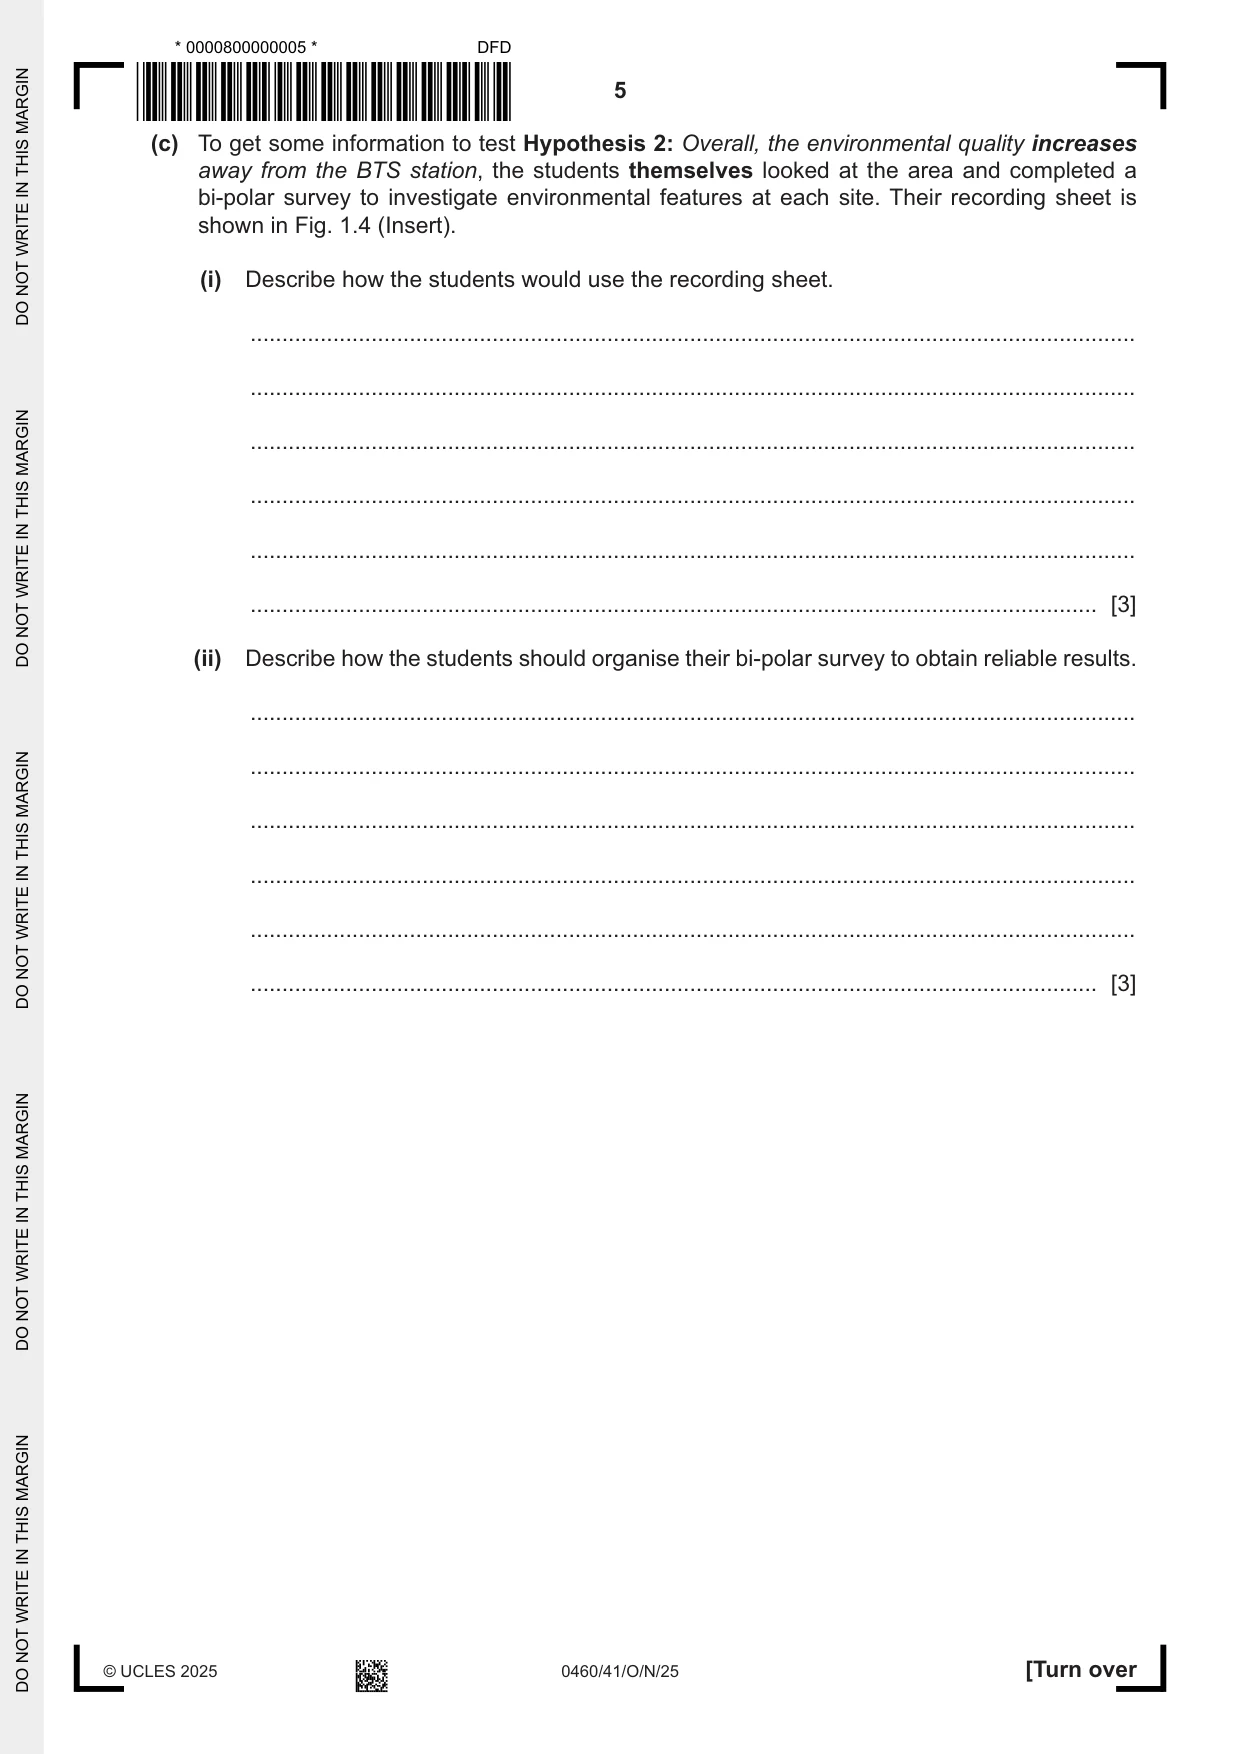
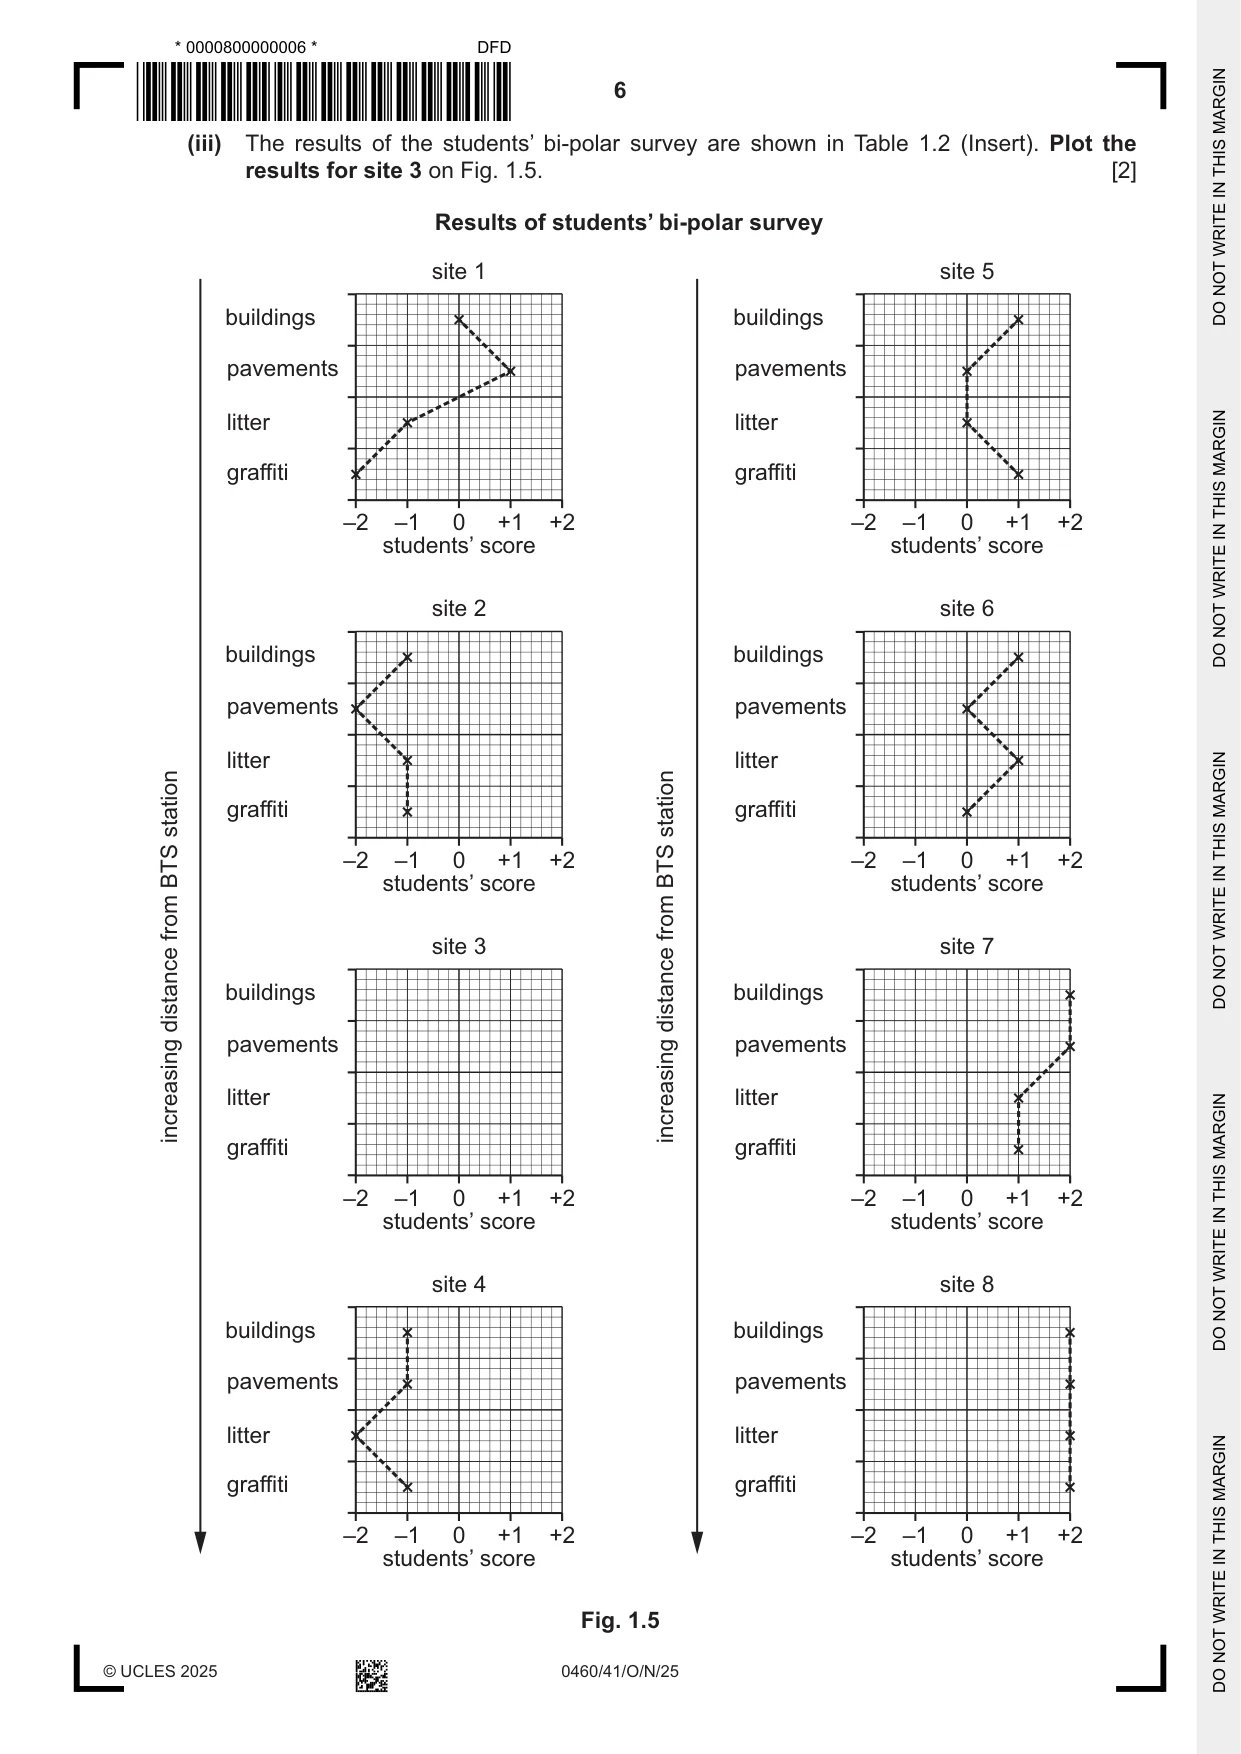
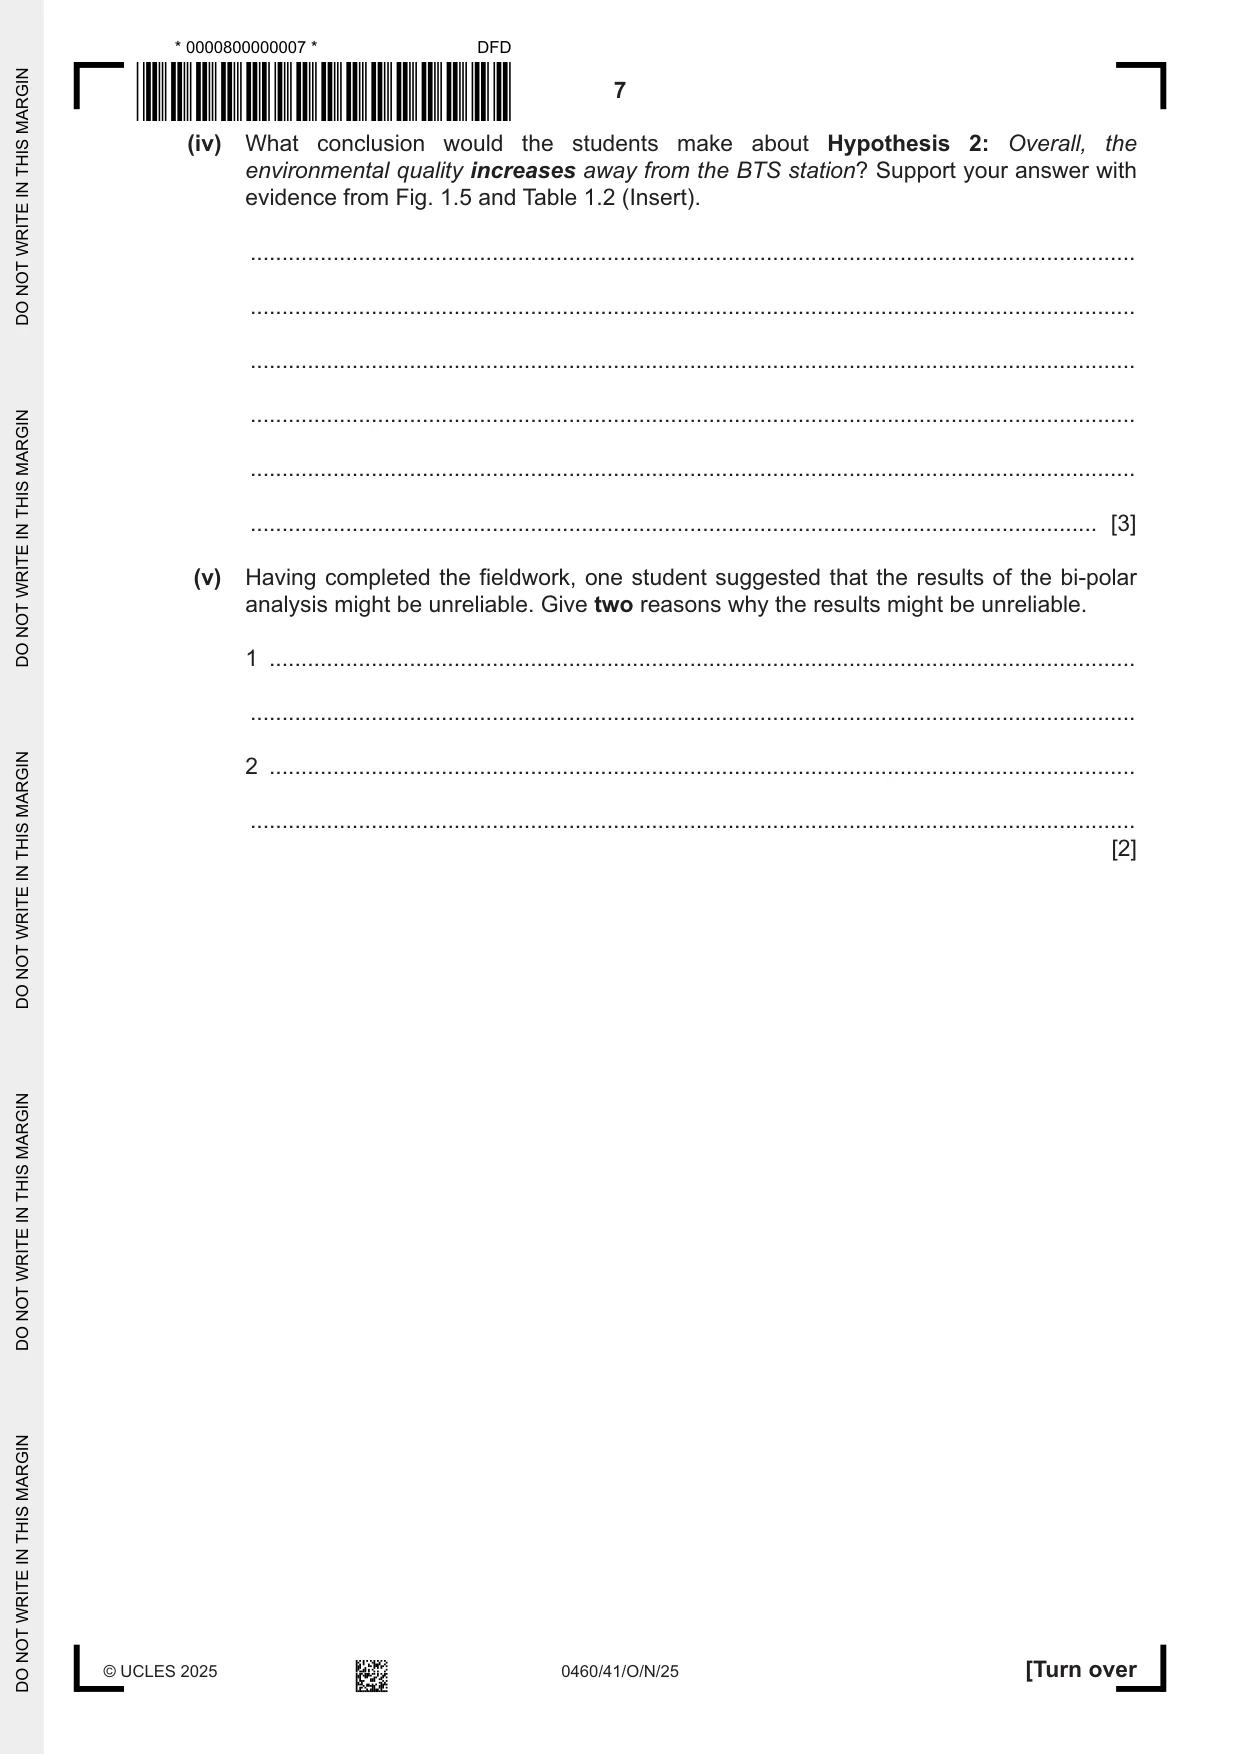
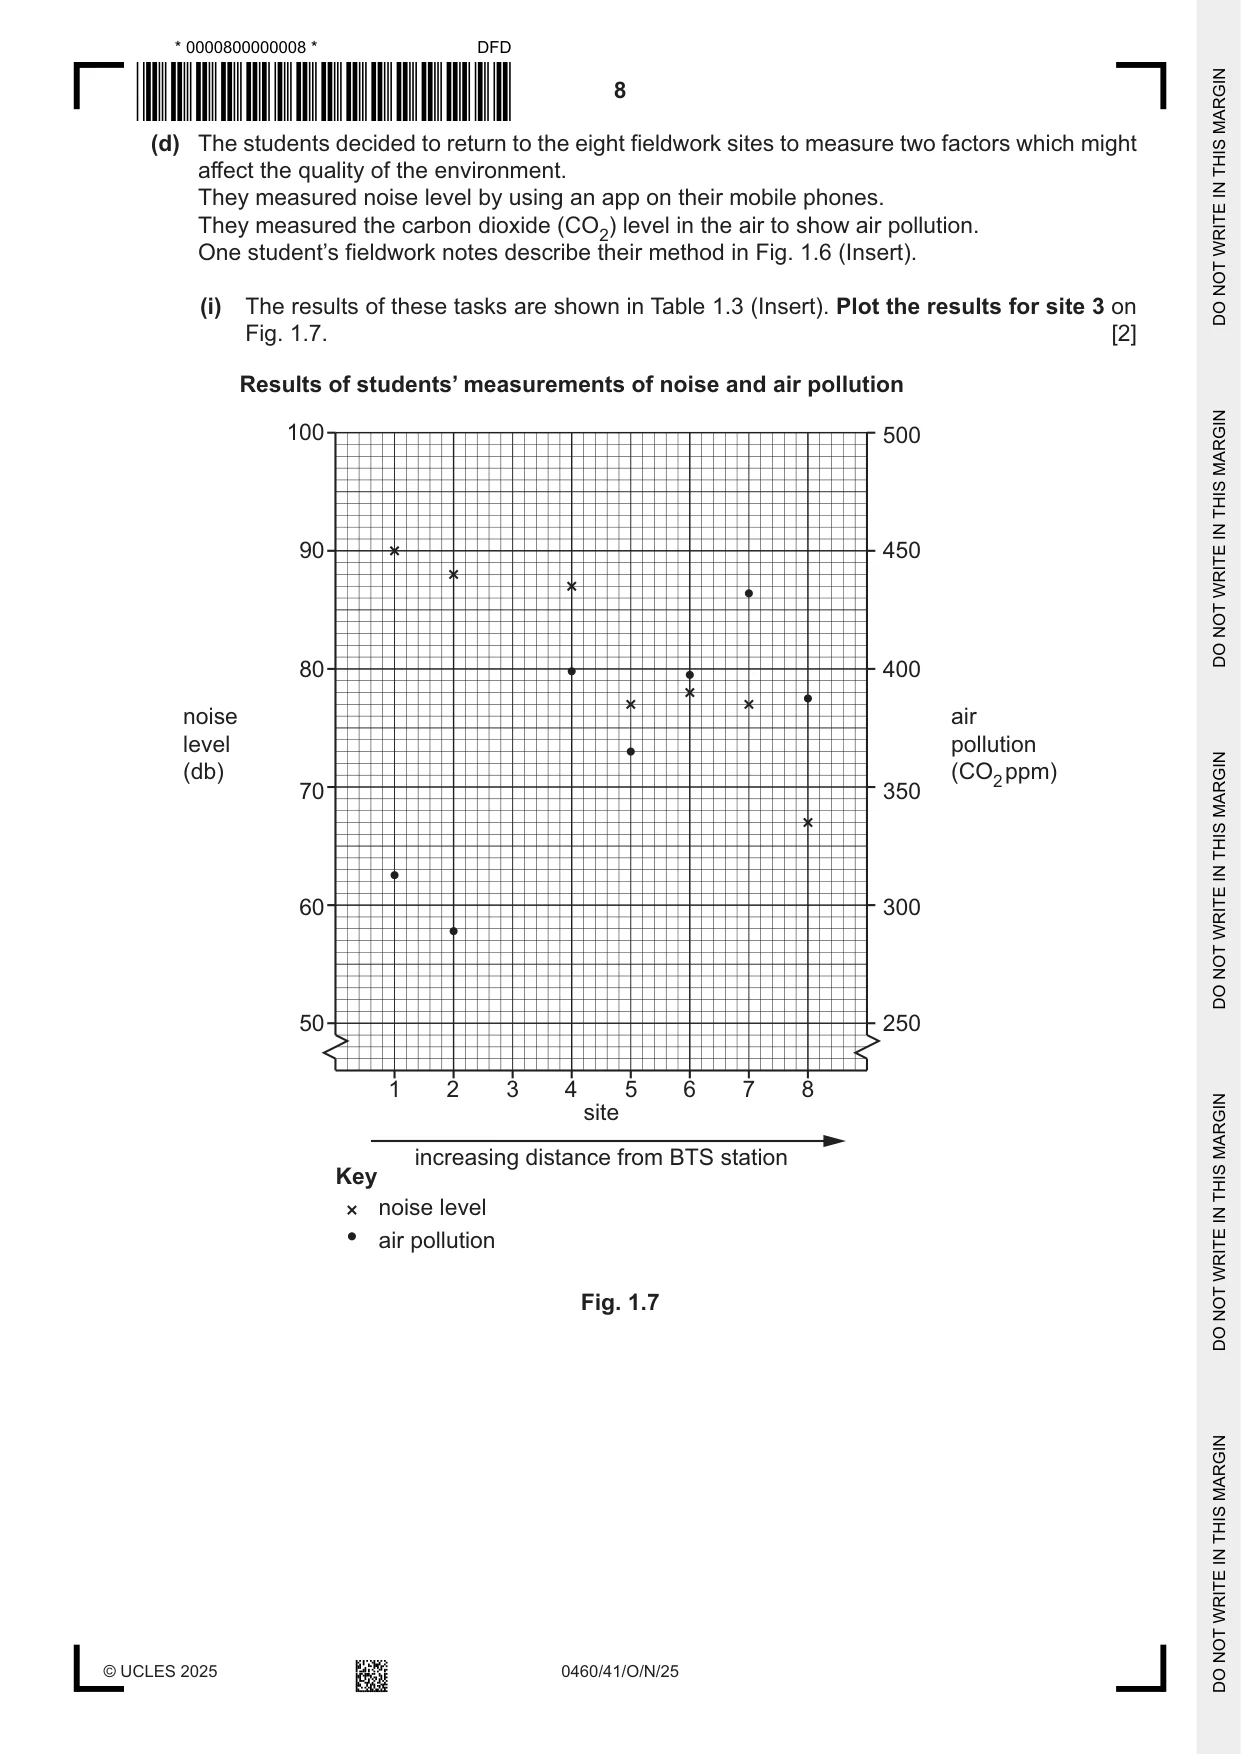
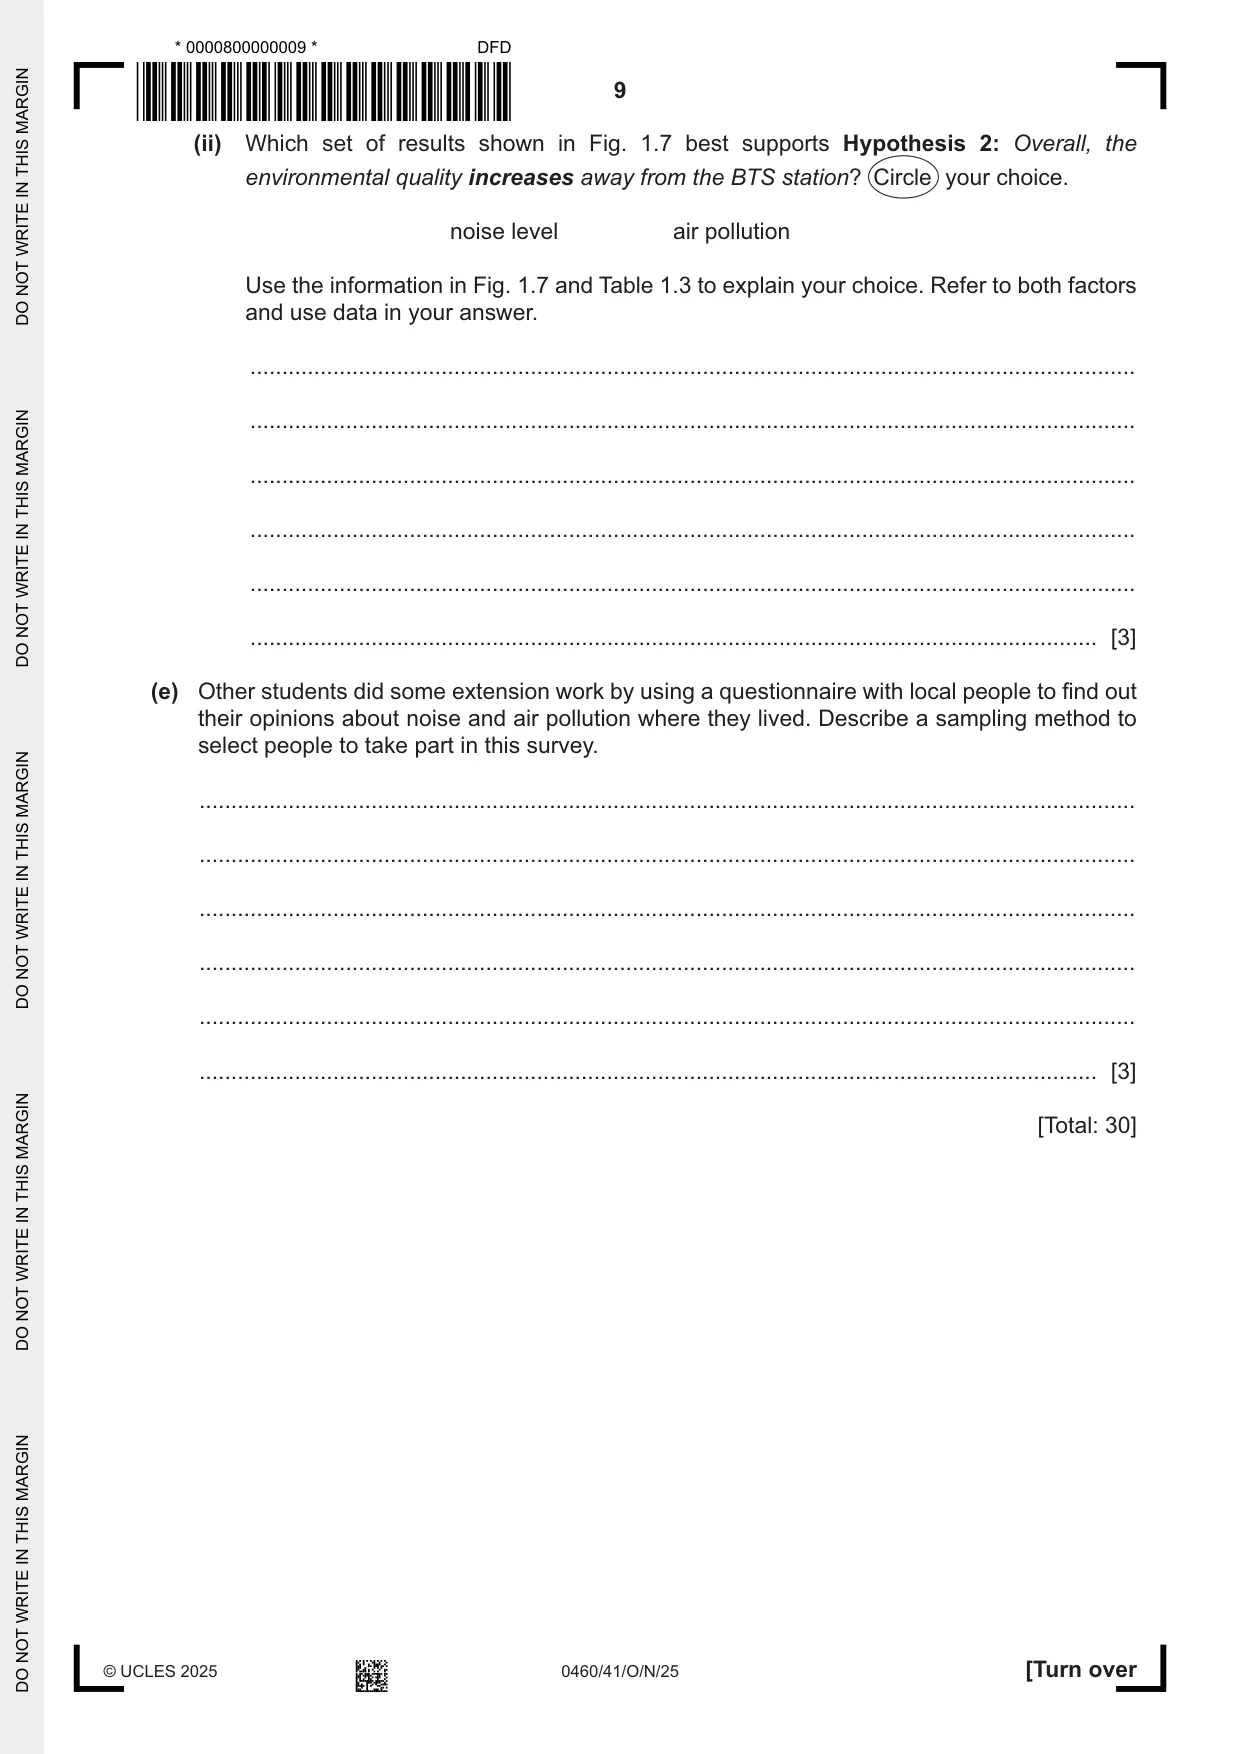
1 Students in Bangkok, Thailand (a country in Asia), investigated how land use and quality of the environment changed with increasing distance from the local BTS station. BTS is the Bangkok Mass Transit System. Fig. 1.1 (Insert) shows the train near Bearing station, which is the area where the students did their fieldwork. The students tested the following hypotheses: Hypothesis 1: The total number of shops and services decreases away from the BTS station. Hypothesis 2: Overall, the environmental quality increases away from the BTS station. (a) Before they began their fieldwork, the students studied the different types of shops and services. One student made a summary table of the differences between high-order, middle-order and low-order shops and services. This is shown in Fig. 1.2. Complete Fig. 1.2 to show the differences between high-order and low-order shops and services. Shops and services distance people how often they average price examples of goods are willing to order are bought or of goods or and services travel for goods visited services or services ‘designer’ fashions high jewellers clothes moderate middle moderate price medium distance frequency health clinic food low café [3] Fig. 1.2 (b) To investigate Hypothesis 1, the students worked at eight sites, approximately 400 m apart, along a main road going away from the station. At each site, the students completed a tally chart to record the different shops and services seen there. (i) The results for all eight sites are shown in Table 1.1 (Insert). Use these results to draw the divided bar graph for site 4 on Fig. 1.3. [3] Shops and services at each fieldwork site 45 40 35 30 number 25 of shops and 20 services 15 10 5 0 1 2 3 4 5 6 7 8 sites at increasing distance from BTS station Key low-order shops and services middle-order shops and services high-order shops and services Fig. 1.3 (ii) Do the results of the students’ fieldwork support Hypothesis 1: The total number of shops and services decreases away from the BTS station? Support your conclusion with evidence from Fig. 1.3 and Table 1.1. ........................................................................................................................................... ........................................................................................................................................... ........................................................................................................................................... ........................................................................................................................................... ........................................................................................................................................... ..................................................................................................................................... [3] (c) To get some information to test Hypothesis 2: Overall, the environmental quality increases away from the BTS station, the students themselves looked at the area and completed a bi-polar survey to investigate environmental features at each site. Their recording sheet is shown in Fig. 1.4 (Insert). (i) Describe how the students would use the recording sheet. ........................................................................................................................................... ........................................................................................................................................... ........................................................................................................................................... ........................................................................................................................................... ........................................................................................................................................... ..................................................................................................................................... [3] (ii) Describe how the students should organise their bi-polar survey to obtain reliable results. ........................................................................................................................................... ........................................................................................................................................... ........................................................................................................................................... ........................................................................................................................................... ........................................................................................................................................... ..................................................................................................................................... [3] i) The results of the students’ bi-polar surve results for site 3 on Fig. 1.5. Results of students’ bi- site 1 buildings pavements litter graffiti –2 –1 0 +1 +2 students’ score site 2 buildings pavements litter graffiti station –2 –1 0 +1 +2 BTS students’ score from site 3 buildings distance pavements litter increasing graffiti –2 –1 0 +1 +2 students’ score site 4 buildings pavements litter graffiti –2 –1 0 +1 +2 students’ score Fig. 1.5 (iv) What conclusion would the students make about Hypothesis 2: Overall, the environmental quality increases away from the BTS station? Support your answer with evidence from Fig. 1.5 and Table 1.2 (Insert). ........................................................................................................................................... ........................................................................................................................................... ........................................................................................................................................... ........................................................................................................................................... ........................................................................................................................................... ..................................................................................................................................... [3] (v) Having completed the fieldwork, one student suggested that the results of the bi-polar analysis might be unreliable. Give two reasons why the results might be unreliable. 1 ........................................................................................................................................ ........................................................................................................................................... 2 ........................................................................................................................................ ........................................................................................................................................... [2] (d) The students decided to return to the eight fieldwork sites to measure two factors which might affect the quality of the environment. They measured noise level by using an app on their mobile phones. They measured the carbon dioxide (CO2) level in the air to show air pollution. One student’s fieldwork notes describe their method in Fig. 1.6 (Insert). (i) The results of these tasks are shown in Table 1.3 (Insert). Plot the results for site 3 on Fig. 1.7. [2] Results of students’ measurements of noise and air pollution 100 500 90 450 80 400 noise air level pollution (db) (CO2 ppm) 70 350 60 300 50 250 1 2 3 4 5 6 7 8 site increasing distance from BTS station Key noise level air pollution Fig. 1.7 (ii) Which set of results shown in Fig. 1.7 best supports Hypothesis 2: Overall, the environmental quality increases away from the BTS station? Circle your choice. noise level air pollution Use the information in Fig. 1.7 and Table 1.3 to explain your choice. Refer to both factors and use data in your answer. ........................................................................................................................................... ........................................................................................................................................... ........................................................................................................................................... ........................................................................................................................................... ........................................................................................................................................... ..................................................................................................................................... [3] (e) Other students did some extension work by using a questionnaire with local people to find out their opinions about noise and air pollution where they lived. Describe a sampling method to select people to take part in this survey. ................................................................................................................................................... ................................................................................................................................................... ................................................................................................................................................... ................................................................................................................................................... ................................................................................................................................................... ............................................................................................................................................. [3] [Total: 30]
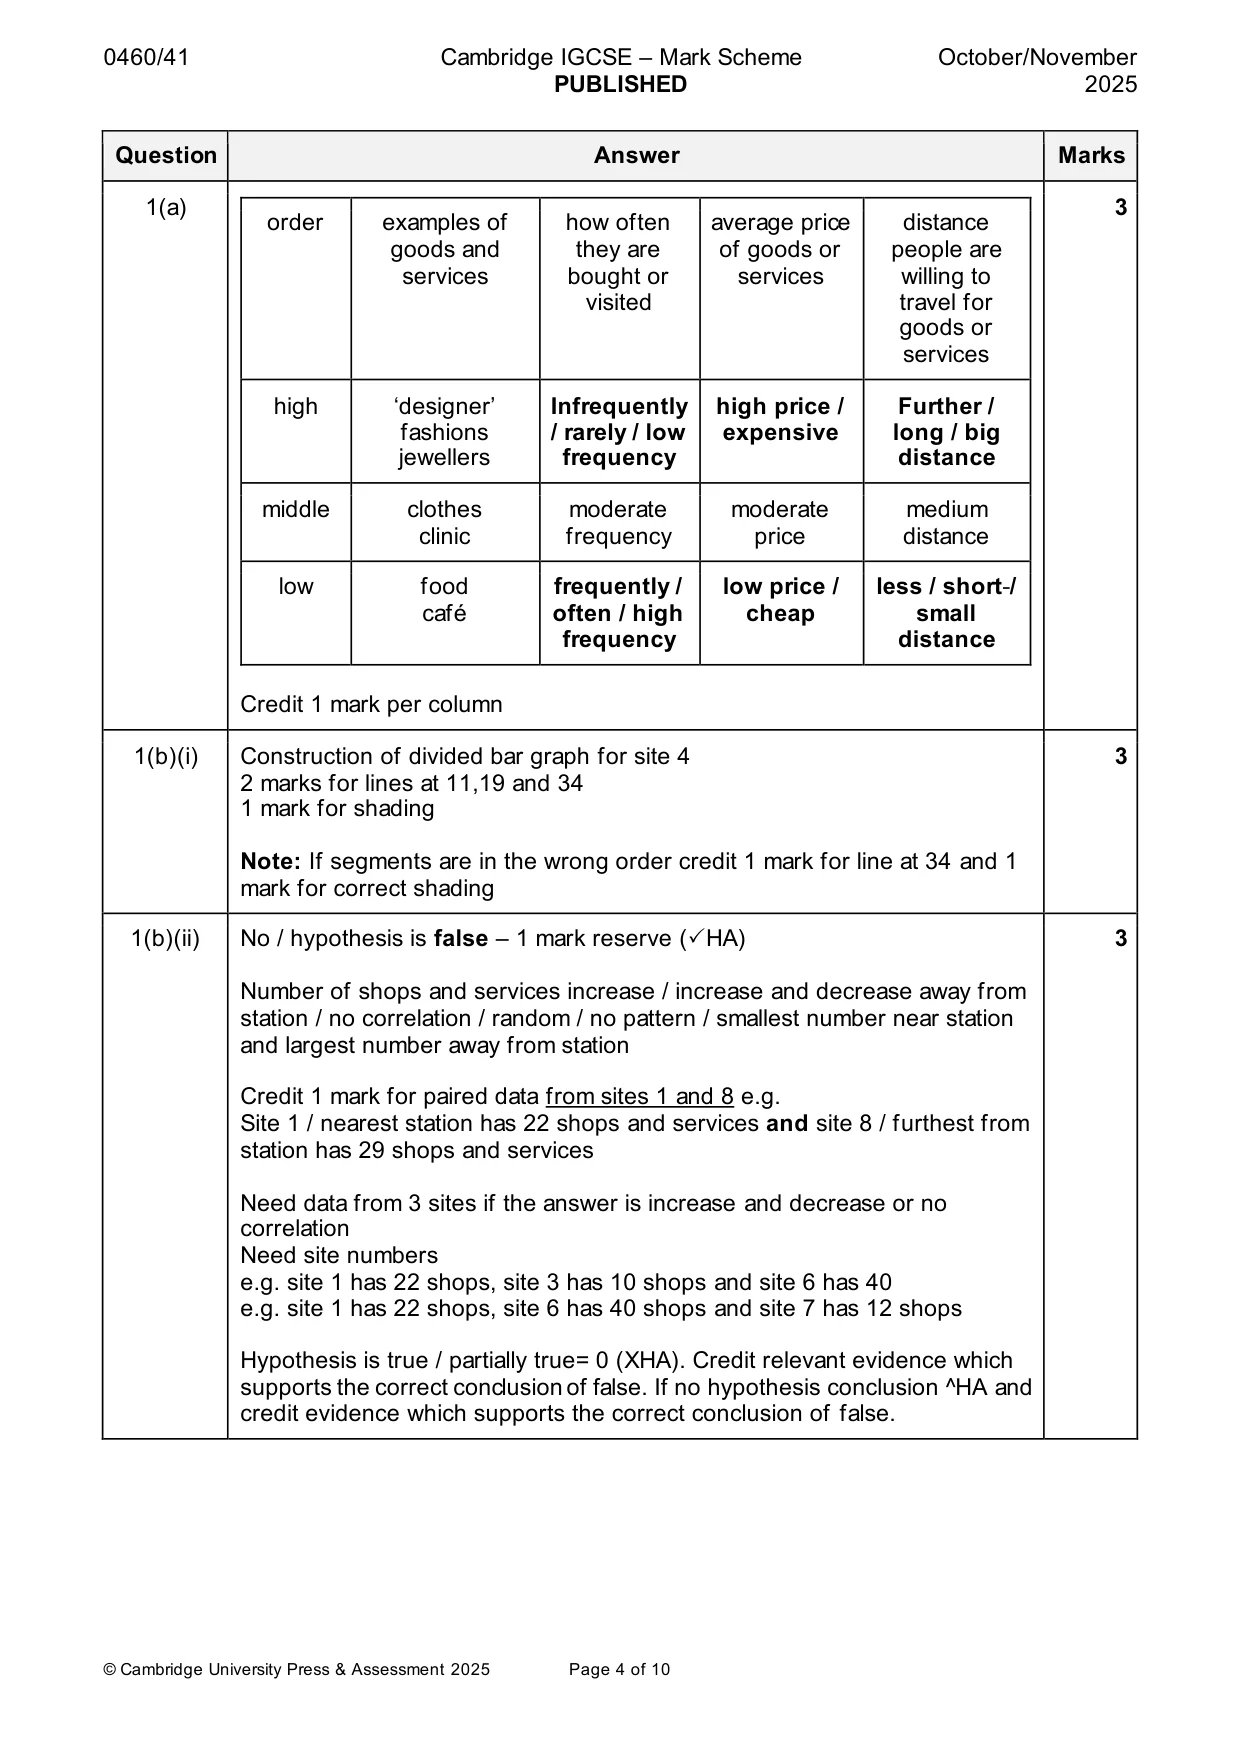
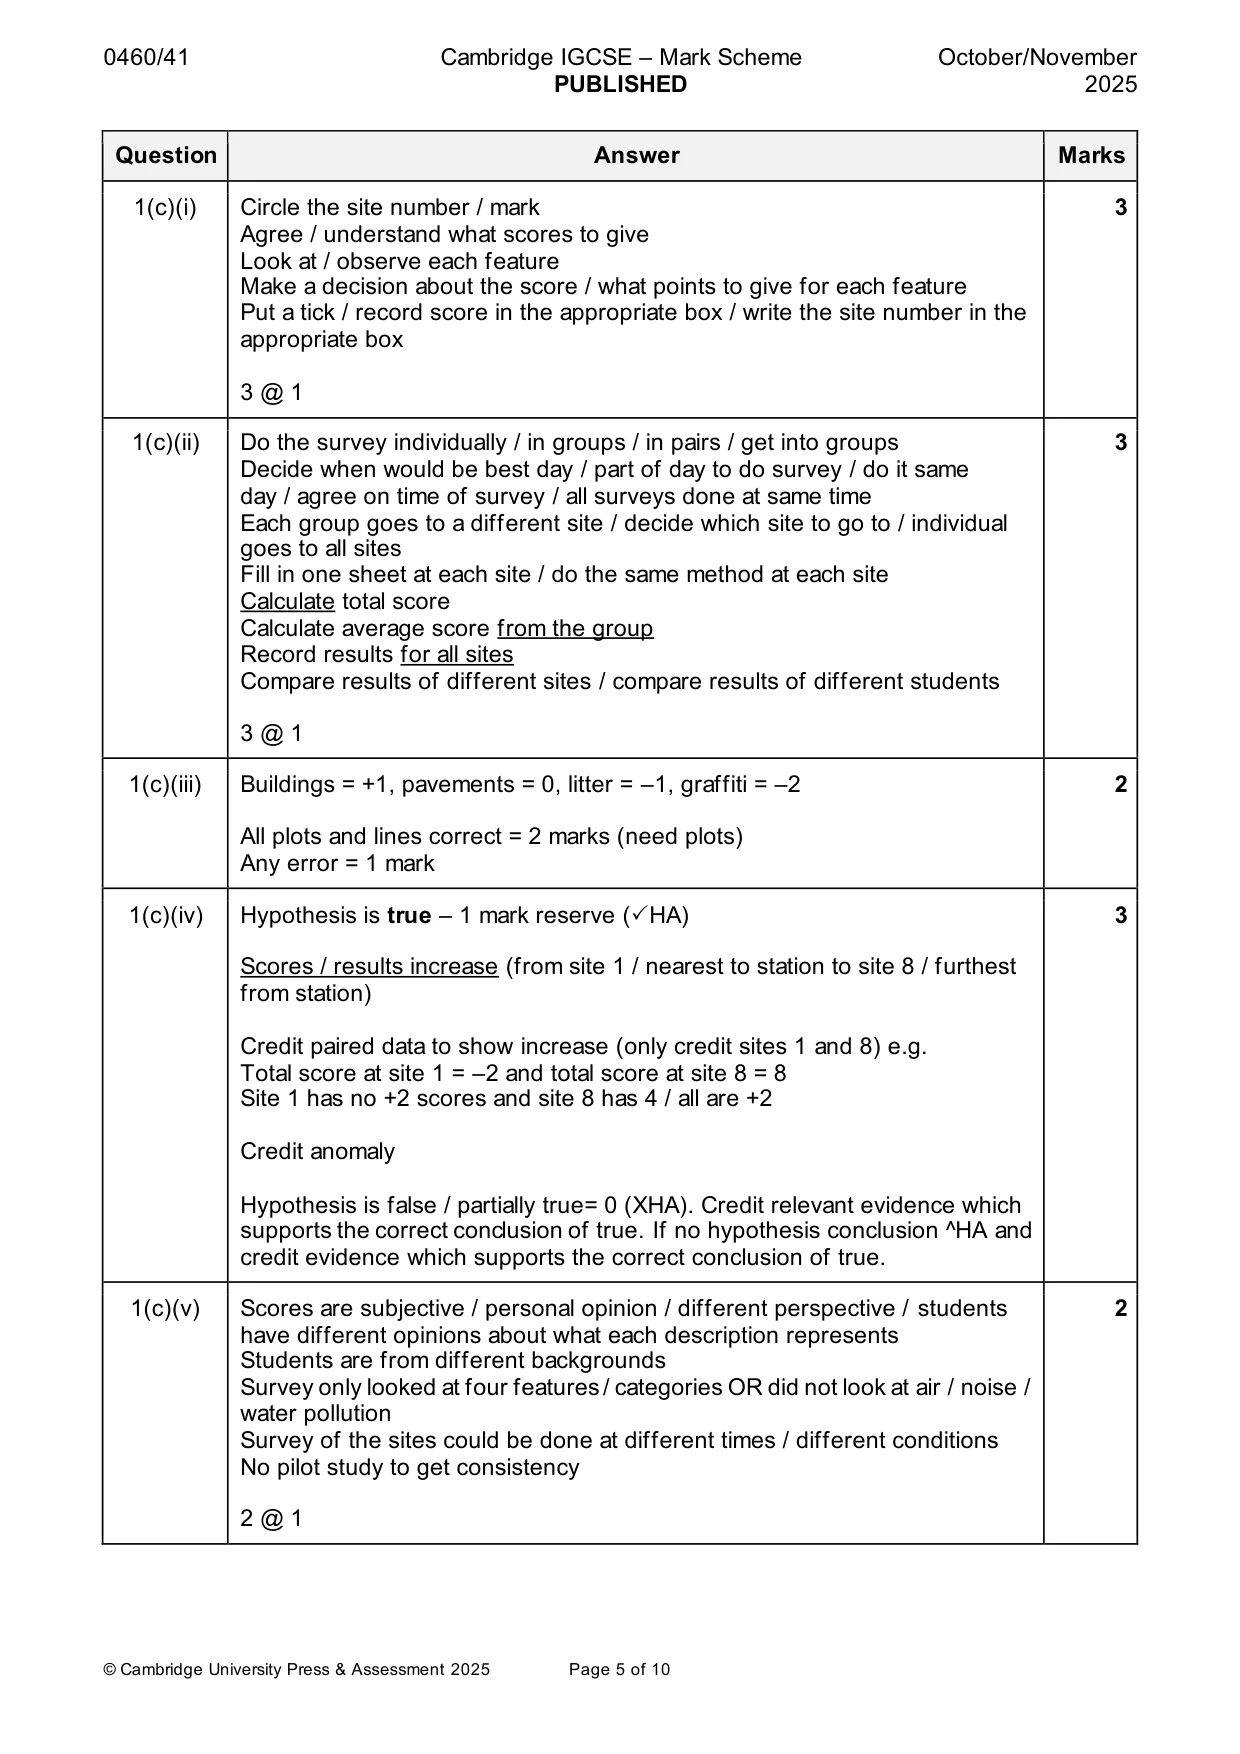
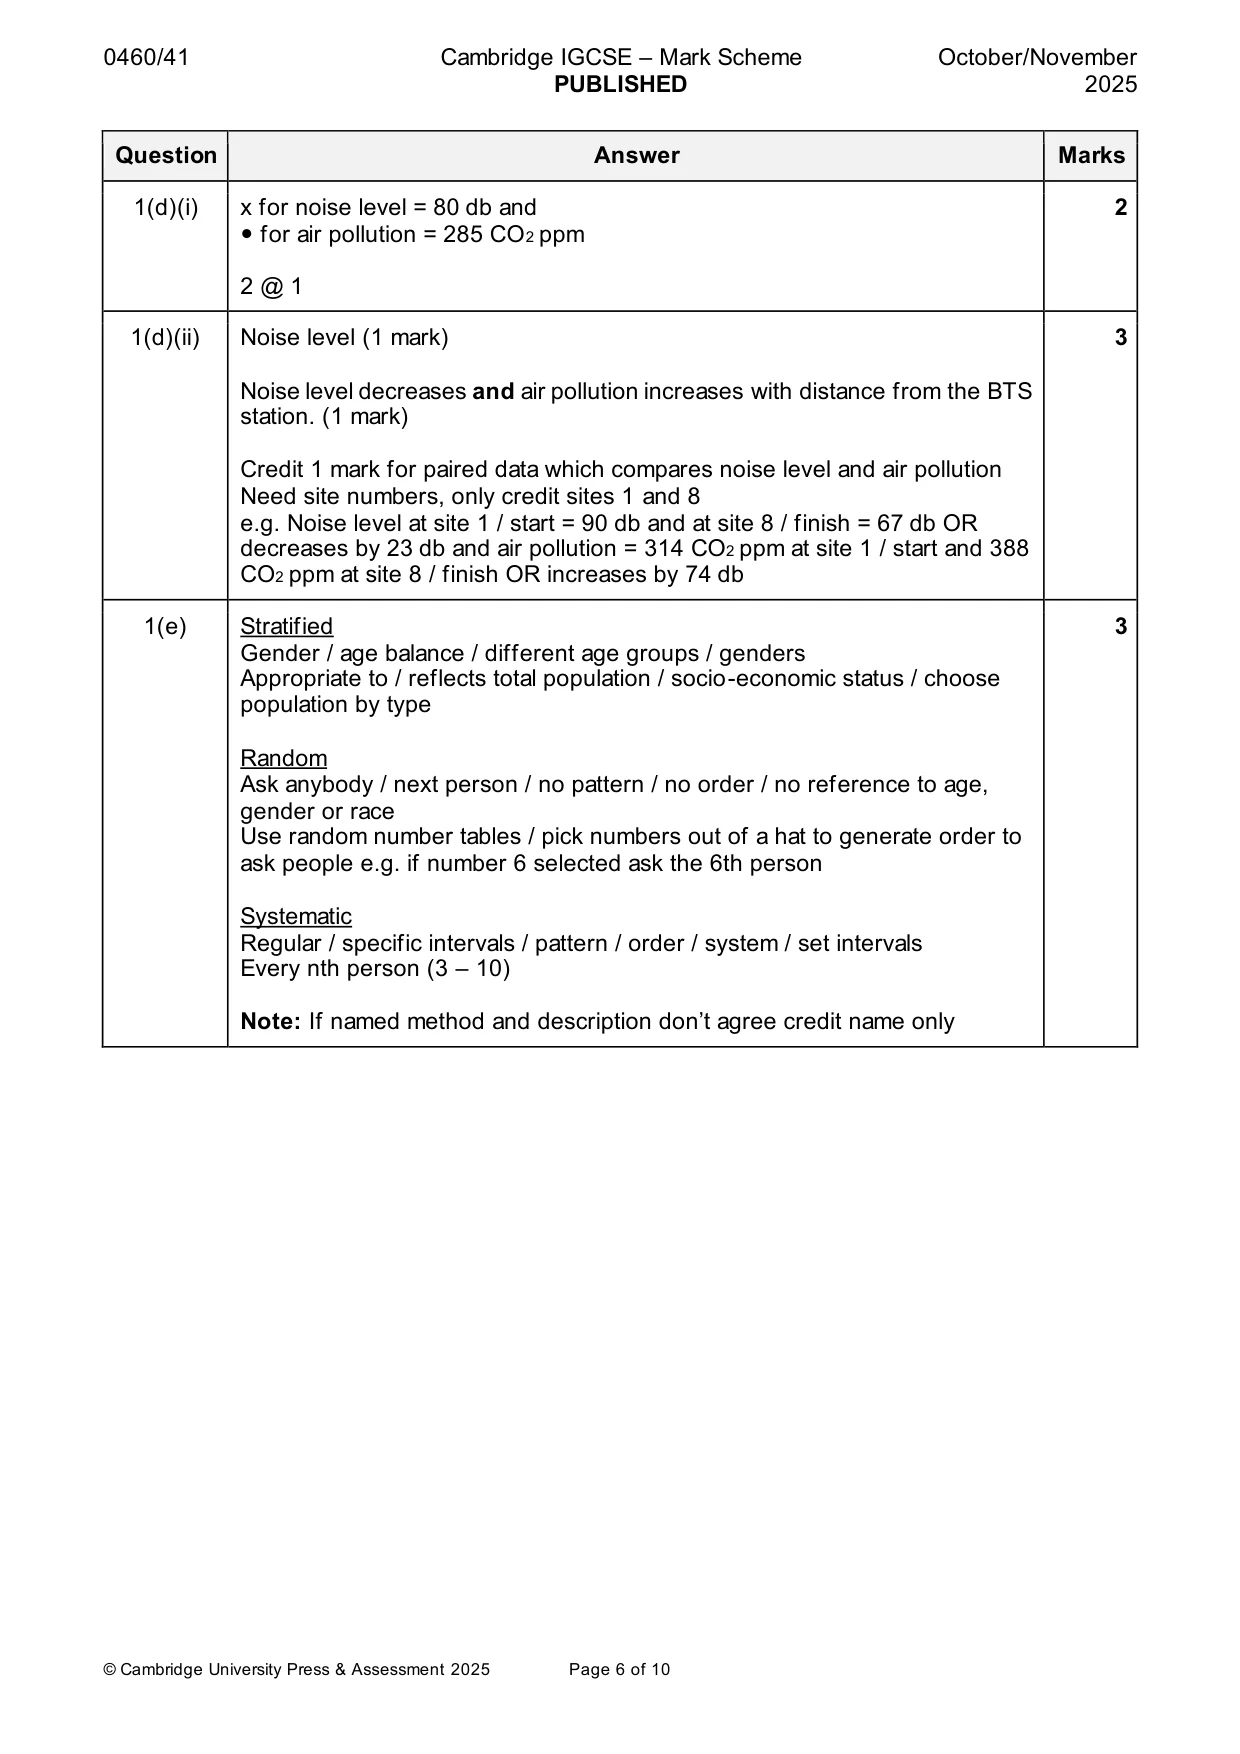
Mark scheme: Question Answer Marks 1(a) 3 order examples of how often average price distance goods and they are of goods or people are services bought or services willing to visited travel for goods or services high ‘designer’ Infrequently high price / Further / fashions / rarely / low expensive long / big jewellers frequency distance middle clothes moderate moderate medium clinic frequency price distance low food frequently / low price / less / short / café often / high cheap small frequency distance Credit 1 mark per column 1(b)(i) Construction of divided bar graph for site 4 3 2 marks for lines at 11,19 and 34 1 mark for shading Note: If segments are in the wrong order credit 1 mark for line at 34 and 1 mark for correct shading 1(b)(ii) No / hypothesis is false – 1 mark reserve (HA) 3 Number of shops and services increase / increase and decrease away from station / no correlation / random / no pattern / smallest number near station and largest number away from station Credit 1 mark for paired data from sites 1 and 8 e.g. Site 1 / nearest station has 22 shops and services and site 8 / furthest from station has 29 shops and services Need data from 3 sites if the answer is increase and decrease or no correlation Need site numbers e.g. site 1 has 22 shops, site 3 has 10 shops and site 6 has 40 e.g. site 1 has 22 shops, site 6 has 40 shops and site 7 has 12 shops Hypothesis is true / partially true= 0 (XHA). Credit relevant evidence which supports the correct conclusion of false. If no hypothesis conclusion ^HA and credit evidence which supports the correct conclusion of false. 1(c)(i) Circle the site number / mark 3 Agree / understand what scores to give Look at / observe each feature Make a decision about the score / what points to give for each feature Put a tick / record score in the appropriate box / write the site number in the appropriate box 3 @ 1 1(c)(ii) Do the survey individually / in groups / in pairs / get into groups 3 Decide when would be best day / part of day to do survey / do it same day / agree on time of survey / all surveys done at same time Each group goes to a different site / decide which site to go to / individual goes to all sites Fill in one sheet at each site / do the same method at each site Calculate total score Calculate average score from the group Record results for all sites Compare results of different sites / compare results of different students 3 @ 1 1(c)(iii) Buildings = +1, pavements = 0, litter = –1, graffiti = –2 2 All plots and lines correct = 2 marks (need plots) Any error = 1 mark 1(c)(iv) Hypothesis is true – 1 mark reserve (HA) 3 Scores / results increase (from site 1 / nearest to station to site 8 / furthest from station) Credit paired data to show increase (only credit sites 1 and 8) e.g. Total score at site 1 = –2 and total score at site 8 = 8 Site 1 has no +2 scores and site 8 has 4 / all are +2 Credit anomaly Hypothesis is false / partially true= 0 (XHA). Credit relevant evidence which supports the correct conclusion of true. If no hypothesis conclusion ^HA and credit evidence which supports the correct conclusion of true. 1(c)(v) Scores are subjective / personal opinion / different perspective / students 2 have different opinions about what each description represents Students are from different backgrounds Survey only looked at four features / categories OR did not look at air / noise / water pollution Survey of the sites could be done at different times / different conditions No pilot study to get consistency 2 @ 1 1(d)(i) x for noise level = 80 db and 2 for air pollution = 285 CO2 ppm 2 @ 1 1(d)(ii) Noise level (1 mark) 3 Noise level decreases and air pollution increases with distance from the BTS station. (1 mark) Credit 1 mark for paired data which compares noise level and air pollution Need site numbers, only credit sites 1 and 8 e.g. Noise level at site 1 / start = 90 db and at site 8 / finish = 67 db OR decreases by 23 db and air pollution = 314 CO2 ppm at site 1 / start and 388 CO2 ppm at site 8 / finish OR increases by 74 db 1(e) Stratified 3 Gender / age balance / different age groups / genders Appropriate to / reflects total population / socio-economic status / choose population by type Random Ask anybody / next person / no pattern / no order / no reference to age, gender or race Use random number tables / pick numbers out of a hat to generate order to ask people e.g. if number 6 selected ask the 6th person Systematic Regular / specific intervals / pattern / order / system / set intervals Every nth person (3 – 10) Note: If named method and description don’t agree credit name only
More questions on Settlements (rural and urban) and service provision
Q2 · Students in London, UK, did a fieldwork investigation on the topic of weather
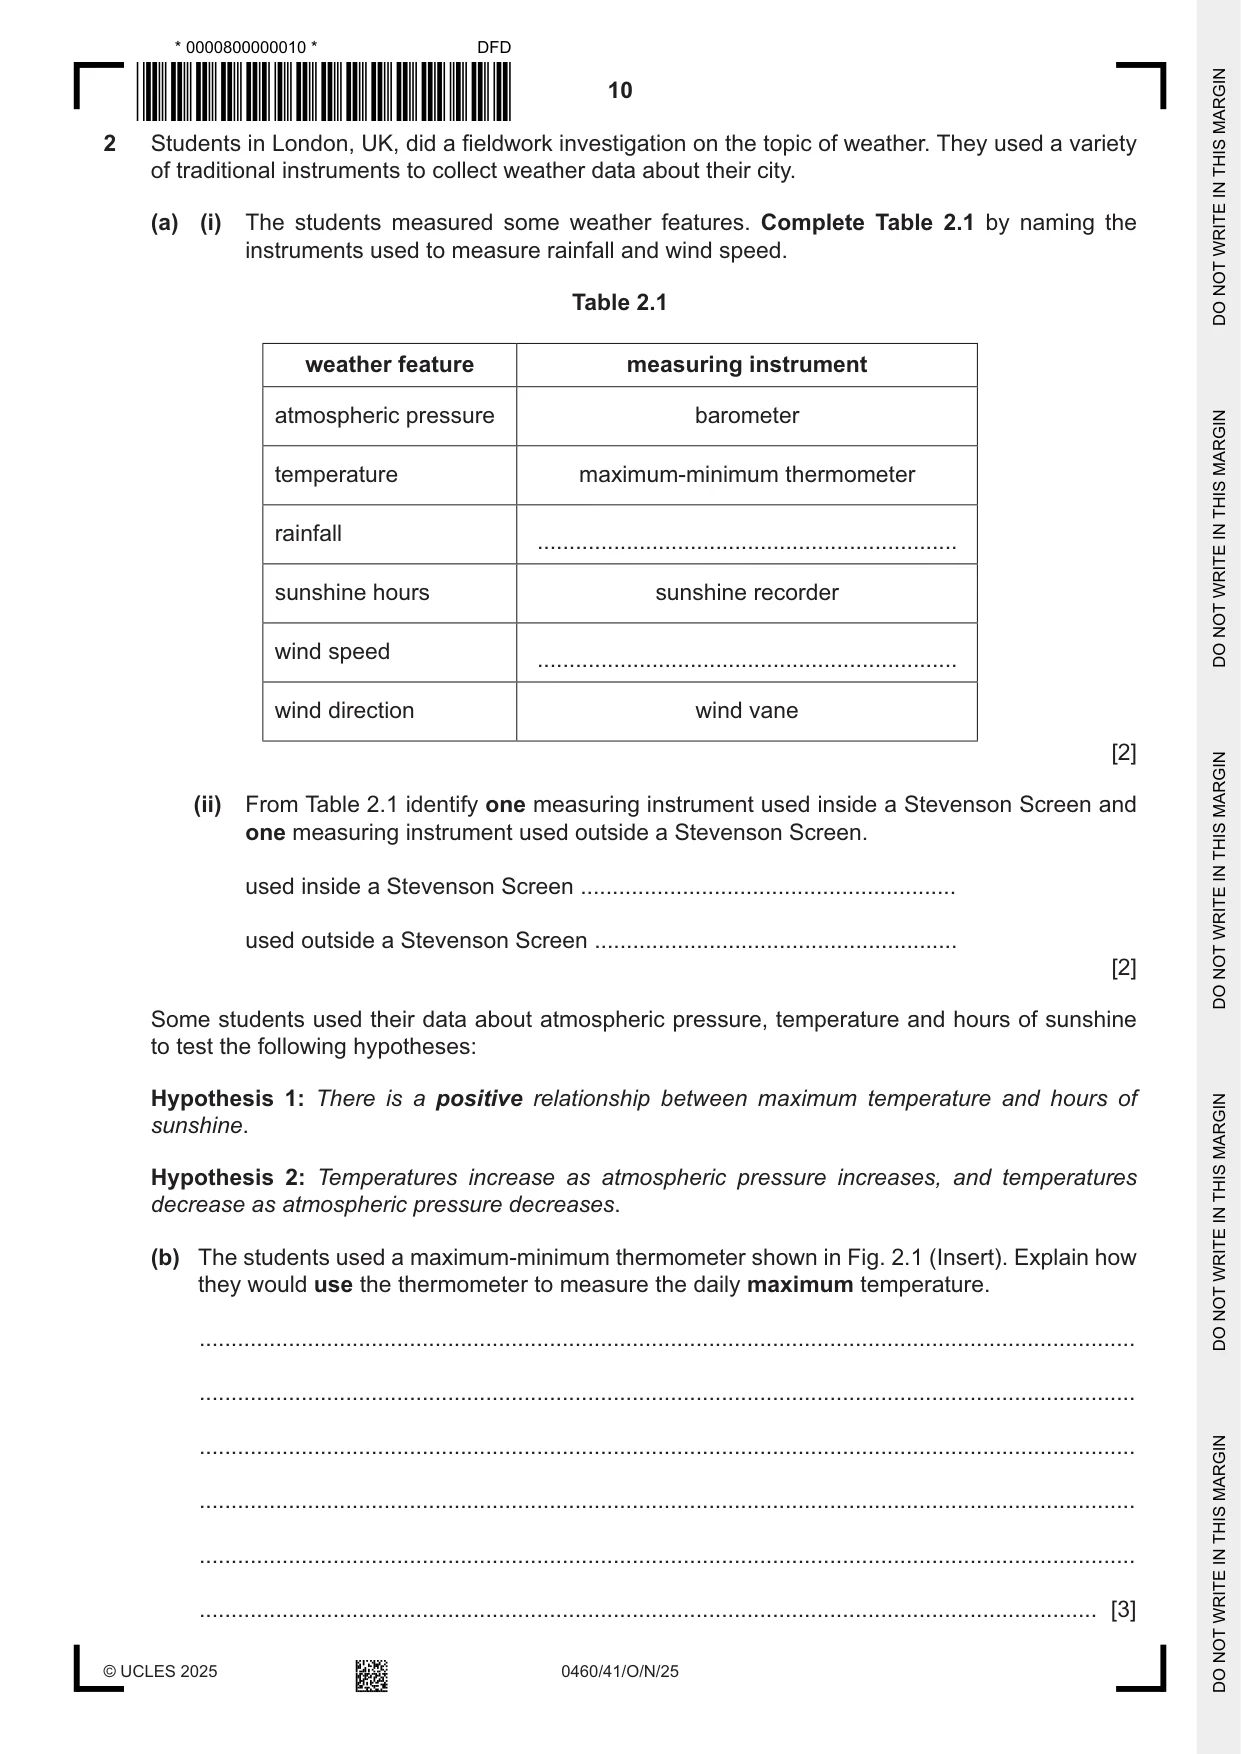
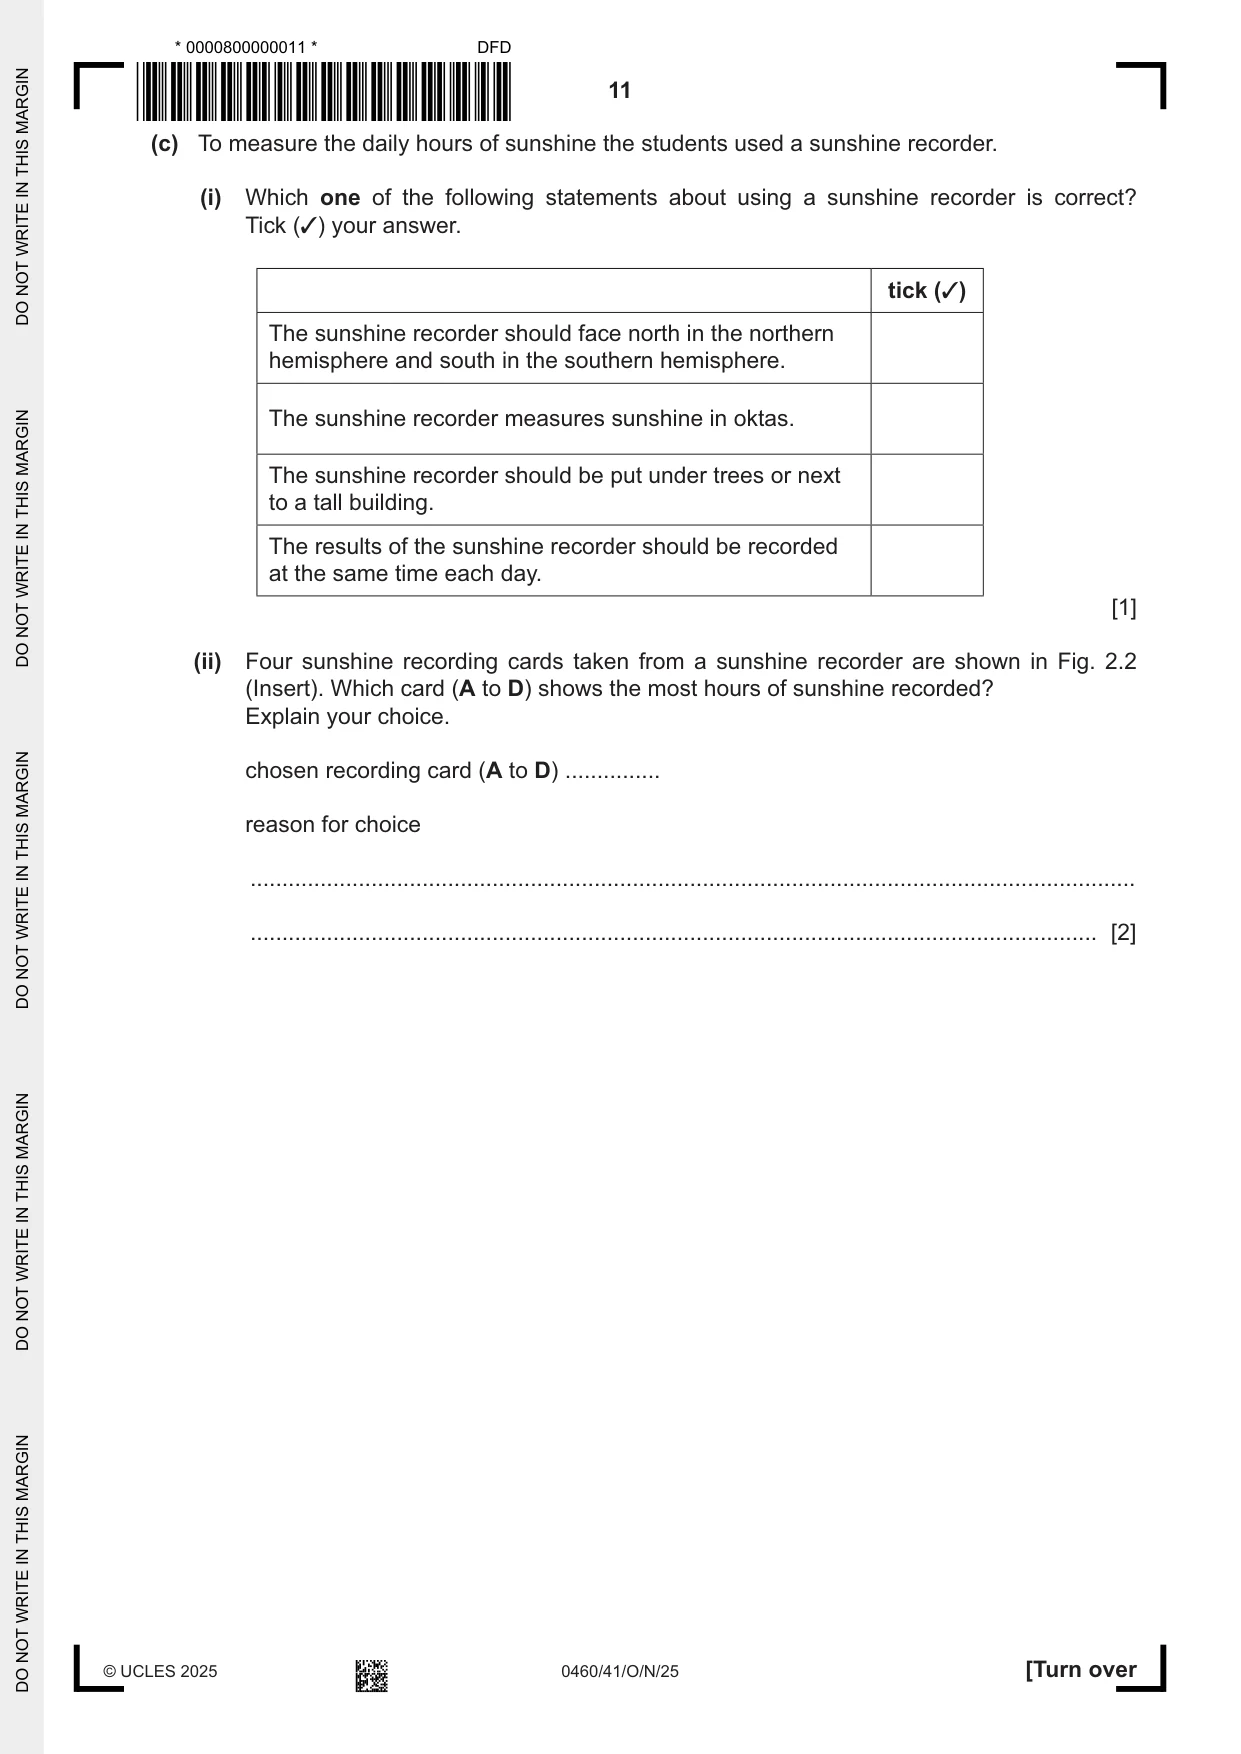
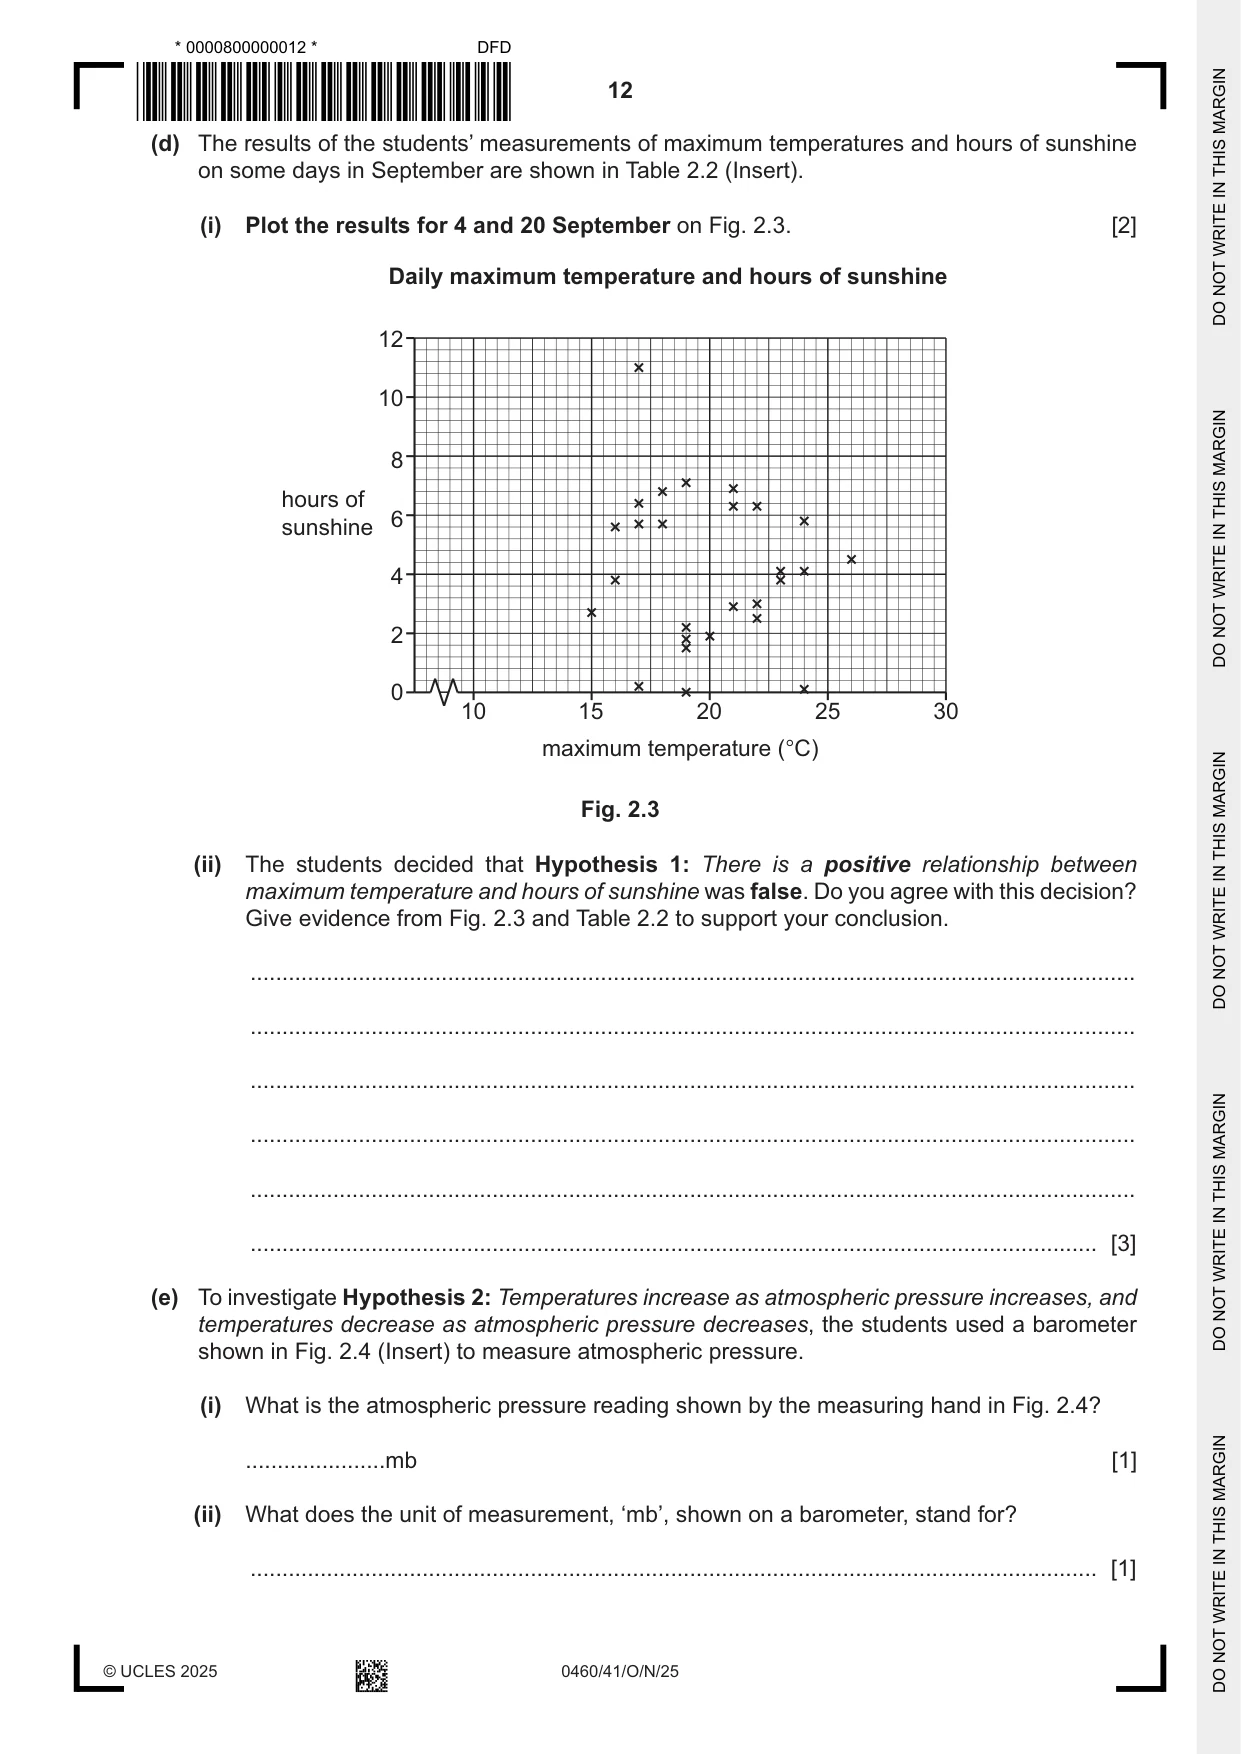
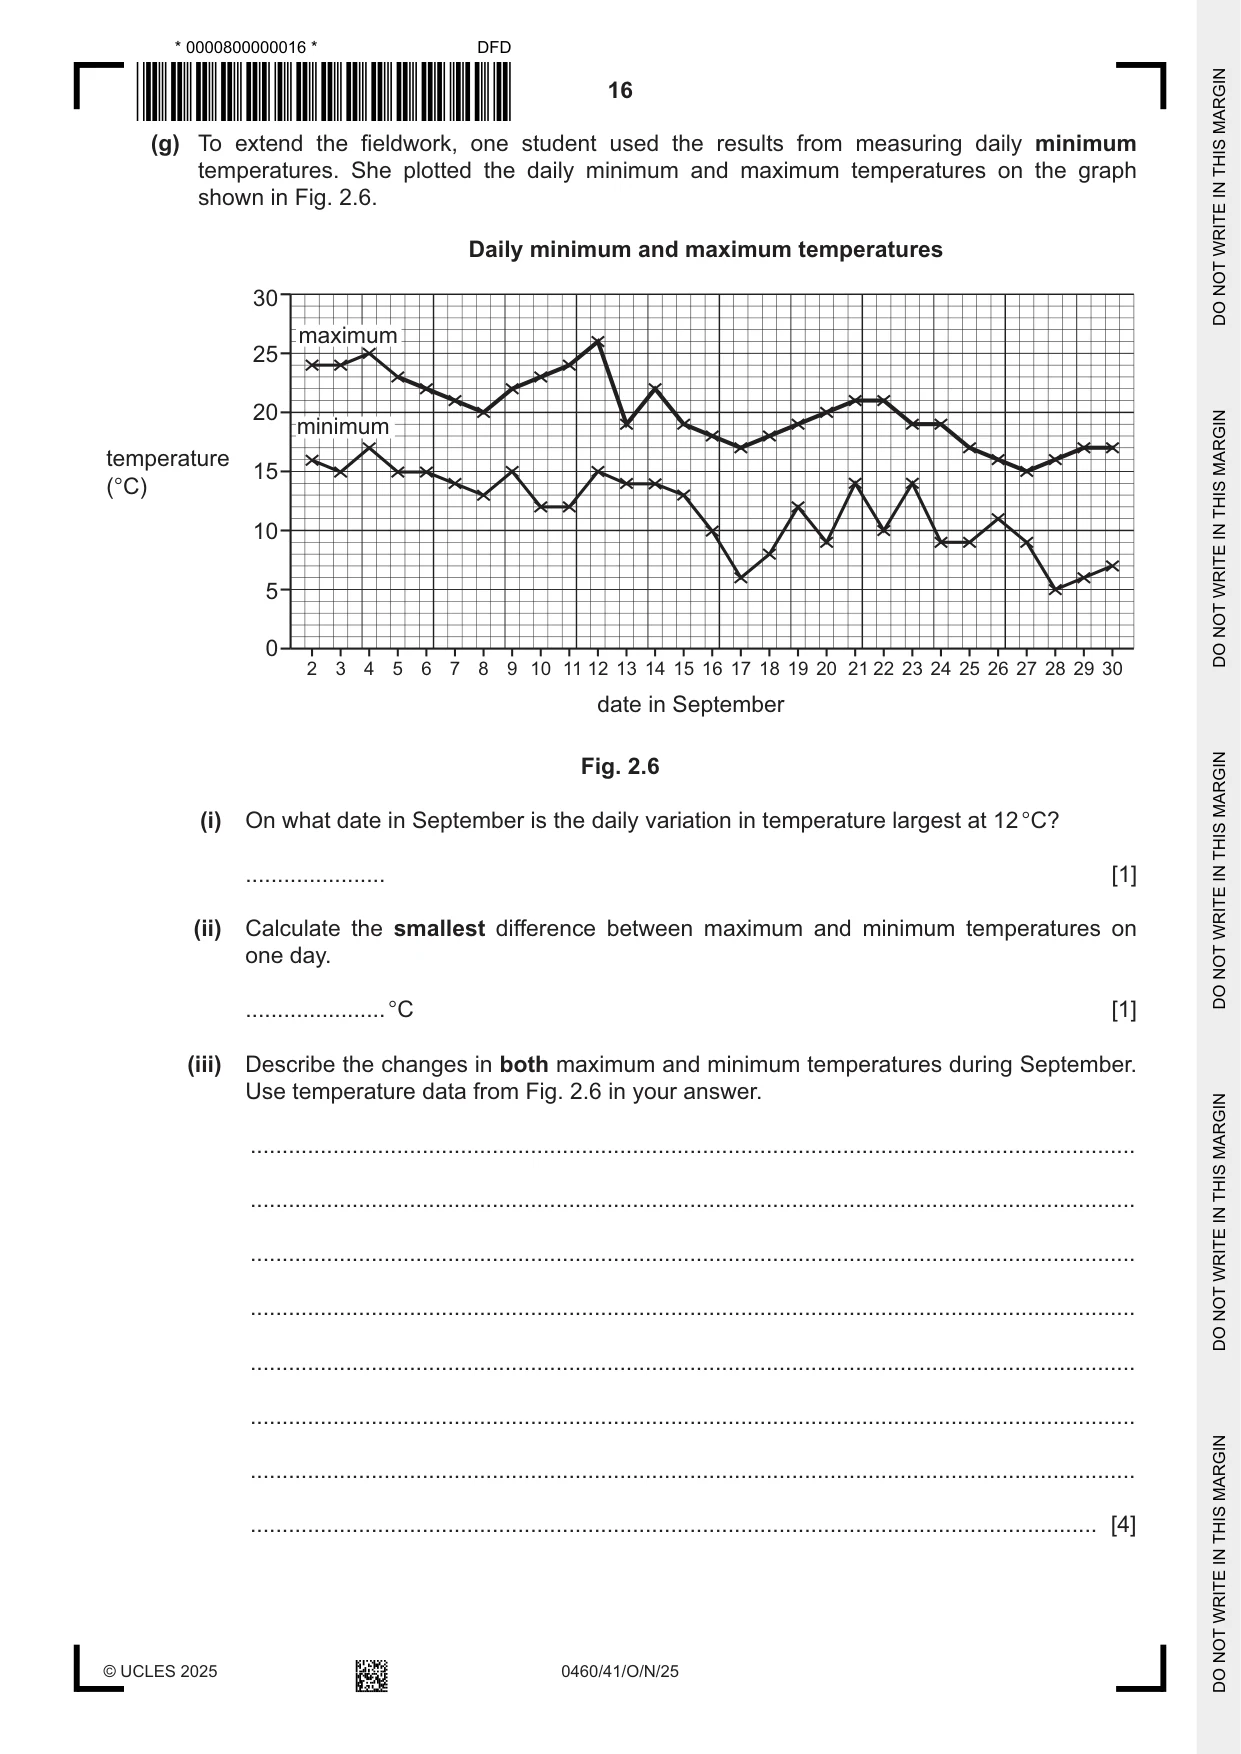
2 Students in London, UK, did a fieldwork investigation on the topic of weather. They used a variety of traditional instruments to collect weather data about their city. (a) (i) The students measured some weather features. Complete Table 2.1 by naming the instruments used to measure rainfall and wind speed. Table 2.1 weather feature measuring instrument atmospheric pressure barometer temperature maximum-minimum thermometer rainfall .................................................................. sunshine hours sunshine recorder wind speed .................................................................. wind direction wind vane [2] (ii) From Table 2.1 identify one measuring instrument used inside a Stevenson Screen and one measuring instrument used outside a Stevenson Screen. used inside a Stevenson Screen ........................................................... used outside a Stevenson Screen ......................................................... [2] Some students used their data about atmospheric pressure, temperature and hours of sunshine to test the following hypotheses: Hypothesis 1: There is a positive relationship between maximum temperature and hours of sunshine. Hypothesis 2: Temperatures increase as atmospheric pressure increases, and temperatures decrease as atmospheric pressure decreases. (b) The students used a maximum-minimum thermometer shown in Fig. 2.1 (Insert). Explain how they would use the thermometer to measure the daily maximum temperature. ................................................................................................................................................... ................................................................................................................................................... ................................................................................................................................................... ................................................................................................................................................... ................................................................................................................................................... ............................................................................................................................................. [3] (c) To measure the daily hours of sunshine the students used a sunshine recorder. (i) Which one of the following statements about using a sunshine recorder is correct? Tick (✓) your answer. tick (✓) The sunshine recorder should face north in the northern hemisphere and south in the southern hemisphere. The sunshine recorder measures sunshine in oktas. The sunshine recorder should be put under trees or next to a tall building. The results of the sunshine recorder should be recorded at the same time each day. [1] (ii) Four sunshine recording cards taken from a sunshine recorder are shown in Fig. 2.2 (Insert). Which card (A to D) shows the most hours of sunshine recorded? Explain your choice. chosen recording card (A to D) ............... reason for choice ........................................................................................................................................... ..................................................................................................................................... [2] (d) The results of the students’ measurements of maximum temperatures and hours of sunshine on some days in September are shown in Table 2.2 (Insert). (i) Plot the results for 4 and 20 September on Fig. 2.3. [2] Daily maximum temperature and hours of sunshine 12 10 8 hours of 6 sunshine 4 2 0 10 15 20 25 30 maximum temperature (°C) Fig. 2.3 (ii) The students decided that Hypothesis 1: There is a positive relationship between maximum temperature and hours of sunshine was false. Do you agree with this decision? Give evidence from Fig. 2.3 and Table 2.2 to support your conclusion. ........................................................................................................................................... ........................................................................................................................................... ........................................................................................................................................... ........................................................................................................................................... ........................................................................................................................................... ..................................................................................................................................... [3] (e) To investigate Hypothesis 2: Temperatures increase as atmospheric pressure increases, and temperatures decrease as atmospheric pressure decreases, the students used a barometer shown in Fig. 2.4 (Insert) to measure atmospheric pressure. (i) What is the atmospheric pressure reading shown by the measuring hand in Fig. 2.4? ......................mb [1] (ii) What does the unit of measurement, ‘mb’, shown on a barometer, stand for? ..................................................................................................................................... [1]
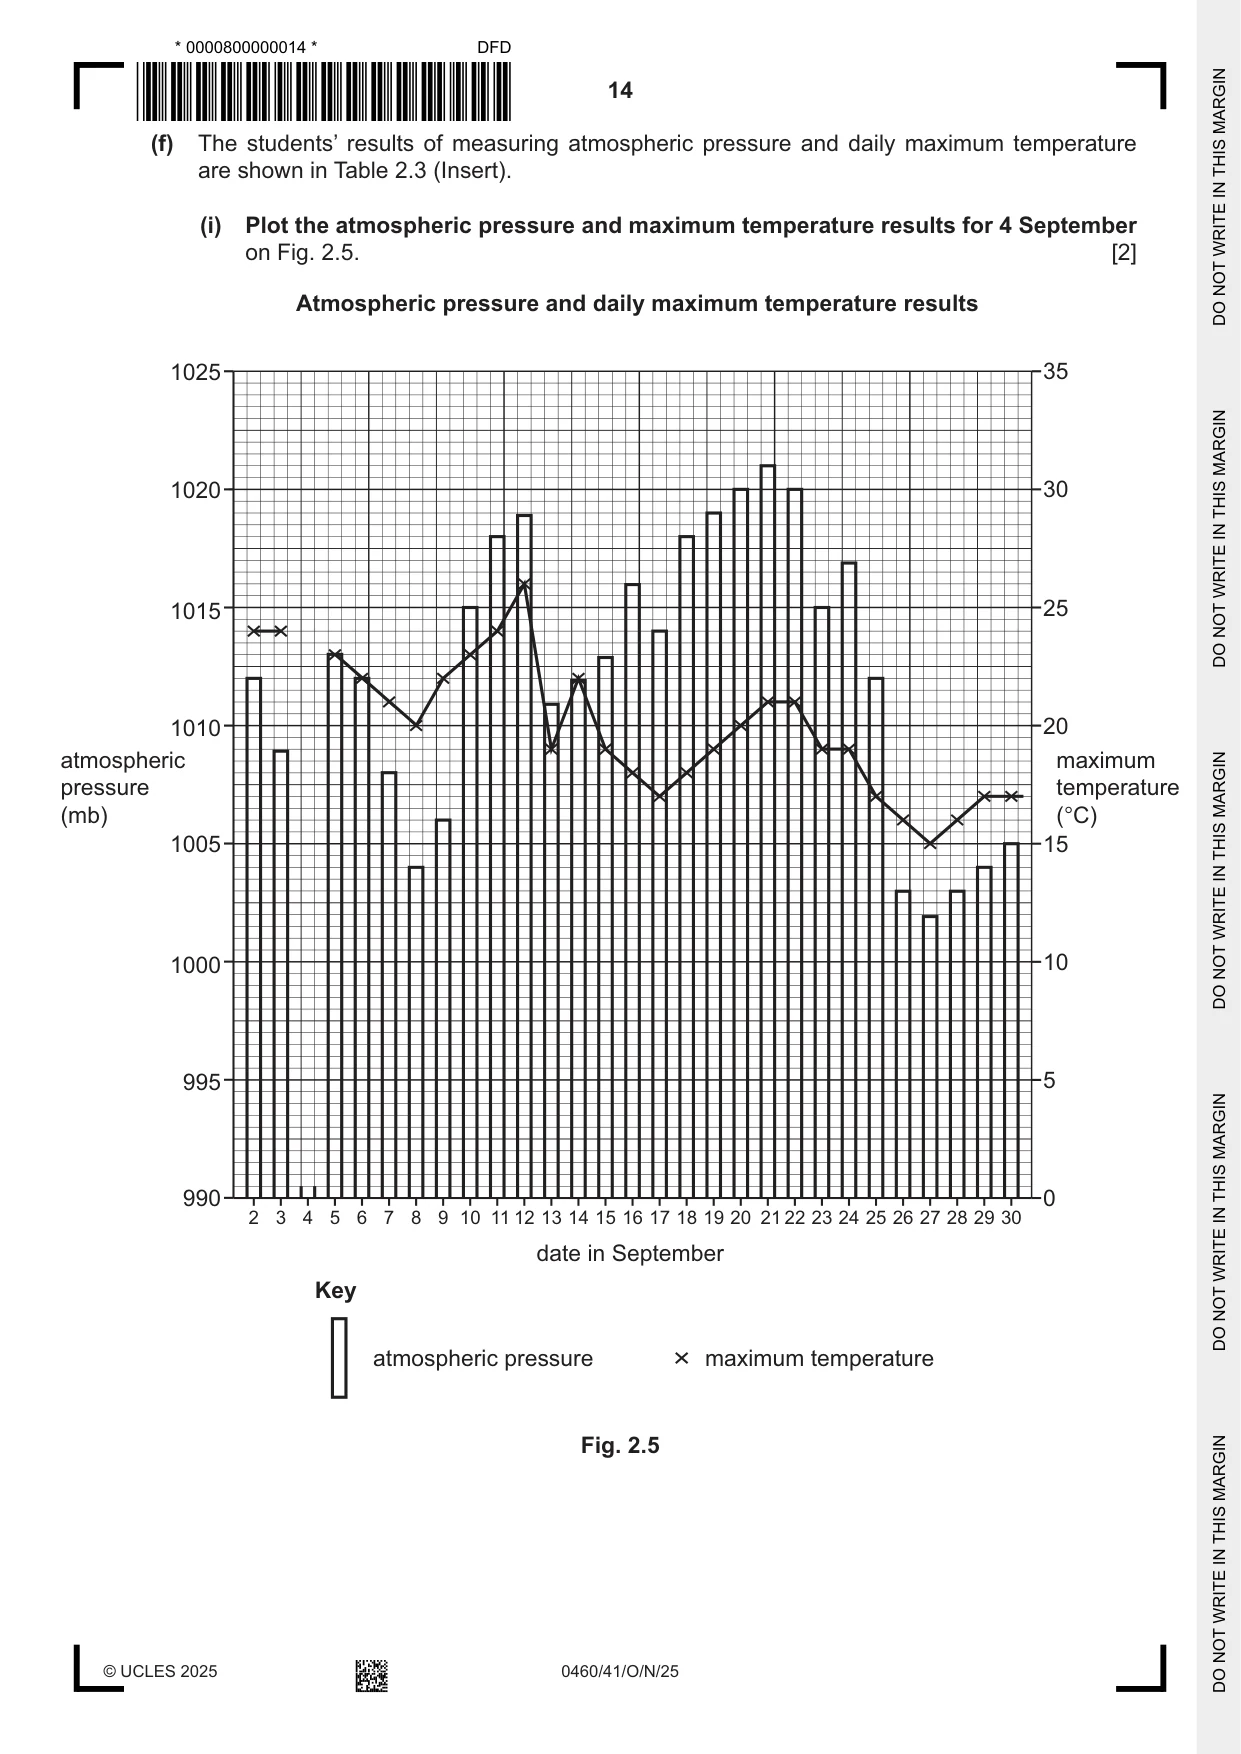
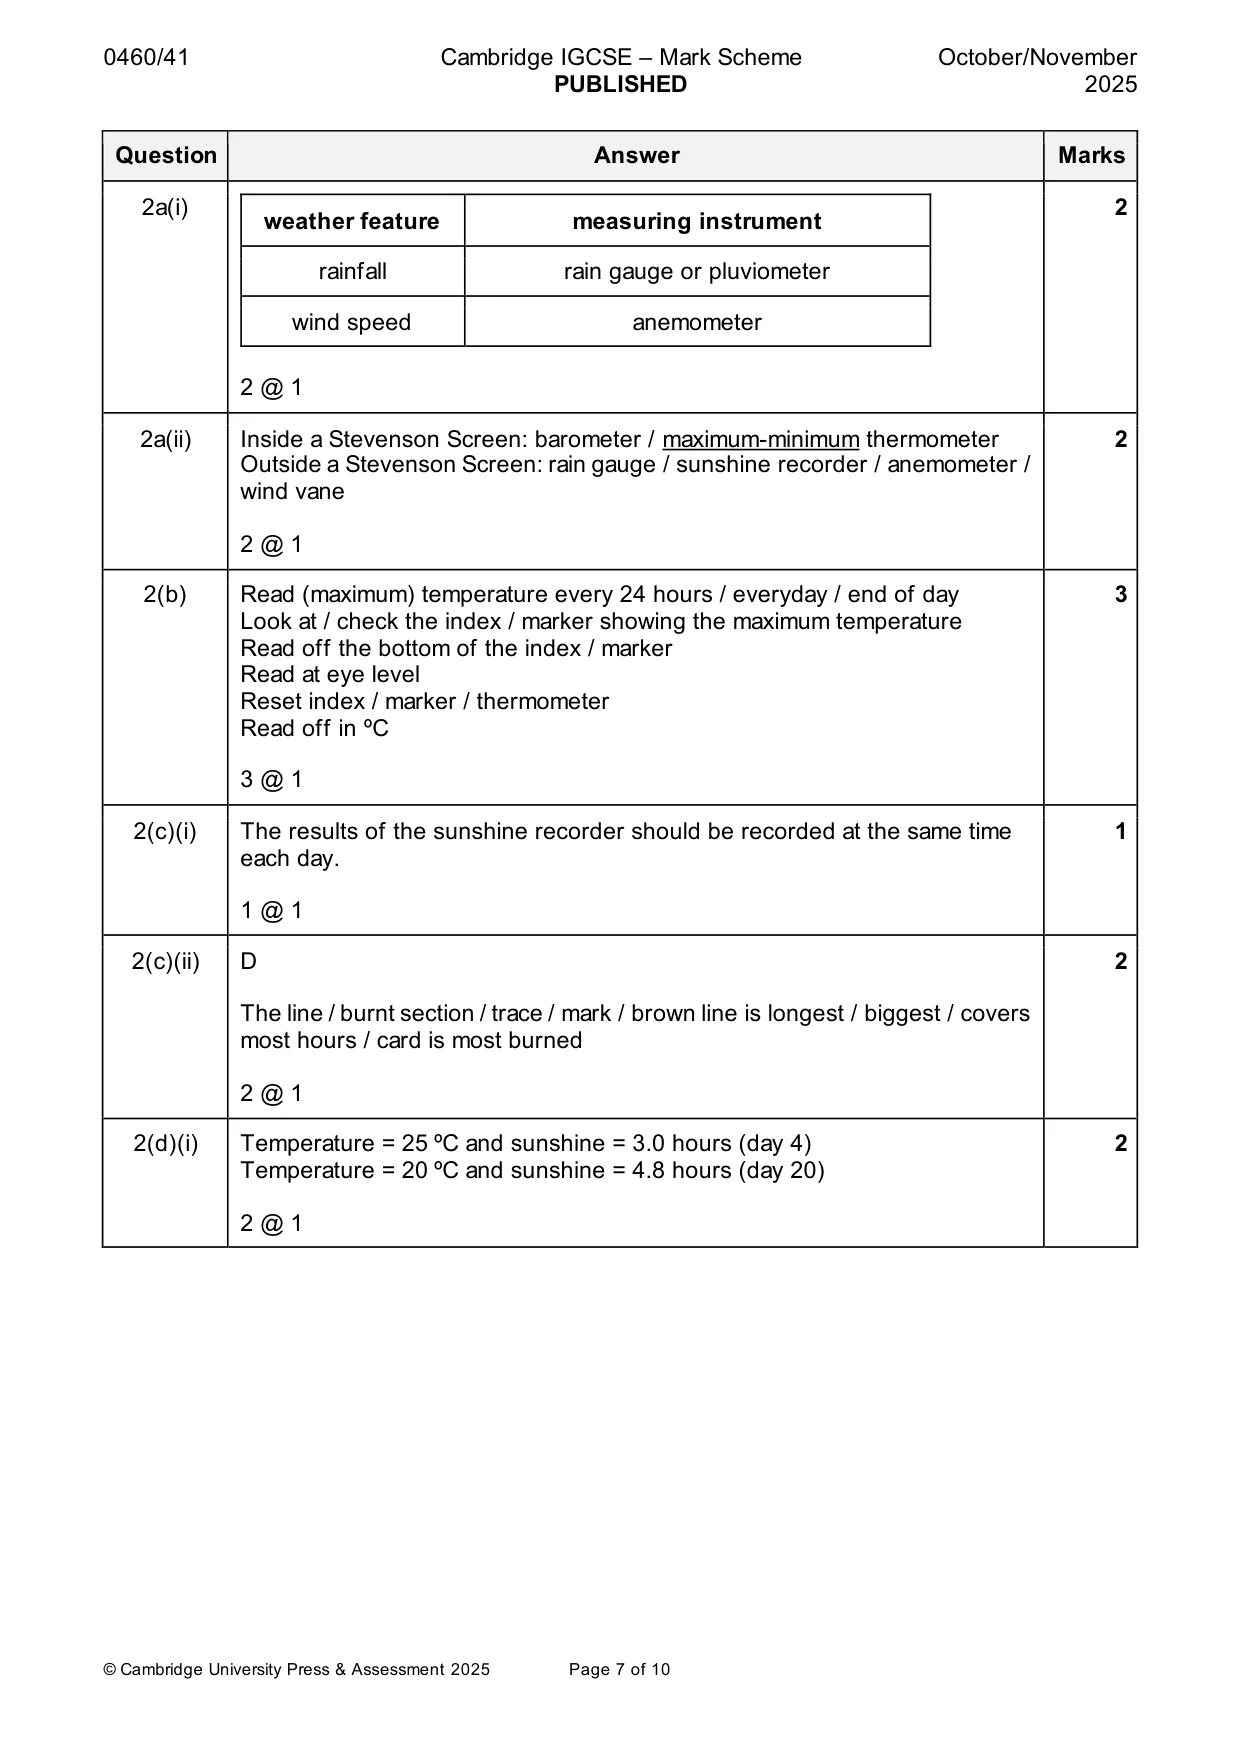
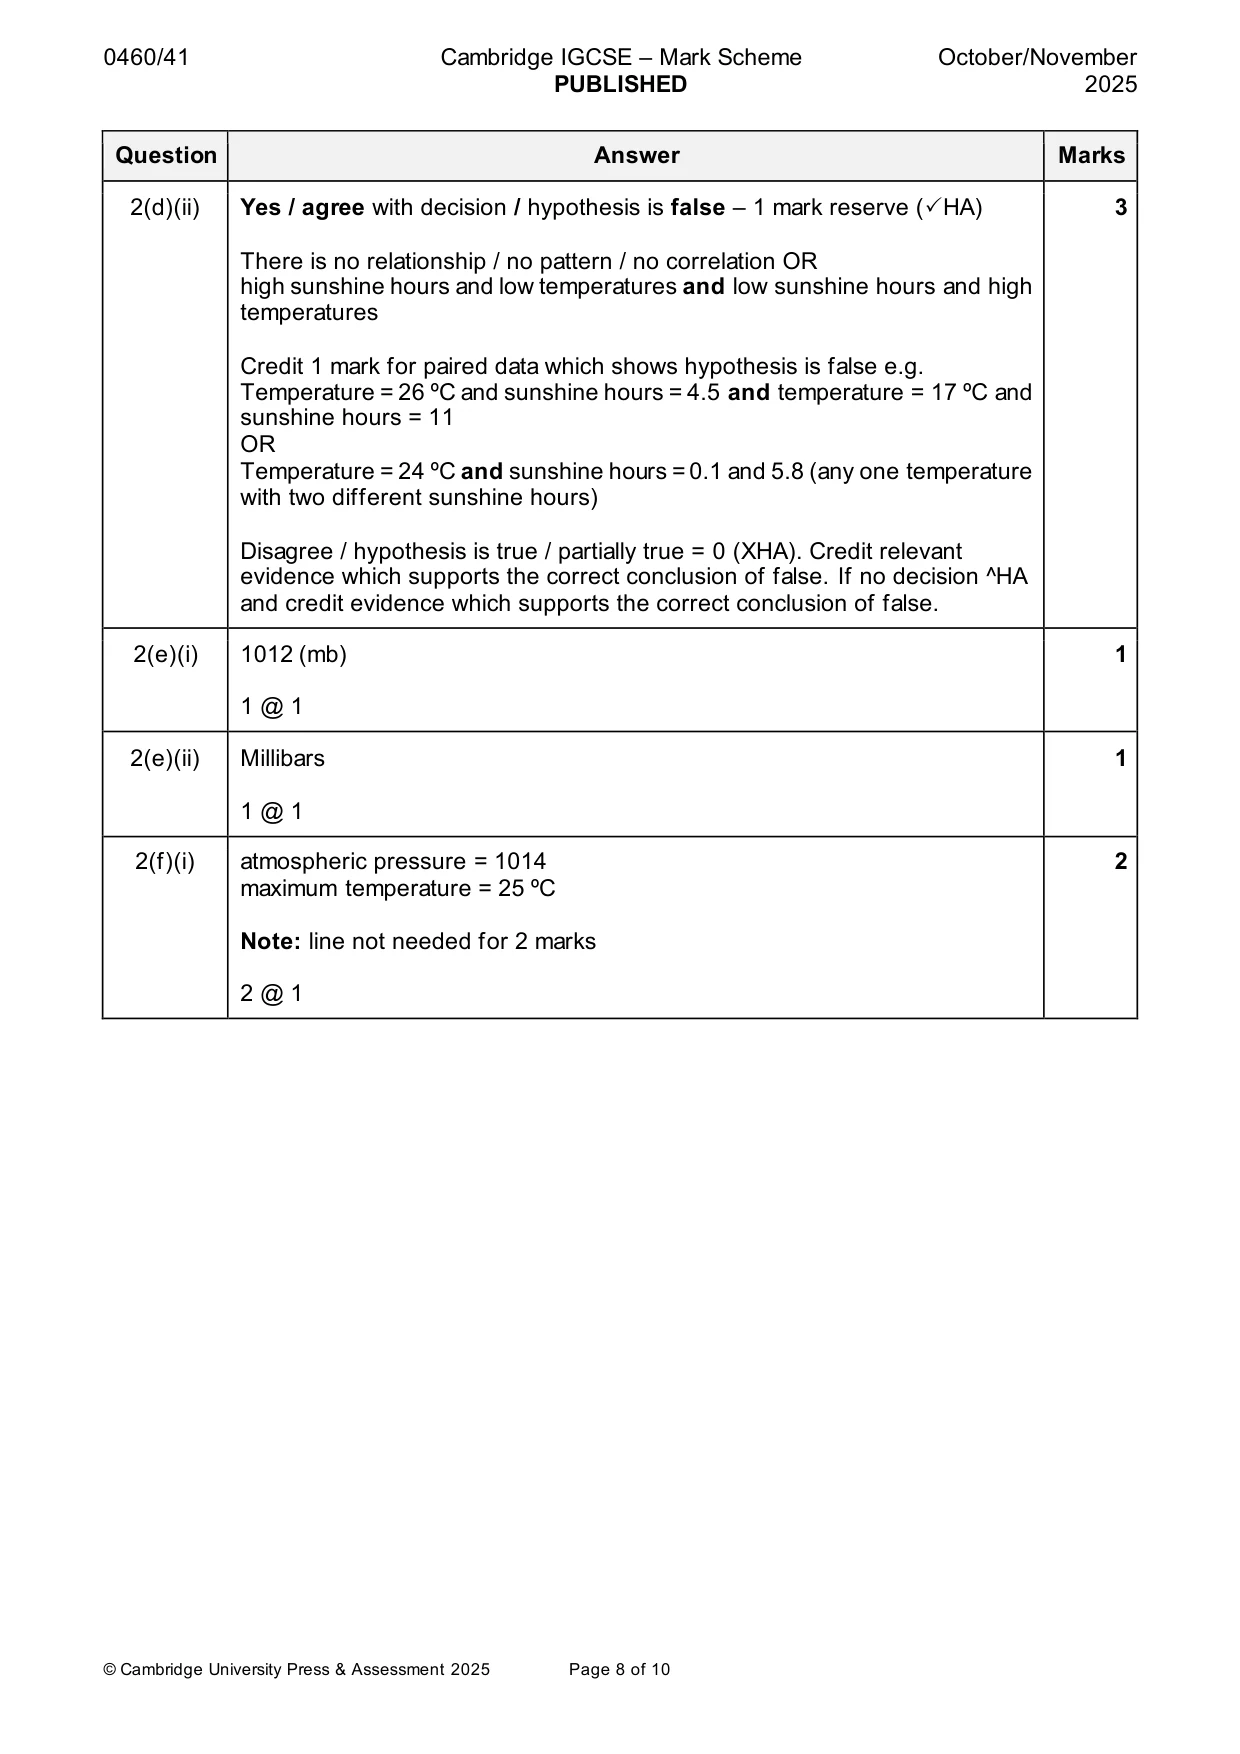
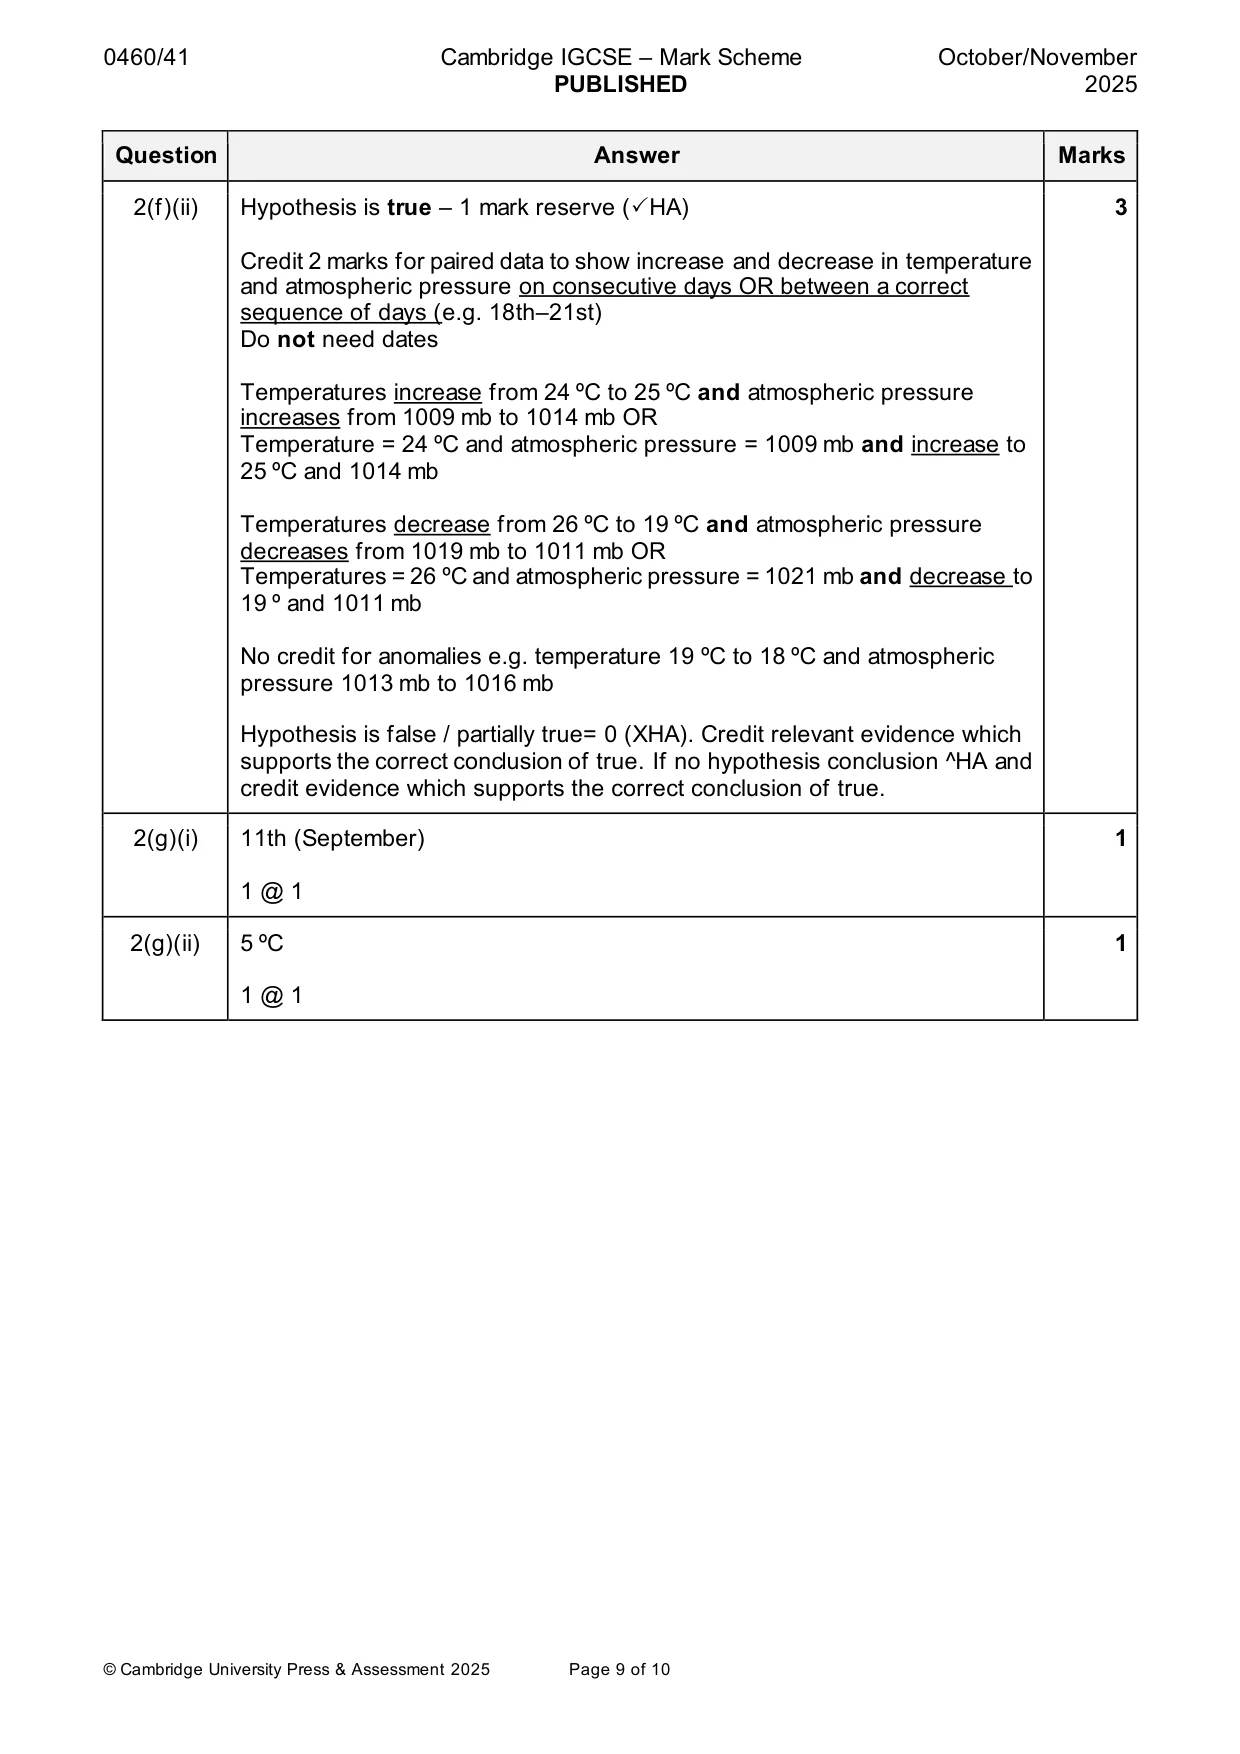
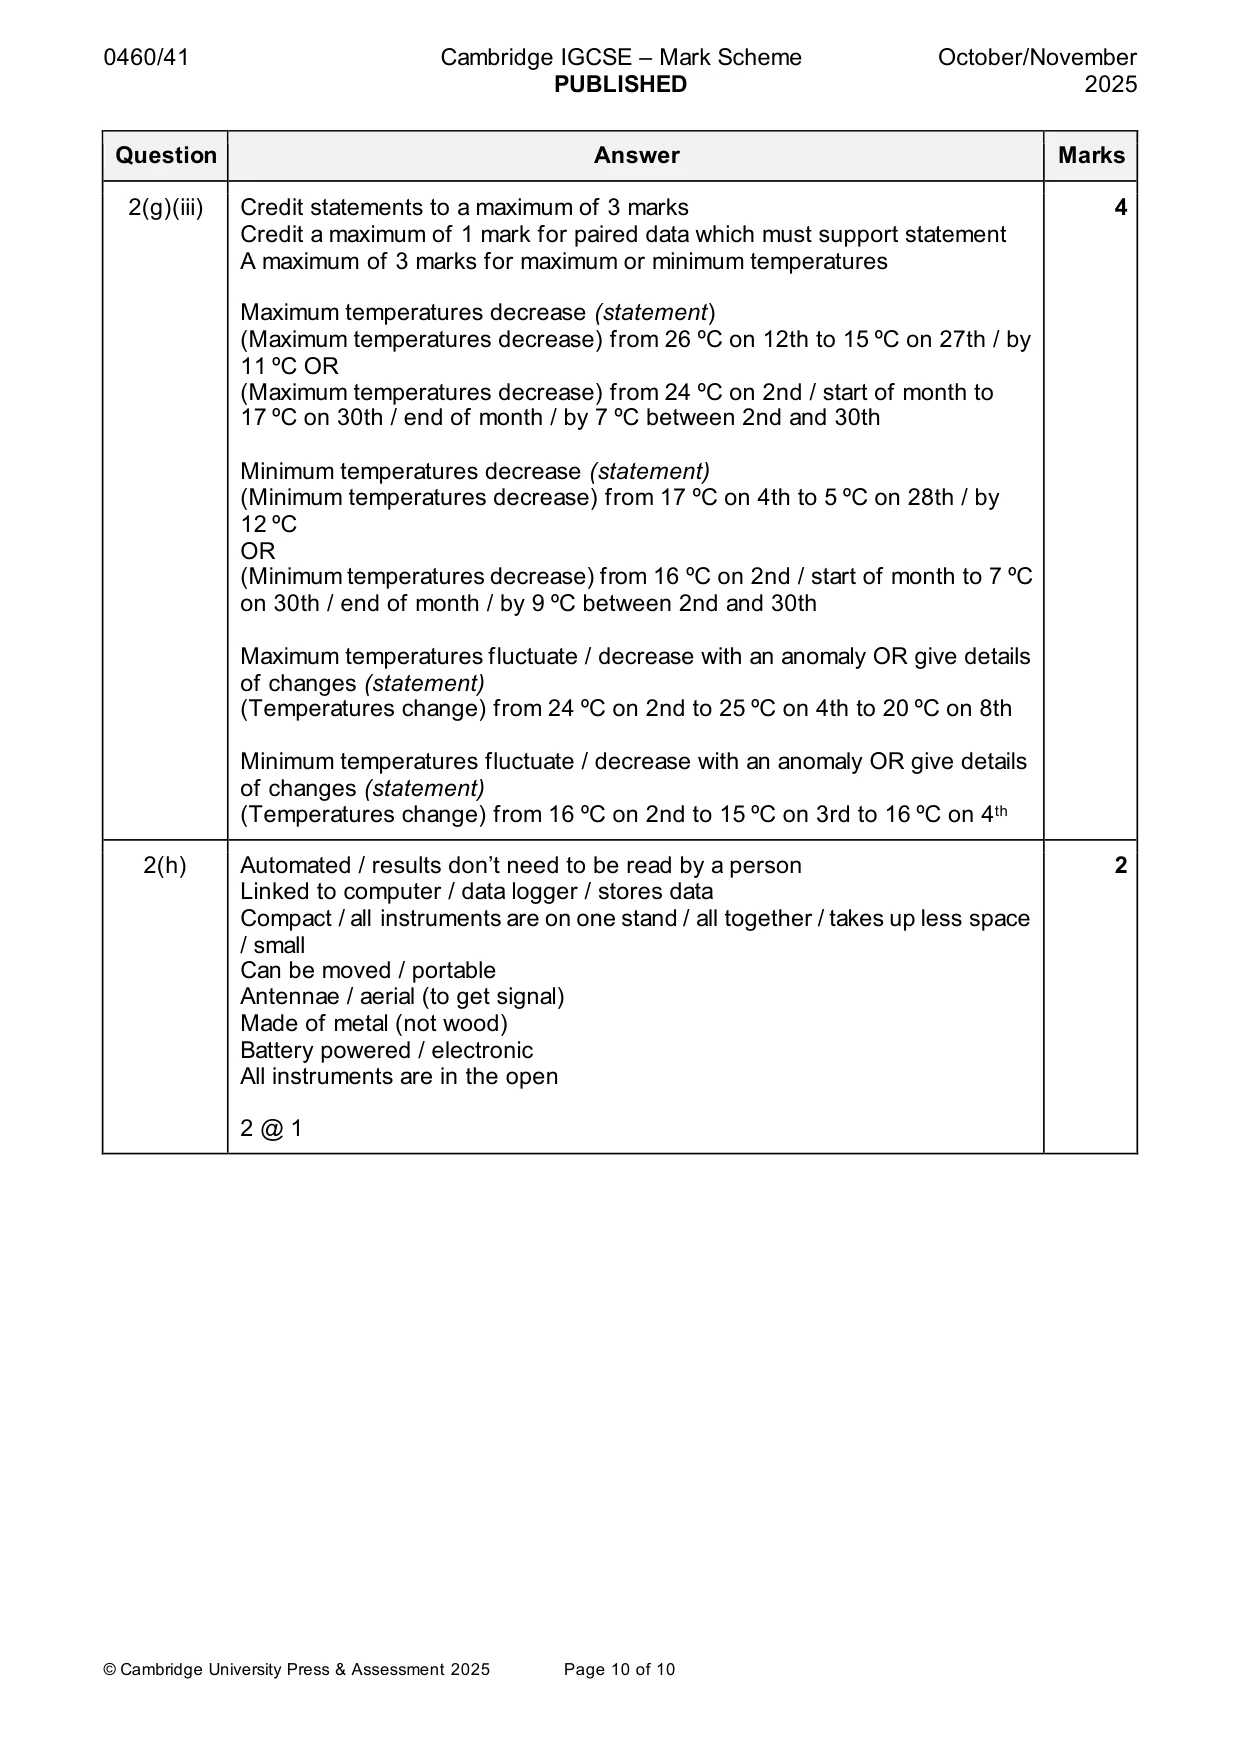
Mark scheme: 2(b) Read (maximum) temperature every 24 hours / everyday / end of day 3 Look at / check the index / marker showing the maximum temperature Read off the bottom of the index / marker Read at eye level Reset index / marker / thermometer Read off in ºC 3 @ 1 2(c)(i) The results of the sunshine recorder should be recorded at the same time 1 each day. 1 @ 1 2(c)(ii) D 2 The line / burnt section / trace / mark / brown line is longest / biggest / covers most hours / card is most burned 2 @ 1 2(d)(i) Temperature = 25 ºC and sunshine = 3.0 hours (day 4) 2 Temperature = 20 ºC and sunshine = 4.8 hours (day 20) 2 @ 1 2(d)(ii) Yes / agree with decision / hypothesis is false – 1 mark reserve (HA) 3 There is no relationship / no pattern / no correlation OR high sunshine hours and low temperatures and low sunshine hours and high temperatures Credit 1 mark for paired data which shows hypothesis is false e.g. Temperature = 26 ºC and sunshine hours = 4.5 and temperature = 17 ºC and sunshine hours = 11 OR Temperature = 24 ºC and sunshine hours = 0.1 and 5.8 (any one temperature with two different sunshine hours) Disagree / hypothesis is true / partially true = 0 (XHA). Credit relevant evidence which supports the correct conclusion of false. If no decision ^HA and credit evidence which supports the correct conclusion of false. 2(e)(i) 1012 (mb) 1 1 @ 1 2(e)(ii) Millibars 1 1 @ 1 2(f)(i) atmospheric pressure = 1014 2 maximum temperature = 25 ºC Note: line not needed for 2 marks 2 @ 1 2(f)(ii) Hypothesis is true – 1 mark reserve (HA) 3 Credit 2 marks for paired data to show increase and decrease in temperature and atmospheric pressure on consecutive days OR between a correct sequence of days (e.g. 18th–21st) Do not need dates Temperatures increase from 24 ºC to 25 ºC and atmospheric pressure increases from 1009 mb to 1014 mb OR Temperature = 24 ºC and atmospheric pressure = 1009 mb and increase to 25 ºC and 1014 mb Temperatures decrease from 26 ºC to 19 ºC and atmospheric pressure decreases from 1019 mb to 1011 mb OR Temperatures = 26 ºC and atmospheric pressure = 1021 mb and decrease to 19 º and 1011 mb No credit for anomalies e.g. temperature 19 ºC to 18 ºC and atmospheric pressure 1013 mb to 1016 mb Hypothesis is false / partially true= 0 (XHA). Credit relevant evidence which supports the correct conclusion of true. If no hypothesis conclusion ^HA and credit evidence which supports the correct conclusion of true. 2(g)(i) 11th (September) 1 1 @ 1 2(g)(ii) 5 ºC 1 1 @ 1 2(g)(iii) Credit statements to a maximum of 3 marks 4 Credit a maximum of 1 mark for paired data which must support statement A maximum of 3 marks for maximum or minimum temperatures Maximum temperatures decrease (statement) (Maximum temperatures decrease) from 26 ºC on 12th to 15 ºC on 27th / by 11 ºC OR (Maximum temperatures decrease) from 24 ºC on 2nd / start of month to 17 ºC on 30th / end of month / by 7 ºC between 2nd and 30th Minimum temperatures decrease (statement) (Minimum temperatures decrease) from 17 ºC on 4th to 5 ºC on 28th / by 12 ºC OR (Minimum temperatures decrease) from 16 ºC on 2nd / start of month to 7 ºC on 30th / end of month / by 9 ºC between 2nd and 30th Maximum temperatures fluctuate / decrease with an anomaly OR give details of changes (statement) (Temperatures change) from 24 ºC on 2nd to 25 ºC on 4th to 20 ºC on 8th Minimum temperatures fluctuate / decrease with an anomaly OR give details of changes (statement) (Temperatures change) from 16 ºC on 2nd to 15 ºC on 3rd to 16 ºC on 4th 2(h) Automated / results don’t need to be read by a person 2 Linked to computer / data logger / stores data Compact / all instruments are on one stand / all together / takes up less space / small Can be moved / portable Antennae / aerial (to get signal) Made of metal (not wood) Battery powered / electronic All instruments are in the open 2 @ 1
What was in this paper
The subtopics covered by these 2 questions, and how many questions each got. Open one in a new tab to see every Cambridge question on it.
What you needed in this session
Cambridge’s own grade thresholds for 2025 Oct/Nov, Paper 4 · Variant 1. A higher threshold means an easier paper — the bar moves with how the cohort did.