Cambridge IGCSE Geography 0460 — 2022 May/June Paper 4 · Variant 3
0460/43/M/J/22 · 2 questions · 60 marks · ≈68 min
The question paper and its mark scheme, free to read here and free to download. This is Cambridge’s own paper, exactly as it was sat.
Question paper16 pages
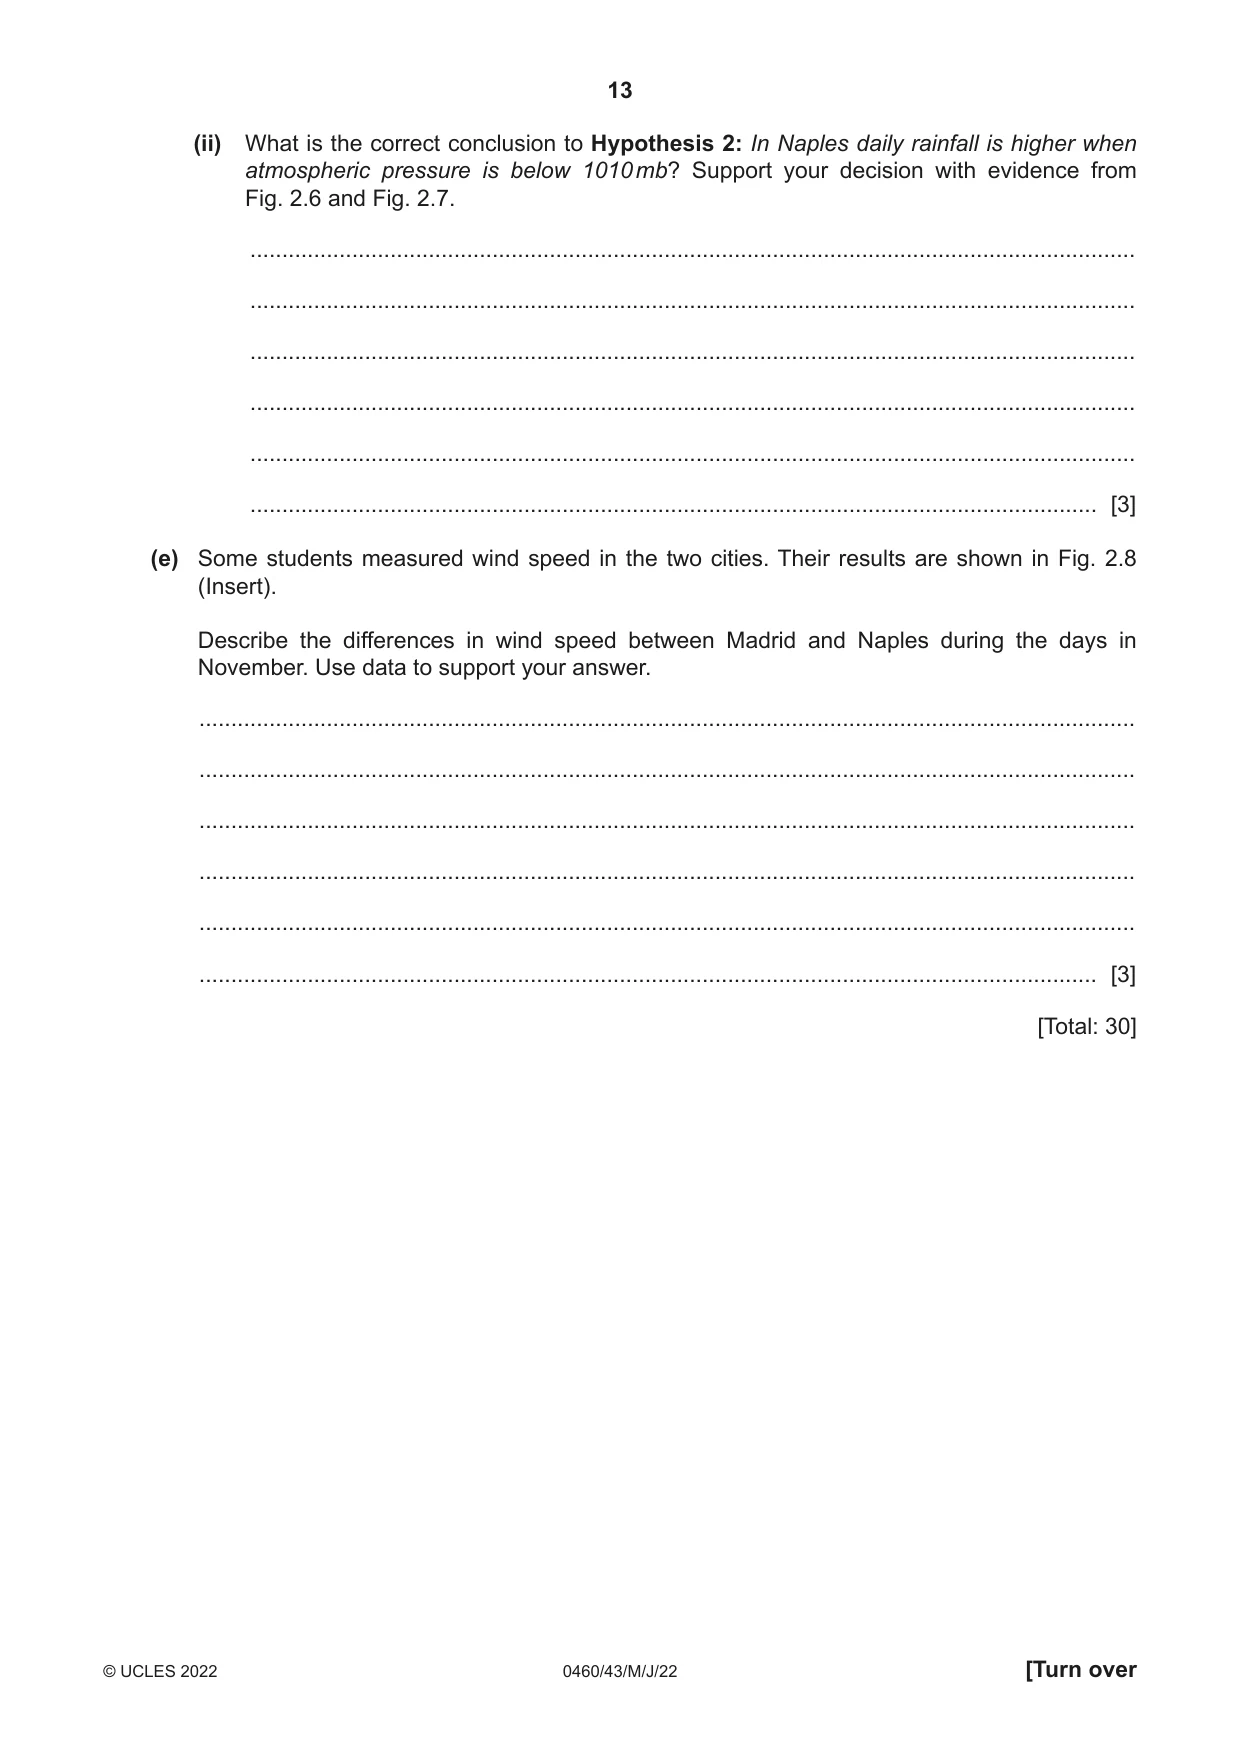


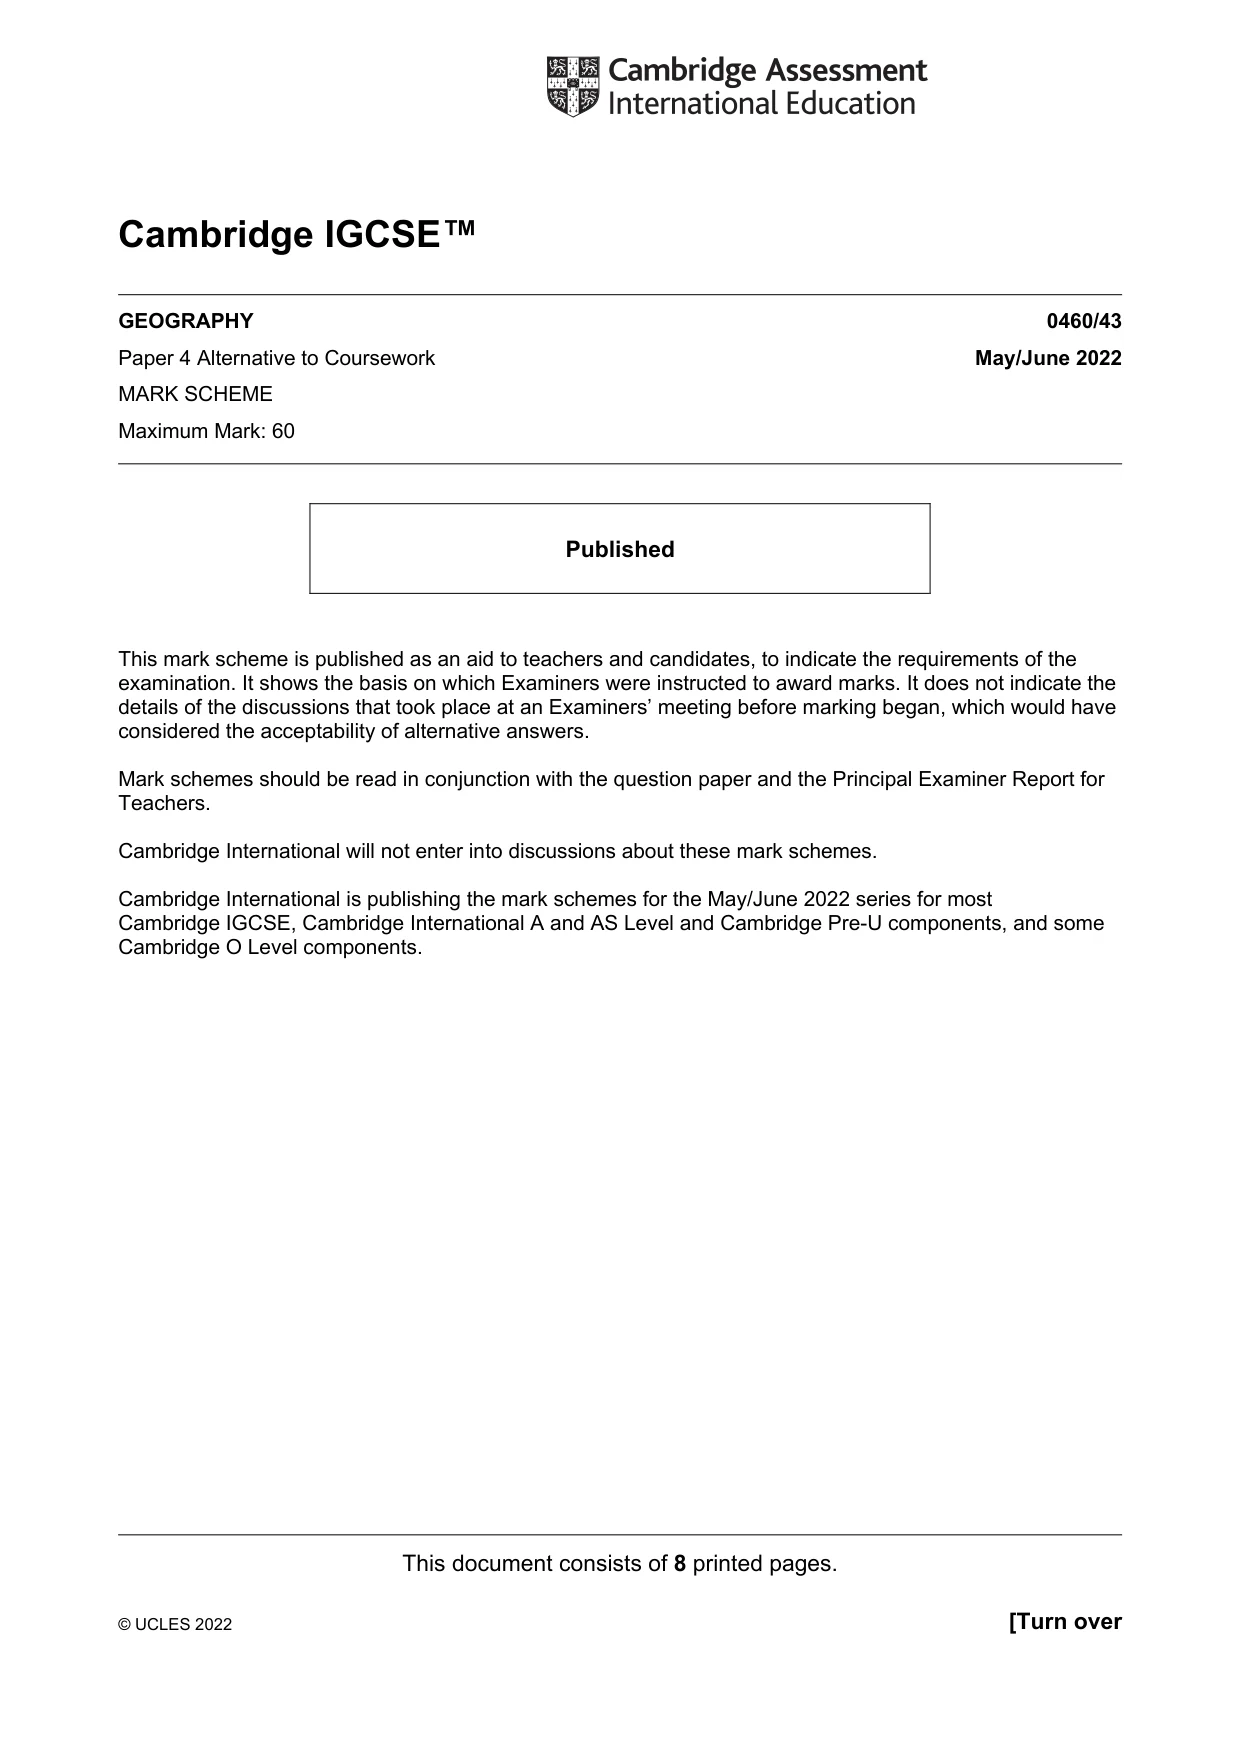
Mark scheme8 pages
Answers below. Sit the paper first if you are practising.
Questions as text
Q1 · Students in Rome, the capital city of Italy (an MEDC), were studying tourism
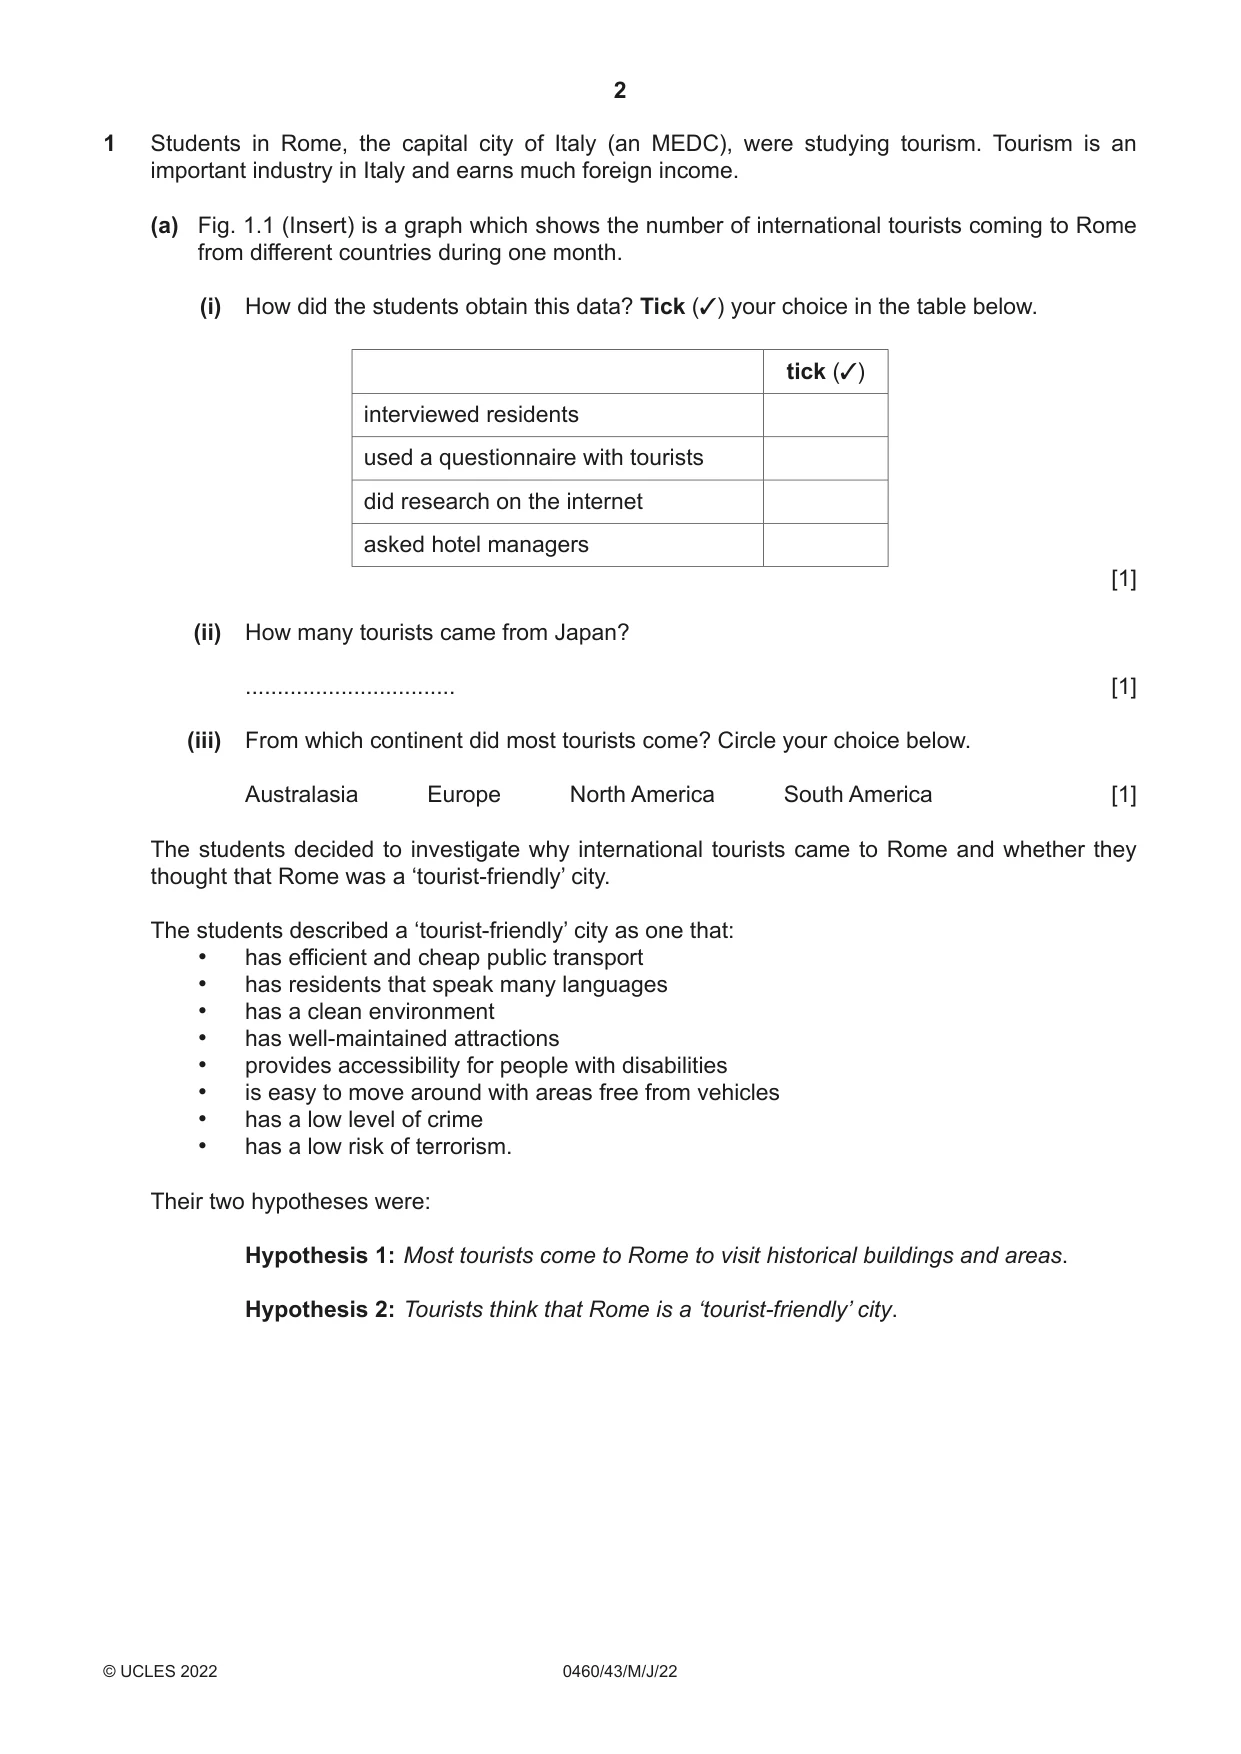
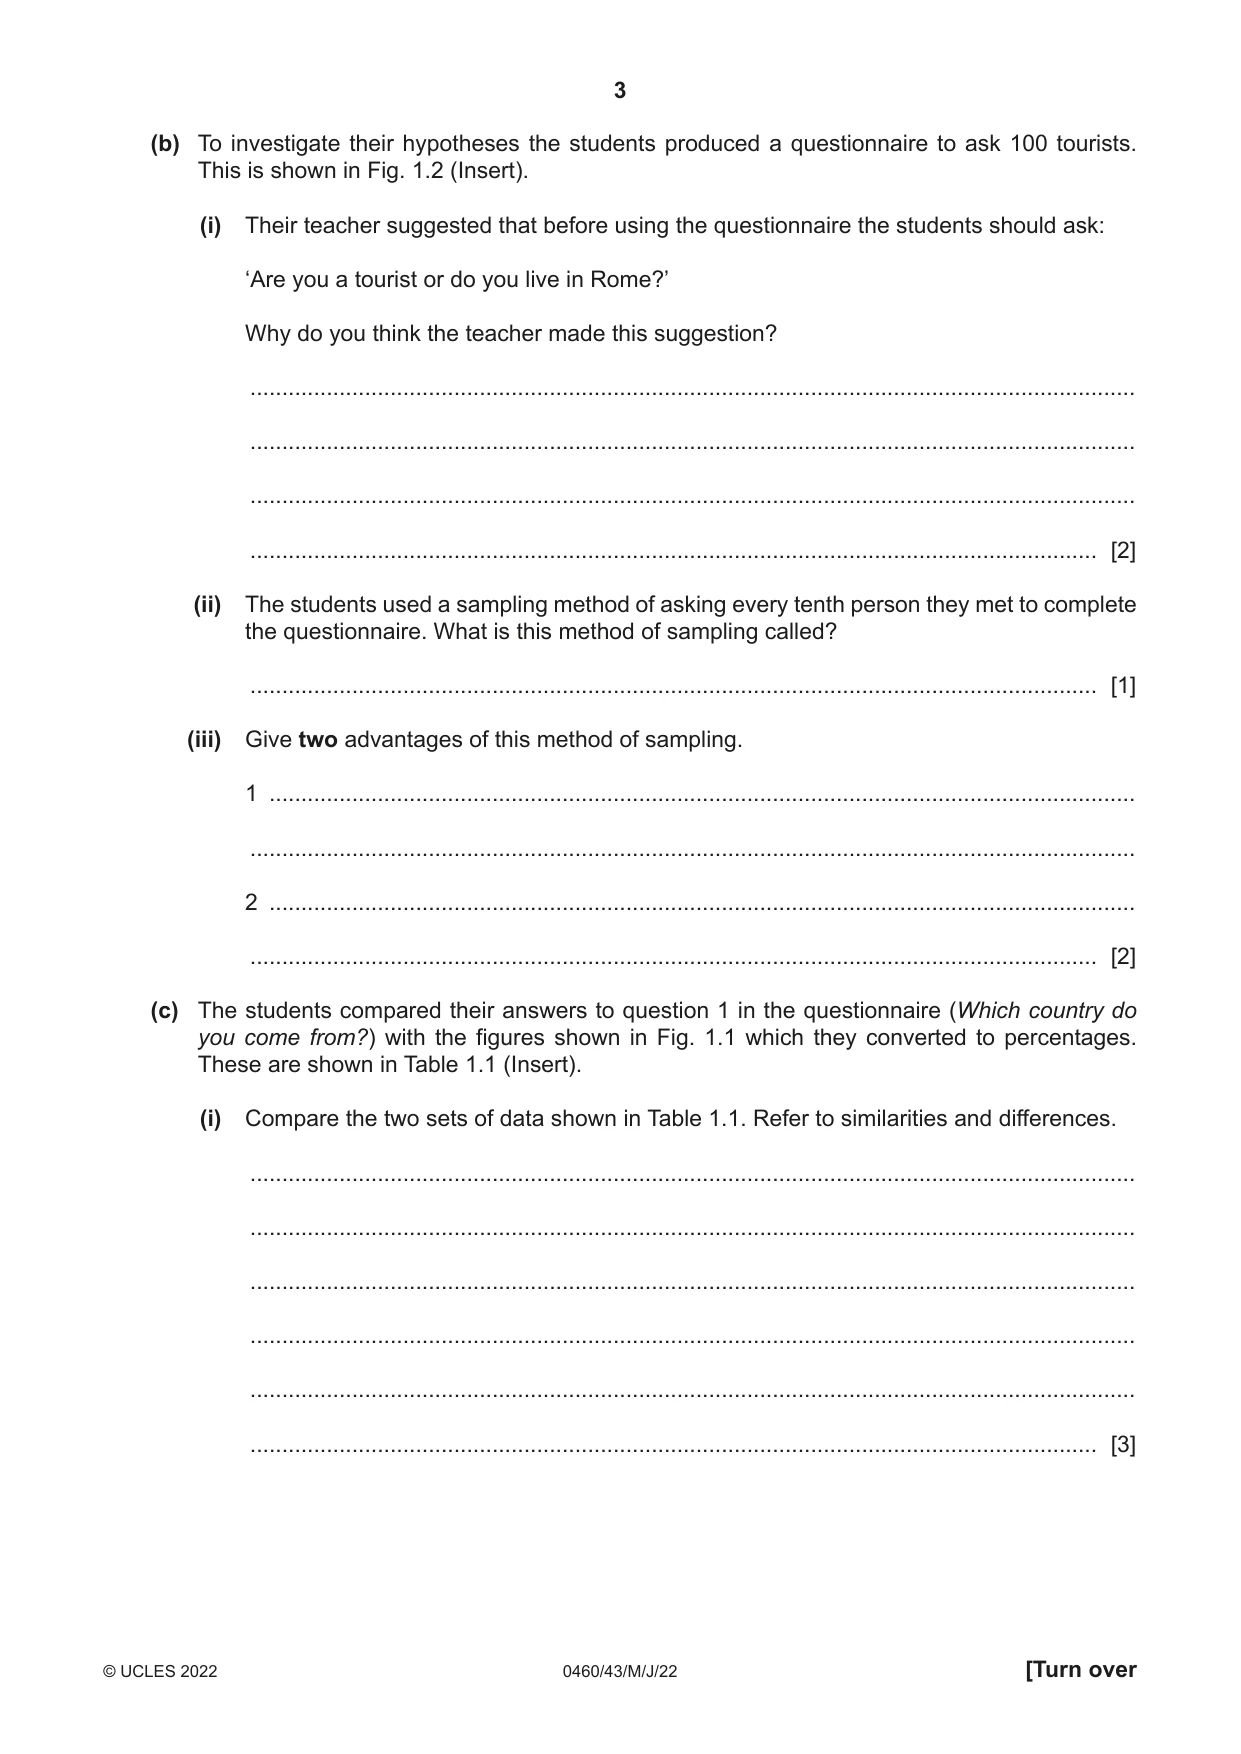
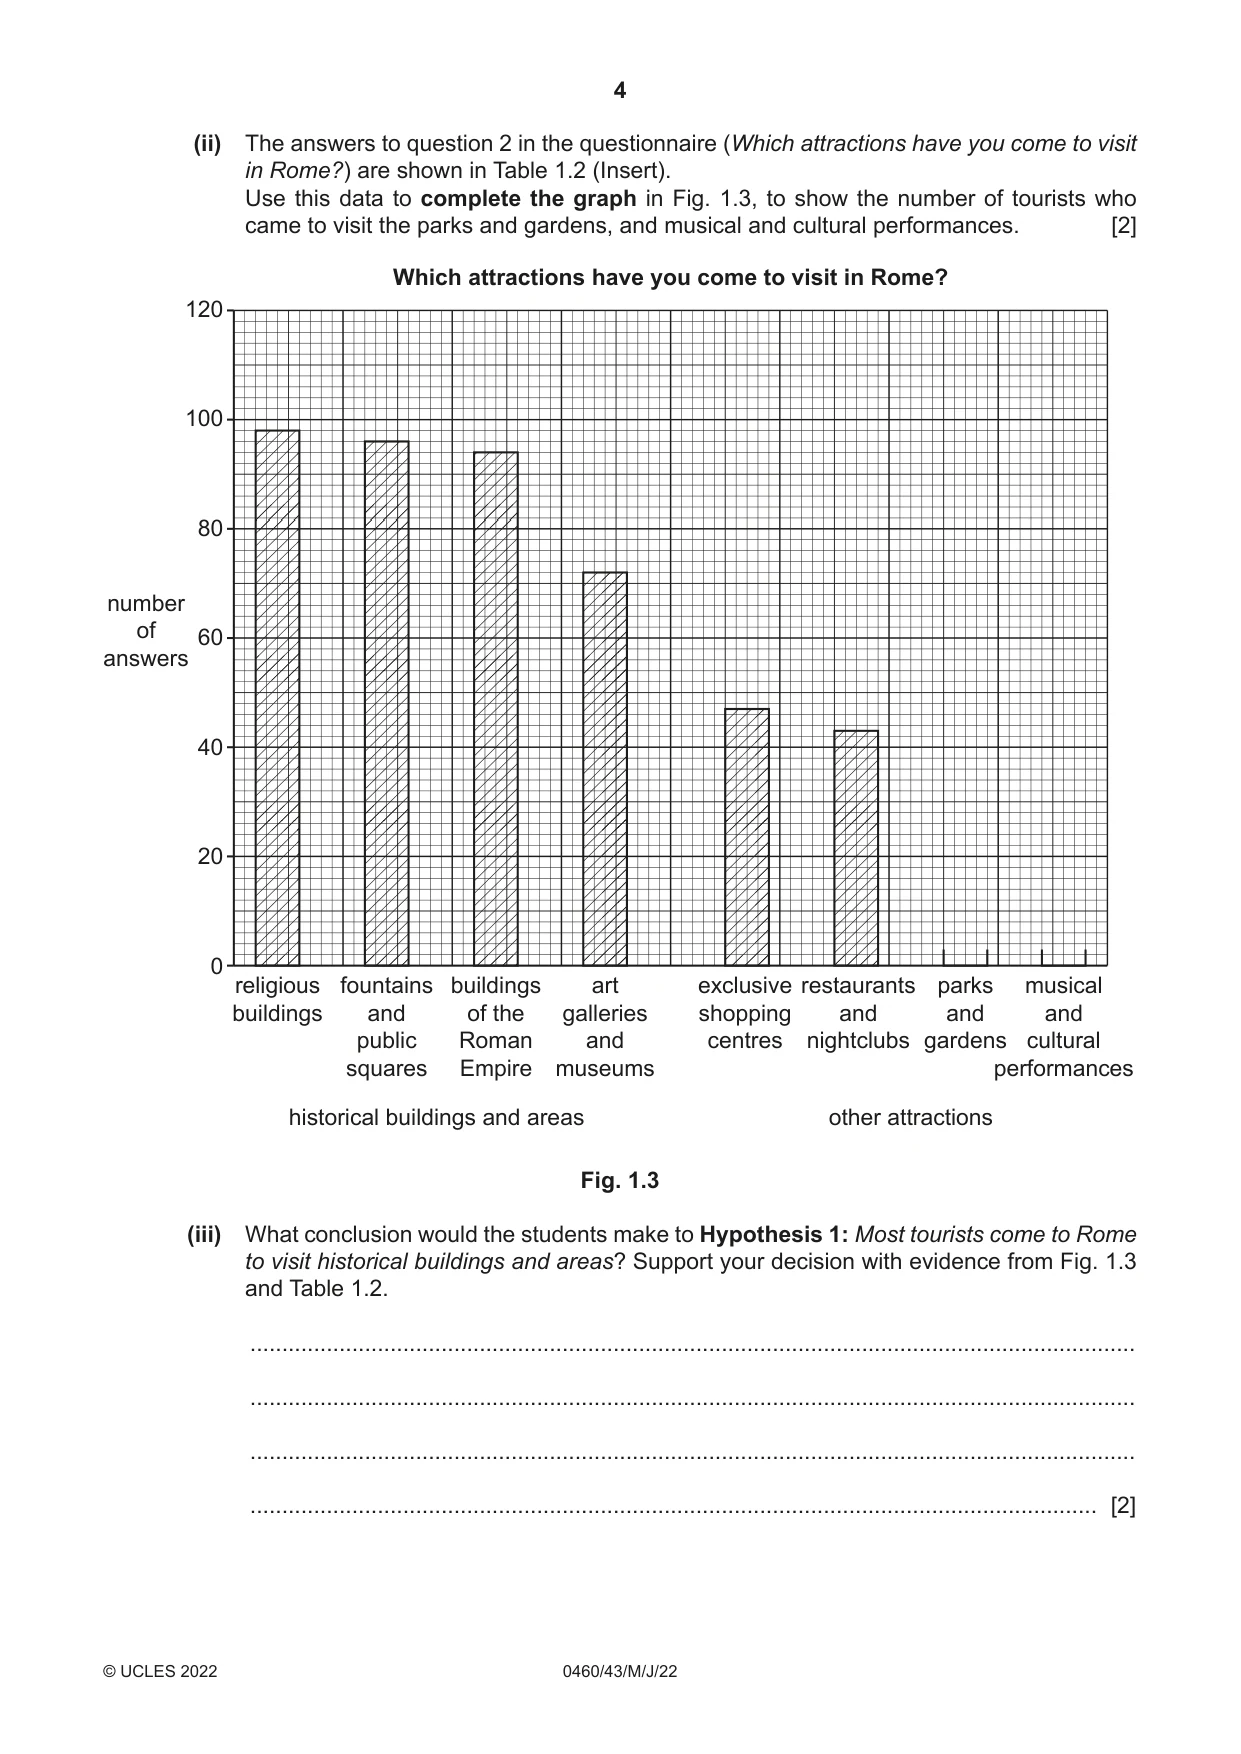
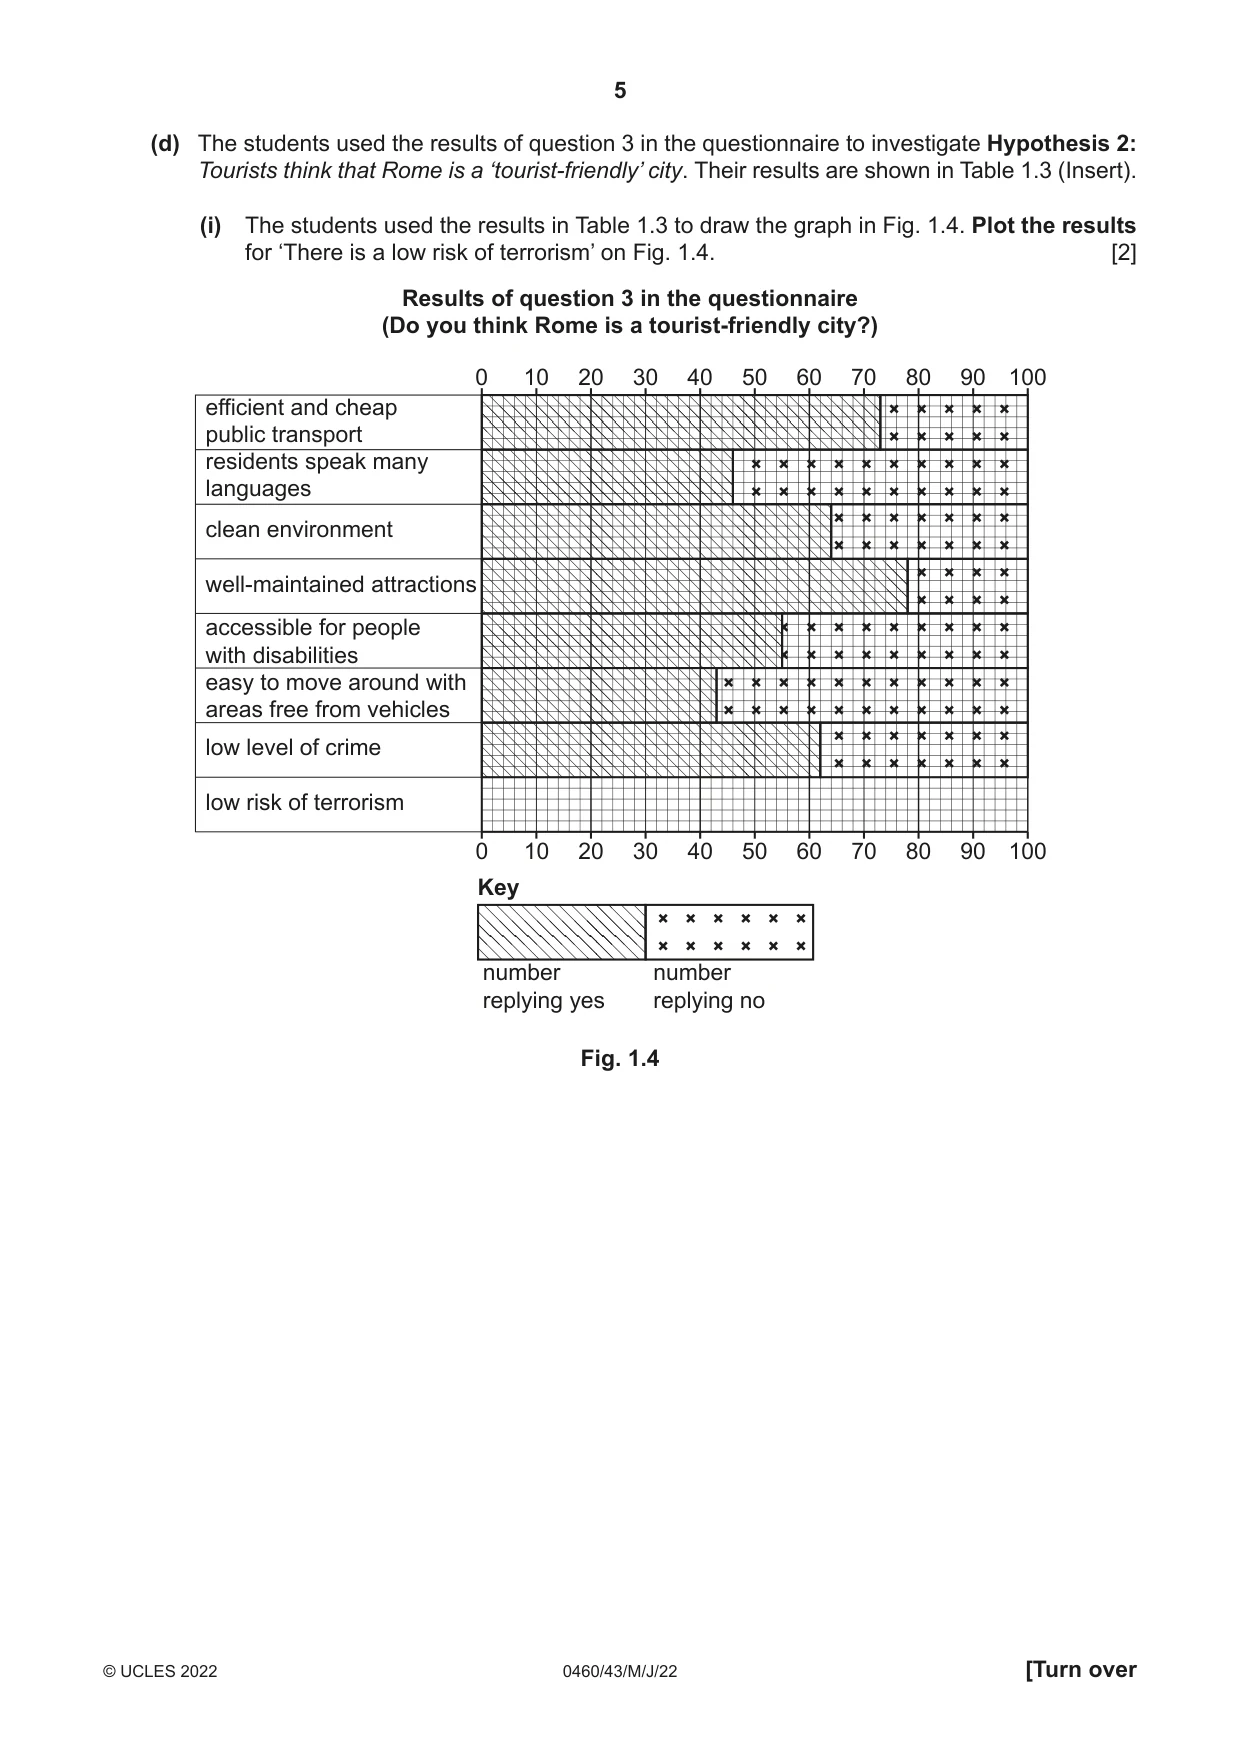
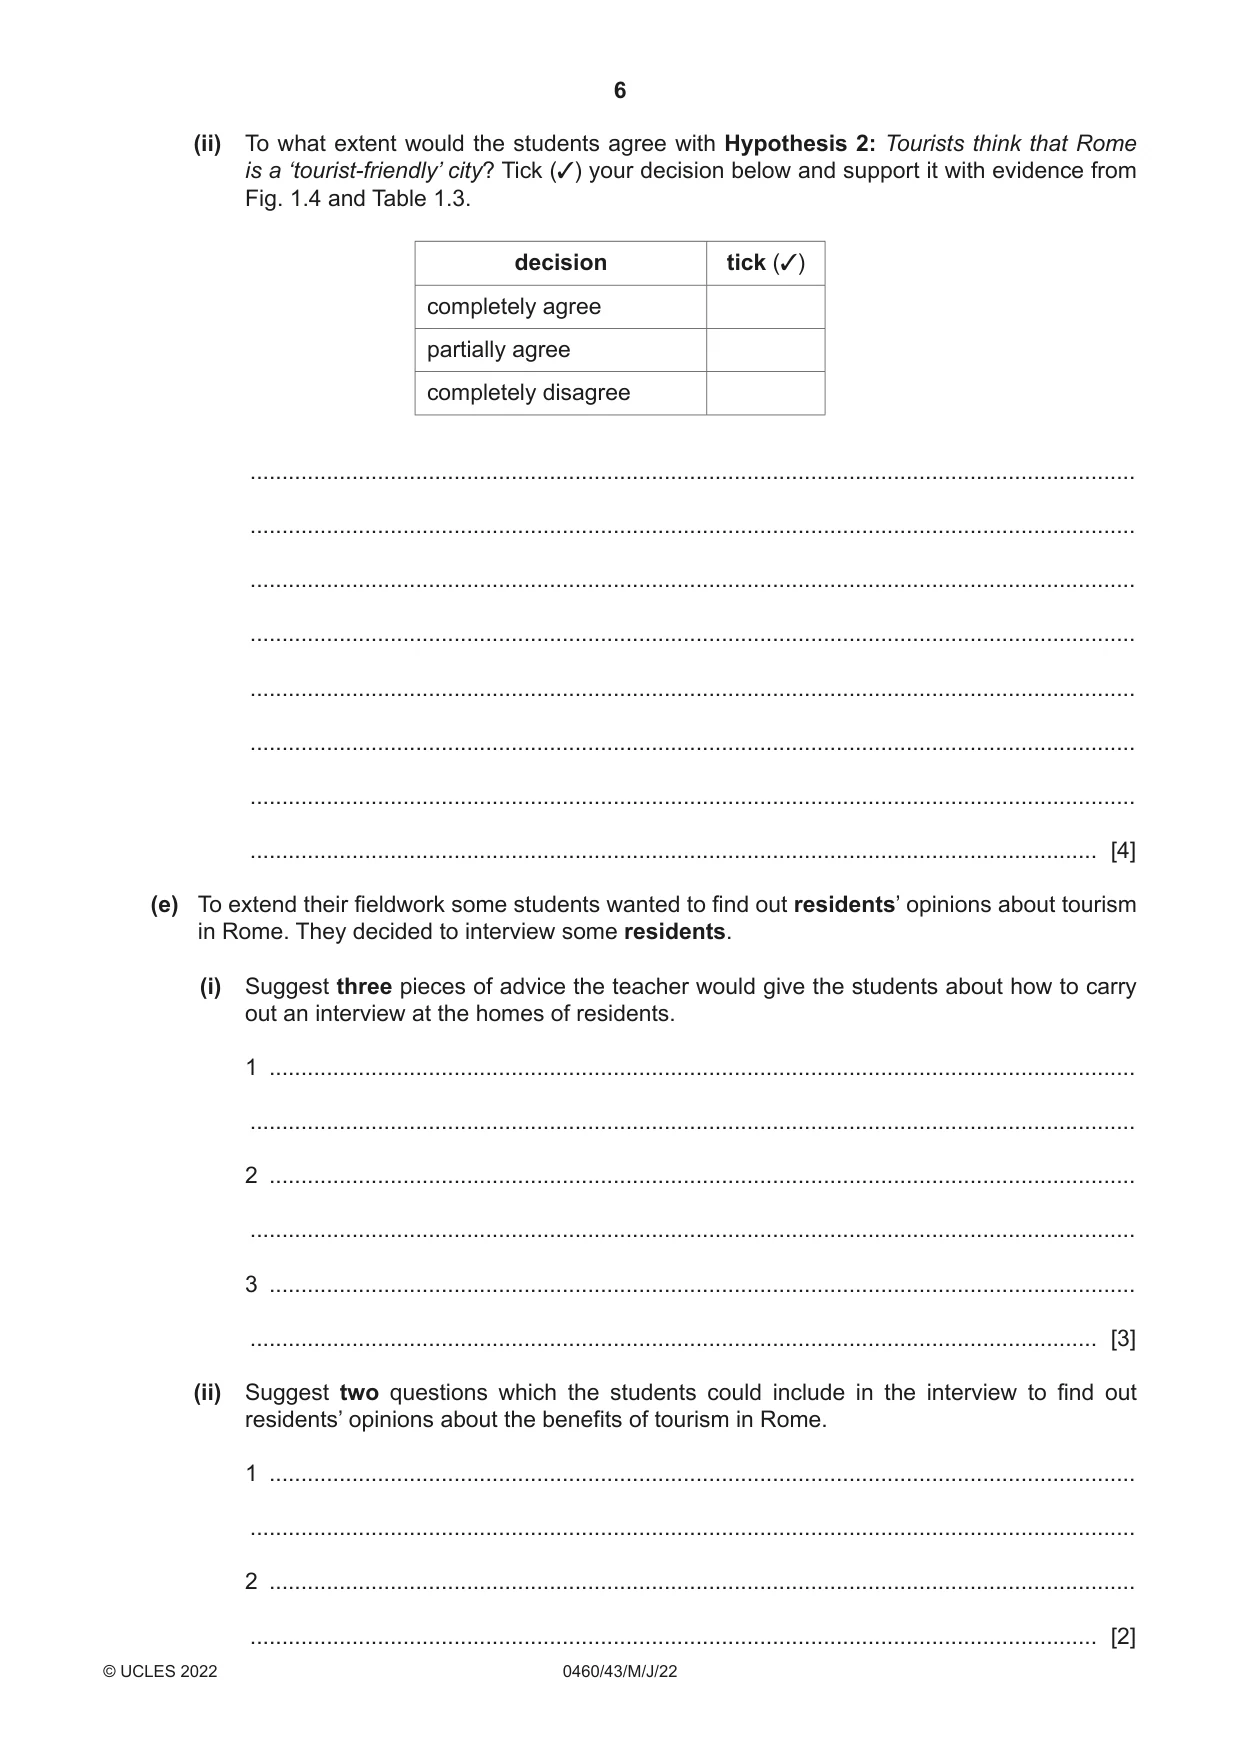
1 Students in Rome, the capital city of Italy (an MEDC), were studying tourism. Tourism is an important industry in Italy and earns much foreign income. (a) Fig. 1.1 (Insert) is a graph which shows the number of international tourists coming to Rome from different countries during one month. (i) How did the students obtain this data? Tick (3) your choice in the table below. tick (3) interviewed residents used a questionnaire with tourists did research on the internet asked hotel managers [1] (ii) How many tourists came from Japan? ................................. [1] (iii) From which continent did most tourists come? Circle your choice below. Australasia Europe North America South America [1] The students decided to investigate why international tourists came to Rome and whether they thought that Rome was a ‘tourist-friendly’ city. The students described a ‘tourist-friendly’ city as one that: • has efficient and cheap public transport • has residents that speak many languages • has a clean environment • has well-maintained attractions • provides accessibility for people with disabilities • is easy to move around with areas free from vehicles • has a low level of crime • has a low risk of terrorism. Their two hypotheses were: Hypothesis 1: Most tourists come to Rome to visit historical buildings and areas. Hypothesis 2: Tourists think that Rome is a ‘tourist-friendly’ city. (b) To investigate their hypotheses the students produced a questionnaire to ask 100 tourists. This is shown in Fig. 1.2 (Insert). (i) Their teacher suggested that before using the questionnaire the students should ask: ‘Are you a tourist or do you live in Rome?’ Why do you think the teacher made this suggestion? ........................................................................................................................................... ........................................................................................................................................... ........................................................................................................................................... ..................................................................................................................................... [2] (ii) The students used a sampling method of asking every tenth person they met to complete the questionnaire. What is this method of sampling called? ..................................................................................................................................... [1] (iii) Give two advantages of this method of sampling. 1 ........................................................................................................................................ ........................................................................................................................................... 2 ........................................................................................................................................ ..................................................................................................................................... [2] (c) The students compared their answers to question 1 in the questionnaire (Which country do you come from?) with the figures shown in Fig. 1.1 which they converted to percentages. These are shown in Table 1.1 (Insert). (i) Compare the two sets of data shown in Table 1.1. Refer to similarities and differences. ........................................................................................................................................... ........................................................................................................................................... ........................................................................................................................................... ........................................................................................................................................... ........................................................................................................................................... ..................................................................................................................................... [3] (ii) The answers to question 2 in the questionnaire (Which attractions have you come to visit in Rome?) are shown in Table 1.2 (Insert). Use this data to complete the graph in Fig. 1.3, to show the number of tourists who came to visit the parks and gardens, and musical and cultural performances. [2] Which attractions have you come to visit in Rome? 120 100 80 number of 60 answers 40 20 0 religious fountains buildings art exclusive restaurants parks musical buildings and of the galleries shopping and and and public Roman and centres nightclubs gardens cultural squares Empire museums performances historical buildings and areas other attractions Fig. 1.3 (iii) What conclusion would the students make to Hypothesis 1: Most tourists come to Rome to visit historical buildings and areas? Support your decision with evidence from Fig. 1.3 and Table 1.2. ........................................................................................................................................... ........................................................................................................................................... ........................................................................................................................................... ..................................................................................................................................... [2] (d) The students used the results of question 3 in the questionnaire to investigate Hypothesis 2: Tourists think that Rome is a ‘tourist-friendly’ city. Their results are shown in Table 1.3 (Insert). (i) The students used the results in Table 1.3 to draw the graph in Fig. 1.4. Plot the results for ‘There is a low risk of terrorism’ on Fig. 1.4. [2] Results of question 3 in the questionnaire (Do you think Rome is a tourist-friendly city?) 0 10 20 30 40 50 60 70 80 90 100 efficient and cheap public transport residents speak many languages clean environment well-maintained attractions accessible for people with disabilities easy to move around with areas free from vehicles low level of crime low risk of terrorism 0 10 20 30 40 50 60 70 80 90 100 Key number number replying yes replying no Fig. 1.4 (ii) To what extent would the students agree with Hypothesis 2: Tourists think that Rome is a ‘tourist-friendly’ city? Tick (3) your decision below and support it with evidence from Fig. 1.4 and Table 1.3. decision tick (3) completely agree partially agree completely disagree ........................................................................................................................................... ........................................................................................................................................... ........................................................................................................................................... ........................................................................................................................................... ........................................................................................................................................... ........................................................................................................................................... ........................................................................................................................................... ..................................................................................................................................... [4] (e) To extend their fieldwork some students wanted to find out residents’ opinions about tourism in Rome. They decided to interview some residents. (i) Suggest three pieces of advice the teacher would give the students about how to carry out an interview at the homes of residents. 1 ........................................................................................................................................ ........................................................................................................................................... 2 ........................................................................................................................................ ........................................................................................................................................... 3 ........................................................................................................................................ ..................................................................................................................................... [3] (ii) Suggest two questions which the students could include in the interview to find out residents’ opinions about the benefits of tourism in Rome. 1 ........................................................................................................................................ ........................................................................................................................................... 2 ........................................................................................................................................ ..................................................................................................................................... [2] (f) Describe the problems caused by tourism in a tourist city. ................................................................................................................................................... ................................................................................................................................................... ................................................................................................................................................... ................................................................................................................................................... ................................................................................................................................................... ................................................................................................................................................... ................................................................................................................................................... ............................................................................................................................................. [4] [Total: 30]
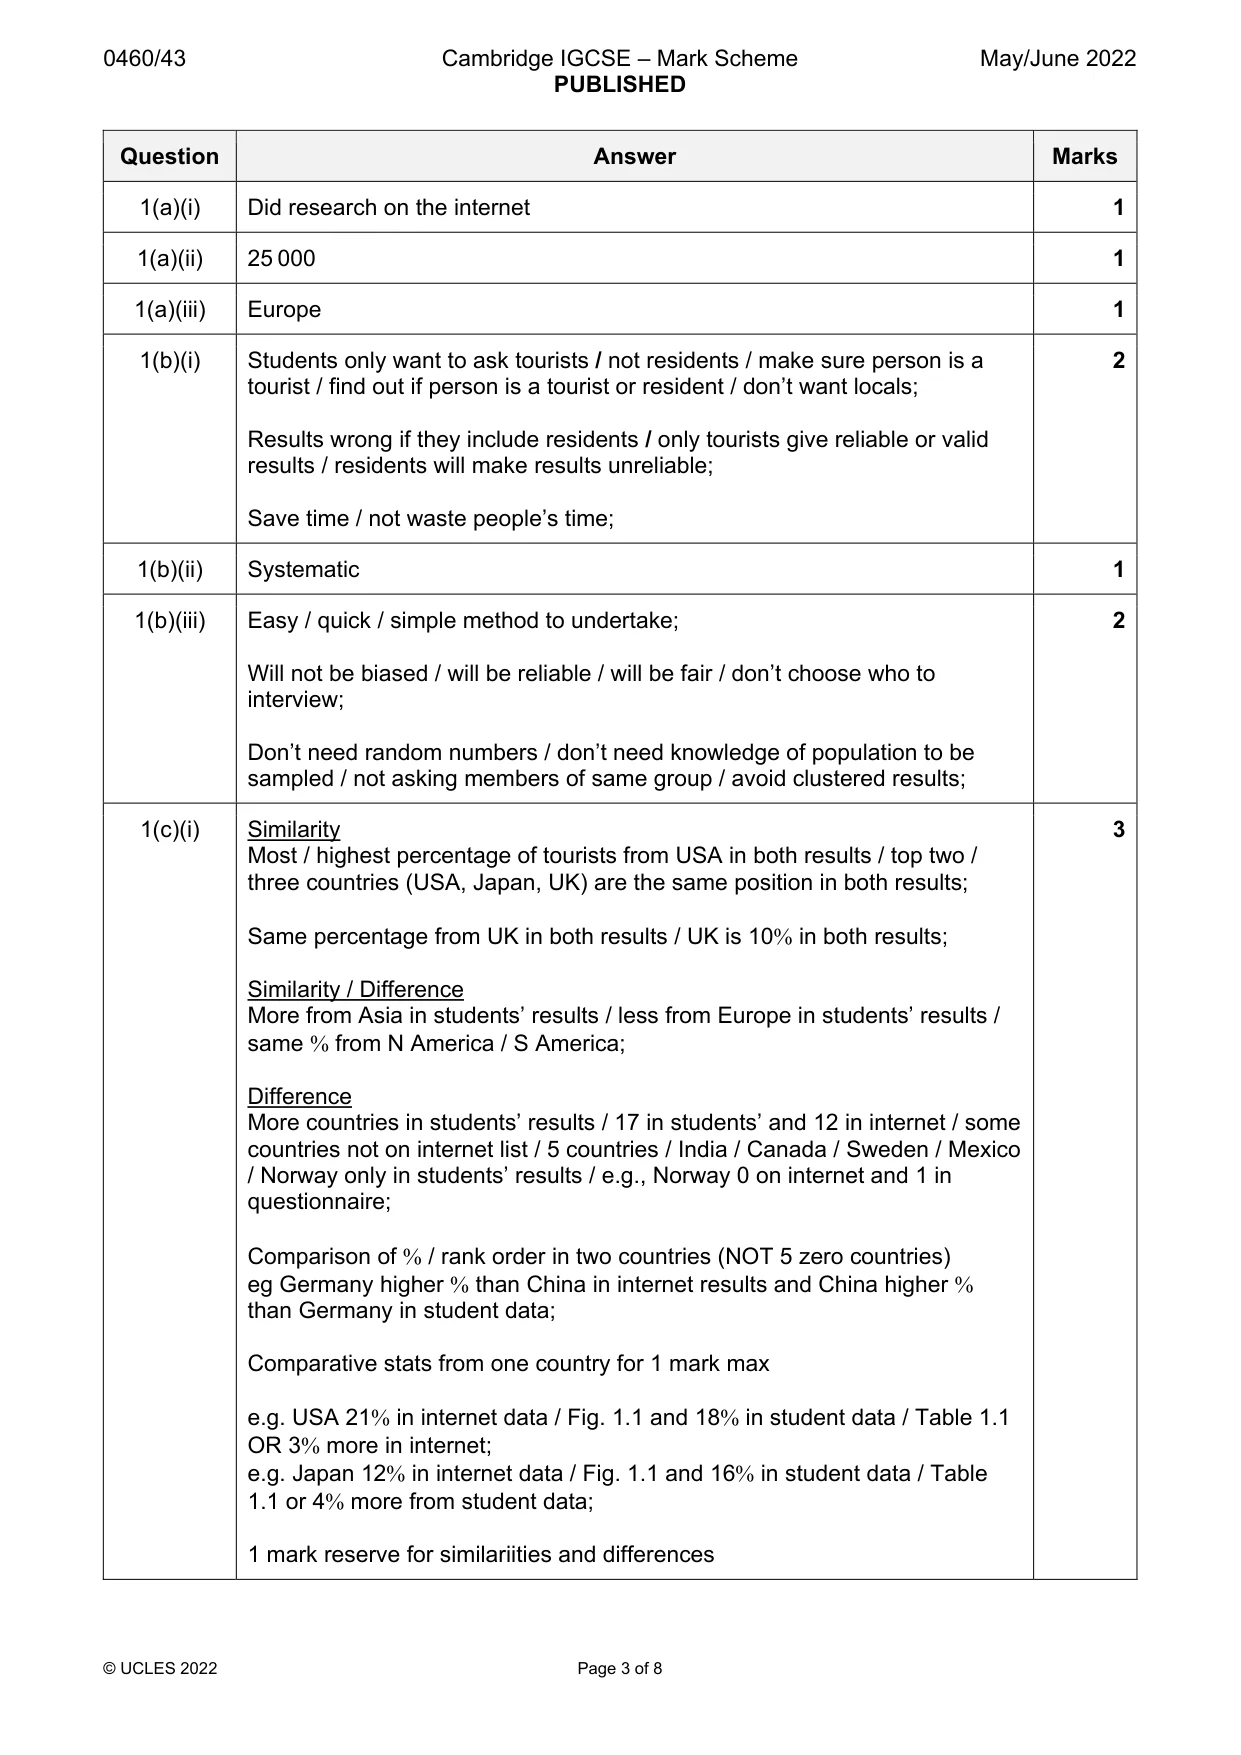
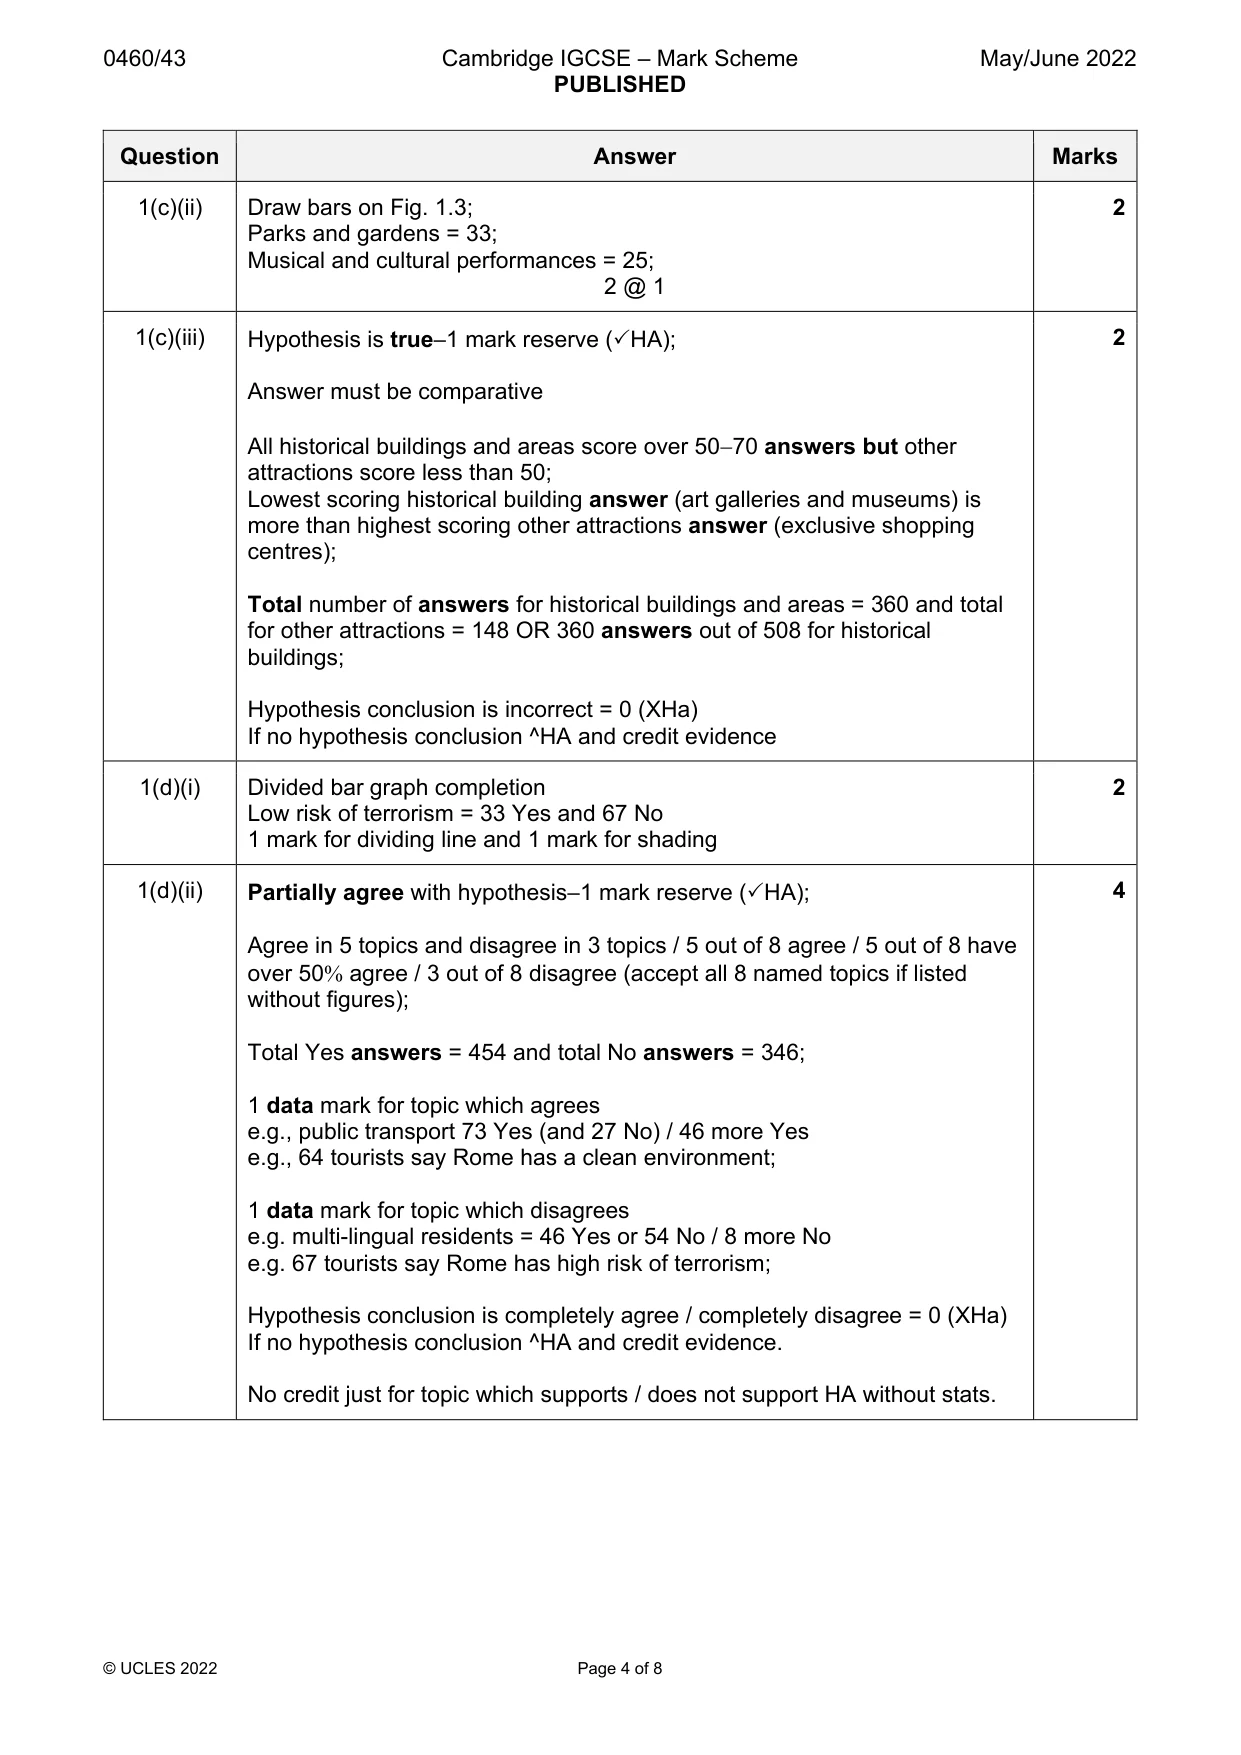
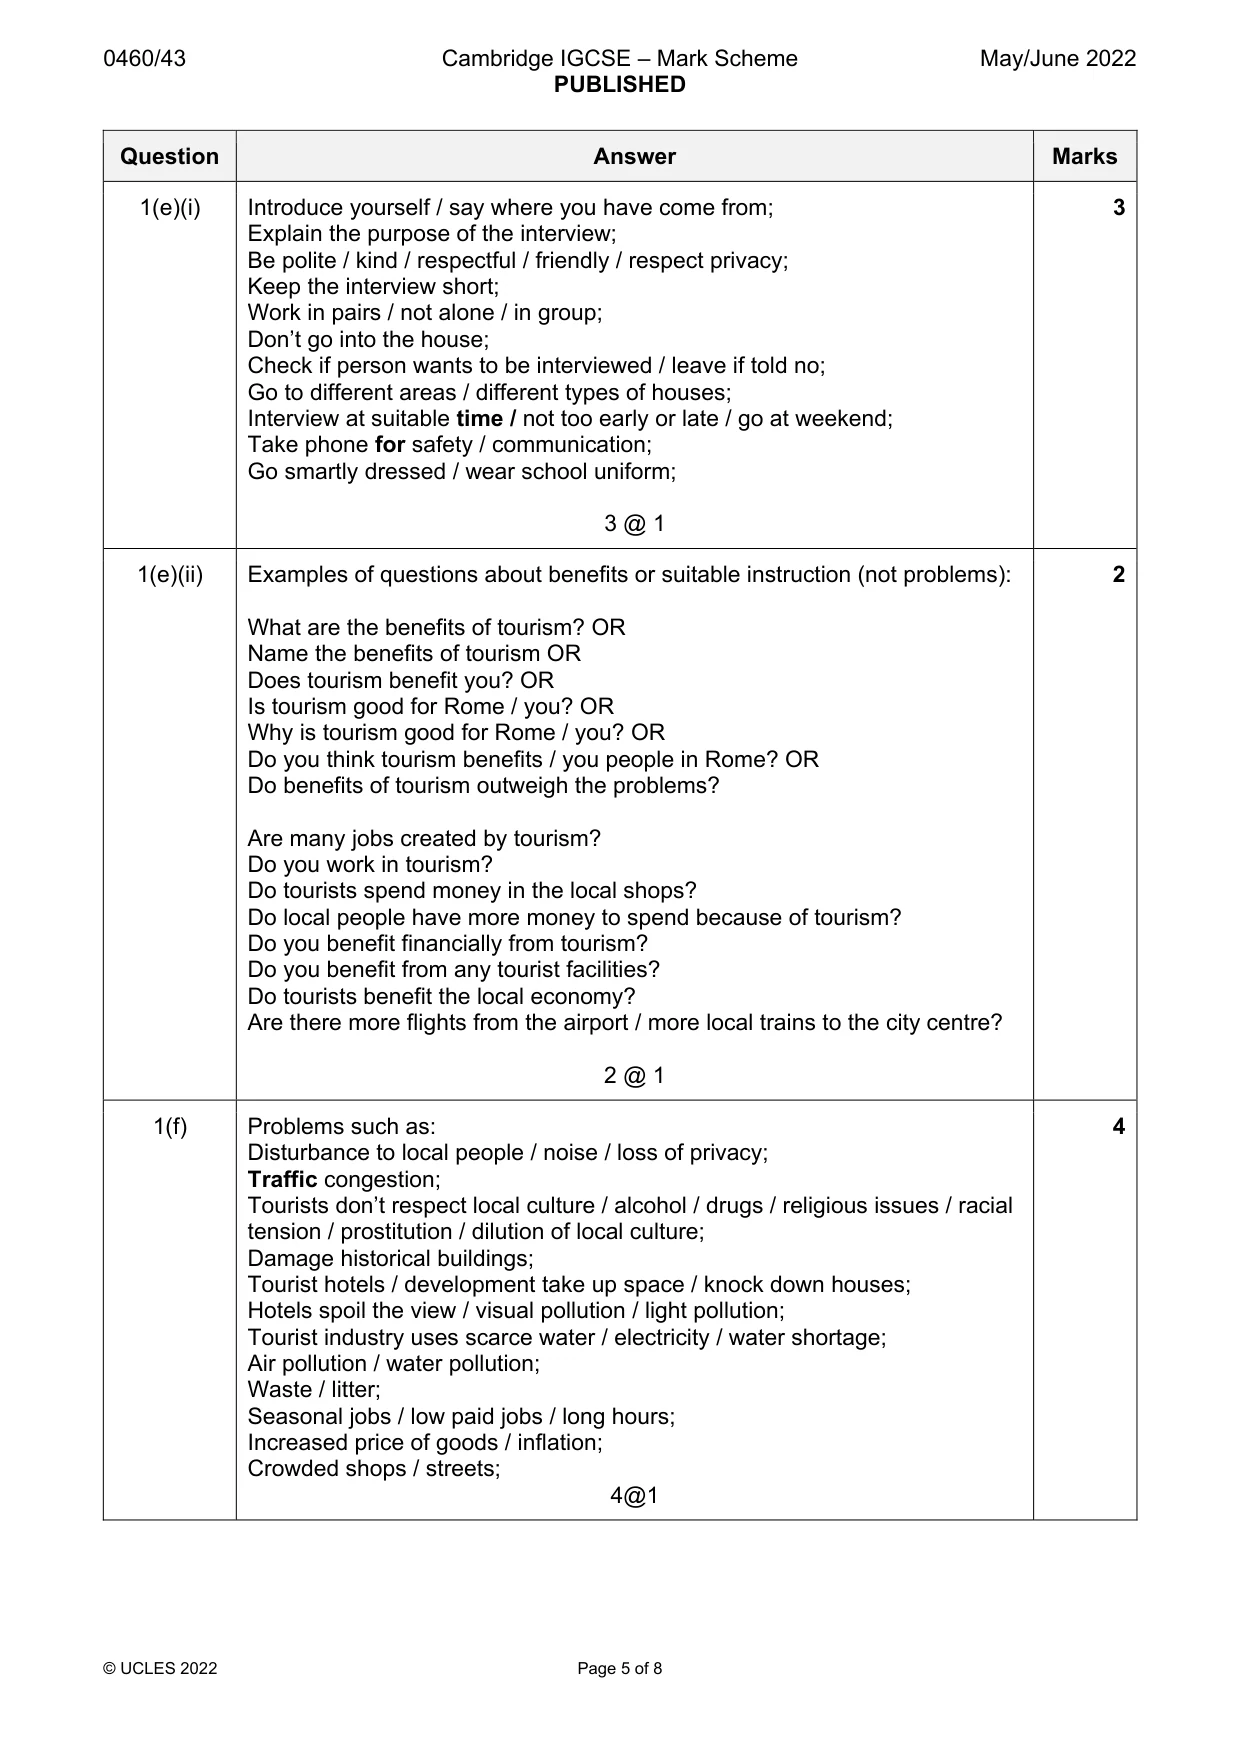
Mark scheme: Question Answer Marks 1(a)(i) Did research on the internet 1 1(a)(ii) 25 000 1 1(a)(iii) Europe 1 1(b)(i) Students only want to ask tourists / not residents / make sure person is a 2 tourist / find out if person is a tourist or resident / don’t want locals; Results wrong if they include residents / only tourists give reliable or valid results / residents will make results unreliable; Save time / not waste people’s time; 1(b)(ii) Systematic 1 1(b)(iii) Easy / quick / simple method to undertake; 2 Will not be biased / will be reliable / will be fair / don’t choose who to interview; Don’t need random numbers / don’t need knowledge of population to be sampled / not asking members of same group / avoid clustered results; 1(c)(i) Similarity 3 Most / highest percentage of tourists from USA in both results / top two / three countries (USA, Japan, UK) are the same position in both results; Same percentage from UK in both results / UK is 10 in both results; Similarity / Difference More from Asia in students’ results / less from Europe in students’ results / same from N America / S America; Difference More countries in students’ results / 17 in students’ and 12 in internet / some countries not on internet list / 5 countries / India / Canada / Sweden / Mexico / Norway only in students’ results / e.g., Norway 0 on internet and 1 in questionnaire; Comparison of / rank order in two countries (NOT 5 zero countries) eg Germany higher than China in internet results and China higher than Germany in student data; Comparative stats from one country for 1 mark max e.g. USA 21 in internet data / Fig. 1.1 and 18 in student data / Table 1.1 OR 3 more in internet; e.g. Japan 12 in internet data / Fig. 1.1 and 16 in student data / Table 1.1 or 4 more from student data; 1 mark reserve for similariities and differences 1(c)(ii) Draw bars on Fig. 1.3; 2 Parks and gardens = 33; Musical and cultural performances = 25; 2 @ 1 1(c)(iii) Hypothesis is true1 mark reserve (HA); 2 Answer must be comparative All historical buildings and areas score over 5070 answers but other attractions score less than 50; Lowest scoring historical building answer (art galleries and museums) is more than highest scoring other attractions answer (exclusive shopping centres); Total number of answers for historical buildings and areas = 360 and total for other attractions = 148 OR 360 answers out of 508 for historical buildings; Hypothesis conclusion is incorrect = 0 (XHa) If no hypothesis conclusion ^HA and credit evidence 1(d)(i) Divided bar graph completion 2 Low risk of terrorism = 33 Yes and 67 No 1 mark for dividing line and 1 mark for shading 1(d)(ii) Partially agree with hypothesis1 mark reserve (HA); 4 Agree in 5 topics and disagree in 3 topics / 5 out of 8 agree / 5 out of 8 have over 50 agree / 3 out of 8 disagree (accept all 8 named topics if listed without figures); Total Yes answers = 454 and total No answers = 346; 1 data mark for topic which agrees e.g., public transport 73 Yes (and 27 No) / 46 more Yes e.g., 64 tourists say Rome has a clean environment; 1 data mark for topic which disagrees e.g. multi-lingual residents = 46 Yes or 54 No / 8 more No e.g. 67 tourists say Rome has high risk of terrorism; Hypothesis conclusion is completely agree / completely disagree = 0 (XHa) If no hypothesis conclusion ^HA and credit evidence. No credit just for topic which supports / does not support HA without stats. 1(e)(i) Introduce yourself / say where you have come from; 3 Explain the purpose of the interview; Be polite / kind / respectful / friendly / respect privacy; Keep the interview short; Work in pairs / not alone / in group; Don’t go into the house; Check if person wants to be interviewed / leave if told no; Go to different areas / different types of houses; Interview at suitable time / not too early or late / go at weekend; Take phone for safety / communication; Go smartly dressed / wear school uniform; 3 @ 1 1(e)(ii) Examples of questions about benefits or suitable instruction (not problems): 2 What are the benefits of tourism? OR Name the benefits of tourism OR Does tourism benefit you? OR Is tourism good for Rome / you? OR Why is tourism good for Rome / you? OR Do you think tourism benefits / you people in Rome? OR Do benefits of tourism outweigh the problems? Are many jobs created by tourism? Do you work in tourism? Do tourists spend money in the local shops? Do local people have more money to spend because of tourism? Do you benefit financially from tourism? Do you benefit from any tourist facilities? Do tourists benefit the local economy? Are there more flights from the airport / more local trains to the city centre? 2 @ 1 1(f) Problems such as: 4 Disturbance to local people / noise / loss of privacy; Traffic congestion; Tourists don’t respect local culture / alcohol / drugs / religious issues / racial tension / prostitution / dilution of local culture; Damage historical buildings; Tourist hotels / development take up space / knock down houses; Hotels spoil the view / visual pollution / light pollution; Tourist industry uses scarce water / electricity / water shortage; Air pollution / water pollution; Waste / litter; Seasonal jobs / low paid jobs / long hours; Increased price of goods / inflation; Crowded shops / streets; 4@1
Q2 · Students at schools in Madrid in Spain and Naples in Italy planned a weather…
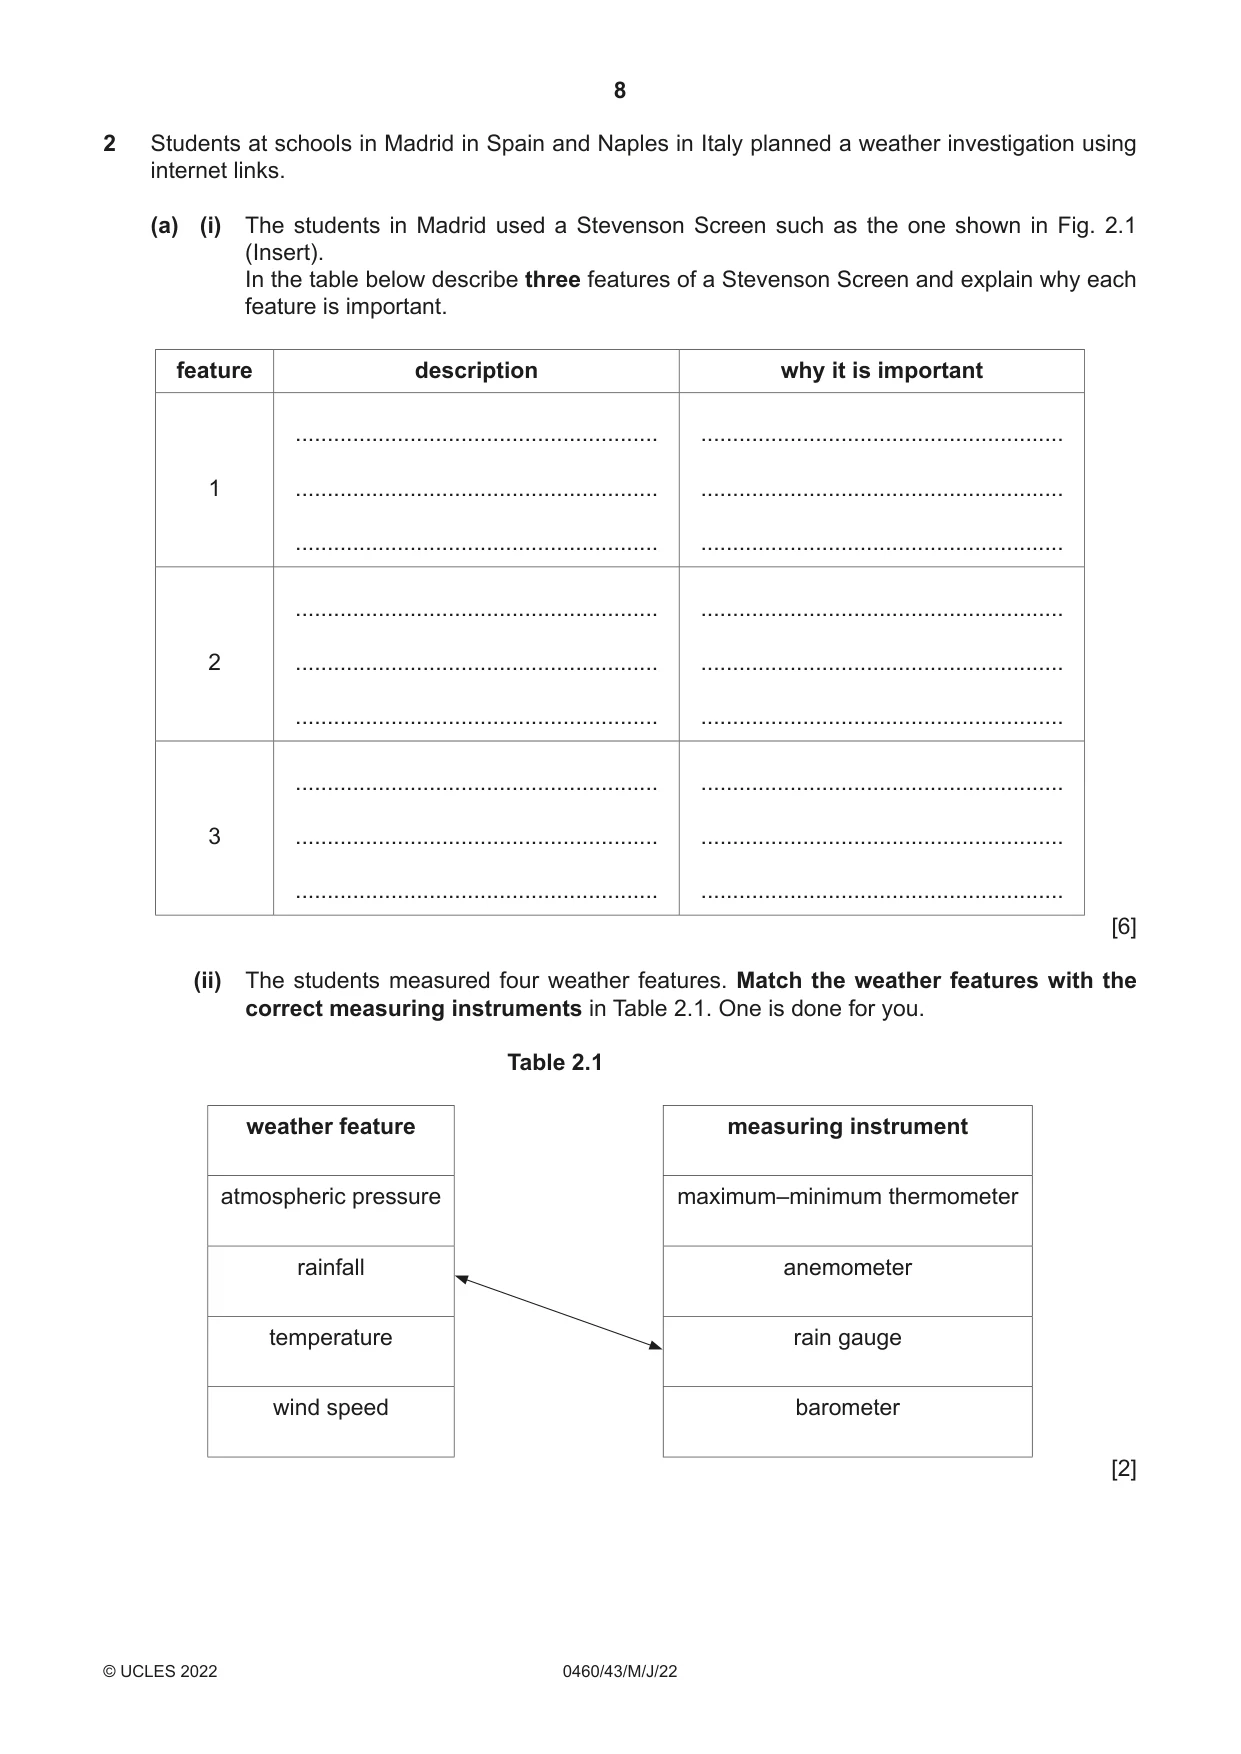
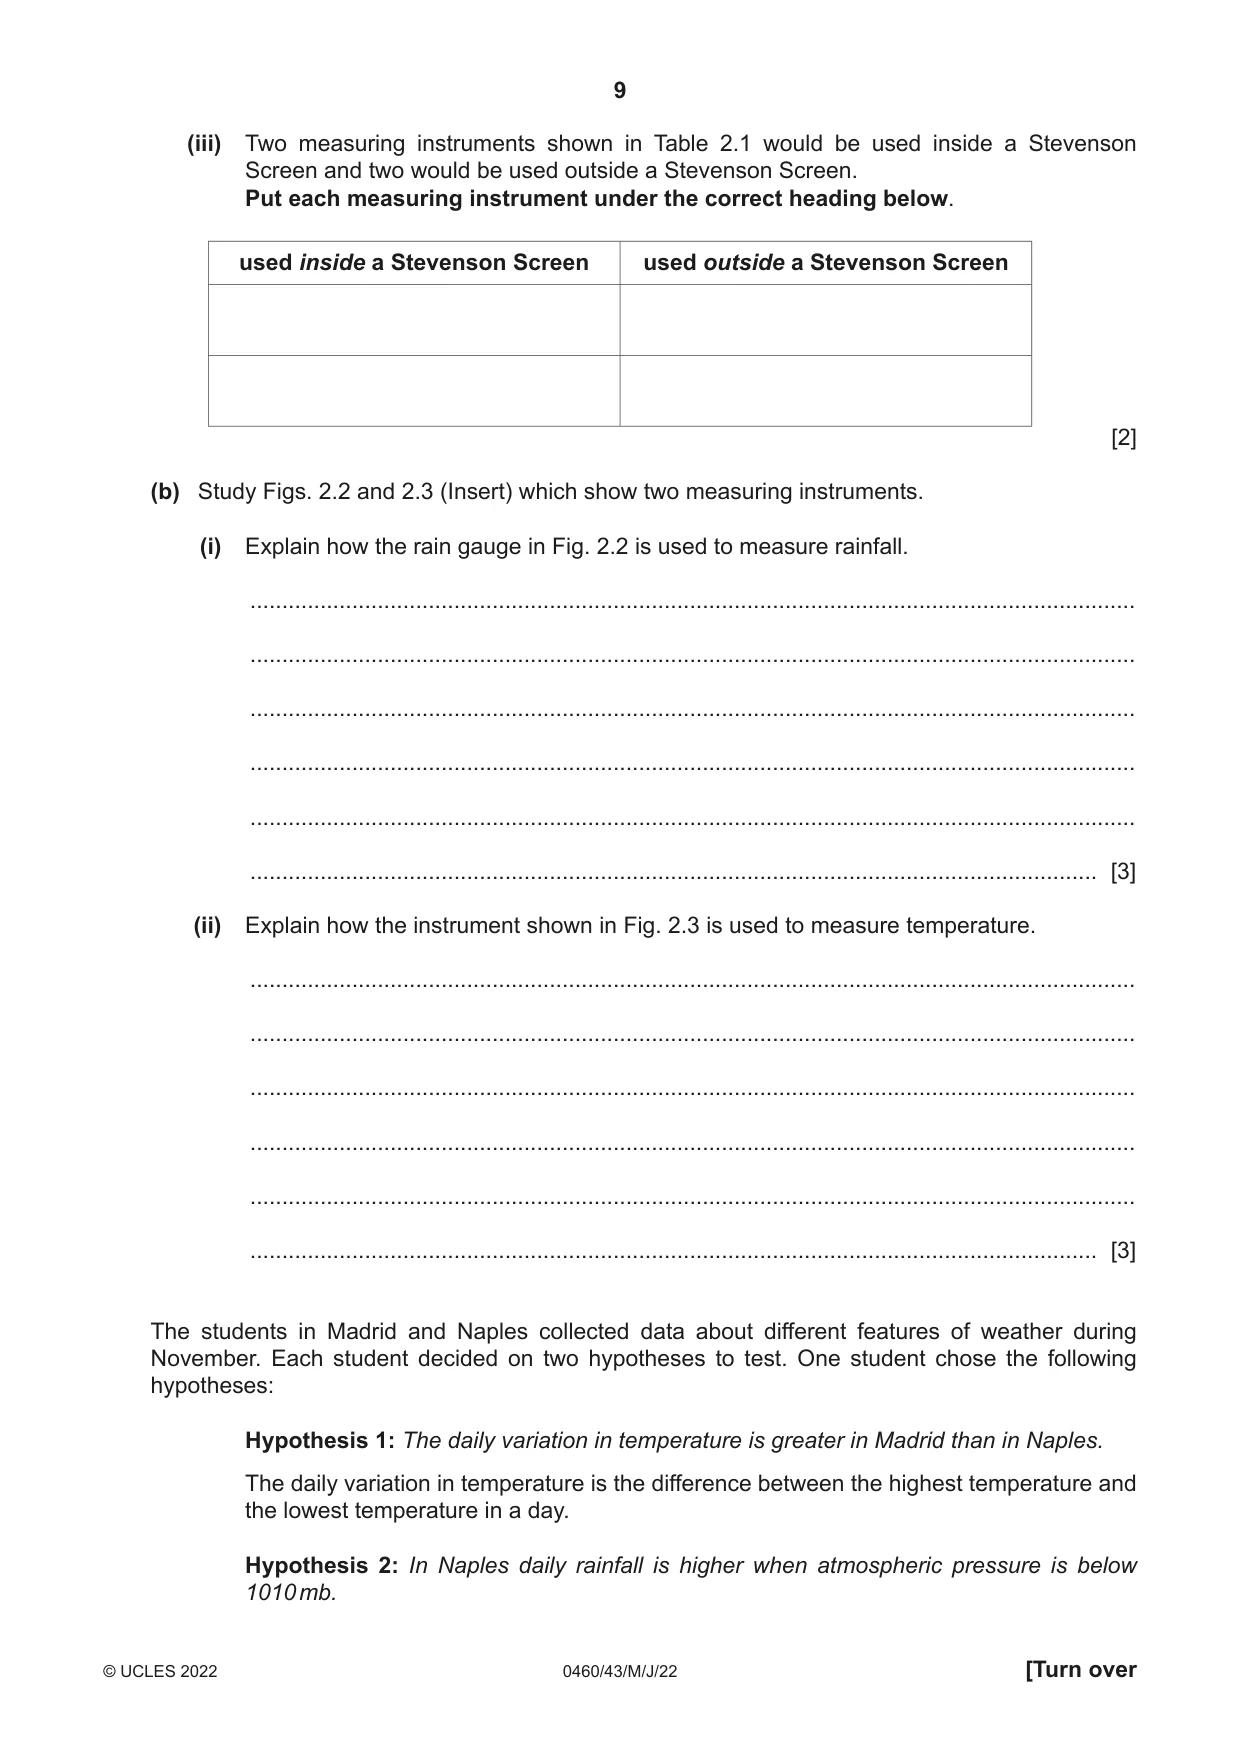
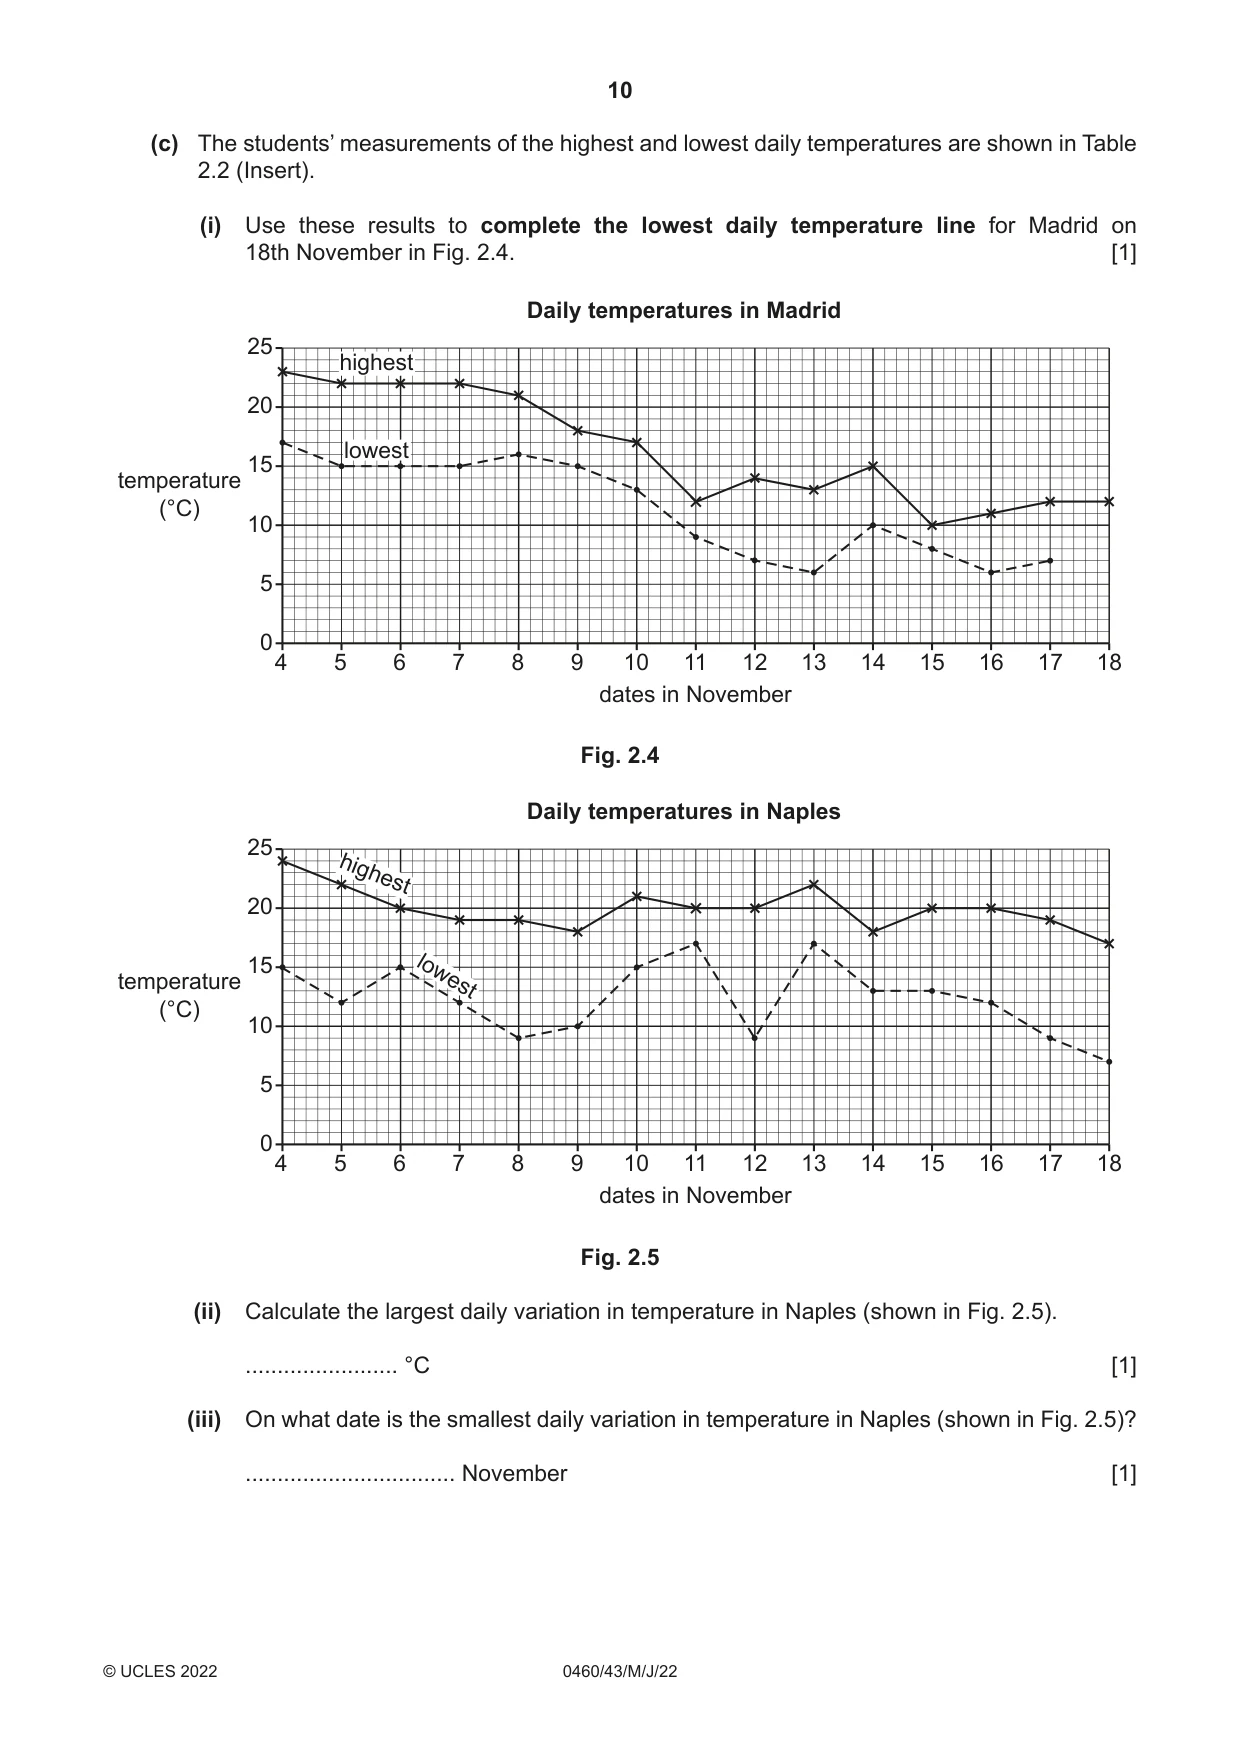
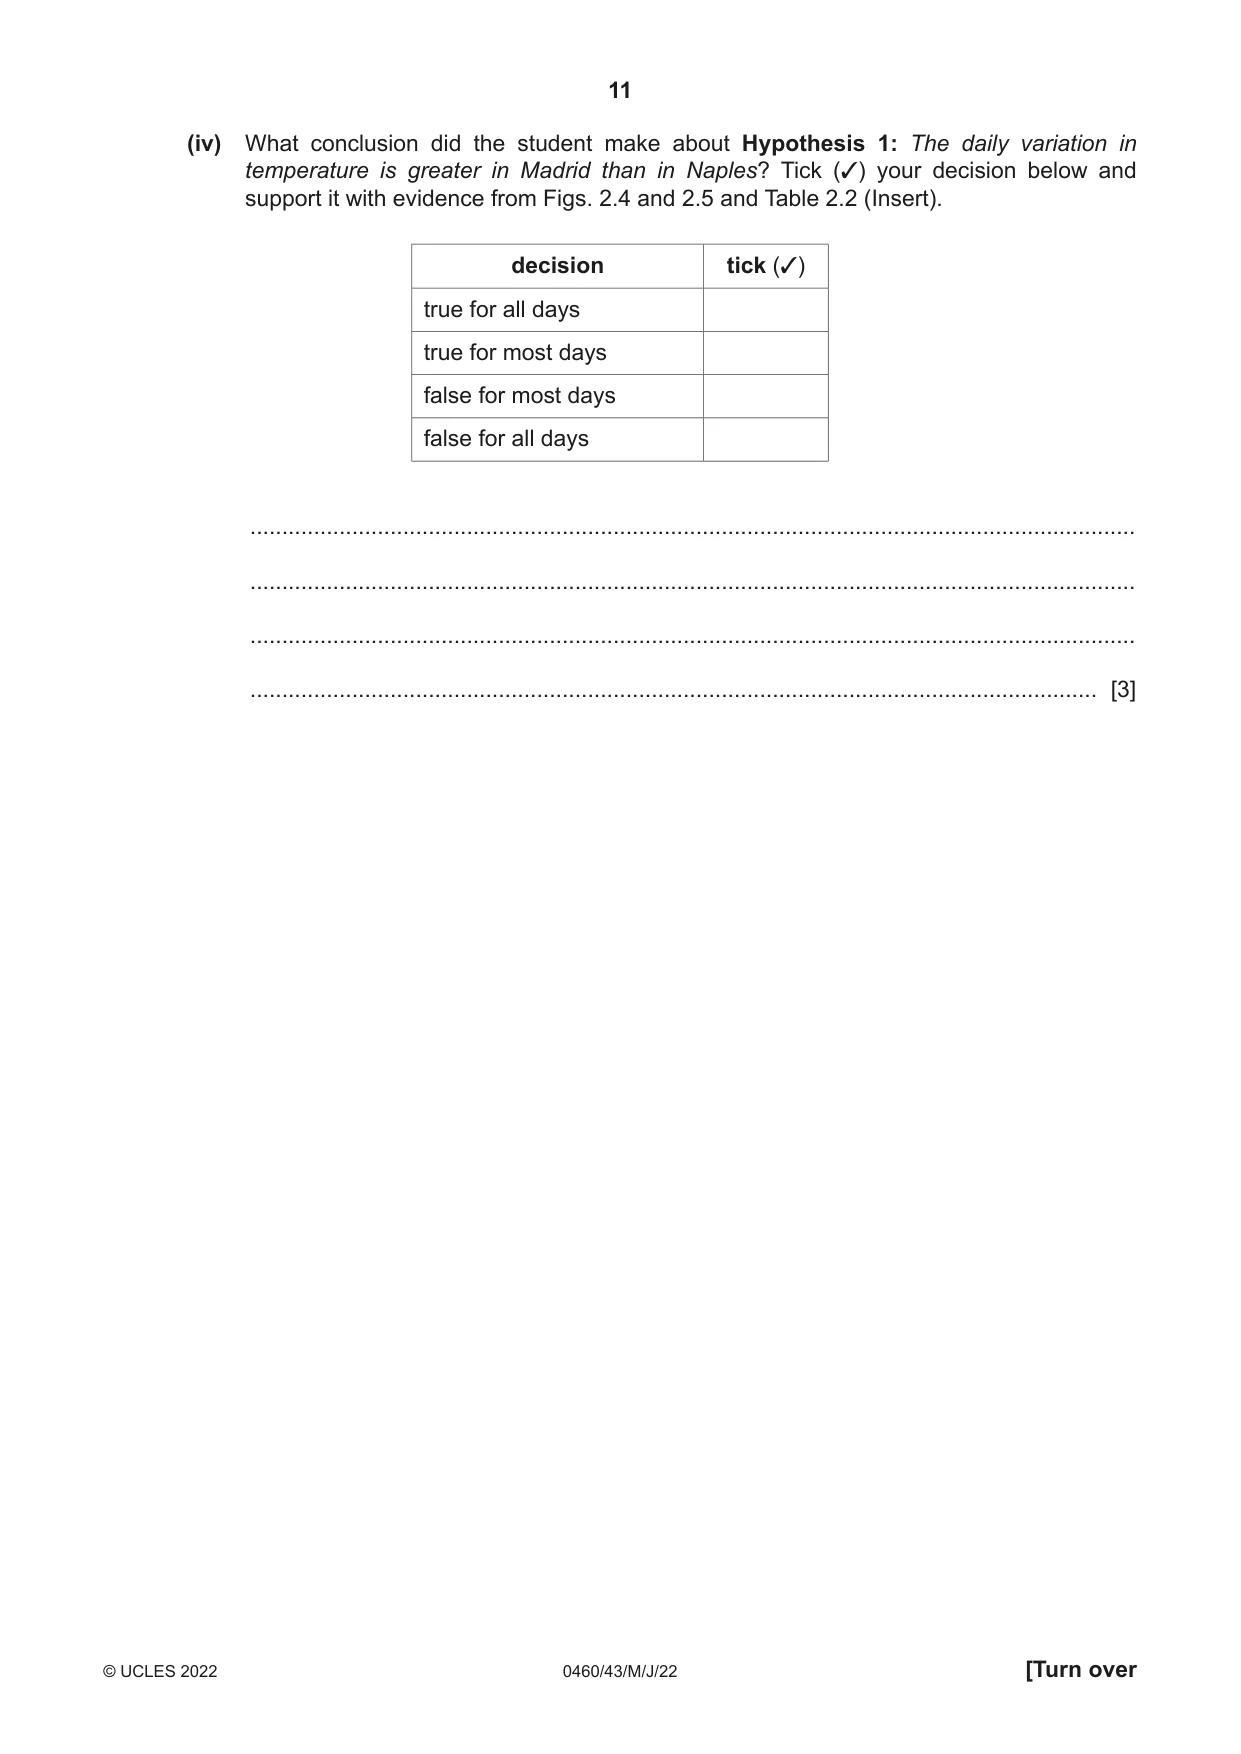
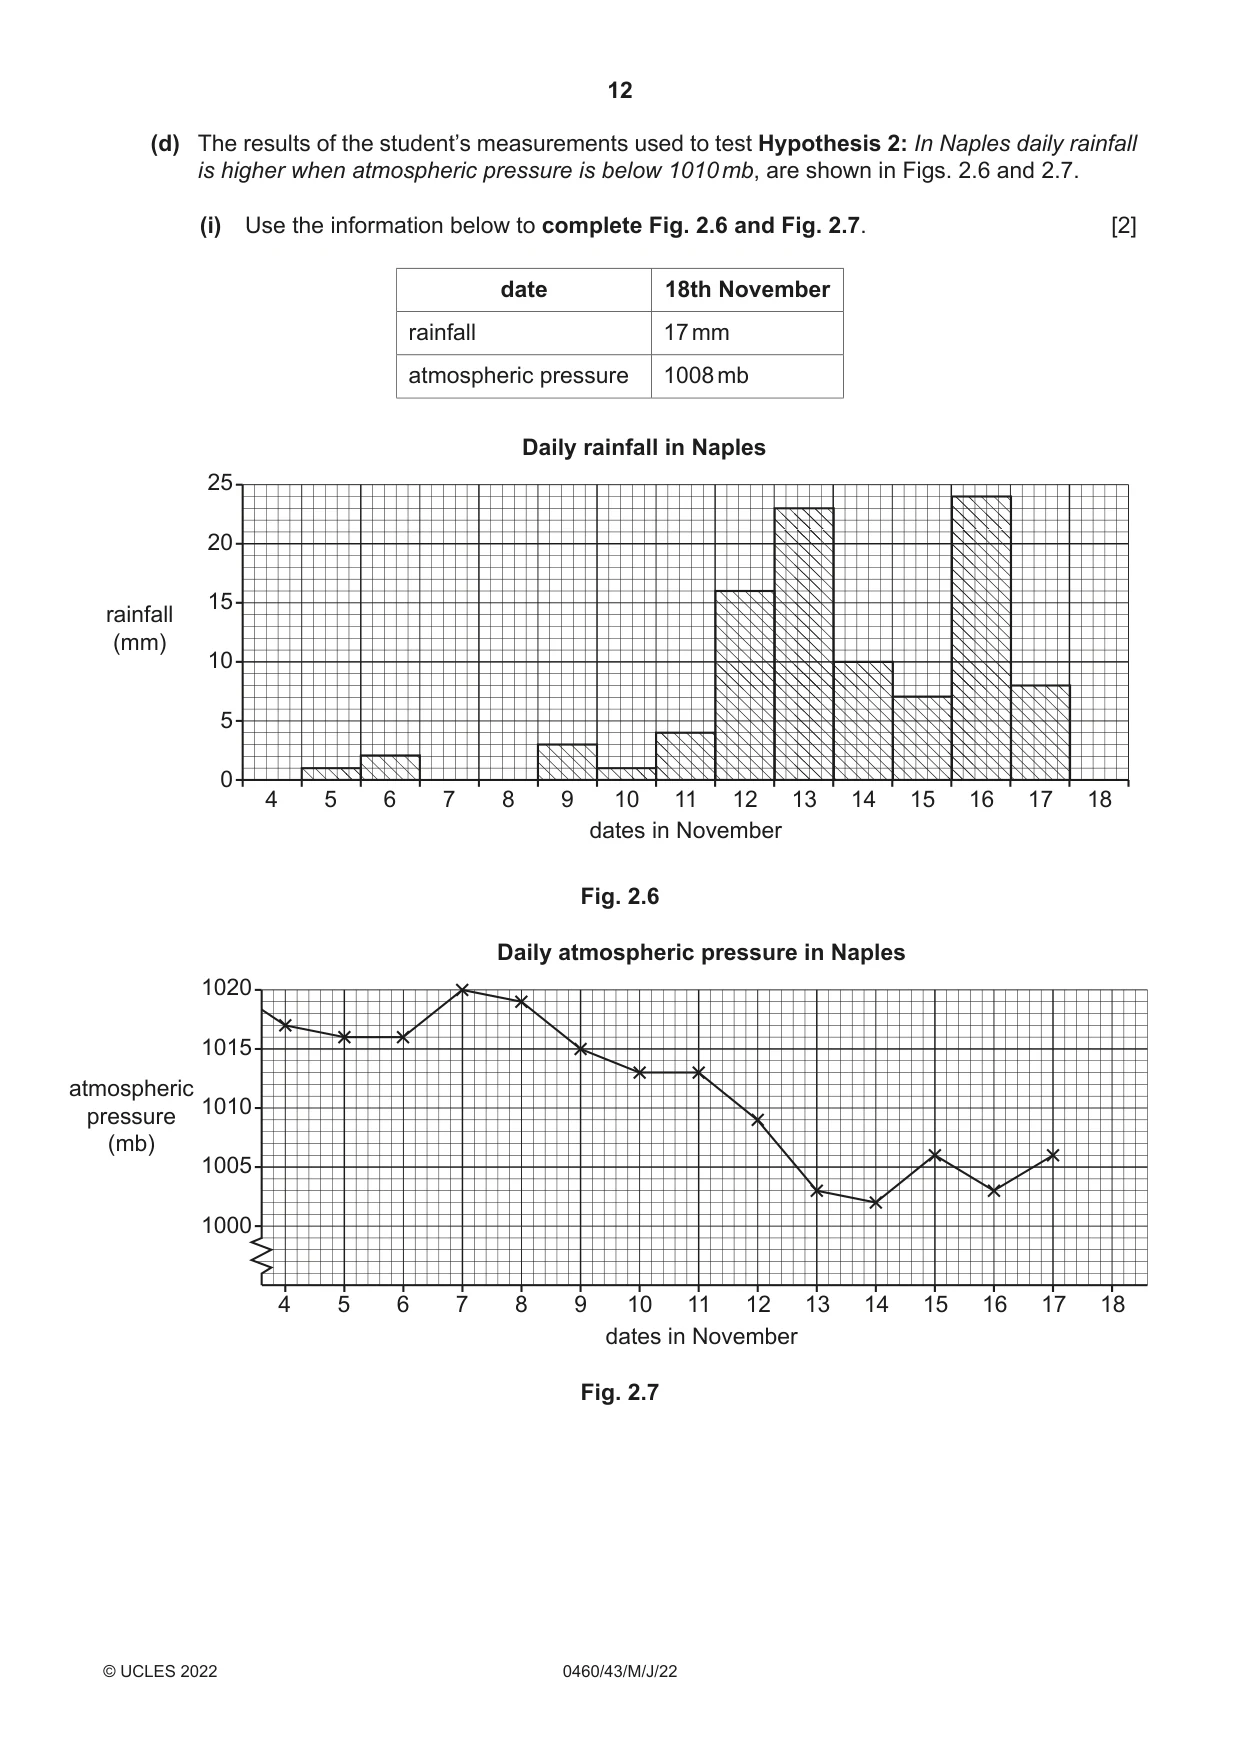
2 Students at schools in Madrid in Spain and Naples in Italy planned a weather investigation using internet links. (a) (i) The students in Madrid used a Stevenson Screen such as the one shown in Fig. 2.1 (Insert). In the table below describe three features of a Stevenson Screen and explain why each feature is important. feature description why it is important ......................................................... ......................................................... 1 ......................................................... ......................................................... ......................................................... ......................................................... ......................................................... ......................................................... 2 ......................................................... ......................................................... ......................................................... ......................................................... ......................................................... ......................................................... 3 ......................................................... ......................................................... ......................................................... ......................................................... [6] (ii) The students measured four weather features. Match the weather features with the correct measuring instruments in Table 2.1. One is done for you. Table 2.1 weather feature measuring instrument atmospheric pressure maximum–minimum thermometer rainfall anemometer temperature rain gauge wind speed barometer [2] (iii) Two measuring instruments shown in Table 2.1 would be used inside a Stevenson Screen and two would be used outside a Stevenson Screen. Put each measuring instrument under the correct heading below. used inside a Stevenson Screen used outside a Stevenson Screen [2] (b) Study Figs. 2.2 and 2.3 (Insert) which show two measuring instruments. (i) Explain how the rain gauge in Fig. 2.2 is used to measure rainfall. ........................................................................................................................................... ........................................................................................................................................... ........................................................................................................................................... ........................................................................................................................................... ........................................................................................................................................... ..................................................................................................................................... [3] (ii) Explain how the instrument shown in Fig. 2.3 is used to measure temperature. ........................................................................................................................................... ........................................................................................................................................... ........................................................................................................................................... ........................................................................................................................................... ........................................................................................................................................... ..................................................................................................................................... [3] The students in Madrid and Naples collected data about different features of weather during November. Each student decided on two hypotheses to test. One student chose the following hypotheses: Hypothesis 1: The daily variation in temperature is greater in Madrid than in Naples. The daily variation in temperature is the difference between the highest temperature and the lowest temperature in a day. Hypothesis 2: In Naples daily rainfall is higher when atmospheric pressure is below 1010 mb. (c) The students’ measurements of the highest and lowest daily temperatures are shown in Table 2.2 (Insert). (i) Use these results to complete the lowest daily temperature line for Madrid on 18th November in Fig. 2.4. [1] Daily temperatures in Madrid 25 highest 20 lowest 15 temperature (°C) 10 5 0 4 5 6 7 8 9 10 11 12 13 14 15 16 17 18 dates in November Fig. 2.4 Daily temperatures in Naples 25 highest 20 15 temperature lowest (°C) 10 5 0 4 5 6 7 8 9 10 11 12 13 14 15 16 17 18 dates in November Fig. 2.5 (ii) Calculate the largest daily variation in temperature in Naples (shown in Fig. 2.5). ........................ °C [1] (iii) On what date is the smallest daily variation in temperature in Naples (shown in Fig. 2.5)? ................................. November [1]
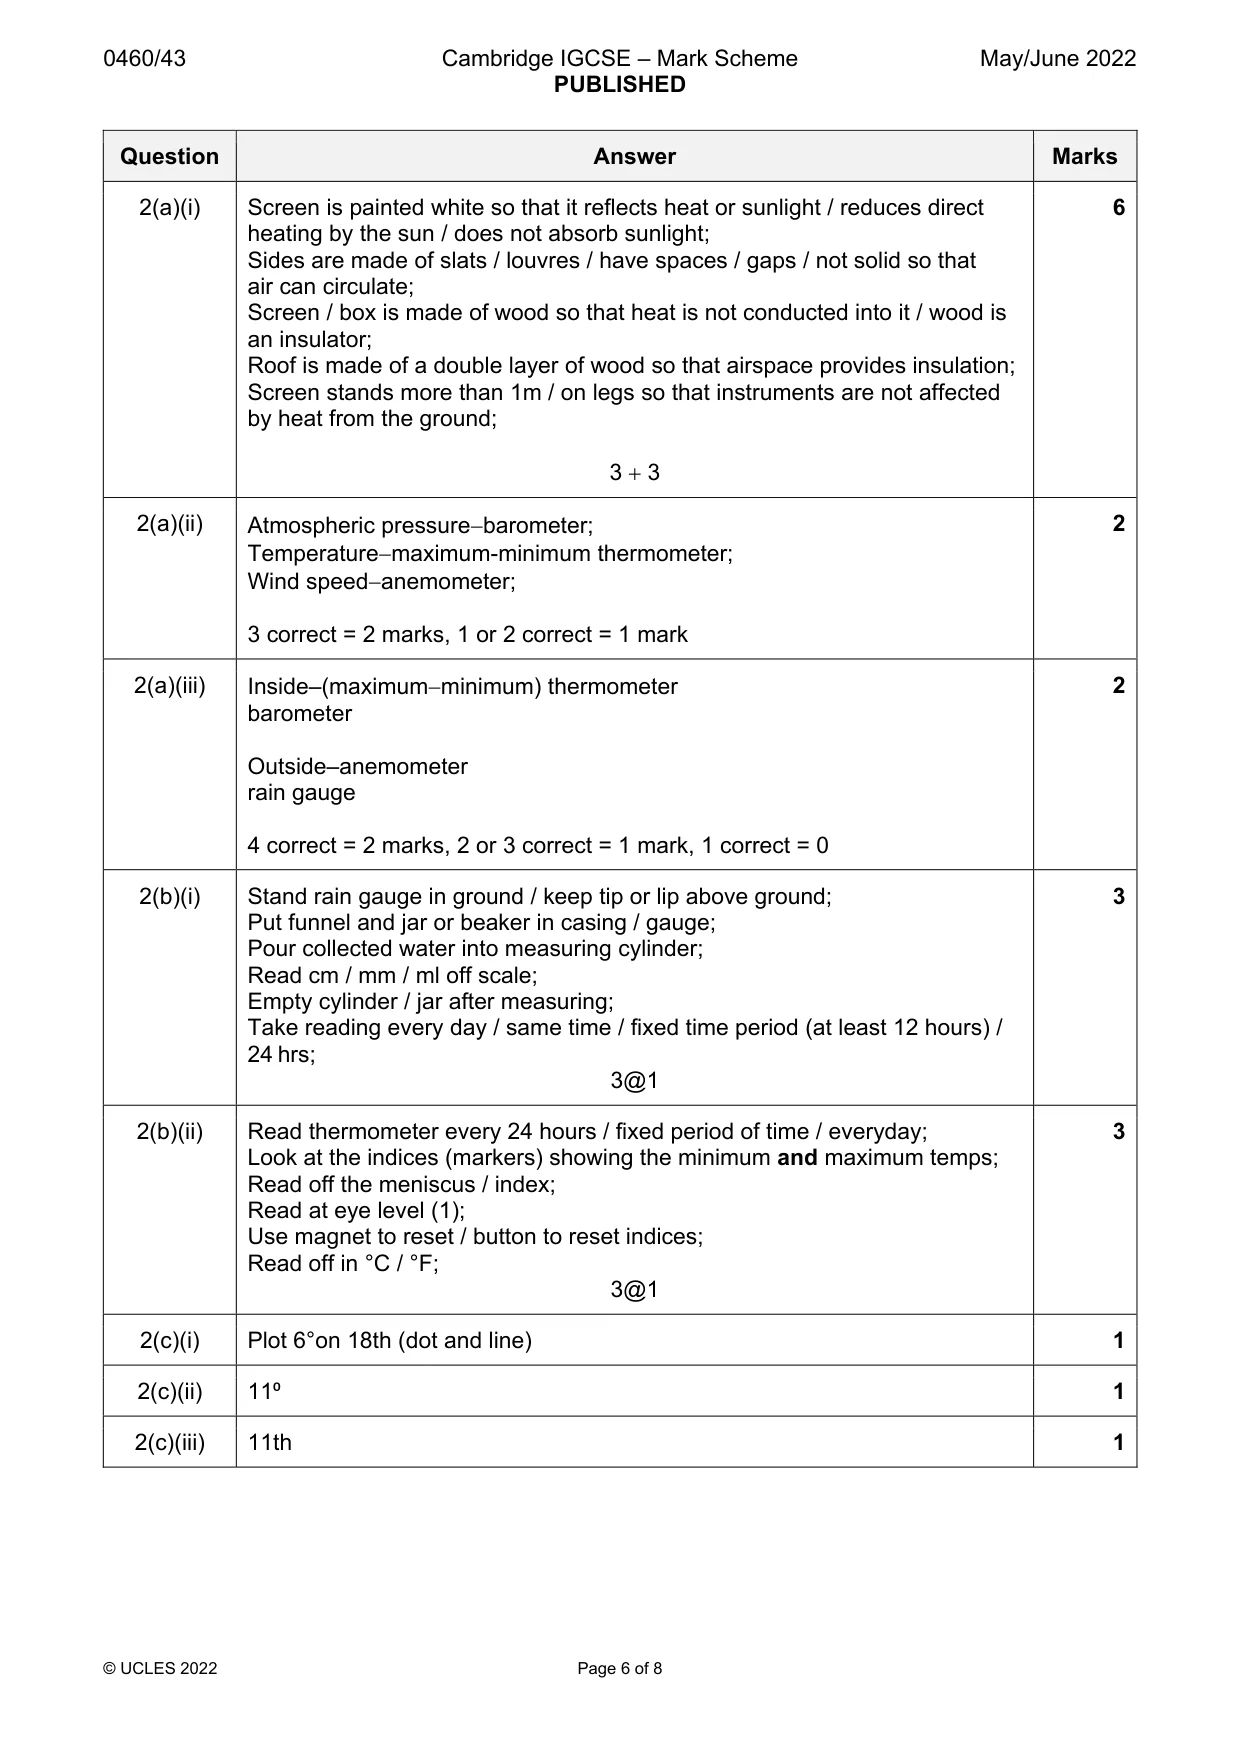
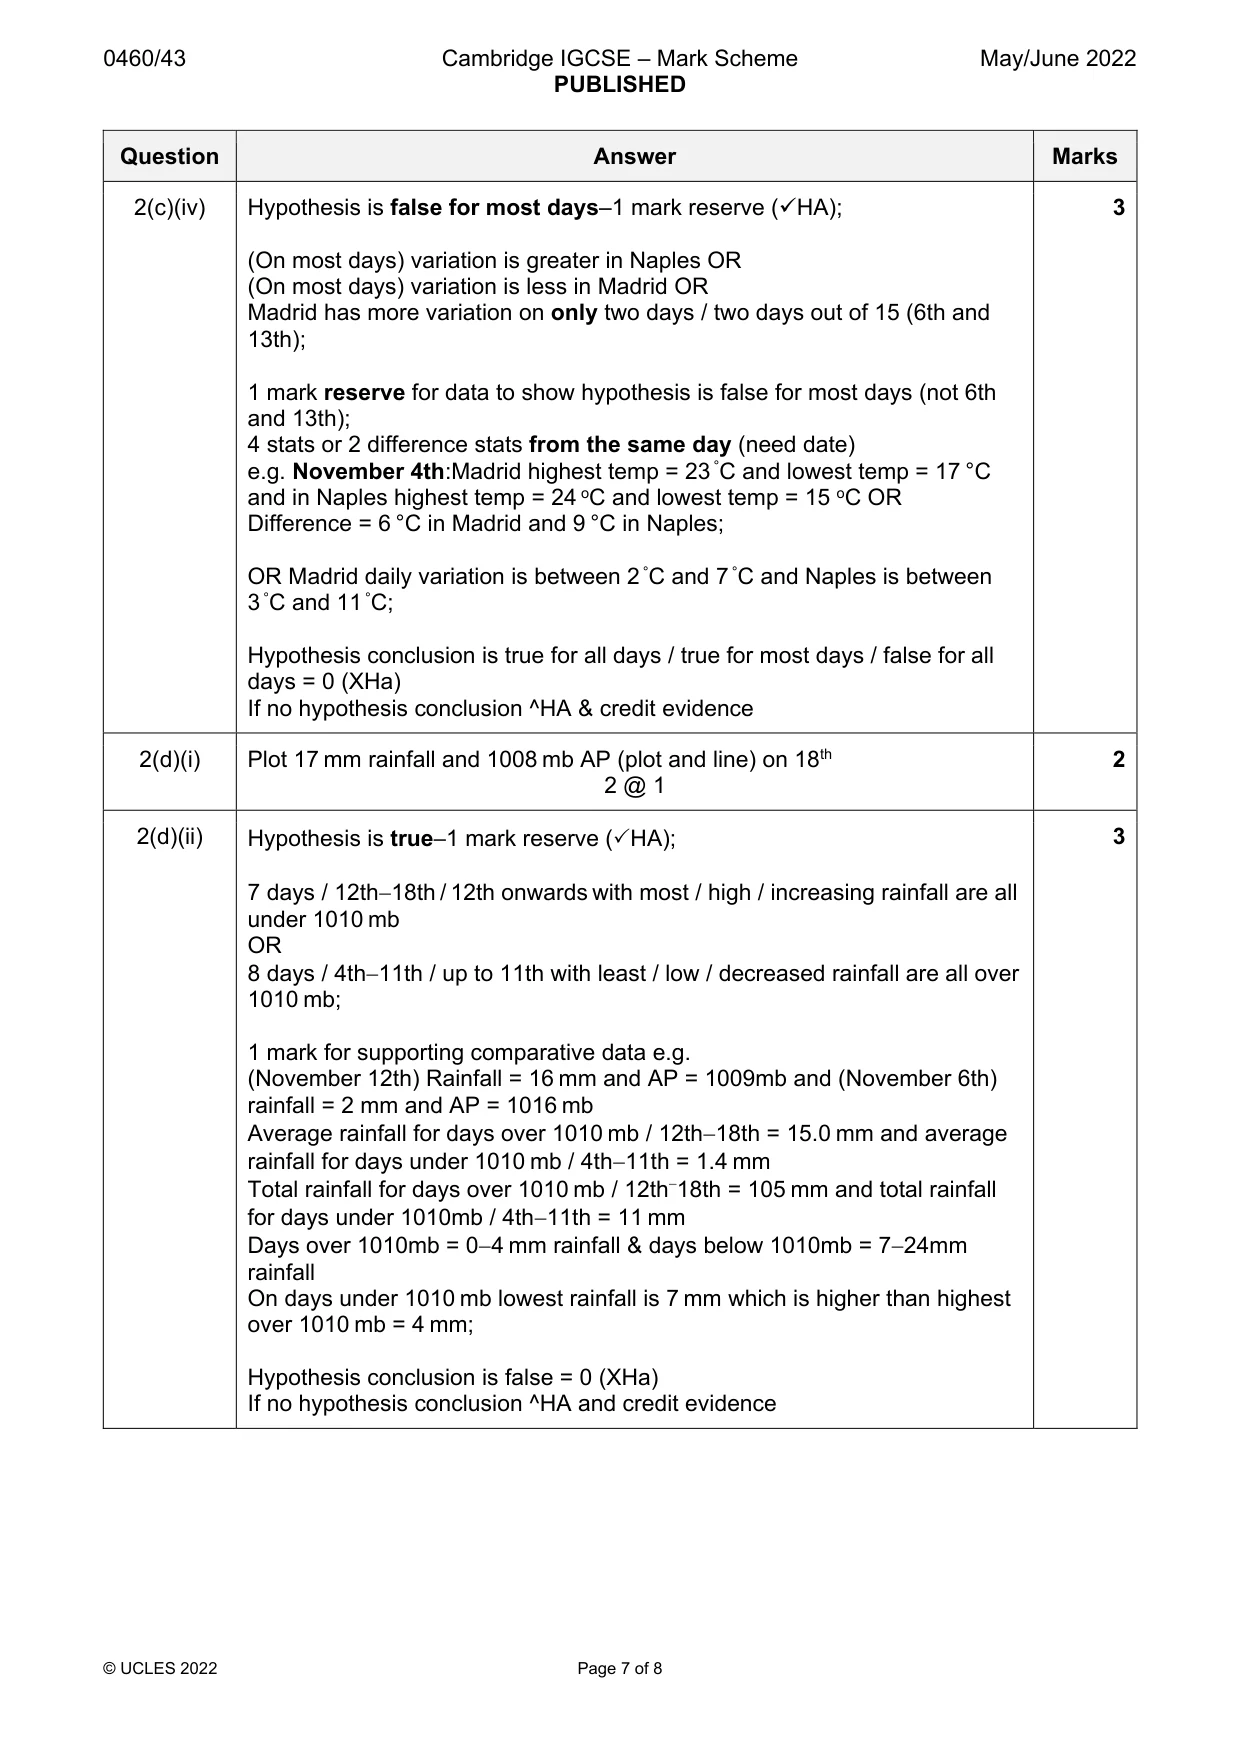
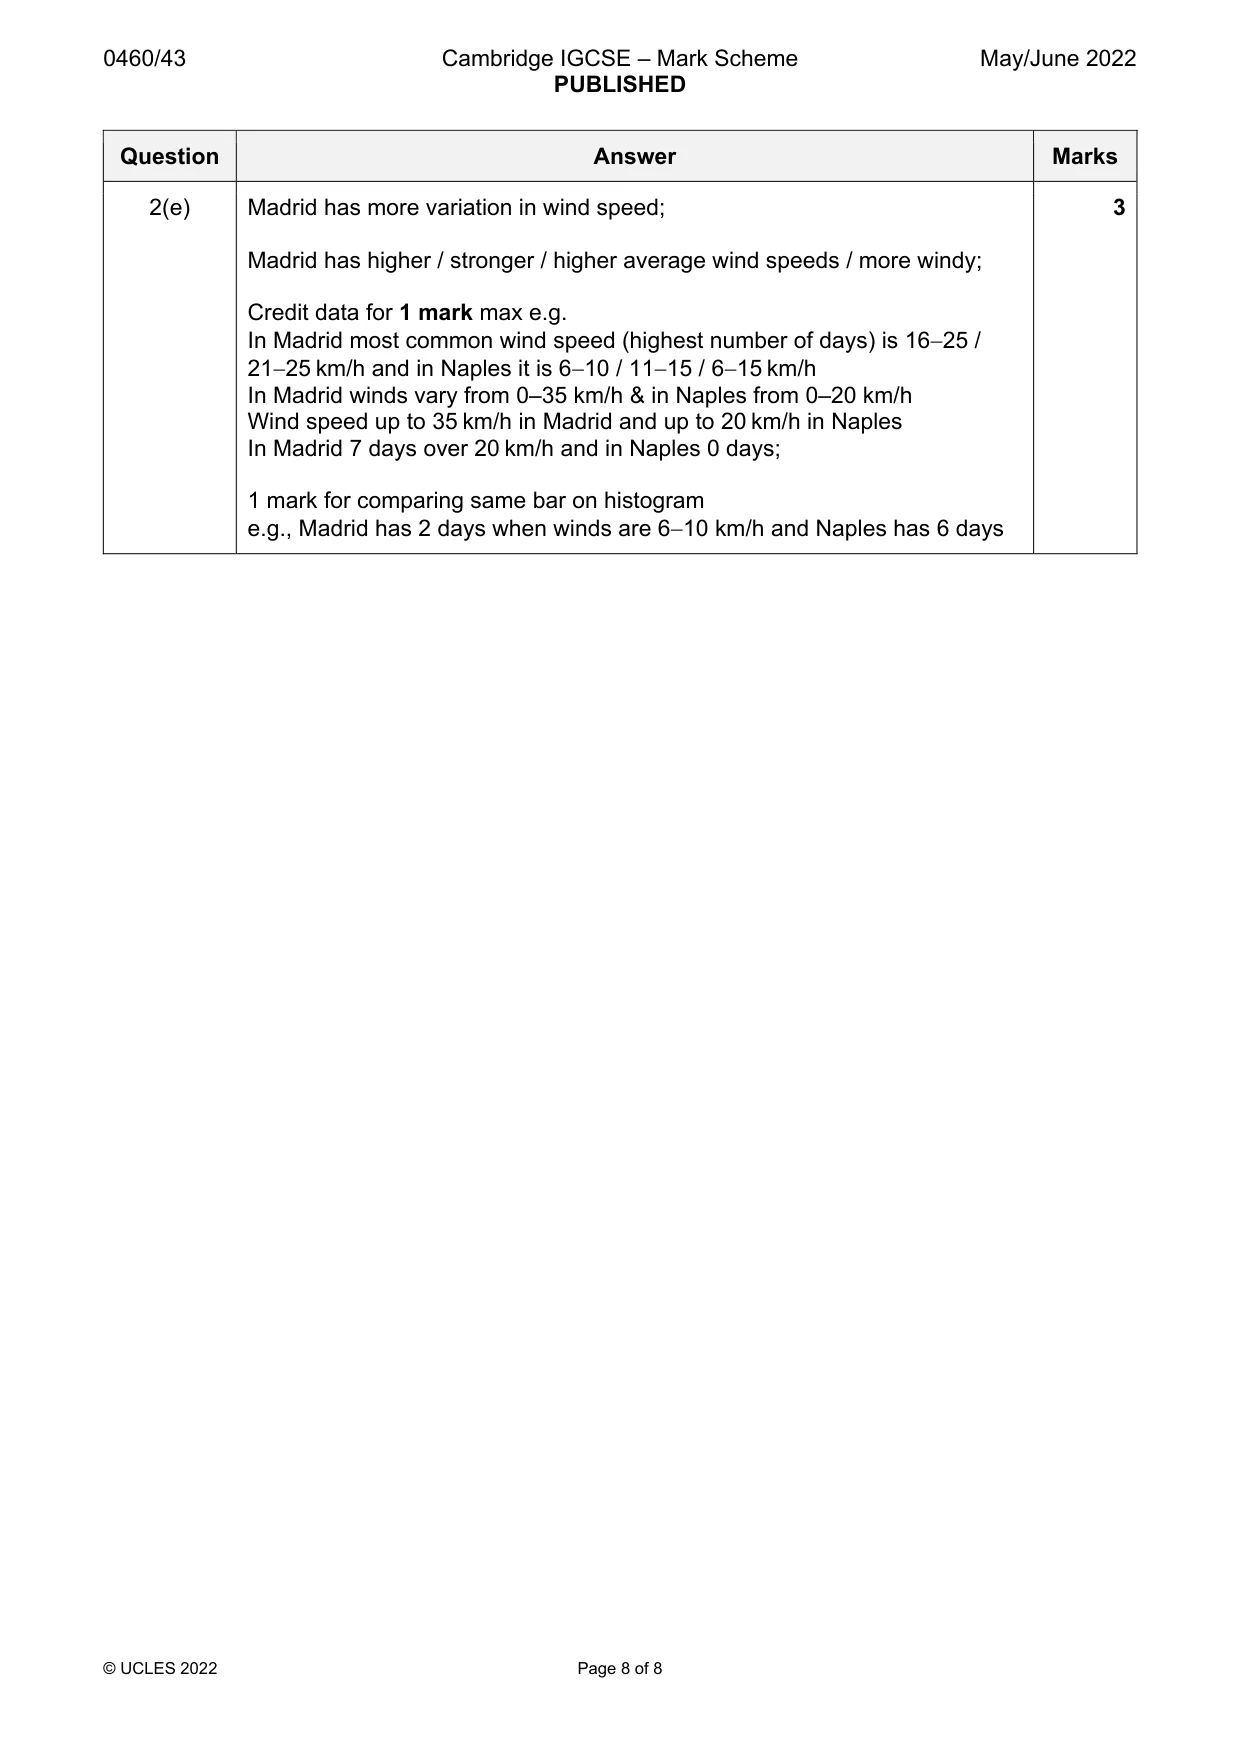
Mark scheme: 2(a)(i) Screen is painted white so that it reflects heat or sunlight / reduces direct 6 heating by the sun / does not absorb sunlight; Sides are made of slats / louvres / have spaces / gaps / not solid so that air can circulate; Screen / box is made of wood so that heat is not conducted into it / wood is an insulator; Roof is made of a double layer of wood so that airspace provides insulation; Screen stands more than 1m / on legs so that instruments are not affected by heat from the ground; 3 3 2(a)(ii) Atmospheric pressurebarometer; 2 Temperaturemaximum-minimum thermometer; Wind speedanemometer; 3 correct = 2 marks, 1 or 2 correct = 1 mark 2(a)(iii) Inside–(maximumminimum) thermometer 2 barometer Outside–anemometer rain gauge 4 correct = 2 marks, 2 or 3 correct = 1 mark, 1 correct = 0 2(b)(i) Stand rain gauge in ground / keep tip or lip above ground; 3 Put funnel and jar or beaker in casing / gauge; Pour collected water into measuring cylinder; Read cm / mm / ml off scale; Empty cylinder / jar after measuring; Take reading every day / same time / fixed time period (at least 12 hours) / 24 hrs; 3@1 2(b)(ii) Read thermometer every 24 hours / fixed period of time / everyday; 3 Look at the indices (markers) showing the minimum and maximum temps; Read off the meniscus / index; Read at eye level (1); Use magnet to reset / button to reset indices; Read off in °C / °F; 3@1 2(c)(i) Plot 6°on 18th (dot and line) 1 2(c)(ii) 11⁰ 1 2(c)(iii) 11th 1 2(c)(iv) Hypothesis is false for most days–1 mark reserve (HA); 3 (On most days) variation is greater in Naples OR (On most days) variation is less in Madrid OR Madrid has more variation on only two days / two days out of 15 (6th and 13th); 1 mark reserve for data to show hypothesis is false for most days (not 6th and 13th); 4 stats or 2 difference stats from the same day (need date) e.g. November 4th:Madrid highest temp = 23 °C and lowest temp = 17 °C and in Naples highest temp = 24 oC and lowest temp = 15 oC OR Difference = 6 °C in Madrid and 9 °C in Naples; OR Madrid daily variation is between 2 °C and 7 °C and Naples is between 3 °C and 11 °C; Hypothesis conclusion is true for all days / true for most days / false for all days = 0 (XHa) If no hypothesis conclusion ^HA & credit evidence 2(d)(i) Plot 17 mm rainfall and 1008 mb AP (plot and line) on 18th 2 2 @ 1 2(d)(ii) Hypothesis is true1 mark reserve (HA); 3 7 days / 12th18th / 12th onwards with most / high / increasing rainfall are all under 1010 mb OR 8 days / 4th11th / up to 11th with least / low / decreased rainfall are all over 1010 mb; 1 mark for supporting comparative data e.g. (November 12th) Rainfall = 16 mm and AP = 1009mb and (November 6th) rainfall = 2 mm and AP = 1016 mb Average rainfall for days over 1010 mb / 12th18th = 15.0 mm and average rainfall for days under 1010 mb / 4th11th = 1.4 mm Total rainfall for days over 1010 mb / 12th18th = 105 mm and total rainfall for days under 1010mb / 4th11th = 11 mm Days over 1010mb = 04 mm rainfall & days below 1010mb = 724mm rainfall On days under 1010 mb lowest rainfall is 7 mm which is higher than highest over 1010 mb = 4 mm; Hypothesis conclusion is false = 0 (XHa) If no hypothesis conclusion ^HA and credit evidence 2(e) Madrid has more variation in wind speed; 3 Madrid has higher / stronger / higher average wind speeds / more windy; Credit data for 1 mark max e.g. In Madrid most common wind speed (highest number of days) is 1625 / 2125 km/h and in Naples it is 610 / 1115 / 615 km/h In Madrid winds vary from 0–35 km/h & in Naples from 0–20 km/h Wind speed up to 35 km/h in Madrid and up to 20 km/h in Naples In Madrid 7 days over 20 km/h and in Naples 0 days; 1 mark for comparing same bar on histogram e.g., Madrid has 2 days when winds are 610 km/h and Naples has 6 days
What was in this paper
The subtopics covered by these 2 questions, and how many questions each got. Open one in a new tab to see every Cambridge question on it.
What you needed in this session
Cambridge’s own grade thresholds for 2022 May/June, Paper 4 · Variant 3. A higher threshold means an easier paper — the bar moves with how the cohort did.