Cambridge IGCSE Geography 0460 — 2025 May/June Paper 4 · Variant 3
0460/43/M/J/25 · 2 questions · 60 marks · 90 min
The question paper and its mark scheme, free to read here and free to download. This is Cambridge’s own paper, exactly as it was sat.
Question paper16 pages
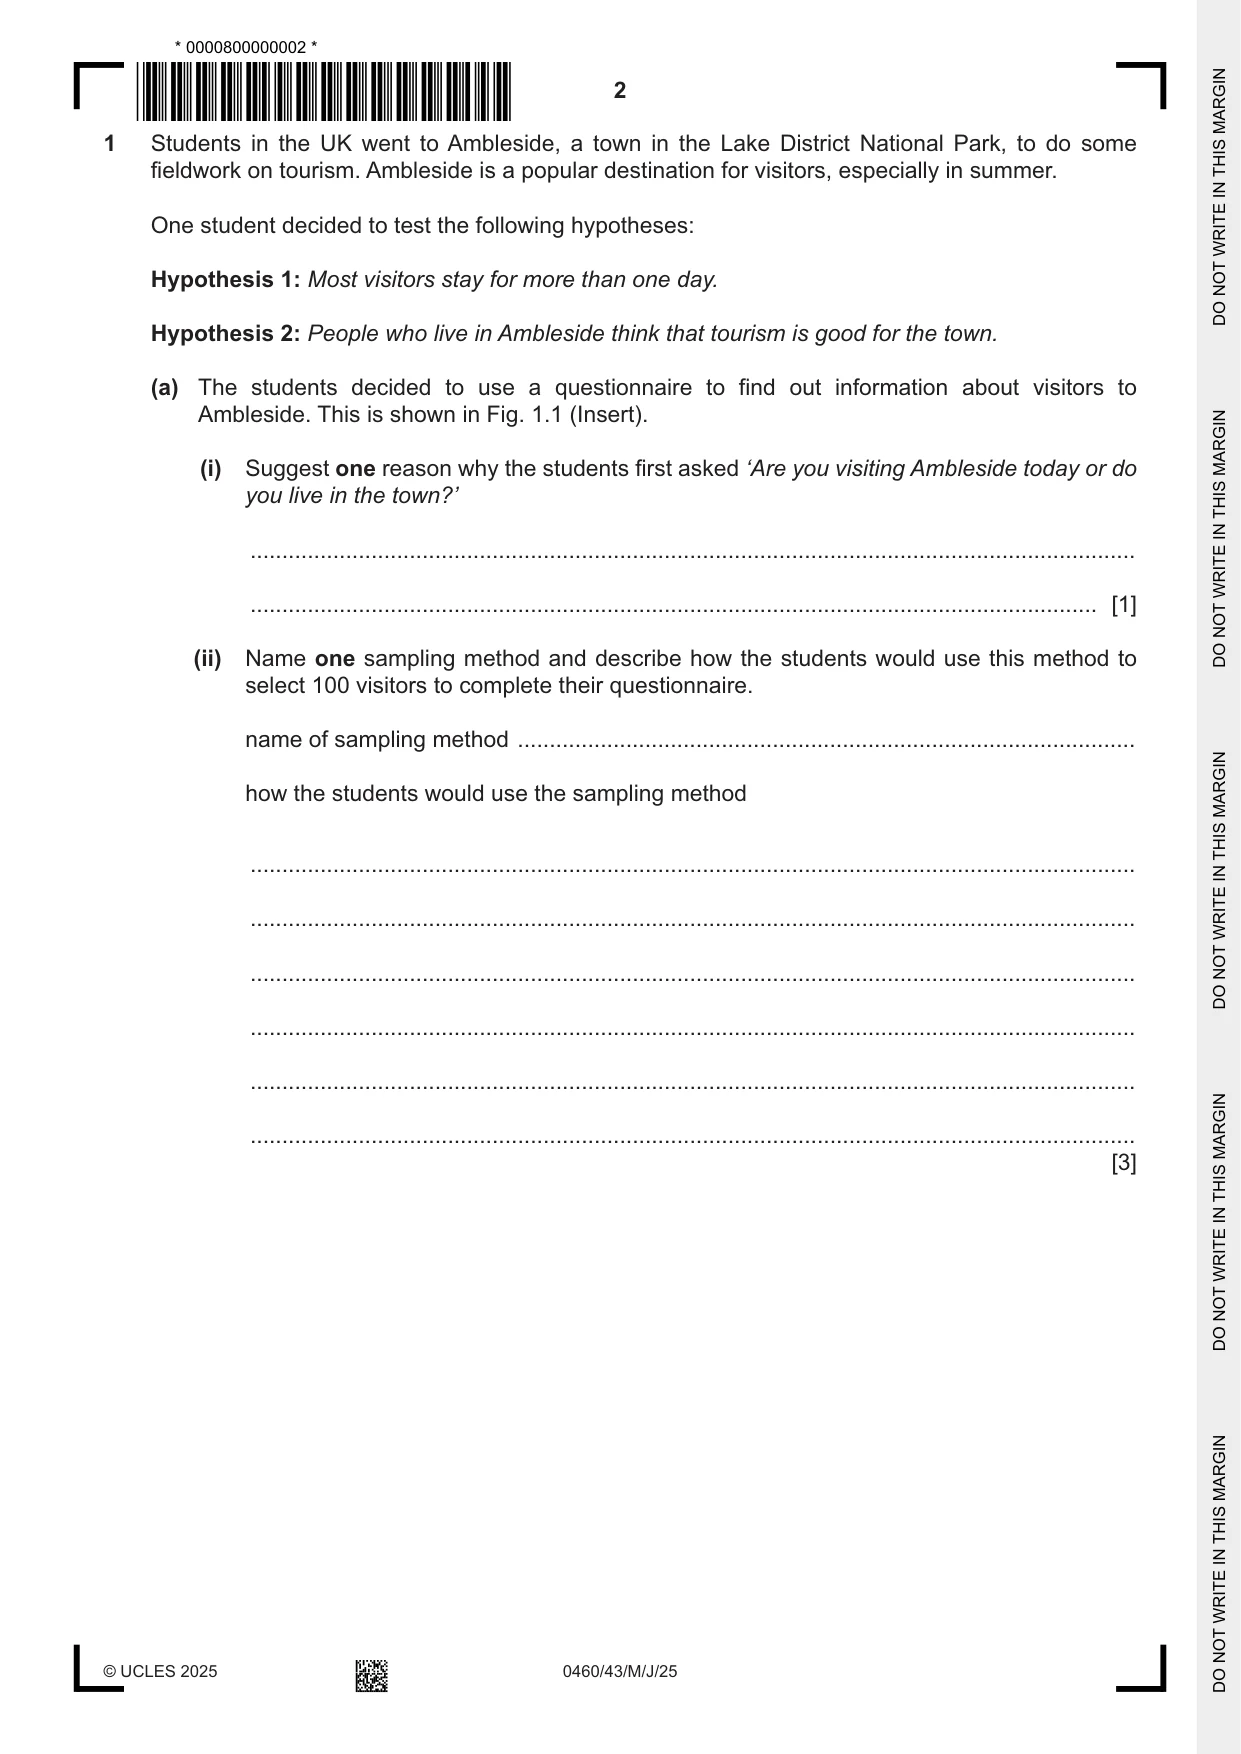





Mark scheme9 pages
Answers below. Sit the paper first if you are practising.

Questions as text
Q1 · Students in the UK went to Ambleside, a town in the Lake District National Park, to do…
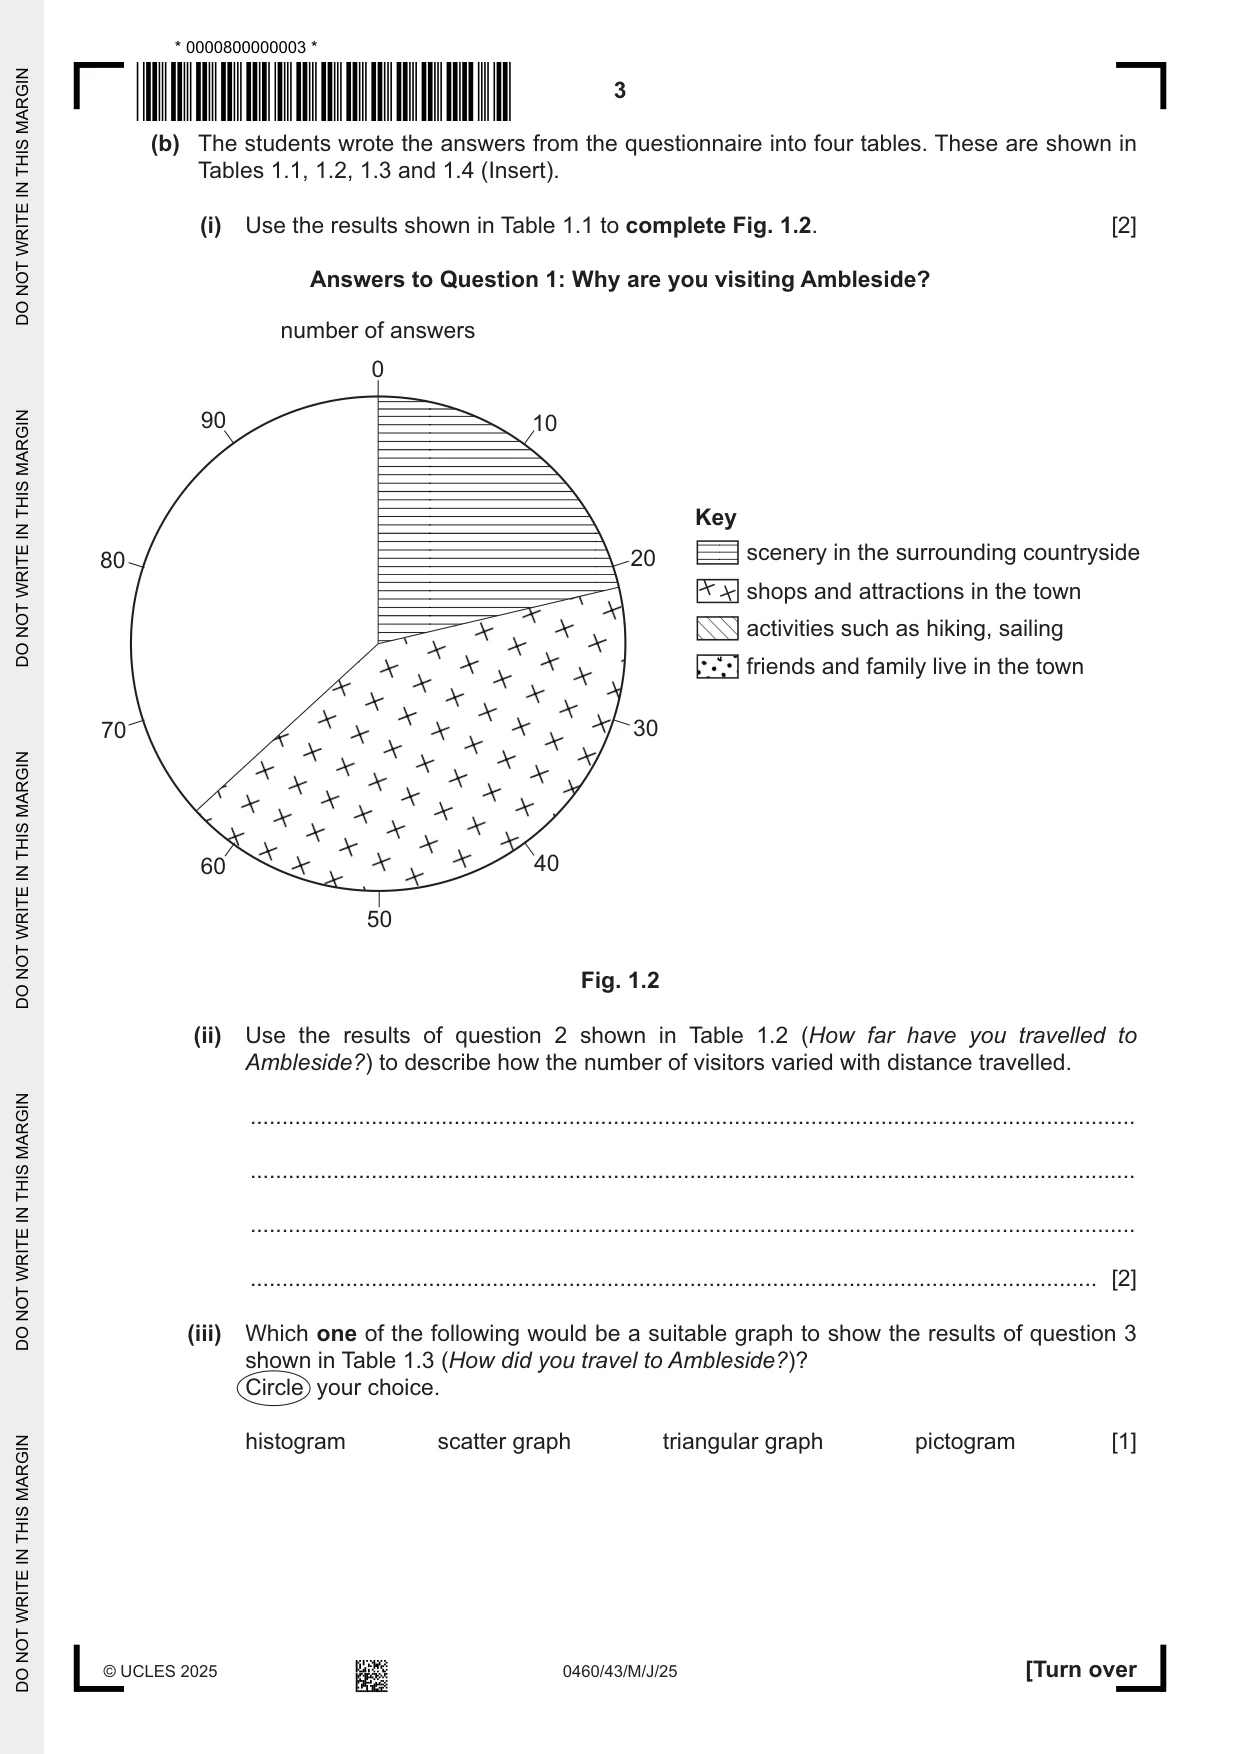
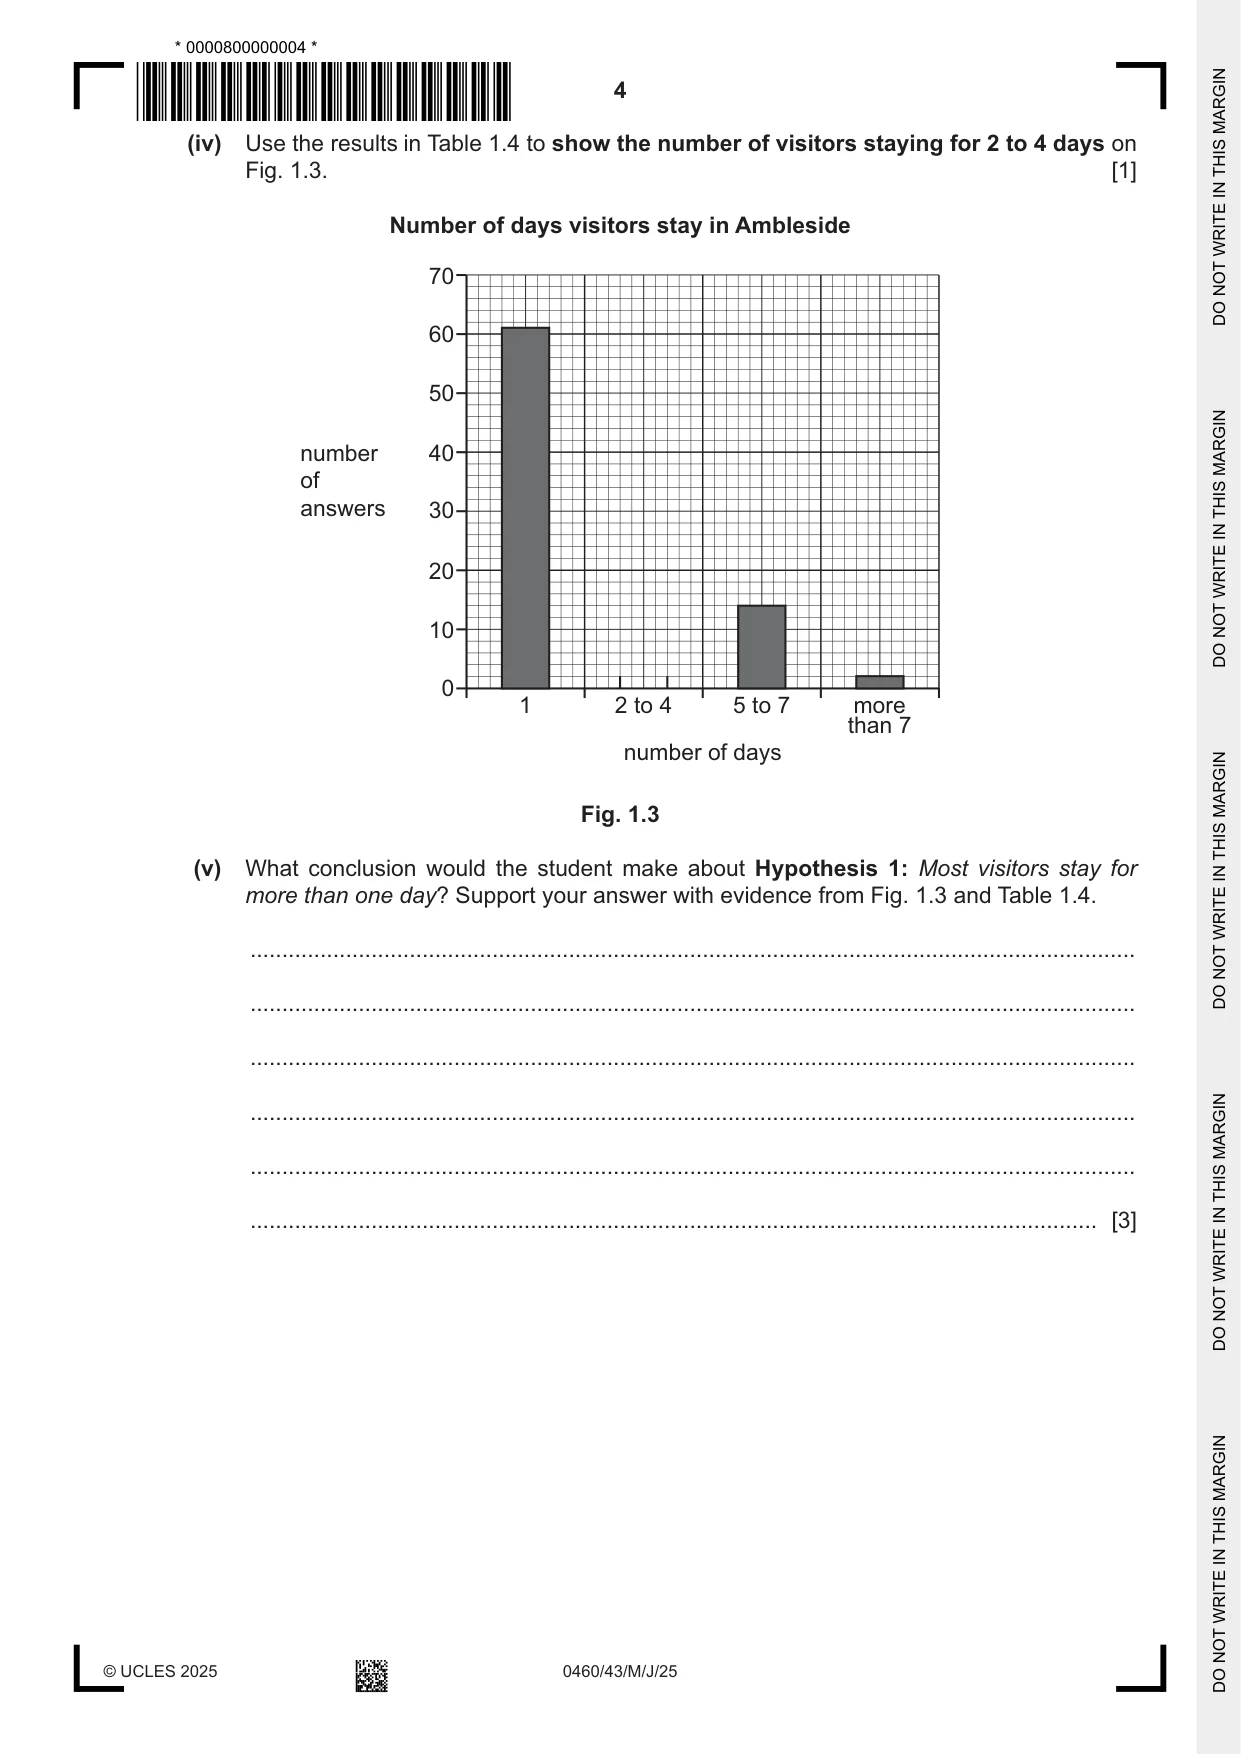
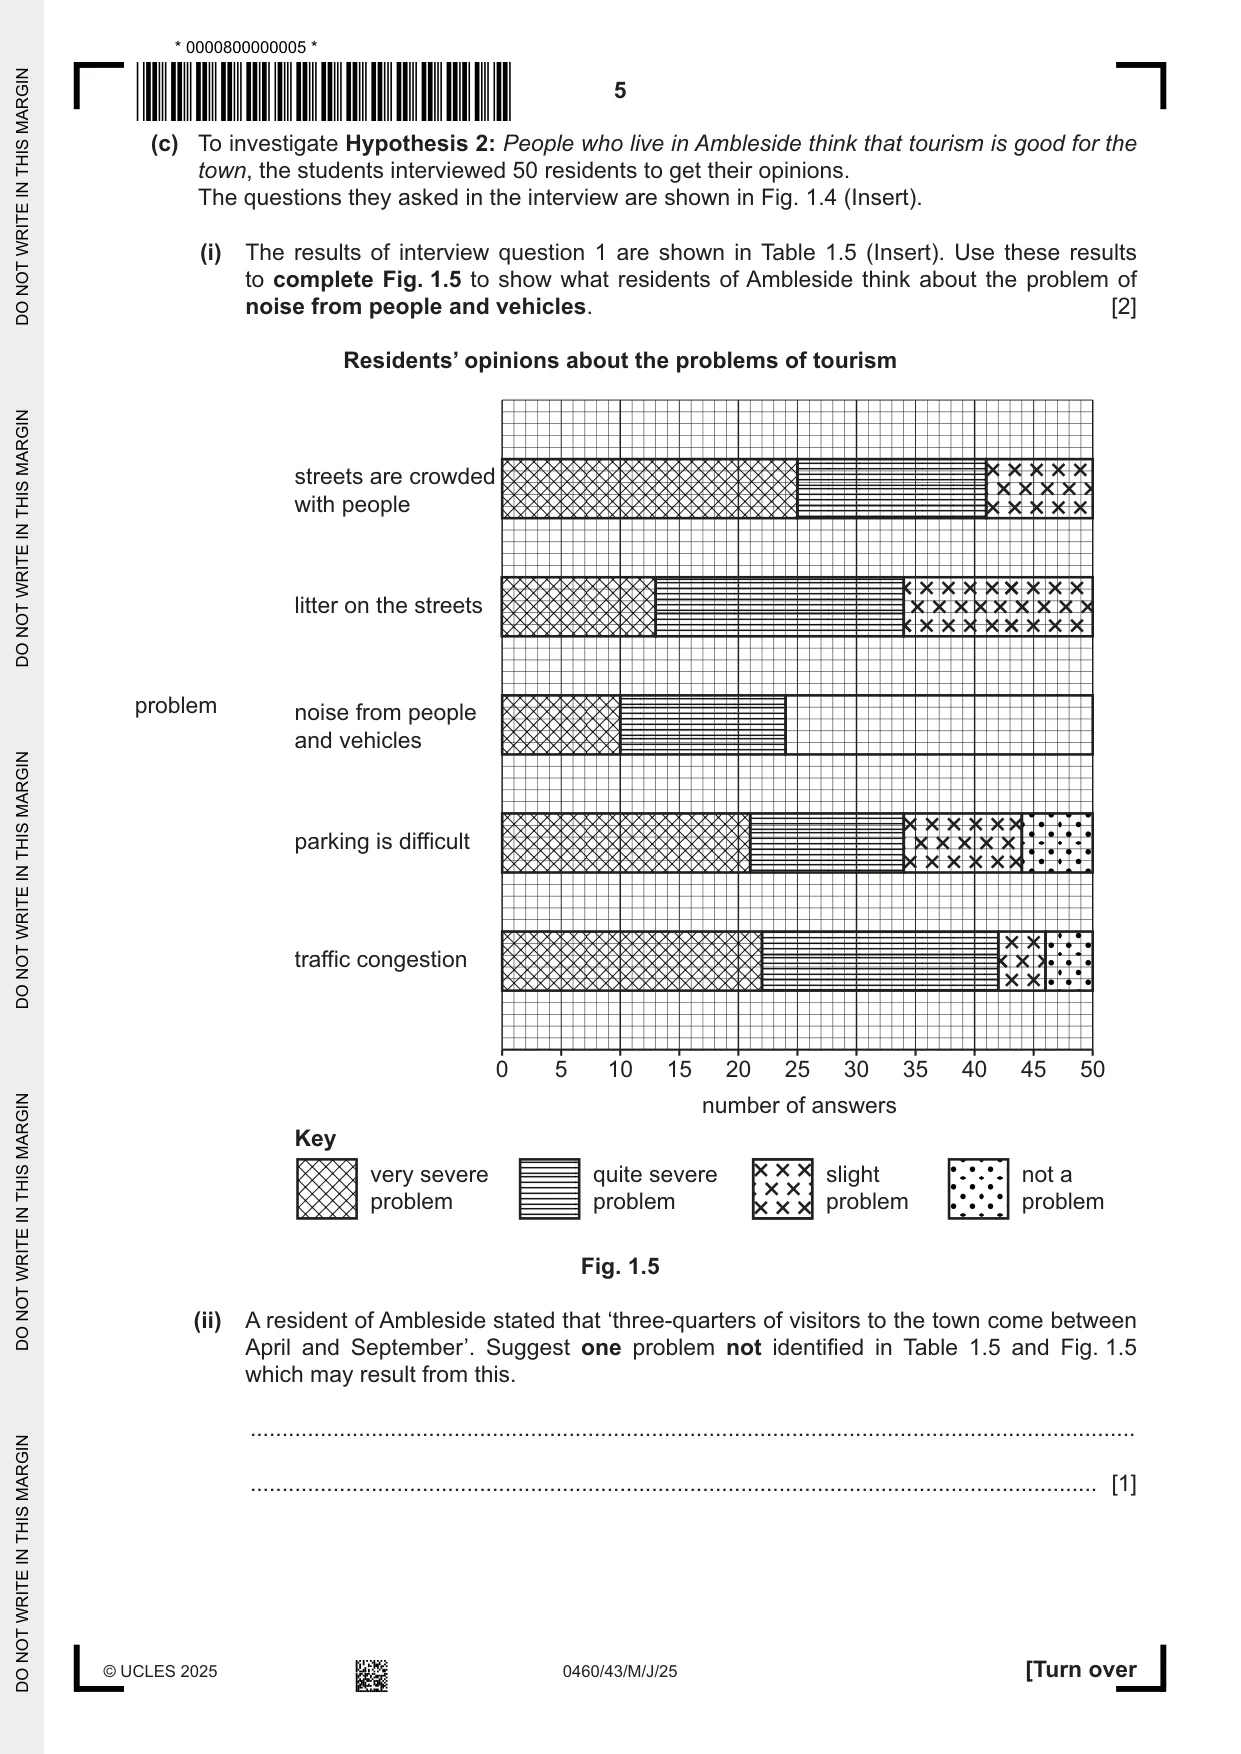
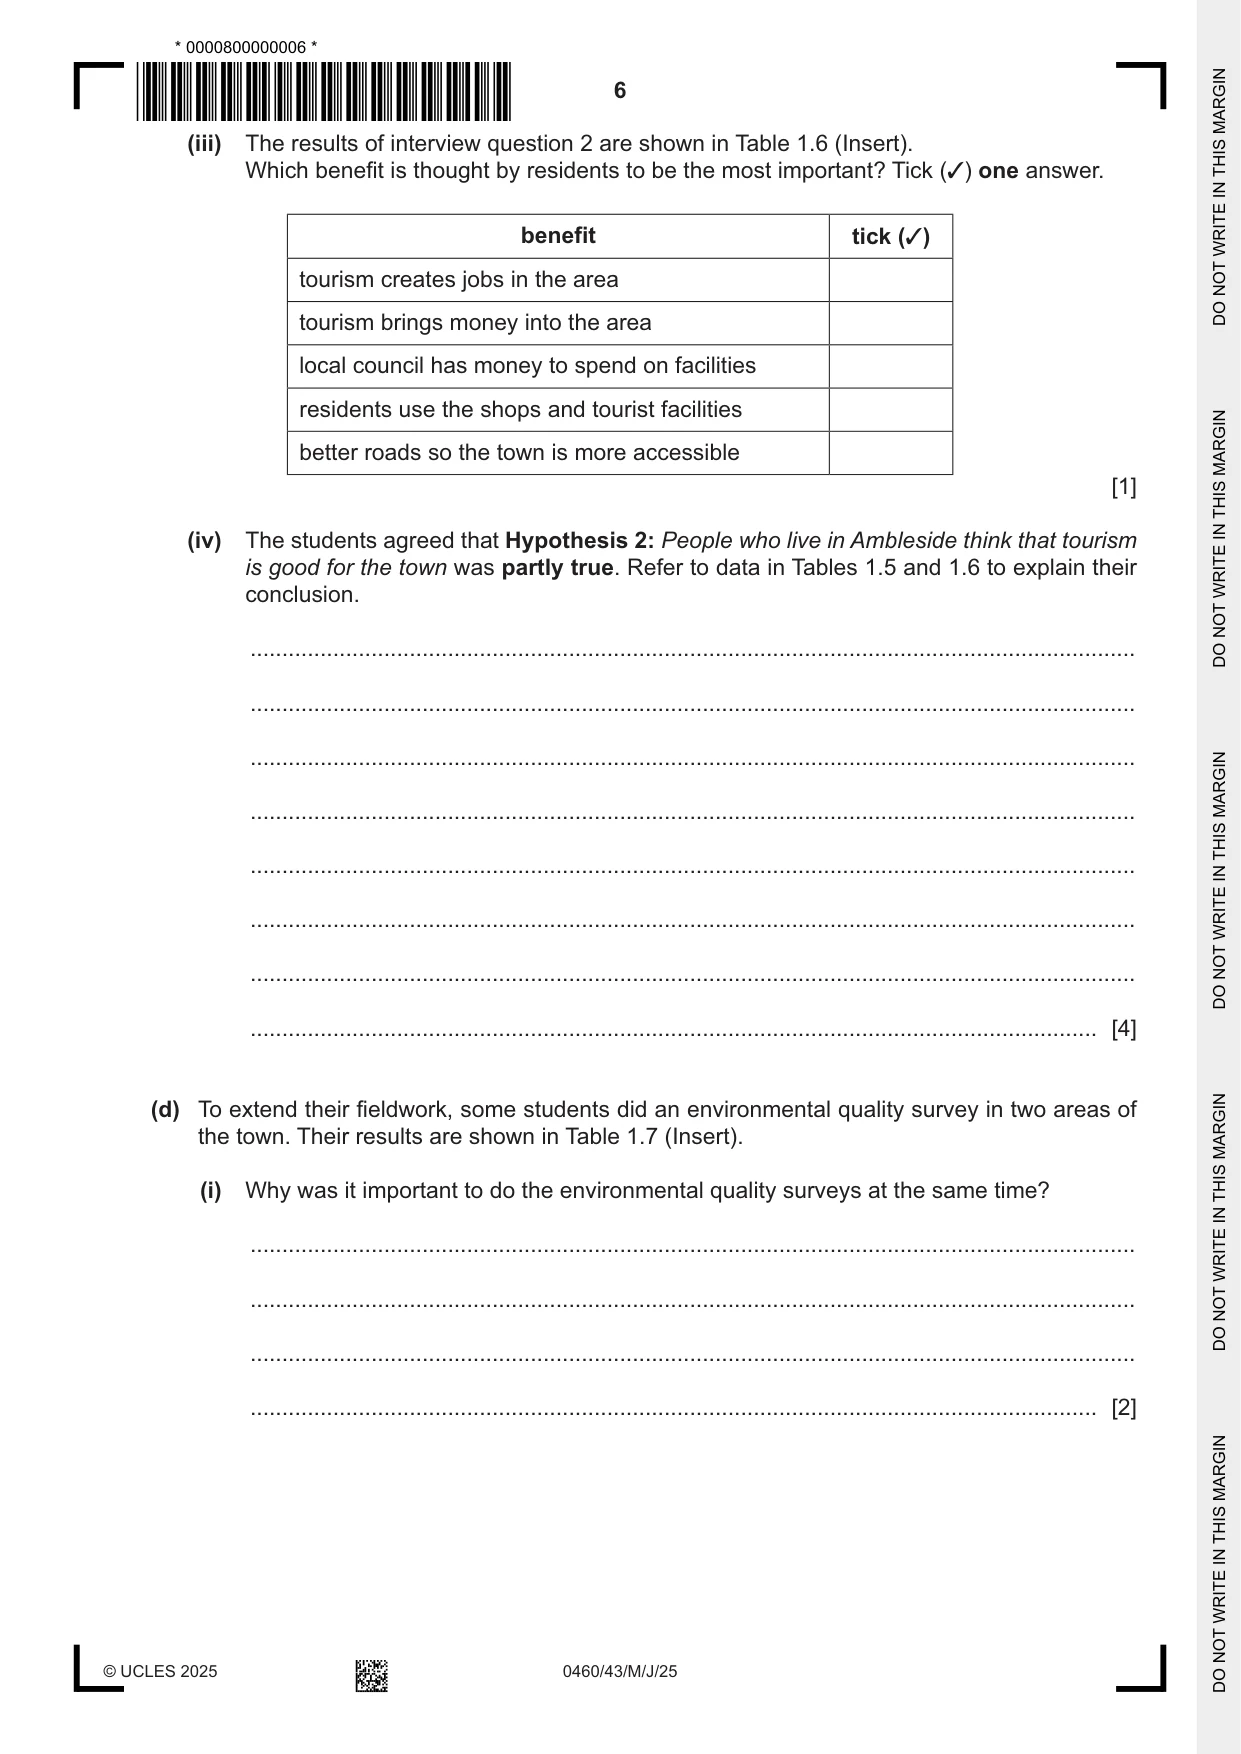
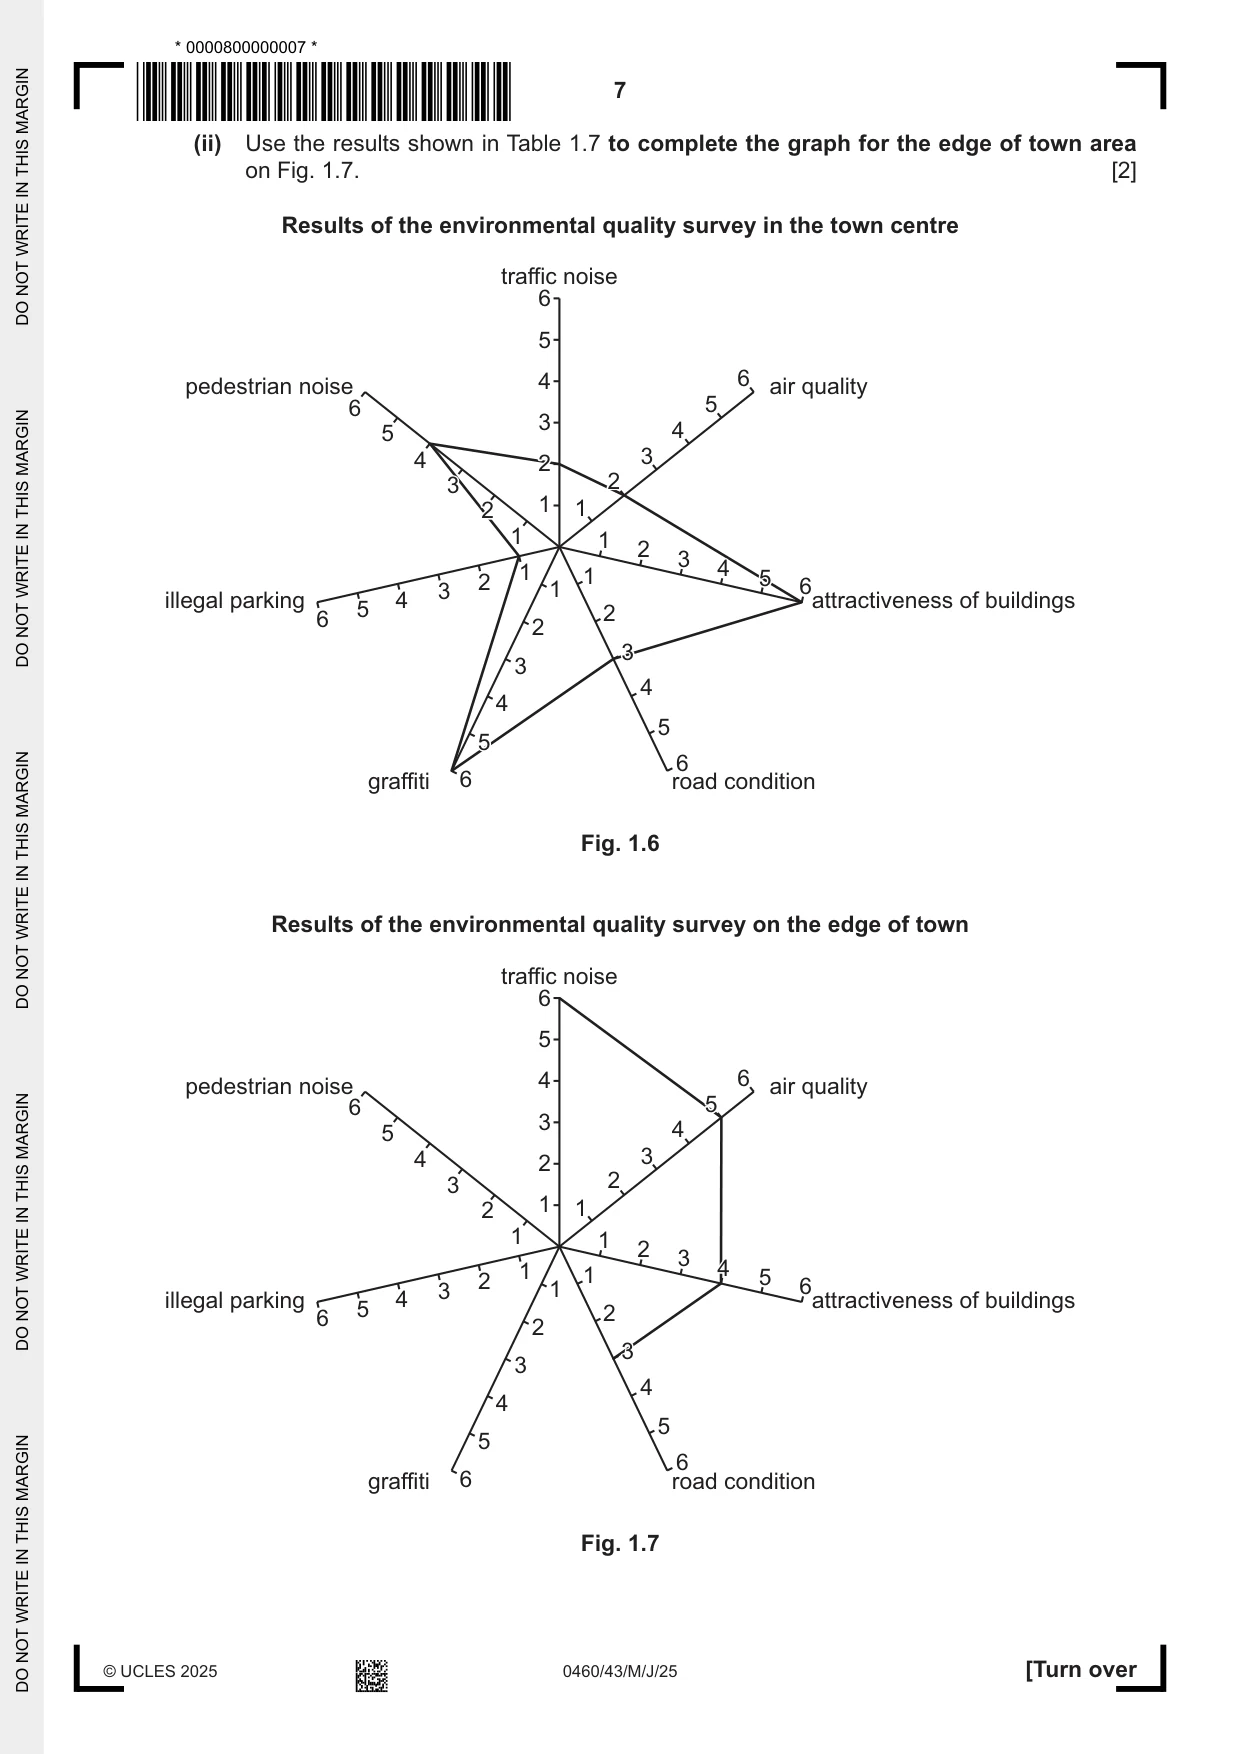
1 Students in the UK went to Ambleside, a town in the Lake District National Park, to do some fieldwork on tourism. Ambleside is a popular destination for visitors, especially in summer. One student decided to test the following hypotheses: Hypothesis 1: Most visitors stay for more than one day. Hypothesis 2: People who live in Ambleside think that tourism is good for the town. (a) The students decided to use a questionnaire to find out information about visitors to Ambleside. This is shown in Fig. 1.1 (Insert). (i) Suggest one reason why the students first asked ‘Are you visiting Ambleside today or do you live in the town?’ ........................................................................................................................................... ..................................................................................................................................... [1] (ii) Name one sampling method and describe how the students would use this method to select 100 visitors to complete their questionnaire. name of sampling method ................................................................................................. how the students would use the sampling method ........................................................................................................................................... ........................................................................................................................................... ........................................................................................................................................... ........................................................................................................................................... ........................................................................................................................................... ........................................................................................................................................... [3] (b) The students wrote the answers from the questionnaire into four tables. These are shown in Tables 1.1, 1.2, 1.3 and 1.4 (Insert). (i) Use the results shown in Table 1.1 to complete Fig. 1.2. [2] Answers to Question 1: Why are you visiting Ambleside? number of answers 0 90 10 Key scenery in the surrounding countryside80 20 shops and attractions in the town activities such as hiking, sailing friends and family live in the town 70 30 60 40 50 Fig. 1.2 (ii) Use the results of question 2 shown in Table 1.2 (How far have you travelled to Ambleside?) to describe how the number of visitors varied with distance travelled. ........................................................................................................................................... ........................................................................................................................................... ........................................................................................................................................... ..................................................................................................................................... [2] (iii) Which one of the following would be a suitable graph to show the results of question 3 shown in Table 1.3 (How did you travel to Ambleside?)? Circle your choice. histogram scatter graph triangular graph pictogram [1] (iv) Use the results in Table 1.4 to show the number of visitors staying for 2 to 4 days on Fig. 1.3. [1] Number of days visitors stay in Ambleside 70 60 50 number 40 of answers 30 20 10 0 1 2 to 4 5 to 7 more than 7 number of days Fig. 1.3 (v) What conclusion would the student make about Hypothesis 1: Most visitors stay for more than one day? Support your answer with evidence from Fig. 1.3 and Table 1.4. ........................................................................................................................................... ........................................................................................................................................... ........................................................................................................................................... ........................................................................................................................................... ........................................................................................................................................... ..................................................................................................................................... [3] (c) To investigate Hypothesis 2: People who live in Ambleside think that tourism is good for the town, the students interviewed 50 residents to get their opinions. The questions they asked in the interview are shown in Fig. 1.4 (Insert). (i) The results of interview question 1 are shown in Table 1.5 (Insert). Use these results to complete Fig. 1.5 to show what residents of Ambleside think about the problem of noise from people and vehicles. [2] Residents’ opinions about the problems of tourism streets are crowded with people litter on the streets problem noise from people and vehicles parking is difficult traffic congestion 0 5 10 15 20 25 30 35 40 45 50 number of answers Key very severe quite severe slight not a problem problem problem problem Fig. 1.5 (ii) A resident of Ambleside stated that ‘three-quarters of visitors to the town come between April and September’. Suggest one problem not identified in Table 1.5 and Fig. 1.5 which may result from this. ........................................................................................................................................... ..................................................................................................................................... [1] (iii) The results of interview question 2 are shown in Table 1.6 (Insert). Which benefit is thought by residents to be the most important? Tick (✓) one answer. benefit tick (✓) tourism creates jobs in the area tourism brings money into the area local council has money to spend on facilities residents use the shops and tourist facilities better roads so the town is more accessible [1] (iv) The students agreed that Hypothesis 2: People who live in Ambleside think that tourism is good for the town was partly true. Refer to data in Tables 1.5 and 1.6 to explain their conclusion. ........................................................................................................................................... ........................................................................................................................................... ........................................................................................................................................... ........................................................................................................................................... ........................................................................................................................................... ........................................................................................................................................... ........................................................................................................................................... ..................................................................................................................................... [4] (d) To extend their fieldwork, some students did an environmental quality survey in two areas of the town. Their results are shown in Table 1.7 (Insert). (i) Why was it important to do the environmental quality surveys at the same time? ........................................................................................................................................... ........................................................................................................................................... ........................................................................................................................................... ..................................................................................................................................... [2] (ii) Use the results shown in Table 1.7 to complete the graph for the edge of town area on Fig. 1.7. [2] Results of the environmental quality survey in the town centre traffic noise 6 5 pedestrian noise 4 6 air quality 6 5 3 5 4 4 2 3 3 2 2 1 1 1 1 2 3 4 1 1 5 2 6 1 3illegal parking 4 attractiveness of buildings 5 2 6 2 3 3 4 4 5 5 6 graffiti 6 road condition Fig. 1.6 Results of the environmental quality survey on the edge of town traffic noise 6 5 pedestrian noise 4 6 air quality 6 5 3 5 4 4 2 3 3 2 2 1 1 1 1 2 3 4 1 1 5 2 6 1 3illegal parking 4 attractiveness of buildings 5 2 6 2 3 3 4 4 5 5 6 graffiti 6 road condition Fig. 1.7 (e) The residents of Ambleside identified traffic congestion as one problem of tourism in the town. (i) Suggest why traffic congestion is a problem in many towns popular with tourists. ........................................................................................................................................... ........................................................................................................................................... ........................................................................................................................................... ..................................................................................................................................... [2] (ii) Describe three ways to reduce traffic congestion in towns which attract many tourists. 1 ........................................................................................................................................ ........................................................................................................................................... 2 ........................................................................................................................................ ........................................................................................................................................... 3 ........................................................................................................................................ ........................................................................................................................................... [3] [Total: 30]
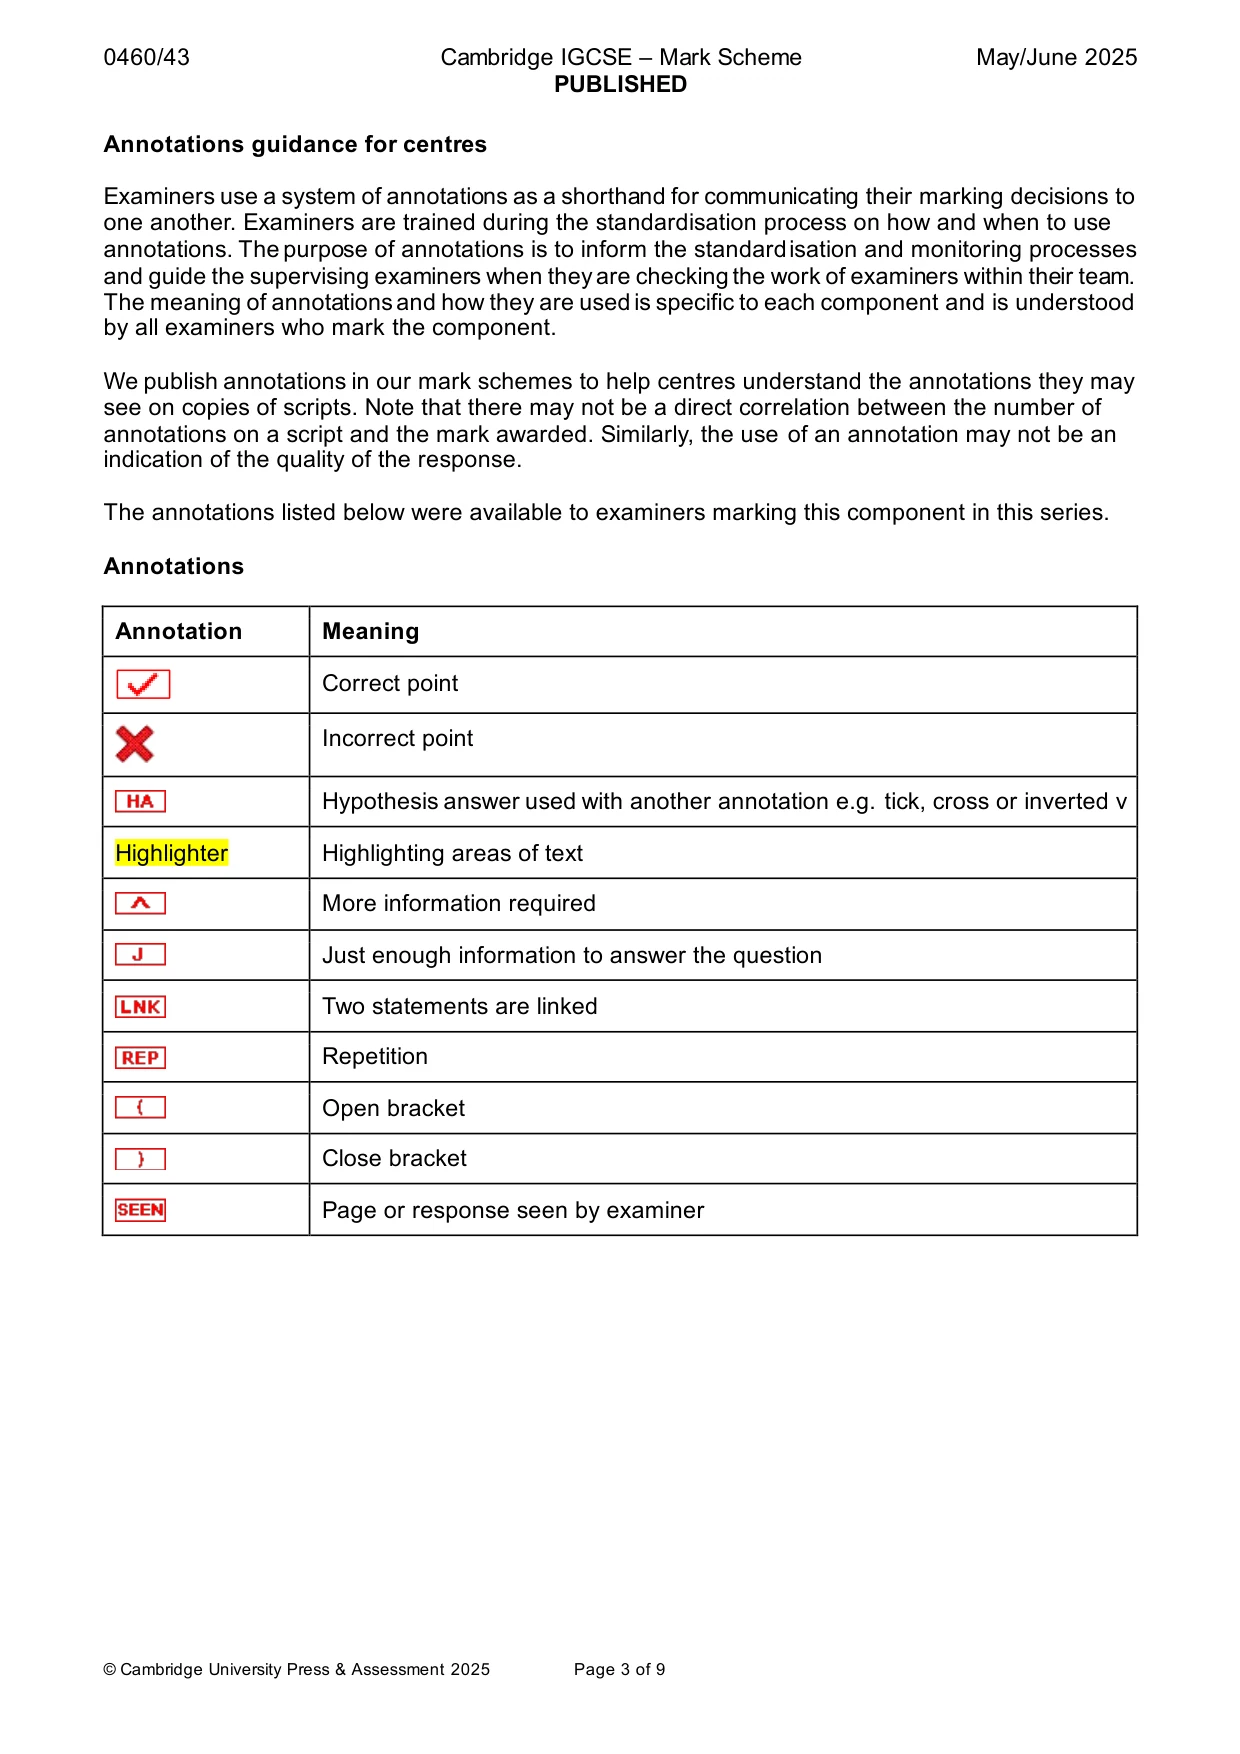
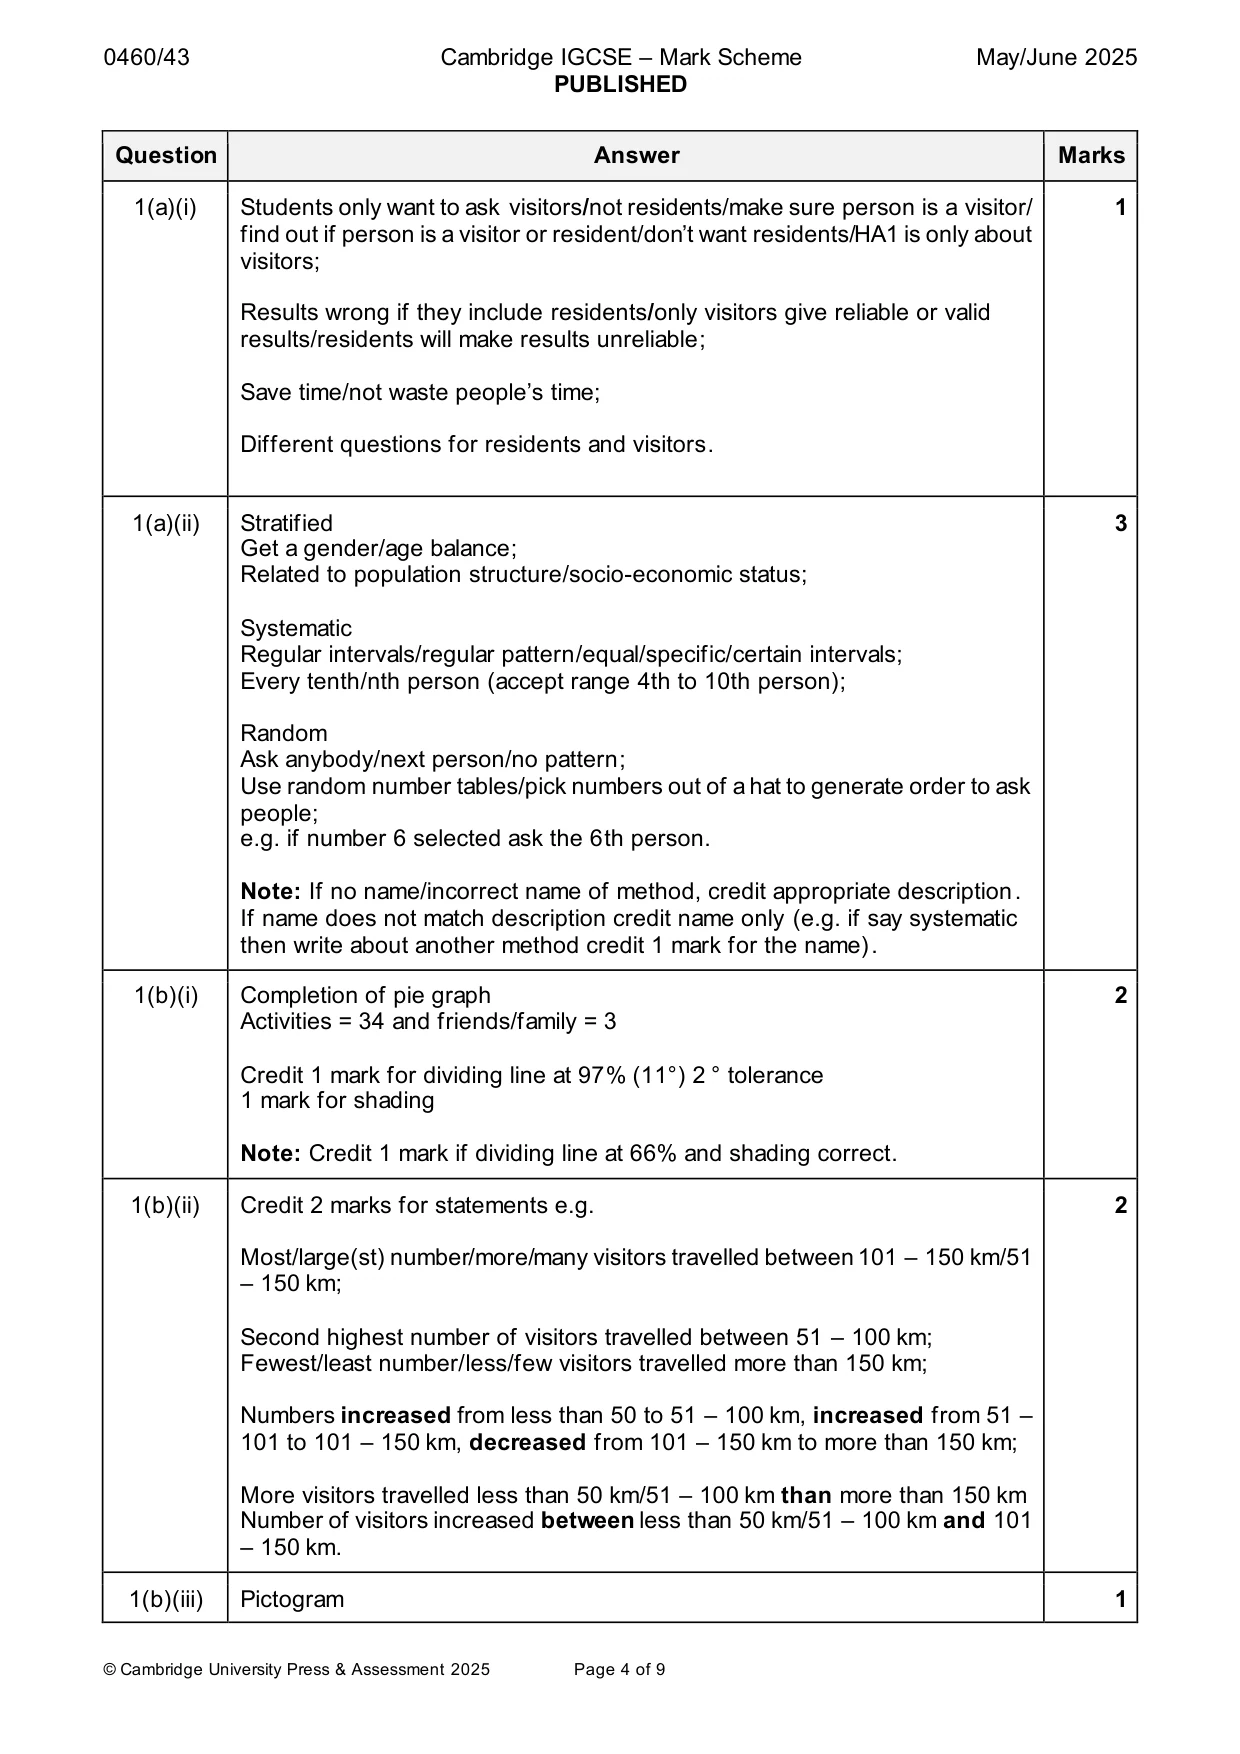
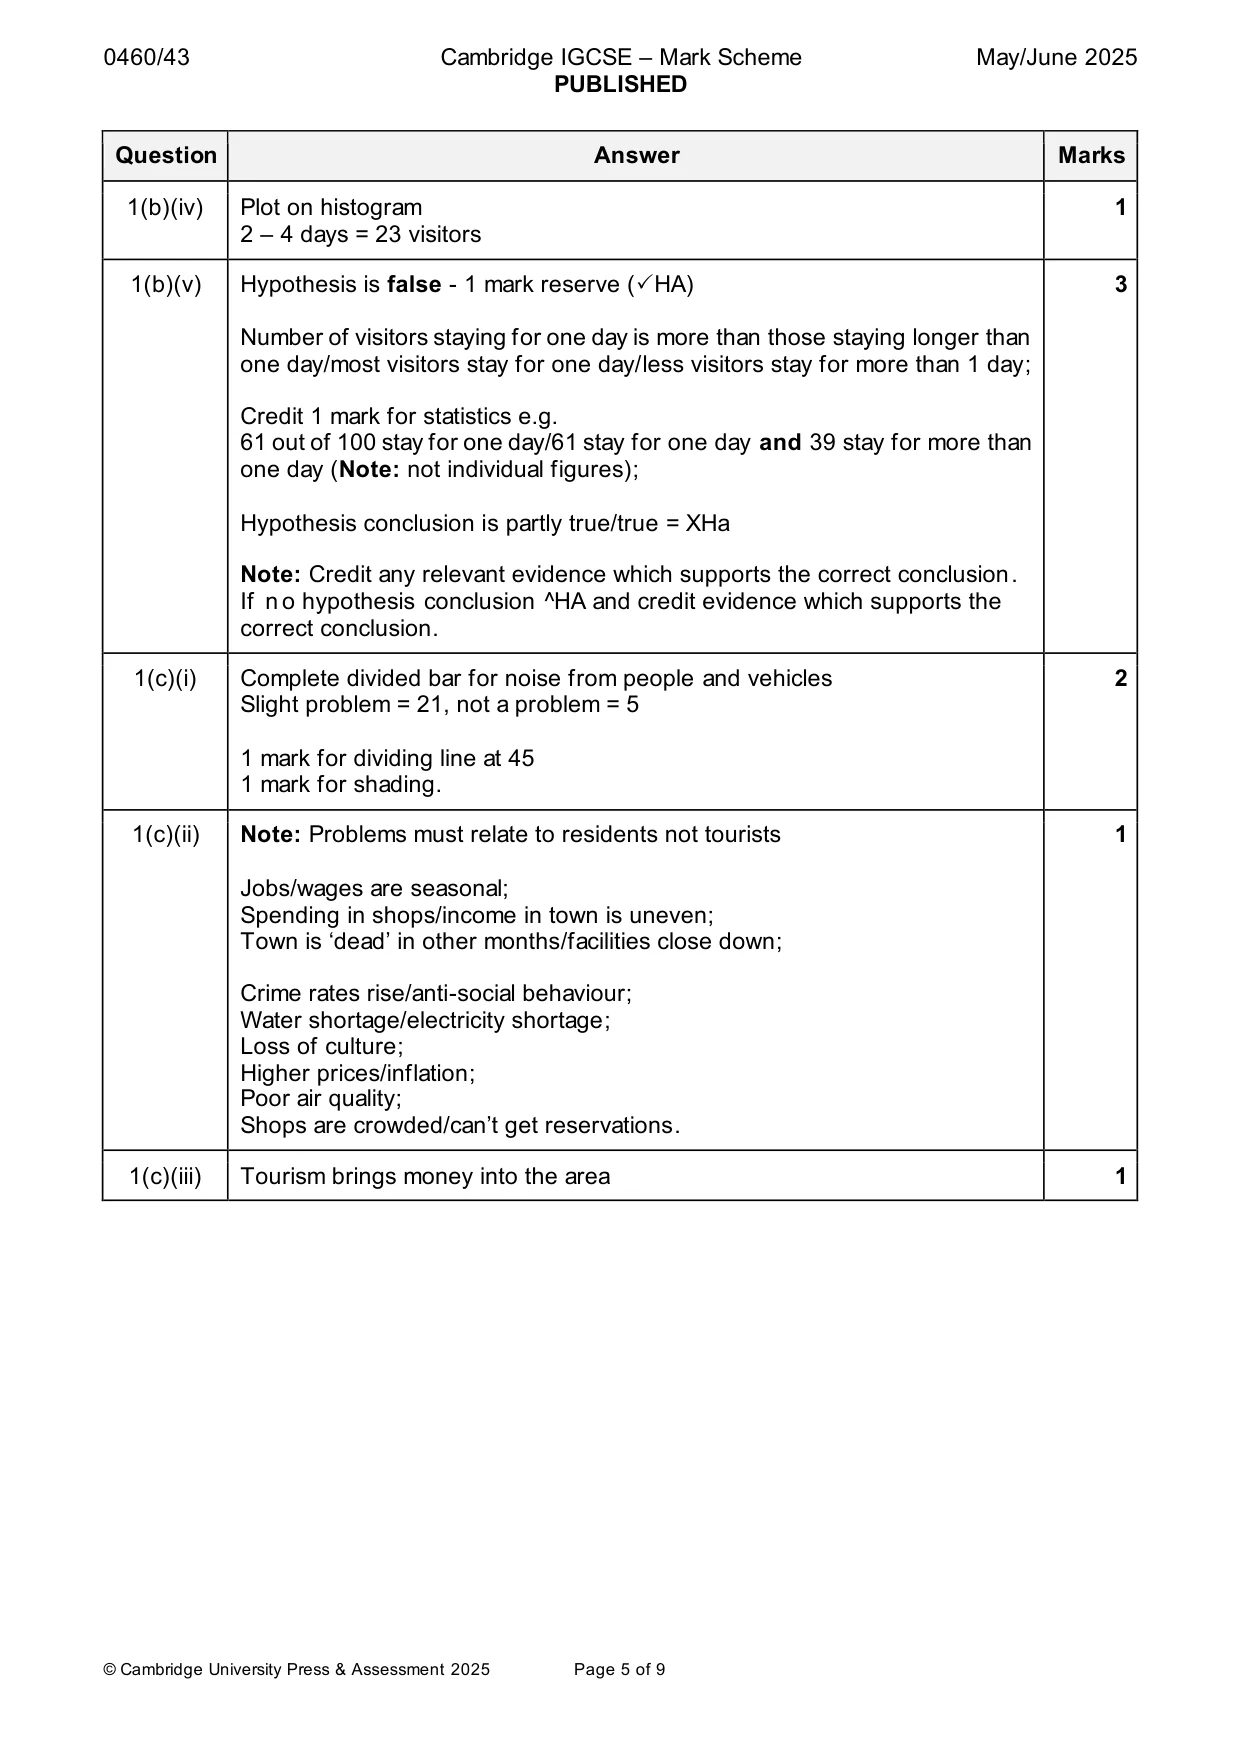
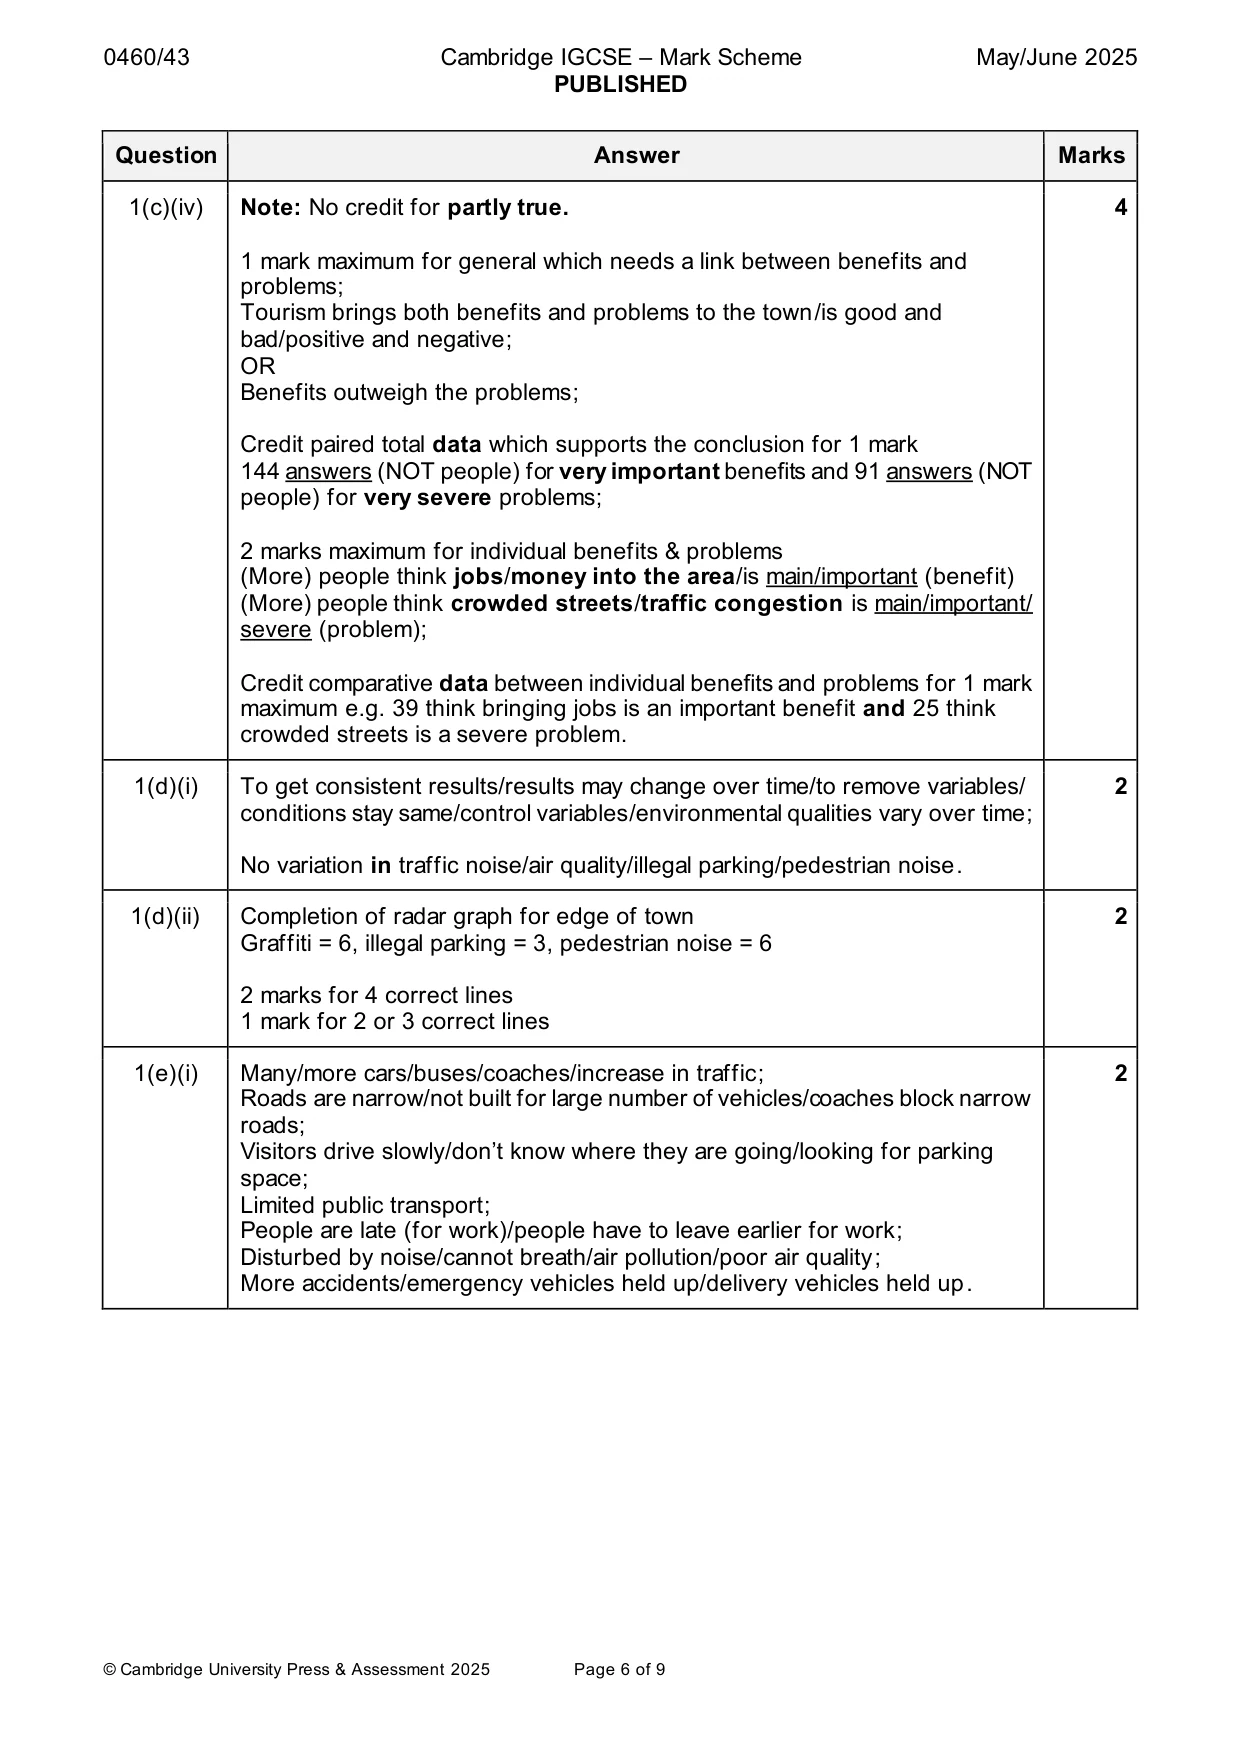
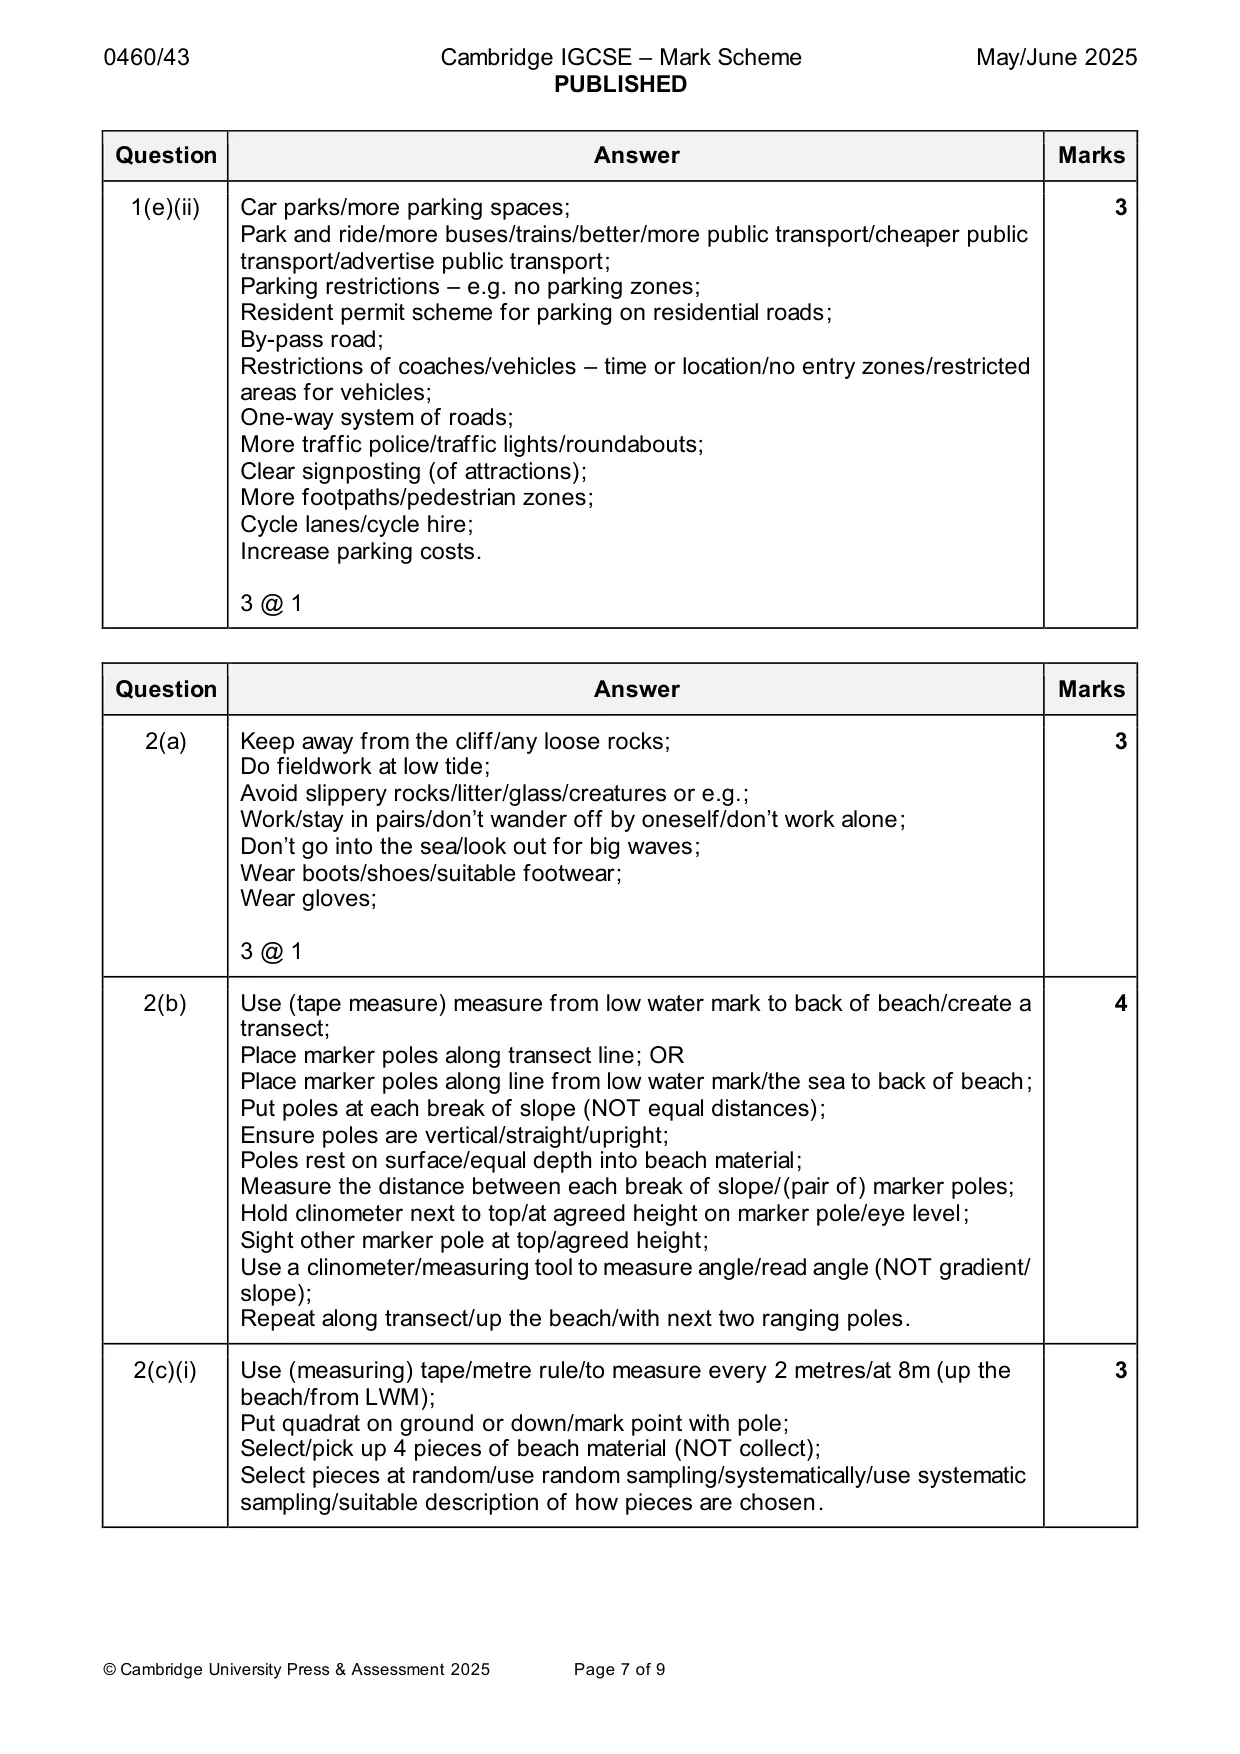
Mark scheme: Question Answer Marks 1(a)(i) Students only want to ask visitors/not residents/make sure person is a visitor/ 1 find out if person is a visitor or resident/don’t want residents/HA1 is only about visitors; Results wrong if they include residents/only visitors give reliable or valid results/residents will make results unreliable; Save time/not waste people’s time; Different questions for residents and visitors. 1(a)(ii) Stratified 3 Get a gender/age balance; Related to population structure/socio-economic status; Systematic Regular intervals/regular pattern/equal/specific/certain intervals; Every tenth/nth person (accept range 4th to 10th person); Random Ask anybody/next person/no pattern; Use random number tables/pick numbers out of a hat to generate order to ask people; e.g. if number 6 selected ask the 6th person. Note: If no name/incorrect name of method, credit appropriate description. If name does not match description credit name only (e.g. if say systematic then write about another method credit 1 mark for the name). 1(b)(i) Completion of pie graph 2 Activities = 34 and friends/family = 3 Credit 1 mark for dividing line at 97% (11°) 2 ° tolerance 1 mark for shading Note: Credit 1 mark if dividing line at 66% and shading correct. 1(b)(ii) Credit 2 marks for statements e.g. 2 Most/large(st) number/more/many visitors travelled between 101 – 150 km/51 – 150 km; Second highest number of visitors travelled between 51 – 100 km; Fewest/least number/less/few visitors travelled more than 150 km; Numbers increased from less than 50 to 51 – 100 km, increased from 51 – 101 to 101 – 150 km, decreased from 101 – 150 km to more than 150 km; More visitors travelled less than 50 km/51 – 100 km than more than 150 km Number of visitors increased between less than 50 km/51 – 100 km and 101 – 150 km. 1(b)(iii) Pictogram 1 1(b)(iv) Plot on histogram 1 2 – 4 days = 23 visitors 1(b)(v) Hypothesis is false - 1 mark reserve (HA) 3 Number of visitors staying for one day is more than those staying longer than one day/most visitors stay for one day/less visitors stay for more than 1 day; Credit 1 mark for statistics e.g. 61 out of 100 stay for one day/61 stay for one day and 39 stay for more than one day (Note: not individual figures); Hypothesis conclusion is partly true/true = XHa Note: Credit any relevant evidence which supports the correct conclusion. If n o hypothesis conclusion ^HA and credit evidence which supports the correct conclusion. 1(c)(i) Complete divided bar for noise from people and vehicles 2 Slight problem = 21, not a problem = 5 1 mark for dividing line at 45 1 mark for shading. 1(c)(ii) Note: Problems must relate to residents not tourists 1 Jobs/wages are seasonal; Spending in shops/income in town is uneven; Town is ‘dead’ in other months/facilities close down; Crime rates rise/anti-social behaviour; Water shortage/electricity shortage; Loss of culture; Higher prices/inflation; Poor air quality; Shops are crowded/can’t get reservations. 1(c)(iii) Tourism brings money into the area 1 1(c)(iv) Note: No credit for partly true. 4 1 mark maximum for general which needs a link between benefits and problems; Tourism brings both benefits and problems to the town/is good and bad/positive and negative; OR Benefits outweigh the problems; Credit paired total data which supports the conclusion for 1 mark 144 answers (NOT people) for very important benefits and 91 answers (NOT people) for very severe problems; 2 marks maximum for individual benefits & problems (More) people think jobs/money into the area/is main/important (benefit) (More) people think crowded streets/traffic congestion is main/important/ severe (problem); Credit comparative data between individual benefits and problems for 1 mark maximum e.g. 39 think bringing jobs is an important benefit and 25 think crowded streets is a severe problem. 1(d)(i) To get consistent results/results may change over time/to remove variables/ 2 conditions stay same/control variables/environmental qualities vary over time; No variation in traffic noise/air quality/illegal parking/pedestrian noise. 1(d)(ii) Completion of radar graph for edge of town 2 Graffiti = 6, illegal parking = 3, pedestrian noise = 6 2 marks for 4 correct lines 1 mark for 2 or 3 correct lines 1(e)(i) Many/more cars/buses/coaches/increase in traffic; 2 Roads are narrow/not built for large number of vehicles/coaches block narrow roads; Visitors drive slowly/don’t know where they are going/looking for parking space; Limited public transport; People are late (for work)/people have to leave earlier for work; Disturbed by noise/cannot breath/air pollution/poor air quality; More accidents/emergency vehicles held up/delivery vehicles held up. 1(e)(ii) Car parks/more parking spaces; 3 Park and ride/more buses/trains/better/more public transport/cheaper public transport/advertise public transport; Parking restrictions – e.g. no parking zones; Resident permit scheme for parking on residential roads; By-pass road; Restrictions of coaches/vehicles – time or location/no entry zones/restricted areas for vehicles; One-way system of roads; More traffic police/traffic lights/roundabouts; Clear signposting (of attractions); More footpaths/pedestrian zones; Cycle lanes/cycle hire; Increase parking costs. 3 @ 1
Q2 · Students in France were studying beach processes
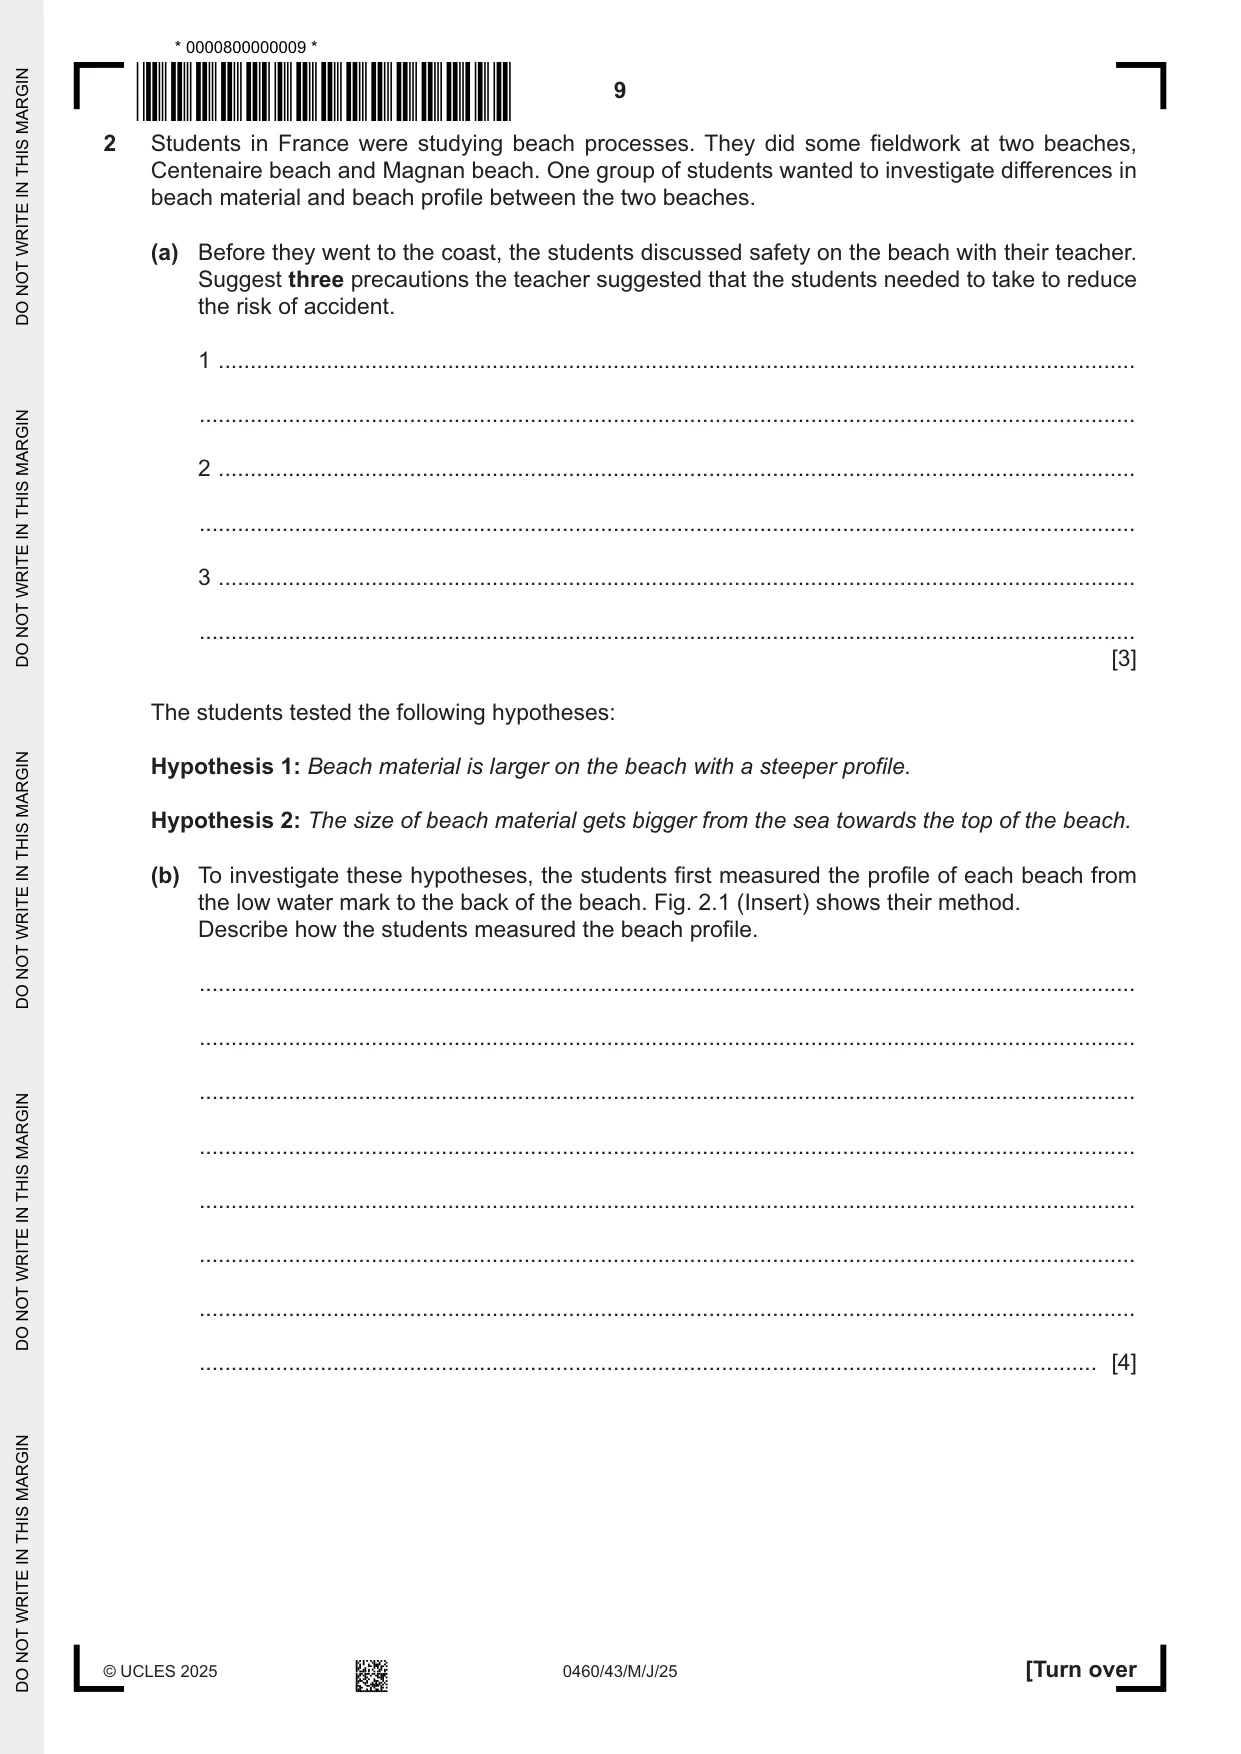
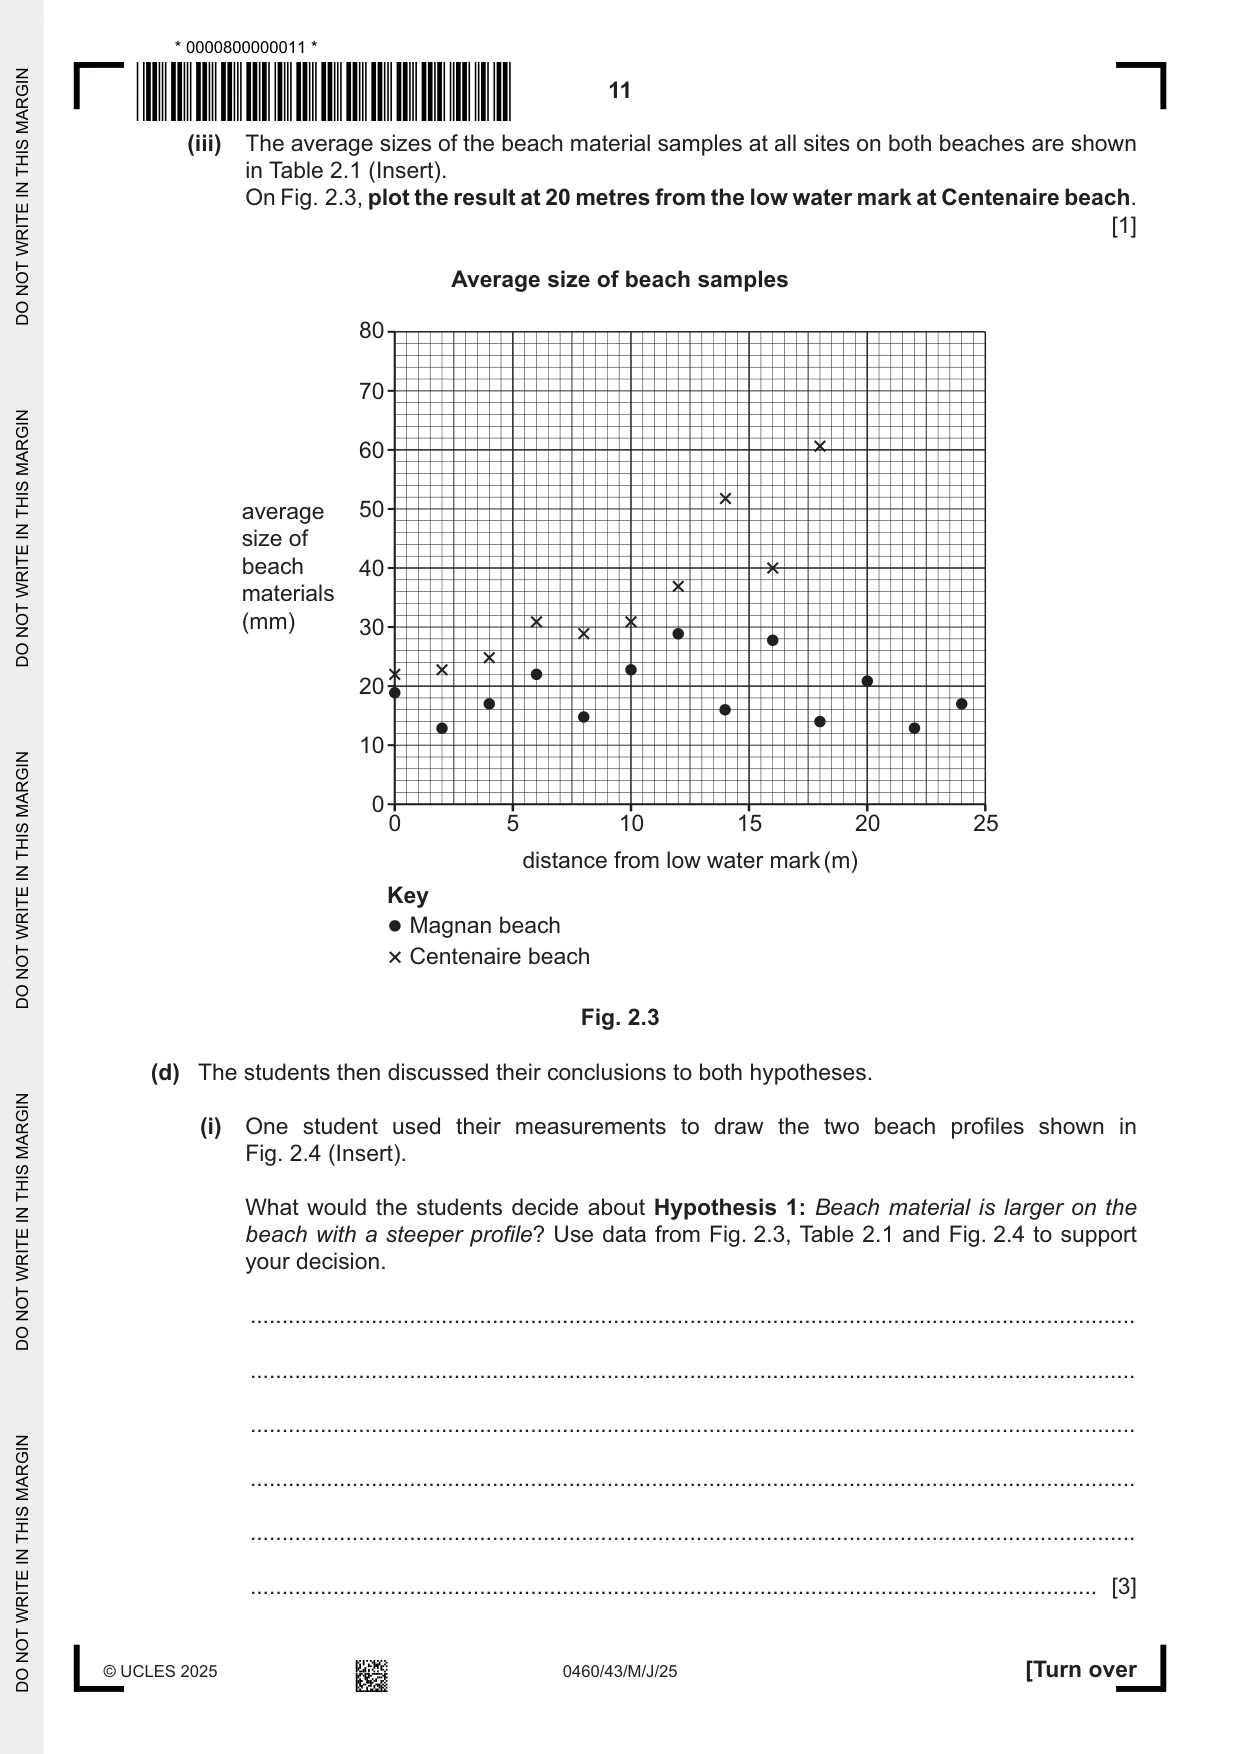
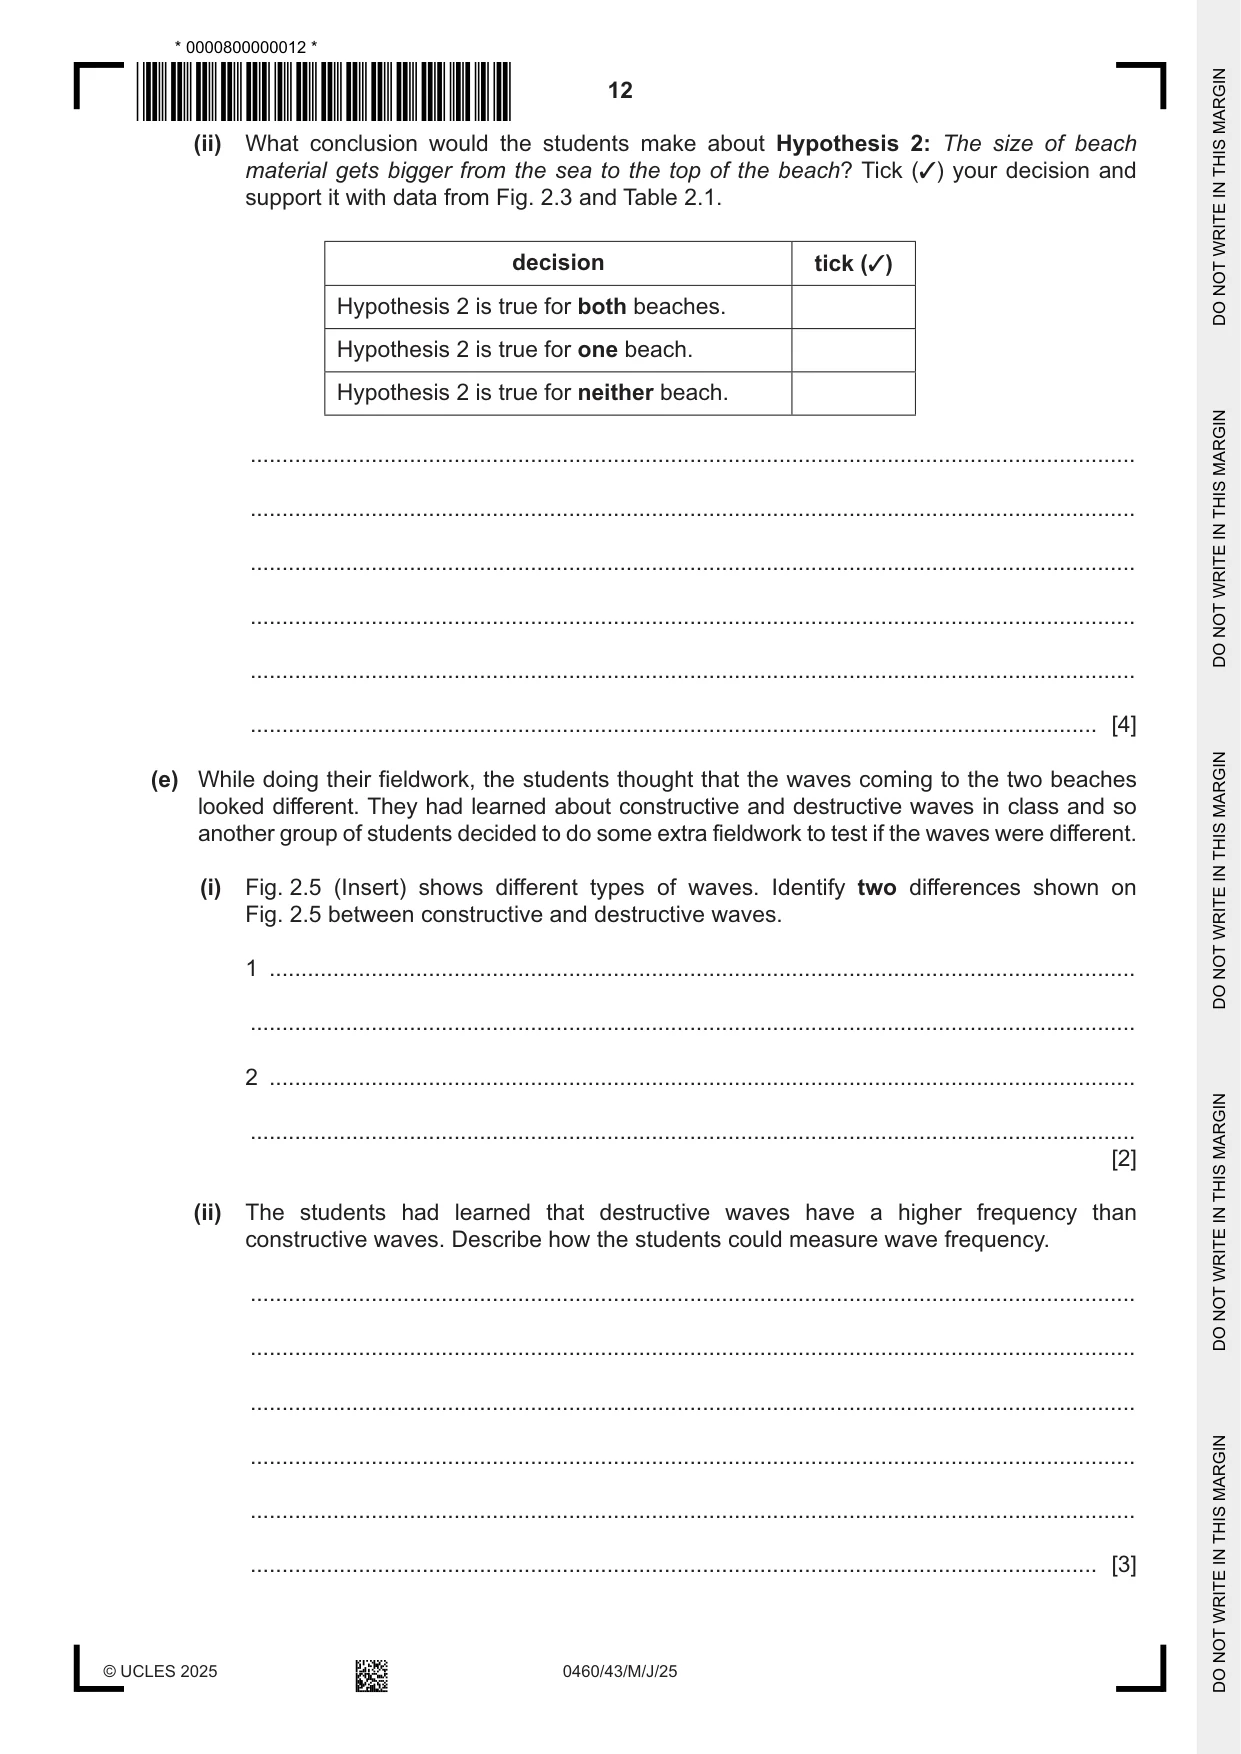
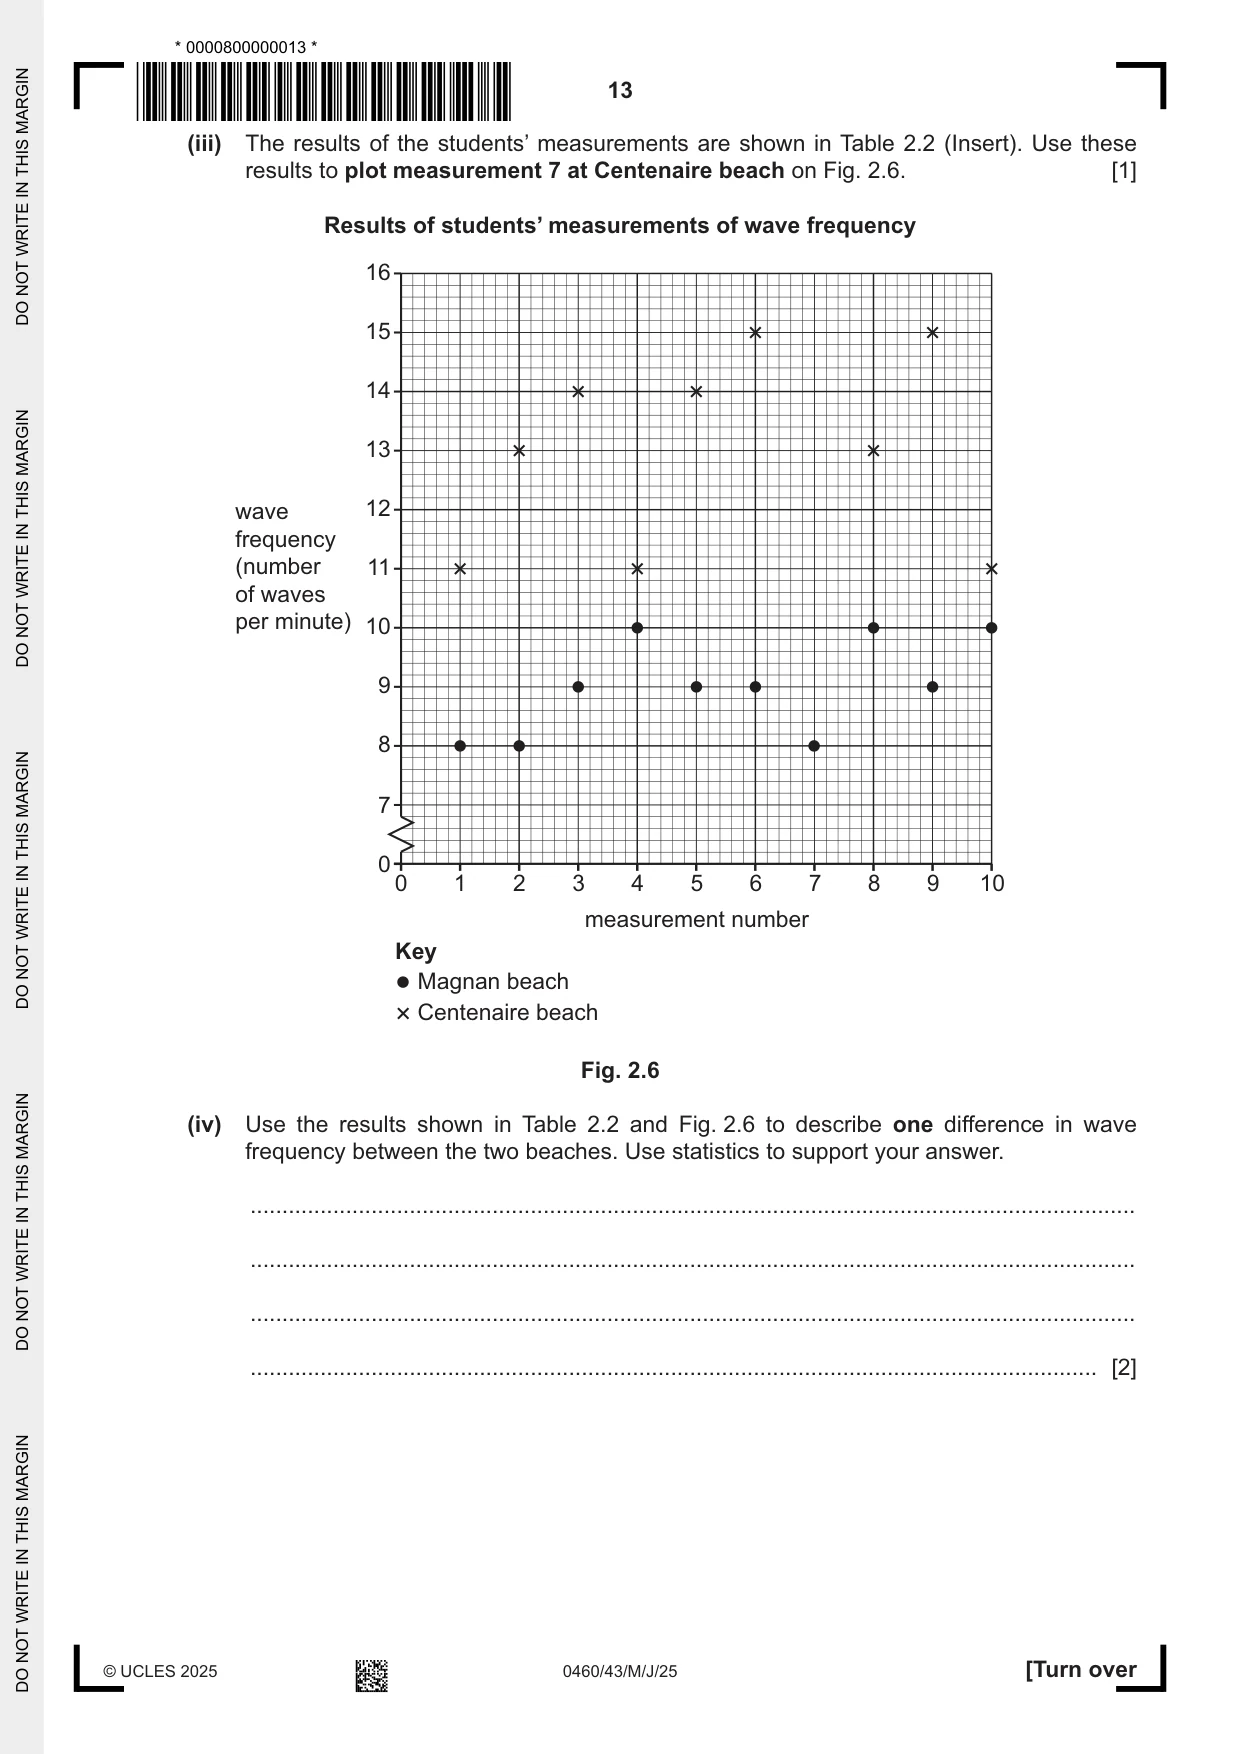
2 Students in France were studying beach processes. They did some fieldwork at two beaches, Centenaire beach and Magnan beach. One group of students wanted to investigate differences in beach material and beach profile between the two beaches. (a) Before they went to the coast, the students discussed safety on the beach with their teacher. Suggest three precautions the teacher suggested that the students needed to take to reduce the risk of accident. 1 ................................................................................................................................................ ................................................................................................................................................... 2 ................................................................................................................................................ ................................................................................................................................................... 3 ................................................................................................................................................ ................................................................................................................................................... [3] The students tested the following hypotheses: Hypothesis 1: Beach material is larger on the beach with a steeper profile. Hypothesis 2: The size of beach material gets bigger from the sea towards the top of the beach. (b) To investigate these hypotheses, the students first measured the profile of each beach from the low water mark to the back of the beach. Fig. 2.1 (Insert) shows their method. Describe how the students measured the beach profile. ................................................................................................................................................... ................................................................................................................................................... ................................................................................................................................................... ................................................................................................................................................... ................................................................................................................................................... ................................................................................................................................................... ................................................................................................................................................... ............................................................................................................................................. [4] (c) Next, the students measured the size of beach material on both beaches. To do this they took samples of beach material every two metres from the low water mark to the top of each beach. (i) A completed data recording sheet for one site is shown in Fig. 2.2 (Insert). Describe a possible method the students used to collect a sample of four pieces of material from the beach at each site. ........................................................................................................................................... ........................................................................................................................................... ........................................................................................................................................... ........................................................................................................................................... ........................................................................................................................................... ..................................................................................................................................... [3] (ii) Describe how the students could have measured the size of each piece of beach material they collected. ........................................................................................................................................... ........................................................................................................................................... ........................................................................................................................................... ..................................................................................................................................... [2] (iii) The average sizes of the beach material samples at all sites on both beaches are shown in Table 2.1 (Insert). On Fig. 2.3, plot the result at 20 metres from the low water mark at Centenaire beach. [1] Average size of beach samples 80 70 60 average 50 size of beach 40 materials (mm) 30 20 10 0 0 5 10 15 20 25 distance from low water mark (m) Key Magnan beach Centenaire beach Fig. 2.3 (d) The students then discussed their conclusions to both hypotheses. (i) One student used their measurements to draw the two beach profiles shown in Fig. 2.4 (Insert). What would the students decide about Hypothesis 1: Beach material is larger on the beach with a steeper profile? Use data from Fig. 2.3, Table 2.1 and Fig. 2.4 to support your decision. ........................................................................................................................................... ........................................................................................................................................... ........................................................................................................................................... ........................................................................................................................................... ........................................................................................................................................... ..................................................................................................................................... [3]
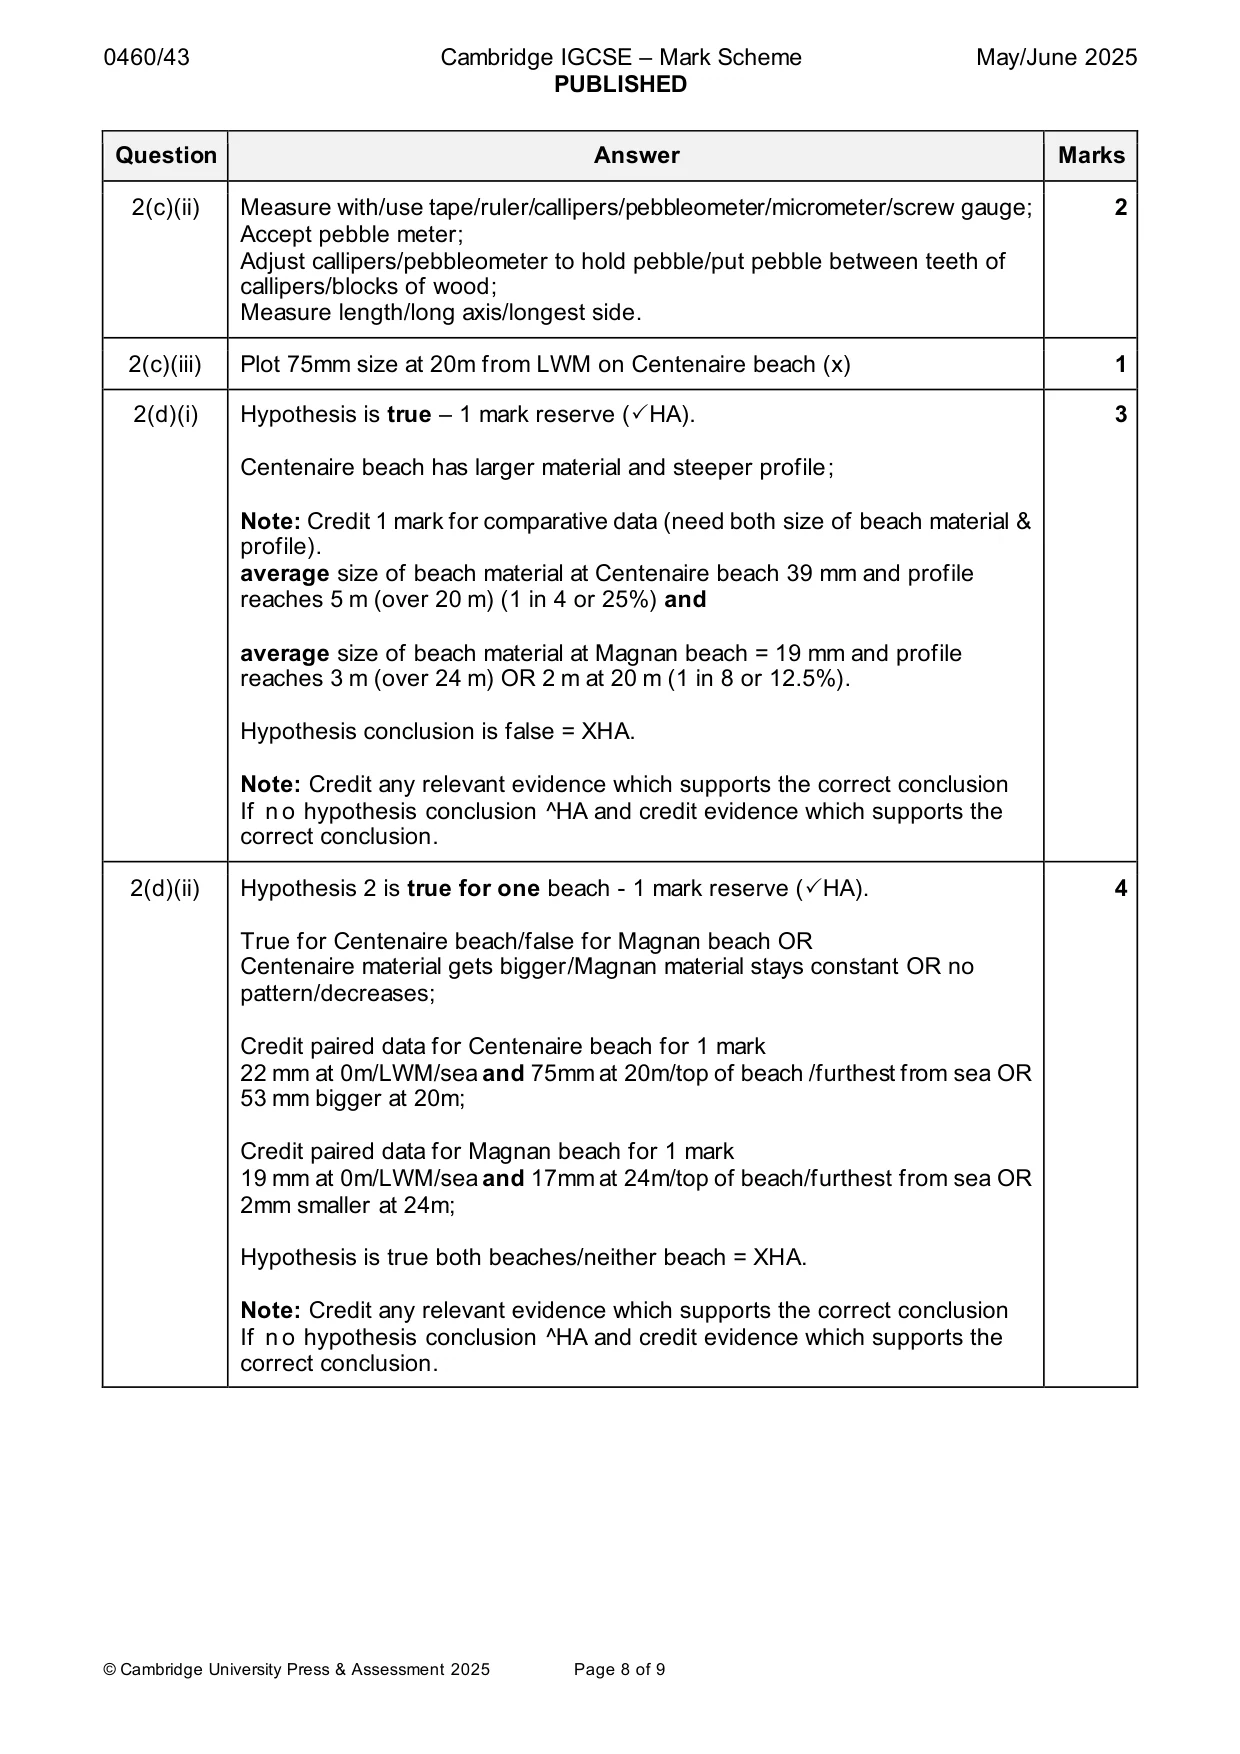
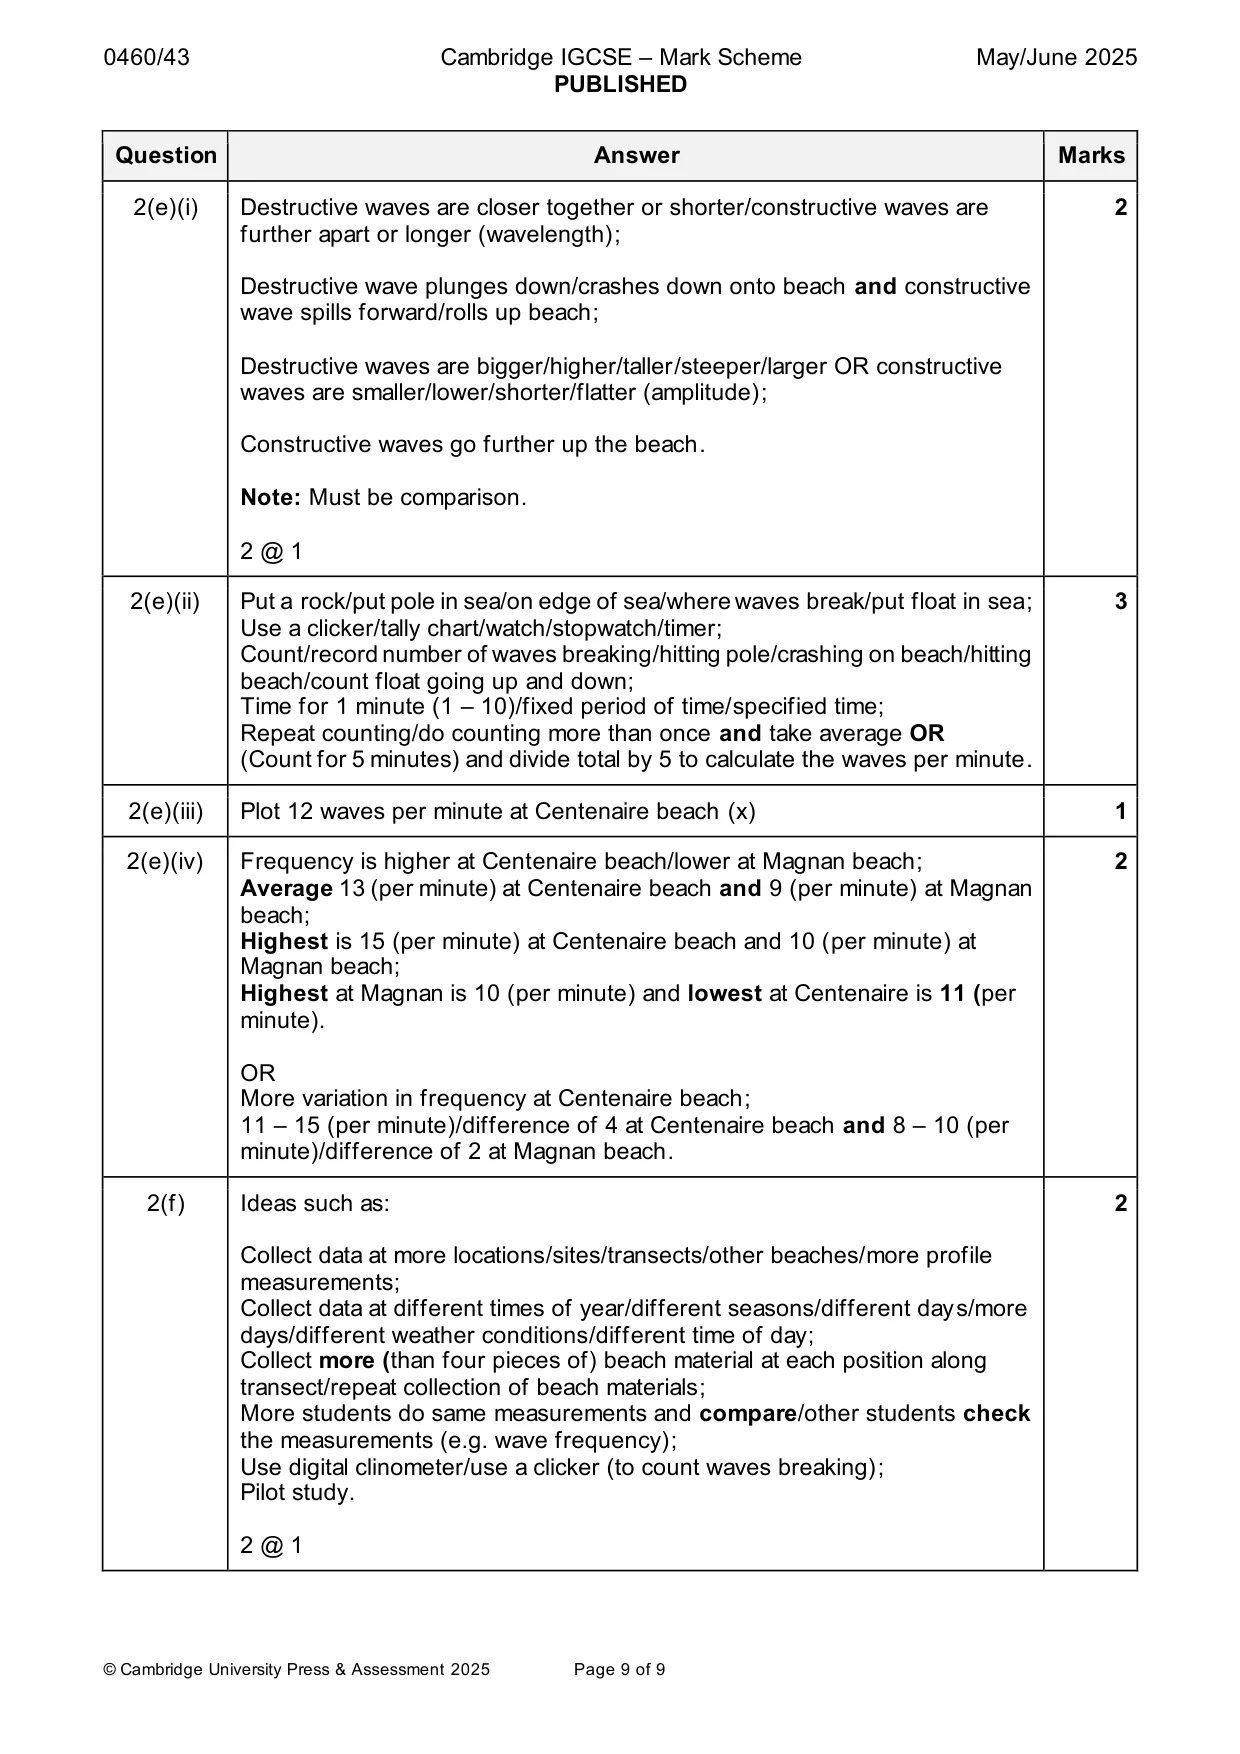
Mark scheme: 2(a) Keep away from the cliff/any loose rocks; 3 Do fieldwork at low tide; Avoid slippery rocks/litter/glass/creatures or e.g.; Work/stay in pairs/don’t wander off by oneself/don’t work alone; Don’t go into the sea/look out for big waves; Wear boots/shoes/suitable footwear; Wear gloves; 3 @ 1 2(b) Use (tape measure) measure from low water mark to back of beach/create a 4 transect; Place marker poles along transect line; OR Place marker poles along line from low water mark/the sea to back of beach; Put poles at each break of slope (NOT equal distances); Ensure poles are vertical/straight/upright; Poles rest on surface/equal depth into beach material; Measure the distance between each break of slope/(pair of) marker poles; Hold clinometer next to top/at agreed height on marker pole/eye level; Sight other marker pole at top/agreed height; Use a clinometer/measuring tool to measure angle/read angle (NOT gradient/ slope); Repeat along transect/up the beach/with next two ranging poles. 2(c)(i) Use (measuring) tape/metre rule/to measure every 2 metres/at 8m (up the 3 beach/from LWM); Put quadrat on ground or down/mark point with pole; Select/pick up 4 pieces of beach material (NOT collect); Select pieces at random/use random sampling/systematically/use systematic sampling/suitable description of how pieces are chosen. 2(c)(ii) Measure with/use tape/ruler/callipers/pebbleometer/micrometer/screw gauge; 2 Accept pebble meter; Adjust callipers/pebbleometer to hold pebble/put pebble between teeth of callipers/blocks of wood; Measure length/long axis/longest side. 2(c)(iii) Plot 75mm size at 20m from LWM on Centenaire beach (x) 1 2(d)(i) Hypothesis is true – 1 mark reserve (HA). 3 Centenaire beach has larger material and steeper profile; Note: Credit 1 mark for comparative data (need both size of beach material & profile). average size of beach material at Centenaire beach 39 mm and profile reaches 5 m (over 20 m) (1 in 4 or 25%) and average size of beach material at Magnan beach = 19 mm and profile reaches 3 m (over 24 m) OR 2 m at 20 m (1 in 8 or 12.5%). Hypothesis conclusion is false = XHA. Note: Credit any relevant evidence which supports the correct conclusion If n o hypothesis conclusion ^HA and credit evidence which supports the correct conclusion. 2(d)(ii) Hypothesis 2 is true for one beach - 1 mark reserve (HA). 4 True for Centenaire beach/false for Magnan beach OR Centenaire material gets bigger/Magnan material stays constant OR no pattern/decreases; Credit paired data for Centenaire beach for 1 mark 22 mm at 0m/LWM/sea and 75mm at 20m/top of beach /furthest from sea OR 53 mm bigger at 20m; Credit paired data for Magnan beach for 1 mark 19 mm at 0m/LWM/sea and 17mm at 24m/top of beach/furthest from sea OR 2mm smaller at 24m; Hypothesis is true both beaches/neither beach = XHA. Note: Credit any relevant evidence which supports the correct conclusion If n o hypothesis conclusion ^HA and credit evidence which supports the correct conclusion. 2(e)(i) Destructive waves are closer together or shorter/constructive waves are 2 further apart or longer (wavelength); Destructive wave plunges down/crashes down onto beach and constructive wave spills forward/rolls up beach; Destructive waves are bigger/higher/taller/steeper/larger OR constructive waves are smaller/lower/shorter/flatter (amplitude); Constructive waves go further up the beach. Note: Must be comparison. 2 @ 1 2(e)(ii) Put a rock/put pole in sea/on edge of sea/where waves break/put float in sea; 3 Use a clicker/tally chart/watch/stopwatch/timer; Count/record number of waves breaking/hitting pole/crashing on beach/hitting beach/count float going up and down; Time for 1 minute (1 – 10)/fixed period of time/specified time; Repeat counting/do counting more than once and take average OR (Count for 5 minutes) and divide total by 5 to calculate the waves per minute. 2(e)(iii) Plot 12 waves per minute at Centenaire beach (x) 1 2(e)(iv) Frequency is higher at Centenaire beach/lower at Magnan beach; 2 Average 13 (per minute) at Centenaire beach and 9 (per minute) at Magnan beach; Highest is 15 (per minute) at Centenaire beach and 10 (per minute) at Magnan beach; Highest at Magnan is 10 (per minute) and lowest at Centenaire is 11 (per minute). OR More variation in frequency at Centenaire beach; 11 – 15 (per minute)/difference of 4 at Centenaire beach and 8 – 10 (per minute)/difference of 2 at Magnan beach. 2(f) Ideas such as: 2 Collect data at more locations/sites/transects/other beaches/more profile measurements; Collect data at different times of year/different seasons/different days/more days/different weather conditions/different time of day; Collect more (than four pieces of) beach material at each position along transect/repeat collection of beach materials; More students do same measurements and compare/other students check the measurements (e.g. wave frequency); Use digital clinometer/use a clicker (to count waves breaking); Pilot study. 2 @ 1
What was in this paper
The subtopics covered by these 2 questions, and how many questions each got. Open one in a new tab to see every Cambridge question on it.
What you needed in this session
Cambridge’s own grade thresholds for 2025 May/June, Paper 4 · Variant 3. A higher threshold means an easier paper — the bar moves with how the cohort did.