Cambridge IGCSE Geography 0460 — 2023 May/June Paper 4 · Variant 3
0460/43/M/J/23 · 2 questions · 60 marks · ≈68 min
The question paper and its mark scheme, free to read here and free to download. This is Cambridge’s own paper, exactly as it was sat.
Question paper20 pages






Mark scheme7 pages
Answers below. Sit the paper first if you are practising.

Questions as text
Q1 · Students carried out fieldwork at Sheringham in eastern England
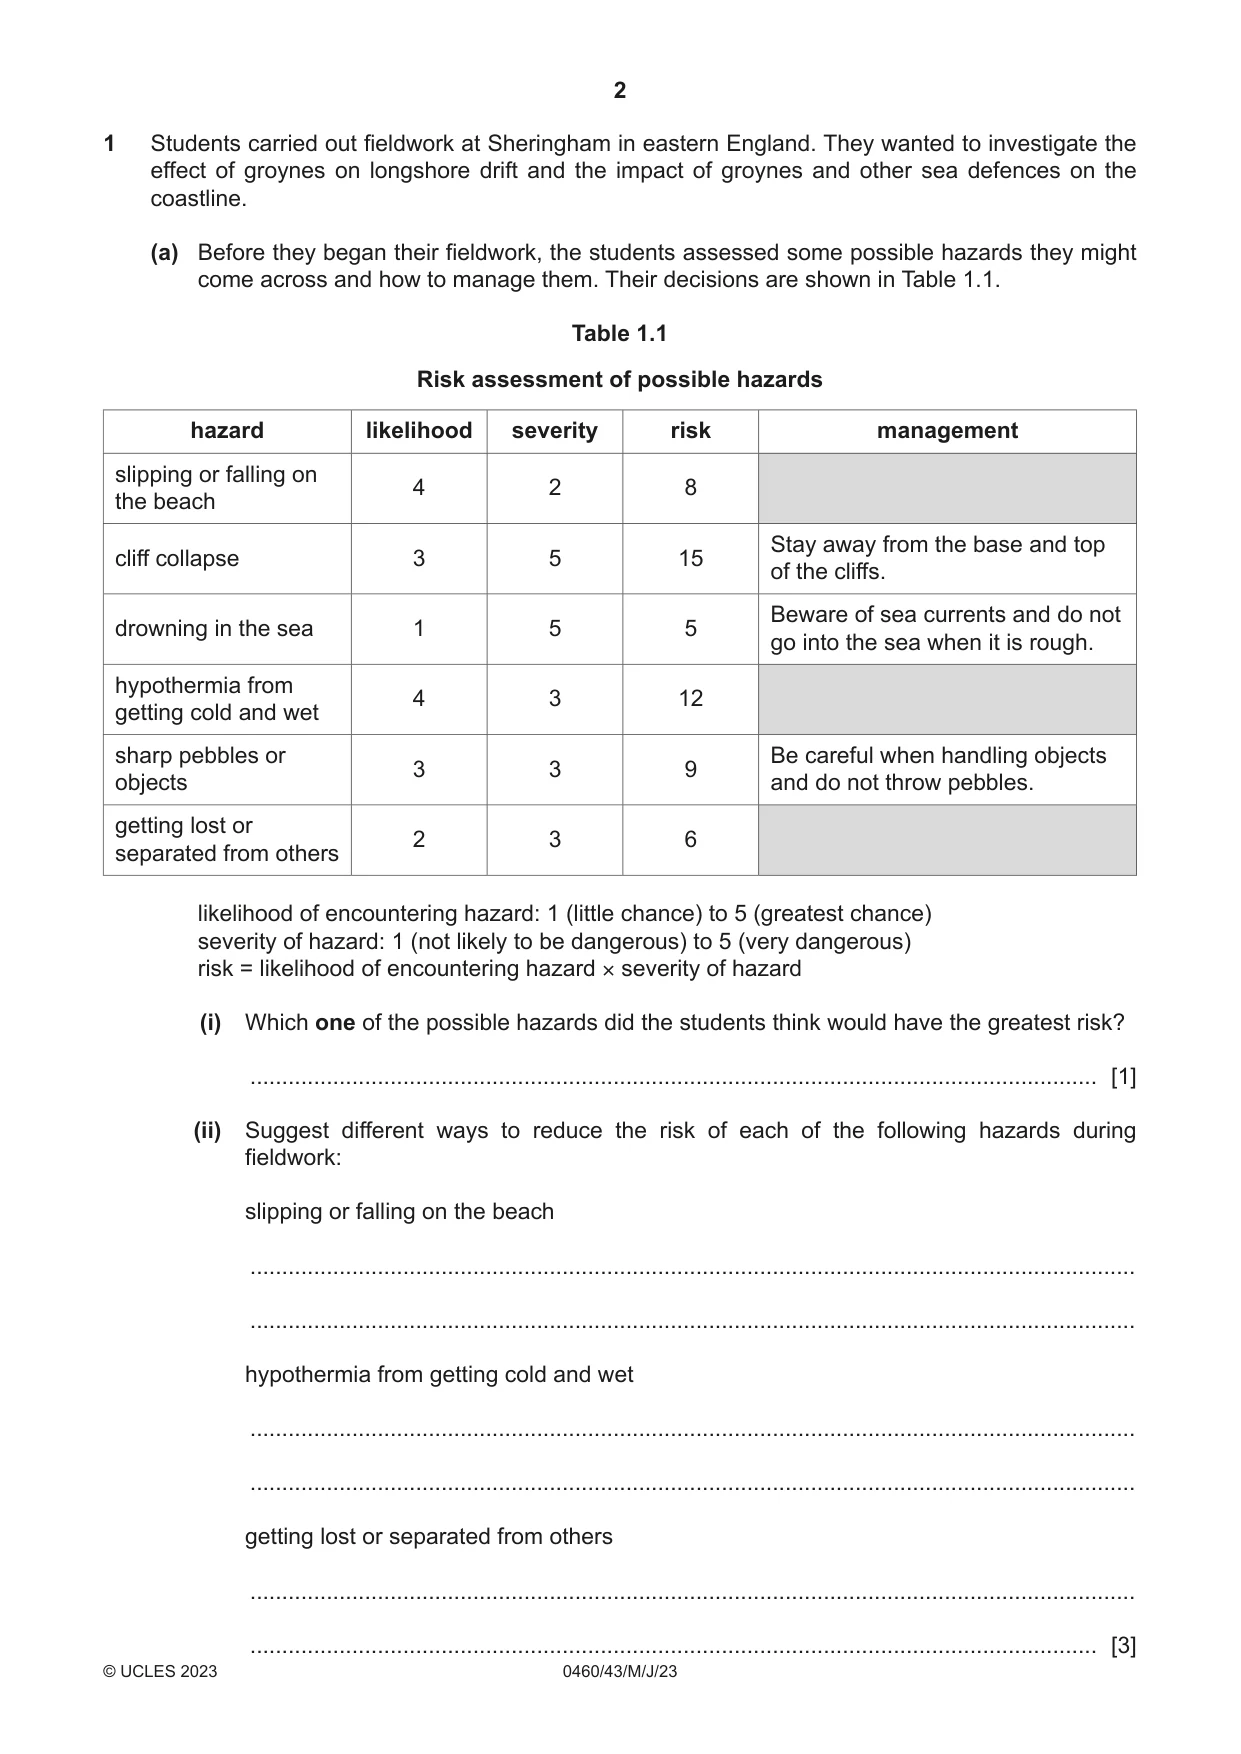
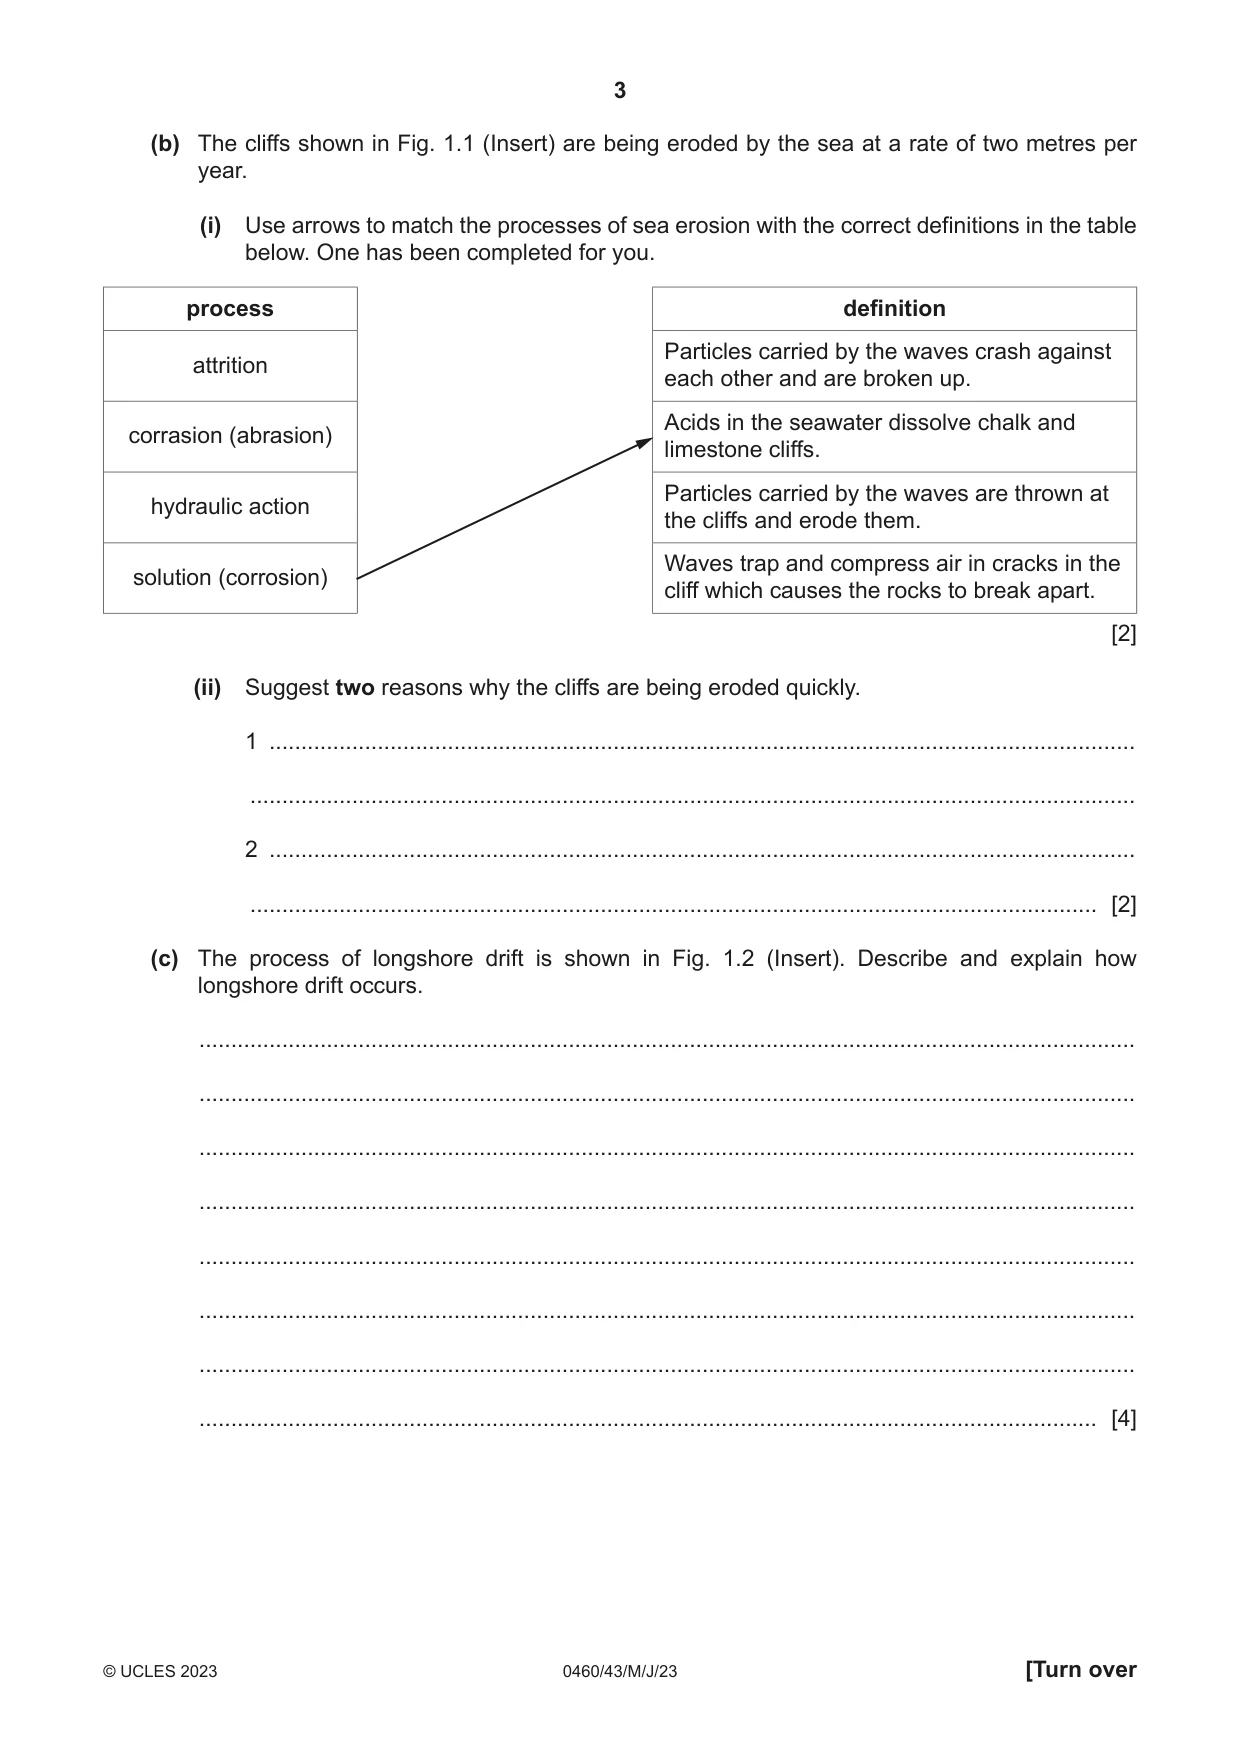
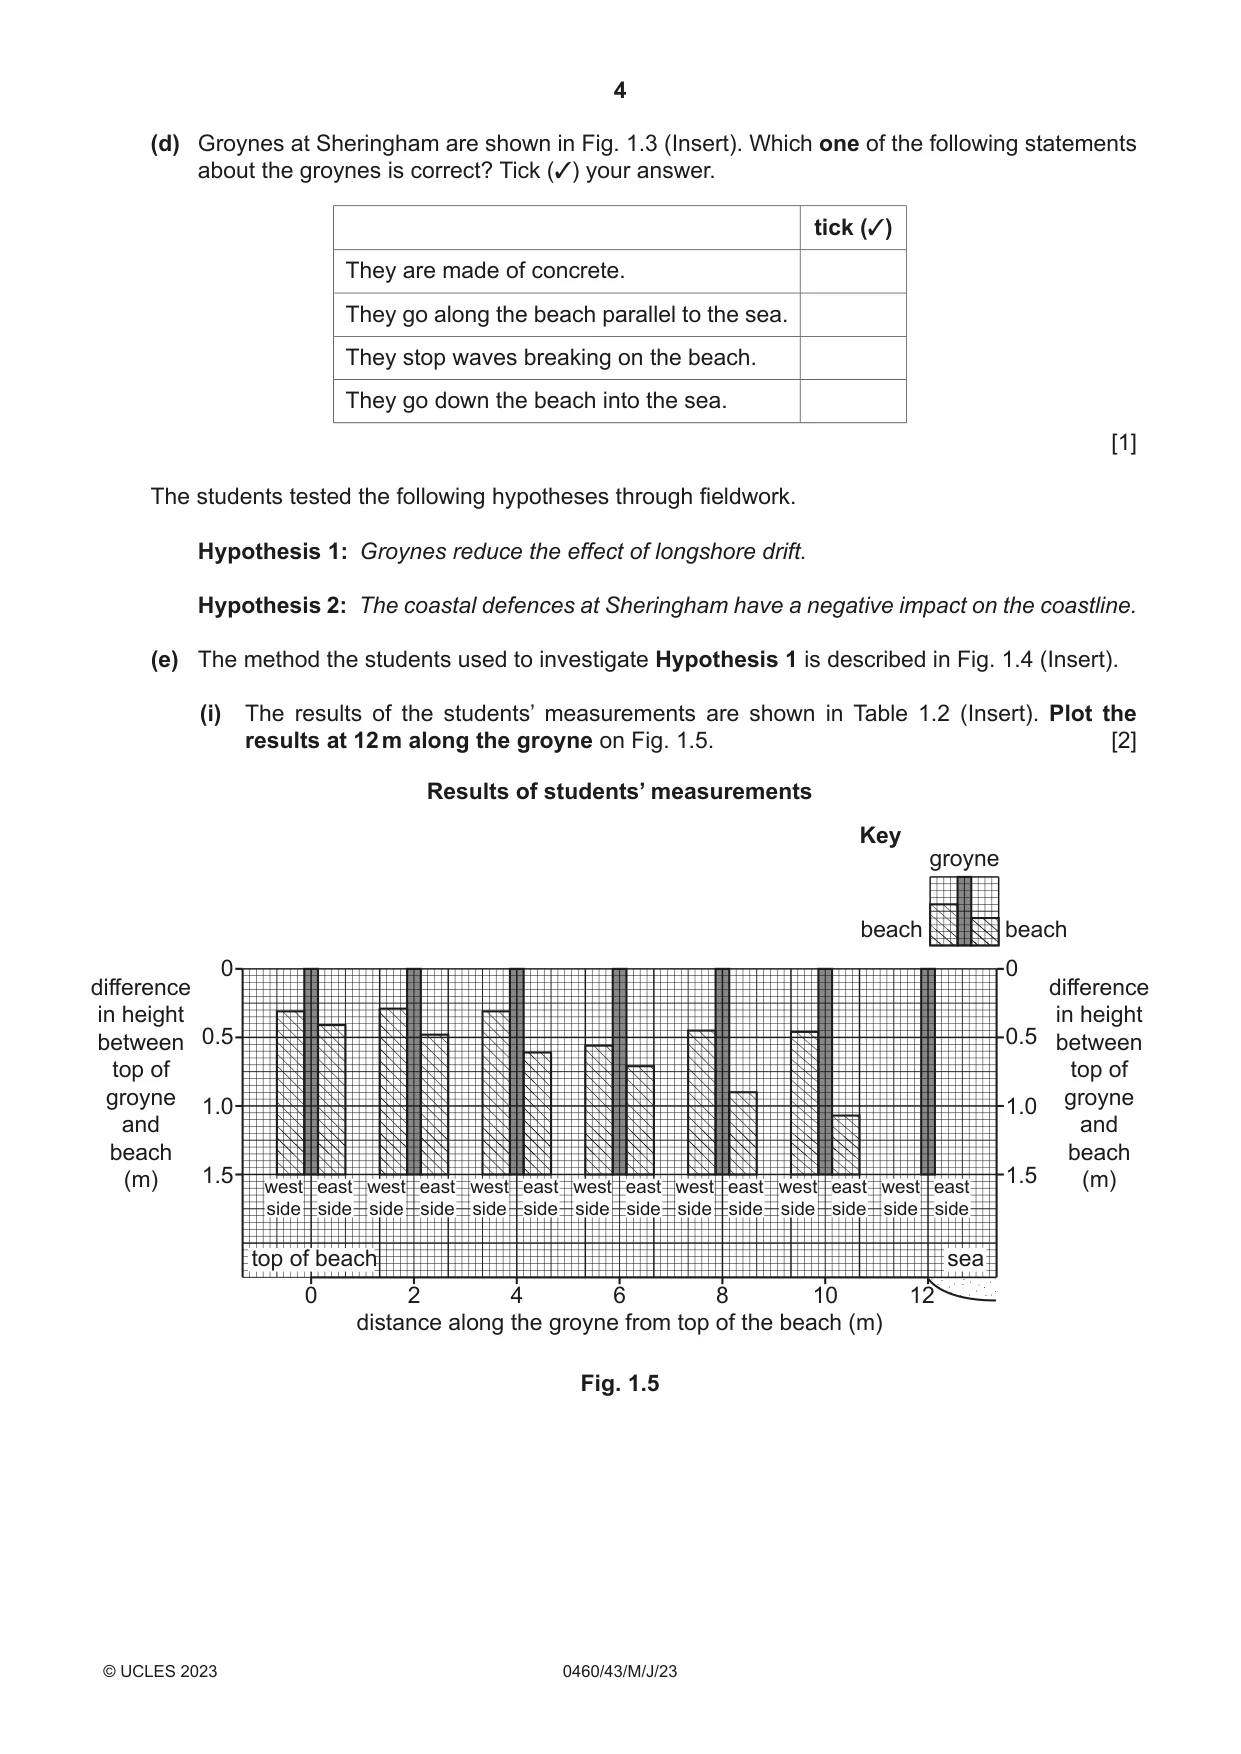
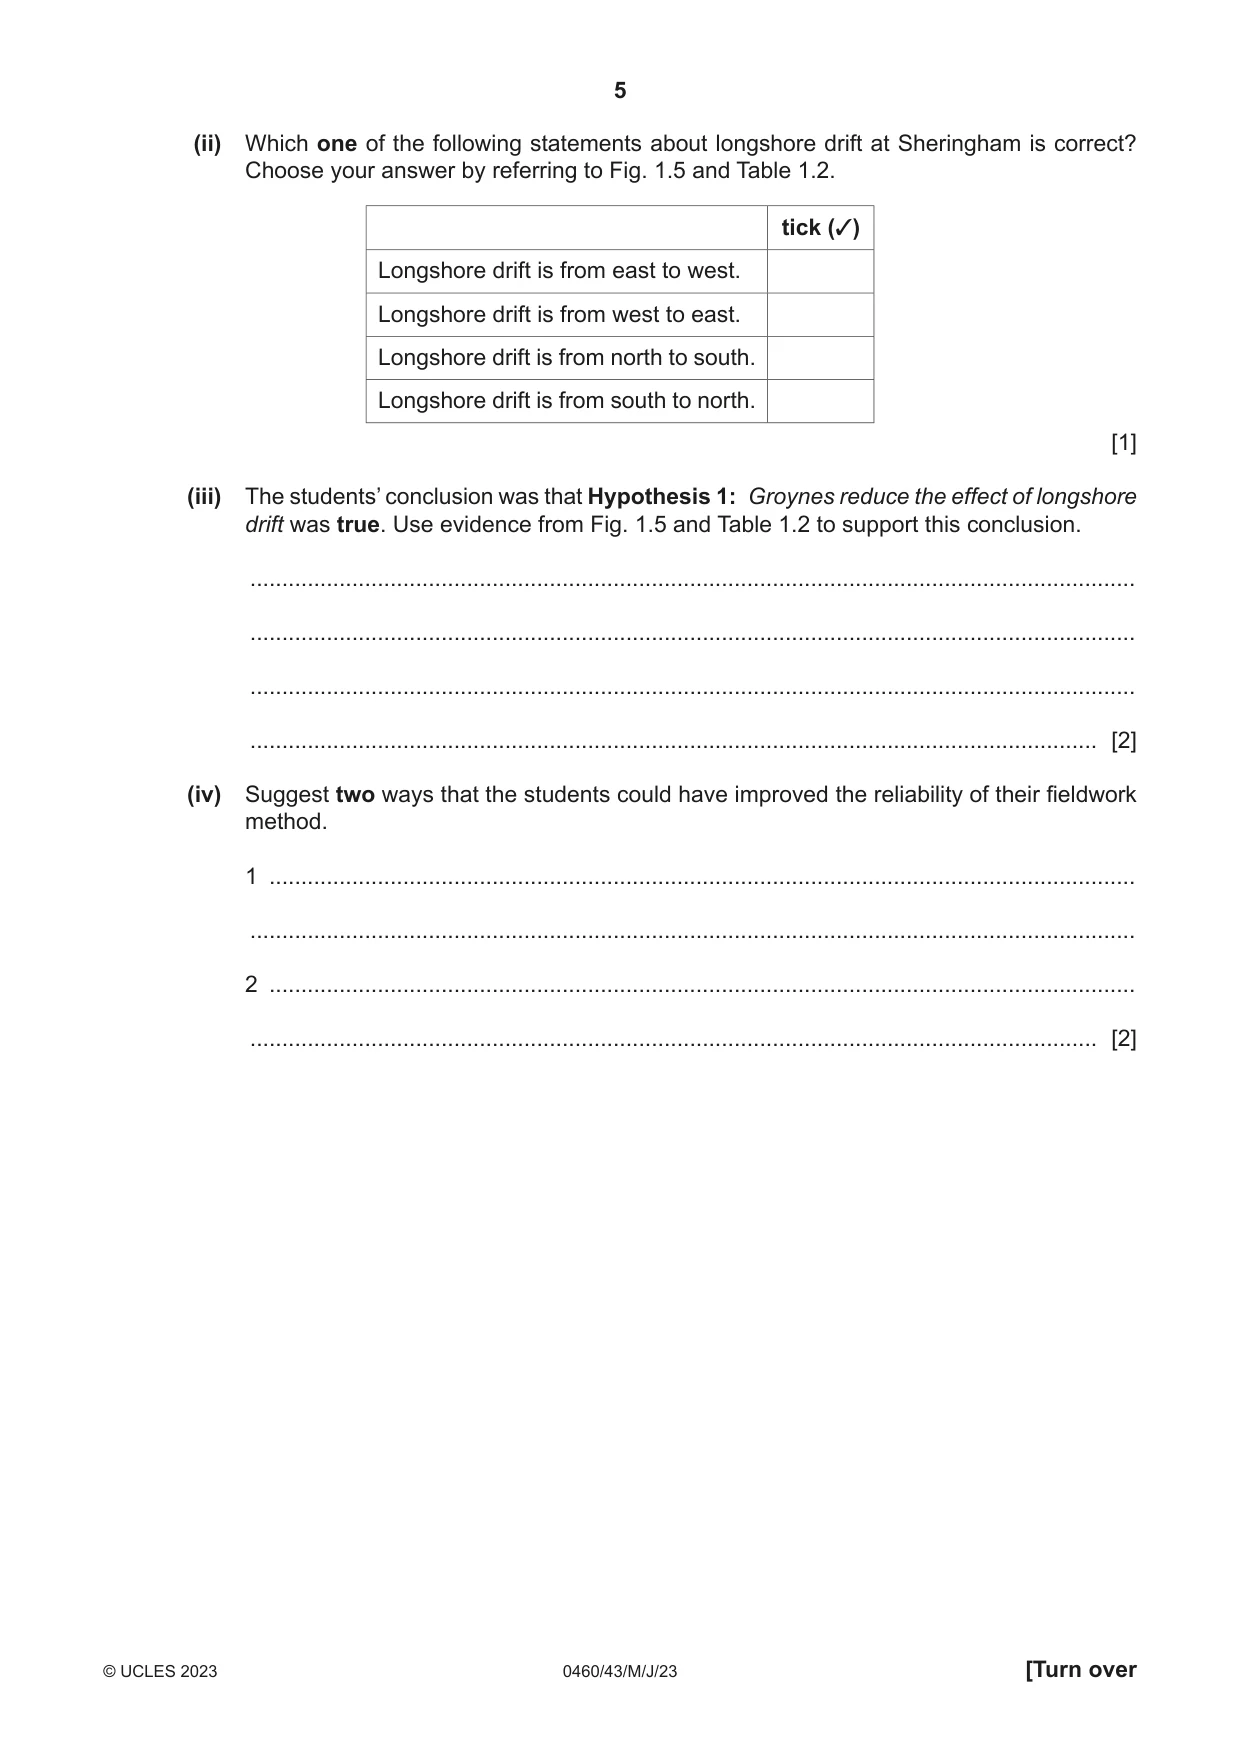
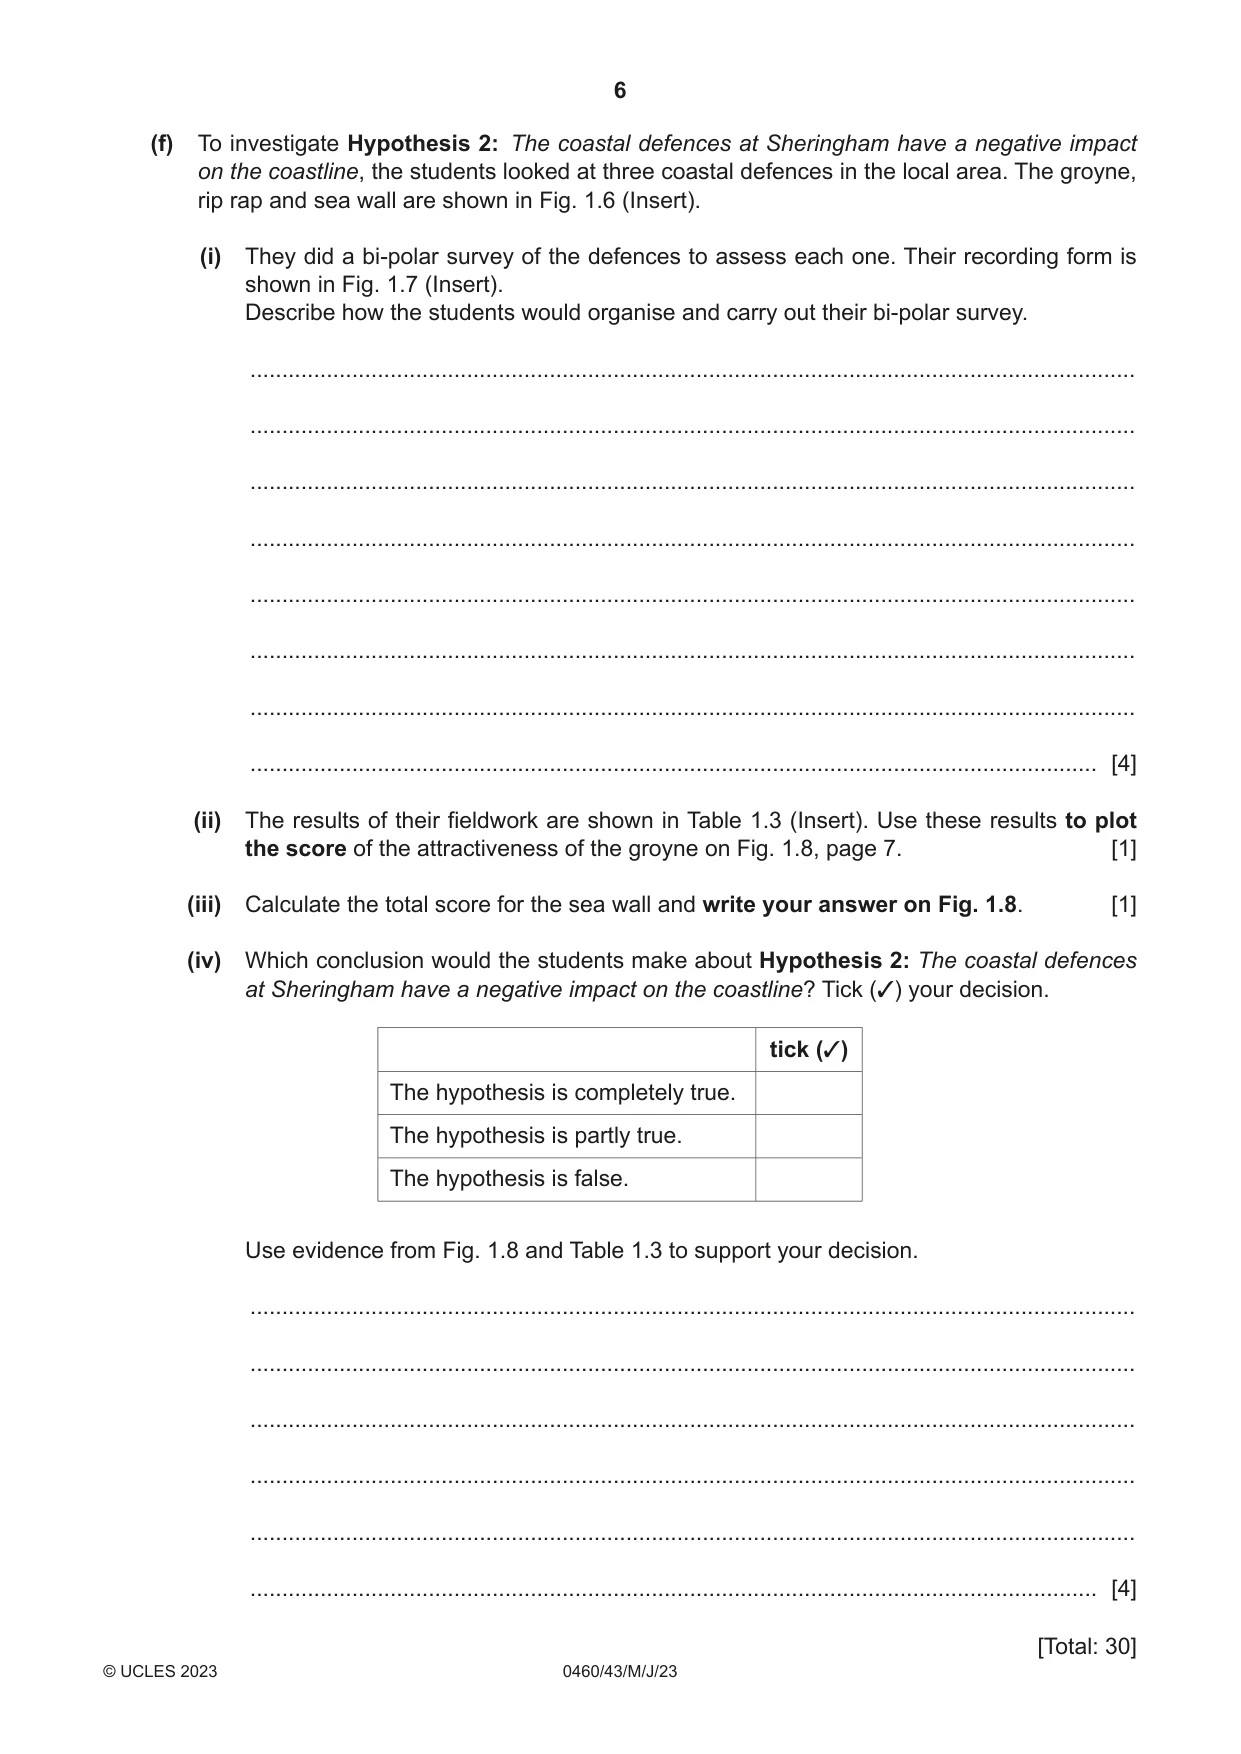
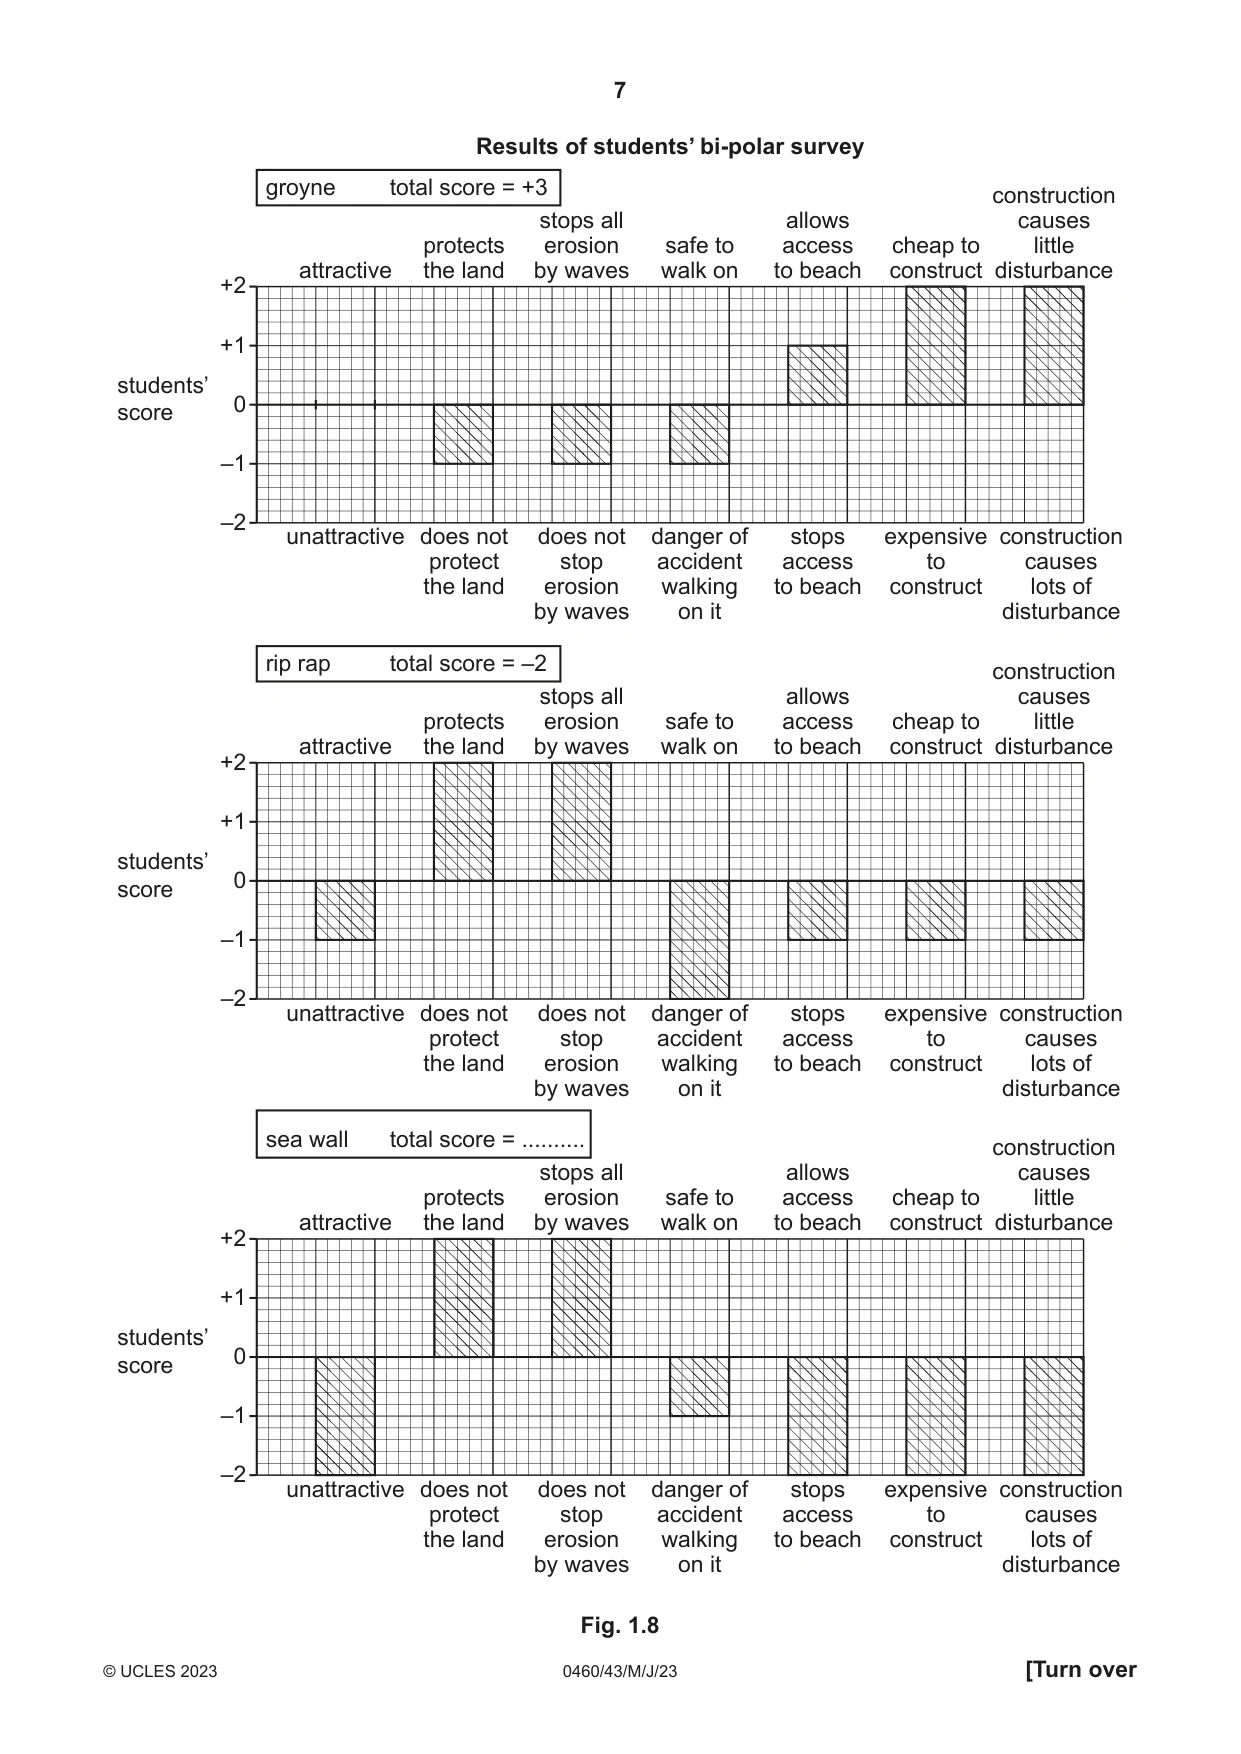
1 Students carried out fieldwork at Sheringham in eastern England. They wanted to investigate the effect of groynes on longshore drift and the impact of groynes and other sea defences on the coastline. (a) Before they began their fieldwork, the students assessed some possible hazards they might come across and how to manage them. Their decisions are shown in Table 1.1. Table 1.1 Risk assessment of possible hazards hazard likelihood severity risk management slipping or falling on 4 2 8 the beach Stay away from the base and top cliff collapse 3 5 15 of the cliffs. Beware of sea currents and do not drowning in the sea 1 5 5 go into the sea when it is rough. hypothermia from 4 3 12 getting cold and wet sharp pebbles or Be careful when handling objects 3 3 9 objects and do not throw pebbles. getting lost or 2 3 6 separated from others likelihood of encountering hazard: 1 (little chance) to 5 (greatest chance) severity of hazard: 1 (not likely to be dangerous) to 5 (very dangerous) risk = likelihood of encountering hazard × severity of hazard (i) Which one of the possible hazards did the students think would have the greatest risk? ..................................................................................................................................... [1] (ii) Suggest different ways to reduce the risk of each of the following hazards during fieldwork: slipping or falling on the beach ........................................................................................................................................... ........................................................................................................................................... hypothermia from getting cold and wet ........................................................................................................................................... ........................................................................................................................................... getting lost or separated from others ........................................................................................................................................... ..................................................................................................................................... [3] (b) The cliffs shown in Fig. 1.1 (Insert) are being eroded by the sea at a rate of two metres per year. (i) Use arrows to match the processes of sea erosion with the correct definitions in the table below. One has been completed for you. process definition Particles carried by the waves crash against attrition each other and are broken up. Acids in the seawater dissolve chalk andcorrasion (abrasion) limestone cliffs. Particles carried by the waves are thrown at hydraulic action the cliffs and erode them. Waves trap and compress air in cracks in thesolution (corrosion) cliff which causes the rocks to break apart. [2] (ii) Suggest two reasons why the cliffs are being eroded quickly. 1 ........................................................................................................................................ ........................................................................................................................................... 2 ........................................................................................................................................ ..................................................................................................................................... [2] (c) The process of longshore drift is shown in Fig. 1.2 (Insert). Describe and explain how longshore drift occurs. ................................................................................................................................................... ................................................................................................................................................... ................................................................................................................................................... ................................................................................................................................................... ................................................................................................................................................... ................................................................................................................................................... ................................................................................................................................................... ............................................................................................................................................. [4] (d) Groynes at Sheringham are shown in Fig. 1.3 (Insert). Which one of the following statements about the groynes is correct? Tick (✓) your answer. tick (✓) They are made of concrete. They go along the beach parallel to the sea. They stop waves breaking on the beach. They go down the beach into the sea. [1] The students tested the following hypotheses through fieldwork. Hypothesis 1: Groynes reduce the effect of longshore drift. Hypothesis 2: The coastal defences at Sheringham have a negative impact on the coastline. (e) The method the students used to investigate Hypothesis 1 is described in Fig. 1.4 (Insert). (i) The results of the students’ measurements are shown in Table 1.2 (Insert). Plot the results at 12 m along the groyne on Fig. 1.5. [2] Results of students’ measurements Key groyne beach beach 0 0 difference difference in height in height between 0.5 0.5 between top of top of groyne groyne 1.0 1.0 and and beach beach (m) 1.5 west east west east west east west east west east west east west east 1.5 (m) side side side side side side side side side side side side side side top of beach sea 0 2 4 6 8 10 12 distance along the groyne from top of the beach (m) Fig. 1.5 (ii) Which one of the following statements about longshore drift at Sheringham is correct? Choose your answer by referring to Fig. 1.5 and Table 1.2. tick (✓) Longshore drift is from east to west. Longshore drift is from west to east. Longshore drift is from north to south. Longshore drift is from south to north. [1] (iii) The students’ conclusion was that Hypothesis 1: Groynes reduce the effect of longshore drift was true. Use evidence from Fig. 1.5 and Table 1.2 to support this conclusion. ........................................................................................................................................... ........................................................................................................................................... ........................................................................................................................................... ..................................................................................................................................... [2] (iv) Suggest two ways that the students could have improved the reliability of their fieldwork method. 1 ........................................................................................................................................ ........................................................................................................................................... 2 ........................................................................................................................................ ..................................................................................................................................... [2] (f) To investigate Hypothesis 2: The coastal defences at Sheringham have a negative impact on the coastline, the students looked at three coastal defences in the local area. The groyne, rip rap and sea wall are shown in Fig. 1.6 (Insert). (i) They did a bi‑polar survey of the defences to assess each one. Their recording form is shown in Fig. 1.7 (Insert). Describe how the students would organise and carry out their bi‑polar survey. ........................................................................................................................................... ........................................................................................................................................... ........................................................................................................................................... ........................................................................................................................................... ........................................................................................................................................... ........................................................................................................................................... ........................................................................................................................................... ..................................................................................................................................... [4] (ii) The results of their fieldwork are shown in Table 1.3 (Insert). Use these results to plot the score of the attractiveness of the groyne on Fig. 1.8, page 7. [1] (iii) Calculate the total score for the sea wall and write your answer on Fig. 1.8. [1] (iv) Which conclusion would the students make about Hypothesis 2: The coastal defences at Sheringham have a negative impact on the coastline? Tick (✓) your decision. tick (✓) The hypothesis is completely true. The hypothesis is partly true. The hypothesis is false. Use evidence from Fig. 1.8 and Table 1.3 to support your decision. ........................................................................................................................................... ........................................................................................................................................... ........................................................................................................................................... ........................................................................................................................................... ........................................................................................................................................... ..................................................................................................................................... [4] [Total: 30] Results of students’ bi-polar survey groyne total score = +3 construction stops all allows causes protects erosion safe to access cheap to little attractive the land by waves walk on to beach construct disturbance +2 +1 students’ 0score –1 –2 unattractive does not does not danger of stops expensive construction protect stop accident access to causes the land erosion walking to beach construct lots of by waves on it disturbance rip rap total score = –2 construction stops all allows causes protects erosion safe to access cheap to little attractive the land by waves walk on to beach construct disturbance +2 +1 students’ 0score –1 –2 unattractive does not does not danger of stops expensive construction protect stop accident access to causes the land erosion walking to beach construct lots of by waves on it disturbance sea wall total score = .......... construction stops all allows causes protects erosion safe to access cheap to little attractive the land by waves walk on to beach construct disturbance +2 +1 students’ 0score –1 –2 unattractive does not does not danger of stops expensive construction protect stop accident access to causes the land erosion walking to beach construct lots of by waves on it disturbance Fig. 1.8
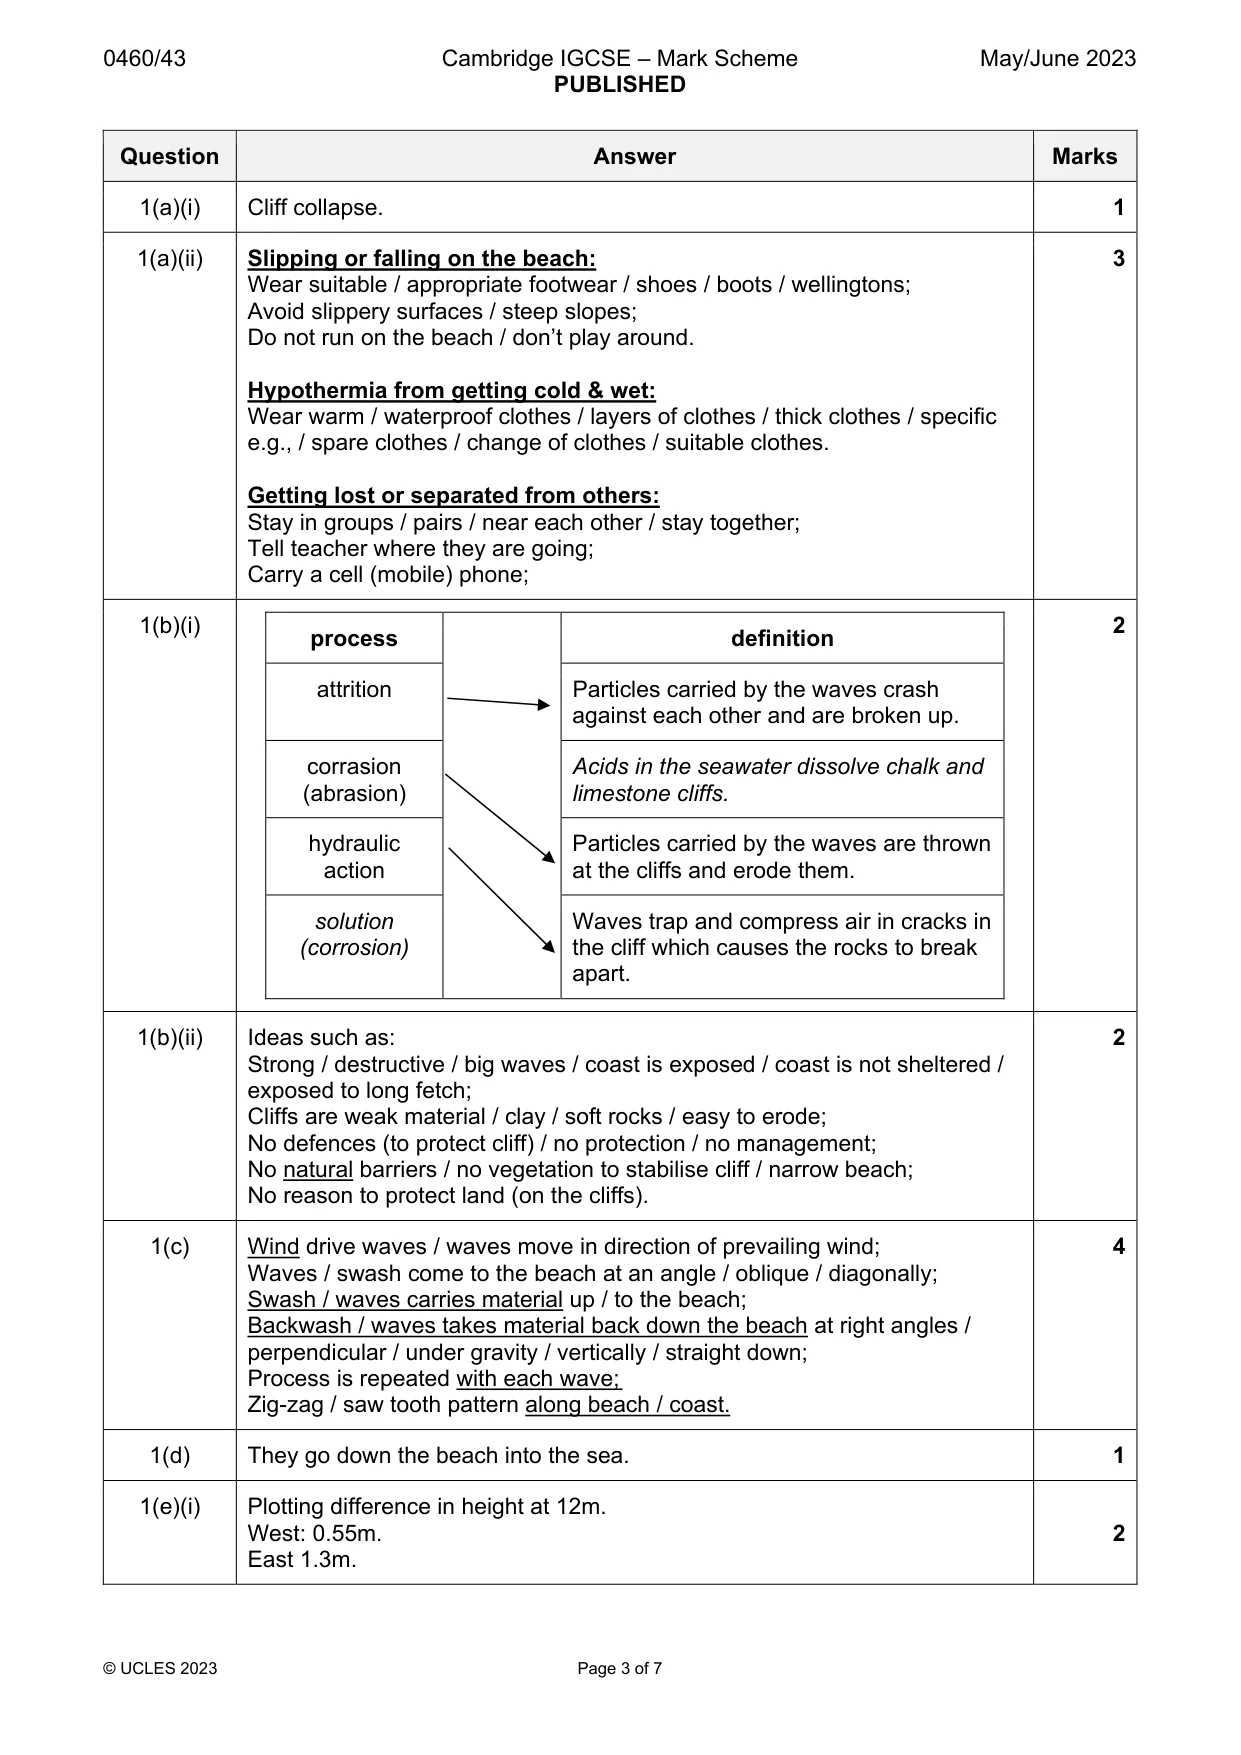
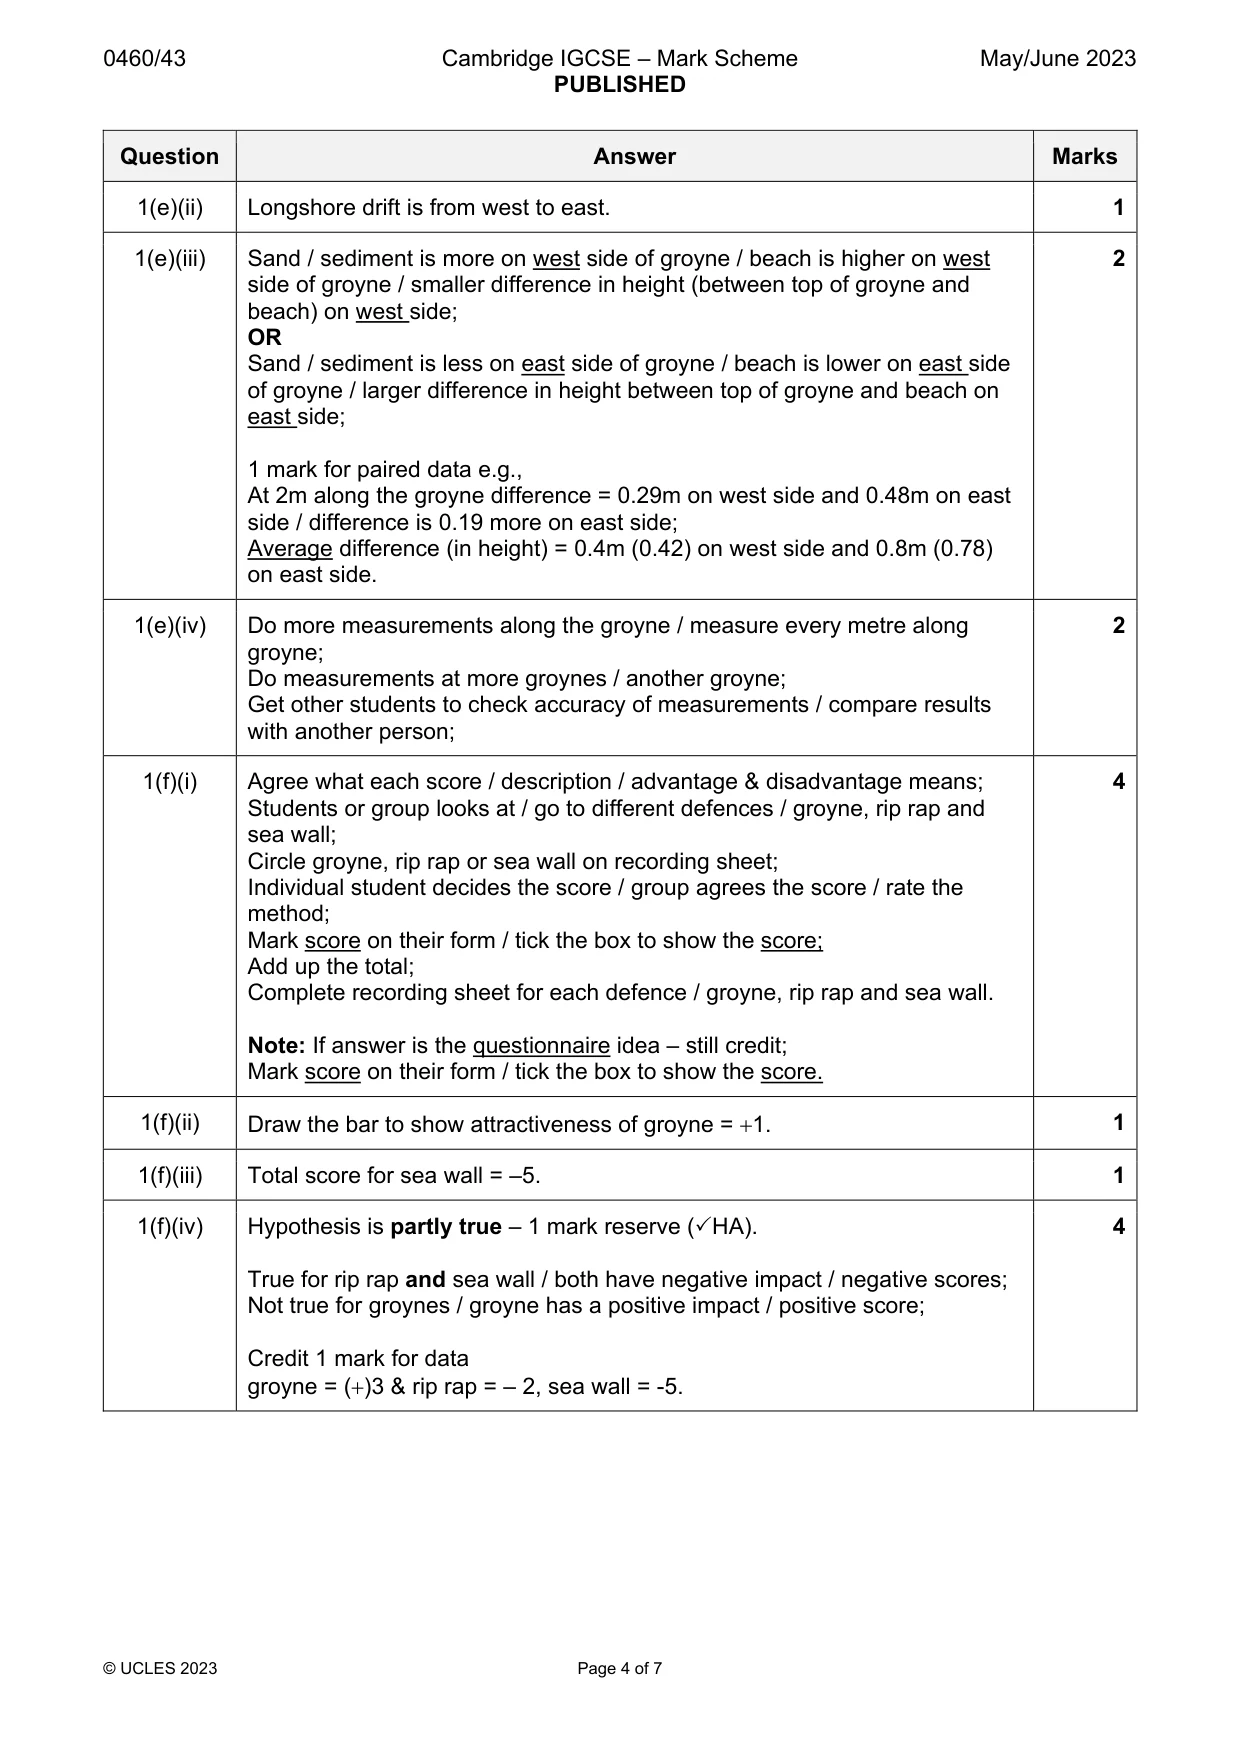
Mark scheme: Question Answer Marks 1(a)(i) Cliff collapse. 1 1(a)(ii) Slipping or falling on the beach: 3 Wear suitable / appropriate footwear / shoes / boots / wellingtons; Avoid slippery surfaces / steep slopes; Do not run on the beach / don’t play around. Hypothermia from getting cold & wet: Wear warm / waterproof clothes / layers of clothes / thick clothes / specific e.g., / spare clothes / change of clothes / suitable clothes. Getting lost or separated from others: Stay in groups / pairs / near each other / stay together; Tell teacher where they are going; Carry a cell (mobile) phone; 1(b)(i) 2 process definition attrition Particles carried by the waves crash against each other and are broken up. corrasion Acids in the seawater dissolve chalk and (abrasion) limestone cliffs. hydraulic Particles carried by the waves are thrown action at the cliffs and erode them. solution Waves trap and compress air in cracks in (corrosion) the cliff which causes the rocks to break apart. 1(b)(ii) Ideas such as: 2 Strong / destructive / big waves / coast is exposed / coast is not sheltered / exposed to long fetch; Cliffs are weak material / clay / soft rocks / easy to erode; No defences (to protect cliff) / no protection / no management; No natural barriers / no vegetation to stabilise cliff / narrow beach; No reason to protect land (on the cliffs). 1(c) Wind drive waves / waves move in direction of prevailing wind; 4 Waves / swash come to the beach at an angle / oblique / diagonally; Swash / waves carries material up / to the beach; Backwash / waves takes material back down the beach at right angles / perpendicular / under gravity / vertically / straight down; Process is repeated with each wave; Zig-zag / saw tooth pattern along beach / coast. 1(d) They go down the beach into the sea. 1 1(e)(i) Plotting difference in height at 12m. West: 0.55m. 2 East 1.3m. 1(e)(ii) Longshore drift is from west to east. 1 1(e)(iii) Sand / sediment is more on west side of groyne / beach is higher on west 2 side of groyne / smaller difference in height (between top of groyne and beach) on west side; OR Sand / sediment is less on east side of groyne / beach is lower on east side of groyne / larger difference in height between top of groyne and beach on east side; 1 mark for paired data e.g., At 2m along the groyne difference = 0.29m on west side and 0.48m on east side / difference is 0.19 more on east side; Average difference (in height) = 0.4m (0.42) on west side and 0.8m (0.78) on east side. 1(e)(iv) Do more measurements along the groyne / measure every metre along 2 groyne; Do measurements at more groynes / another groyne; Get other students to check accuracy of measurements / compare results with another person; 1(f)(i) Agree what each score / description / advantage & disadvantage means; 4 Students or group looks at / go to different defences / groyne, rip rap and sea wall; Circle groyne, rip rap or sea wall on recording sheet; Individual student decides the score / group agrees the score / rate the method; Mark score on their form / tick the box to show the score; Add up the total; Complete recording sheet for each defence / groyne, rip rap and sea wall. Note: If answer is the questionnaire idea – still credit; Mark score on their form / tick the box to show the score. 1(f)(ii) Draw the bar to show attractiveness of groyne = 1. 1 1(f)(iii) Total score for sea wall = –5. 1 1(f)(iv) Hypothesis is partly true – 1 mark reserve (HA). 4 True for rip rap and sea wall / both have negative impact / negative scores; Not true for groynes / groyne has a positive impact / positive score; Credit 1 mark for data groyne = ()3 & rip rap = – 2, sea wall = -5.
Q2 · Students in a class in Rio de Janeiro, Brazil did fieldwork to compare two shopping…
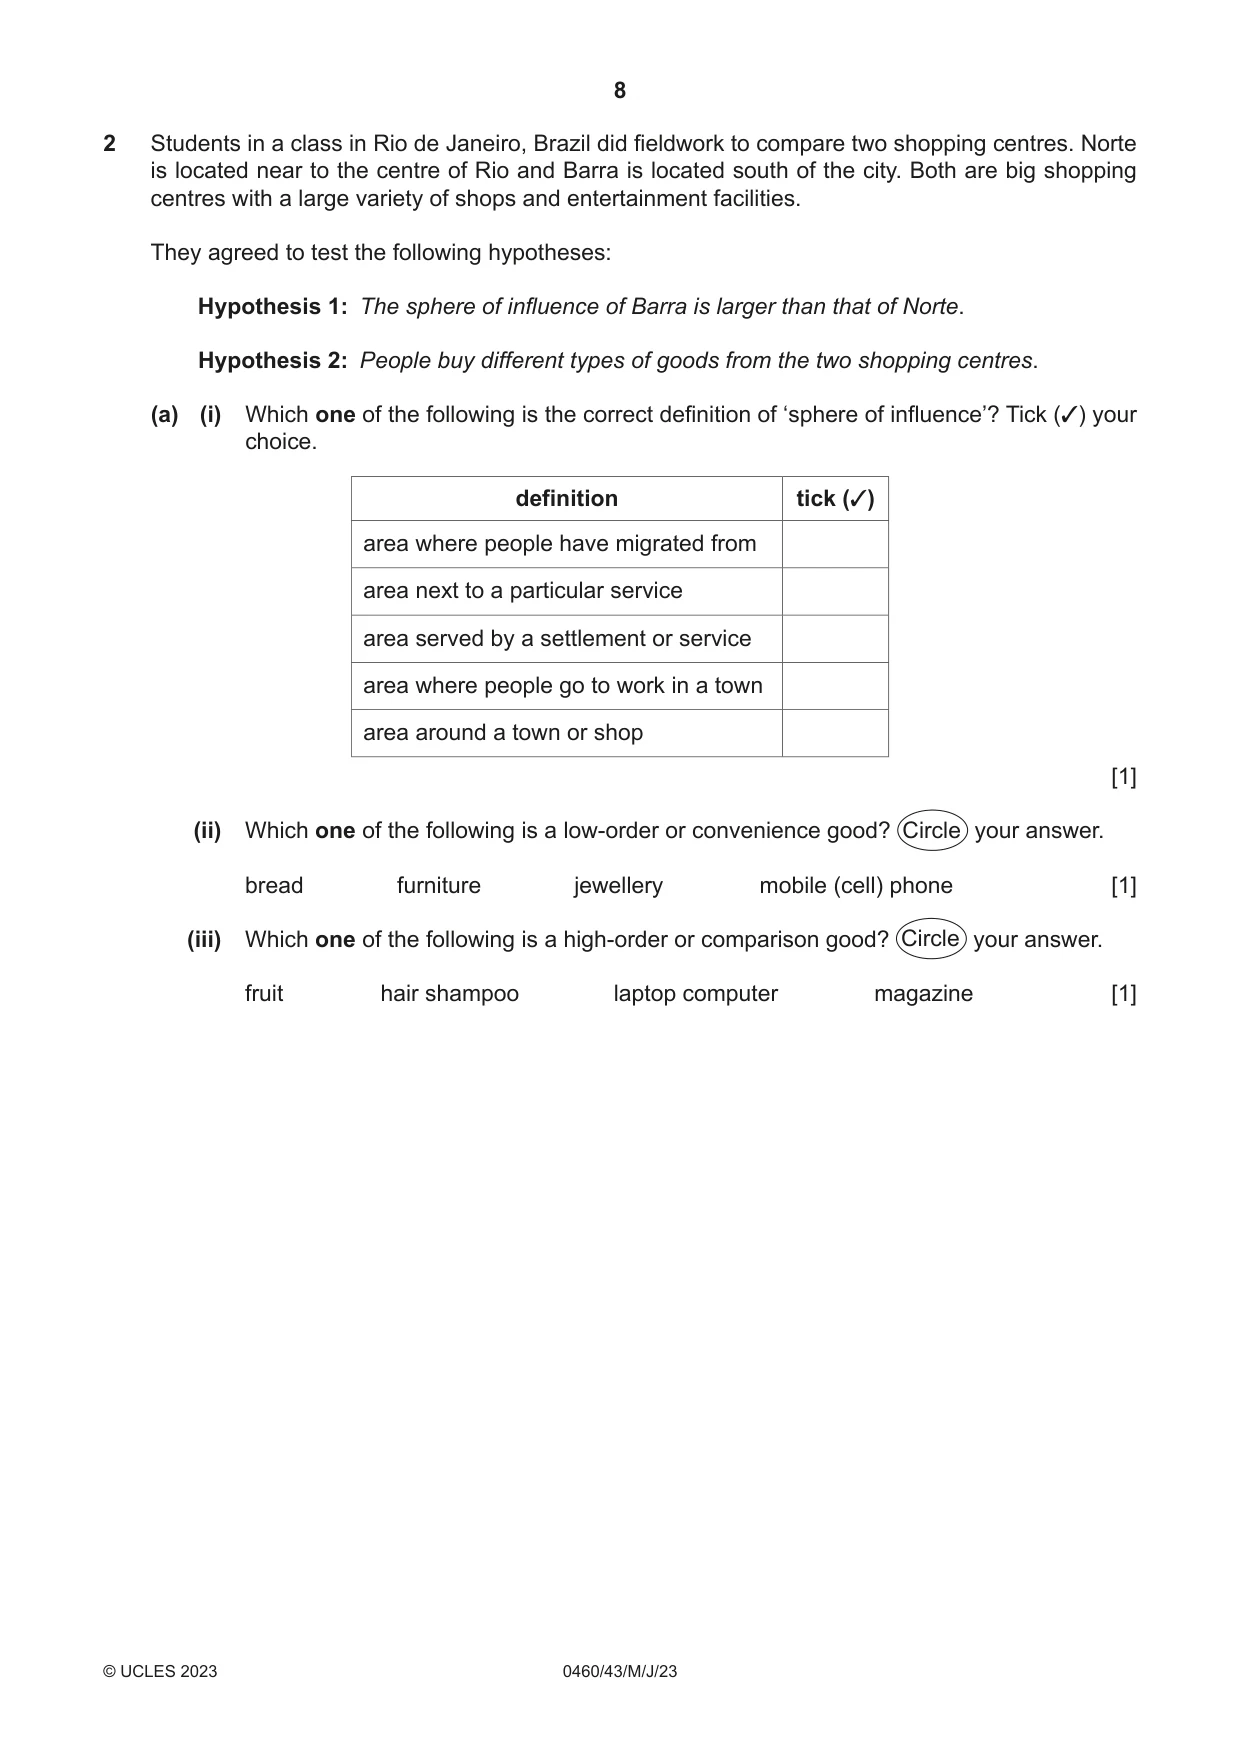
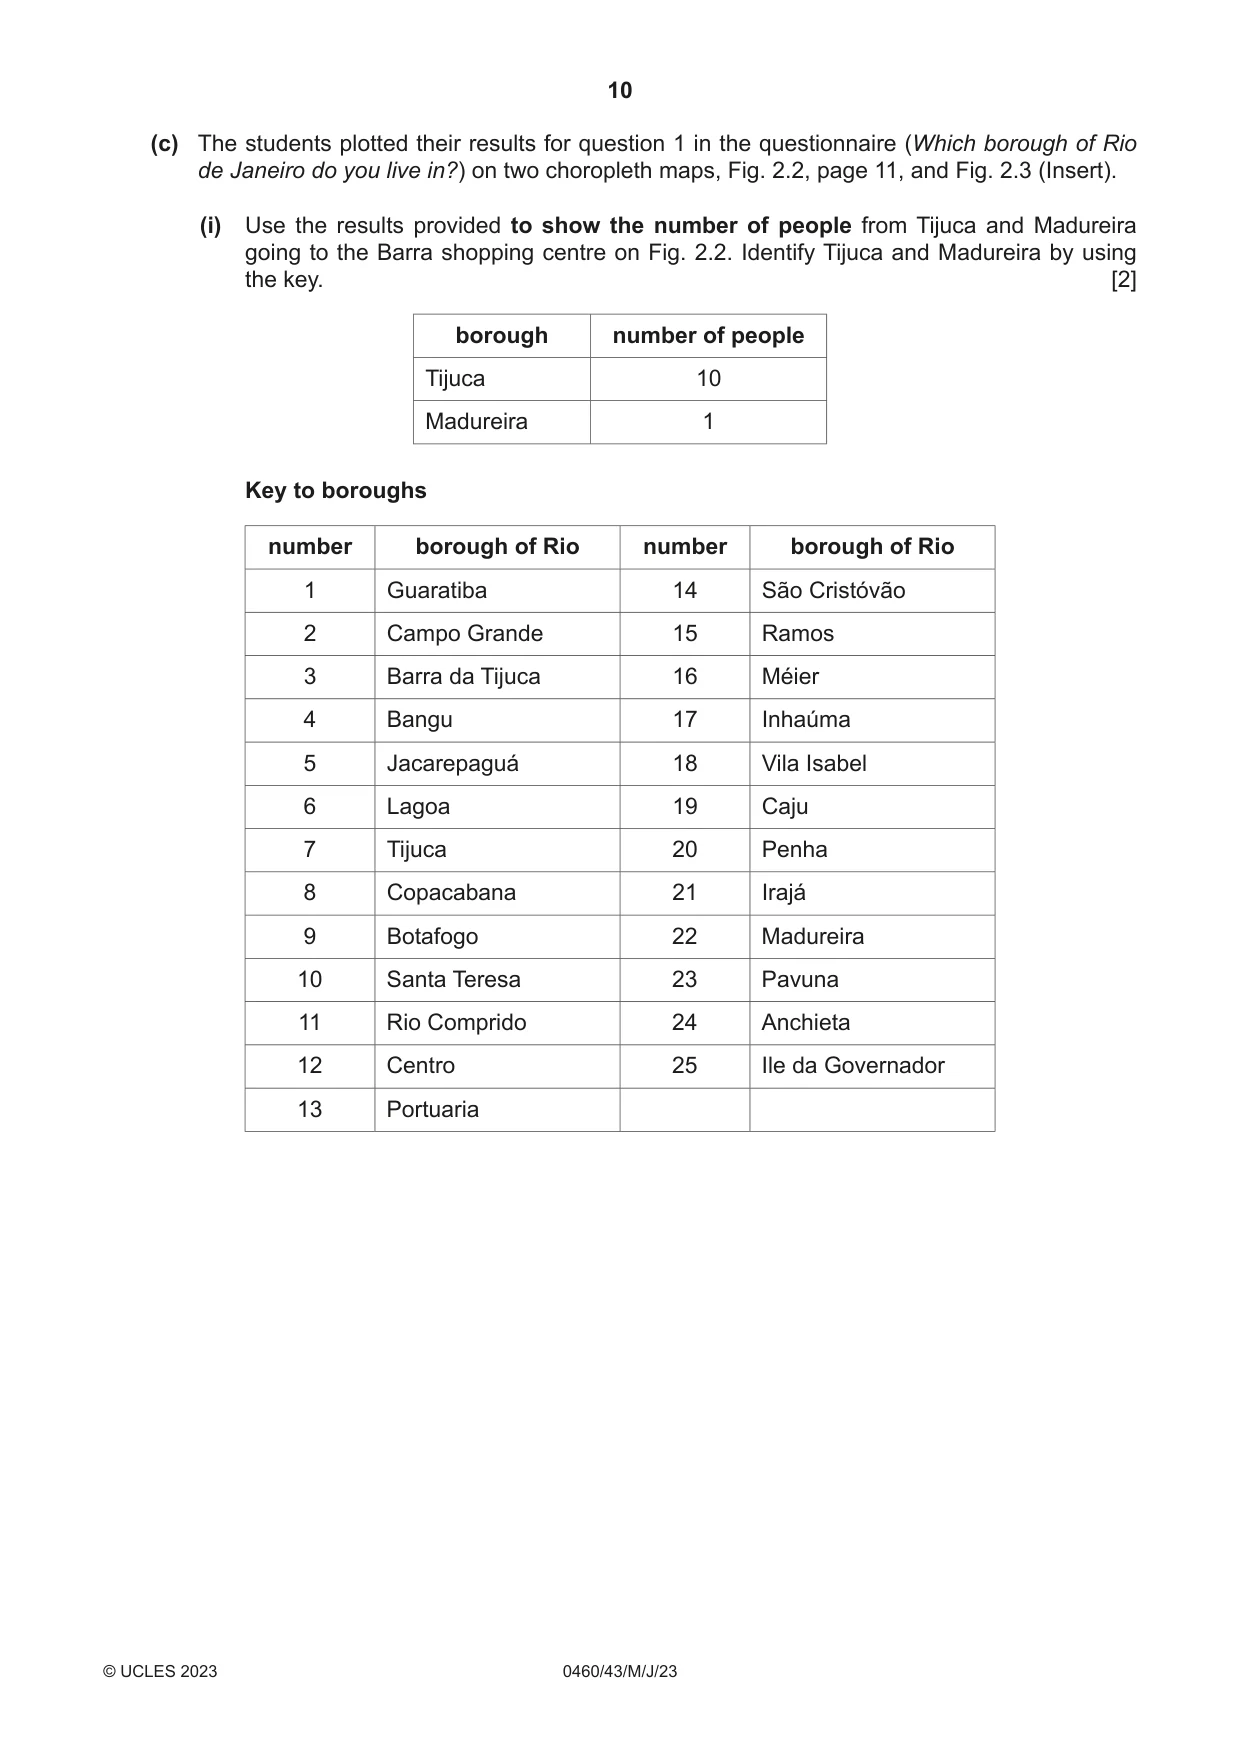
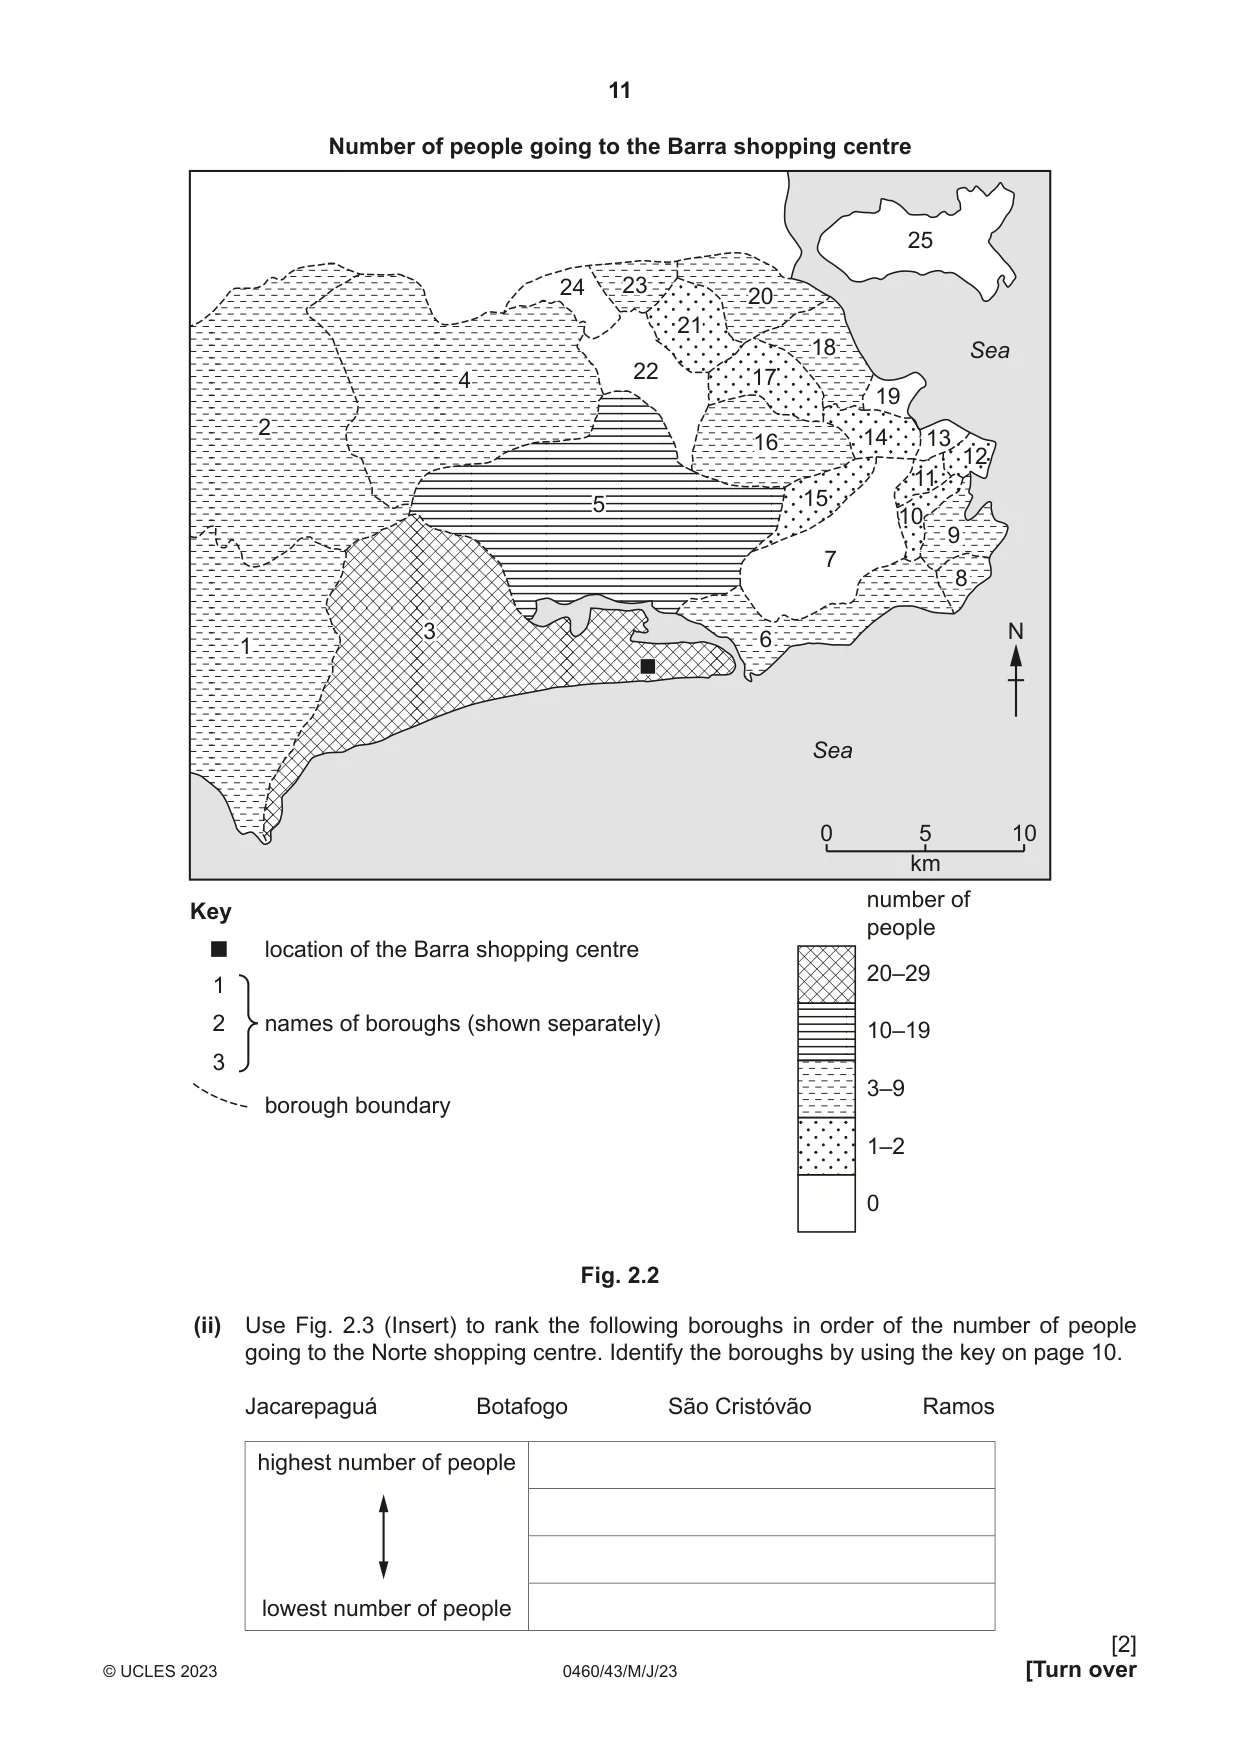
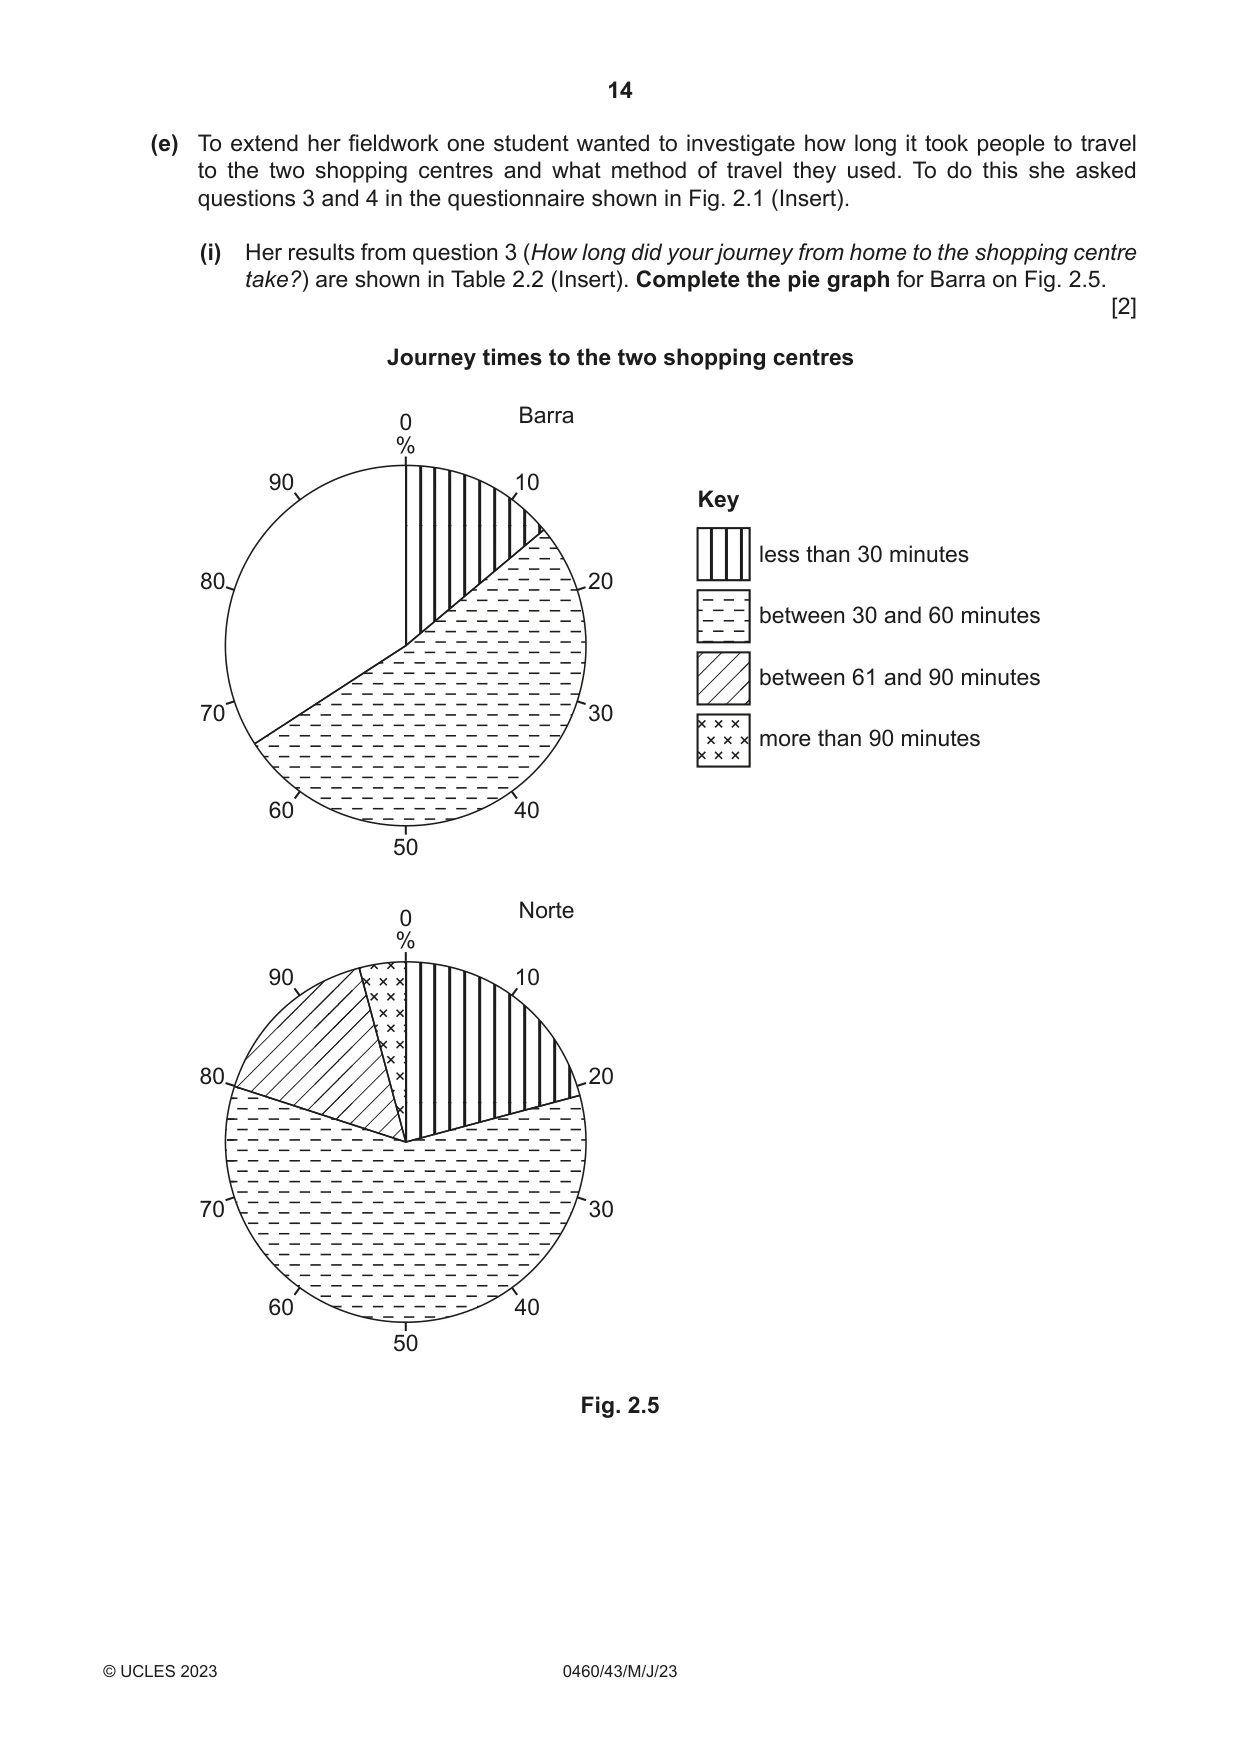
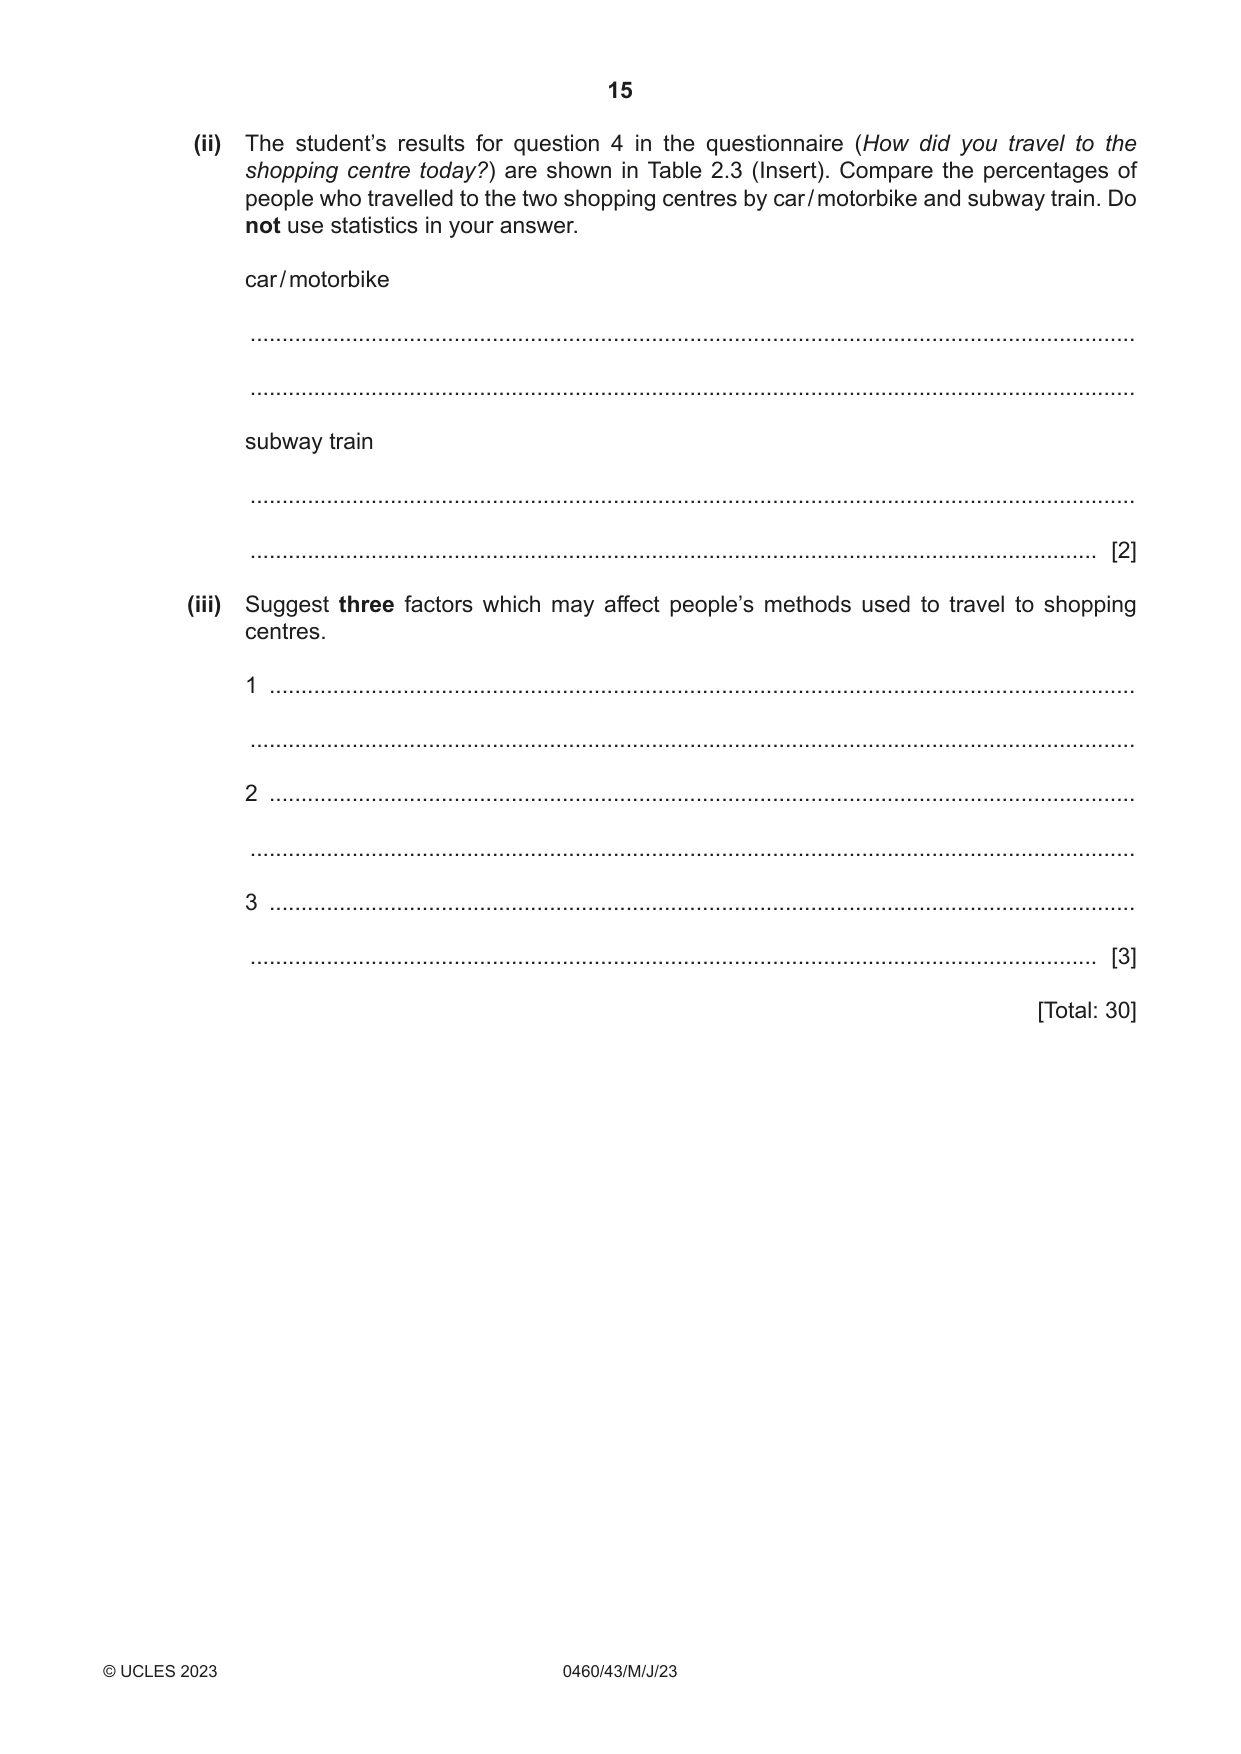
2 Students in a class in Rio de Janeiro, Brazil did fieldwork to compare two shopping centres. Norte is located near to the centre of Rio and Barra is located south of the city. Both are big shopping centres with a large variety of shops and entertainment facilities. They agreed to test the following hypotheses: Hypothesis 1: The sphere of influence of Barra is larger than that of Norte. Hypothesis 2: People buy different types of goods from the two shopping centres. (a) (i) Which one of the following is the correct definition of ‘sphere of influence’? Tick (✓) your choice. definition tick (✓) area where people have migrated from area next to a particular service area served by a settlement or service area where people go to work in a town area around a town or shop [1] (ii) Which one of the following is a low‑order or convenience good? Circle your answer. bread furniture jewellery mobile (cell) phone [1] (iii) Which one of the following is a high‑order or comparison good? Circle your answer. fruit hair shampoo laptop computer magazine [1] (b) To investigate the hypotheses the students used a questionnaire at the two shopping centres. This is shown in Fig. 2.1 (Insert). (i) To get information about Hypothesis 1 one student wanted to include the question ‘Where do you live?’ in the questionnaire. Suggest two reasons why their teacher suggested this question should not be asked. 1 ........................................................................................................................................ ........................................................................................................................................... 2 ........................................................................................................................................ ..................................................................................................................................... [2] (ii) When the teacher approved the questionnaire in Fig. 2.1, she advised the students how to use this questionnaire with people at the shopping centres. Suggest three pieces of advice she might give them. 1 ........................................................................................................................................ ........................................................................................................................................... 2 ........................................................................................................................................ ........................................................................................................................................... 3 ........................................................................................................................................ ..................................................................................................................................... [3] (c) The students plotted their results for question 1 in the questionnaire (Which borough of Rio de Janeiro do you live in?) on two choropleth maps, Fig. 2.2, page 11, and Fig. 2.3 (Insert). (i) Use the results provided to show the number of people from Tijuca and Madureira going to the Barra shopping centre on Fig. 2.2. Identify Tijuca and Madureira by using the key. [2] borough number of people Tijuca 10 Madureira 1 Key to boroughs number borough of Rio number borough of Rio 1 Guaratiba 14 São Cristóvão 2 Campo Grande 15 Ramos 3 Barra da Tijuca 16 Méier 4 Bangu 17 Inhaúma 5 Jacarepaguá 18 Vila Isabel 6 Lagoa 19 Caju 7 Tijuca 20 Penha 8 Copacabana 21 Irajá 9 Botafogo 22 Madureira 10 Santa Teresa 23 Pavuna 11 Rio Comprido 24 Anchieta 12 Centro 25 Ile da Governador 13 Portuaria
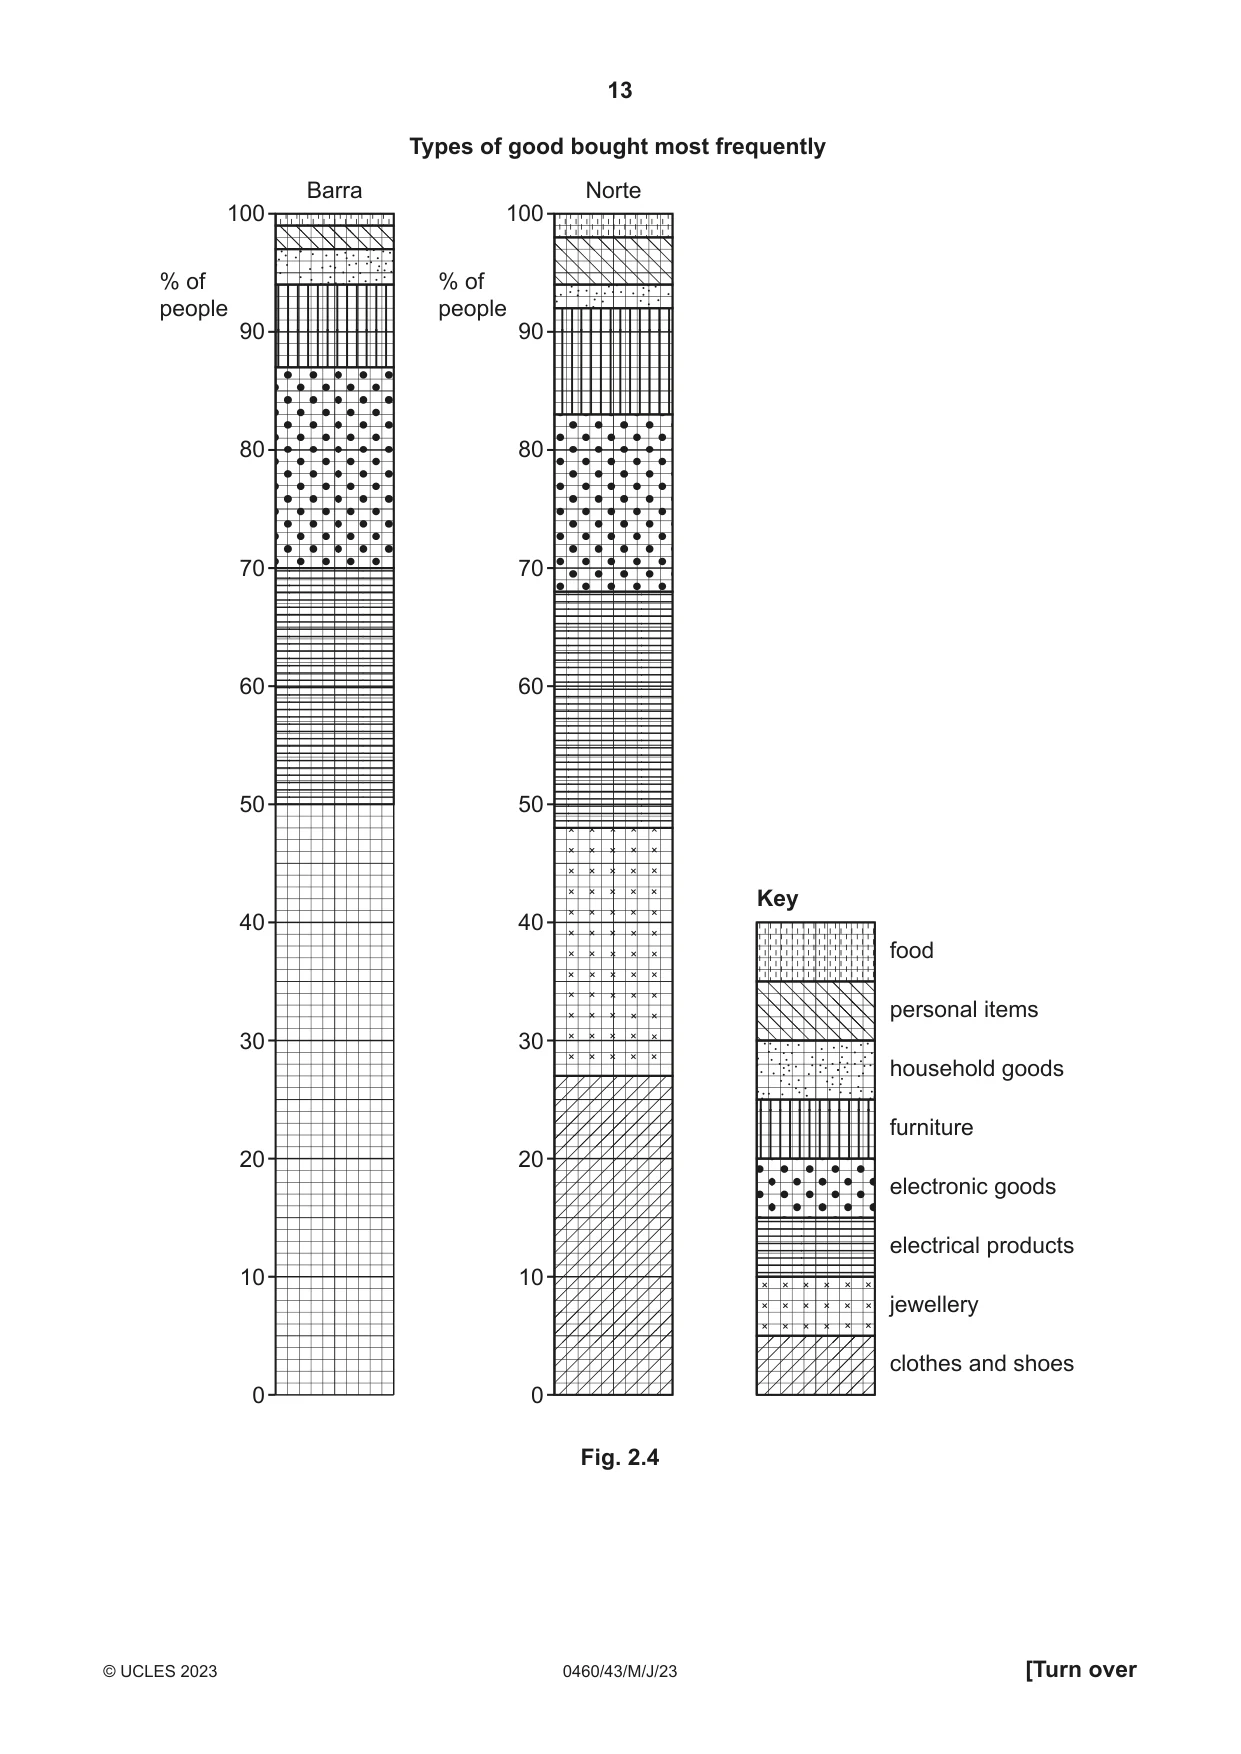
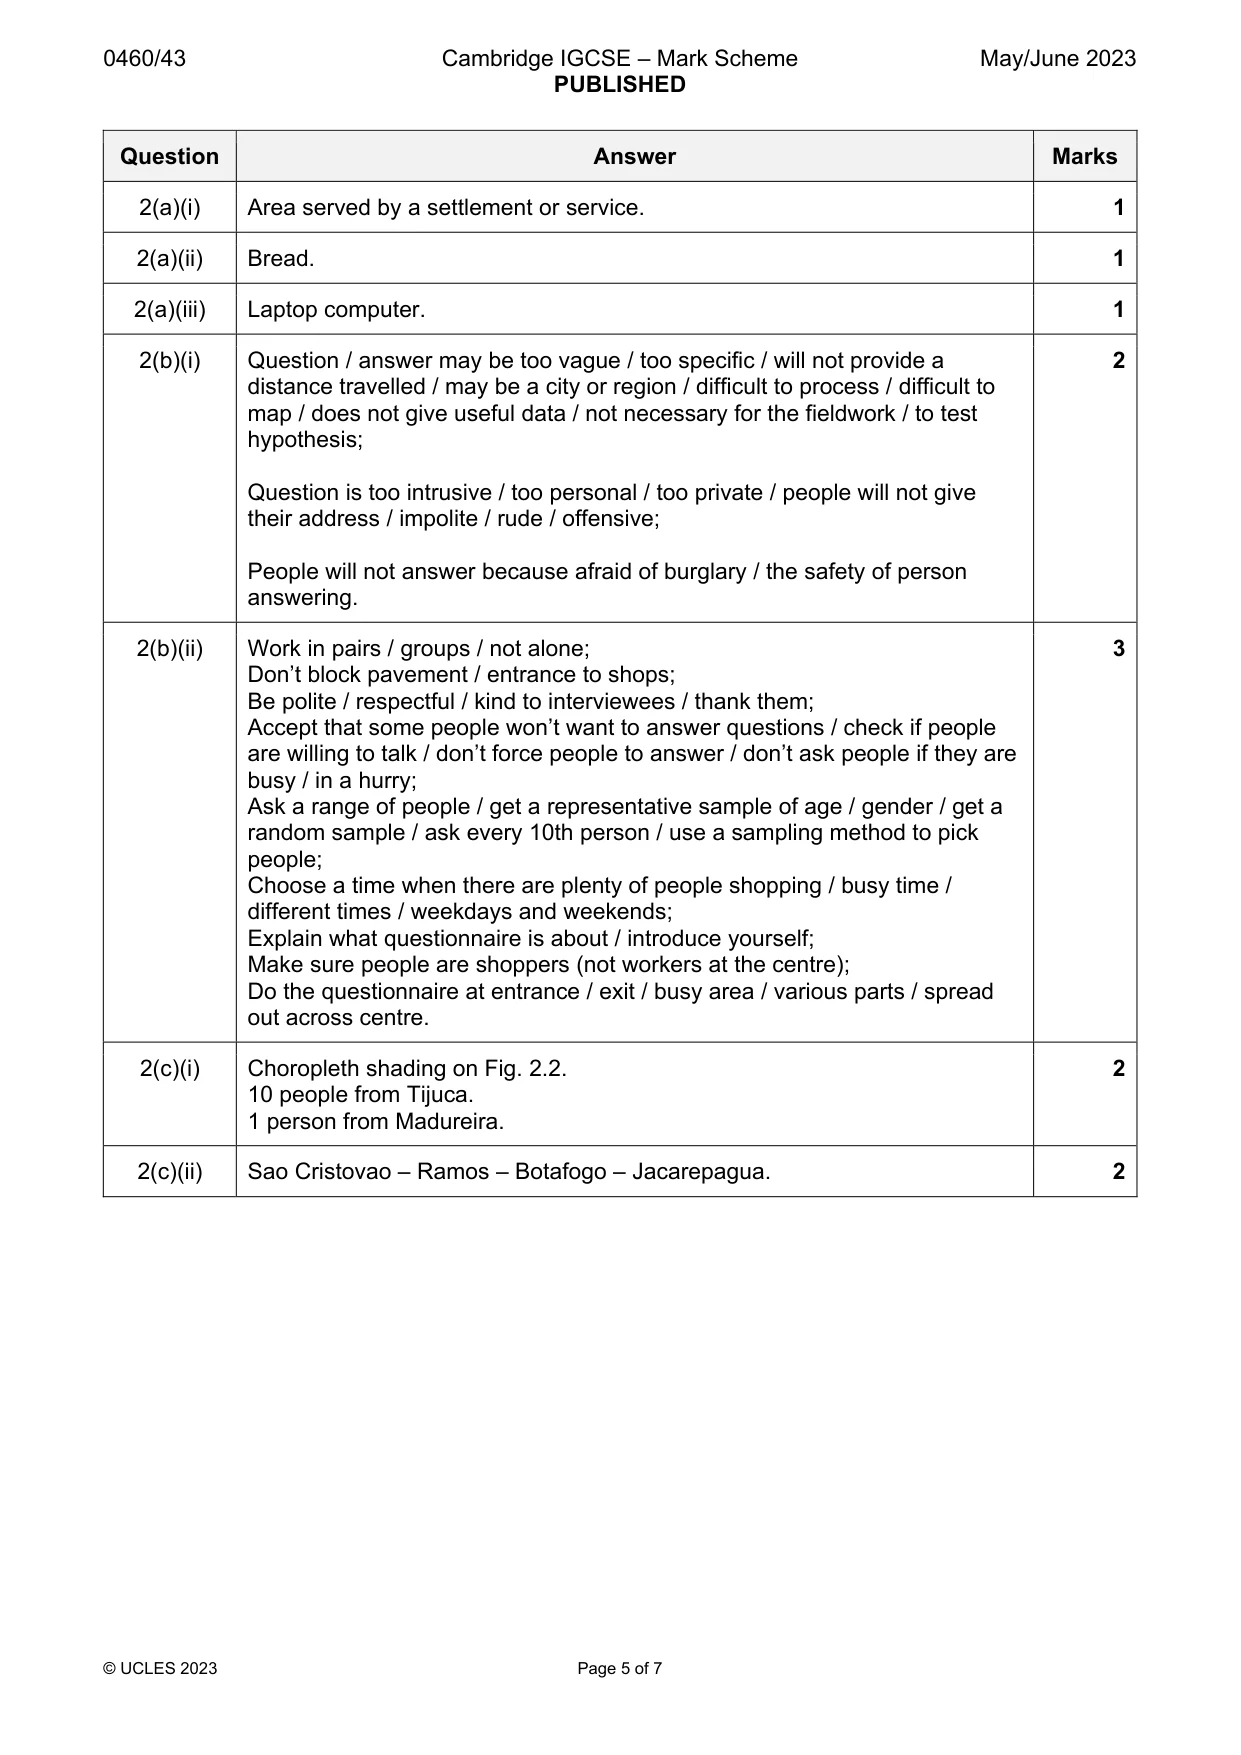
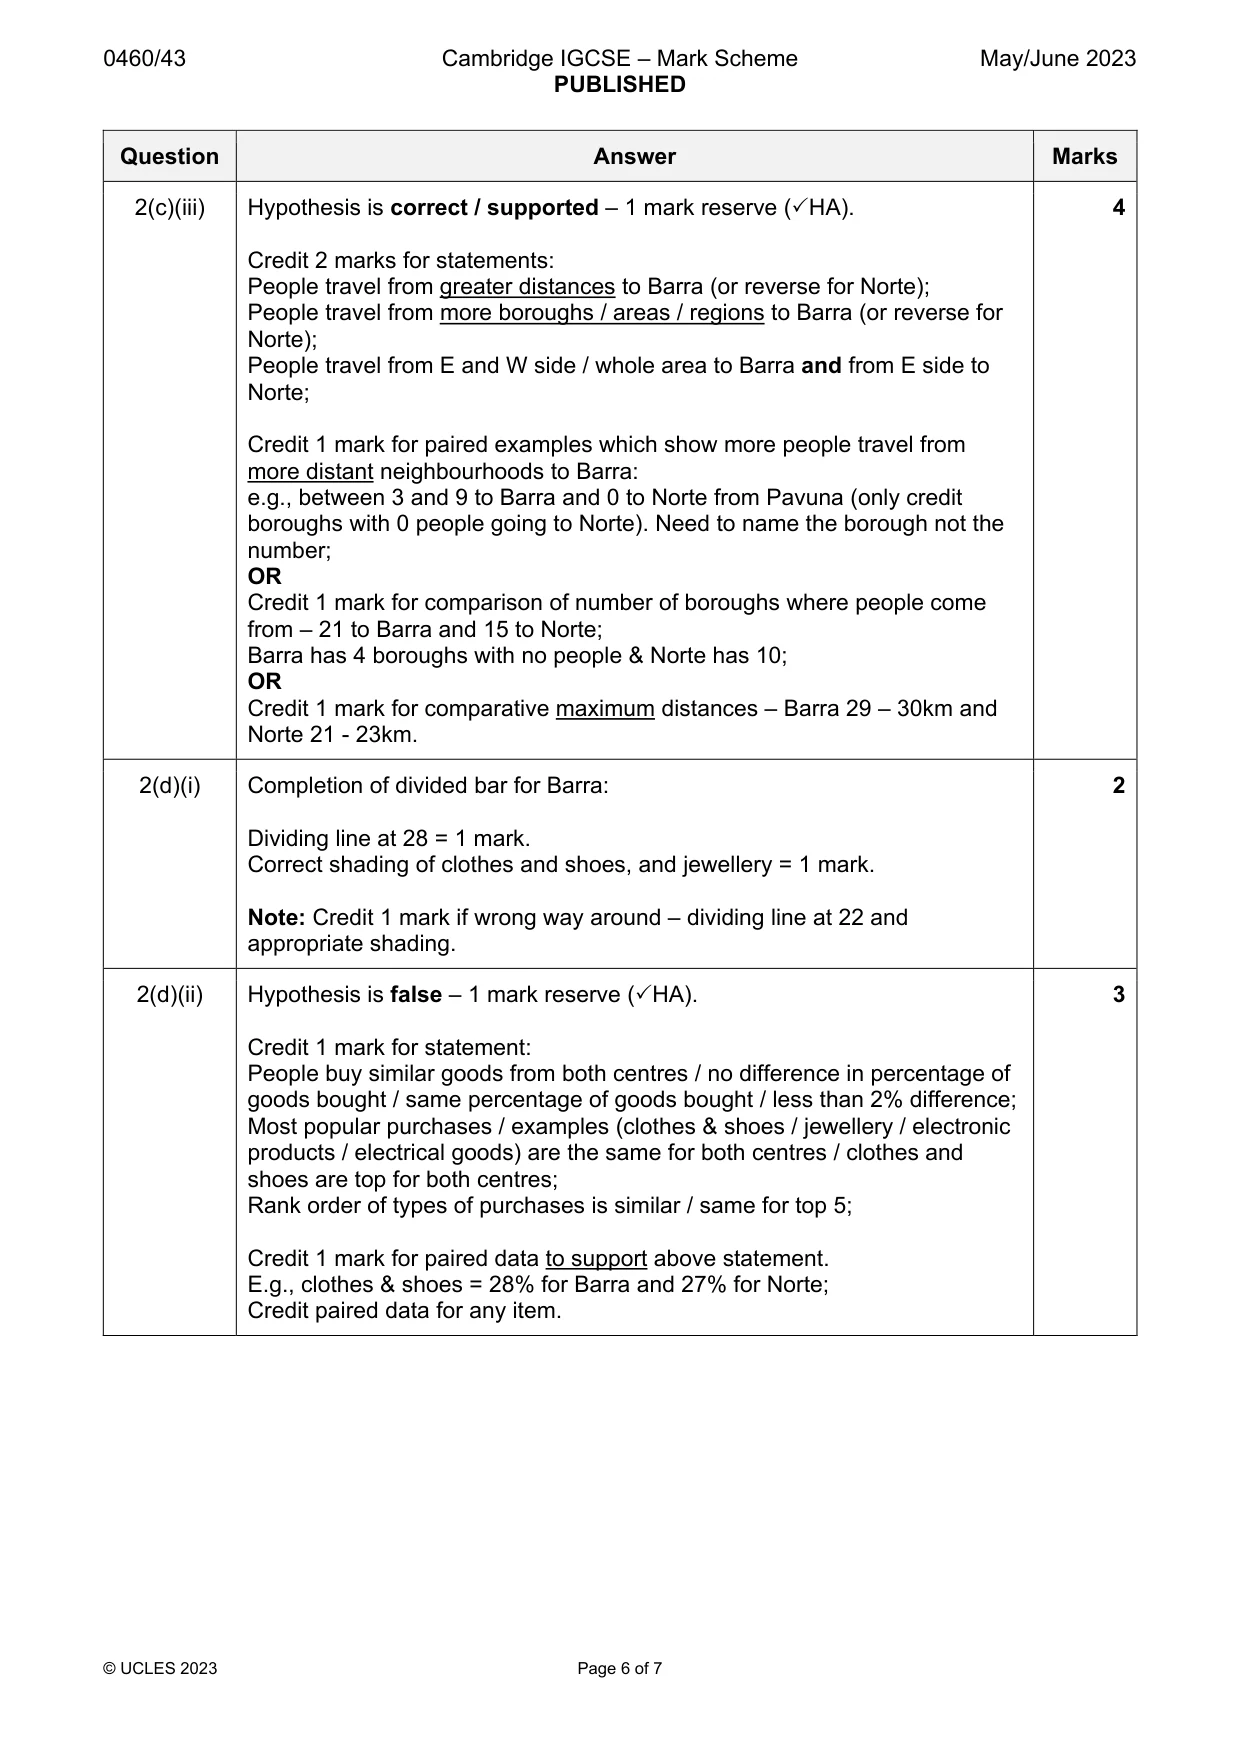
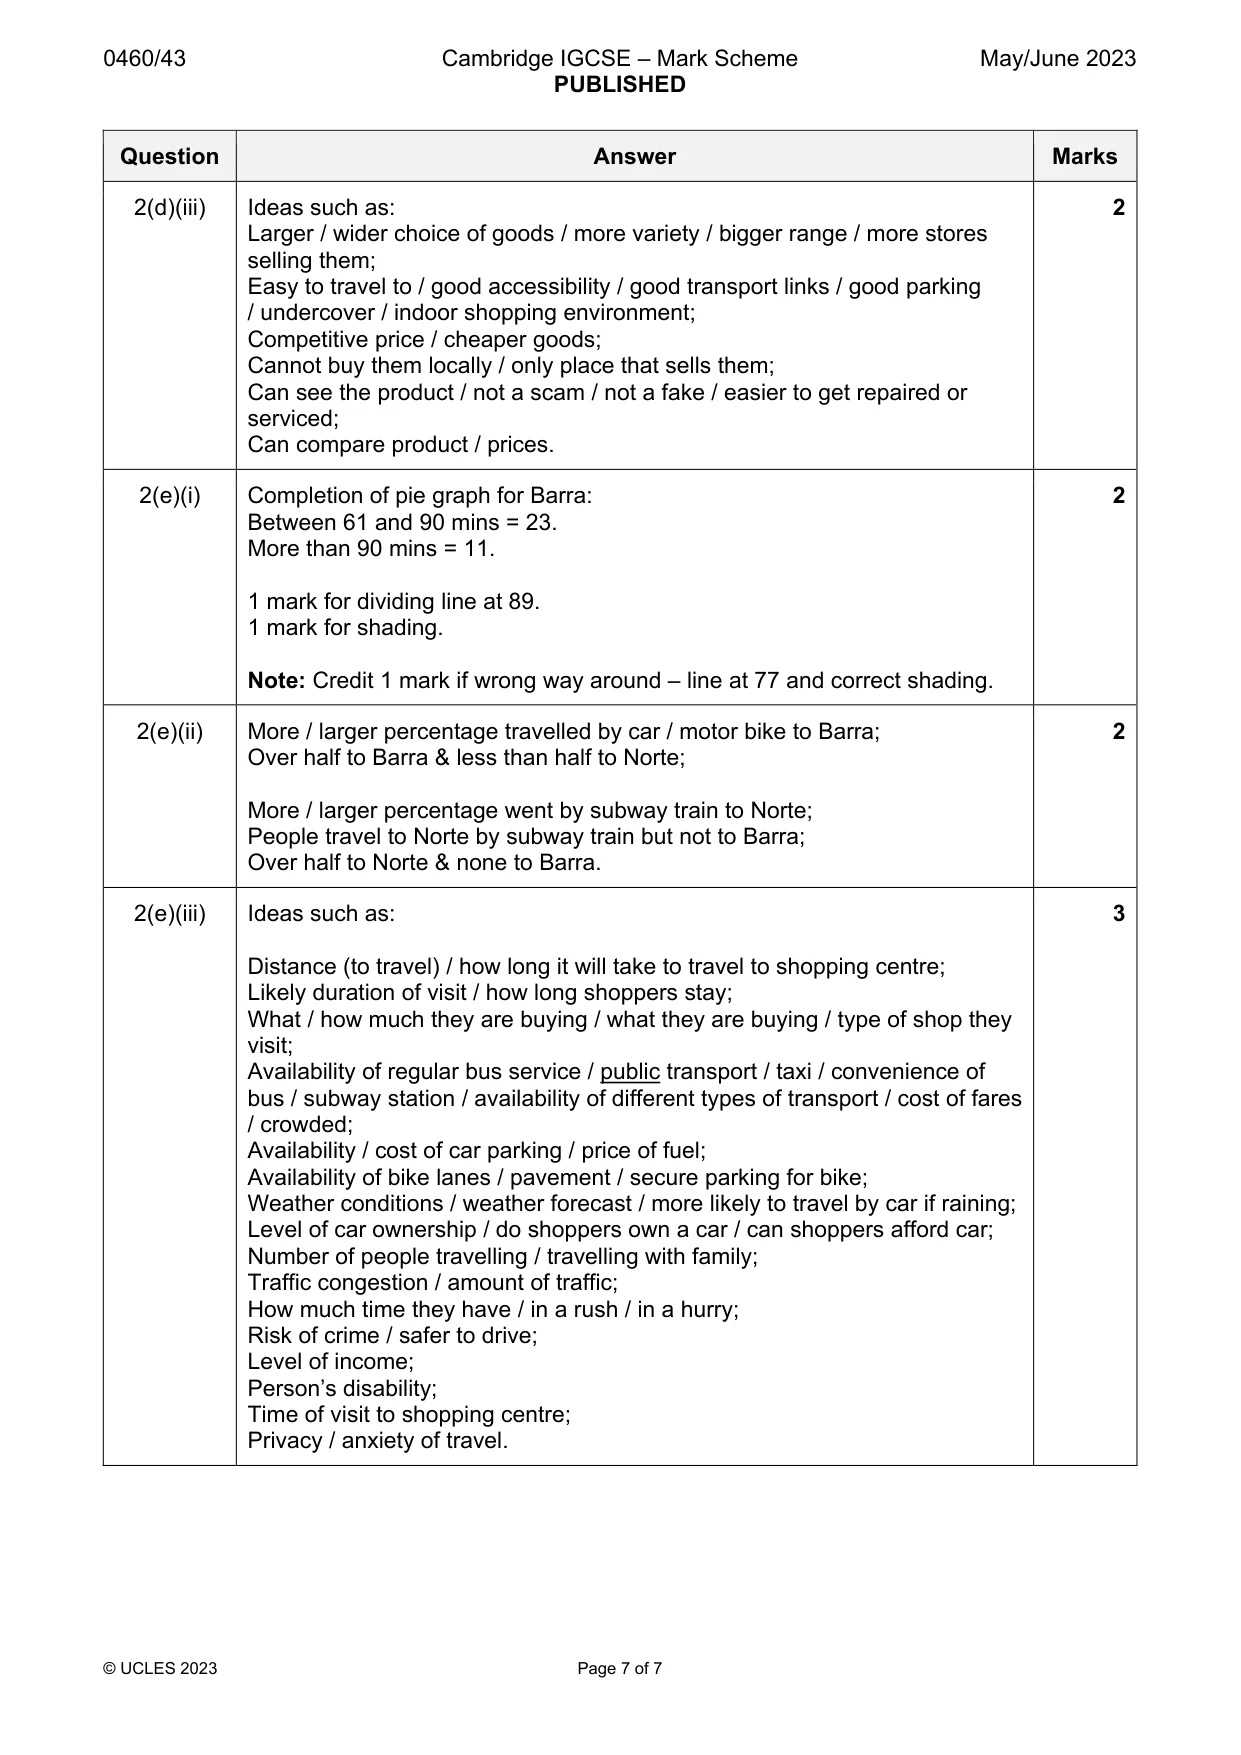
Mark scheme: 2(a)(i) Area served by a settlement or service. 1 2(a)(ii) Bread. 1 2(a)(iii) Laptop computer. 1 2(b)(i) Question / answer may be too vague / too specific / will not provide a 2 distance travelled / may be a city or region / difficult to process / difficult to map / does not give useful data / not necessary for the fieldwork / to test hypothesis; Question is too intrusive / too personal / too private / people will not give their address / impolite / rude / offensive; People will not answer because afraid of burglary / the safety of person answering. 2(b)(ii) Work in pairs / groups / not alone; 3 Don’t block pavement / entrance to shops; Be polite / respectful / kind to interviewees / thank them; Accept that some people won’t want to answer questions / check if people are willing to talk / don’t force people to answer / don’t ask people if they are busy / in a hurry; Ask a range of people / get a representative sample of age / gender / get a random sample / ask every 10th person / use a sampling method to pick people; Choose a time when there are plenty of people shopping / busy time / different times / weekdays and weekends; Explain what questionnaire is about / introduce yourself; Make sure people are shoppers (not workers at the centre); Do the questionnaire at entrance / exit / busy area / various parts / spread out across centre. 2(c)(i) Choropleth shading on Fig. 2.2. 2 10 people from Tijuca. 1 person from Madureira. 2(c)(ii) Sao Cristovao – Ramos – Botafogo – Jacarepagua. 2 2(c)(iii) Hypothesis is correct / supported – 1 mark reserve (HA). 4 Credit 2 marks for statements: People travel from greater distances to Barra (or reverse for Norte); People travel from more boroughs / areas / regions to Barra (or reverse for Norte); People travel from E and W side / whole area to Barra and from E side to Norte; Credit 1 mark for paired examples which show more people travel from more distant neighbourhoods to Barra: e.g., between 3 and 9 to Barra and 0 to Norte from Pavuna (only credit boroughs with 0 people going to Norte). Need to name the borough not the number; OR Credit 1 mark for comparison of number of boroughs where people come from – 21 to Barra and 15 to Norte; Barra has 4 boroughs with no people & Norte has 10; OR Credit 1 mark for comparative maximum distances – Barra 29 – 30km and Norte 21 - 23km. 2(d)(i) Completion of divided bar for Barra: 2 Dividing line at 28 = 1 mark. Correct shading of clothes and shoes, and jewellery = 1 mark. Note: Credit 1 mark if wrong way around – dividing line at 22 and appropriate shading. 2(d)(ii) Hypothesis is false – 1 mark reserve (HA). 3 Credit 1 mark for statement: People buy similar goods from both centres / no difference in percentage of goods bought / same percentage of goods bought / less than 2% difference; Most popular purchases / examples (clothes & shoes / jewellery / electronic products / electrical goods) are the same for both centres / clothes and shoes are top for both centres; Rank order of types of purchases is similar / same for top 5; Credit 1 mark for paired data to support above statement. E.g., clothes & shoes = 28% for Barra and 27% for Norte; Credit paired data for any item. 2(d)(iii) Ideas such as: 2 Larger / wider choice of goods / more variety / bigger range / more stores selling them; Easy to travel to / good accessibility / good transport links / good parking / undercover / indoor shopping environment; Competitive price / cheaper goods; Cannot buy them locally / only place that sells them; Can see the product / not a scam / not a fake / easier to get repaired or serviced; Can compare product / prices. 2(e)(i) Completion of pie graph for Barra: 2 Between 61 and 90 mins = 23. More than 90 mins = 11. 1 mark for dividing line at 89. 1 mark for shading. Note: Credit 1 mark if wrong way around – line at 77 and correct shading. 2(e)(ii) More / larger percentage travelled by car / motor bike to Barra; 2 Over half to Barra & less than half to Norte; More / larger percentage went by subway train to Norte; People travel to Norte by subway train but not to Barra; Over half to Norte & none to Barra. 2(e)(iii) Ideas such as: 3 Distance (to travel) / how long it will take to travel to shopping centre; Likely duration of visit / how long shoppers stay; What / how much they are buying / what they are buying / type of shop they visit; Availability of regular bus service / public transport / taxi / convenience of bus / subway station / availability of different types of transport / cost of fares / crowded; Availability / cost of car parking / price of fuel; Availability of bike lanes / pavement / secure parking for bike; Weather conditions / weather forecast / more likely to travel by car if raining; Level of car ownership / do shoppers own a car / can shoppers afford car; Number of people travelling / travelling with family; Traffic congestion / amount of traffic; How much time they have / in a rush / in a hurry; Risk of crime / safer to drive; Level of income; Person’s disability; Time of visit to shopping centre; Privacy / anxiety of travel.
More questions on Settlements (rural and urban) and service provision
What was in this paper
The subtopics covered by these 2 questions, and how many questions each got. Open one in a new tab to see every Cambridge question on it.
What you needed in this session
Cambridge’s own grade thresholds for 2023 May/June, Paper 4 · Variant 3. A higher threshold means an easier paper — the bar moves with how the cohort did.