Cambridge IGCSE Geography 0460 — 2024 May/June Paper 4 · Variant 3
0460/43/M/J/24 · 2 questions · 60 marks · ≈68 min
The question paper and its mark scheme, free to read here and free to download. This is Cambridge’s own paper, exactly as it was sat.
Question paper16 pages

Mark scheme10 pages
Answers below. Sit the paper first if you are practising.
Questions as text
Q1 · Students studying urban land use did fieldwork to investigate the land use in their city
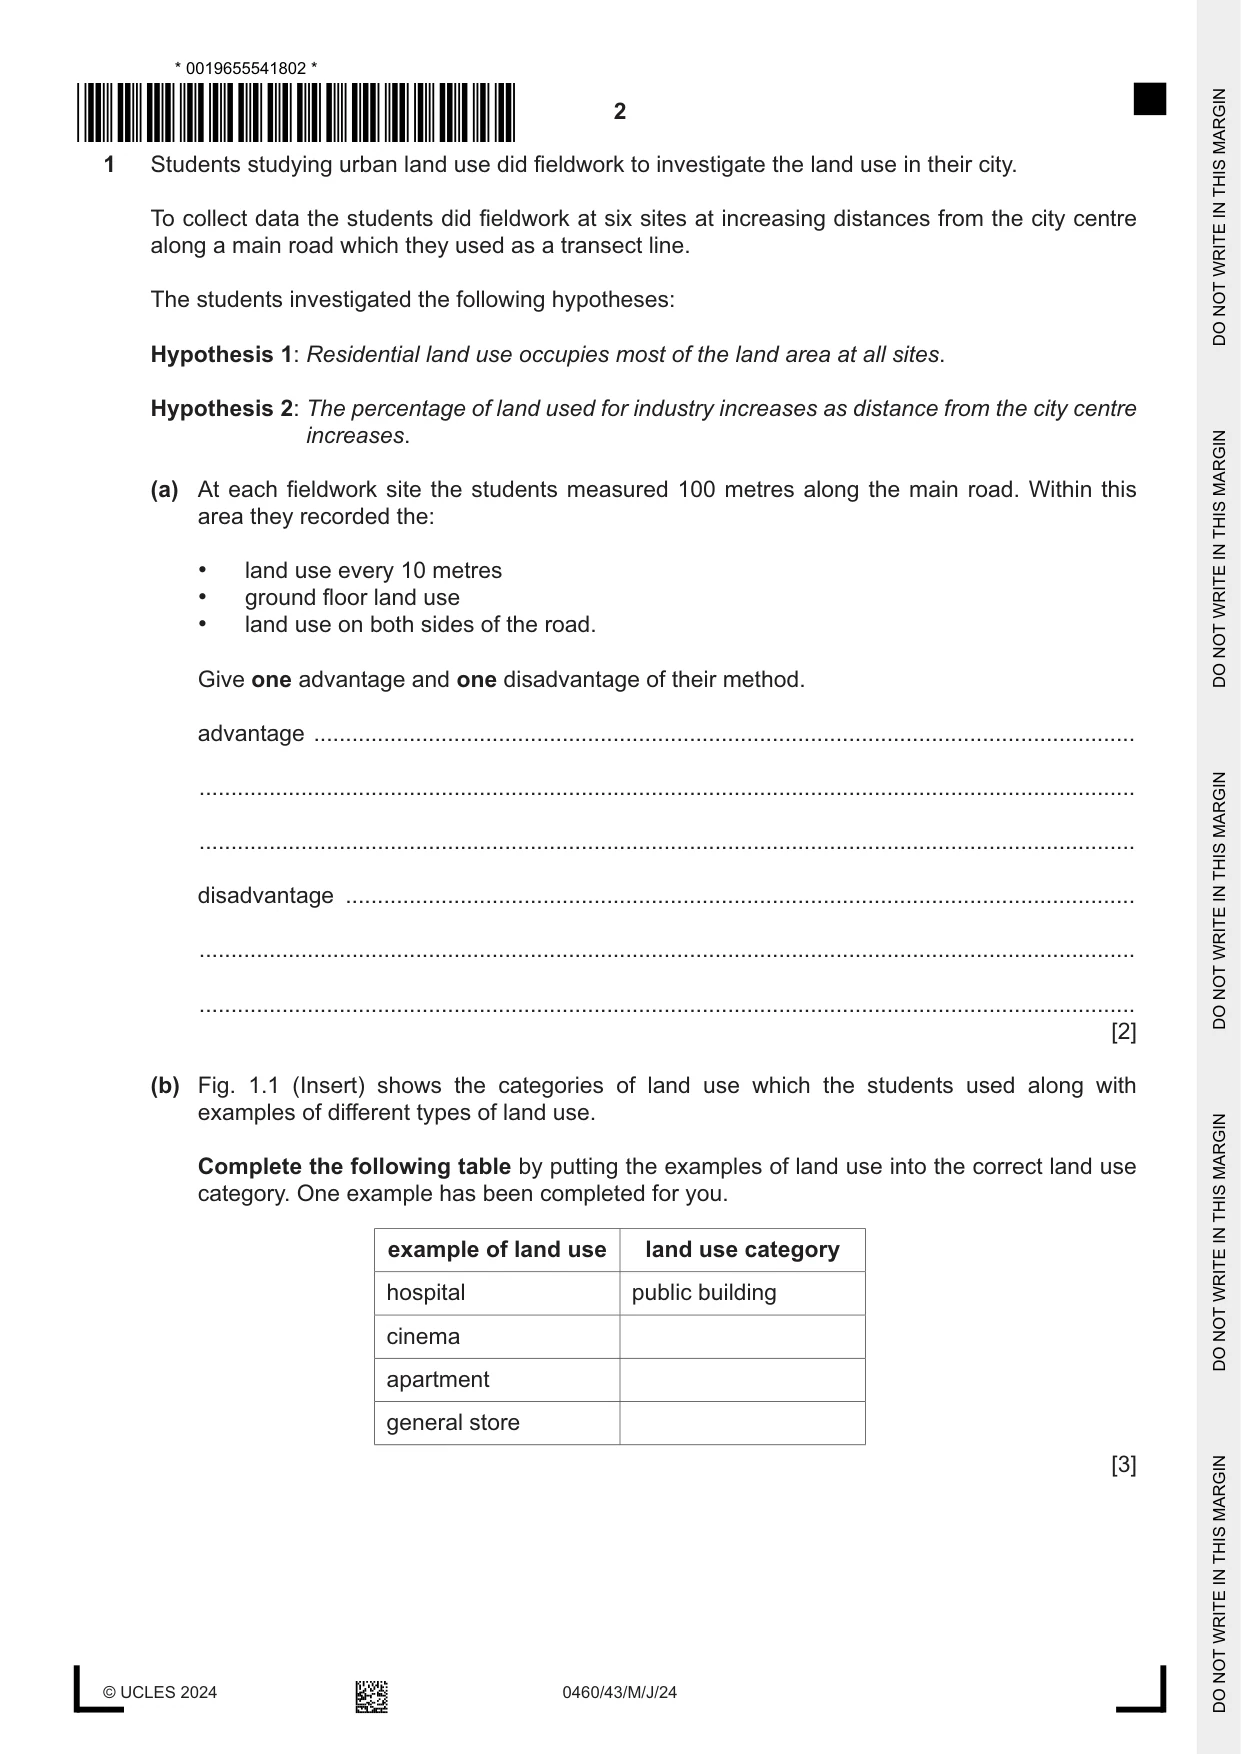
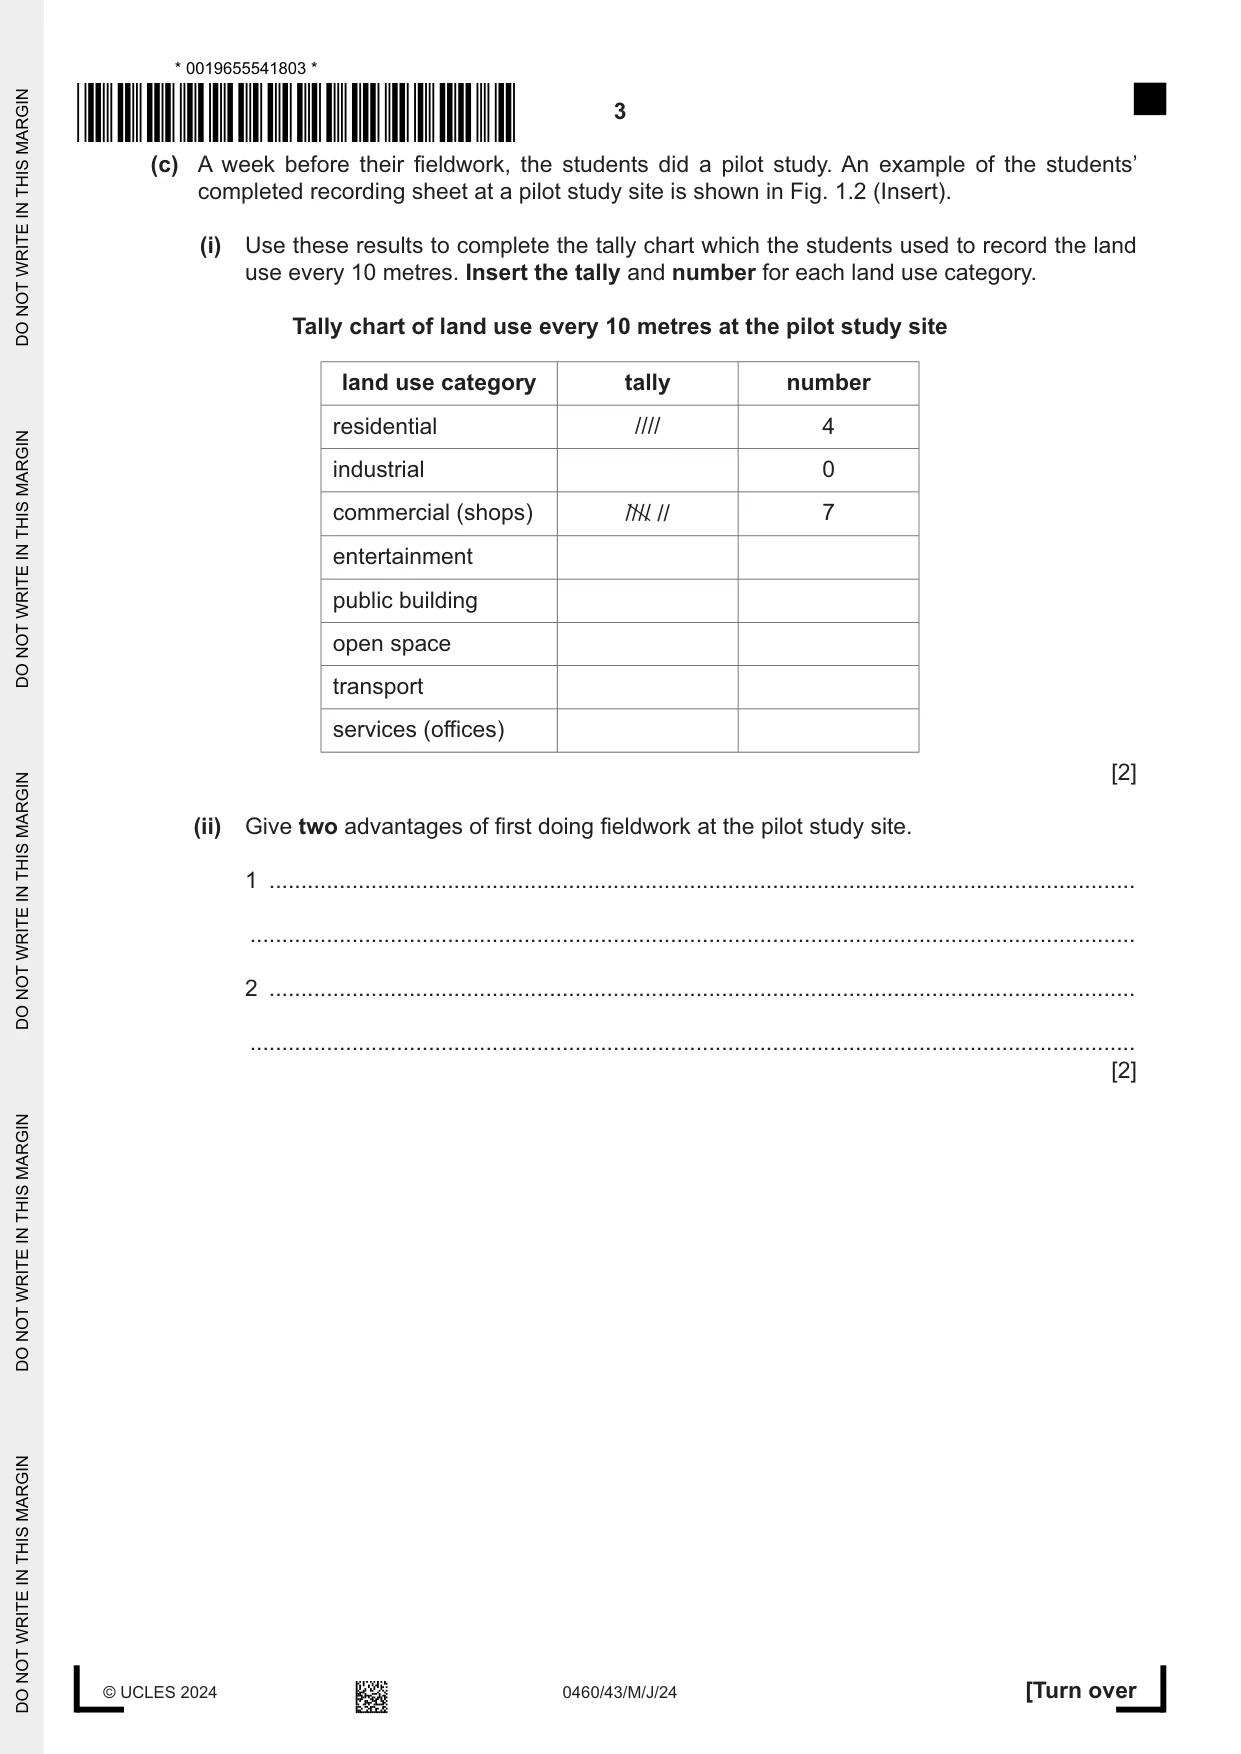
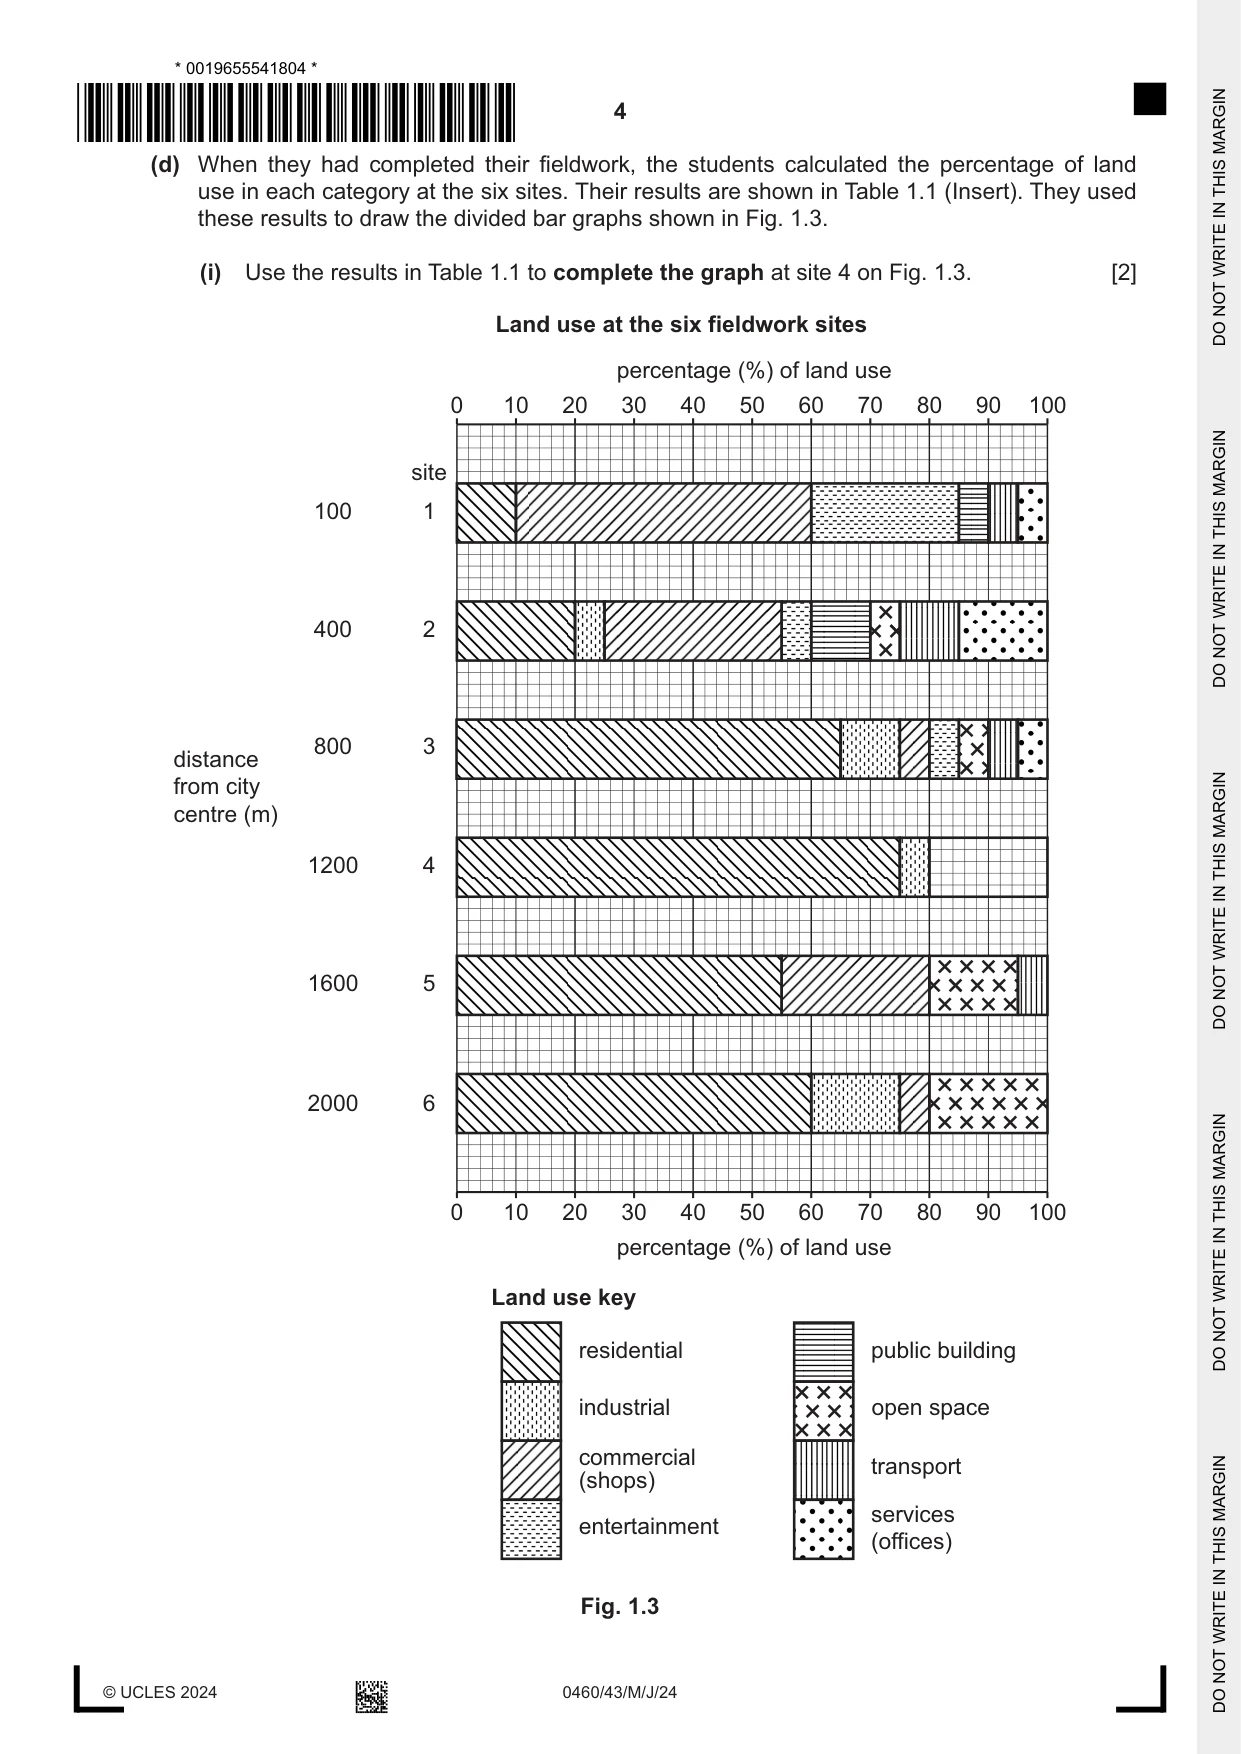
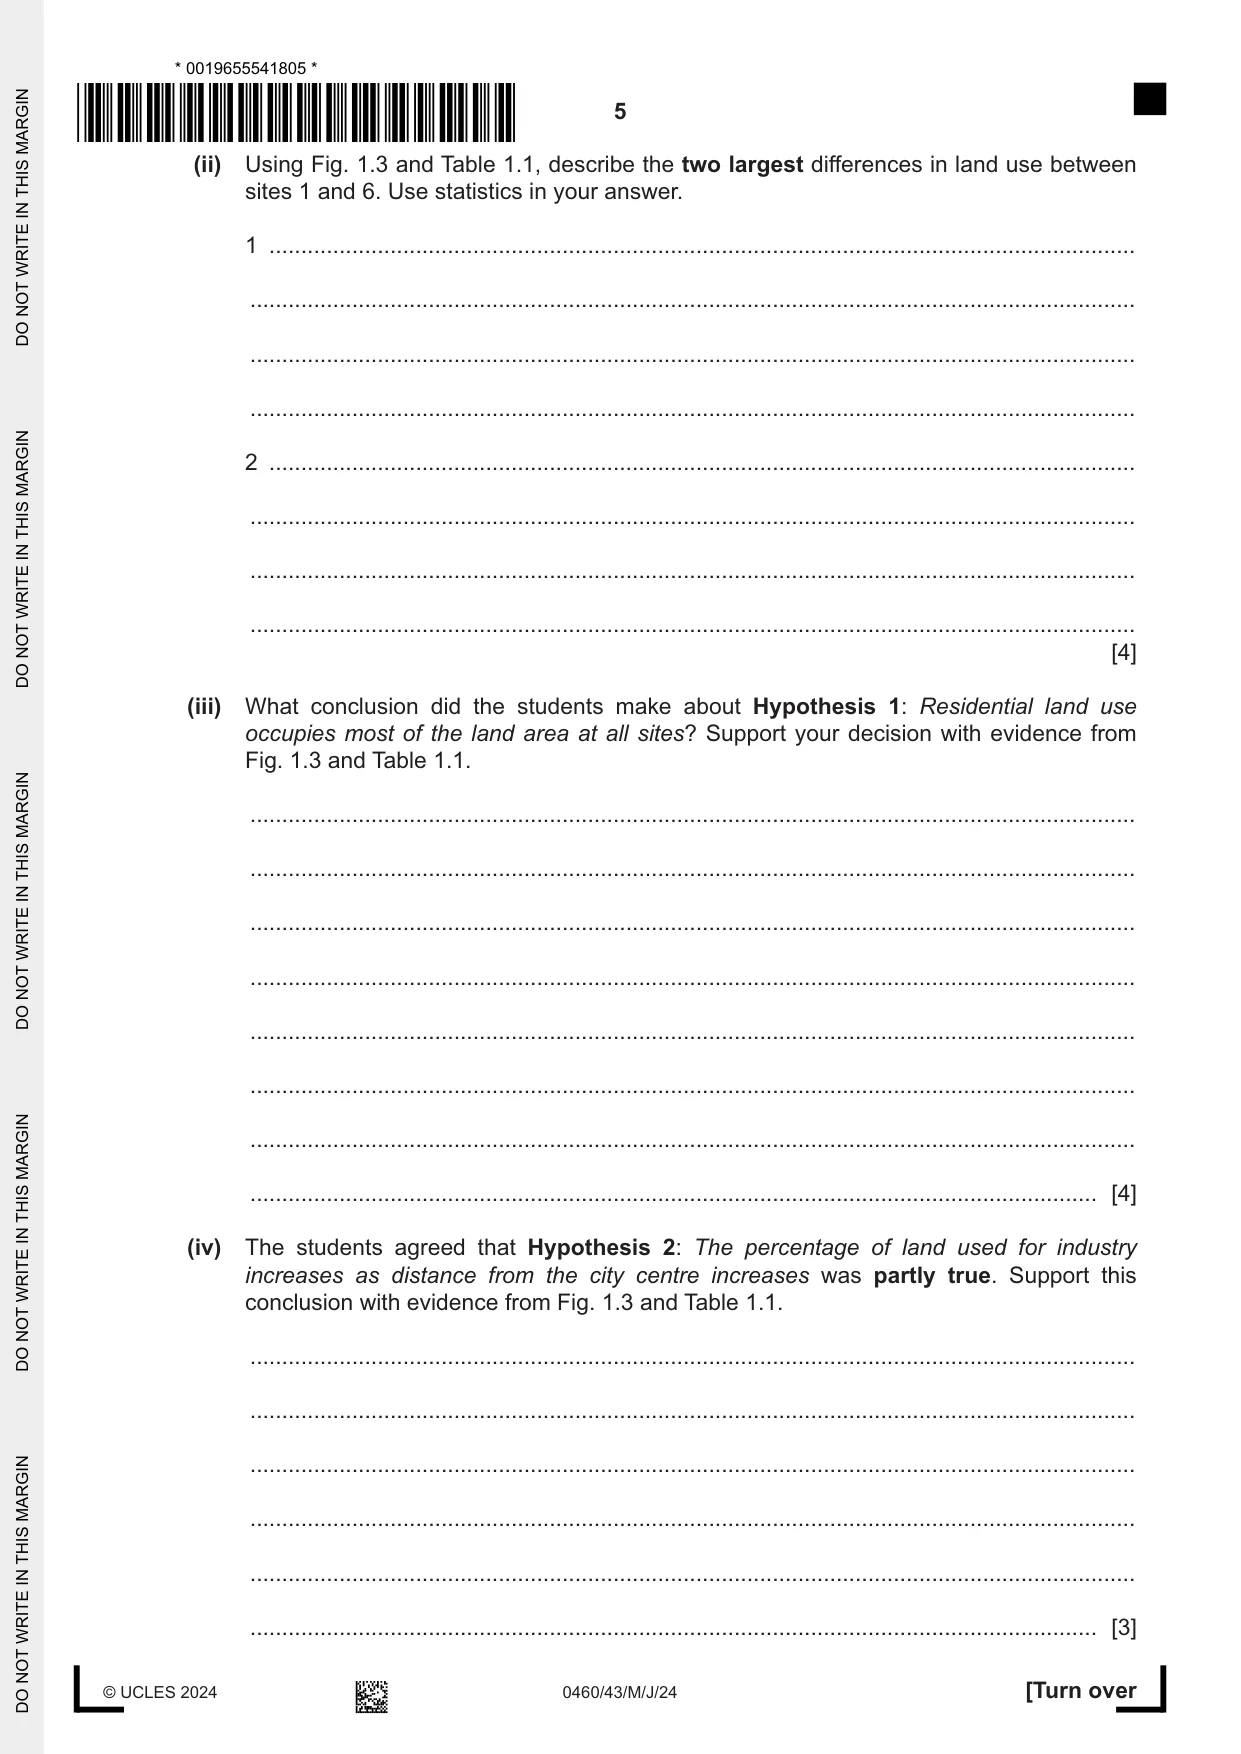
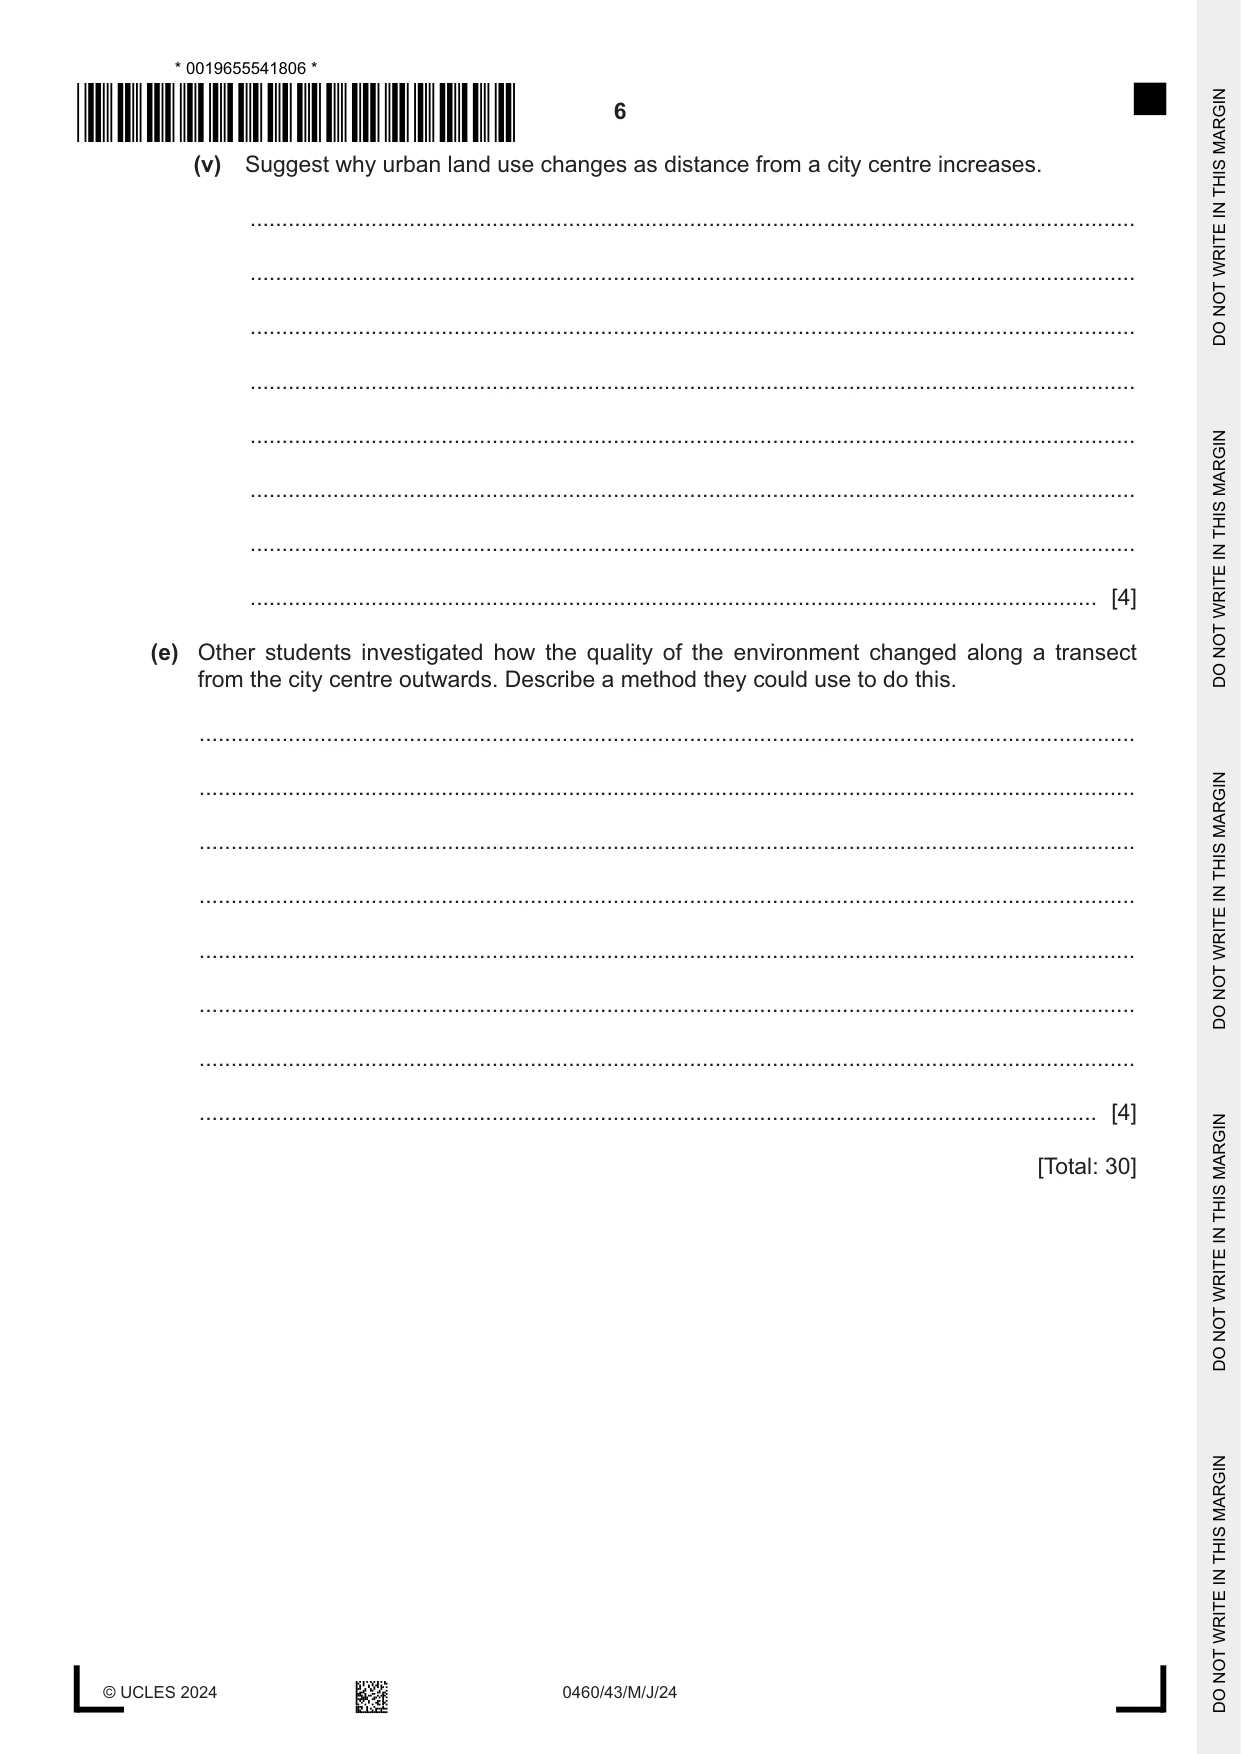
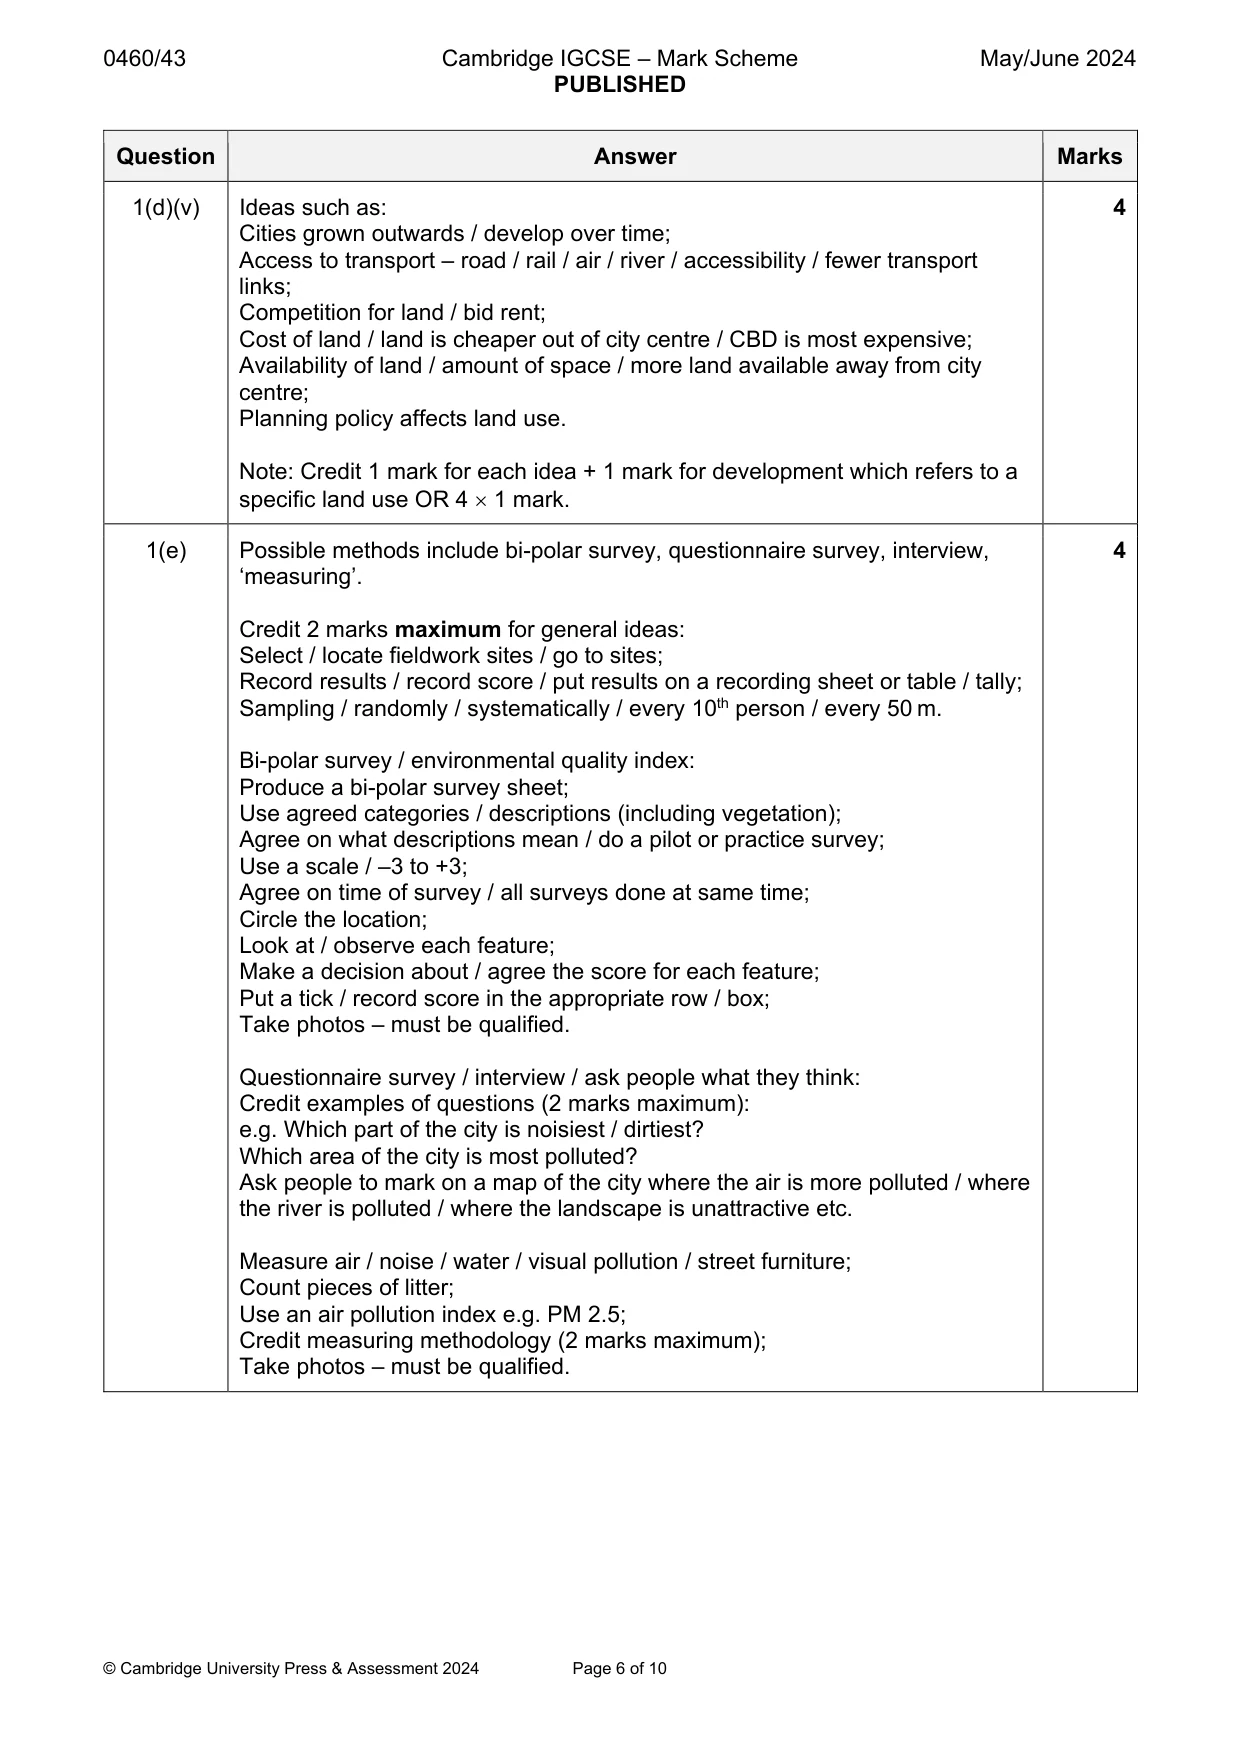
1 Students studying urban land use did fieldwork to investigate the land use in their city. To collect data the students did fieldwork at six sites at increasing distances from the city centre along a main road which they used as a transect line. The students investigated the following hypotheses: Hypothesis 1: Residential land use occupies most of the land area at all sites. Hypothesis 2: The percentage of land used for industry increases as distance from the city centre increases. (a) At each fieldwork site the students measured 100 metres along the main road. Within this area they recorded the: • land use every 10 metres • ground floor land use • land use on both sides of the road. Give one advantage and one disadvantage of their method. advantage ................................................................................................................................. ................................................................................................................................................... ................................................................................................................................................... disadvantage ............................................................................................................................ ................................................................................................................................................... ................................................................................................................................................... [2] (b) Fig. 1.1 (Insert) shows the categories of land use which the students used along with examples of different types of land use. Complete the following table by putting the examples of land use into the correct land use category. One example has been completed for you. example of land use land use category hospital public building cinema apartment general store [3] (c) A week before their fieldwork, the students did a pilot study. An example of the students’ completed recording sheet at a pilot study site is shown in Fig. 1.2 (Insert). (i) Use these results to complete the tally chart which the students used to record the land use every 10 metres. Insert the tally and number for each land use category. Tally chart of land use every 10 metres at the pilot study site land use category tally number residential 4 industrial 0 commercial (shops) // 7 entertainment public building open space transport services (offices) [2] (ii) Give two advantages of first doing fieldwork at the pilot study site. 1 ........................................................................................................................................ ........................................................................................................................................... 2 ........................................................................................................................................ ........................................................................................................................................... [2] (d) When they had completed their fieldwork, the students calculated the percentage of land use in each category at the six sites. Their results are shown in Table 1.1 (Insert). They used these results to draw the divided bar graphs shown in Fig. 1.3. (i) Use the results in Table 1.1 to complete the graph at site 4 on Fig. 1.3. [2] Land use at the six fieldwork sites percentage (%) of land use 0 10 20 30 40 50 60 70 80 90 100 site 100 1 400 2 800 3 distance from city centre (m) 1200 4 1600 5 2000 6 0 10 20 30 40 50 60 70 80 90 100 percentage (%) of land use Land use key residential public building industrial open space commercial transport (shops) services entertainment (offices) Fig. 1.3 (ii) Using Fig. 1.3 and Table 1.1, describe the two largest differences in land use between sites 1 and 6. Use statistics in your answer. 1 ........................................................................................................................................ ........................................................................................................................................... ........................................................................................................................................... ........................................................................................................................................... 2 ........................................................................................................................................ ........................................................................................................................................... ........................................................................................................................................... ........................................................................................................................................... [4] (iii) What conclusion did the students make about Hypothesis 1: Residential land use occupies most of the land area at all sites? Support your decision with evidence from Fig. 1.3 and Table 1.1. ........................................................................................................................................... ........................................................................................................................................... ........................................................................................................................................... ........................................................................................................................................... ........................................................................................................................................... ........................................................................................................................................... ........................................................................................................................................... ..................................................................................................................................... [4] (iv) The students agreed that Hypothesis 2: The percentage of land used for industry increases as distance from the city centre increases was partly true. Support this conclusion with evidence from Fig. 1.3 and Table 1.1. ........................................................................................................................................... ........................................................................................................................................... ........................................................................................................................................... ........................................................................................................................................... ........................................................................................................................................... ..................................................................................................................................... [3] (v) Suggest why urban land use changes as distance from a city centre increases. ........................................................................................................................................... ........................................................................................................................................... ........................................................................................................................................... ........................................................................................................................................... ........................................................................................................................................... ........................................................................................................................................... ........................................................................................................................................... ..................................................................................................................................... [4] (e) Other students investigated how the quality of the environment changed along a transect from the city centre outwards. Describe a method they could use to do this. ................................................................................................................................................... ................................................................................................................................................... ................................................................................................................................................... ................................................................................................................................................... ................................................................................................................................................... ................................................................................................................................................... ................................................................................................................................................... ............................................................................................................................................. [4] [Total: 30]
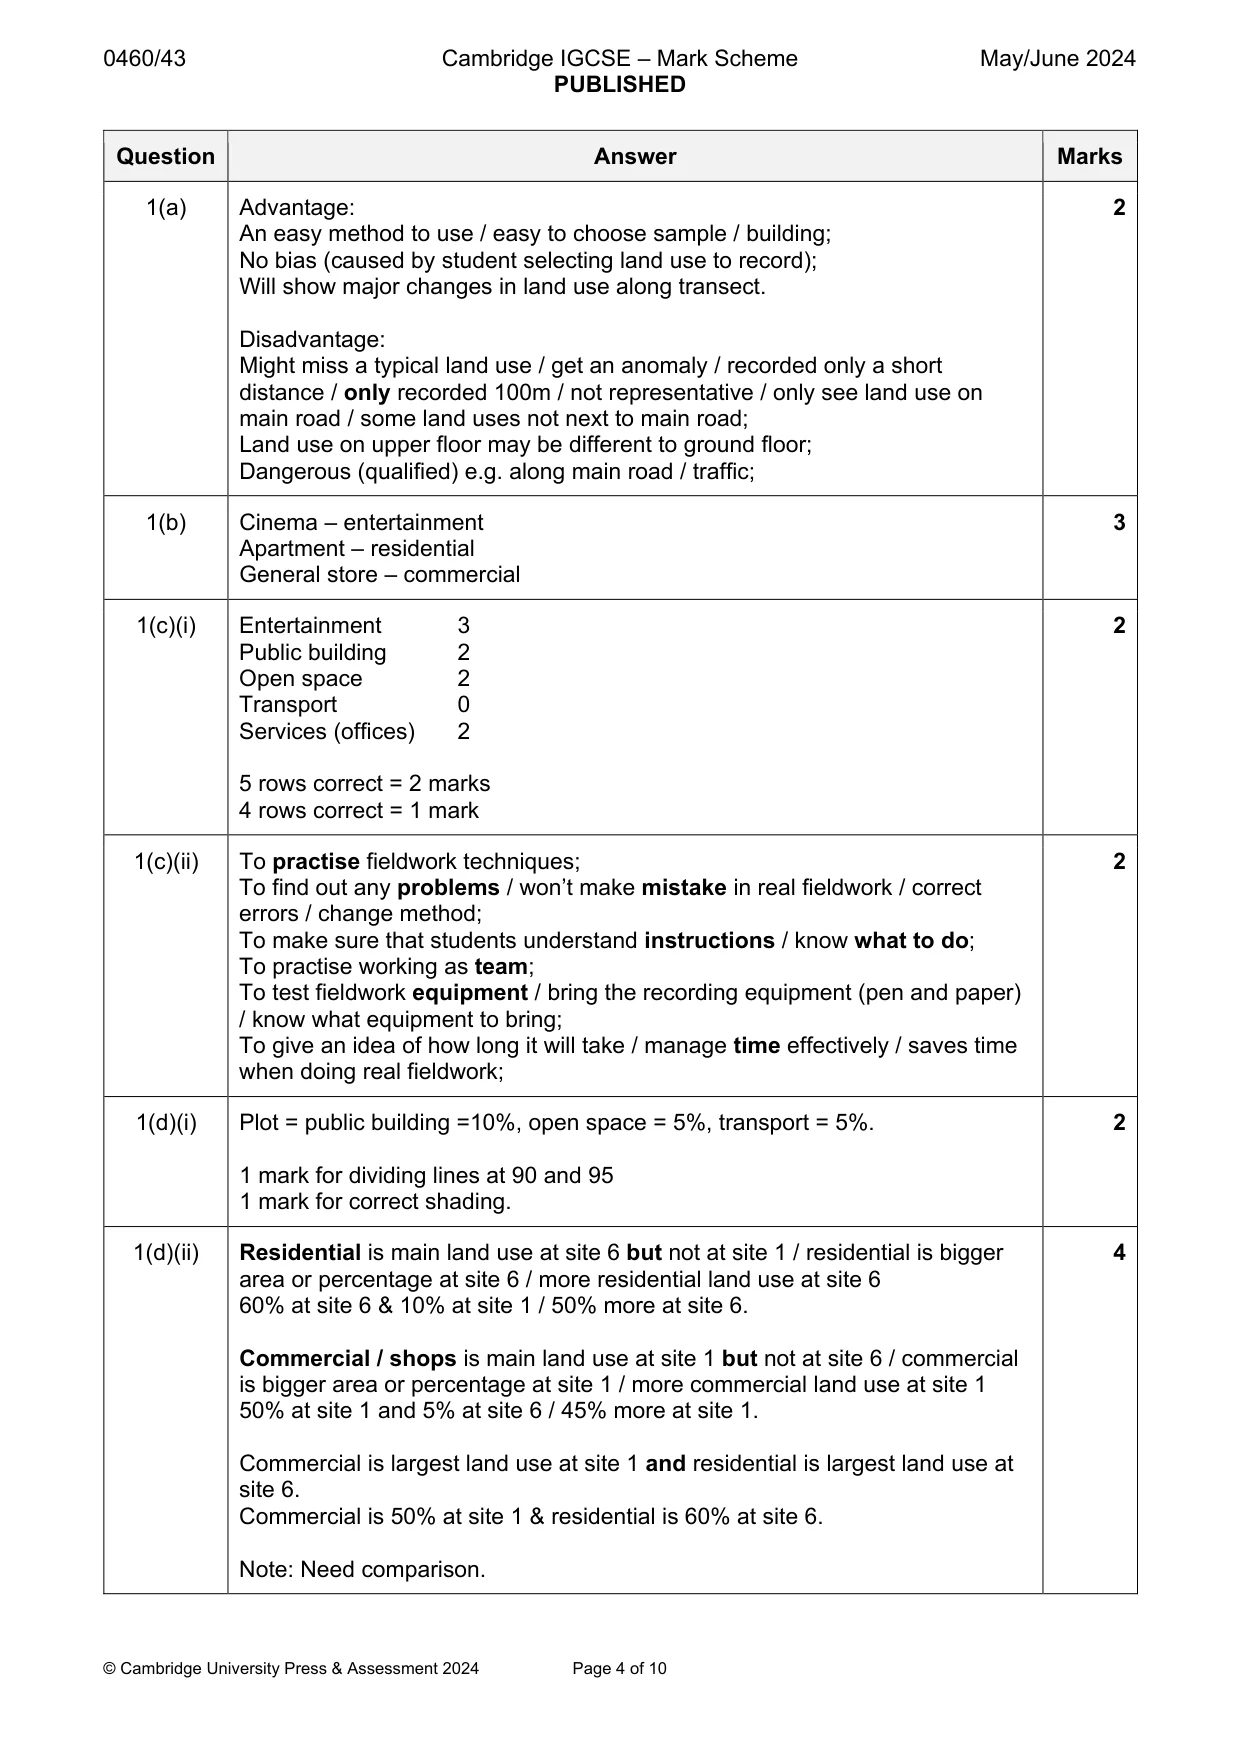
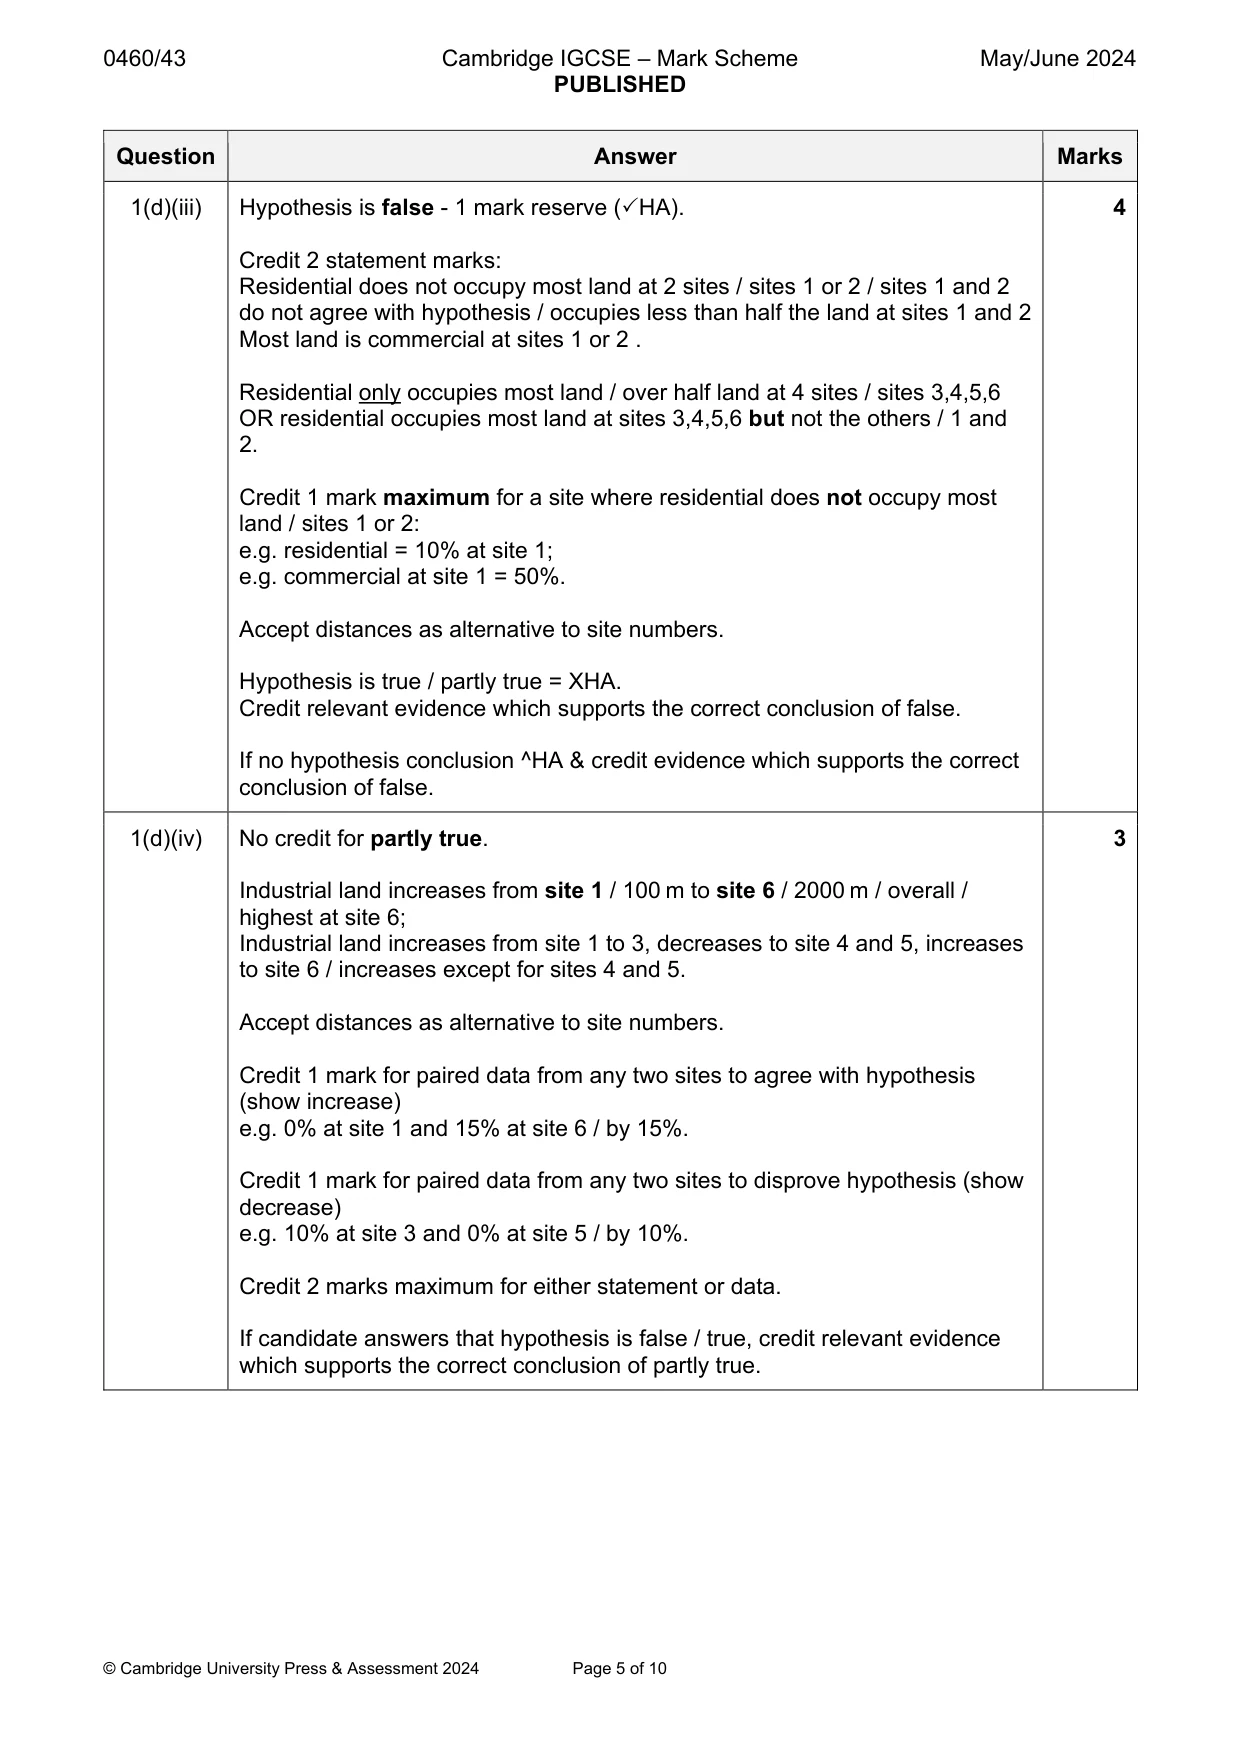
Mark scheme: Question Answer Marks 1(a) Advantage: 2 An easy method to use / easy to choose sample / building; No bias (caused by student selecting land use to record); Will show major changes in land use along transect. Disadvantage: Might miss a typical land use / get an anomaly / recorded only a short distance / only recorded 100m / not representative / only see land use on main road / some land uses not next to main road; Land use on upper floor may be different to ground floor; Dangerous (qualified) e.g. along main road / traffic; 1(b) Cinema – entertainment 3 Apartment – residential General store – commercial 1(c)(i) Entertainment 3 2 Public building 2 Open space 2 Transport 0 Services (offices) 2 5 rows correct = 2 marks 4 rows correct = 1 mark 1(c)(ii) To practise fieldwork techniques; 2 To find out any problems / won’t make mistake in real fieldwork / correct errors / change method; To make sure that students understand instructions / know what to do; To practise working as team; To test fieldwork equipment / bring the recording equipment (pen and paper) / know what equipment to bring; To give an idea of how long it will take / manage time effectively / saves time when doing real fieldwork; 1(d)(i) Plot = public building =10%, open space = 5%, transport = 5%. 2 1 mark for dividing lines at 90 and 95 1 mark for correct shading. 1(d)(ii) Residential is main land use at site 6 but not at site 1 / residential is bigger 4 area or percentage at site 6 / more residential land use at site 6 60% at site 6 & 10% at site 1 / 50% more at site 6. Commercial / shops is main land use at site 1 but not at site 6 / commercial is bigger area or percentage at site 1 / more commercial land use at site 1 50% at site 1 and 5% at site 6 / 45% more at site 1. Commercial is largest land use at site 1 and residential is largest land use at site 6. Commercial is 50% at site 1 & residential is 60% at site 6. Note: Need comparison. 1(d)(iii) Hypothesis is false - 1 mark reserve (HA). 4 Credit 2 statement marks: Residential does not occupy most land at 2 sites / sites 1 or 2 / sites 1 and 2 do not agree with hypothesis / occupies less than half the land at sites 1 and 2 Most land is commercial at sites 1 or 2 . Residential only occupies most land / over half land at 4 sites / sites 3,4,5,6 OR residential occupies most land at sites 3,4,5,6 but not the others / 1 and 2. Credit 1 mark maximum for a site where residential does not occupy most land / sites 1 or 2: e.g. residential = 10% at site 1; e.g. commercial at site 1 = 50%. Accept distances as alternative to site numbers. Hypothesis is true / partly true = XHA. Credit relevant evidence which supports the correct conclusion of false. If no hypothesis conclusion ^HA & credit evidence which supports the correct conclusion of false. 1(d)(iv) No credit for partly true. 3 Industrial land increases from site 1 / 100 m to site 6 / 2000 m / overall / highest at site 6; Industrial land increases from site 1 to 3, decreases to site 4 and 5, increases to site 6 / increases except for sites 4 and 5. Accept distances as alternative to site numbers. Credit 1 mark for paired data from any two sites to agree with hypothesis (show increase) e.g. 0% at site 1 and 15% at site 6 / by 15%. Credit 1 mark for paired data from any two sites to disprove hypothesis (show decrease) e.g. 10% at site 3 and 0% at site 5 / by 10%. Credit 2 marks maximum for either statement or data. If candidate answers that hypothesis is false / true, credit relevant evidence which supports the correct conclusion of partly true. 1(d)(v) Ideas such as: 4 Cities grown outwards / develop over time; Access to transport – road / rail / air / river / accessibility / fewer transport links; Competition for land / bid rent; Cost of land / land is cheaper out of city centre / CBD is most expensive; Availability of land / amount of space / more land available away from city centre; Planning policy affects land use. Note: Credit 1 mark for each idea + 1 mark for development which refers to a specific land use OR 4 1 mark. 1(e) Possible methods include bi-polar survey, questionnaire survey, interview, 4 ‘measuring’. Credit 2 marks maximum for general ideas: Select / locate fieldwork sites / go to sites; Record results / record score / put results on a recording sheet or table / tally; Sampling / randomly / systematically / every 10th person / every 50 m. Bi-polar survey / environmental quality index: Produce a bi-polar survey sheet; Use agreed categories / descriptions (including vegetation); Agree on what descriptions mean / do a pilot or practice survey; Use a scale / –3 to +3; Agree on time of survey / all surveys done at same time; Circle the location; Look at / observe each feature; Make a decision about / agree the score for each feature; Put a tick / record score in the appropriate row / box; Take photos – must be qualified. Questionnaire survey / interview / ask people what they think: Credit examples of questions (2 marks maximum): e.g. Which part of the city is noisiest / dirtiest? Which area of the city is most polluted? Ask people to mark on a map of the city where the air is more polluted / where the river is polluted / where the landscape is unattractive etc. Measure air / noise / water / visual pollution / street furniture; Count pieces of litter; Use an air pollution index e.g. PM 2.5; Credit measuring methodology (2 marks maximum); Take photos – must be qualified.
Q2 · Students in southern England did fieldwork on a local river to investigate how it changed…
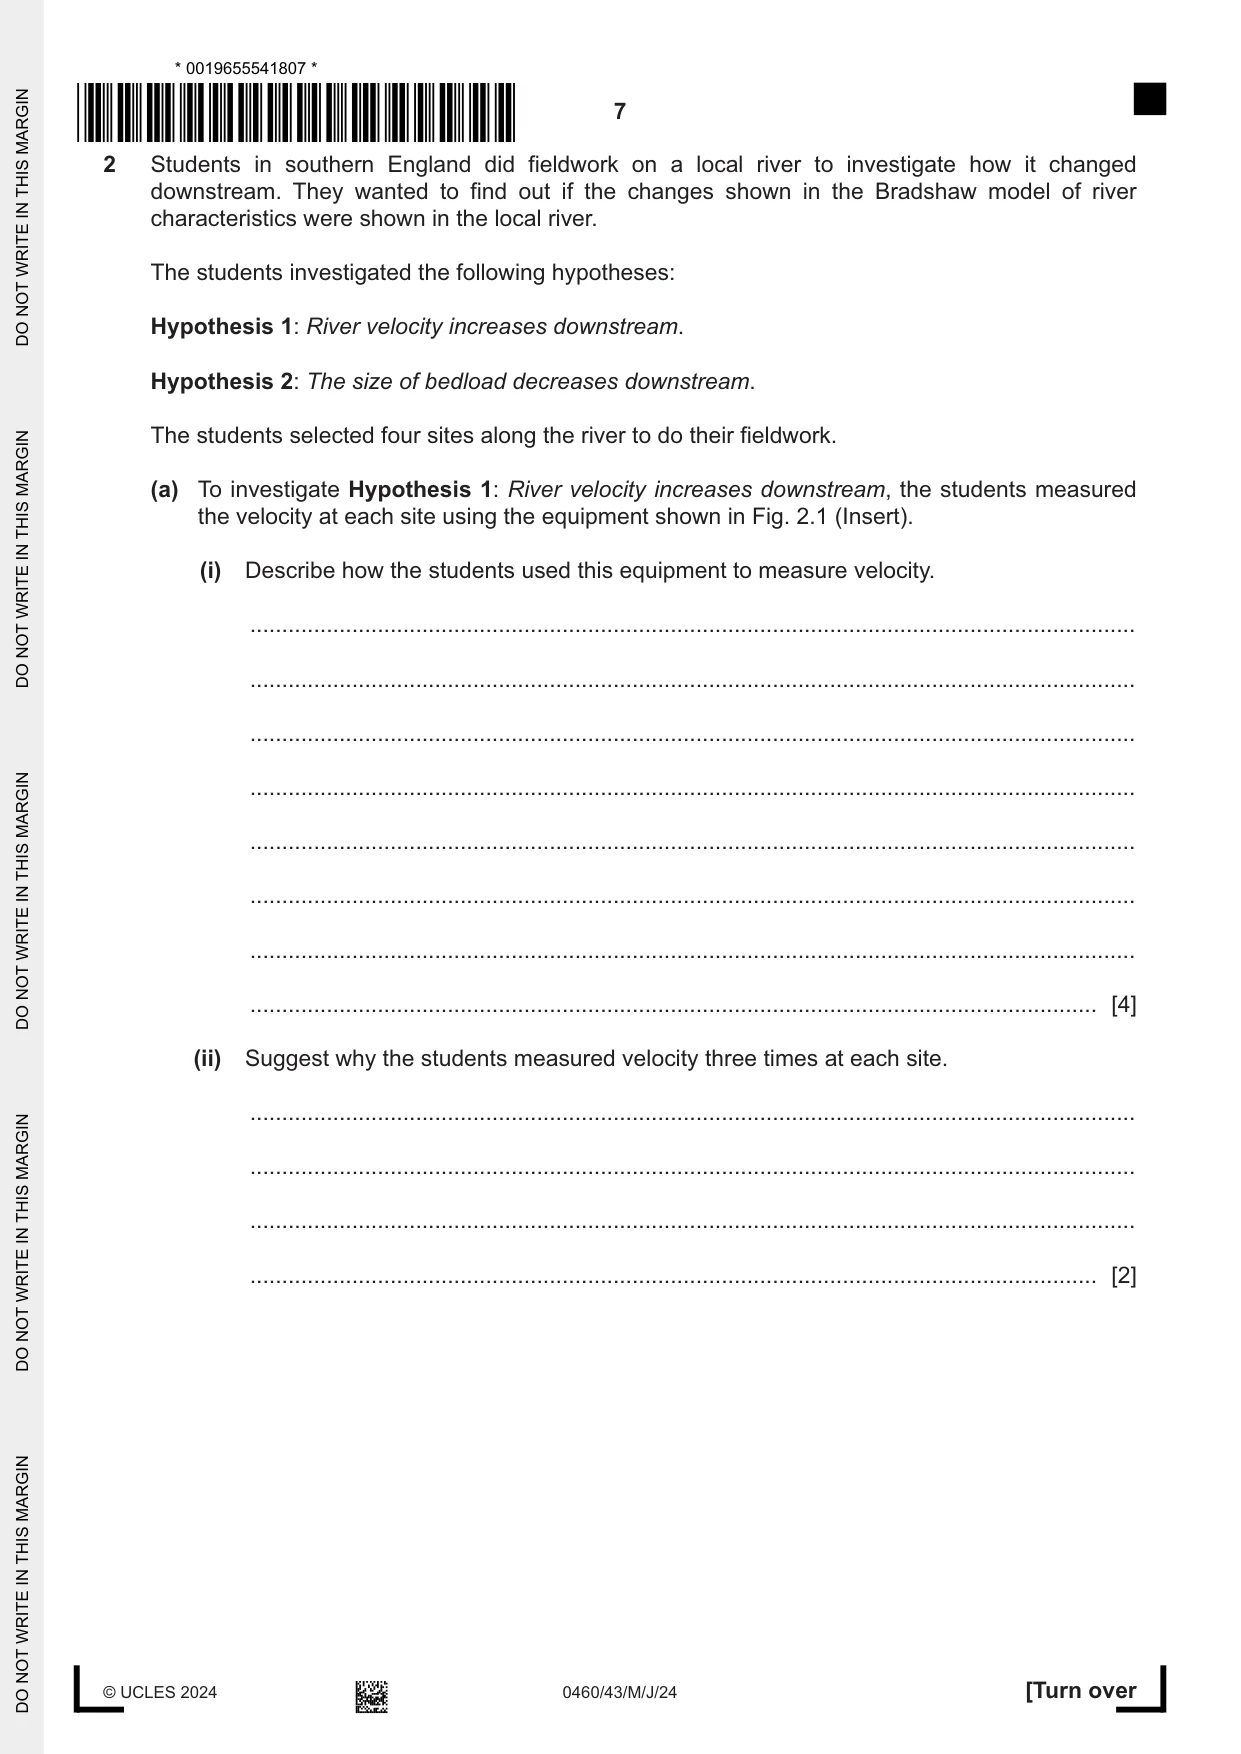
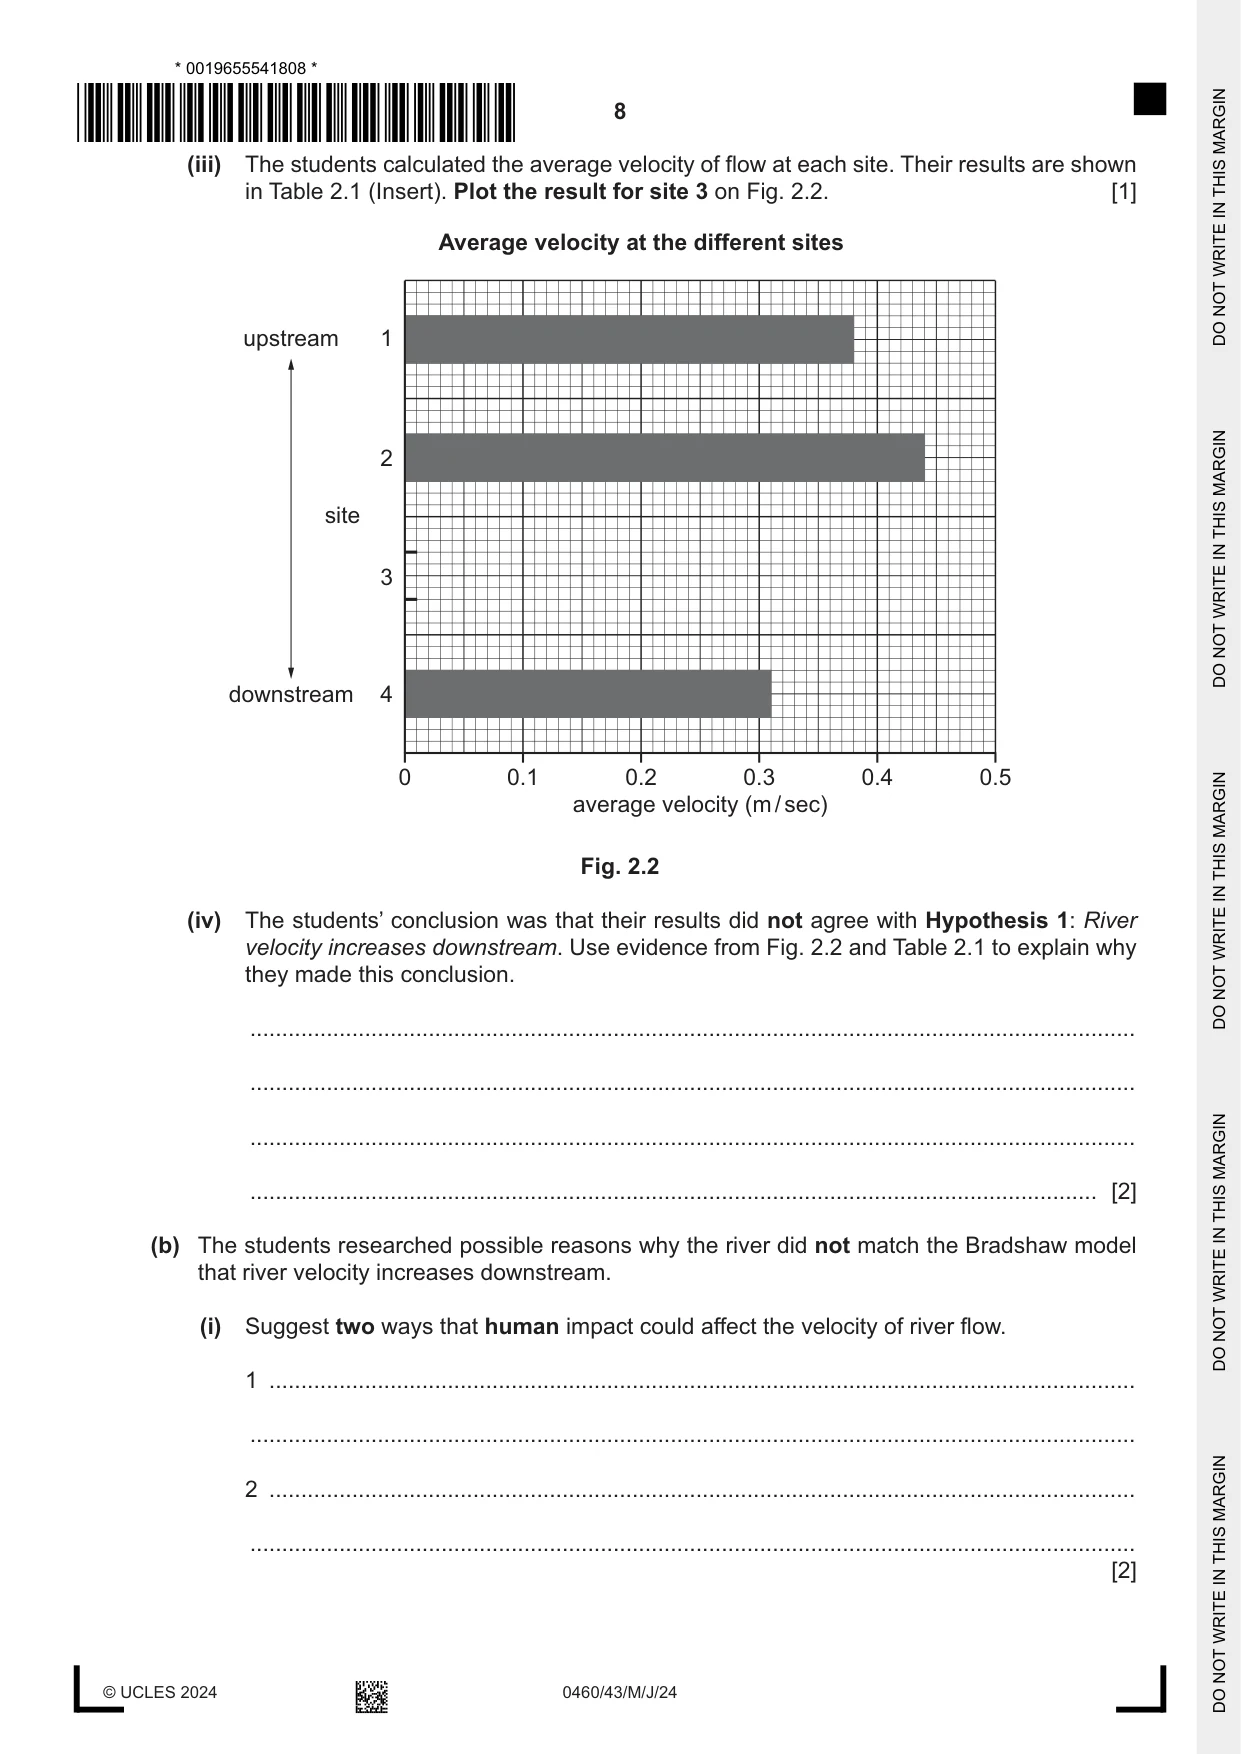
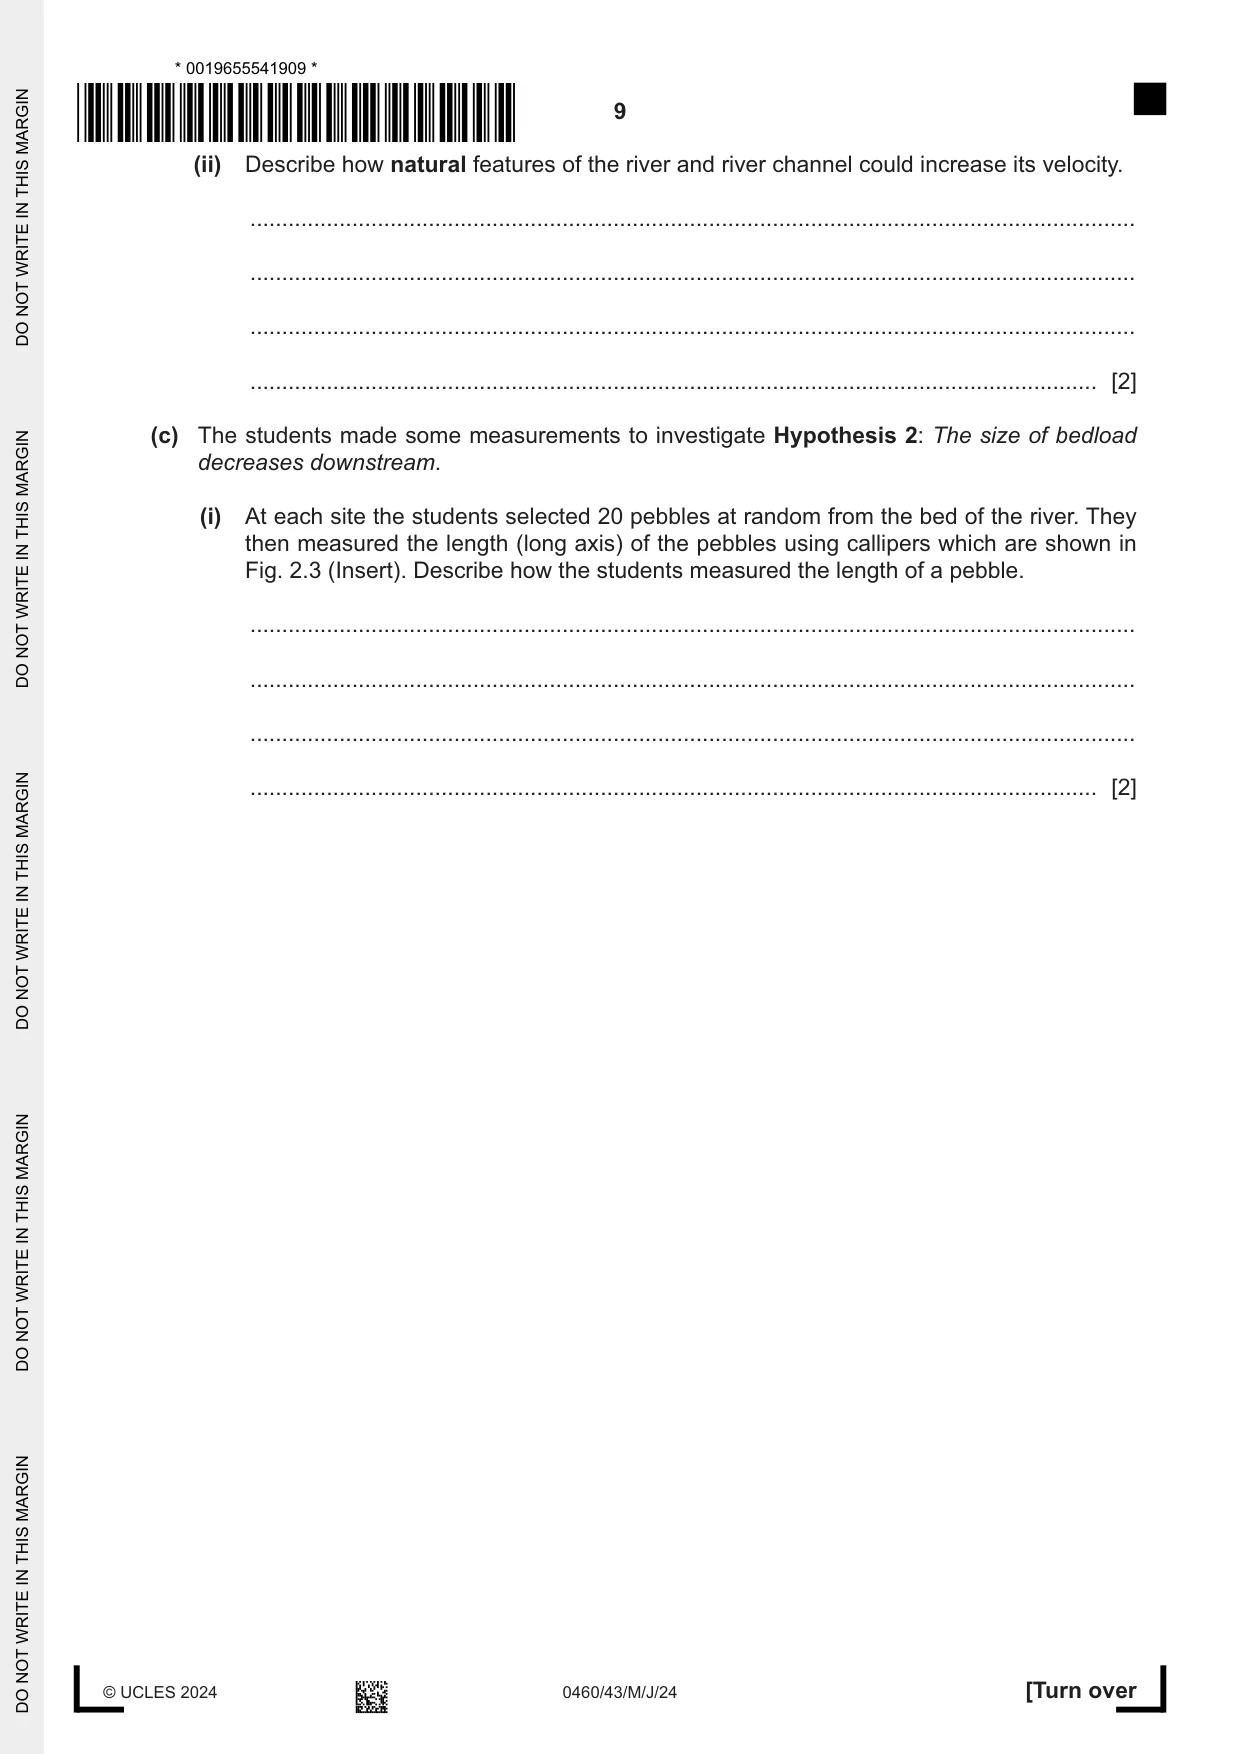
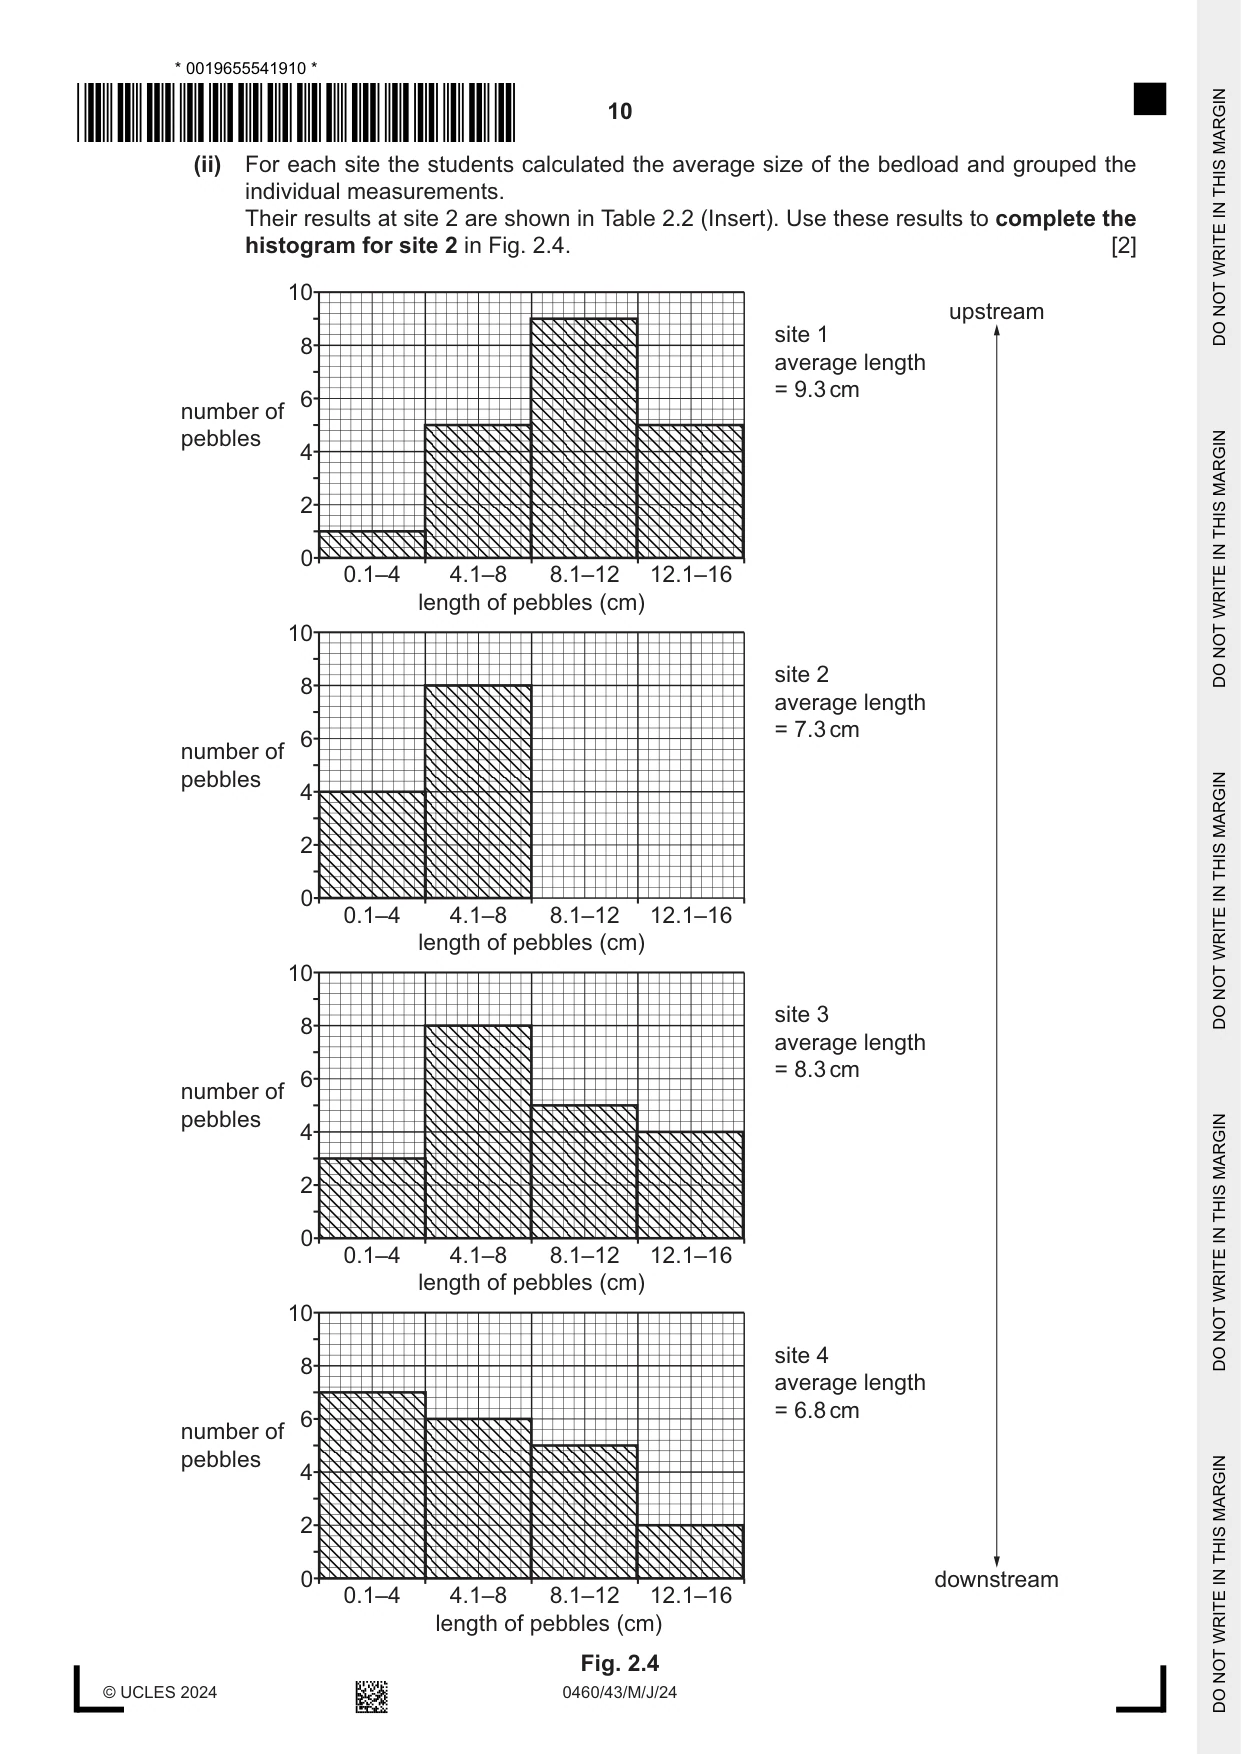
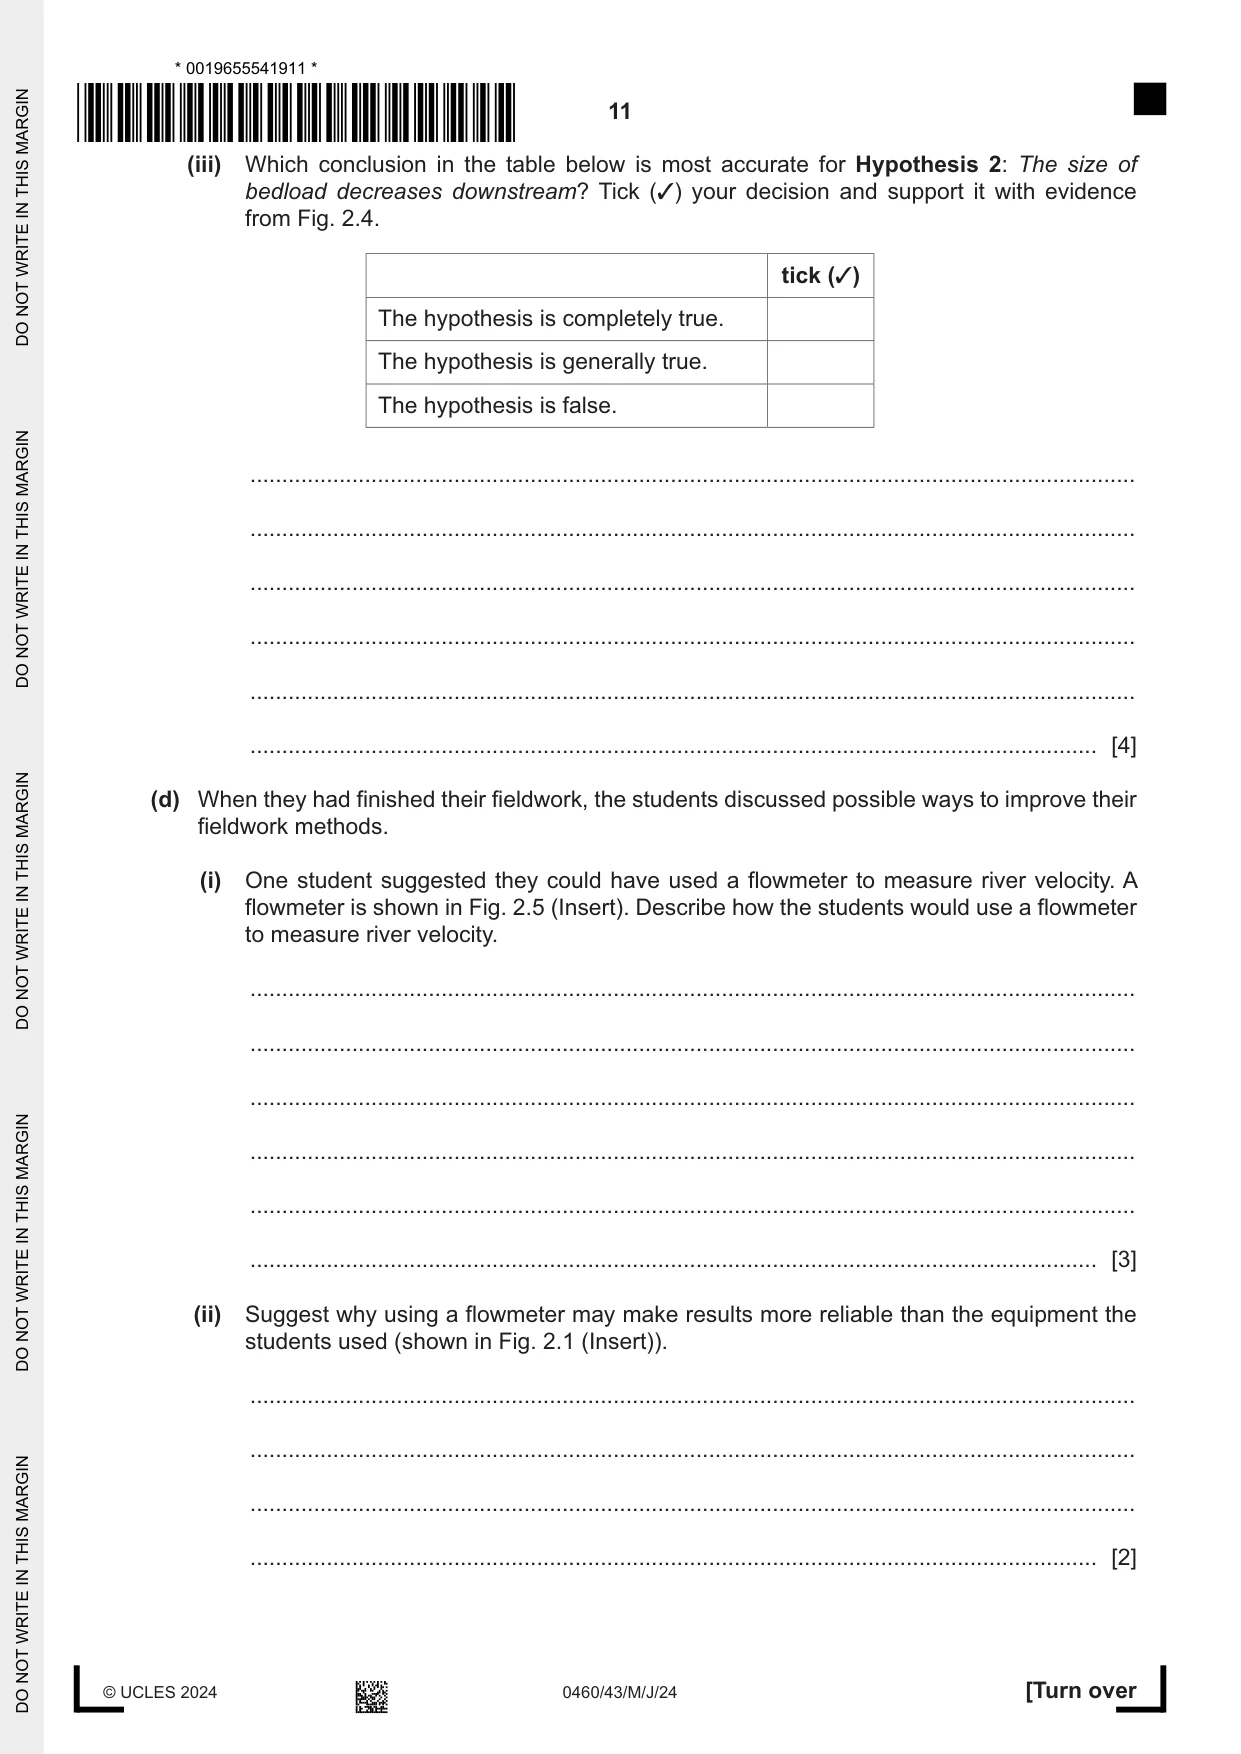
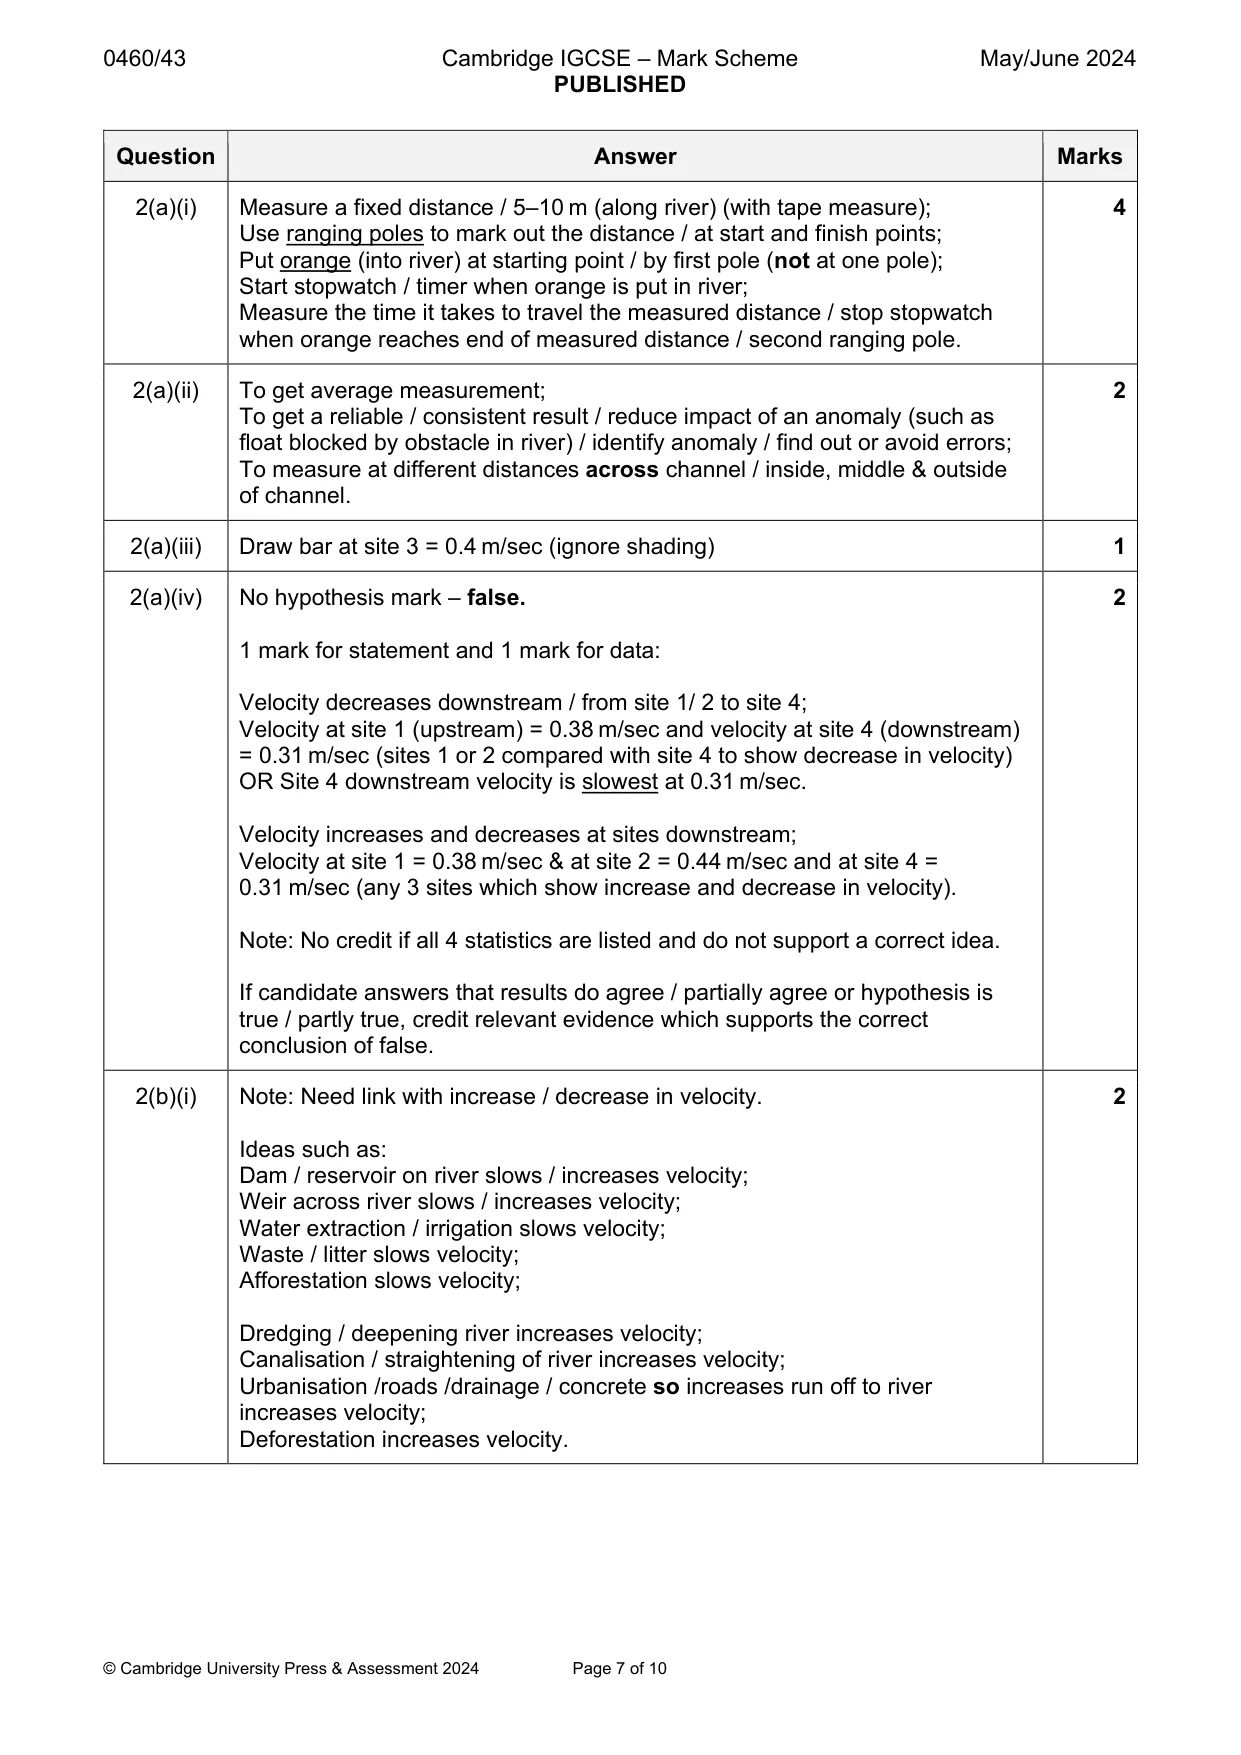
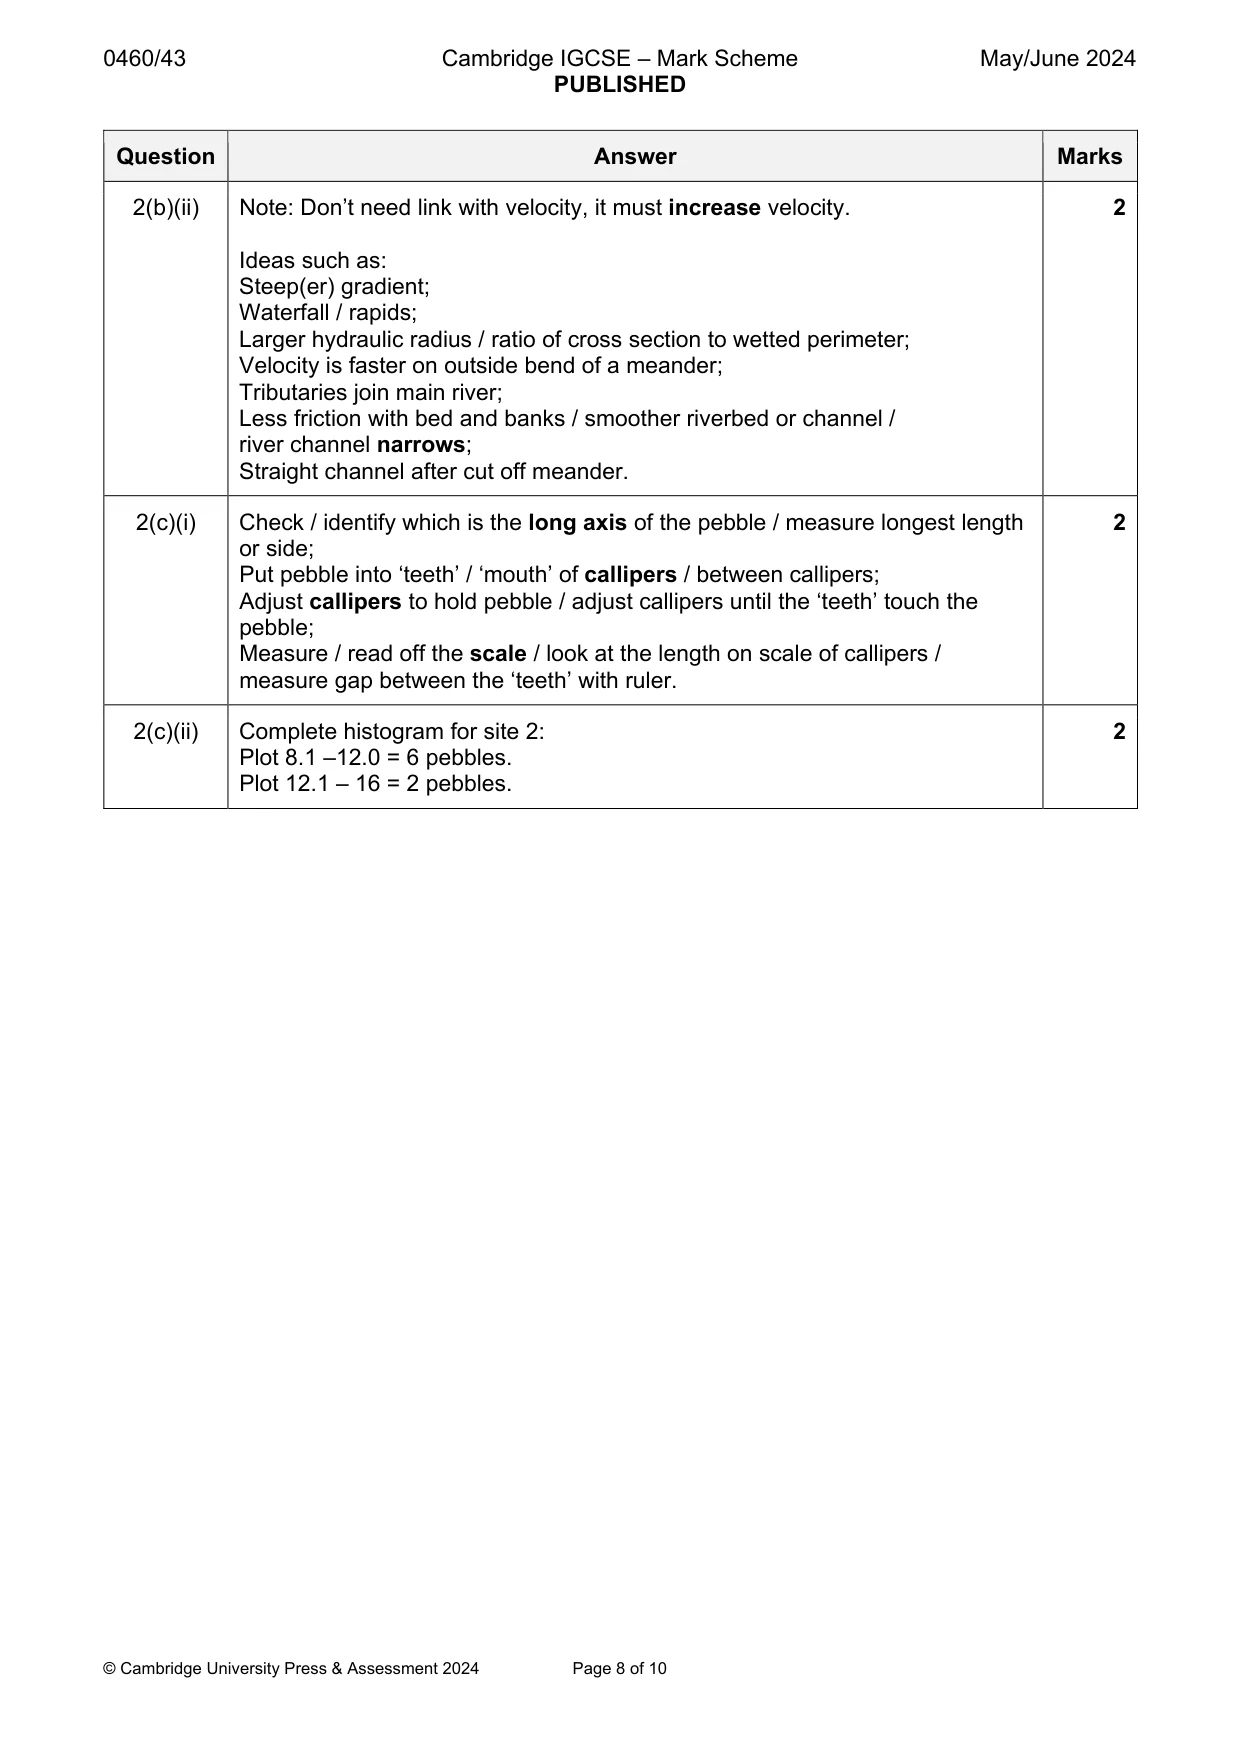
2 Students in southern England did fieldwork on a local river to investigate how it changed downstream. They wanted to find out if the changes shown in the Bradshaw model of river characteristics were shown in the local river. The students investigated the following hypotheses: Hypothesis 1: River velocity increases downstream. Hypothesis 2: The size of bedload decreases downstream. The students selected four sites along the river to do their fieldwork. (a) To investigate Hypothesis 1: River velocity increases downstream, the students measured the velocity at each site using the equipment shown in Fig. 2.1 (Insert). (i) Describe how the students used this equipment to measure velocity. ........................................................................................................................................... ........................................................................................................................................... ........................................................................................................................................... ........................................................................................................................................... ........................................................................................................................................... ........................................................................................................................................... ........................................................................................................................................... ..................................................................................................................................... [4] (ii) Suggest why the students measured velocity three times at each site. ........................................................................................................................................... ........................................................................................................................................... ........................................................................................................................................... ..................................................................................................................................... [2] (iii) The students calculated the average velocity of flow at each site. Their results are shown in Table 2.1 (Insert). Plot the result for site 3 on Fig. 2.2. [1] Average velocity at the different sites upstream 1 2 site 3 downstream 4 0 0.1 0.2 0.3 0.4 0.5 average velocity (m / sec) Fig. 2.2 (iv) The students’ conclusion was that their results did not agree with Hypothesis 1: River velocity increases downstream. Use evidence from Fig. 2.2 and Table 2.1 to explain why they made this conclusion. ........................................................................................................................................... ........................................................................................................................................... ........................................................................................................................................... ..................................................................................................................................... [2] (b) The students researched possible reasons why the river did not match the Bradshaw model that river velocity increases downstream. (i) Suggest two ways that human impact could affect the velocity of river flow. 1 ........................................................................................................................................ ........................................................................................................................................... 2 ........................................................................................................................................ ........................................................................................................................................... [2] (ii) Describe how natural features of the river and river channel could increase its velocity. ........................................................................................................................................... ........................................................................................................................................... ........................................................................................................................................... ..................................................................................................................................... [2] (c) The students made some measurements to investigate Hypothesis 2: The size of bedload decreases downstream. (i) At each site the students selected 20 pebbles at random from the bed of the river. They then measured the length (long axis) of the pebbles using callipers which are shown in Fig. 2.3 (Insert). Describe how the students measured the length of a pebble. ........................................................................................................................................... ........................................................................................................................................... ........................................................................................................................................... ..................................................................................................................................... [2]
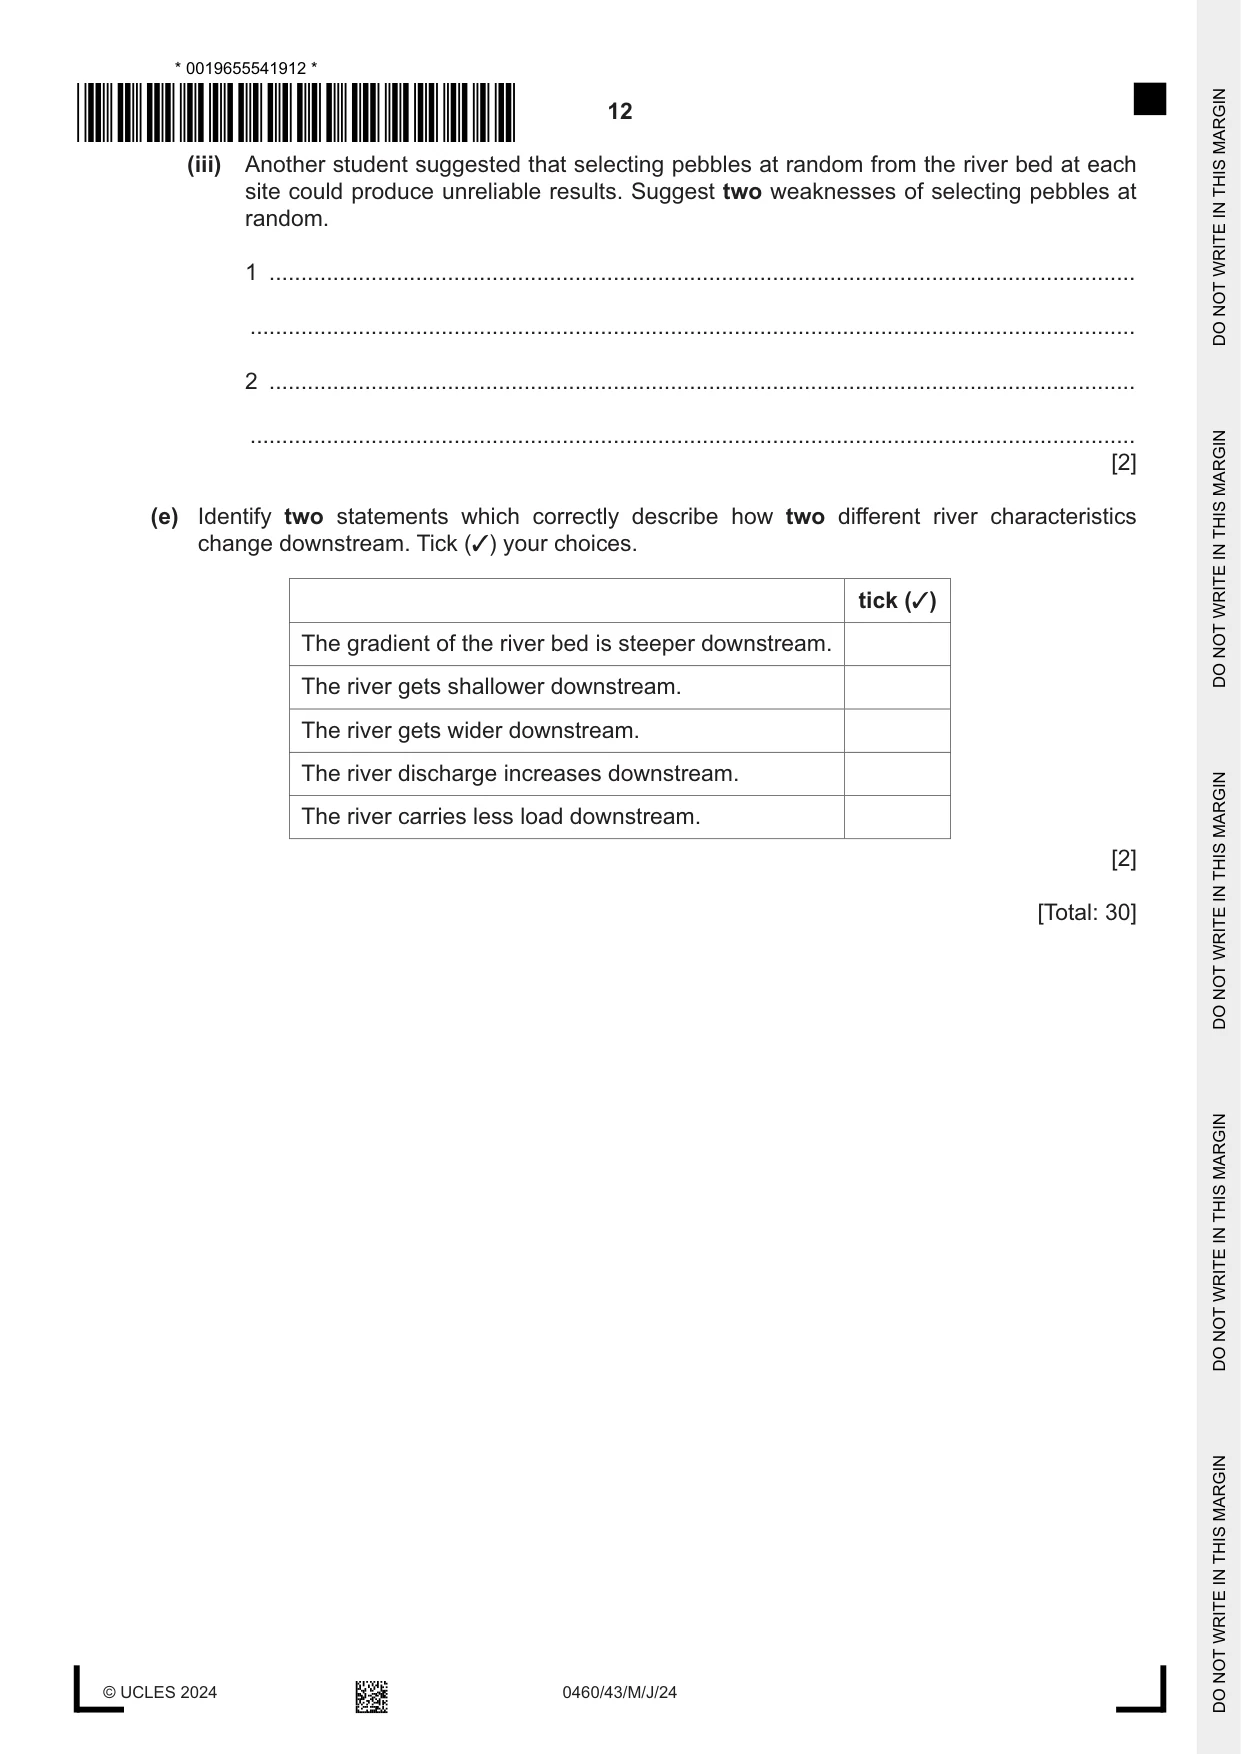
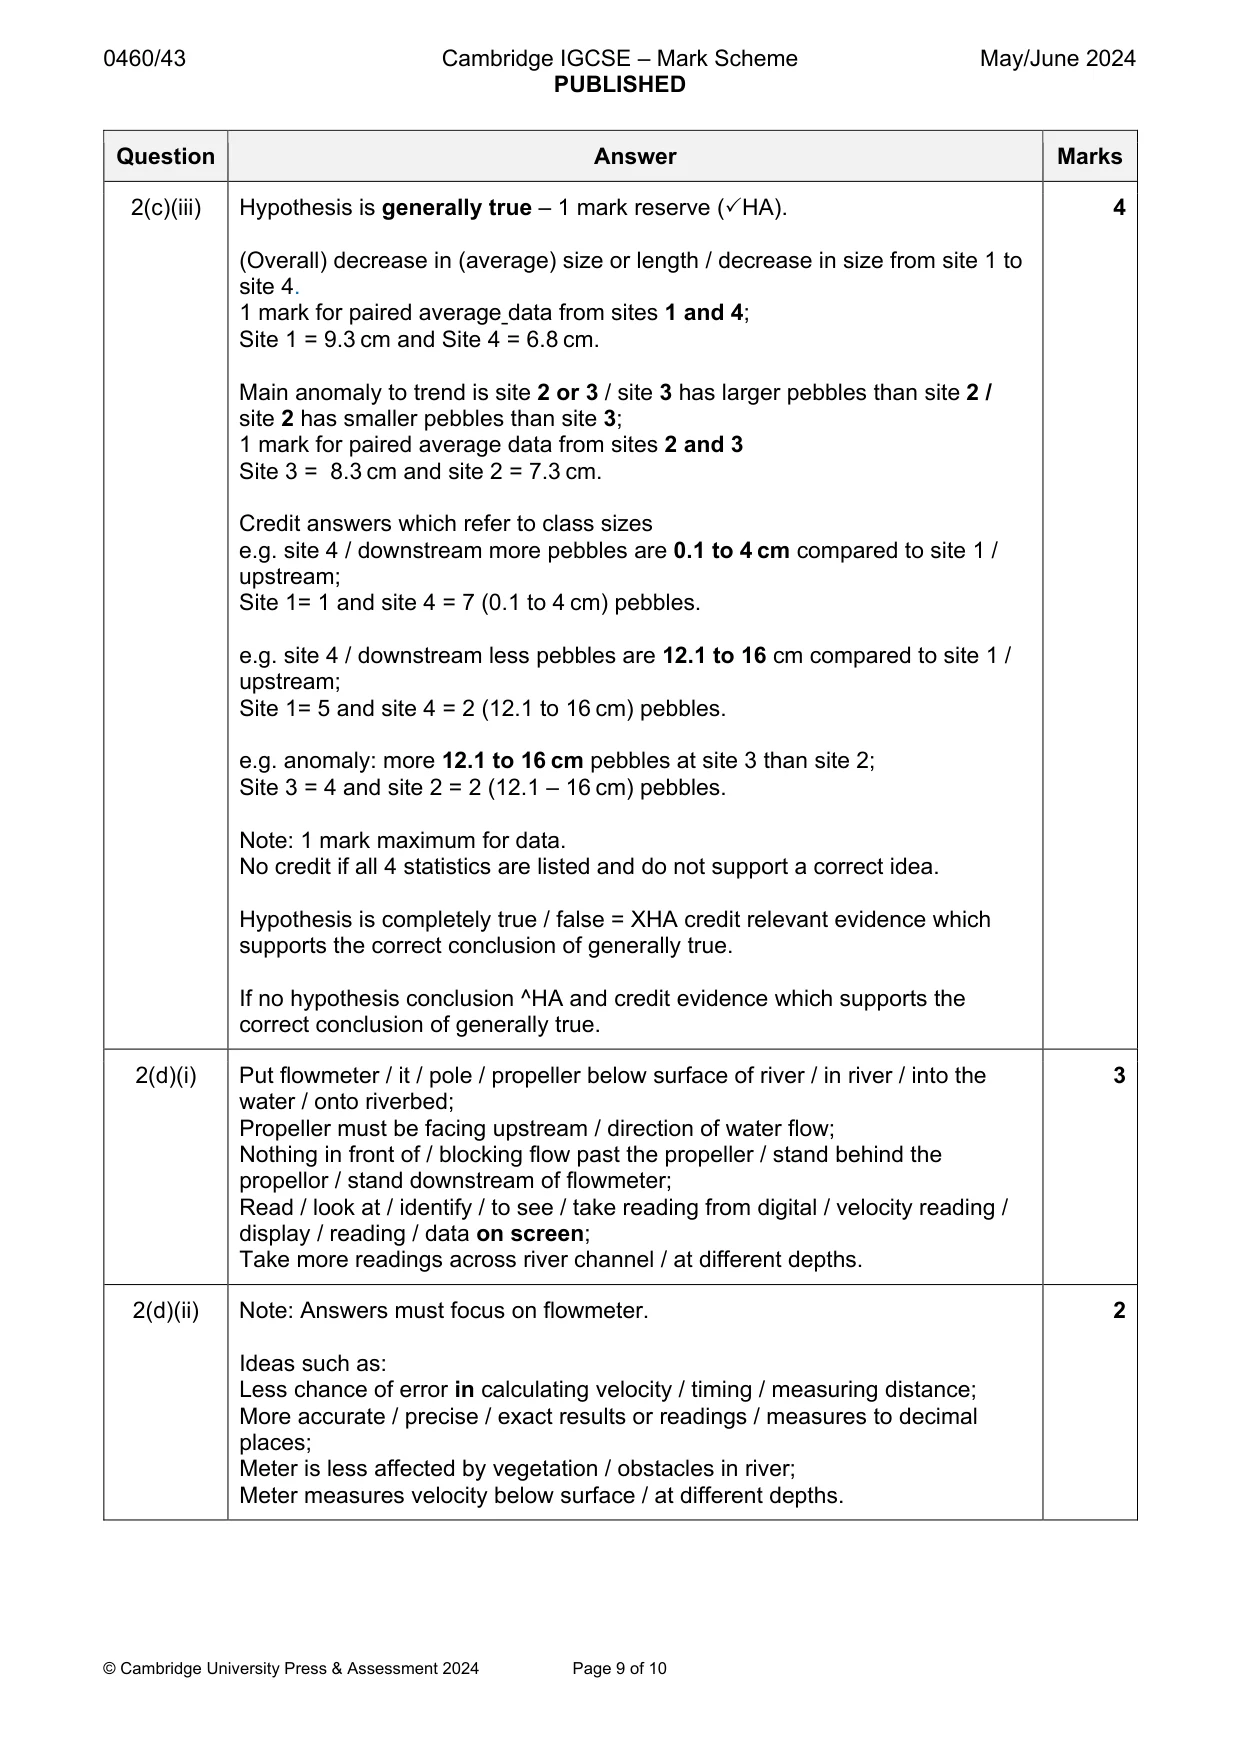
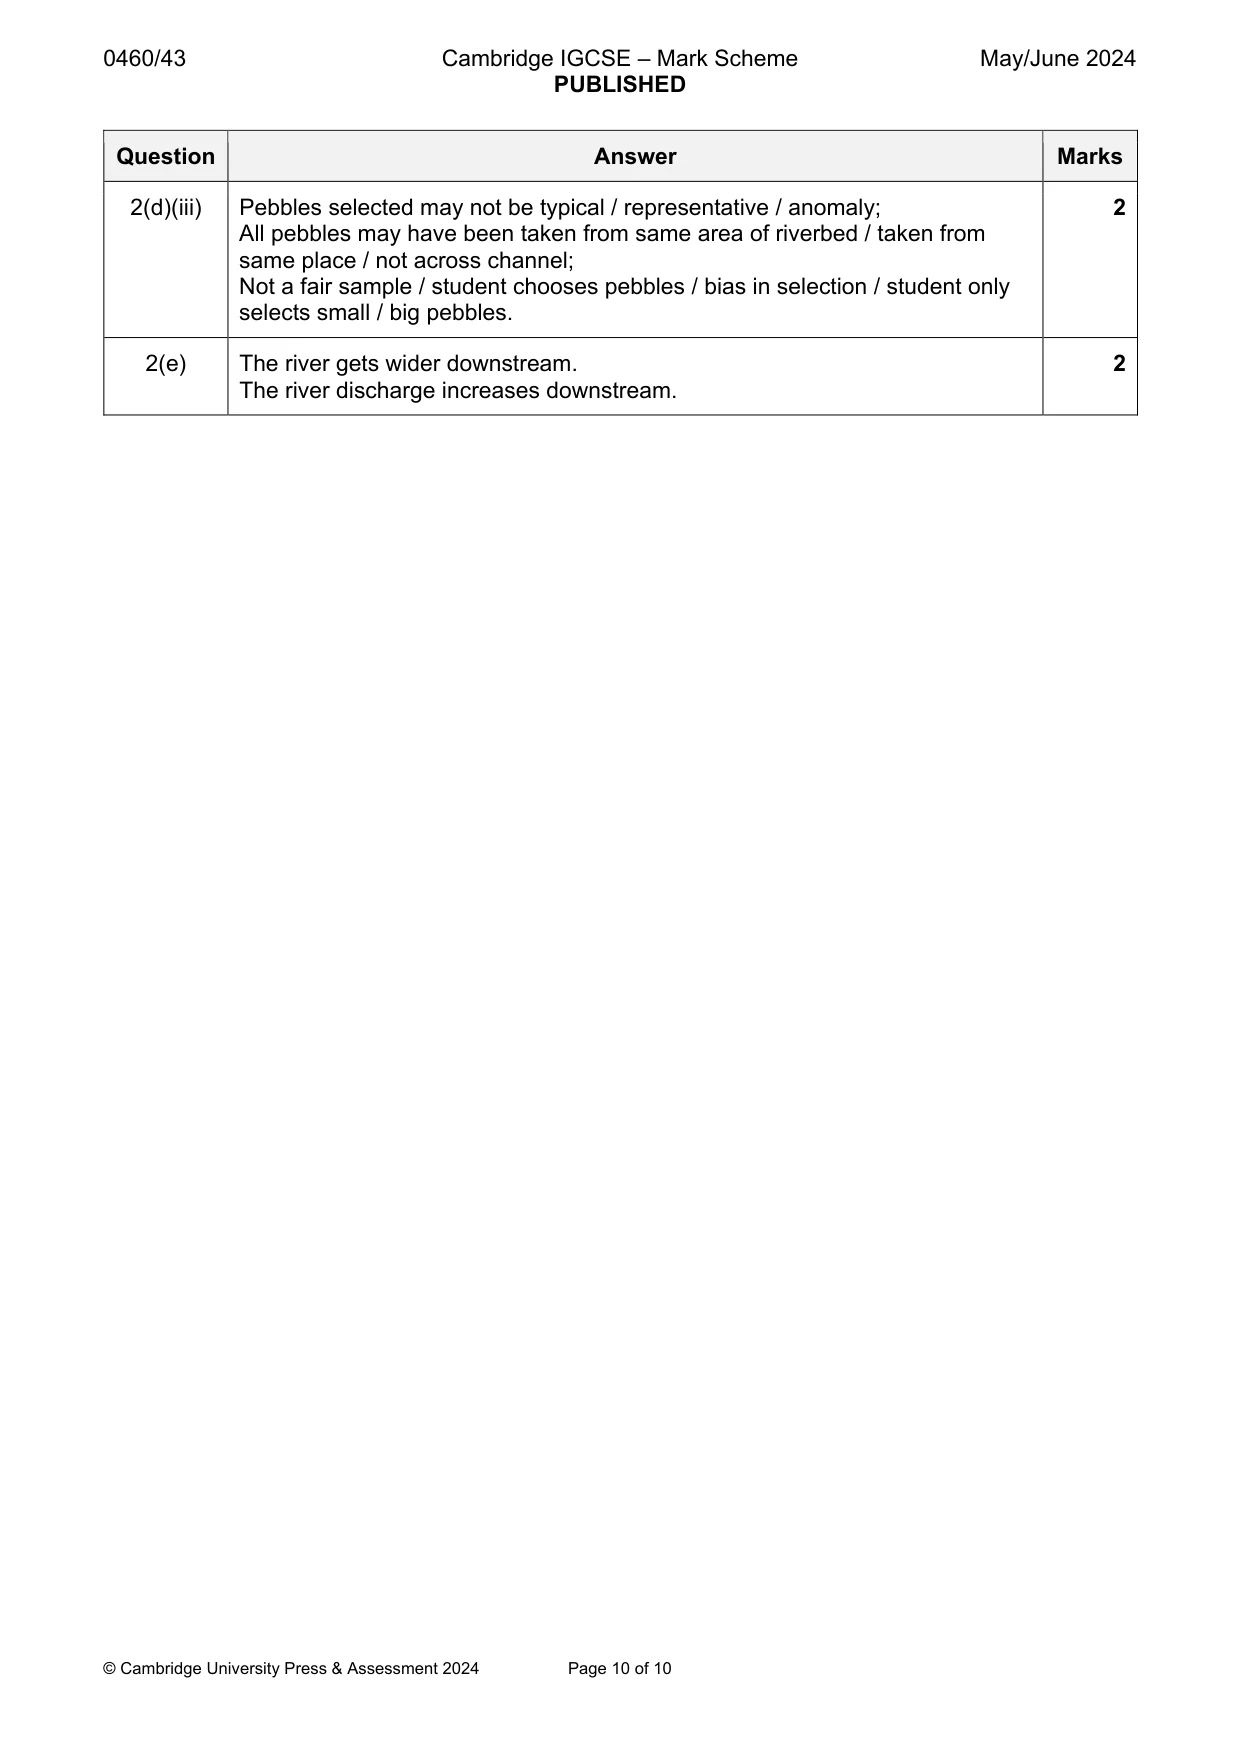
Mark scheme: 2(a)(i) Measure a fixed distance / 5–10 m (along river) (with tape measure); 4 Use ranging poles to mark out the distance / at start and finish points; Put orange (into river) at starting point / by first pole (not at one pole); Start stopwatch / timer when orange is put in river; Measure the time it takes to travel the measured distance / stop stopwatch when orange reaches end of measured distance / second ranging pole. 2(a)(ii) To get average measurement; 2 To get a reliable / consistent result / reduce impact of an anomaly (such as float blocked by obstacle in river) / identify anomaly / find out or avoid errors; To measure at different distances across channel / inside, middle & outside of channel. 2(a)(iii) Draw bar at site 3 = 0.4 m/sec (ignore shading) 1 2(a)(iv) No hypothesis mark – false. 2 1 mark for statement and 1 mark for data: Velocity decreases downstream / from site 1/ 2 to site 4; Velocity at site 1 (upstream) = 0.38 m/sec and velocity at site 4 (downstream) = 0.31 m/sec (sites 1 or 2 compared with site 4 to show decrease in velocity) OR Site 4 downstream velocity is slowest at 0.31 m/sec. Velocity increases and decreases at sites downstream; Velocity at site 1 = 0.38 m/sec & at site 2 = 0.44 m/sec and at site 4 = 0.31 m/sec (any 3 sites which show increase and decrease in velocity). Note: No credit if all 4 statistics are listed and do not support a correct idea. If candidate answers that results do agree / partially agree or hypothesis is true / partly true, credit relevant evidence which supports the correct conclusion of false. 2(b)(i) Note: Need link with increase / decrease in velocity. 2 Ideas such as: Dam / reservoir on river slows / increases velocity; Weir across river slows / increases velocity; Water extraction / irrigation slows velocity; Waste / litter slows velocity; Afforestation slows velocity; Dredging / deepening river increases velocity; Canalisation / straightening of river increases velocity; Urbanisation /roads /drainage / concrete so increases run off to river increases velocity; Deforestation increases velocity. 2(b)(ii) Note: Don’t need link with velocity, it must increase velocity. 2 Ideas such as: Steep(er) gradient; Waterfall / rapids; Larger hydraulic radius / ratio of cross section to wetted perimeter; Velocity is faster on outside bend of a meander; Tributaries join main river; Less friction with bed and banks / smoother riverbed or channel / river channel narrows; Straight channel after cut off meander. 2(c)(i) Check / identify which is the long axis of the pebble / measure longest length 2 or side; Put pebble into ‘teeth’ / ‘mouth’ of callipers / between callipers; Adjust callipers to hold pebble / adjust callipers until the ‘teeth’ touch the pebble; Measure / read off the scale / look at the length on scale of callipers / measure gap between the ‘teeth’ with ruler. 2(c)(ii) Complete histogram for site 2: 2 Plot 8.1 –12.0 = 6 pebbles. Plot 12.1 – 16 = 2 pebbles. 2(c)(iii) Hypothesis is generally true – 1 mark reserve (HA). 4 (Overall) decrease in (average) size or length / decrease in size from site 1 to site 4. 1 mark for paired average data from sites 1 and 4; Site 1 = 9.3 cm and Site 4 = 6.8 cm. Main anomaly to trend is site 2 or 3 / site 3 has larger pebbles than site 2 / site 2 has smaller pebbles than site 3; 1 mark for paired average data from sites 2 and 3 Site 3 = 8.3 cm and site 2 = 7.3 cm. Credit answers which refer to class sizes e.g. site 4 / downstream more pebbles are 0.1 to 4 cm compared to site 1 / upstream; Site 1= 1 and site 4 = 7 (0.1 to 4 cm) pebbles. e.g. site 4 / downstream less pebbles are 12.1 to 16 cm compared to site 1 / upstream; Site 1= 5 and site 4 = 2 (12.1 to 16 cm) pebbles. e.g. anomaly: more 12.1 to 16 cm pebbles at site 3 than site 2; Site 3 = 4 and site 2 = 2 (12.1 – 16 cm) pebbles. Note: 1 mark maximum for data. No credit if all 4 statistics are listed and do not support a correct idea. Hypothesis is completely true / false = XHA credit relevant evidence which supports the correct conclusion of generally true. If no hypothesis conclusion ^HA and credit evidence which supports the correct conclusion of generally true. 2(d)(i) Put flowmeter / it / pole / propeller below surface of river / in river / into the 3 water / onto riverbed; Propeller must be facing upstream / direction of water flow; Nothing in front of / blocking flow past the propeller / stand behind the propellor / stand downstream of flowmeter; Read / look at / identify / to see / take reading from digital / velocity reading / display / reading / data on screen; Take more readings across river channel / at different depths. 2(d)(ii) Note: Answers must focus on flowmeter. 2 Ideas such as: Less chance of error in calculating velocity / timing / measuring distance; More accurate / precise / exact results or readings / measures to decimal places; Meter is less affected by vegetation / obstacles in river; Meter measures velocity below surface / at different depths. 2(d)(iii) Pebbles selected may not be typical / representative / anomaly; 2 All pebbles may have been taken from same area of riverbed / taken from same place / not across channel; Not a fair sample / student chooses pebbles / bias in selection / student only selects small / big pebbles. 2(e) The river gets wider downstream. 2 The river discharge increases downstream.
What was in this paper
The subtopics covered by these 2 questions, and how many questions each got. Open one in a new tab to see every Cambridge question on it.
What you needed in this session
Cambridge’s own grade thresholds for 2024 May/June, Paper 4 · Variant 3. A higher threshold means an easier paper — the bar moves with how the cohort did.