Cambridge IGCSE Geography 0460 — 2024 Oct/Nov Paper 4 · Variant 3
0460/43/O/N/24 · 2 questions · 60 marks · ≈68 min
The question paper and its mark scheme, free to read here and free to download. This is Cambridge’s own paper, exactly as it was sat.
Question paper20 pages
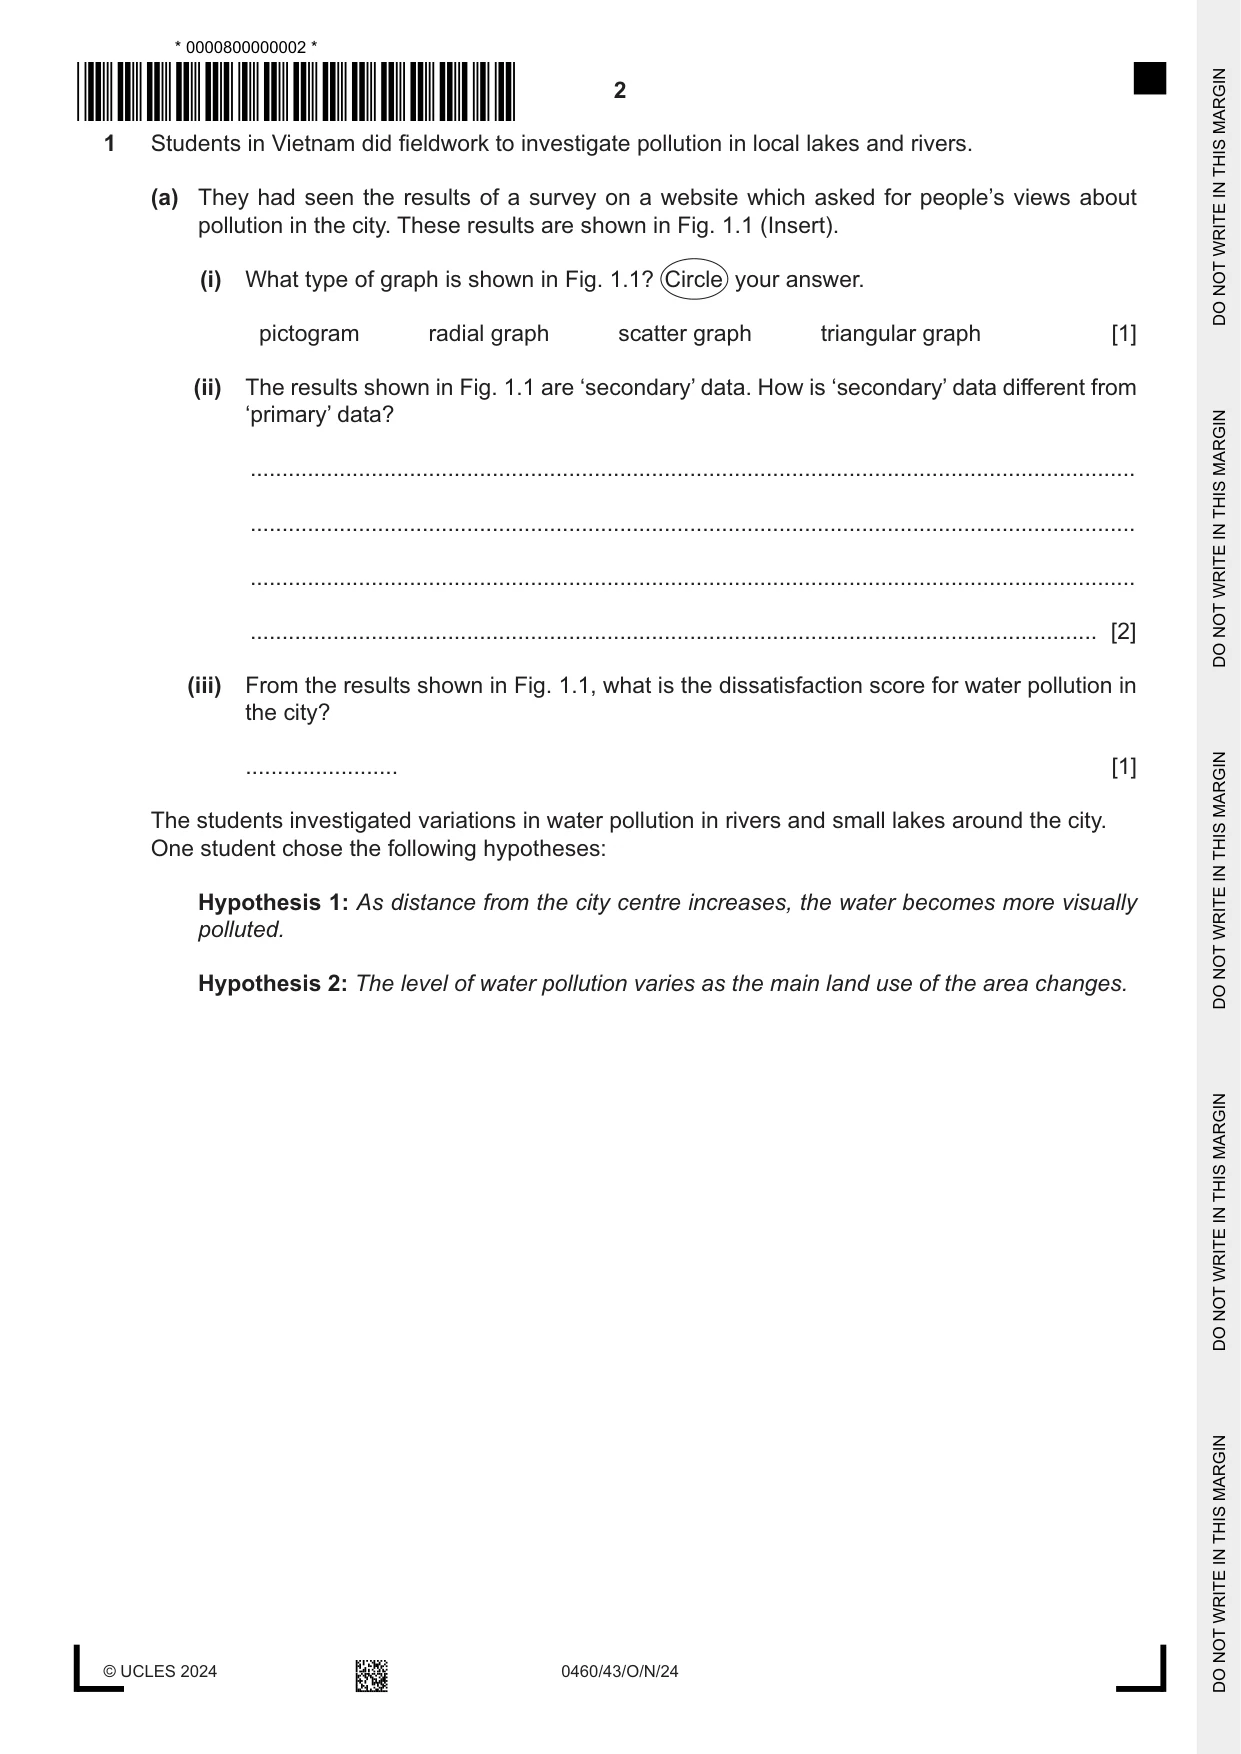
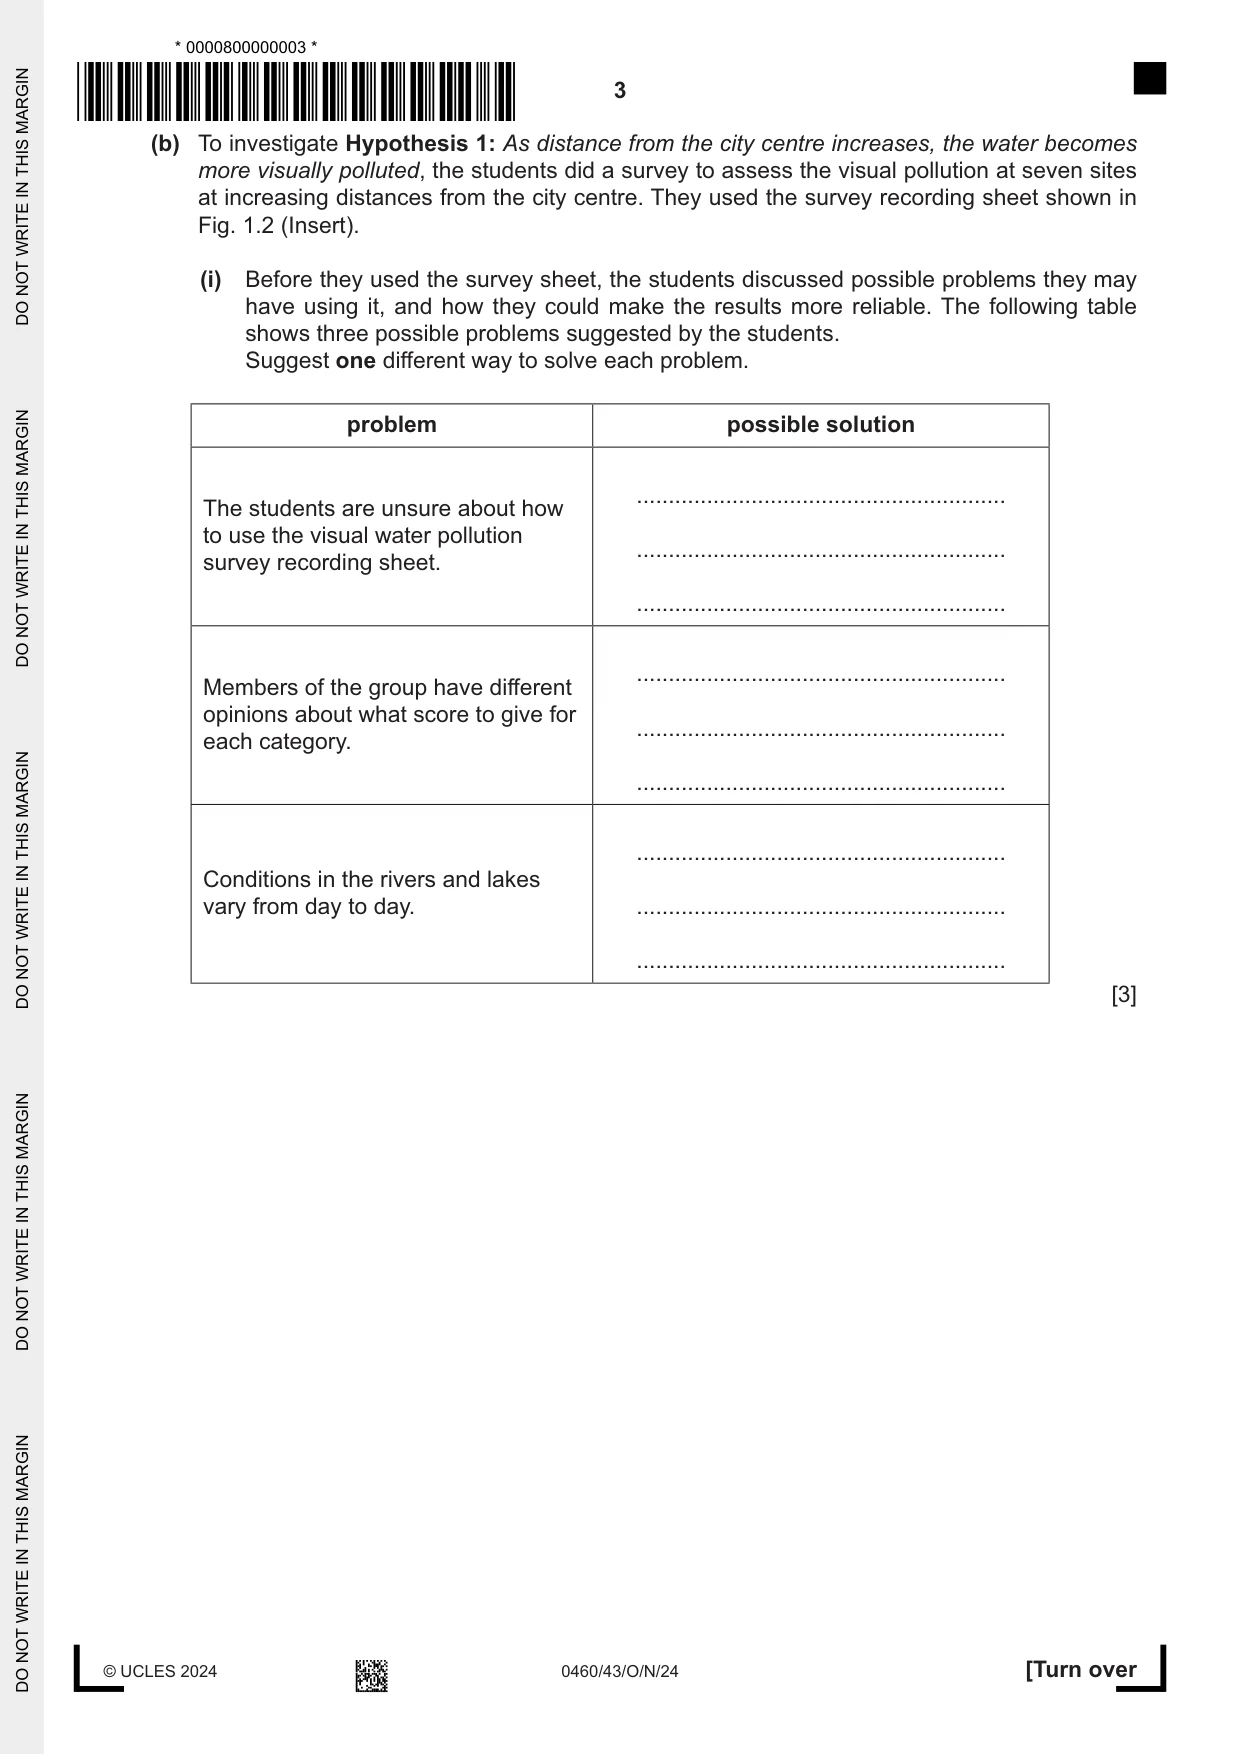
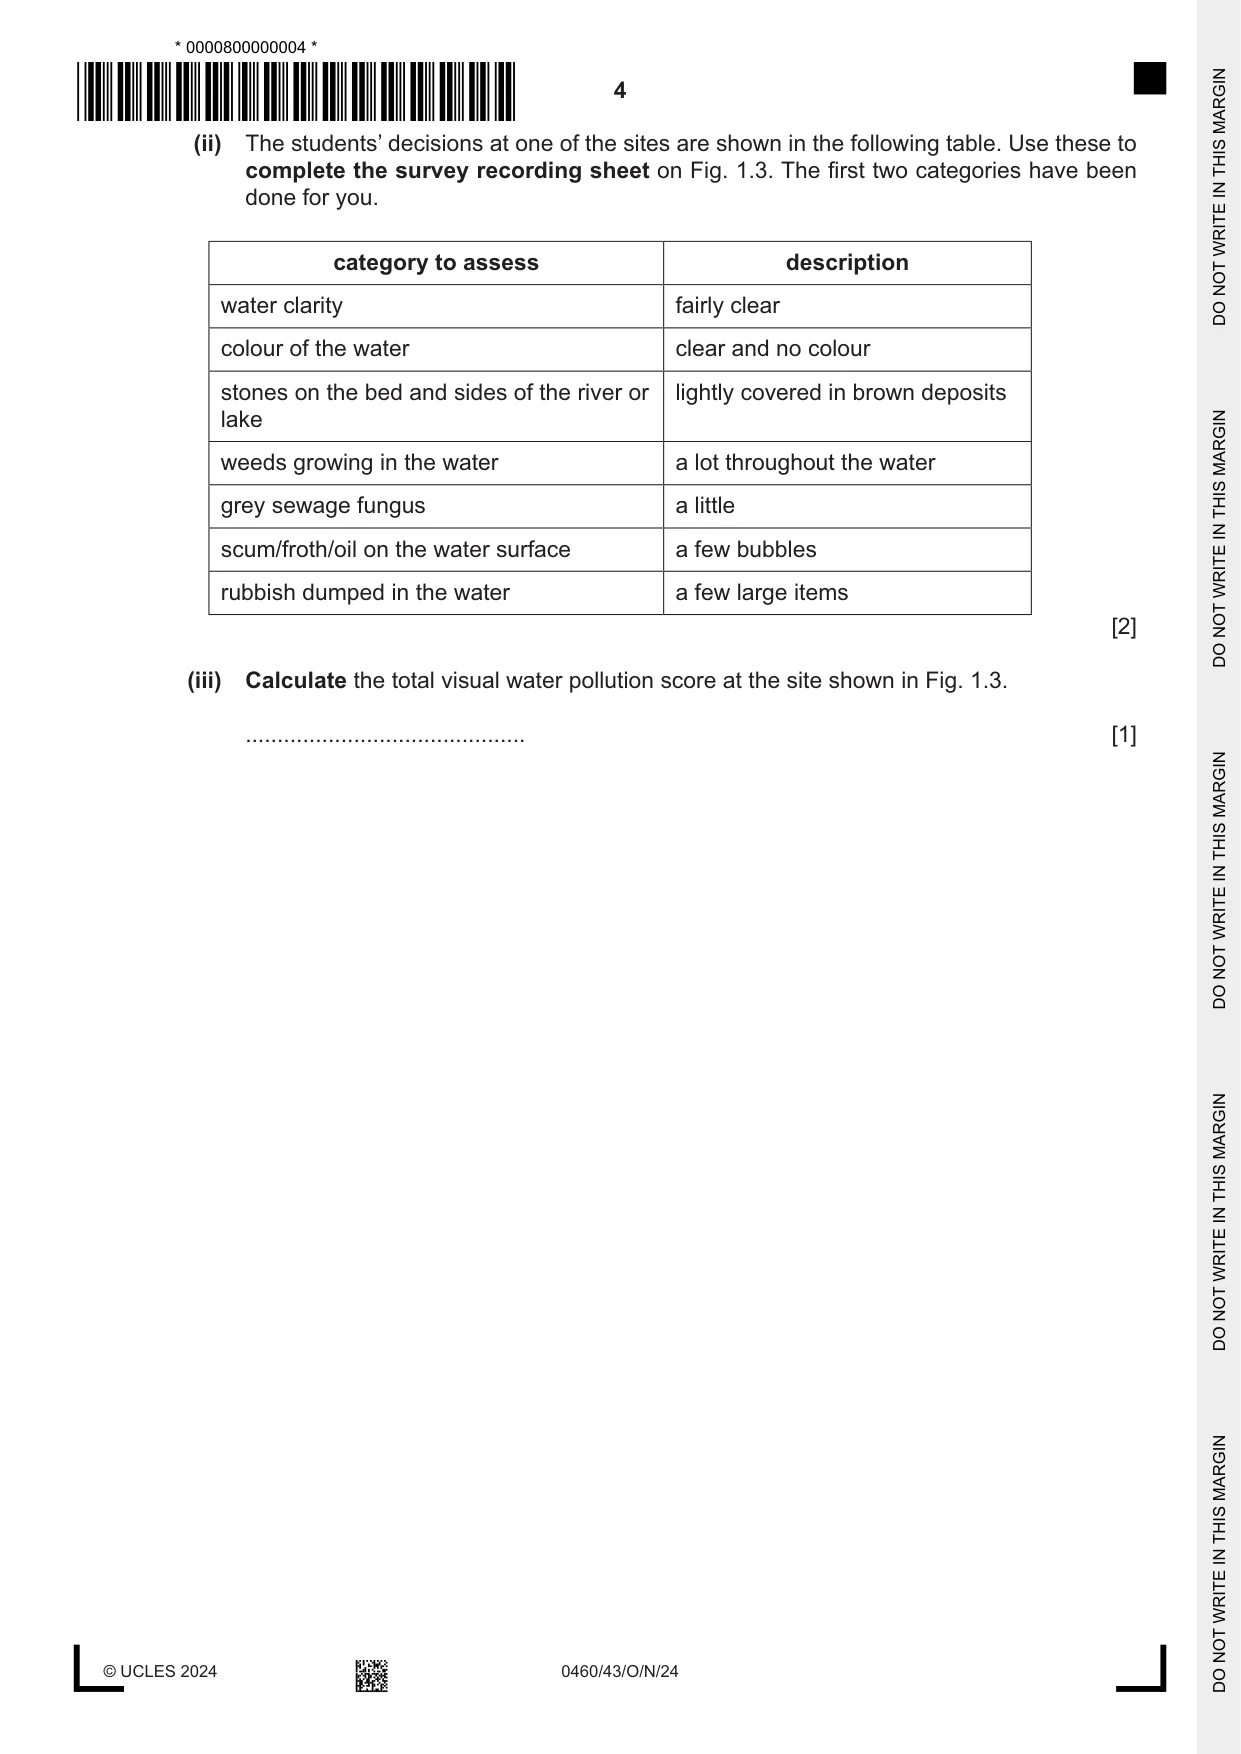



Mark scheme12 pages
Answers below. Sit the paper first if you are practising.
Questions as text
Q1 · Students in Vietnam did fieldwork to investigate pollution in local lakes and rivers
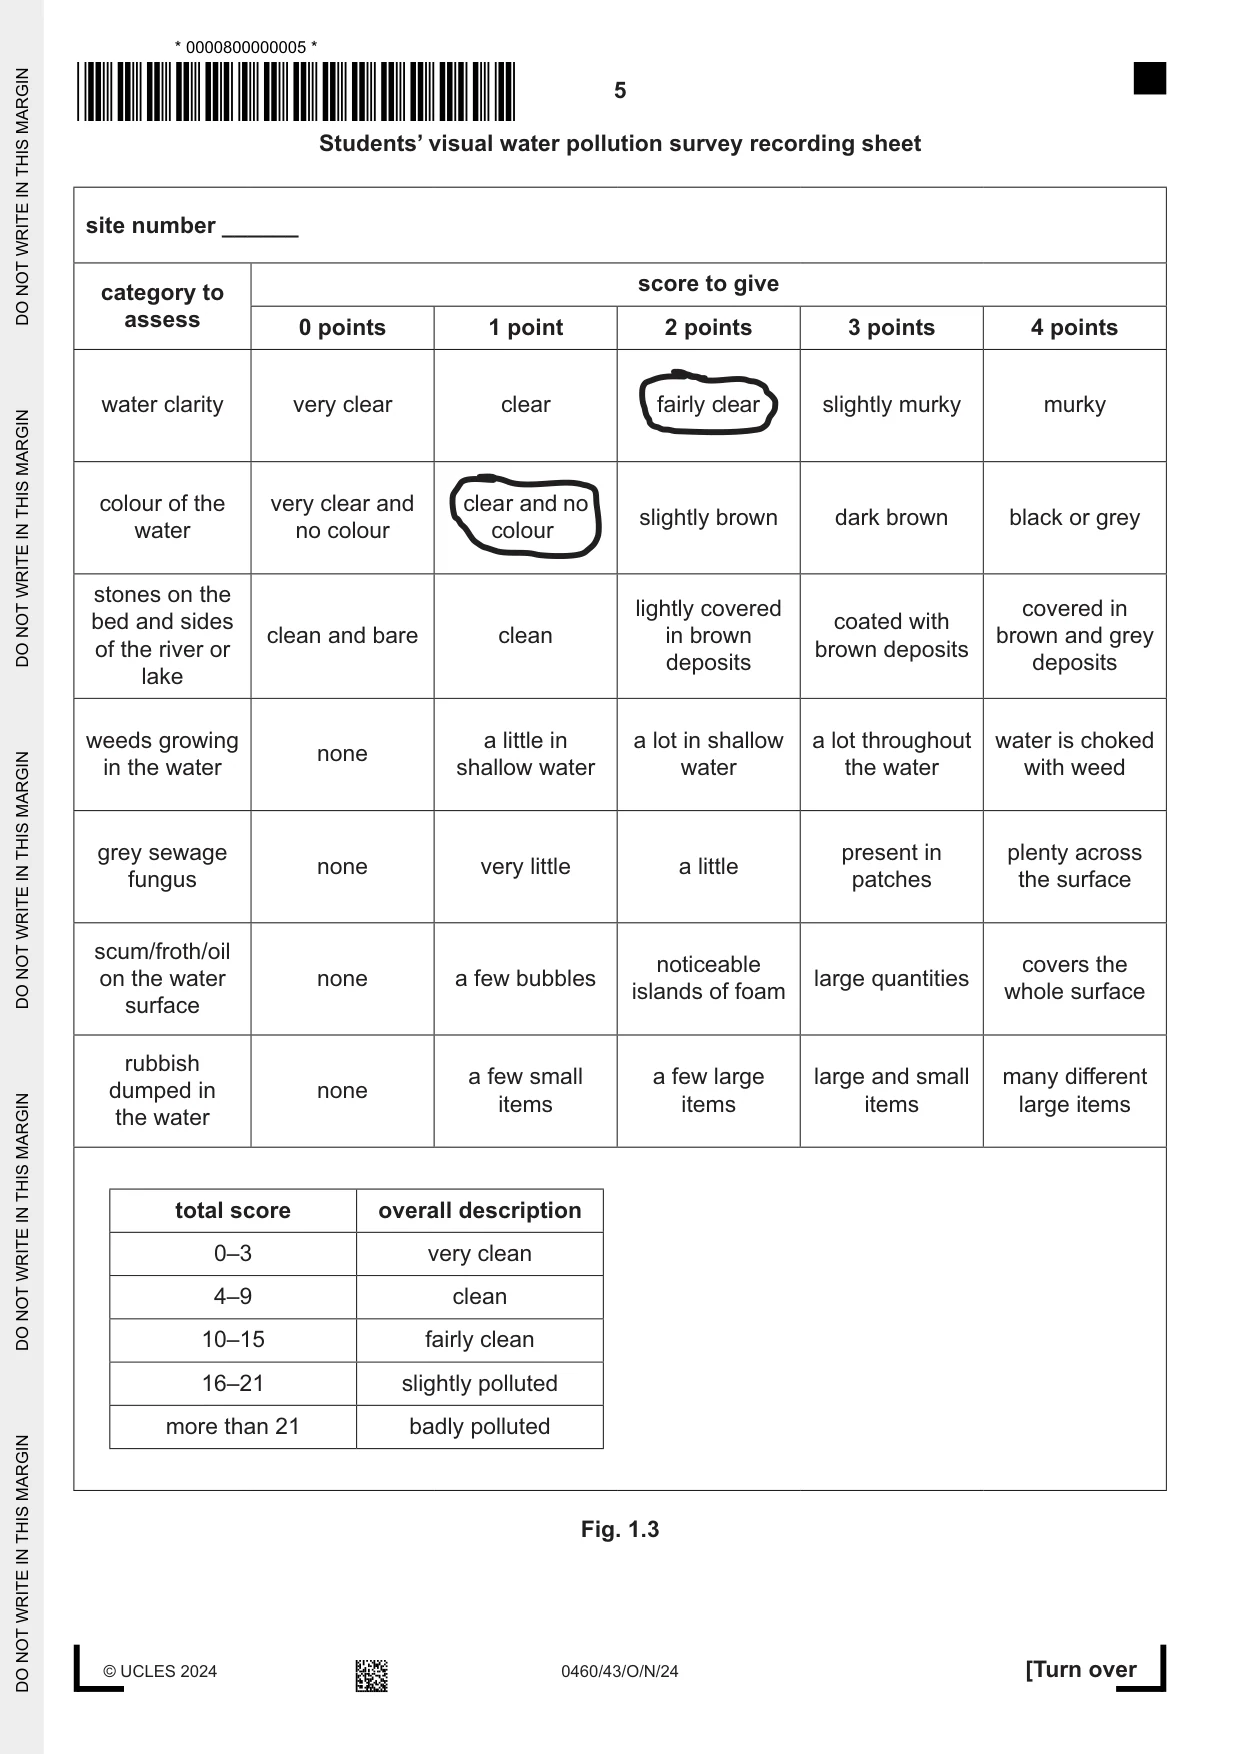
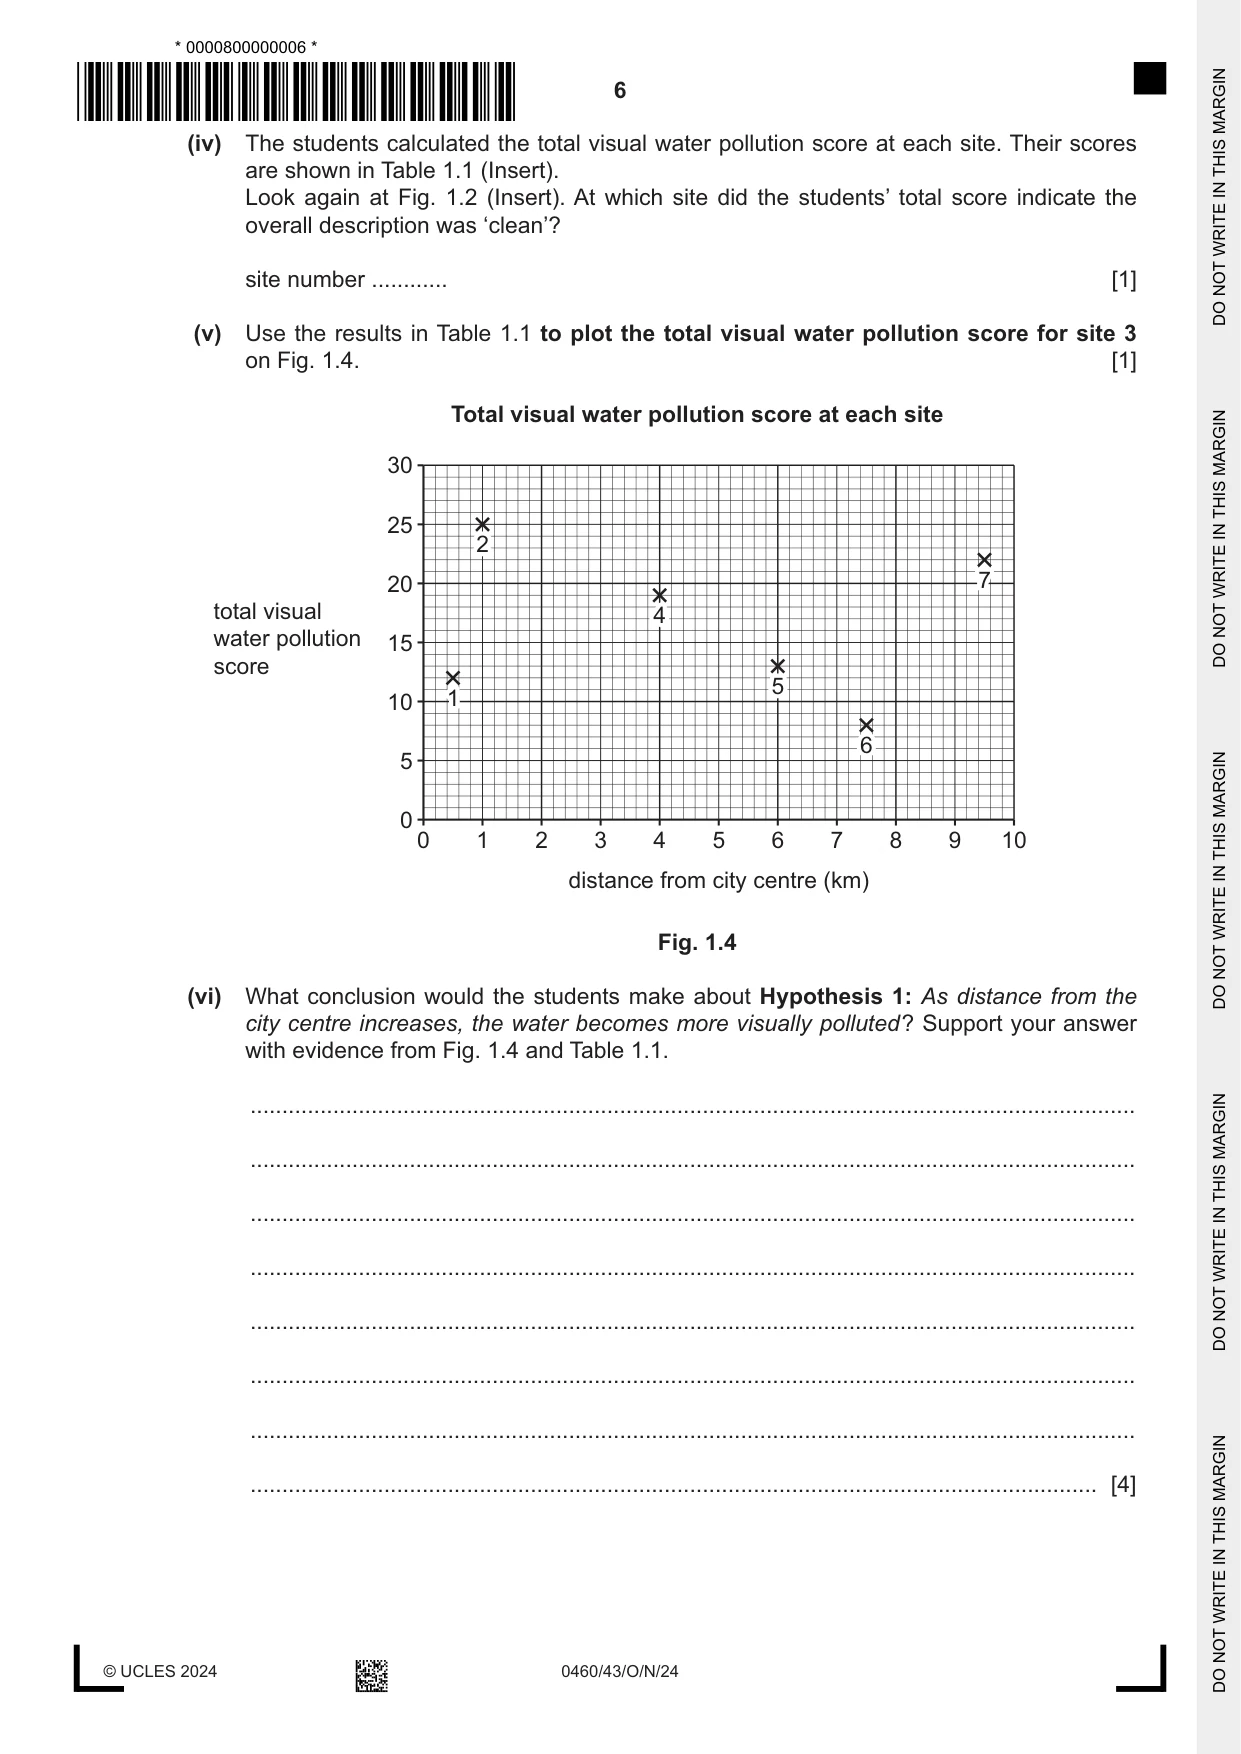
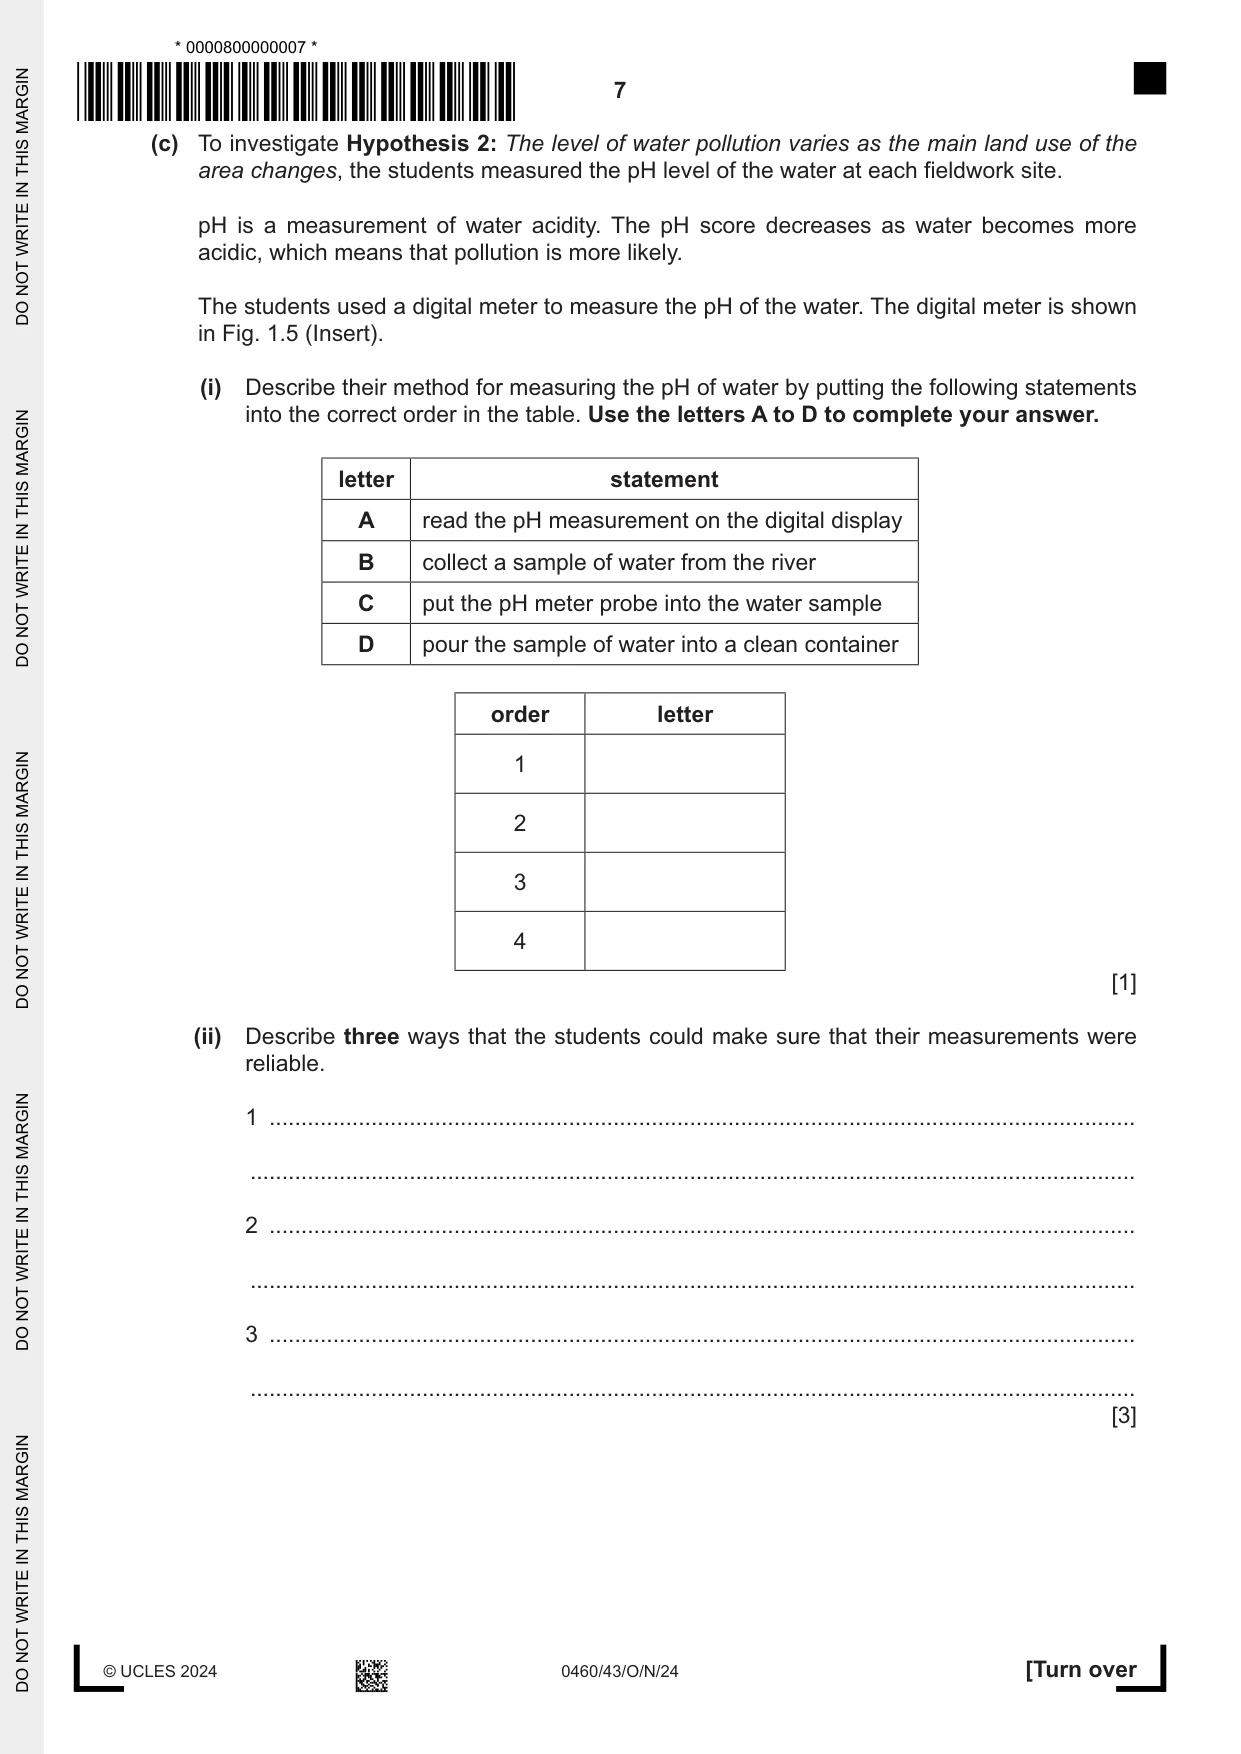
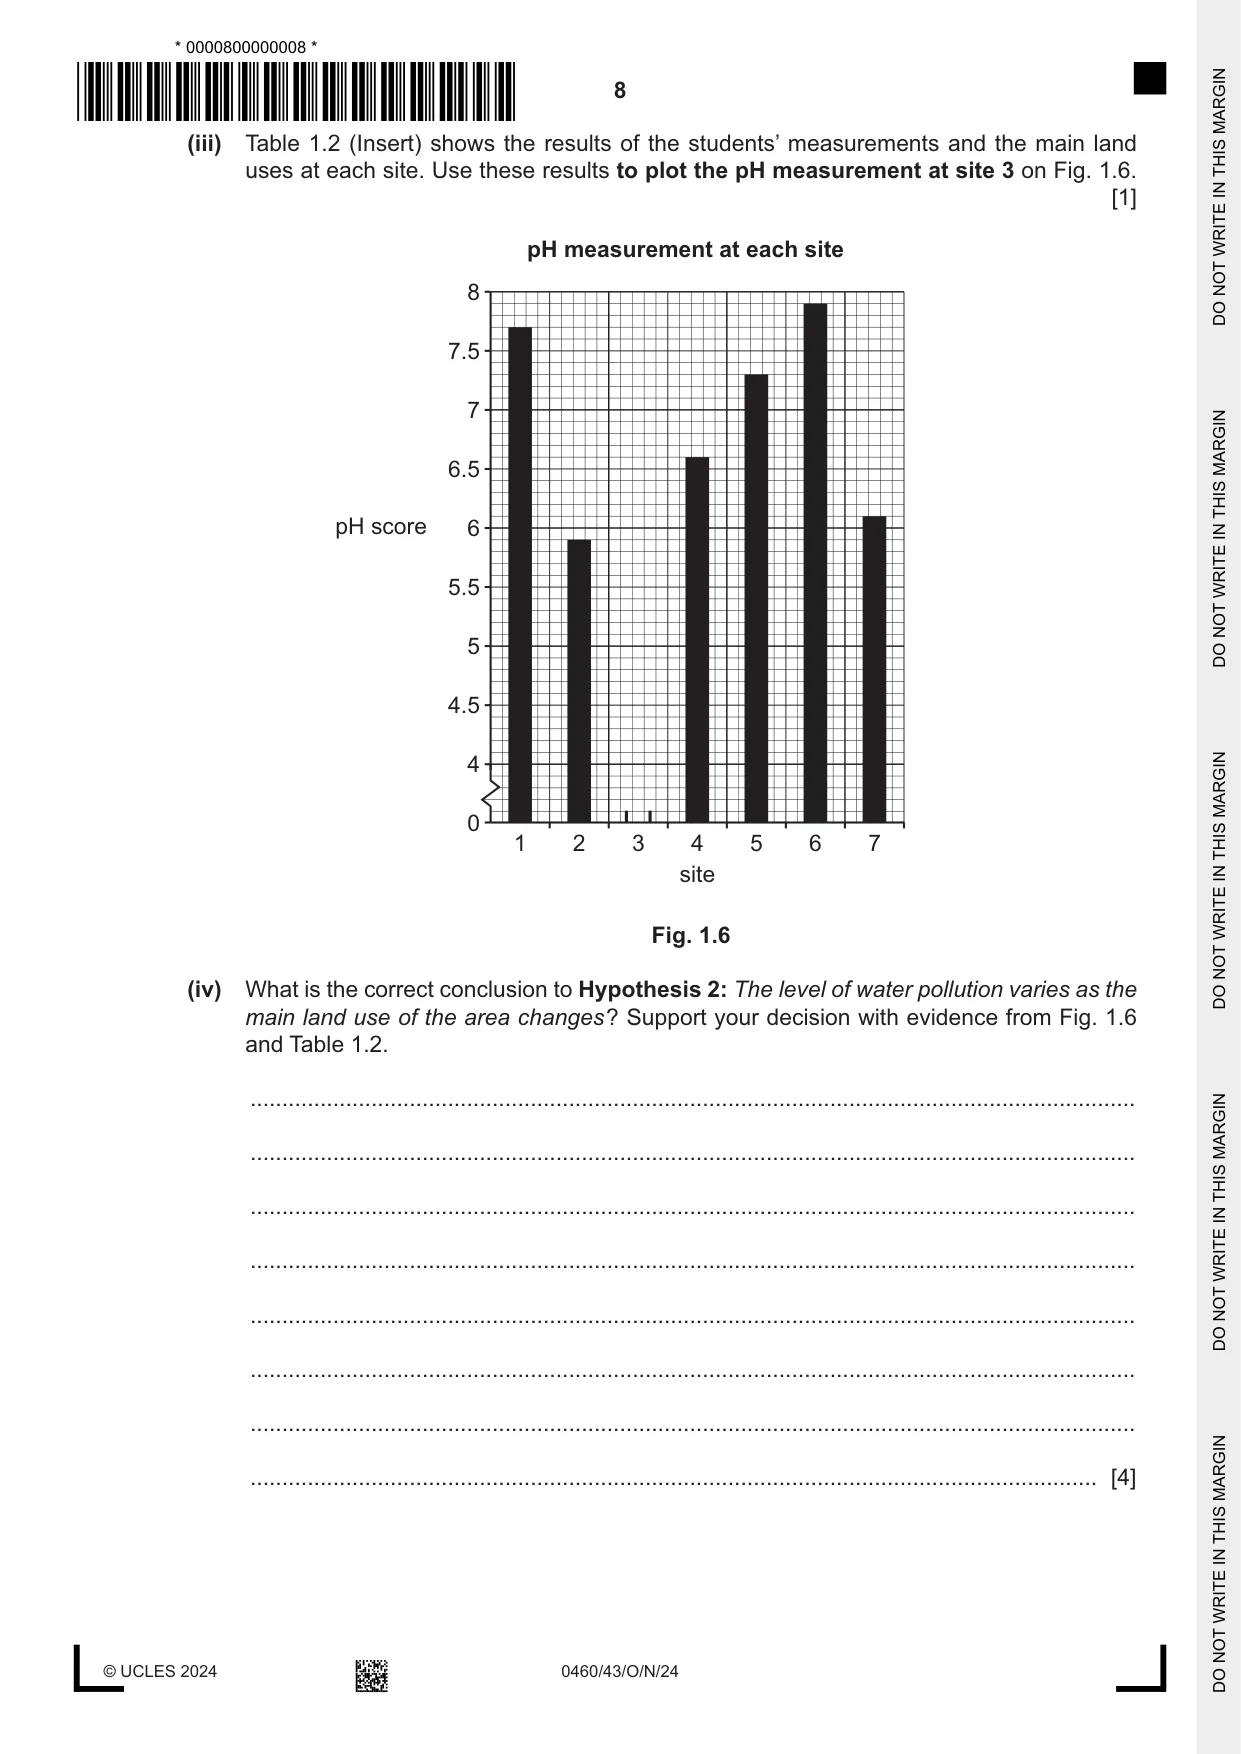
1 Students in Vietnam did fieldwork to investigate pollution in local lakes and rivers. (a) They had seen the results of a survey on a website which asked for people’s views about pollution in the city. These results are shown in Fig. 1.1 (Insert). (i) What type of graph is shown in Fig. 1.1? Circle your answer. pictogram radial graph scatter graph triangular graph [1] (ii) The results shown in Fig. 1.1 are ‘secondary’ data. How is ‘secondary’ data different from ‘primary’ data? ........................................................................................................................................... ........................................................................................................................................... ........................................................................................................................................... ..................................................................................................................................... [2] (iii) From the results shown in Fig. 1.1, what is the dissatisfaction score for water pollution in the city? ........................ [1] The students investigated variations in water pollution in rivers and small lakes around the city. One student chose the following hypotheses: Hypothesis 1: As distance from the city centre increases, the water becomes more visually polluted. Hypothesis 2: The level of water pollution varies as the main land use of the area changes. (b) To investigate Hypothesis 1: As distance from the city centre increases, the water becomes more visually polluted, the students did a survey to assess the visual pollution at seven sites at increasing distances from the city centre. They used the survey recording sheet shown in Fig. 1.2 (Insert). (i) Before they used the survey sheet, the students discussed possible problems they may have using it, and how they could make the results more reliable. The following table shows three possible problems suggested by the students. Suggest one different way to solve each problem. problem possible solution .......................................................... The students are unsure about how to use the visual water pollution .......................................................... survey recording sheet. .......................................................... .......................................................... Members of the group have different opinions about what score to give for .......................................................... each category. .......................................................... .......................................................... Conditions in the rivers and lakes vary from day to day. .......................................................... .......................................................... [3] (ii) The students’ decisions at one of the sites are shown in the following table. Use these to complete the survey recording sheet on Fig. 1.3. The first two categories have been done for you. category to assess description water clarity fairly clear colour of the water clear and no colour stones on the bed and sides of the river or lightly covered in brown deposits lake weeds growing in the water a lot throughout the water grey sewage fungus a little scum/froth/oil on the water surface a few bubbles rubbish dumped in the water a few large items [2] (iii) Calculate the total visual water pollution score at the site shown in Fig. 1.3. ............................................ [1] Students’ visual water pollution survey recording sheet site number ______ score to give category to assess 0 points 1 point 2 points 3 points 4 points water clarity very clear clear fairly clear slightly murky murky colour of the very clear and clear and no slightly brown dark brown black or grey water no colour colour stones on the lightly covered covered in bed and sides coated with clean and bare clean in brown brown and grey of the river or brown deposits deposits deposits lake weeds growing a little in a lot in shallow a lot throughout water is choked none in the water shallow water water the water with weed grey sewage present in plenty across none very little a little fungus patches the surface scum/froth/oil noticeable covers the on the water none a few bubbles large quantities islands of foam whole surface surface rubbish a few small a few large large and small many different dumped in none items items items large items the water total score overall description 0–3 very clean 4–9 clean 10–15 fairly clean 16–21 slightly polluted more than 21 badly polluted Fig. 1.3 (iv) The students calculated the total visual water pollution score at each site. Their scores are shown in Table 1.1 (Insert). Look again at Fig. 1.2 (Insert). At which site did the students’ total score indicate the overall description was ‘clean’? site number ............ [1] (v) Use the results in Table 1.1 to plot the total visual water pollution score for site 3 on Fig. 1.4. [1] Total visual water pollution score at each site 30 25 2 20 7 total visual 4 water pollution 15 score 5 10 1 6 5 0 0 1 2 3 4 5 6 7 8 9 10 distance from city centre (km) Fig. 1.4 (vi) What conclusion would the students make about Hypothesis 1: As distance from the city centre increases, the water becomes more visually polluted ? Support your answer with evidence from Fig. 1.4 and Table 1.1. ........................................................................................................................................... ........................................................................................................................................... ........................................................................................................................................... ........................................................................................................................................... ........................................................................................................................................... ........................................................................................................................................... ........................................................................................................................................... ..................................................................................................................................... [4] (c) To investigate Hypothesis 2: The level of water pollution varies as the main land use of the area changes, the students measured the pH level of the water at each fieldwork site. pH is a measurement of water acidity. The pH score decreases as water becomes more acidic, which means that pollution is more likely. The students used a digital meter to measure the pH of the water. The digital meter is shown in Fig. 1.5 (Insert). (i) Describe their method for measuring the pH of water by putting the following statements into the correct order in the table. Use the letters A to D to complete your answer. letter statement A read the pH measurement on the digital display B collect a sample of water from the river C put the pH meter probe into the water sample D pour the sample of water into a clean container order letter 1 2 3 4 [1] (ii) Describe three ways that the students could make sure that their measurements were reliable. 1 ........................................................................................................................................ ........................................................................................................................................... 2 ........................................................................................................................................ ........................................................................................................................................... 3 ........................................................................................................................................ ........................................................................................................................................... [3] (iii) Table 1.2 (Insert) shows the results of the students’ measurements and the main land uses at each site. Use these results to plot the pH measurement at site 3 on Fig. 1.6. [1] pH measurement at each site 8 7.5 7 6.5 pH score 6 5.5 5 4.5 4 0 1 2 3 4 5 6 7 site Fig. 1.6 (iv) What is the correct conclusion to Hypothesis 2: The level of water pollution varies as the main land use of the area changes ? Support your decision with evidence from Fig. 1.6 and Table 1.2. ........................................................................................................................................... ........................................................................................................................................... ........................................................................................................................................... ........................................................................................................................................... ........................................................................................................................................... ........................................................................................................................................... ........................................................................................................................................... ..................................................................................................................................... [4] (d) (i) Suggest a different hypothesis that students could test through river fieldwork. Do not refer to pollution. ........................................................................................................................................... ..................................................................................................................................... [1] (ii) Describe how they could test this hypothesis through fieldwork. You may use a labelled diagram in your answer. ........................................................................................................................................... ........................................................................................................................................... ........................................................................................................................................... ........................................................................................................................................... ........................................................................................................................................... ........................................................................................................................................... ........................................................................................................................................... ........................................................................................................................................... [4] [Total: 30]
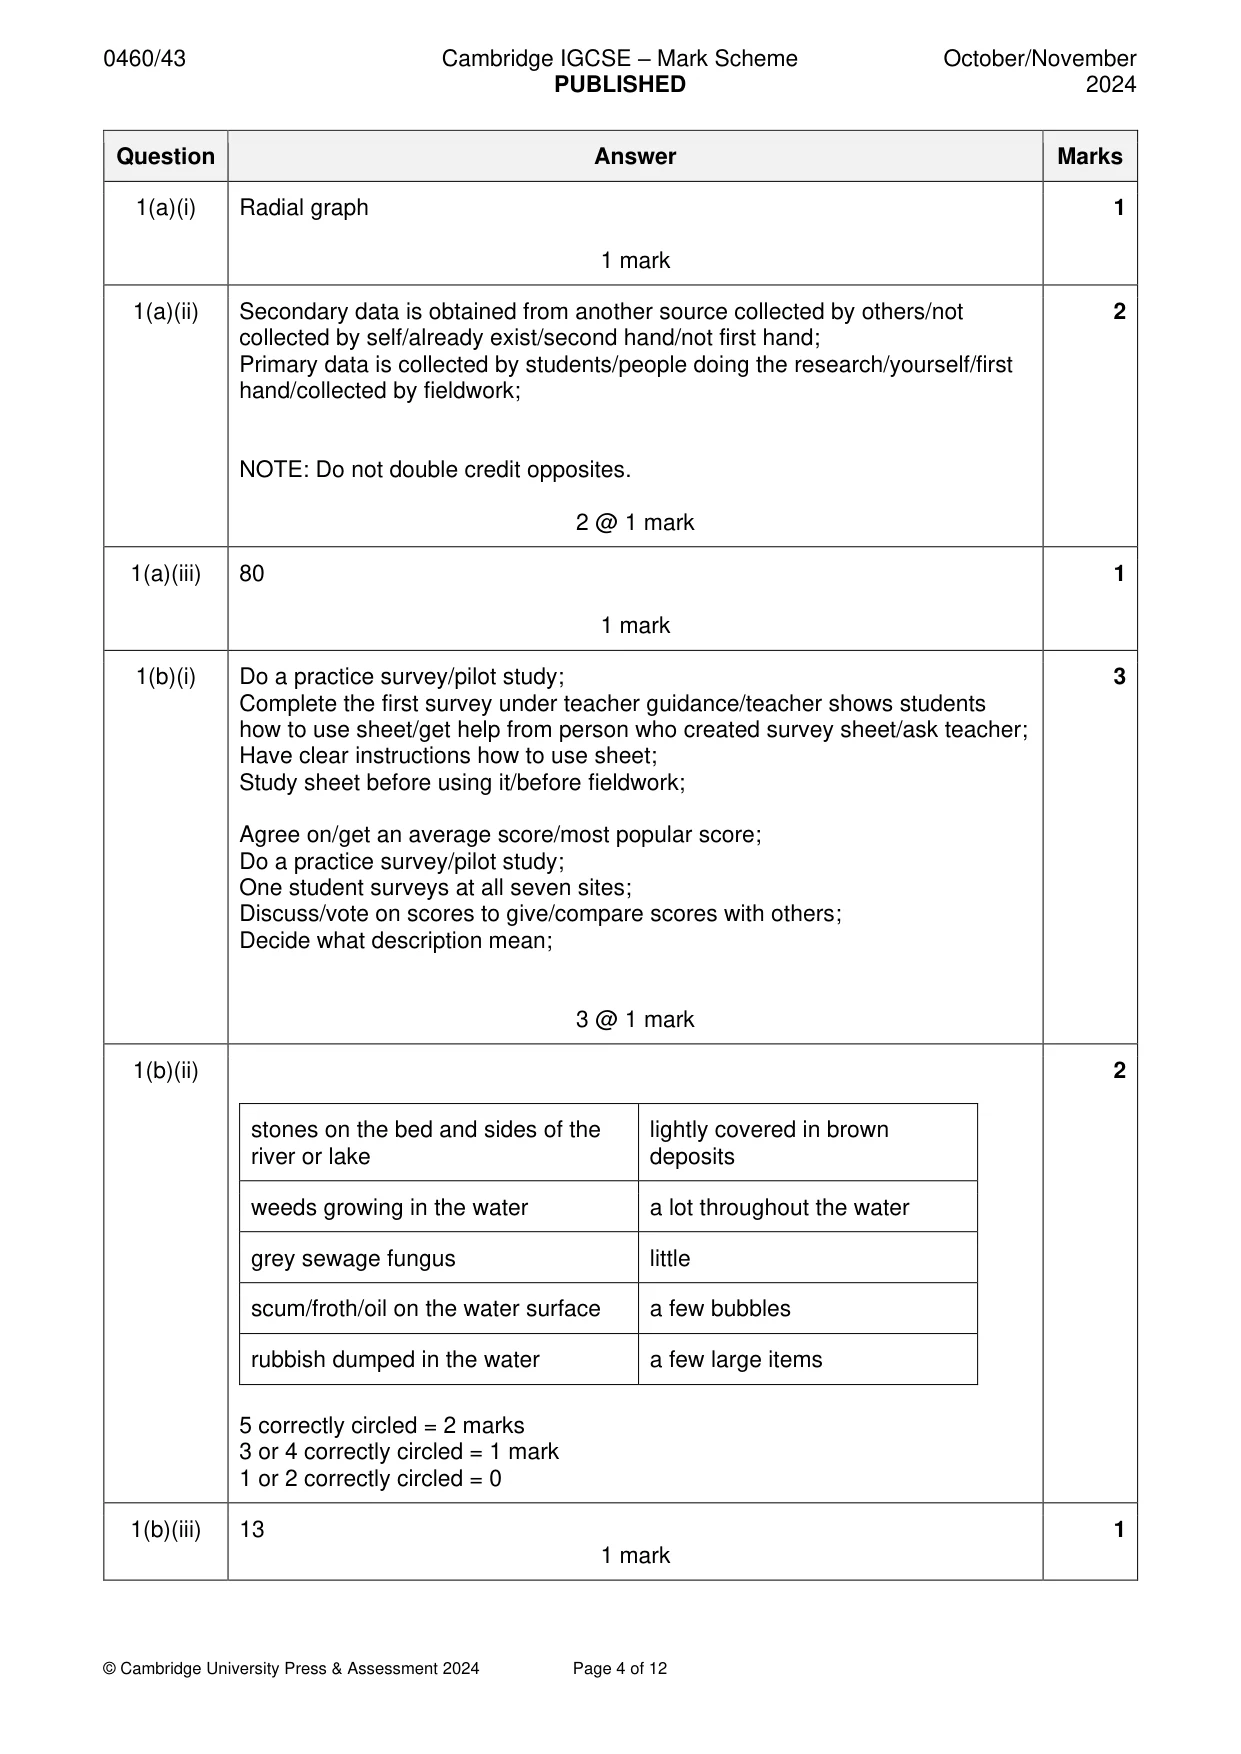
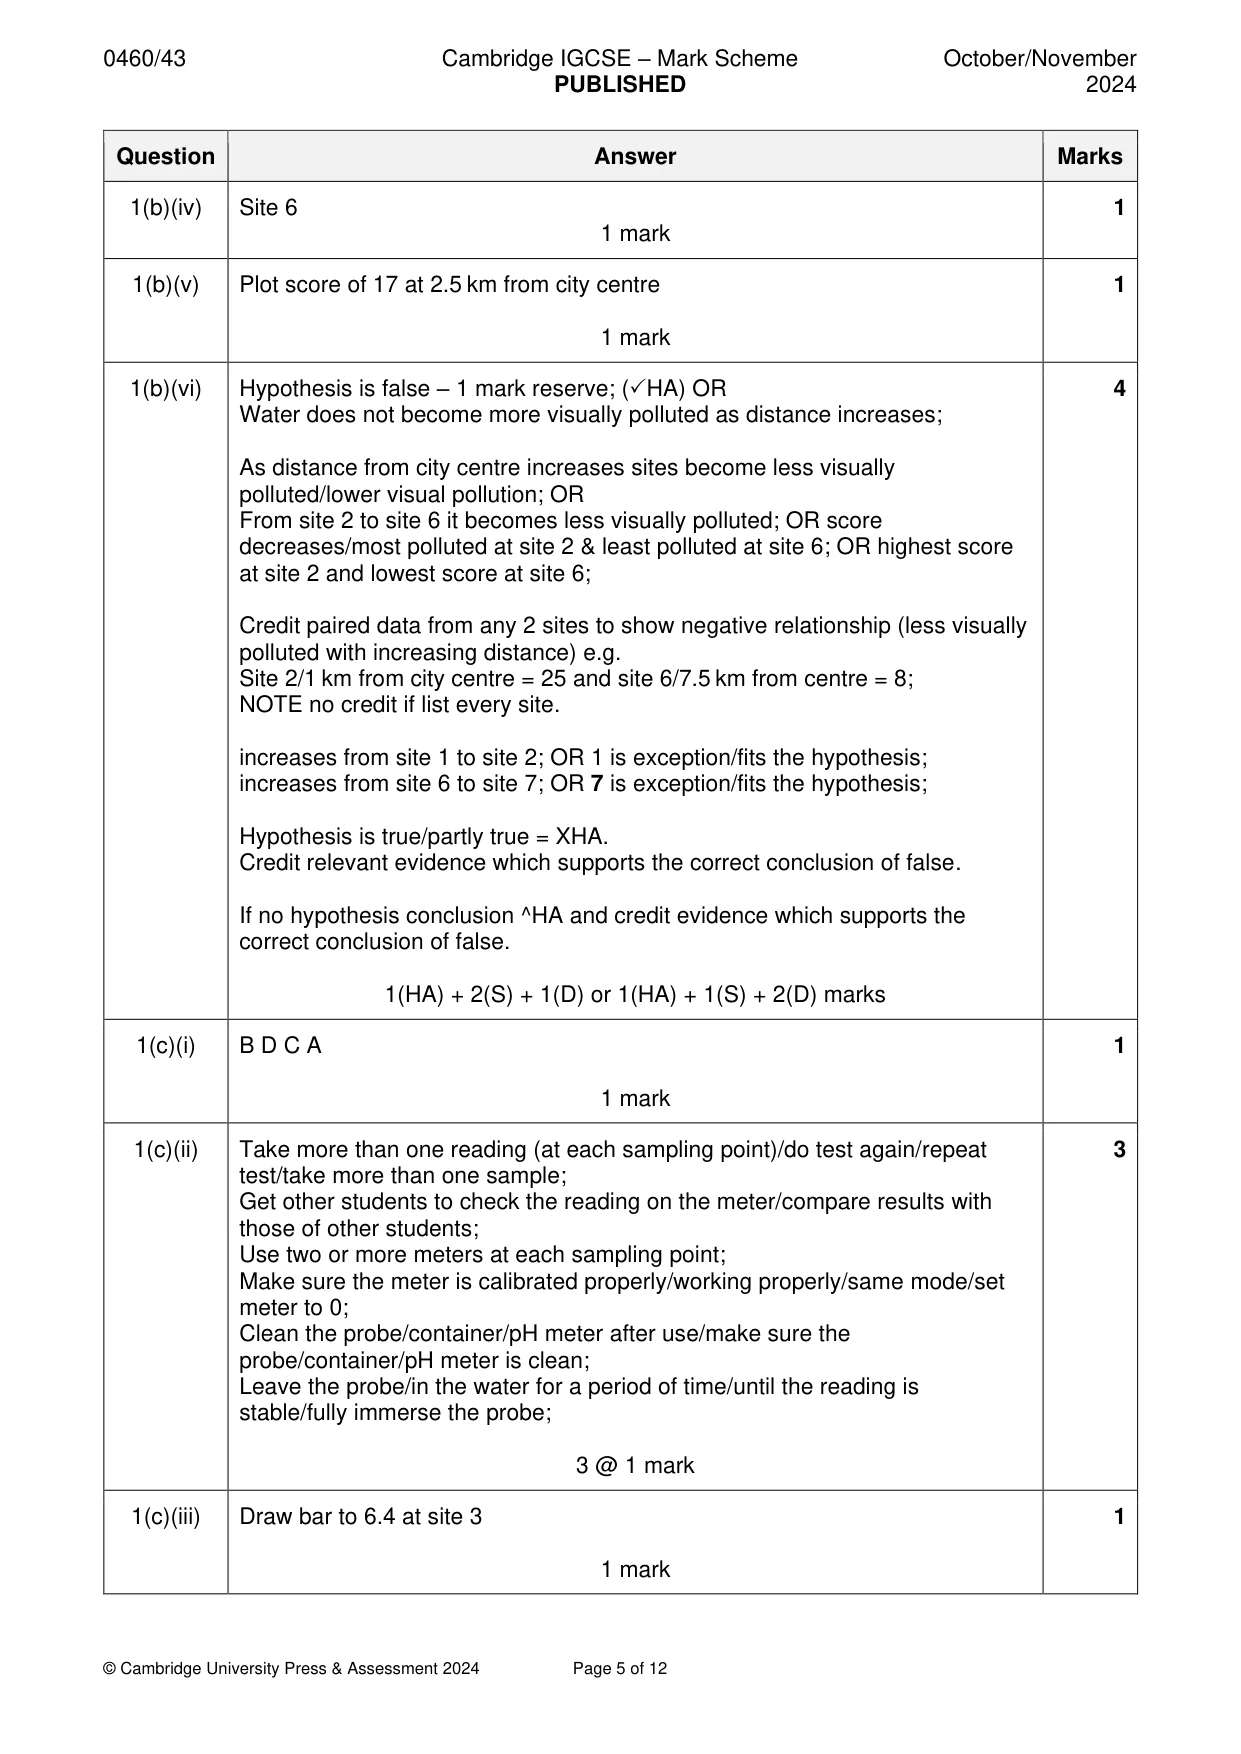
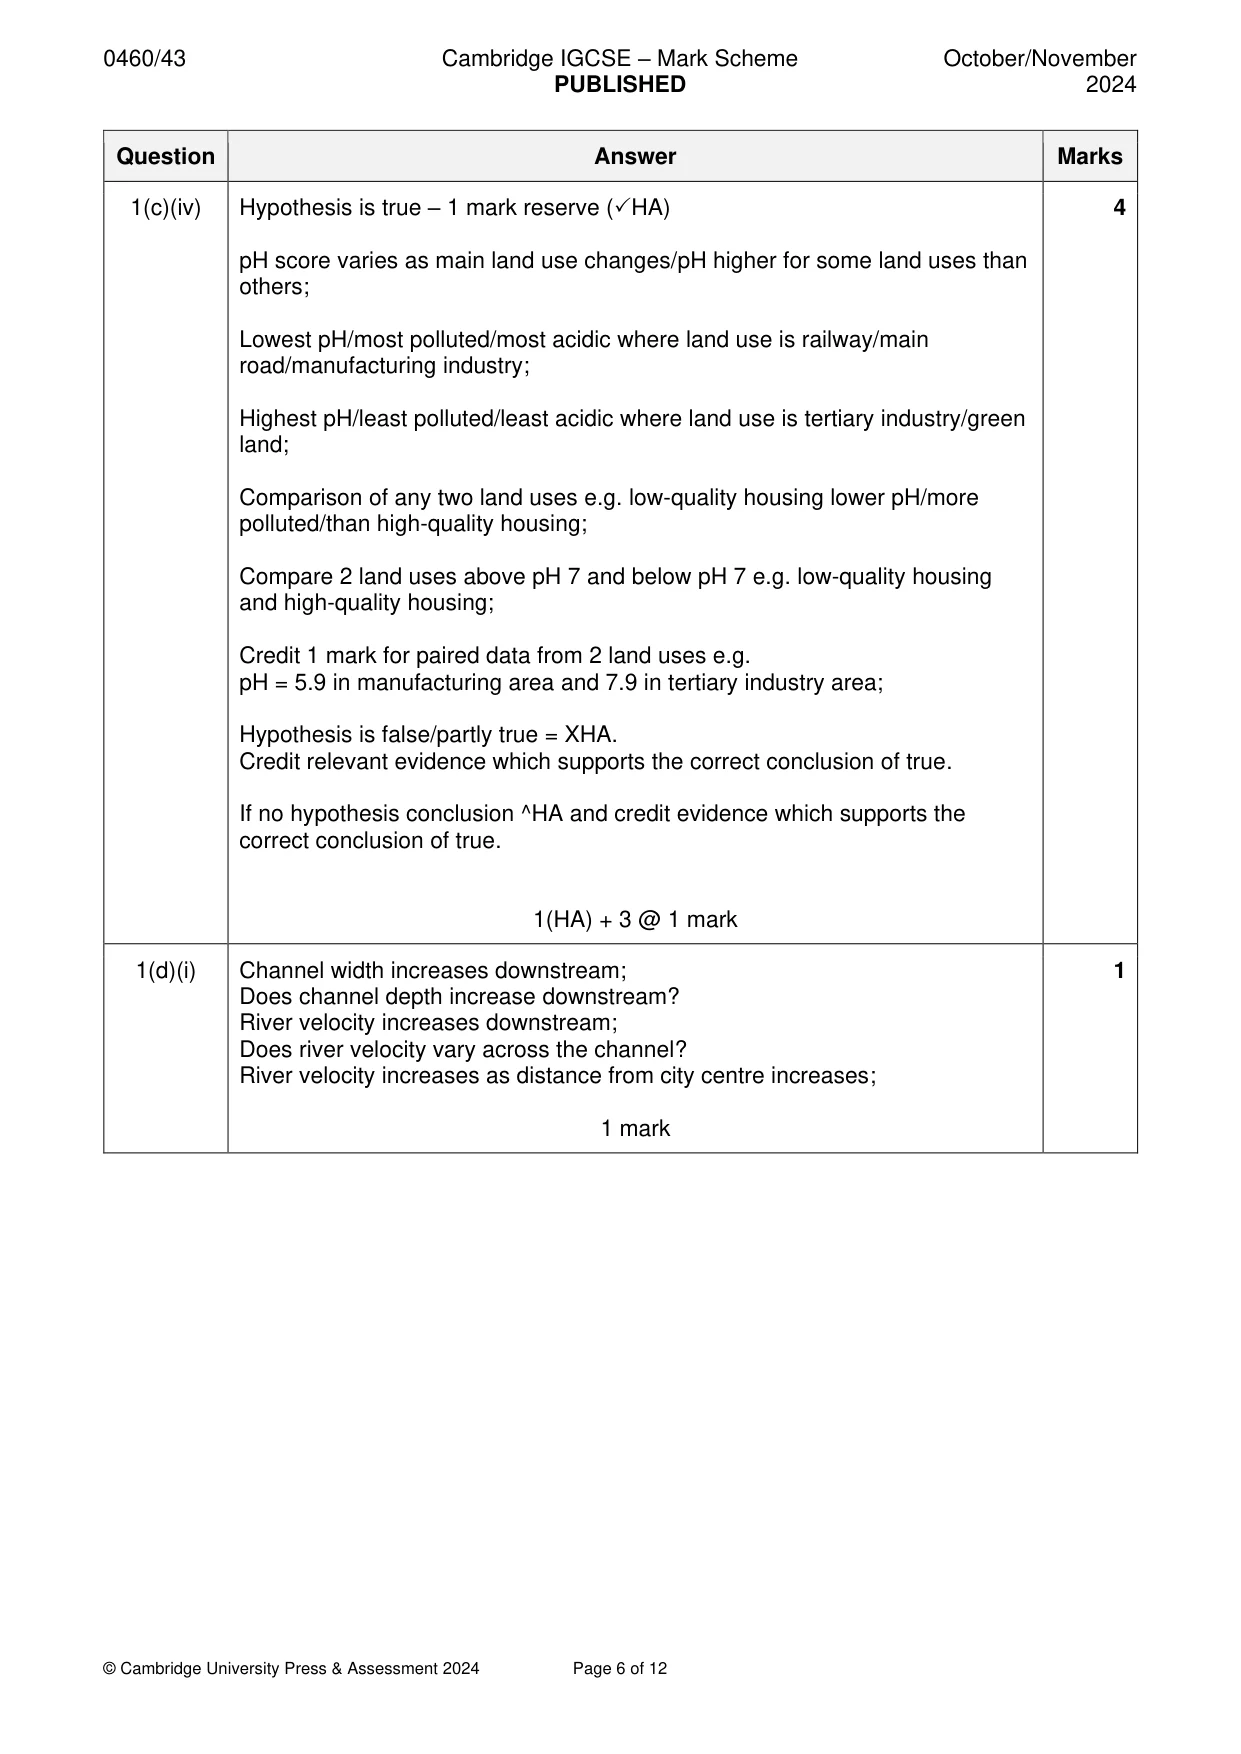
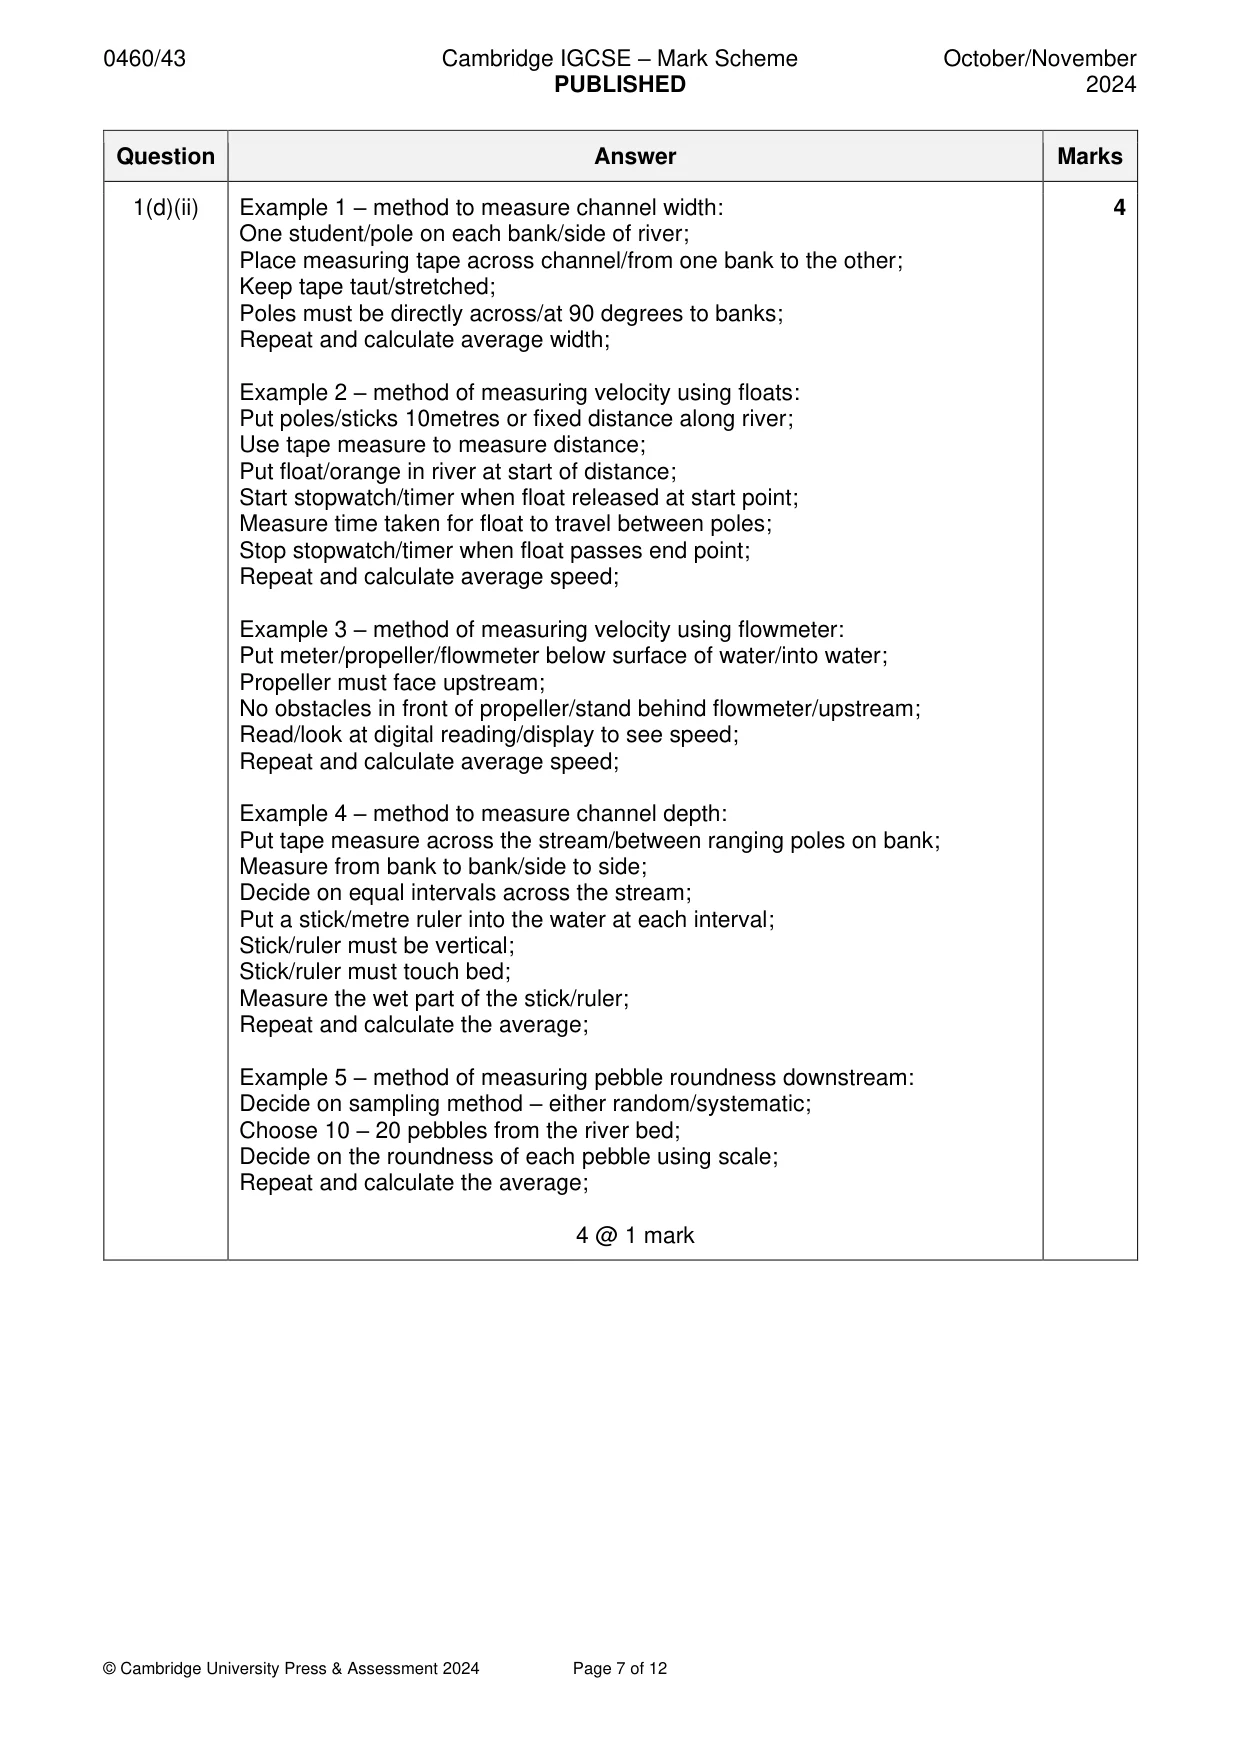
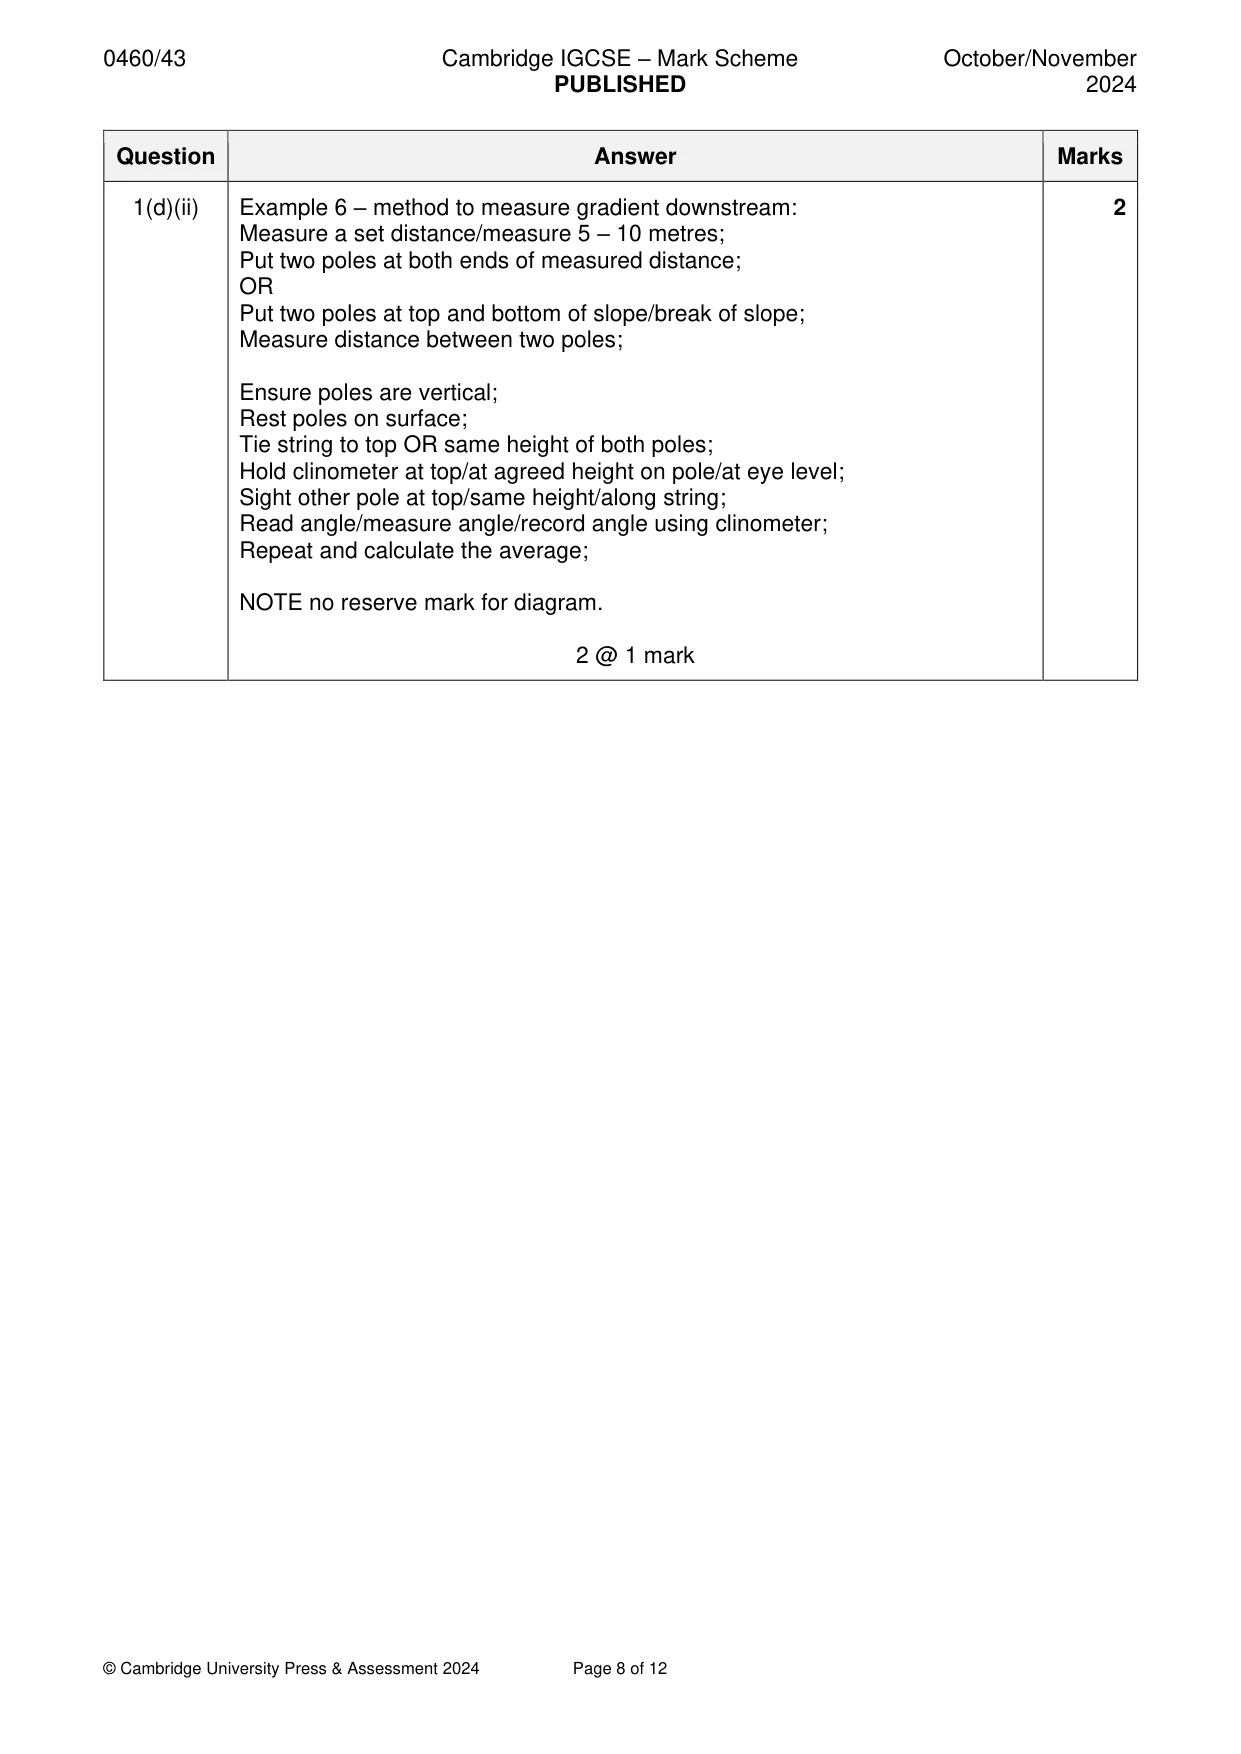
Mark scheme: Question Answer Marks 1(a)(i) Radial graph 1 1 mark 1(a)(ii) Secondary data is obtained from another source collected by others/not 2 collected by self/already exist/second hand/not first hand; Primary data is collected by students/people doing the research/yourself/first hand/collected by fieldwork; NOTE: Do not double credit opposites. 2 @ 1 mark 1(a)(iii) 80 1 1 mark 1(b)(i) Do a practice survey/pilot study; 3 Complete the first survey under teacher guidance/teacher shows students how to use sheet/get help from person who created survey sheet/ask teacher; Have clear instructions how to use sheet; Study sheet before using it/before fieldwork; Agree on/get an average score/most popular score; Do a practice survey/pilot study; One student surveys at all seven sites; Discuss/vote on scores to give/compare scores with others; Decide what description mean; 3 @ 1 mark 1(b)(ii) 2 stones on the bed and sides of the lightly covered in brown river or lake deposits weeds growing in the water a lot throughout the water grey sewage fungus little scum/froth/oil on the water surface a few bubbles rubbish dumped in the water a few large items 5 correctly circled = 2 marks 3 or 4 correctly circled = 1 mark 1 or 2 correctly circled = 0 1(b)(iii) 13 1 1 mark 1(b)(iv) Site 6 1 1 mark 1(b)(v) Plot score of 17 at 2.5 km from city centre 1 1 mark 1(b)(vi) Hypothesis is false – 1 mark reserve; (HA) OR 4 Water does not become more visually polluted as distance increases; As distance from city centre increases sites become less visually polluted/lower visual pollution; OR From site 2 to site 6 it becomes less visually polluted; OR score decreases/most polluted at site 2 & least polluted at site 6; OR highest score at site 2 and lowest score at site 6; Credit paired data from any 2 sites to show negative relationship (less visually polluted with increasing distance) e.g. Site 2/1 km from city centre = 25 and site 6/7.5 km from centre = 8; NOTE no credit if list every site. increases from site 1 to site 2; OR 1 is exception/fits the hypothesis; increases from site 6 to site 7; OR 7 is exception/fits the hypothesis; Hypothesis is true/partly true = XHA. Credit relevant evidence which supports the correct conclusion of false. If no hypothesis conclusion ^HA and credit evidence which supports the correct conclusion of false. 1(HA) + 2(S) + 1(D) or 1(HA) + 1(S) + 2(D) marks 1(c)(i) B D C A 1 1 mark 1(c)(ii) Take more than one reading (at each sampling point)/do test again/repeat 3 test/take more than one sample; Get other students to check the reading on the meter/compare results with those of other students; Use two or more meters at each sampling point; Make sure the meter is calibrated properly/working properly/same mode/set meter to 0; Clean the probe/container/pH meter after use/make sure the probe/container/pH meter is clean; Leave the probe/in the water for a period of time/until the reading is stable/fully immerse the probe; 3 @ 1 mark 1(c)(iii) Draw bar to 6.4 at site 3 1 1 mark 1(c)(iv) Hypothesis is true – 1 mark reserve (HA) 4 pH score varies as main land use changes/pH higher for some land uses than others; Lowest pH/most polluted/most acidic where land use is railway/main road/manufacturing industry; Highest pH/least polluted/least acidic where land use is tertiary industry/green land; Comparison of any two land uses e.g. low-quality housing lower pH/more polluted/than high-quality housing; Compare 2 land uses above pH 7 and below pH 7 e.g. low-quality housing and high-quality housing; Credit 1 mark for paired data from 2 land uses e.g. pH = 5.9 in manufacturing area and 7.9 in tertiary industry area; Hypothesis is false/partly true = XHA. Credit relevant evidence which supports the correct conclusion of true. If no hypothesis conclusion ^HA and credit evidence which supports the correct conclusion of true. 1(HA) + 3 @ 1 mark 1(d)(i) Channel width increases downstream; 1 Does channel depth increase downstream? River velocity increases downstream; Does river velocity vary across the channel? River velocity increases as distance from city centre increases; 1 mark 1(d)(ii) Example 1 – method to measure channel width: 4 One student/pole on each bank/side of river; Place measuring tape across channel/from one bank to the other; Keep tape taut/stretched; Poles must be directly across/at 90 degrees to banks; Repeat and calculate average width; Example 2 – method of measuring velocity using floats: Put poles/sticks 10metres or fixed distance along river; Use tape measure to measure distance; Put float/orange in river at start of distance; Start stopwatch/timer when float released at start point; Measure time taken for float to travel between poles; Stop stopwatch/timer when float passes end point; Repeat and calculate average speed; Example 3 – method of measuring velocity using flowmeter: Put meter/propeller/flowmeter below surface of water/into water; Propeller must face upstream; No obstacles in front of propeller/stand behind flowmeter/upstream; Read/look at digital reading/display to see speed; Repeat and calculate average speed; Example 4 – method to measure channel depth: Put tape measure across the stream/between ranging poles on bank; Measure from bank to bank/side to side; Decide on equal intervals across the stream; Put a stick/metre ruler into the water at each interval; Stick/ruler must be vertical; Stick/ruler must touch bed; Measure the wet part of the stick/ruler; Repeat and calculate the average; Example 5 – method of measuring pebble roundness downstream: Decide on sampling method – either random/systematic; Choose 10 – 20 pebbles from the river bed; Decide on the roundness of each pebble using scale; Repeat and calculate the average; 4 @ 1 mark 1(d)(ii) Example 6 – method to measure gradient downstream: 2 Measure a set distance/measure 5 – 10 metres; Put two poles at both ends of measured distance; OR Put two poles at top and bottom of slope/break of slope; Measure distance between two poles; Ensure poles are vertical; Rest poles on surface; Tie string to top OR same height of both poles; Hold clinometer at top/at agreed height on pole/at eye level; Sight other pole at top/same height/along string; Read angle/measure angle/record angle using clinometer; Repeat and calculate the average; NOTE no reserve mark for diagram. 2 @ 1 mark
More questions on Environmental risks of economic development
Q2 · Students in Nigeria were studying indicators of development
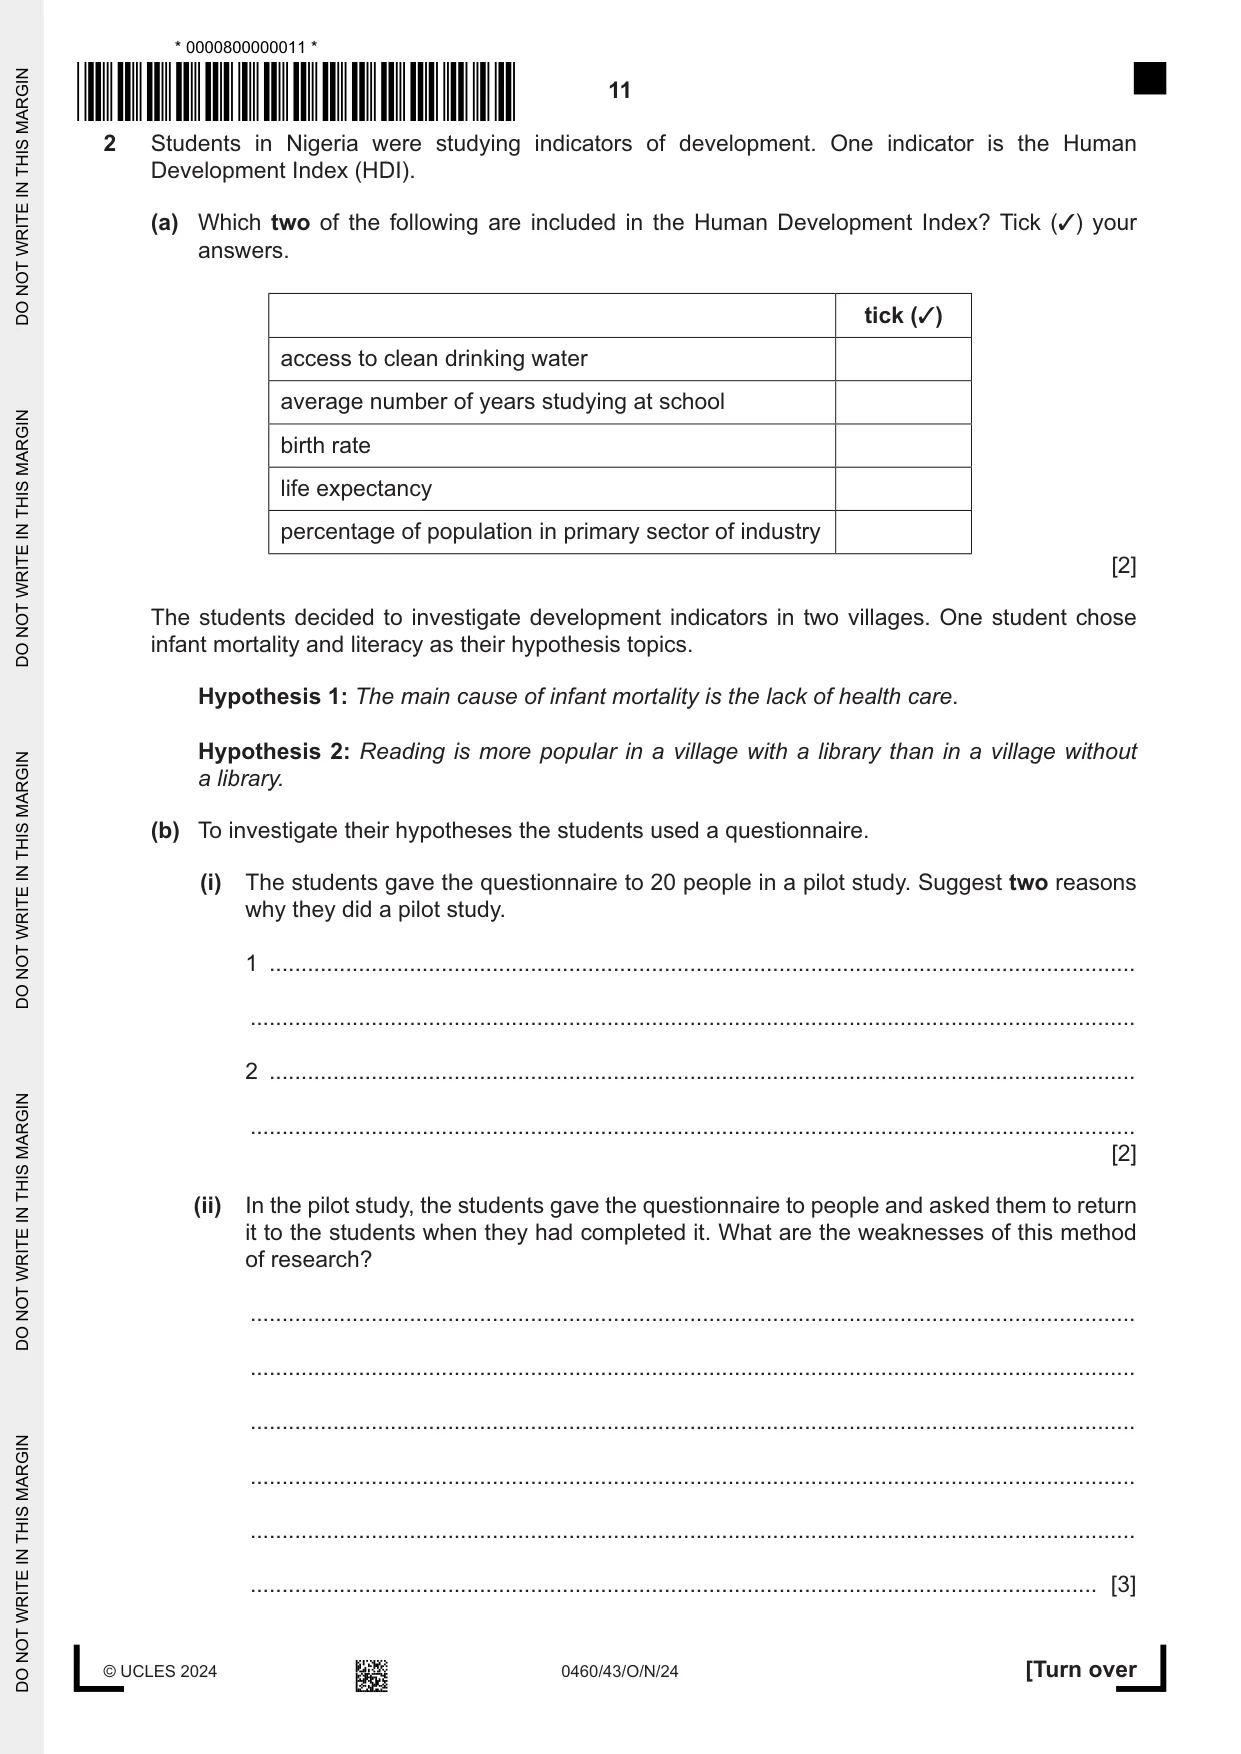
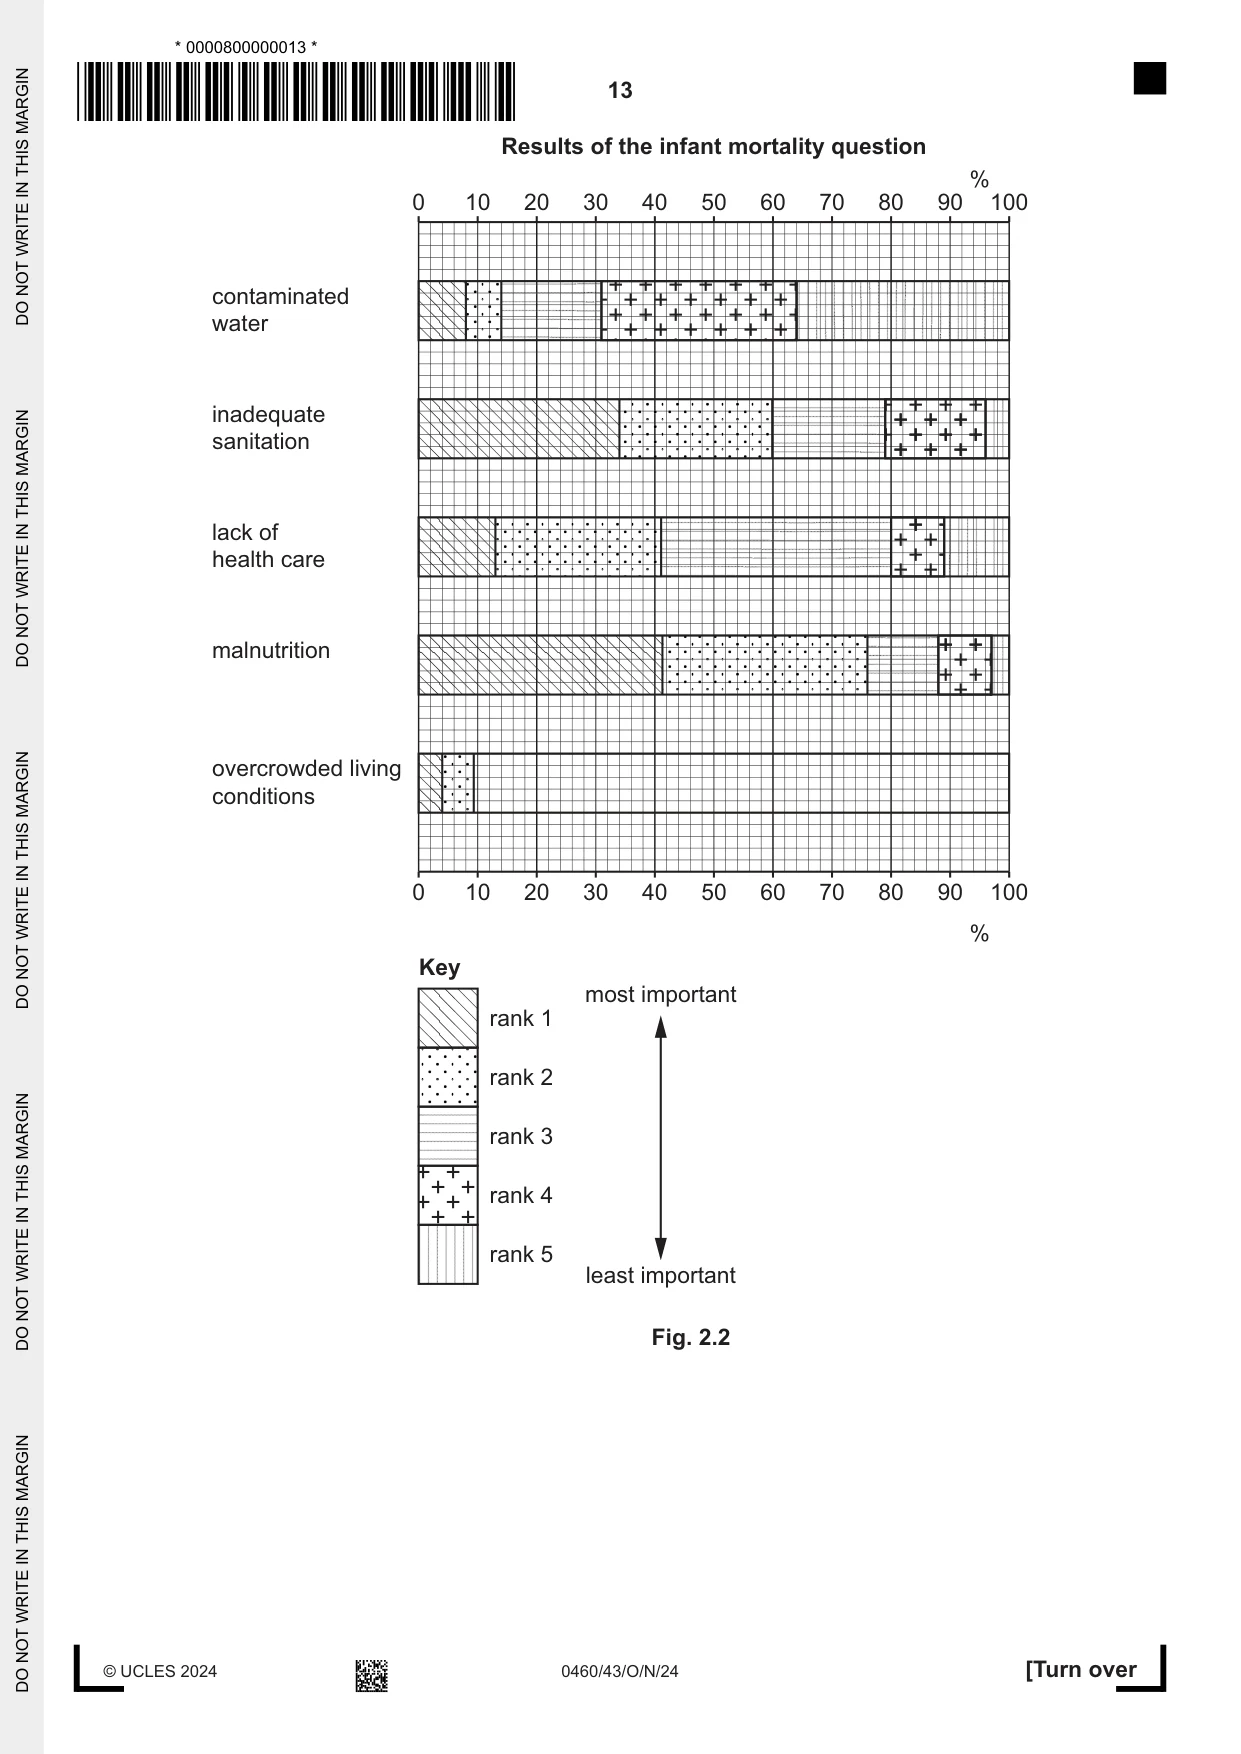
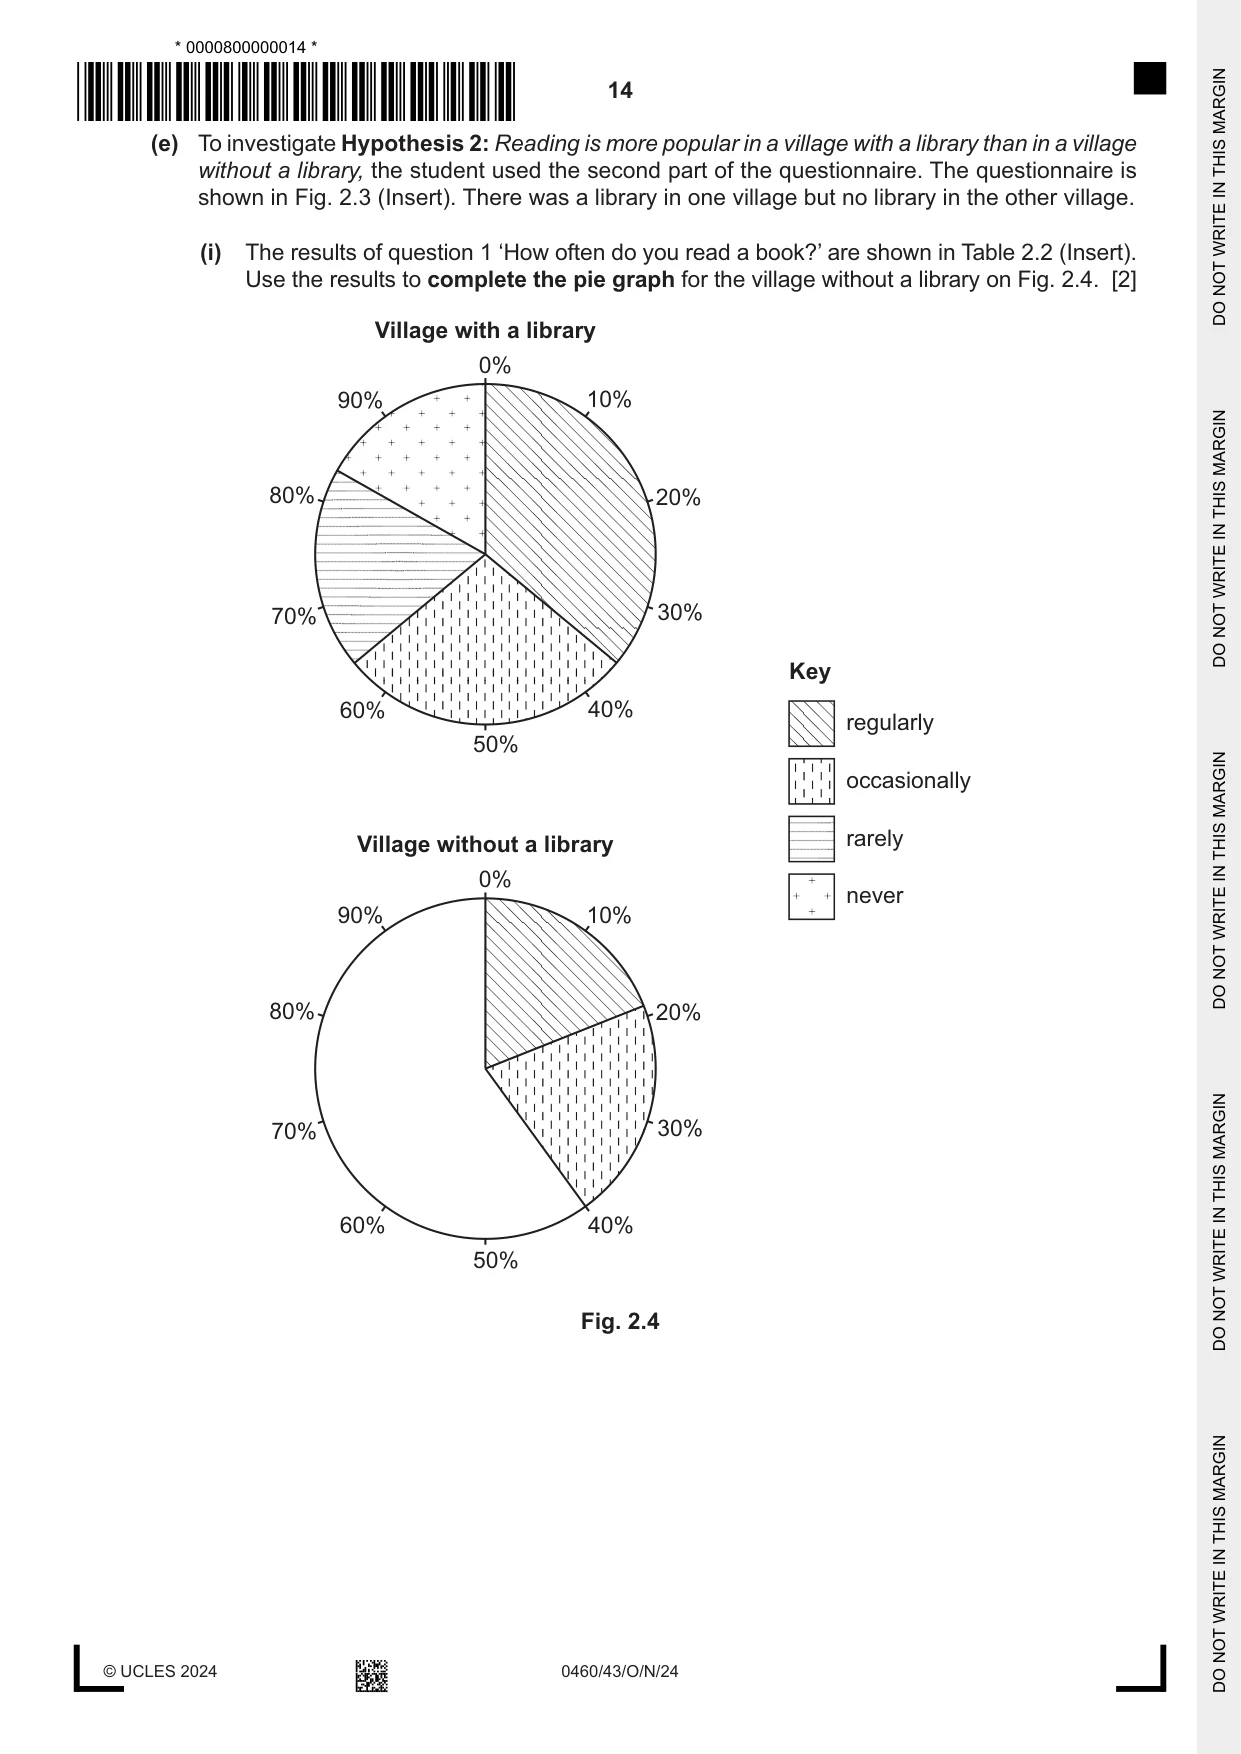
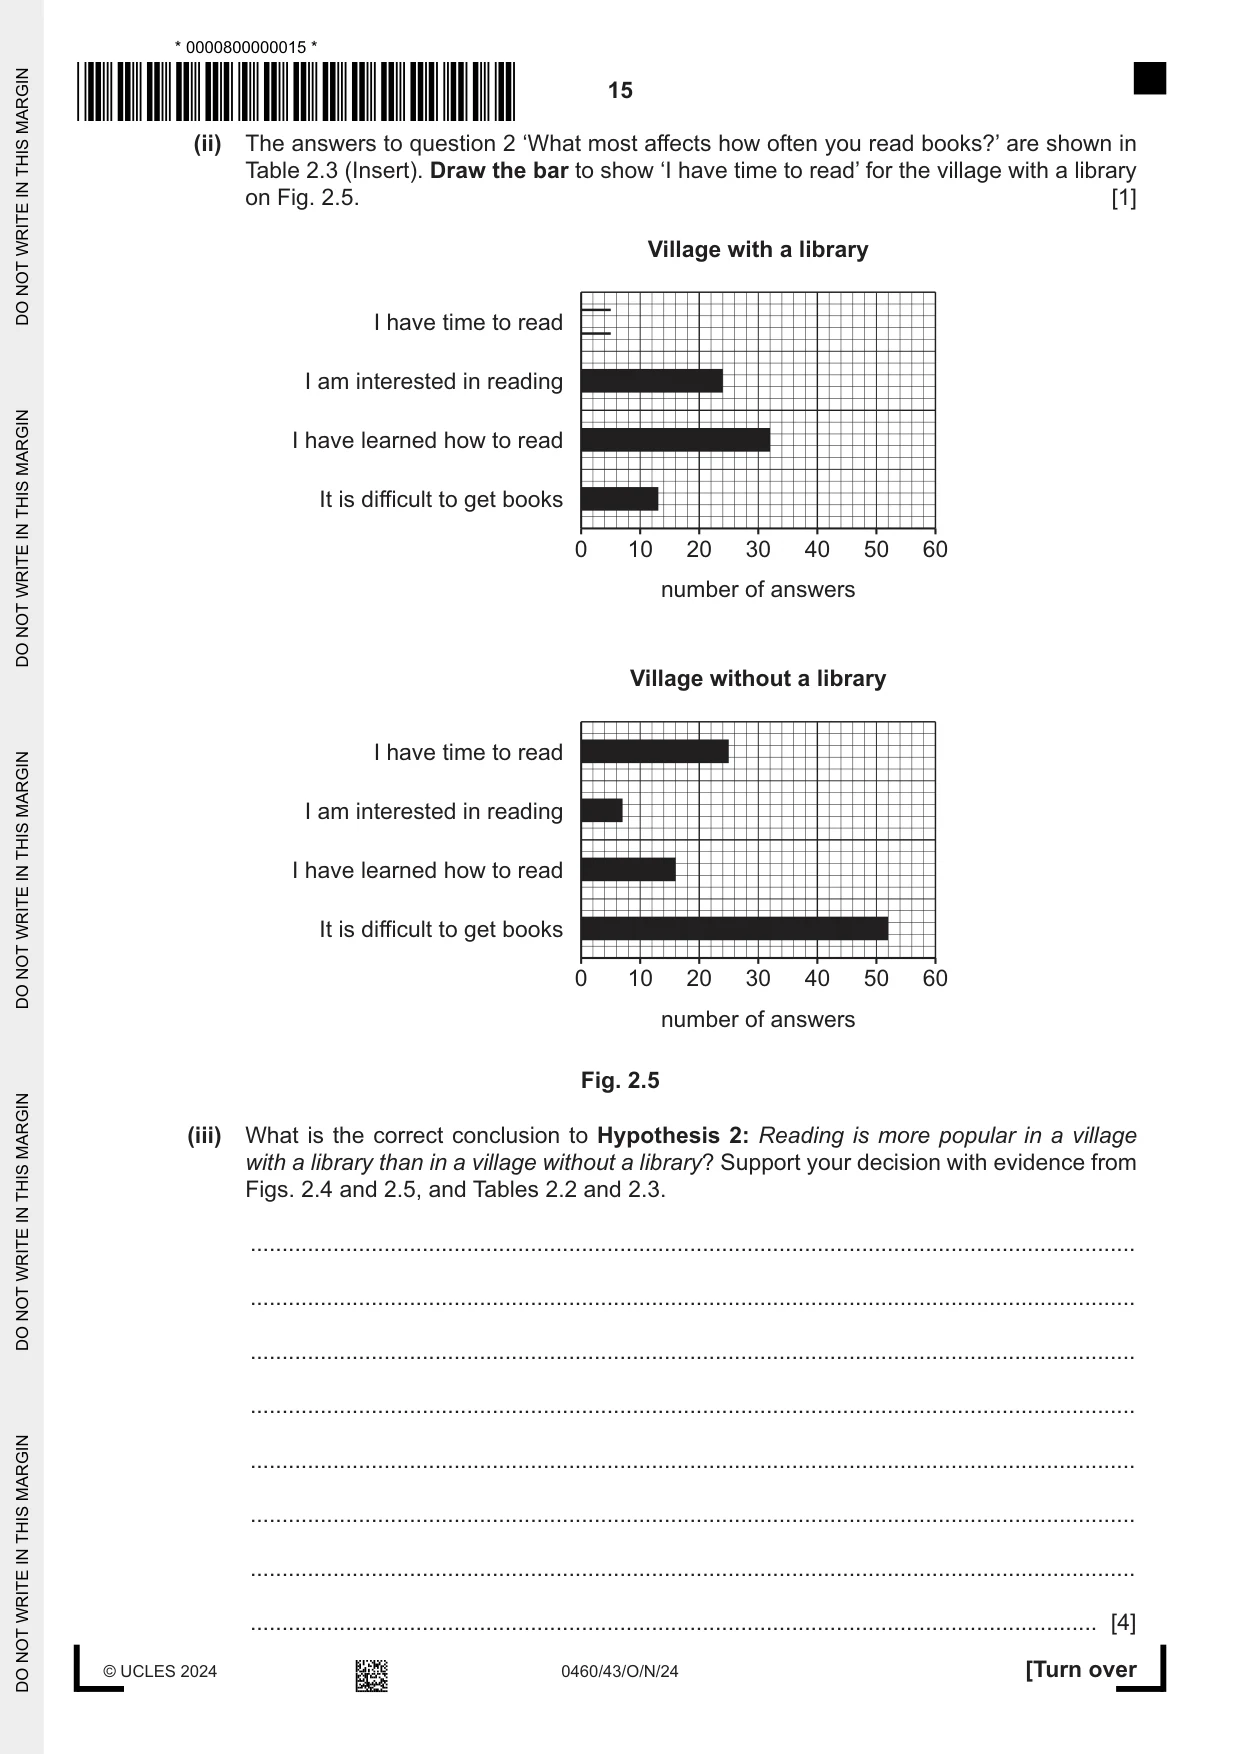
2 Students in Nigeria were studying indicators of development. One indicator is the Human Development Index (HDI). (a) Which two of the following are included in the Human Development Index? Tick (✓) your answers. tick (✓) access to clean drinking water average number of years studying at school birth rate life expectancy percentage of population in primary sector of industry [2] The students decided to investigate development indicators in two villages. One student chose infant mortality and literacy as their hypothesis topics. Hypothesis 1: The main cause of infant mortality is the lack of health care. Hypothesis 2: Reading is more popular in a village with a library than in a village without a library. (b) To investigate their hypotheses the students used a questionnaire. (i) The students gave the questionnaire to 20 people in a pilot study. Suggest two reasons why they did a pilot study. 1 ........................................................................................................................................ ........................................................................................................................................... 2 ........................................................................................................................................ ........................................................................................................................................... [2] (ii) In the pilot study, the students gave the questionnaire to people and asked them to return it to the students when they had completed it. What are the weaknesses of this method of research? ........................................................................................................................................... ........................................................................................................................................... ........................................................................................................................................... ........................................................................................................................................... ........................................................................................................................................... ..................................................................................................................................... [3] (c) For their main study, the students decided to complete the questionnaire by asking people directly. They sampled 100 people in each village. They could use a random, systematic or stratified method of sampling. Choose one sampling method. Describe the method and explain why it would be a good method to use. sampling method: .................................................................................................. ................................................................................................................................................... ................................................................................................................................................... ................................................................................................................................................... ................................................................................................................................................... ................................................................................................................................................... ............................................................................................................................................. [3] (d) Part of the questionnaire the student used to investigate Hypothesis 1: The main cause of infant mortality is the lack of health care, is shown in Fig. 2.1 (Insert). The results of the infant mortality question are shown in Table 2.1 (Insert). (i) Complete the divided bar for ‘overcrowded living conditions’ on Fig. 2.2. [3] (ii) What conclusion would the student make about Hypothesis 1: The main cause of infant mortality is the lack of health care? What evidence in Fig. 2.2 and Table 2.1 supports their conclusion? ........................................................................................................................................... ........................................................................................................................................... ........................................................................................................................................... ........................................................................................................................................... ........................................................................................................................................... ..................................................................................................................................... [3] Results of the infant mortality question % 0 10 20 30 40 50 60 70 80 90 100 contaminated water inadequate sanitation lack of health care malnutrition overcrowded living conditions 0 10 20 30 40 50 60 70 80 90 100 % Key most important rank 1 rank 2 rank 3 rank 4 rank 5 least important Fig. 2.2
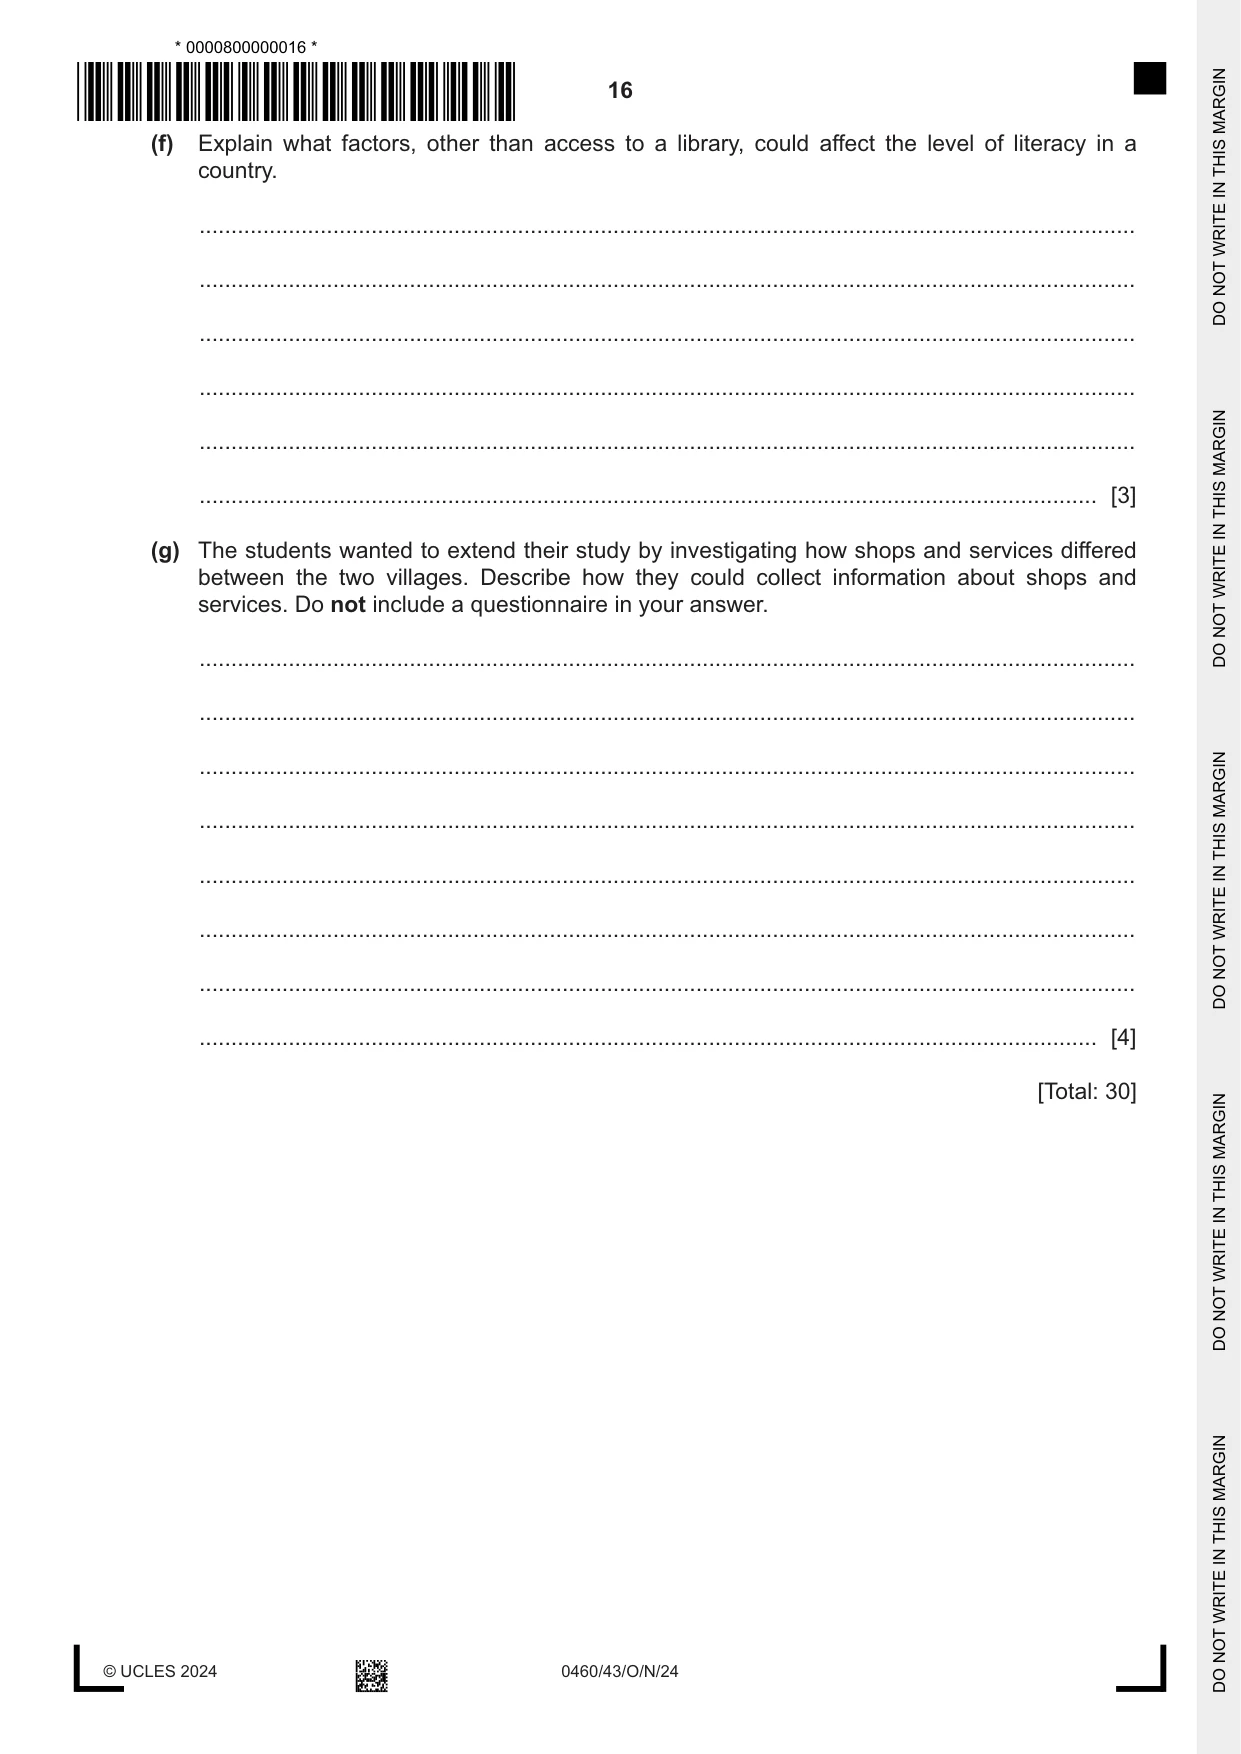
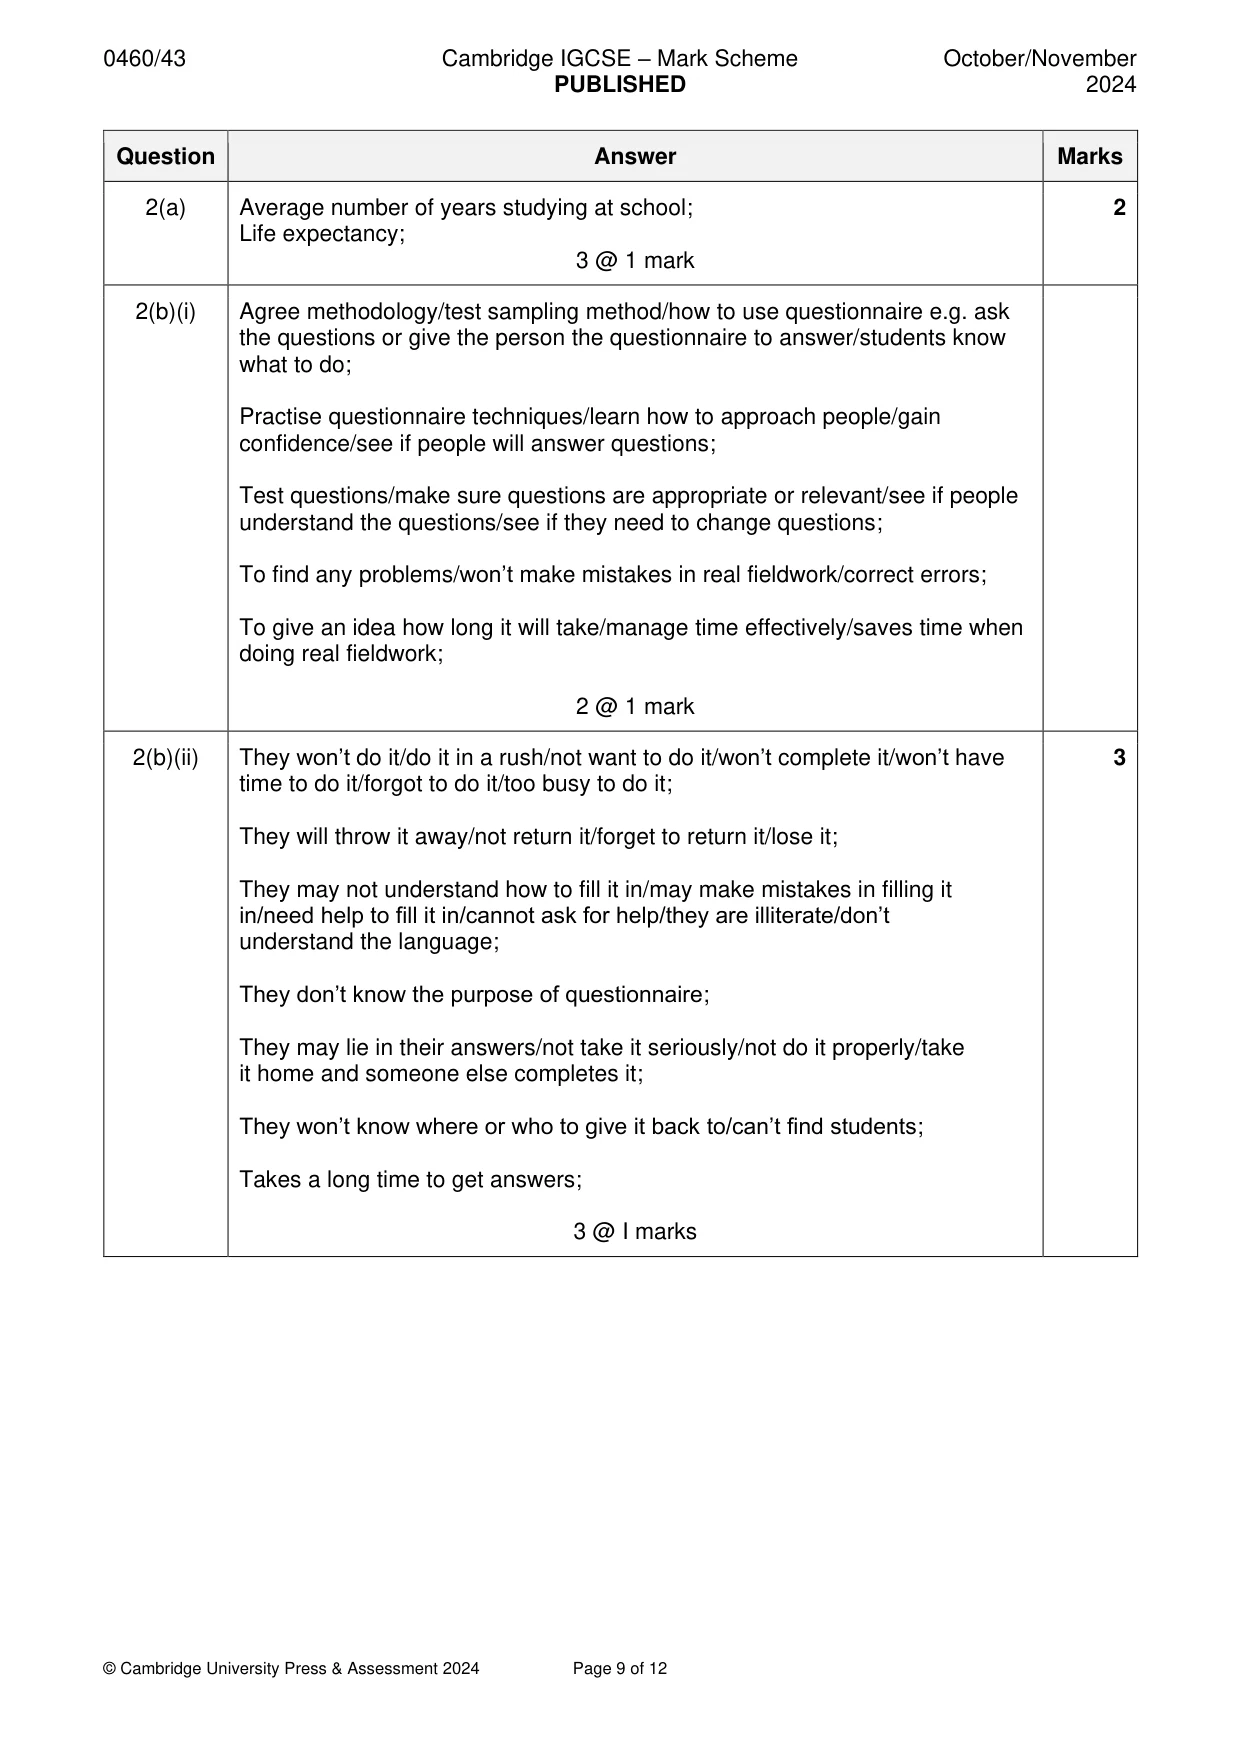
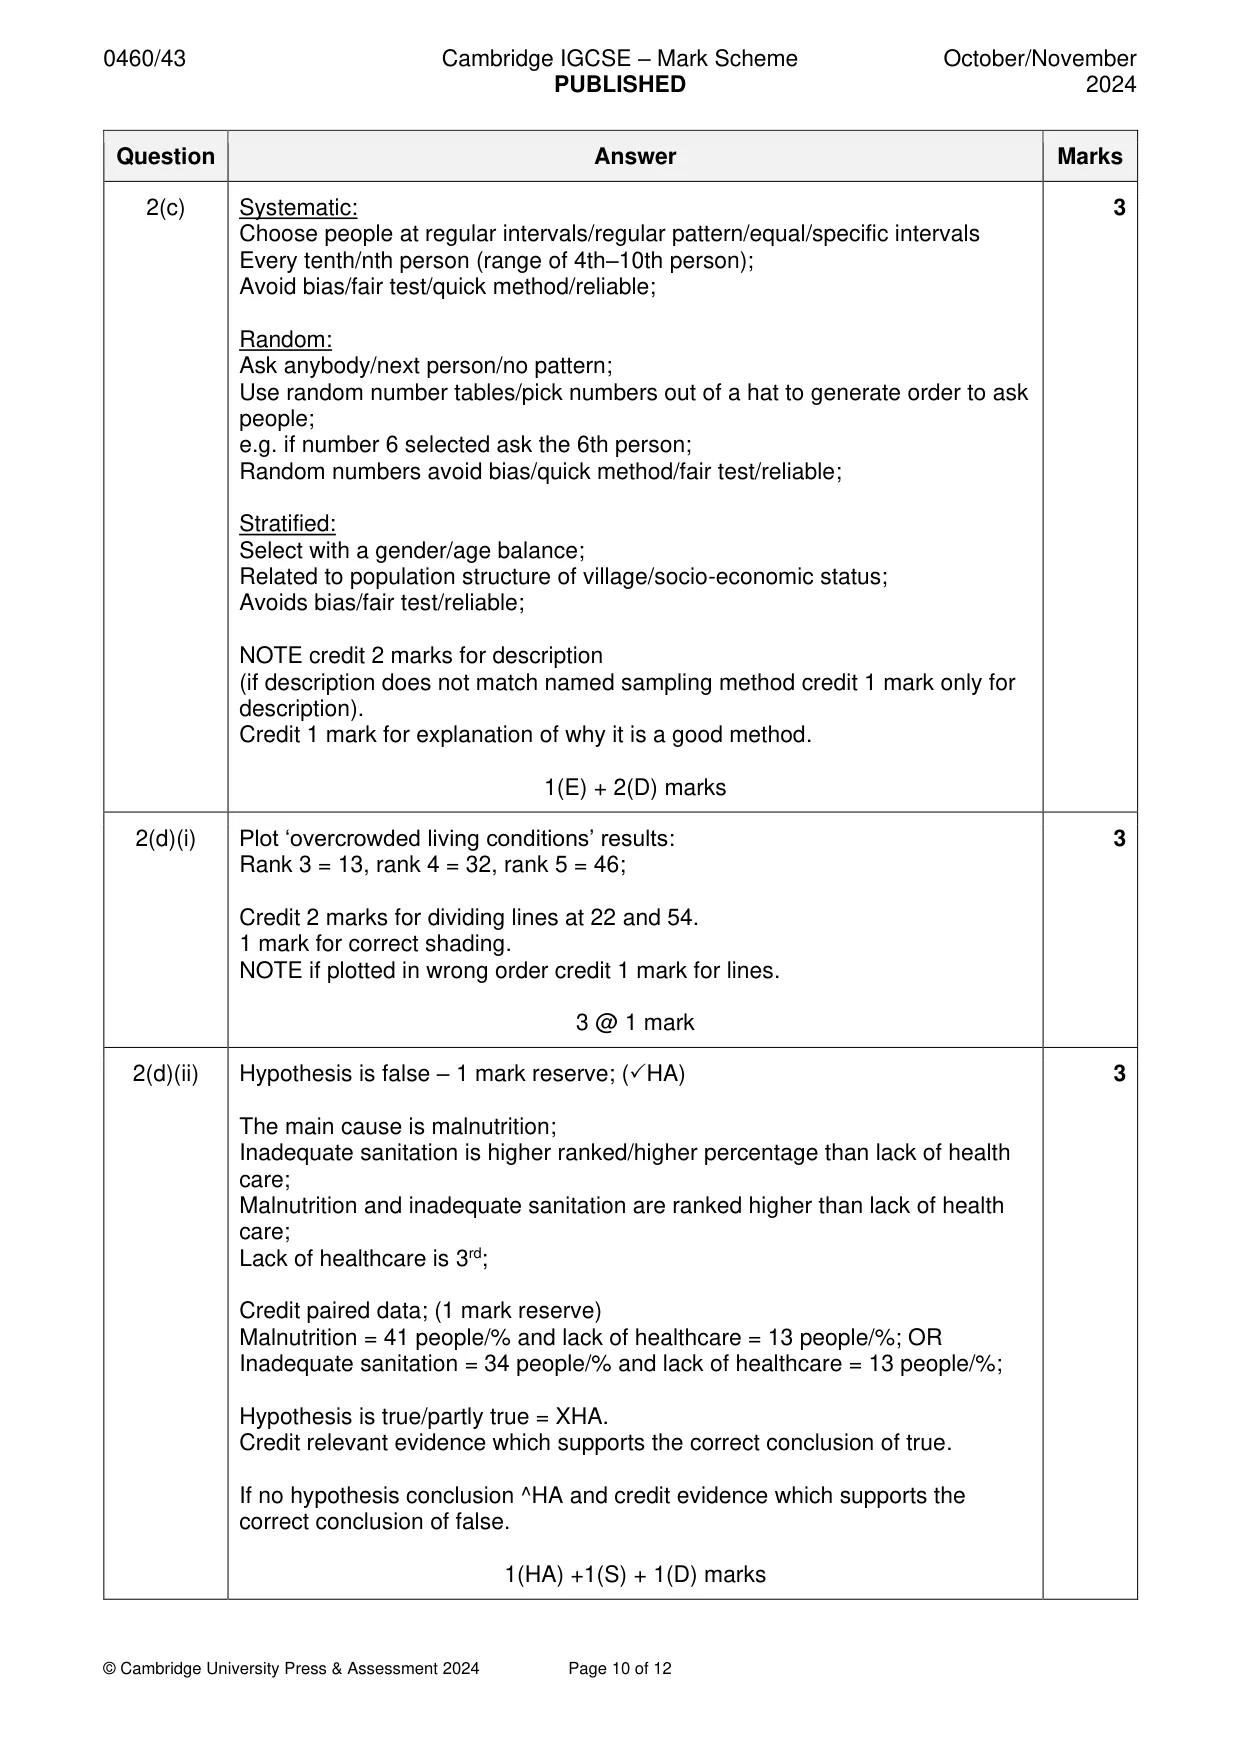
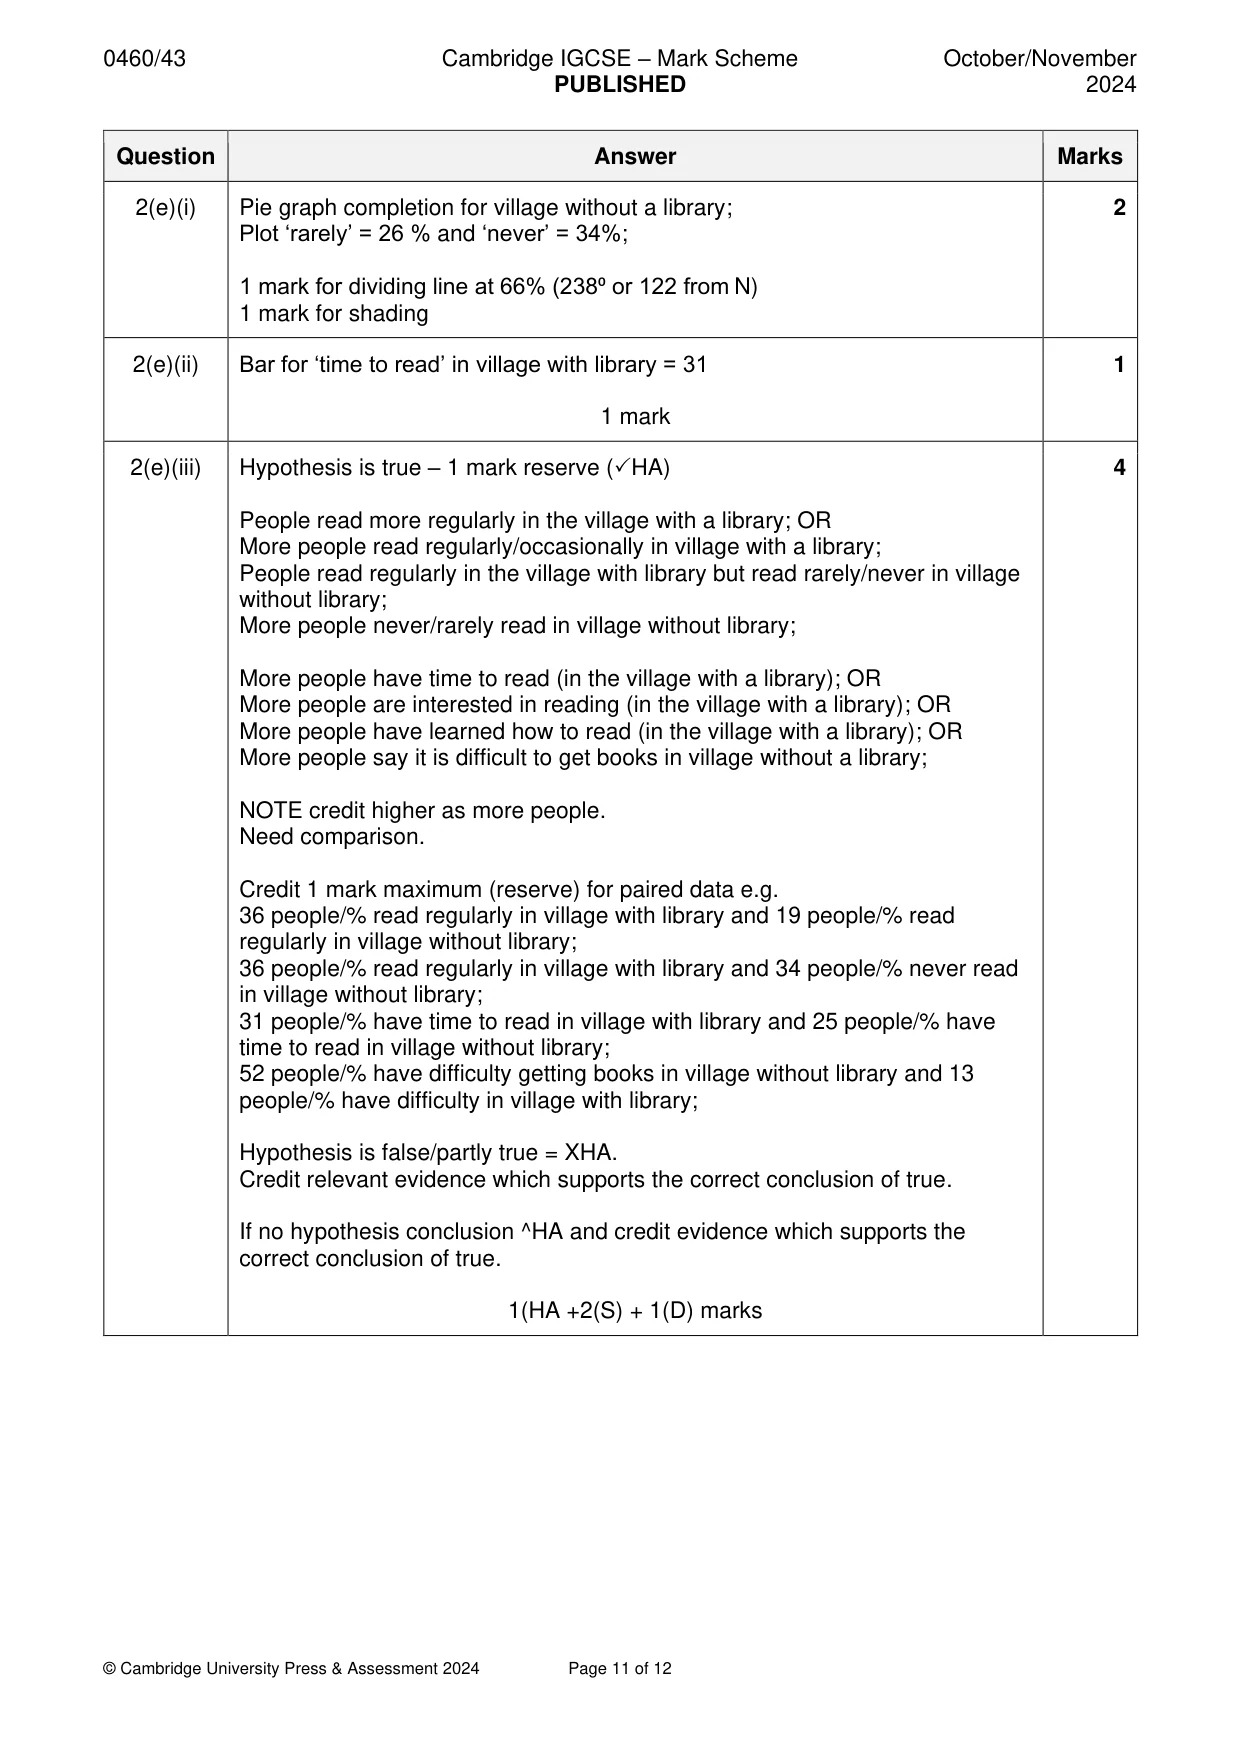
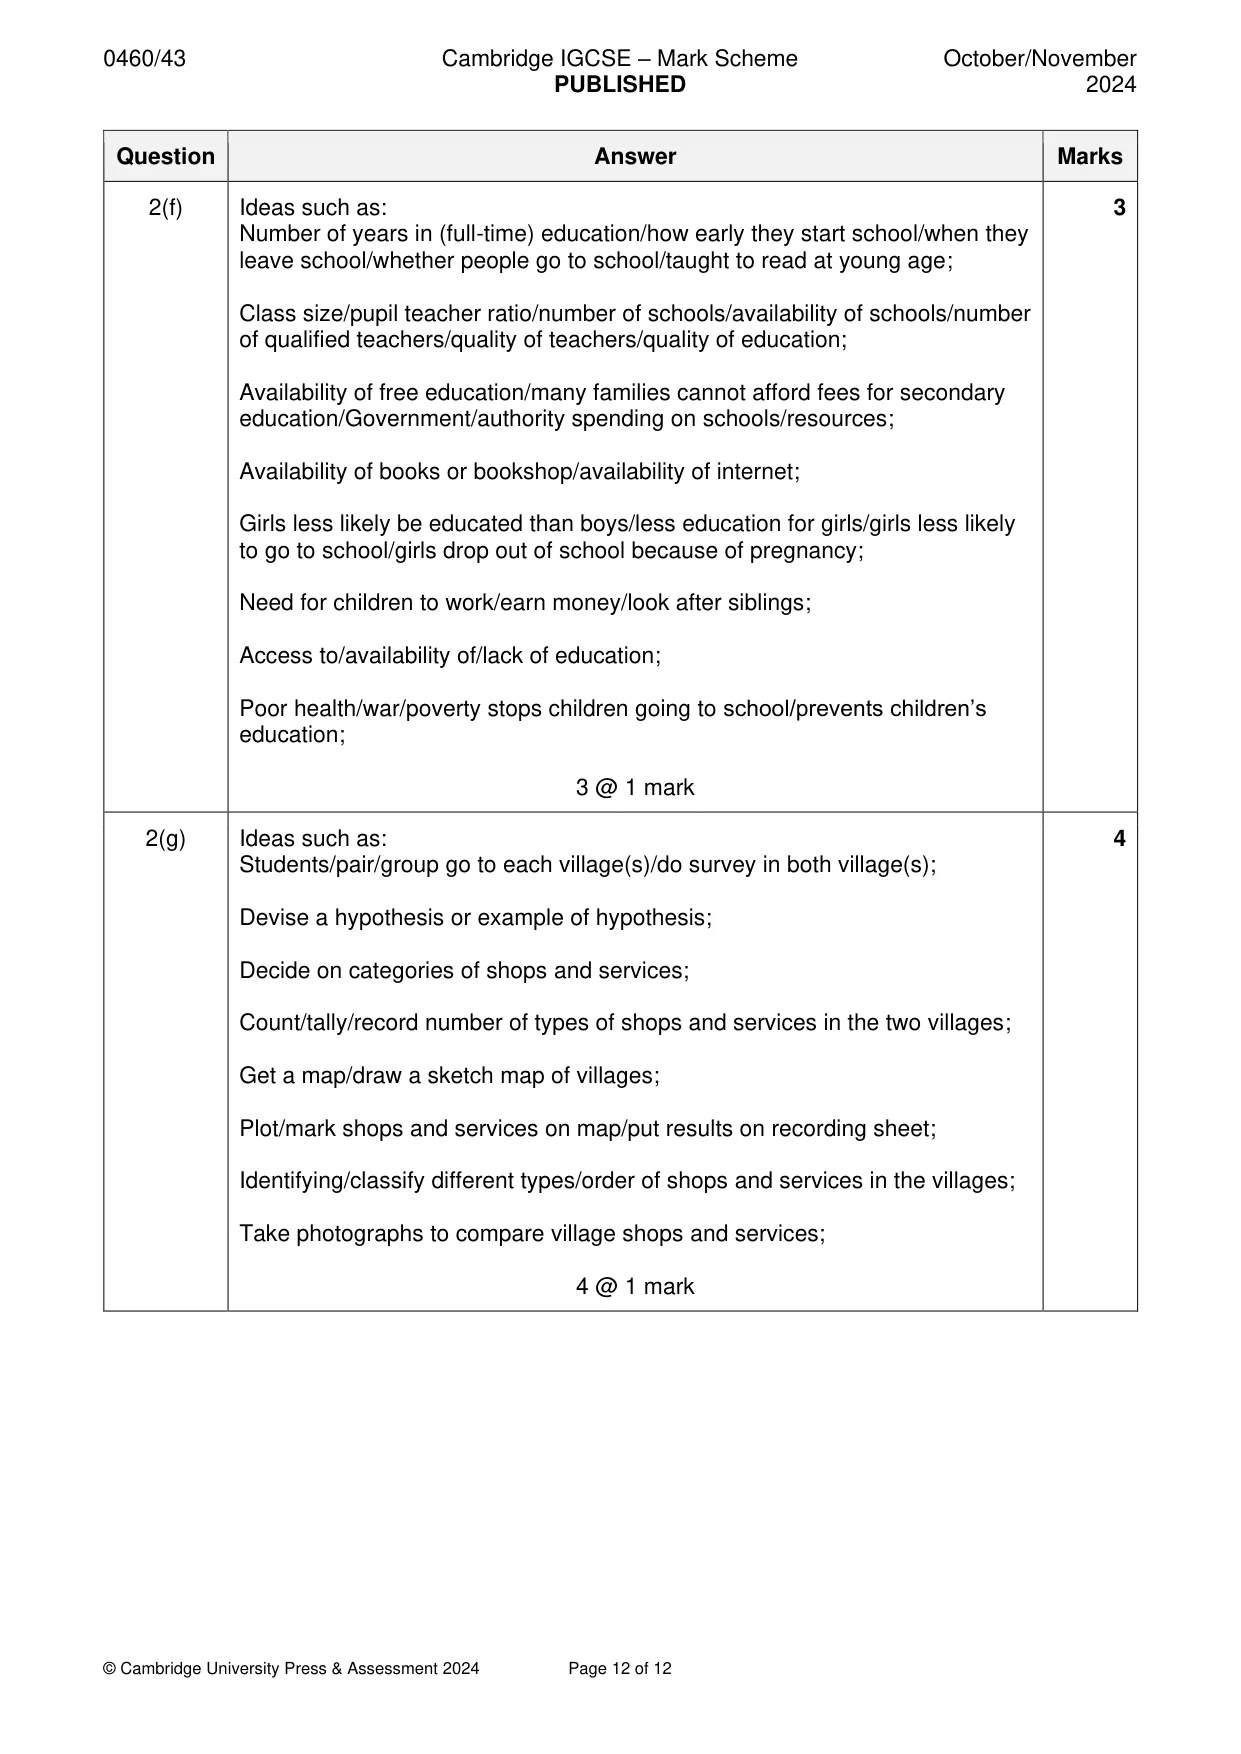
Mark scheme: 2(a) Average number of years studying at school; 2 Life expectancy; 3 @ 1 mark 2(b)(i) Agree methodology/test sampling method/how to use questionnaire e.g. ask the questions or give the person the questionnaire to answer/students know what to do; Practise questionnaire techniques/learn how to approach people/gain confidence/see if people will answer questions; Test questions/make sure questions are appropriate or relevant/see if people understand the questions/see if they need to change questions; To find any problems/won’t make mistakes in real fieldwork/correct errors; To give an idea how long it will take/manage time effectively/saves time when doing real fieldwork; 2 @ 1 mark 2(b)(ii) They won’t do it/do it in a rush/not want to do it/won’t complete it/won’t have 3 time to do it/forgot to do it/too busy to do it; They will throw it away/not return it/forget to return it/lose it; They may not understand how to fill it in/may make mistakes in filling it in/need help to fill it in/cannot ask for help/they are illiterate/don’t understand the language; They don’t know the purpose of questionnaire; They may lie in their answers/not take it seriously/not do it properly/take it home and someone else completes it; They won’t know where or who to give it back to/can’t find students; Takes a long time to get answers; 3 @ I marks 2(c) Systematic: 3 Choose people at regular intervals/regular pattern/equal/specific intervals Every tenth/nth person (range of 4th–10th person); Avoid bias/fair test/quick method/reliable; Random: Ask anybody/next person/no pattern; Use random number tables/pick numbers out of a hat to generate order to ask people; e.g. if number 6 selected ask the 6th person; Random numbers avoid bias/quick method/fair test/reliable; Stratified: Select with a gender/age balance; Related to population structure of village/socio-economic status; Avoids bias/fair test/reliable; NOTE credit 2 marks for description (if description does not match named sampling method credit 1 mark only for description). Credit 1 mark for explanation of why it is a good method. 1(E) + 2(D) marks 2(d)(i) Plot ‘overcrowded living conditions’ results: 3 Rank 3 = 13, rank 4 = 32, rank 5 = 46; Credit 2 marks for dividing lines at 22 and 54. 1 mark for correct shading. NOTE if plotted in wrong order credit 1 mark for lines. 3 @ 1 mark 2(d)(ii) Hypothesis is false – 1 mark reserve; (HA) 3 The main cause is malnutrition; Inadequate sanitation is higher ranked/higher percentage than lack of health care; Malnutrition and inadequate sanitation are ranked higher than lack of health care; Lack of healthcare is 3rd; Credit paired data; (1 mark reserve) Malnutrition = 41 people/% and lack of healthcare = 13 people/%; OR Inadequate sanitation = 34 people/% and lack of healthcare = 13 people/%; Hypothesis is true/partly true = XHA. Credit relevant evidence which supports the correct conclusion of true. If no hypothesis conclusion ^HA and credit evidence which supports the correct conclusion of false. 1(HA) +1(S) + 1(D) marks 2(e)(i) Pie graph completion for village without a library; 2 Plot ‘rarely’ = 26 % and ‘never’ = 34%; 1 mark for dividing line at 66% (238⁰ or 122 from N) 1 mark for shading 2(e)(ii) Bar for ‘time to read’ in village with library = 31 1 1 mark 2(e)(iii) Hypothesis is true – 1 mark reserve (HA) 4 People read more regularly in the village with a library; OR More people read regularly/occasionally in village with a library; People read regularly in the village with library but read rarely/never in village without library; More people never/rarely read in village without library; More people have time to read (in the village with a library); OR More people are interested in reading (in the village with a library); OR More people have learned how to read (in the village with a library); OR More people say it is difficult to get books in village without a library; NOTE credit higher as more people. Need comparison. Credit 1 mark maximum (reserve) for paired data e.g. 36 people/% read regularly in village with library and 19 people/% read regularly in village without library; 36 people/% read regularly in village with library and 34 people/% never read in village without library; 31 people/% have time to read in village with library and 25 people/% have time to read in village without library; 52 people/% have difficulty getting books in village without library and 13 people/% have difficulty in village with library; Hypothesis is false/partly true = XHA. Credit relevant evidence which supports the correct conclusion of true. If no hypothesis conclusion ^HA and credit evidence which supports the correct conclusion of true. 1(HA +2(S) + 1(D) marks 2(f) Ideas such as: 3 Number of years in (full-time) education/how early they start school/when they leave school/whether people go to school/taught to read at young age; Class size/pupil teacher ratio/number of schools/availability of schools/number of qualified teachers/quality of teachers/quality of education; Availability of free education/many families cannot afford fees for secondary education/Government/authority spending on schools/resources; Availability of books or bookshop/availability of internet; Girls less likely be educated than boys/less education for girls/girls less likely to go to school/girls drop out of school because of pregnancy; Need for children to work/earn money/look after siblings; Access to/availability of/lack of education; Poor health/war/poverty stops children going to school/prevents children’s education; 3 @ 1 mark 2(g) Ideas such as: 4 Students/pair/group go to each village(s)/do survey in both village(s); Devise a hypothesis or example of hypothesis; Decide on categories of shops and services; Count/tally/record number of types of shops and services in the two villages; Get a map/draw a sketch map of villages; Plot/mark shops and services on map/put results on recording sheet; Identifying/classify different types/order of shops and services in the villages; Take photographs to compare village shops and services; 4 @ 1 mark
What was in this paper
The subtopics covered by these 2 questions, and how many questions each got. Open one in a new tab to see every Cambridge question on it.
What you needed in this session
Cambridge’s own grade thresholds for 2024 Oct/Nov, Paper 4 · Variant 3. A higher threshold means an easier paper — the bar moves with how the cohort did.