Cambridge IGCSE Geography 0460 — 2025 Oct/Nov Paper 4 · Variant 2
0460/42/O/N/25 · 2 questions · 60 marks · 90 min
The question paper and its mark scheme, free to read here and free to download. This is Cambridge’s own paper, exactly as it was sat.
Question paper16 pages

Mark scheme9 pages
Answers below. Sit the paper first if you are practising.
Questions as text
Q1 · Students in Shanghai, China investigated differences in temperatures and wind speed…
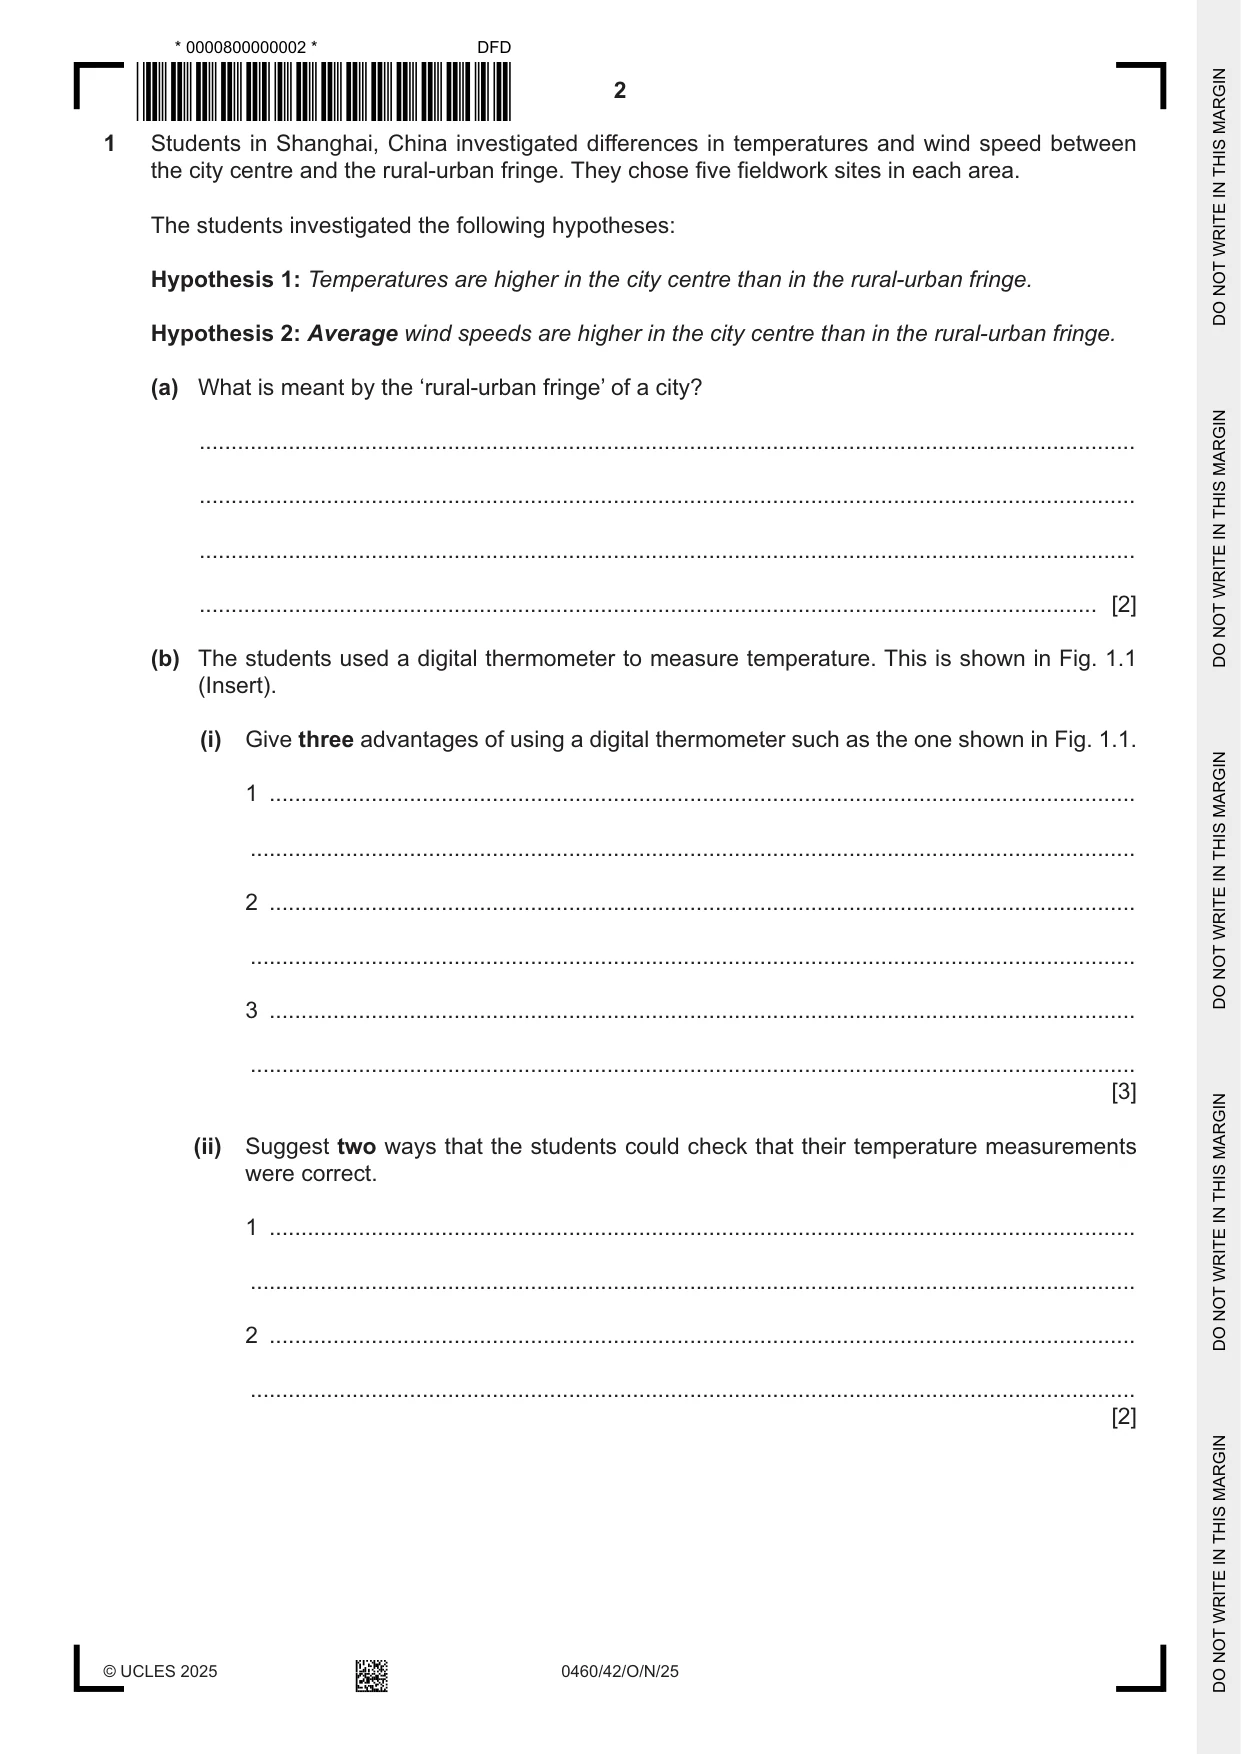
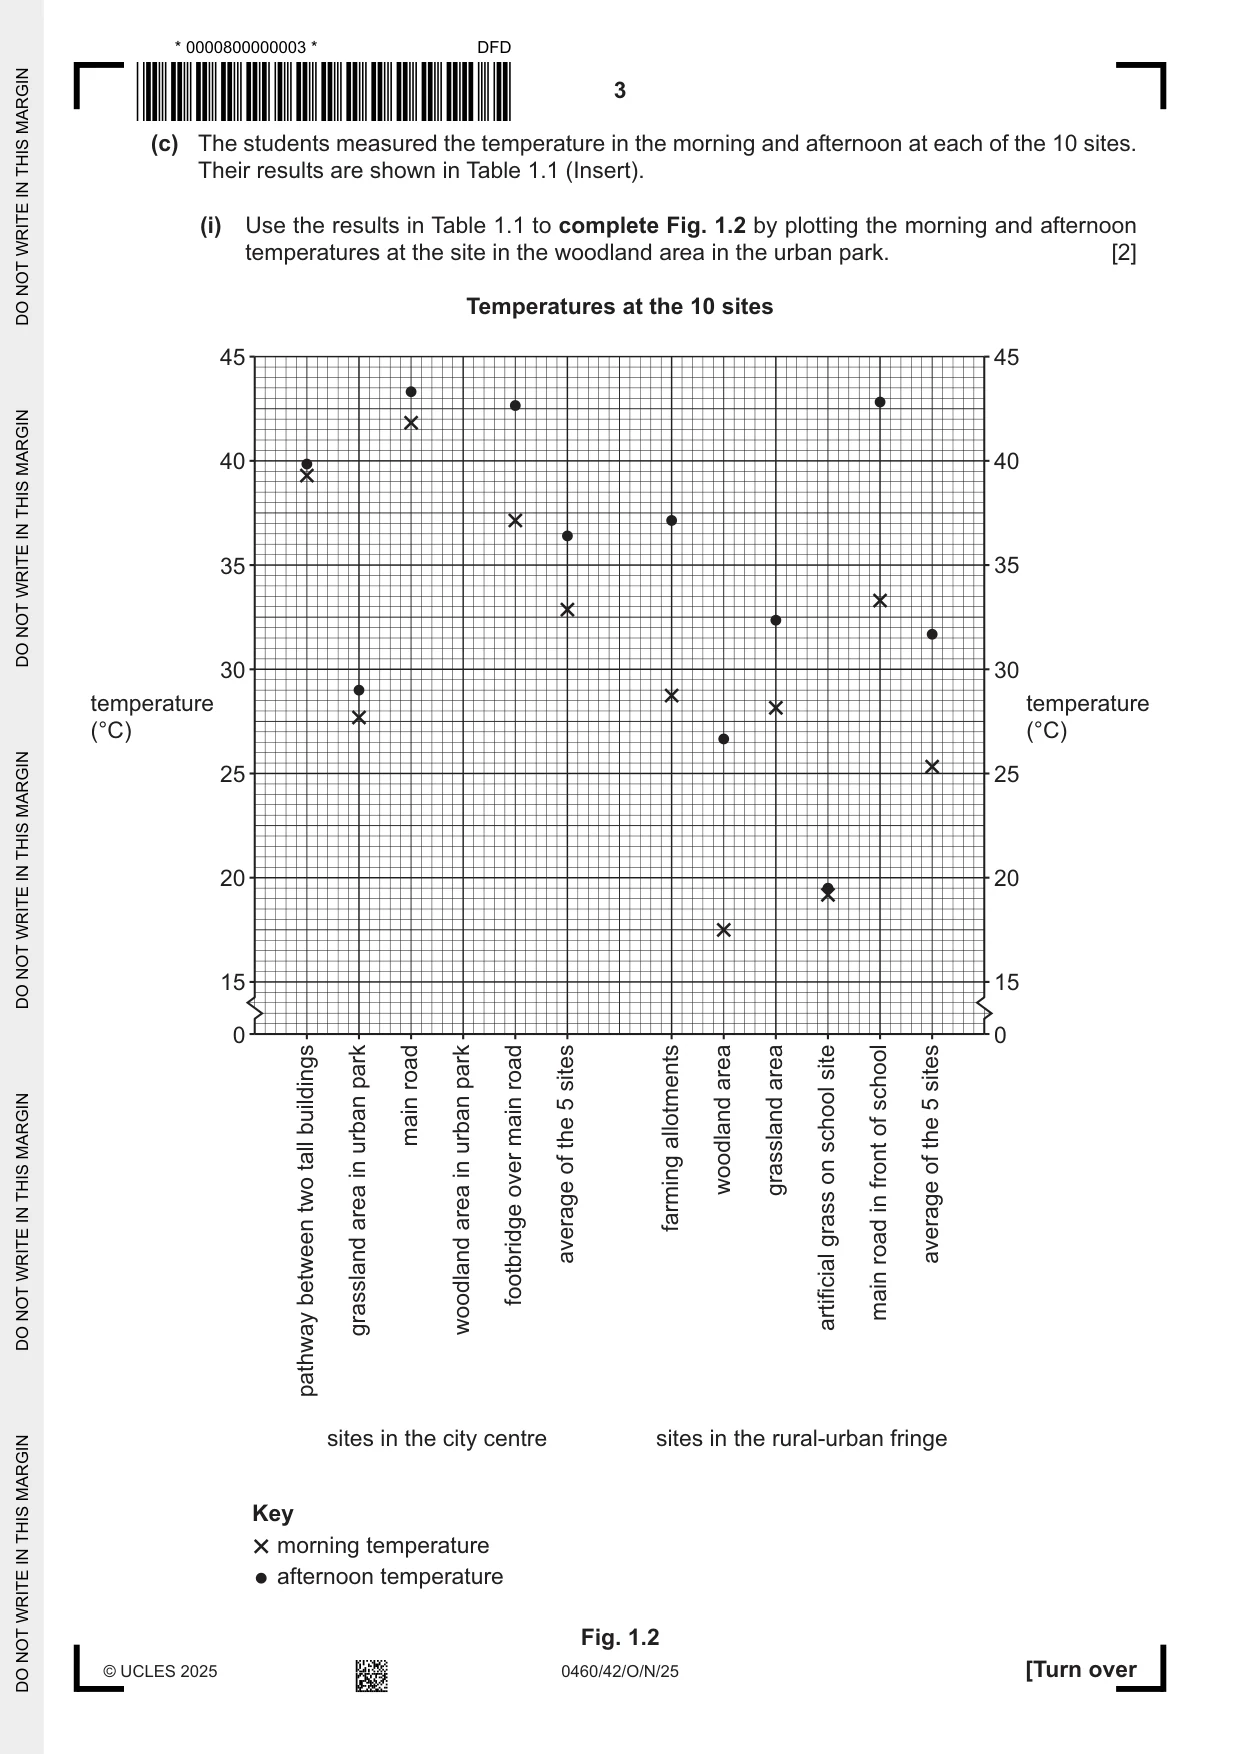
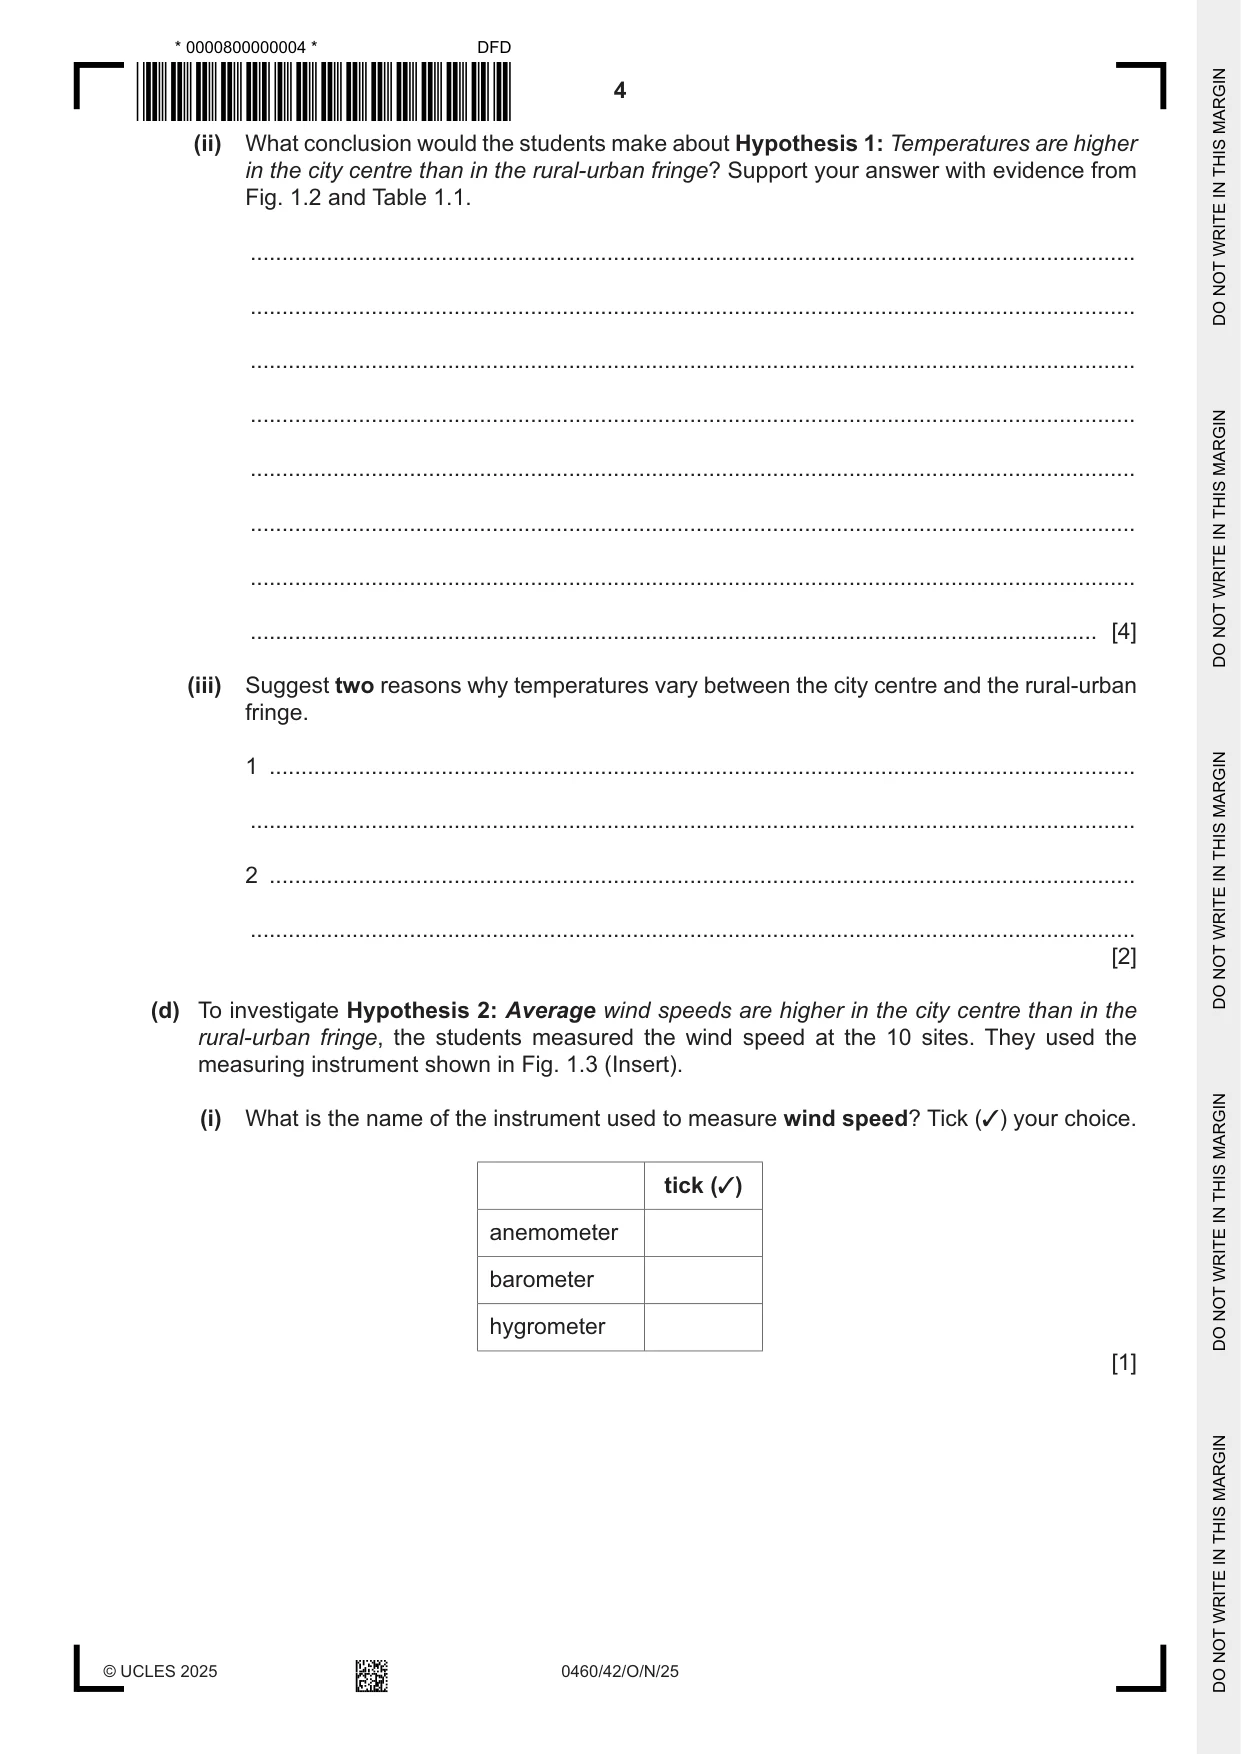
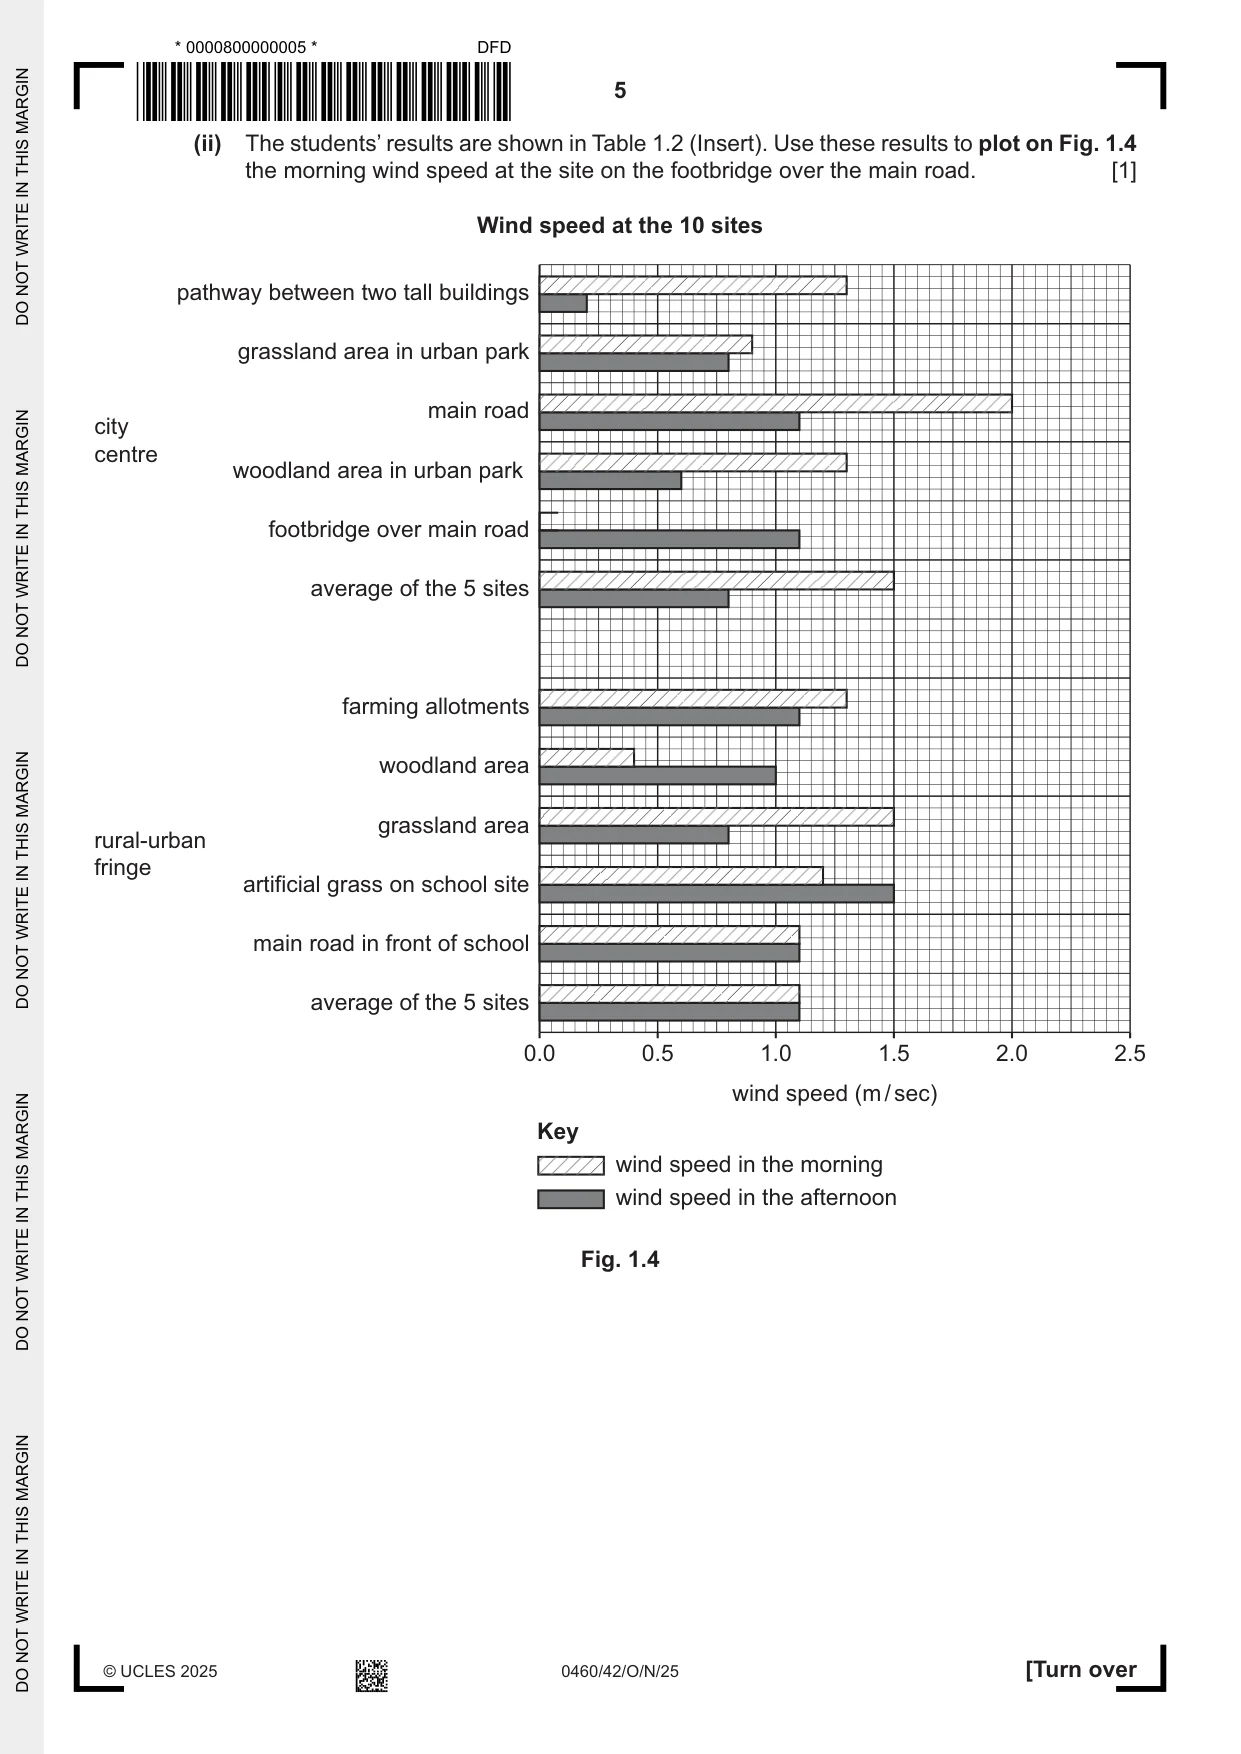
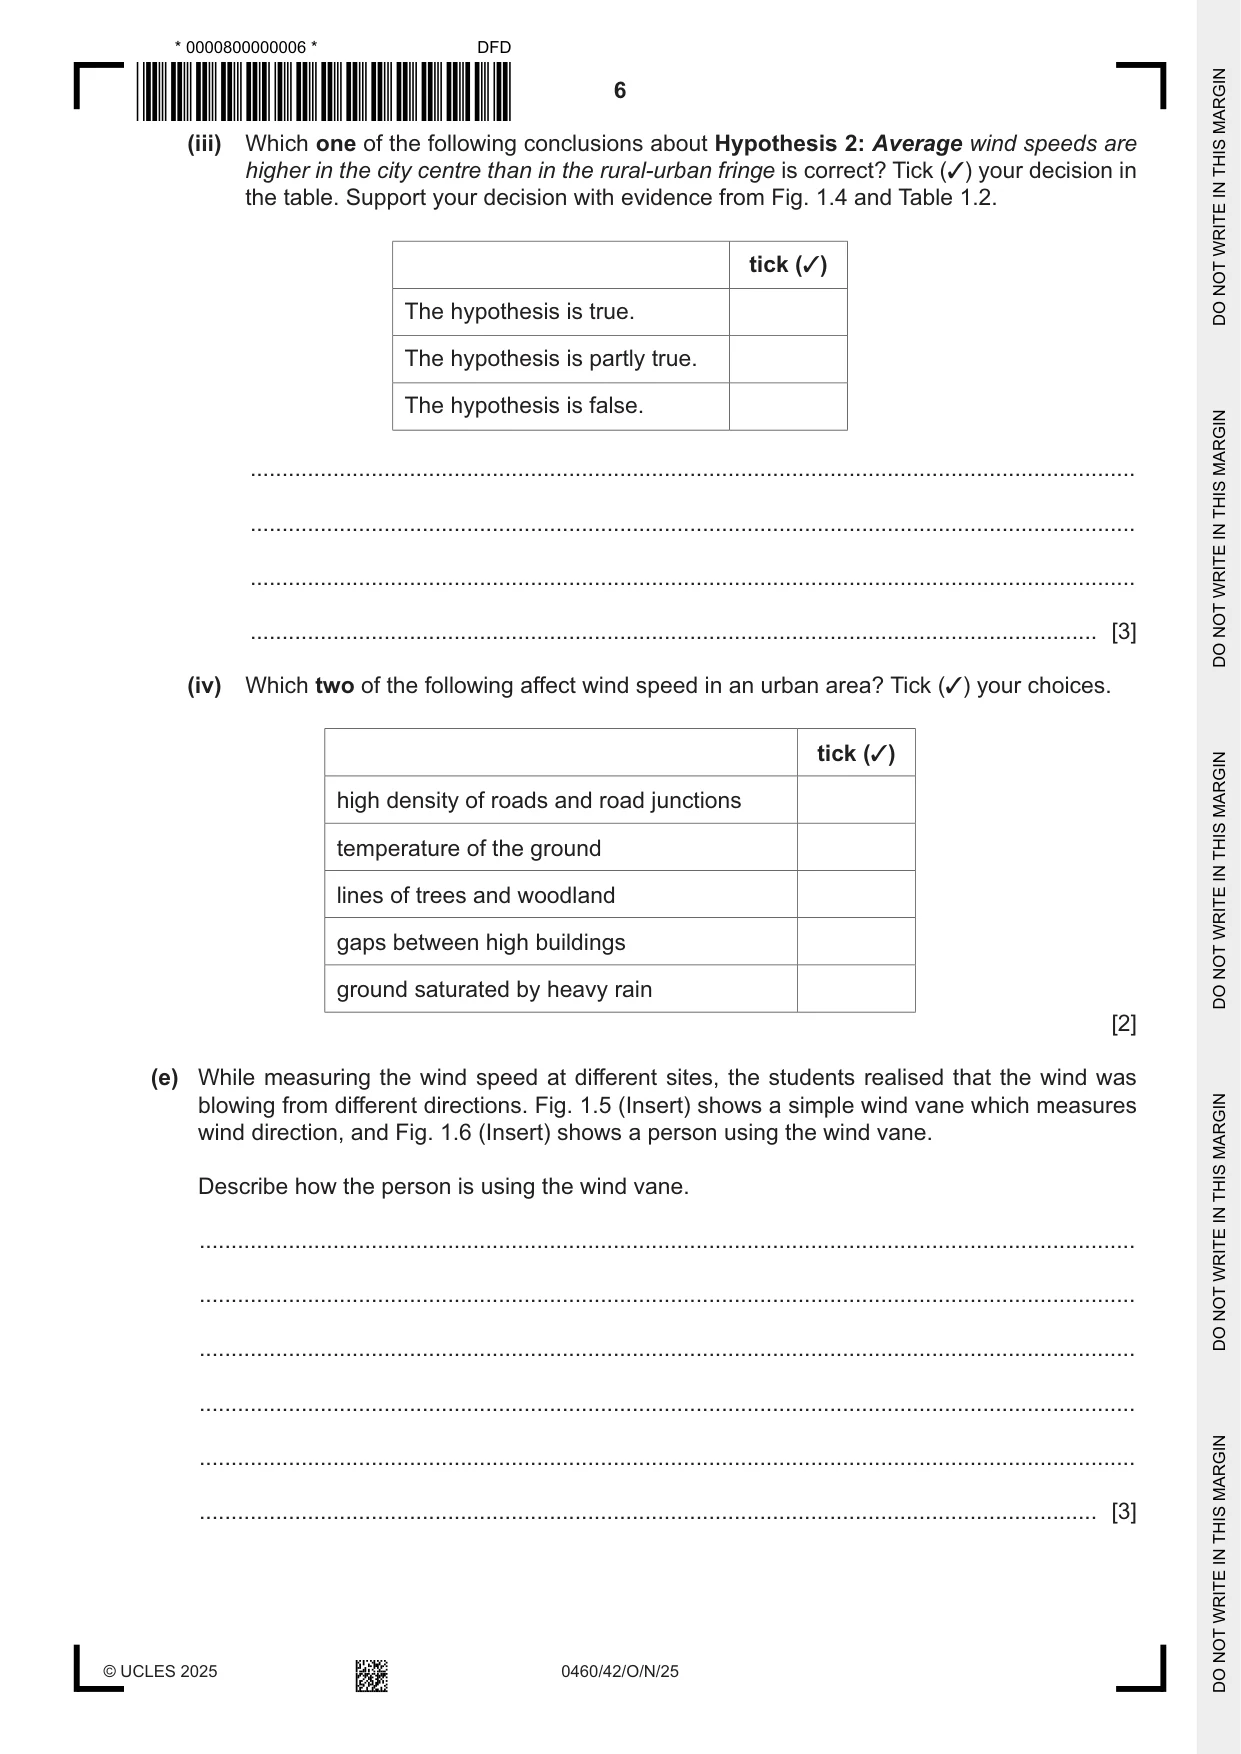
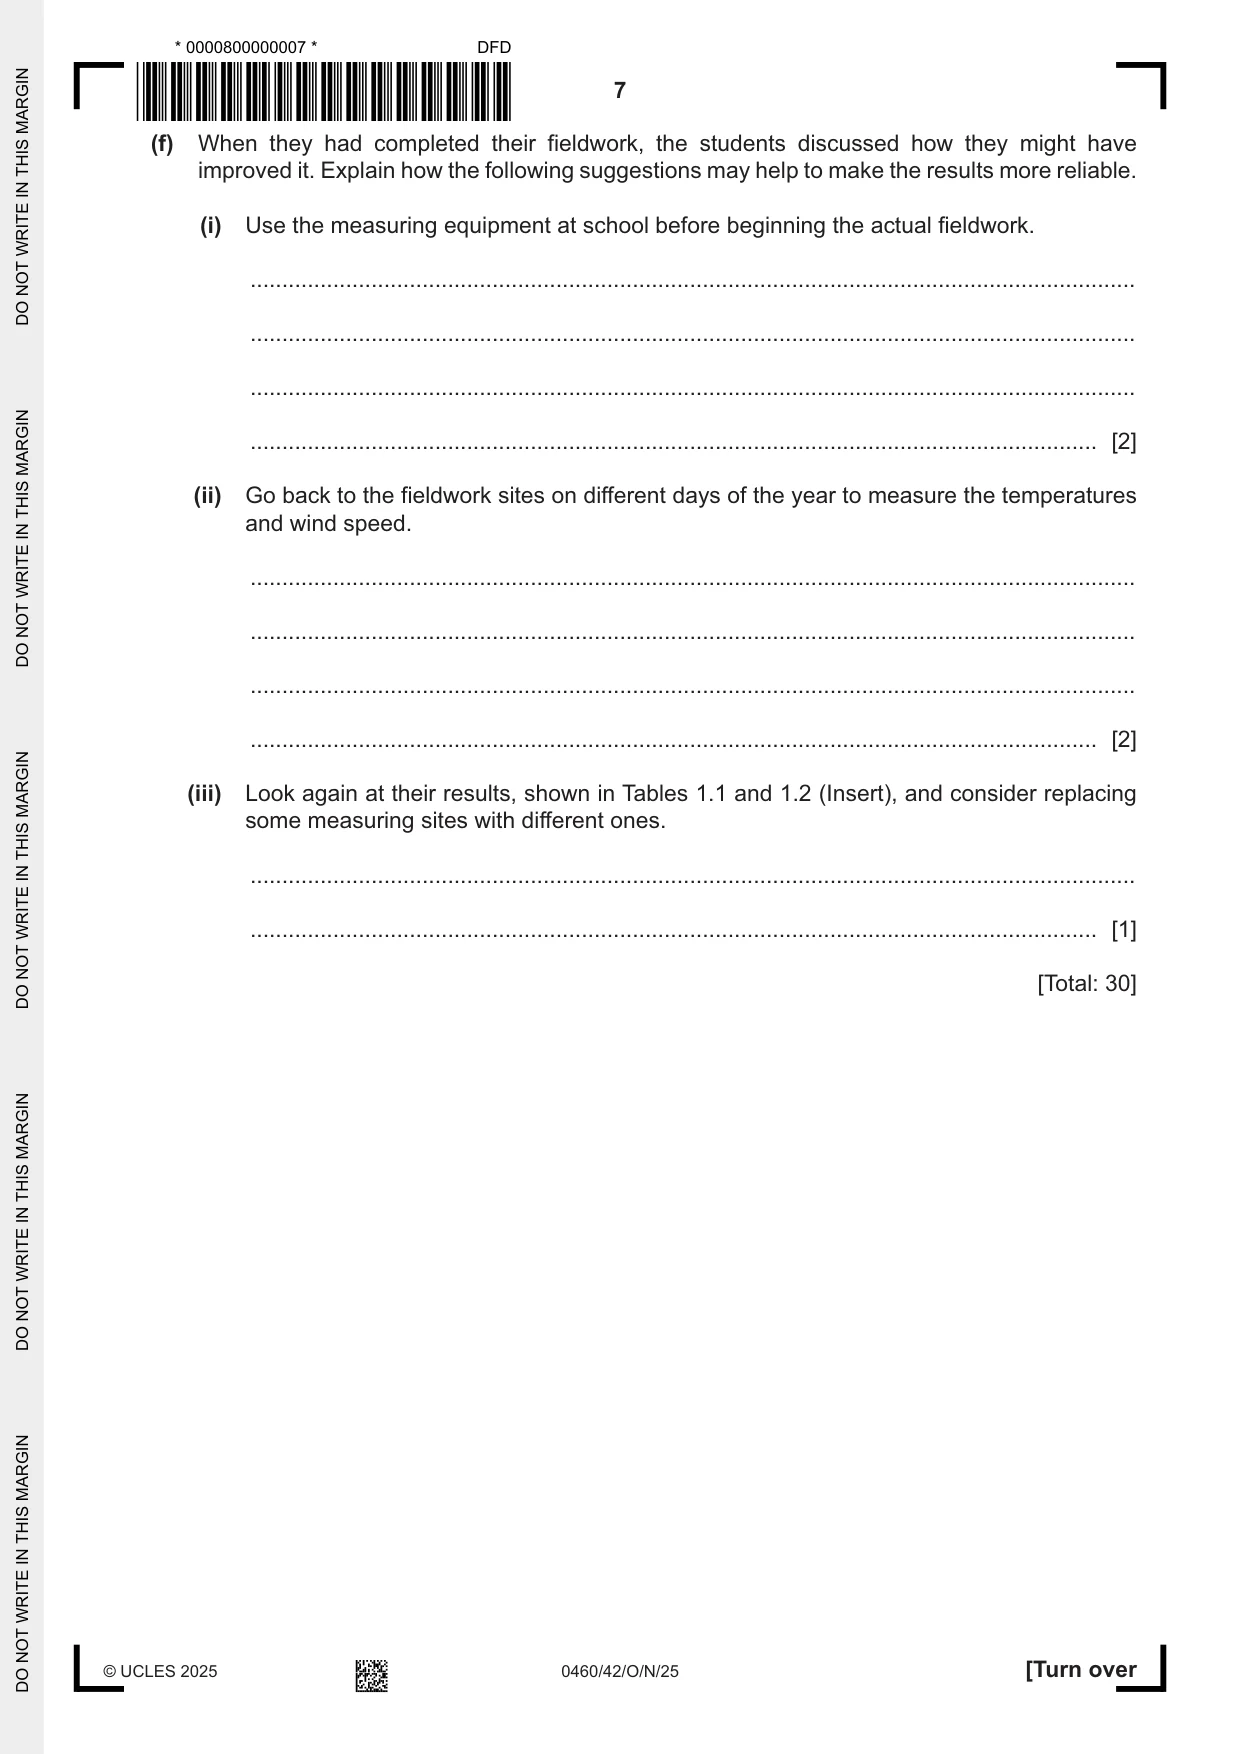
1 Students in Shanghai, China investigated differences in temperatures and wind speed between the city centre and the rural‑urban fringe. They chose five fieldwork sites in each area. The students investigated the following hypotheses: Hypothesis 1: Temperatures are higher in the city centre than in the rural‑urban fringe. Hypothesis 2: Average wind speeds are higher in the city centre than in the rural‑urban fringe. (a) What is meant by the ‘rural‑urban fringe’ of a city? ................................................................................................................................................... ................................................................................................................................................... ................................................................................................................................................... ............................................................................................................................................. [2] (b) The students used a digital thermometer to measure temperature. This is shown in Fig. 1.1 (Insert). (i) Give three advantages of using a digital thermometer such as the one shown in Fig. 1.1. 1 ........................................................................................................................................ ........................................................................................................................................... 2 ........................................................................................................................................ ........................................................................................................................................... 3 ........................................................................................................................................ ........................................................................................................................................... [3] (ii) Suggest two ways that the students could check that their temperature measurements were correct. 1 ........................................................................................................................................ ........................................................................................................................................... 2 ........................................................................................................................................ ........................................................................................................................................... [2] (c) The students measured the temperature in the morning and afternoon at each of the 10 sites. Their results are shown in Table 1.1 (Insert). (i) Use the results in Table 1.1 to complete Fig. 1.2 by plotting the morning and afternoon temperatures at the site in the woodland area in the urban park. [2] Temperatures at the 10 sites 45 45 40 40 35 35 30 30 temperature temperature (°C) (°C) 25 25 20 20 15 15 0 0 5 school buildings park road park road sites area area site sites of urban main urban main the allotments school 5the tall in in of on front of over woodland grassland two in area area farming grass average road average between footbridge main grassland woodland artificial pathway sites in the city centre sites in the rural-urban fringe Key morning temperature afternoon temperature Fig. 1.2 (ii) What conclusion would the students make about Hypothesis 1: Temperatures are higher in the city centre than in the rural‑urban fringe? Support your answer with evidence from Fig. 1.2 and Table 1.1. ........................................................................................................................................... ........................................................................................................................................... ........................................................................................................................................... ........................................................................................................................................... ........................................................................................................................................... ........................................................................................................................................... ........................................................................................................................................... ..................................................................................................................................... [4] (iii) Suggest two reasons why temperatures vary between the city centre and the rural‑urban fringe. 1 ........................................................................................................................................ ........................................................................................................................................... 2 ........................................................................................................................................ ........................................................................................................................................... [2] (d) To investigate Hypothesis 2: Average wind speeds are higher in the city centre than in the rural‑urban fringe, the students measured the wind speed at the 10 sites. They used the measuring instrument shown in Fig. 1.3 (Insert). (i) What is the name of the instrument used to measure wind speed? Tick (3) your choice. tick (3) anemometer barometer hygrometer [1] (ii) The students’ results are shown in Table 1.2 (Insert). Use these results to plot on Fig. 1.4 the morning wind speed at the site on the footbridge over the main road. [1] Wind speed at the 10 sites pathway between two tall buildings grassland area in urban park main road city centre woodland area in urban park footbridge over main road average of the 5 sites farming allotments woodland area grassland area rural-urban fringe artificial grass on school site main road in front of school average of the 5 sites 0.0 0.5 1.0 1.5 2.0 2.5 wind speed (m / sec) Key wind speed in the morning wind speed in the afternoon Fig. 1.4 (iii) Which one of the following conclusions about Hypothesis 2: Average wind speeds are higher in the city centre than in the rural‑urban fringe is correct? Tick (3) your decision in the table. Support your decision with evidence from Fig. 1.4 and Table 1.2. tick (3) The hypothesis is true. The hypothesis is partly true. The hypothesis is false. ........................................................................................................................................... ........................................................................................................................................... ........................................................................................................................................... ..................................................................................................................................... [3] (iv) Which two of the following affect wind speed in an urban area? Tick (3) your choices. tick (3) high density of roads and road junctions temperature of the ground lines of trees and woodland gaps between high buildings ground saturated by heavy rain [2] (e) While measuring the wind speed at different sites, the students realised that the wind was blowing from different directions. Fig. 1.5 (Insert) shows a simple wind vane which measures wind direction, and Fig. 1.6 (Insert) shows a person using the wind vane. Describe how the person is using the wind vane. ................................................................................................................................................... ................................................................................................................................................... ................................................................................................................................................... ................................................................................................................................................... ................................................................................................................................................... ............................................................................................................................................. [3] (f) When they had completed their fieldwork, the students discussed how they might have improved it. Explain how the following suggestions may help to make the results more reliable. (i) Use the measuring equipment at school before beginning the actual fieldwork. ........................................................................................................................................... ........................................................................................................................................... ........................................................................................................................................... ..................................................................................................................................... [2] (ii) Go back to the fieldwork sites on different days of the year to measure the temperatures and wind speed. ........................................................................................................................................... ........................................................................................................................................... ........................................................................................................................................... ..................................................................................................................................... [2] (iii) Look again at their results, shown in Tables 1.1 and 1.2 (Insert), and consider replacing some measuring sites with different ones. ........................................................................................................................................... ..................................................................................................................................... [1] [Total: 30]
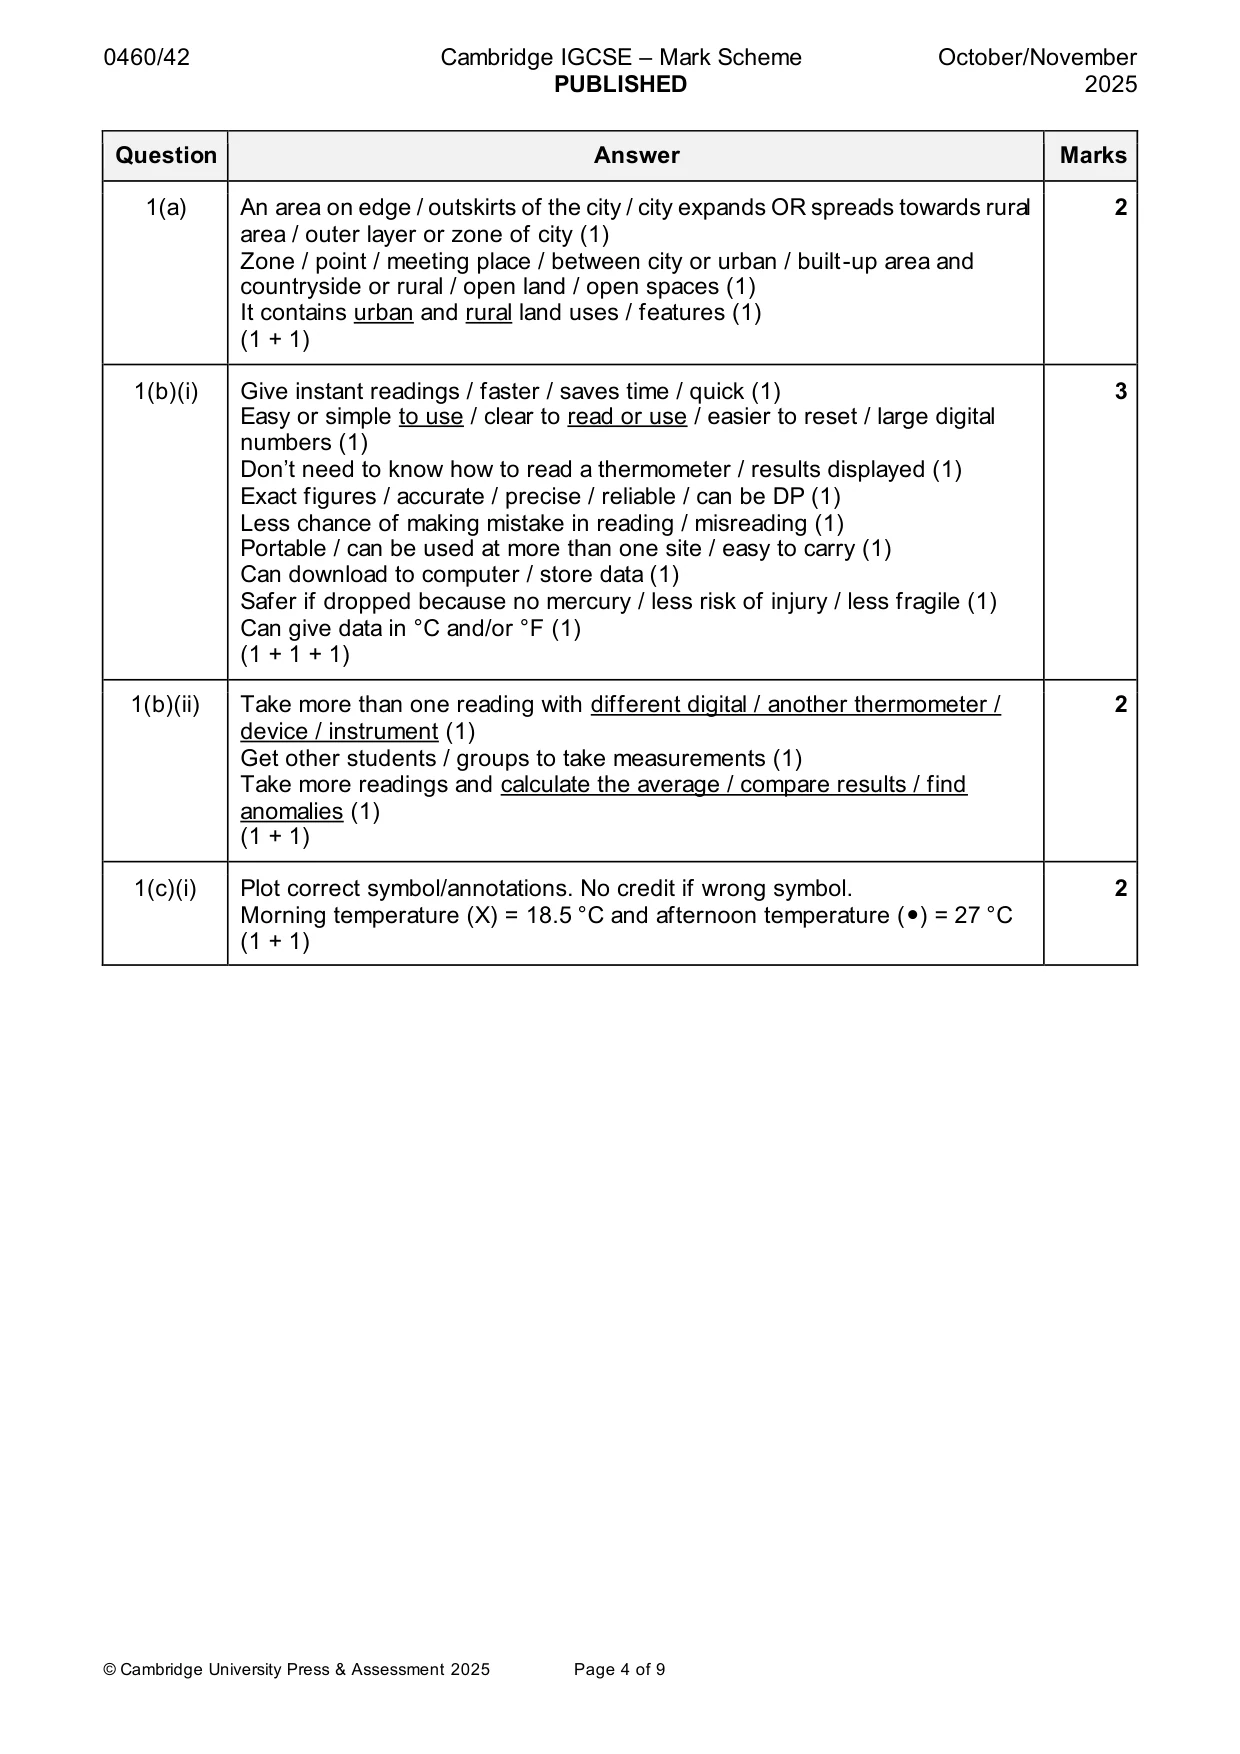
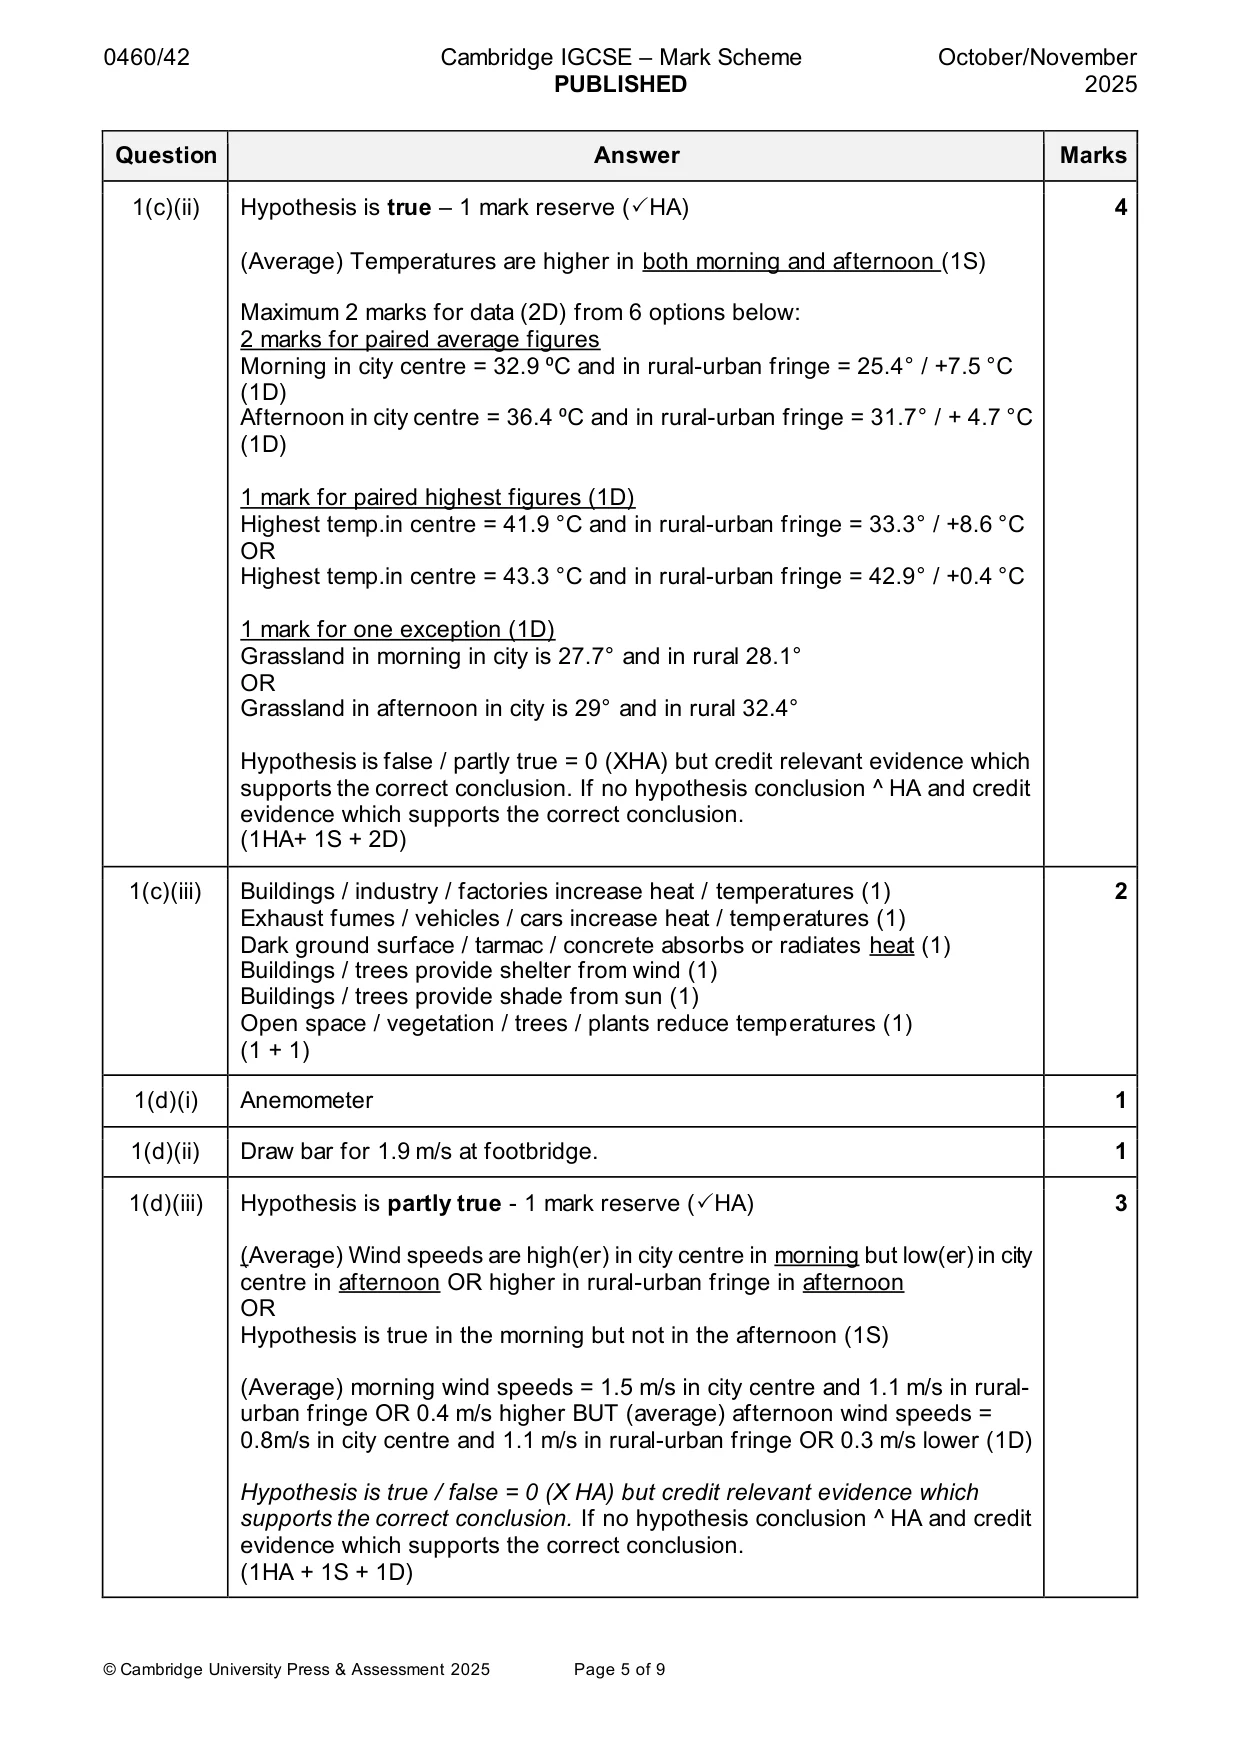
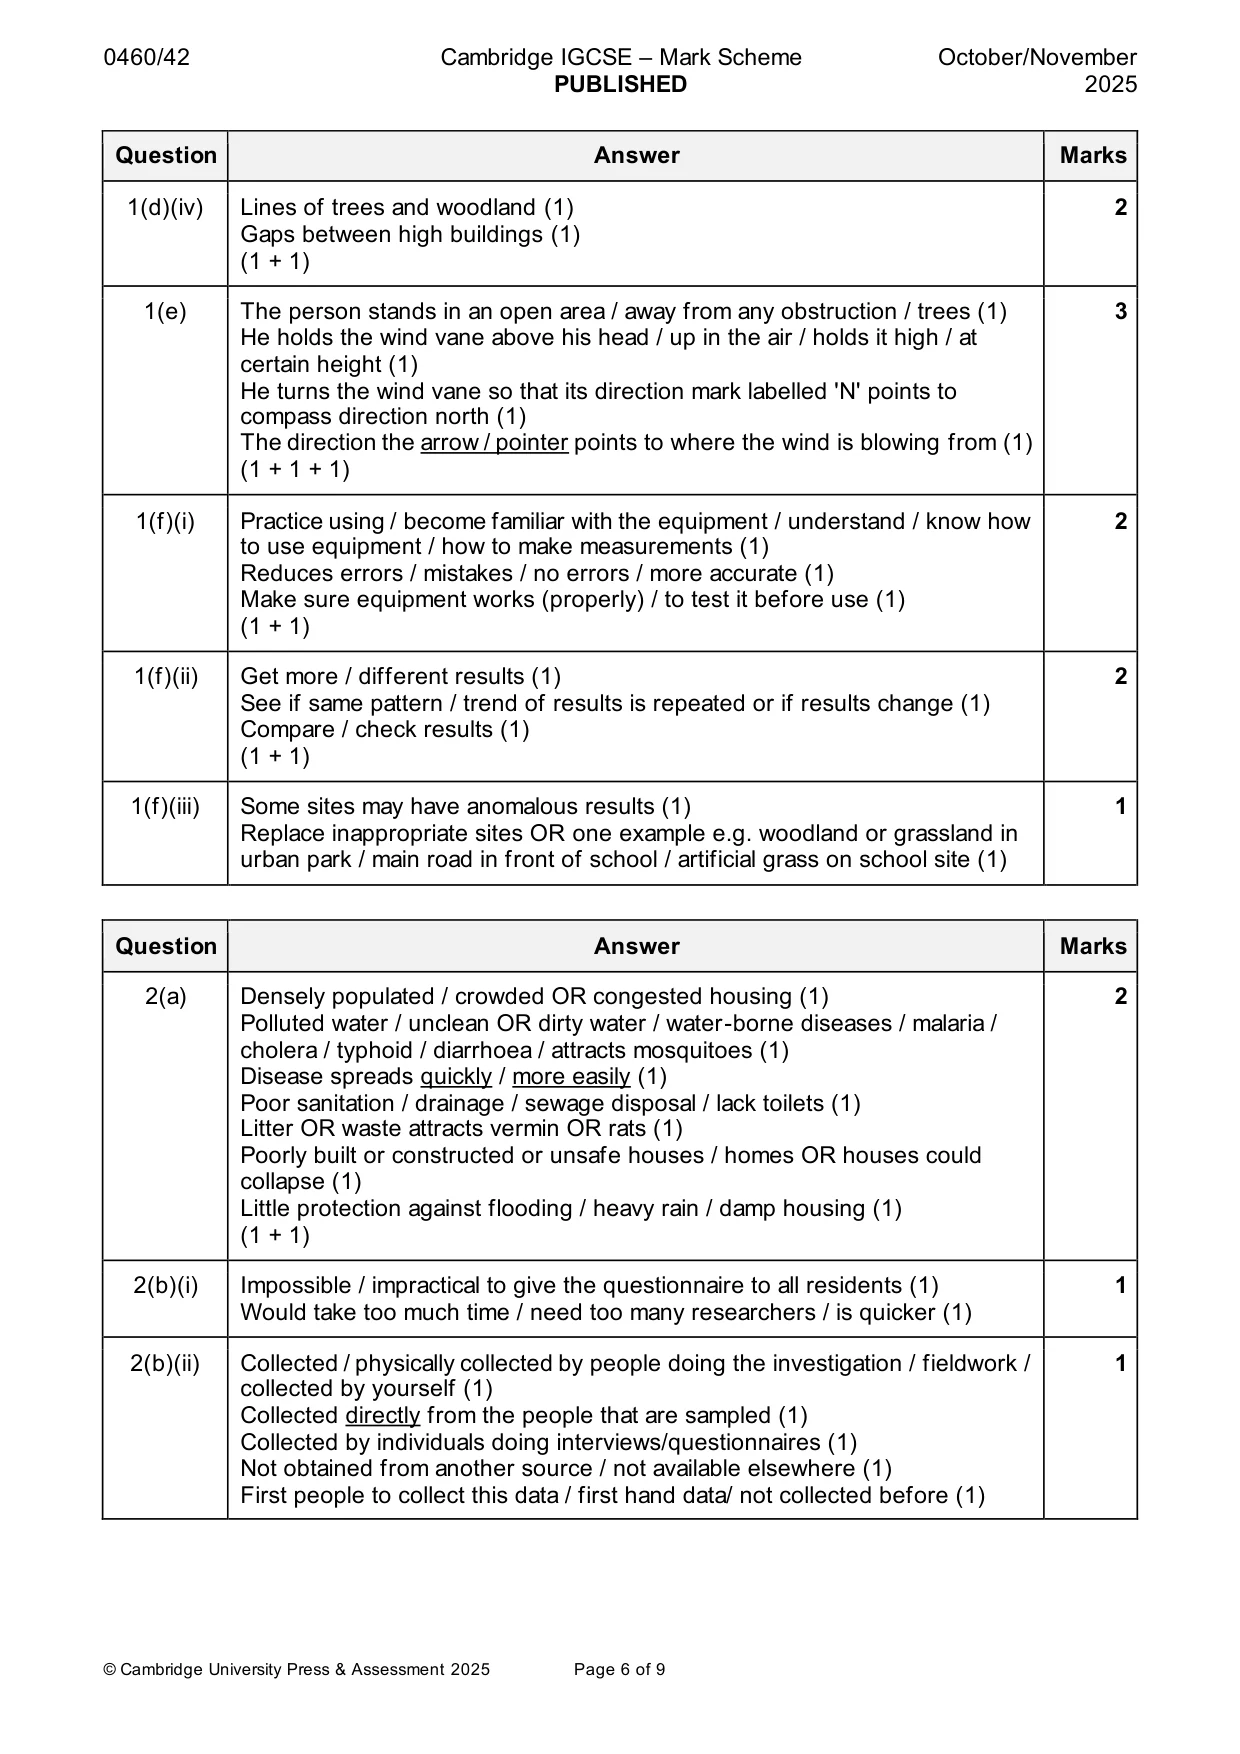
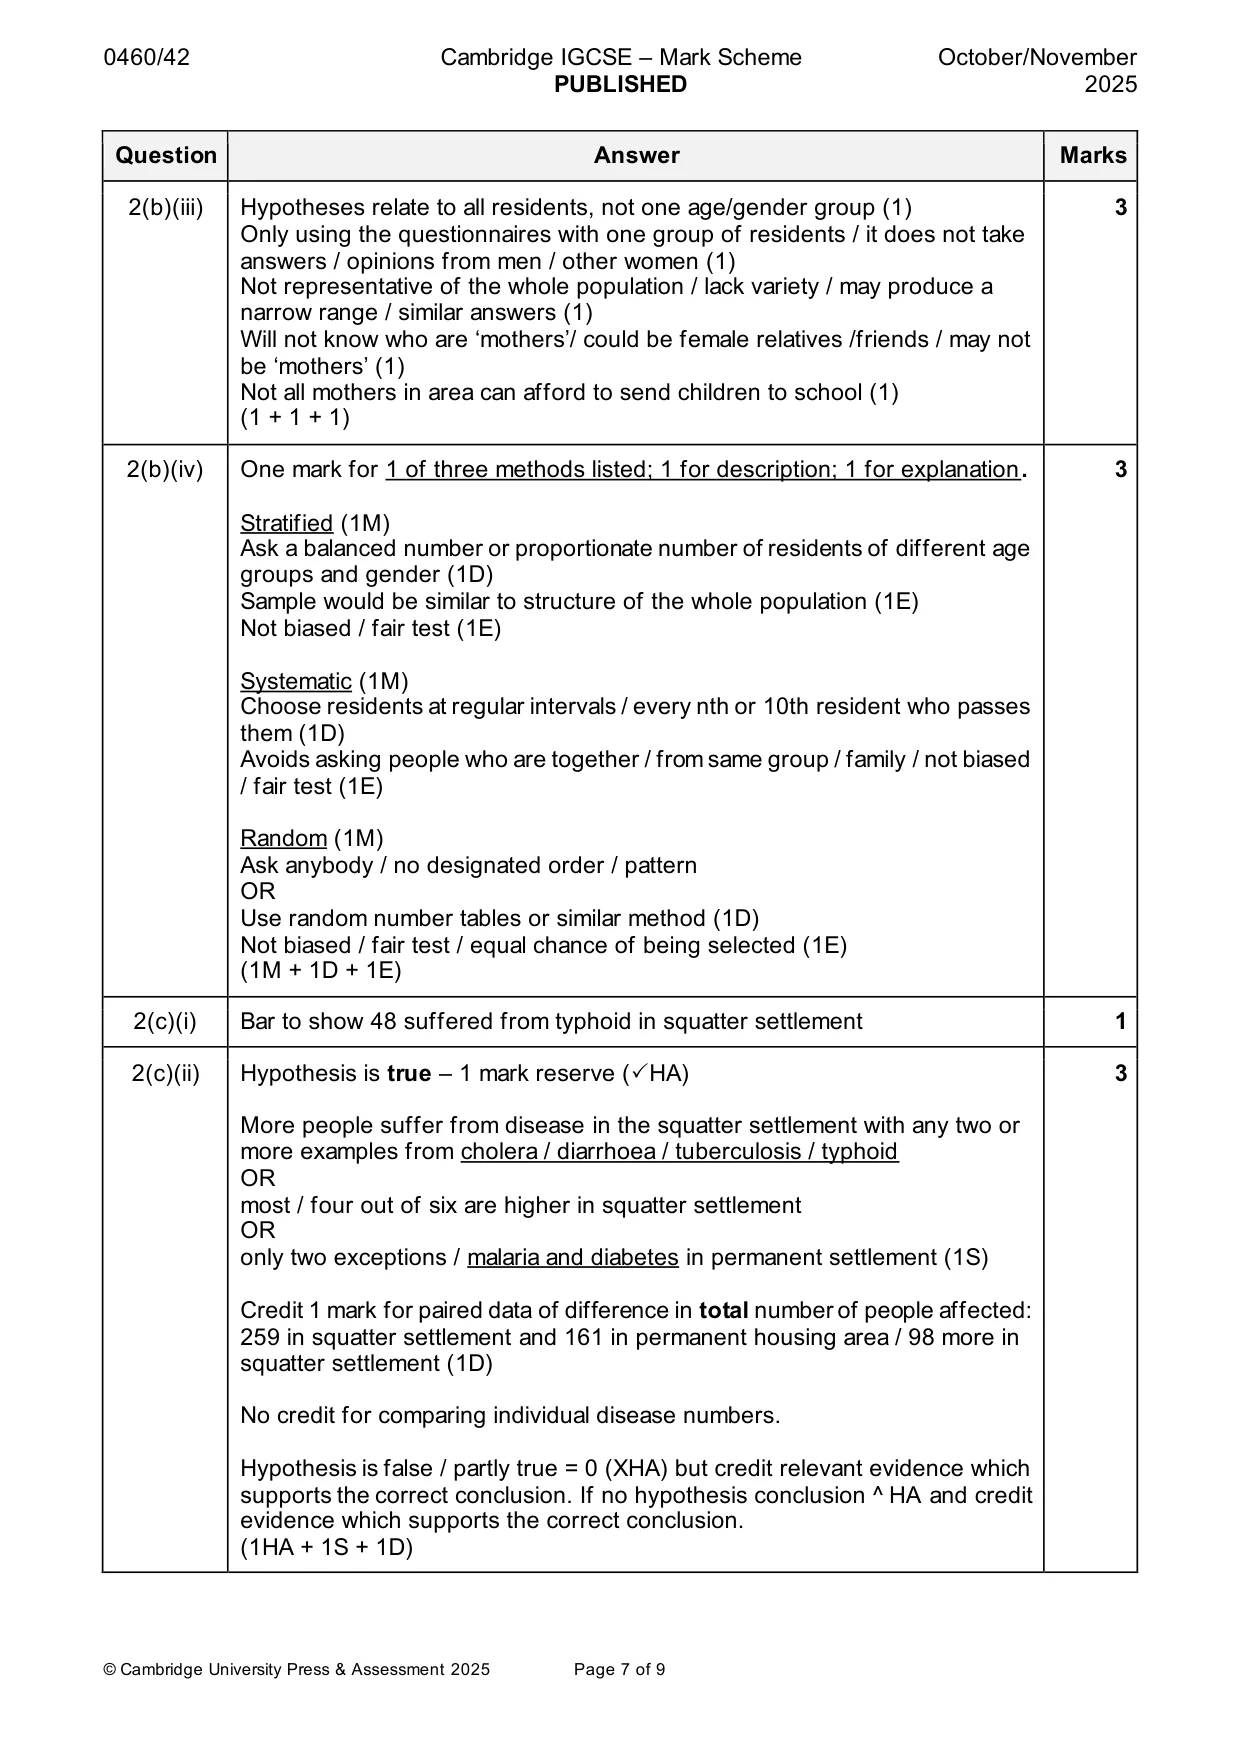
Mark scheme: Question Answer Marks 1(a) An area on edge / outskirts of the city / city expands OR spreads towards rural 2 area / outer layer or zone of city (1) Zone / point / meeting place / between city or urban / built-up area and countryside or rural / open land / open spaces (1) It contains urban and rural land uses / features (1) (1 + 1) 1(b)(i) Give instant readings / faster / saves time / quick (1) 3 Easy or simple to use / clear to read or use / easier to reset / large digital numbers (1) Don’t need to know how to read a thermometer / results displayed (1) Exact figures / accurate / precise / reliable / can be DP (1) Less chance of making mistake in reading / misreading (1) Portable / can be used at more than one site / easy to carry (1) Can download to computer / store data (1) Safer if dropped because no mercury / less risk of injury / less fragile (1) Can give data in °C and/or °F (1) (1 + 1 + 1) 1(b)(ii) Take more than one reading with different digital / another thermometer / 2 device / instrument (1) Get other students / groups to take measurements (1) Take more readings and calculate the average / compare results / find anomalies (1) (1 + 1) 1(c)(i) Plot correct symbol/annotations. No credit if wrong symbol. 2 Morning temperature (X) = 18.5 °C and afternoon temperature () = 27 °C (1 + 1) 1(c)(ii) Hypothesis is true – 1 mark reserve (HA) 4 (Average) Temperatures are higher in both morning and afternoon (1S) Maximum 2 marks for data (2D) from 6 options below: 2 marks for paired average figures Morning in city centre = 32.9 ⁰C and in rural-urban fringe = 25.4° / +7.5 °C (1D) Afternoon in city centre = 36.4 ⁰C and in rural-urban fringe = 31.7° / + 4.7 °C (1D) 1 mark for paired highest figures (1D) Highest temp.in centre = 41.9 °C and in rural-urban fringe = 33.3° / +8.6 °C OR Highest temp.in centre = 43.3 °C and in rural-urban fringe = 42.9° / +0.4 °C 1 mark for one exception (1D) Grassland in morning in city is 27.7° and in rural 28.1° OR Grassland in afternoon in city is 29° and in rural 32.4° Hypothesis is false / partly true = 0 (XHA) but credit relevant evidence which supports the correct conclusion. If no hypothesis conclusion ^ HA and credit evidence which supports the correct conclusion. (1HA+ 1S + 2D) 1(c)(iii) Buildings / industry / factories increase heat / temperatures (1) 2 Exhaust fumes / vehicles / cars increase heat / temperatures (1) Dark ground surface / tarmac / concrete absorbs or radiates heat (1) Buildings / trees provide shelter from wind (1) Buildings / trees provide shade from sun (1) Open space / vegetation / trees / plants reduce temperatures (1) (1 + 1) 1(d)(i) Anemometer 1 1(d)(ii) Draw bar for 1.9 m/s at footbridge. 1 1(d)(iii) Hypothesis is partly true - 1 mark reserve (HA) 3 (Average) Wind speeds are high(er) in city centre in morning but low(er) in city centre in afternoon OR higher in rural-urban fringe in afternoon OR Hypothesis is true in the morning but not in the afternoon (1S) (Average) morning wind speeds = 1.5 m/s in city centre and 1.1 m/s in rural- urban fringe OR 0.4 m/s higher BUT (average) afternoon wind speeds = 0.8m/s in city centre and 1.1 m/s in rural-urban fringe OR 0.3 m/s lower (1D) Hypothesis is true / false = 0 (X HA) but credit relevant evidence which supports the correct conclusion. If no hypothesis conclusion ^ HA and credit evidence which supports the correct conclusion. (1HA + 1S + 1D) 1(d)(iv) Lines of trees and woodland (1) 2 Gaps between high buildings (1) (1 + 1) 1(e) The person stands in an open area / away from any obstruction / trees (1) 3 He holds the wind vane above his head / up in the air / holds it high / at certain height (1) He turns the wind vane so that its direction mark labelled 'N' points to compass direction north (1) The direction the arrow / pointer points to where the wind is blowing from (1) (1 + 1 + 1) 1(f)(i) Practice using / become familiar with the equipment / understand / know how 2 to use equipment / how to make measurements (1) Reduces errors / mistakes / no errors / more accurate (1) Make sure equipment works (properly) / to test it before use (1) (1 + 1) 1(f)(ii) Get more / different results (1) 2 See if same pattern / trend of results is repeated or if results change (1) Compare / check results (1) (1 + 1) 1(f)(iii) Some sites may have anomalous results (1) 1 Replace inappropriate sites OR one example e.g. woodland or grassland in urban park / main road in front of school / artificial grass on school site (1)
Q2 · Students investigated differences in the health of families in Mumbai, a city in India…
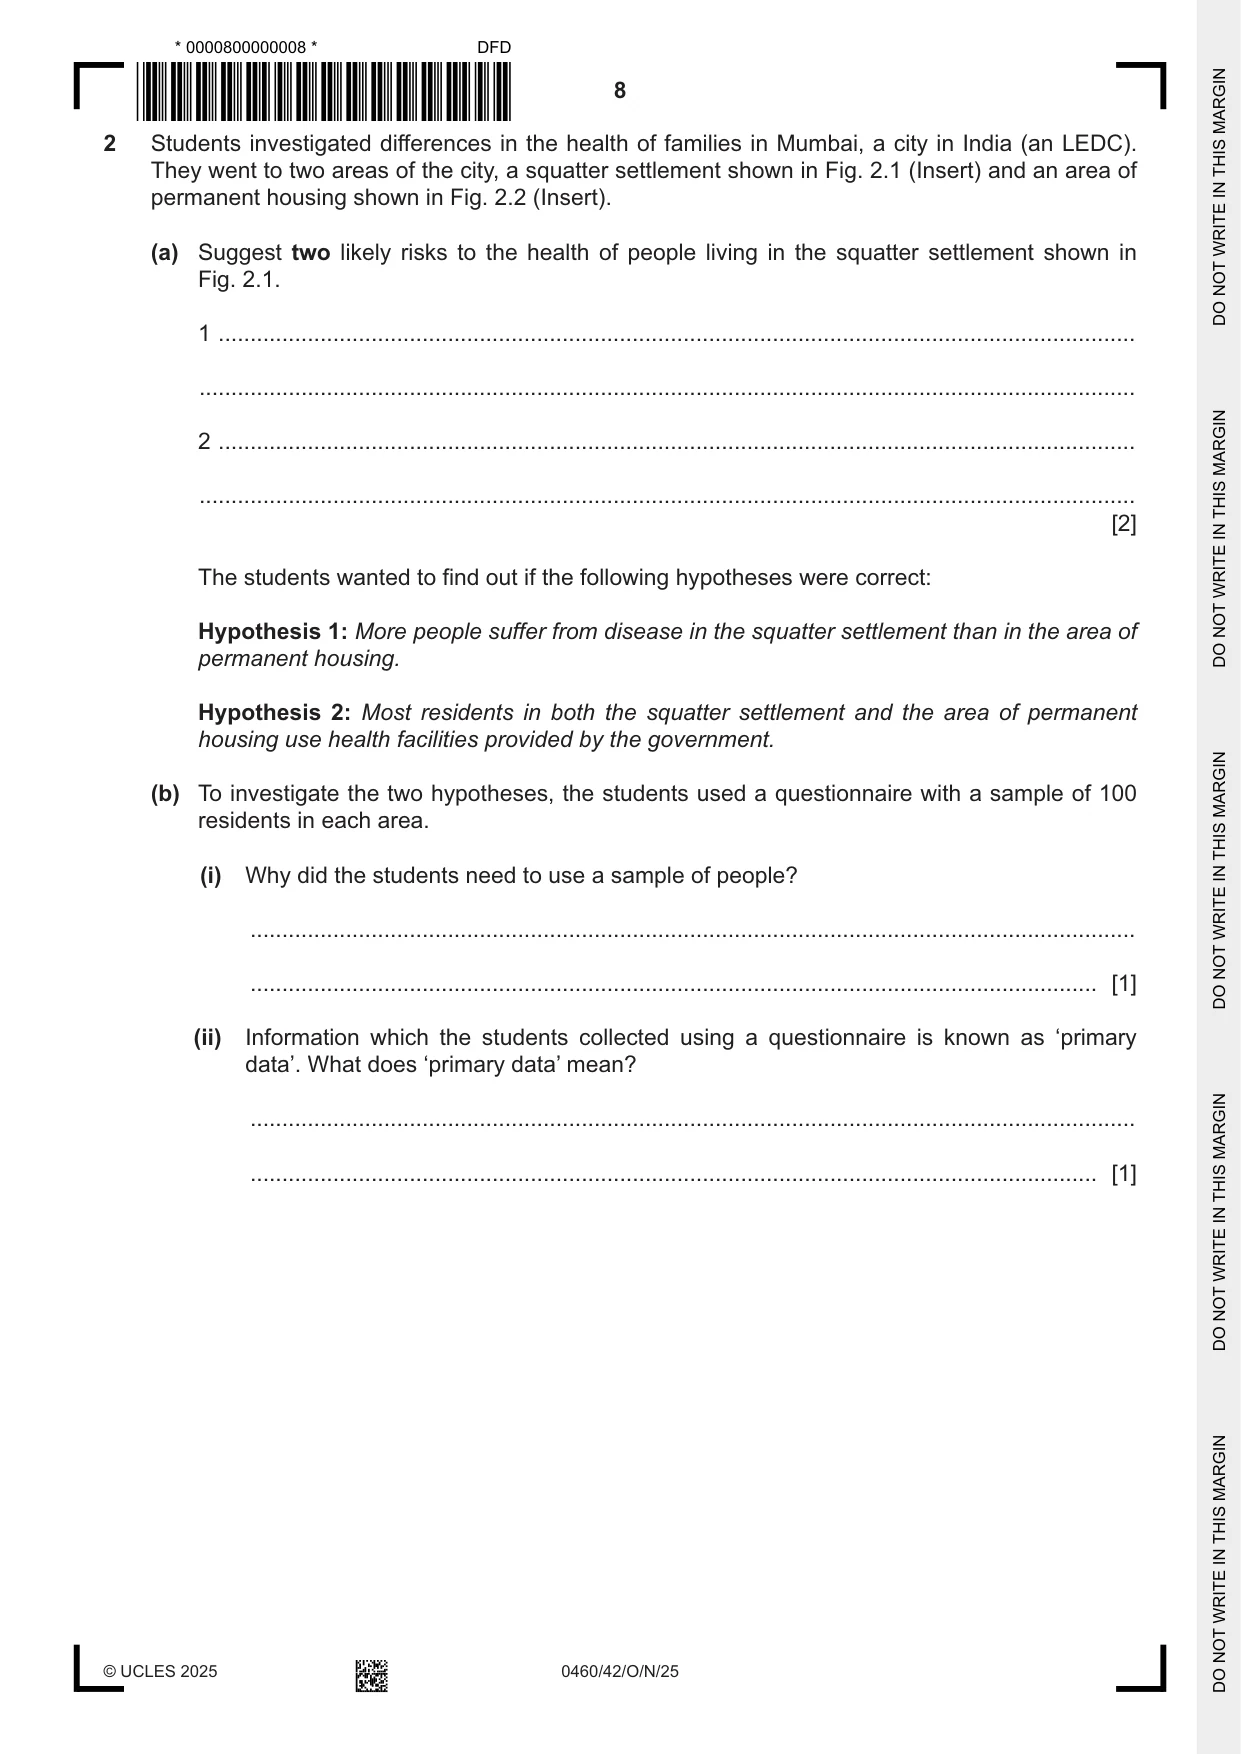
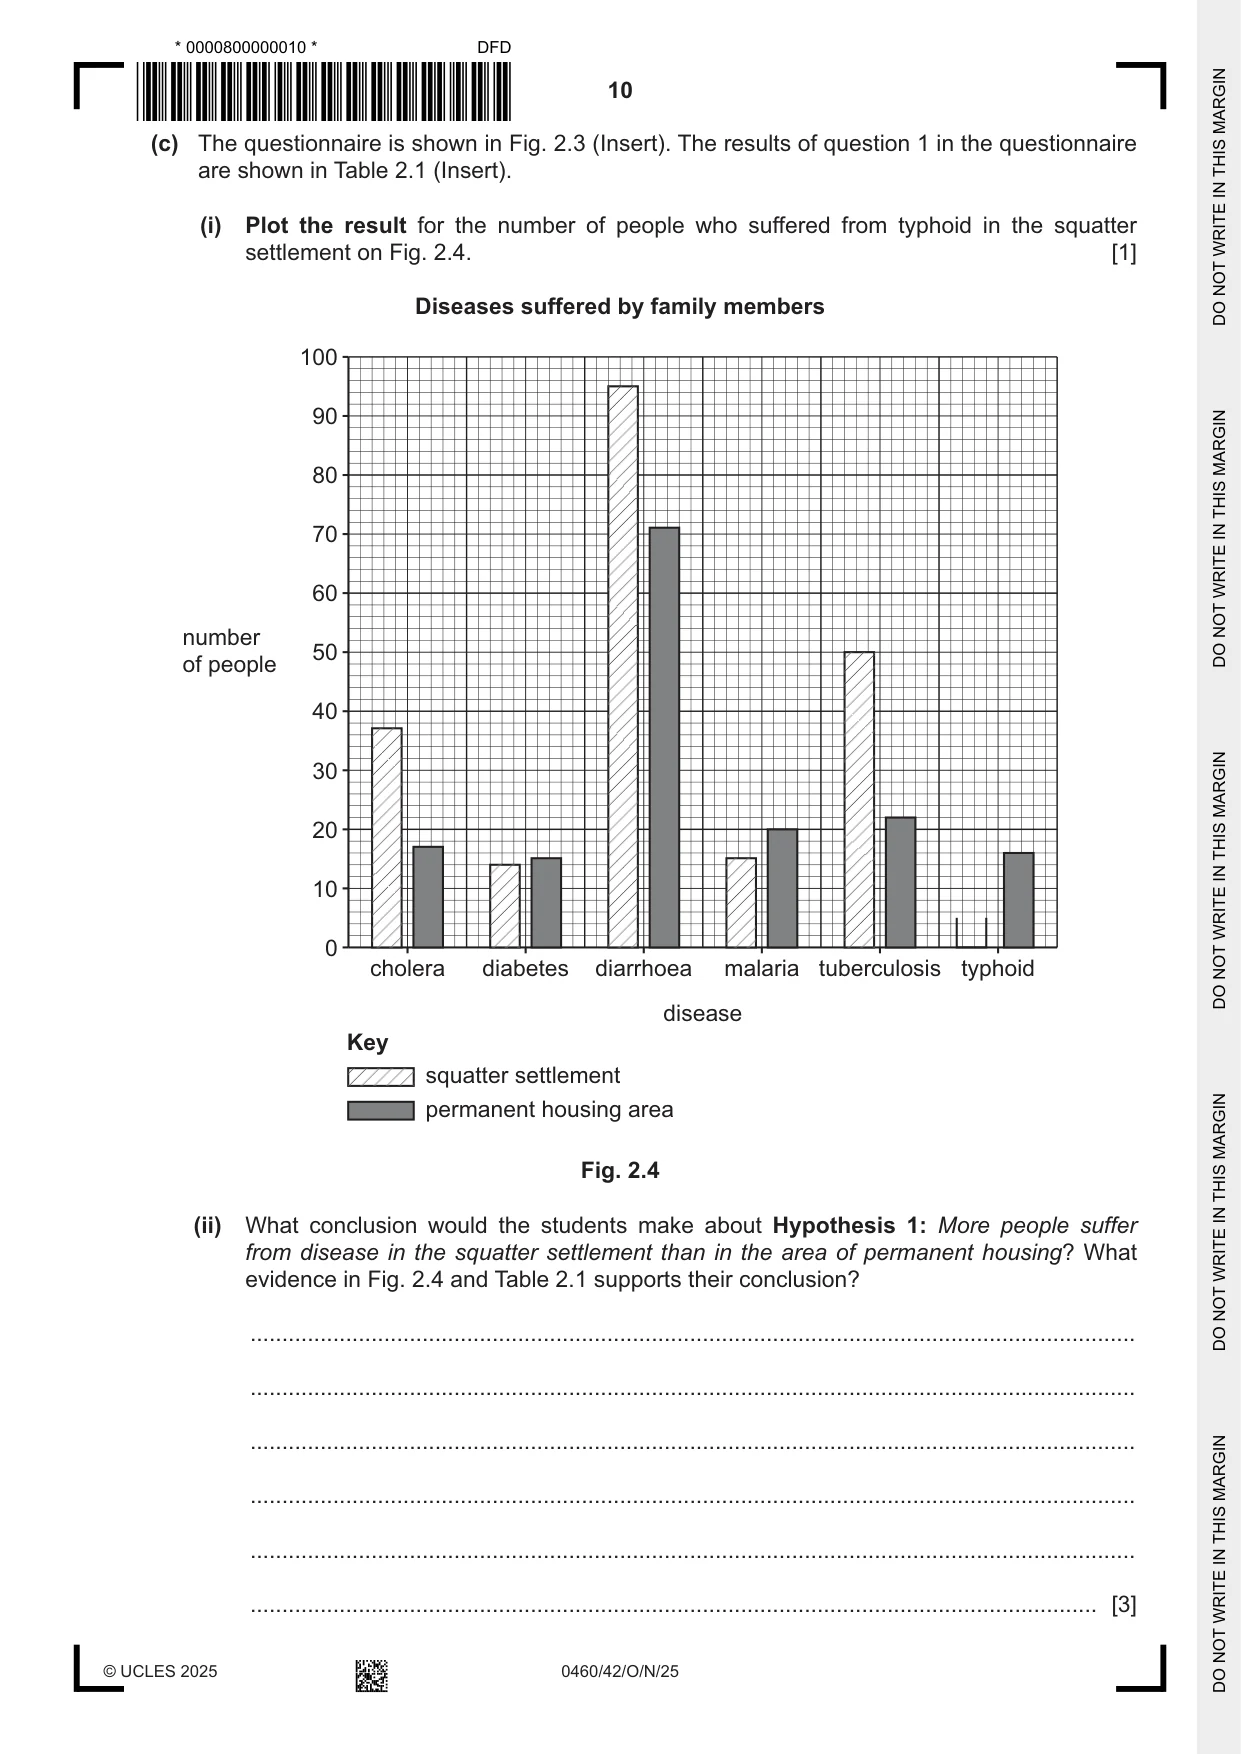
2 Students investigated differences in the health of families in Mumbai, a city in India (an LEDC). They went to two areas of the city, a squatter settlement shown in Fig. 2.1 (Insert) and an area of permanent housing shown in Fig. 2.2 (Insert). (a) Suggest two likely risks to the health of people living in the squatter settlement shown in Fig. 2.1. 1 ................................................................................................................................................ ................................................................................................................................................... 2 ................................................................................................................................................ ................................................................................................................................................... [2] The students wanted to find out if the following hypotheses were correct: Hypothesis 1: More people suffer from disease in the squatter settlement than in the area of permanent housing. Hypothesis 2: Most residents in both the squatter settlement and the area of permanent housing use health facilities provided by the government. (b) To investigate the two hypotheses, the students used a questionnaire with a sample of 100 residents in each area. (i) Why did the students need to use a sample of people? ........................................................................................................................................... ..................................................................................................................................... [1] (ii) Information which the students collected using a questionnaire is known as ‘primary data’. What does ‘primary data’ mean? ........................................................................................................................................... ..................................................................................................................................... [1] (iii) The following is an unreliable sampling method which may have been used to select people to answer the questionnaire. ‘Give the questionnaire to all mothers waiting outside the local school.’ Explain why this is an unreliable method to obtain a sample of people. ........................................................................................................................................... ........................................................................................................................................... ........................................................................................................................................... ........................................................................................................................................... ........................................................................................................................................... ..................................................................................................................................... [3] (iv) Name and describe a reliable sampling method which the students could use to select people to answer the questionnaire. Explain why this would be a reliable method to use. name of method .............................. ........................................................................................................................................... ........................................................................................................................................... ........................................................................................................................................... ........................................................................................................................................... ..................................................................................................................................... [3] (c) The questionnaire is shown in Fig. 2.3 (Insert). The results of question 1 in the questionnaire are shown in Table 2.1 (Insert). (i) Plot the result for the number of people who suffered from typhoid in the squatter settlement on Fig. 2.4. [1] Diseases suffered by family members 100 90 80 70 60 number 50 of people 40 30 20 10 0 cholera diabetes diarrhoea malaria tuberculosis typhoid disease Key squatter settlement permanent housing area Fig. 2.4 (ii) What conclusion would the students make about Hypothesis 1: More people suffer from disease in the squatter settlement than in the area of permanent housing? What evidence in Fig. 2.4 and Table 2.1 supports their conclusion? ........................................................................................................................................... ........................................................................................................................................... ........................................................................................................................................... ........................................................................................................................................... ........................................................................................................................................... ..................................................................................................................................... [3]
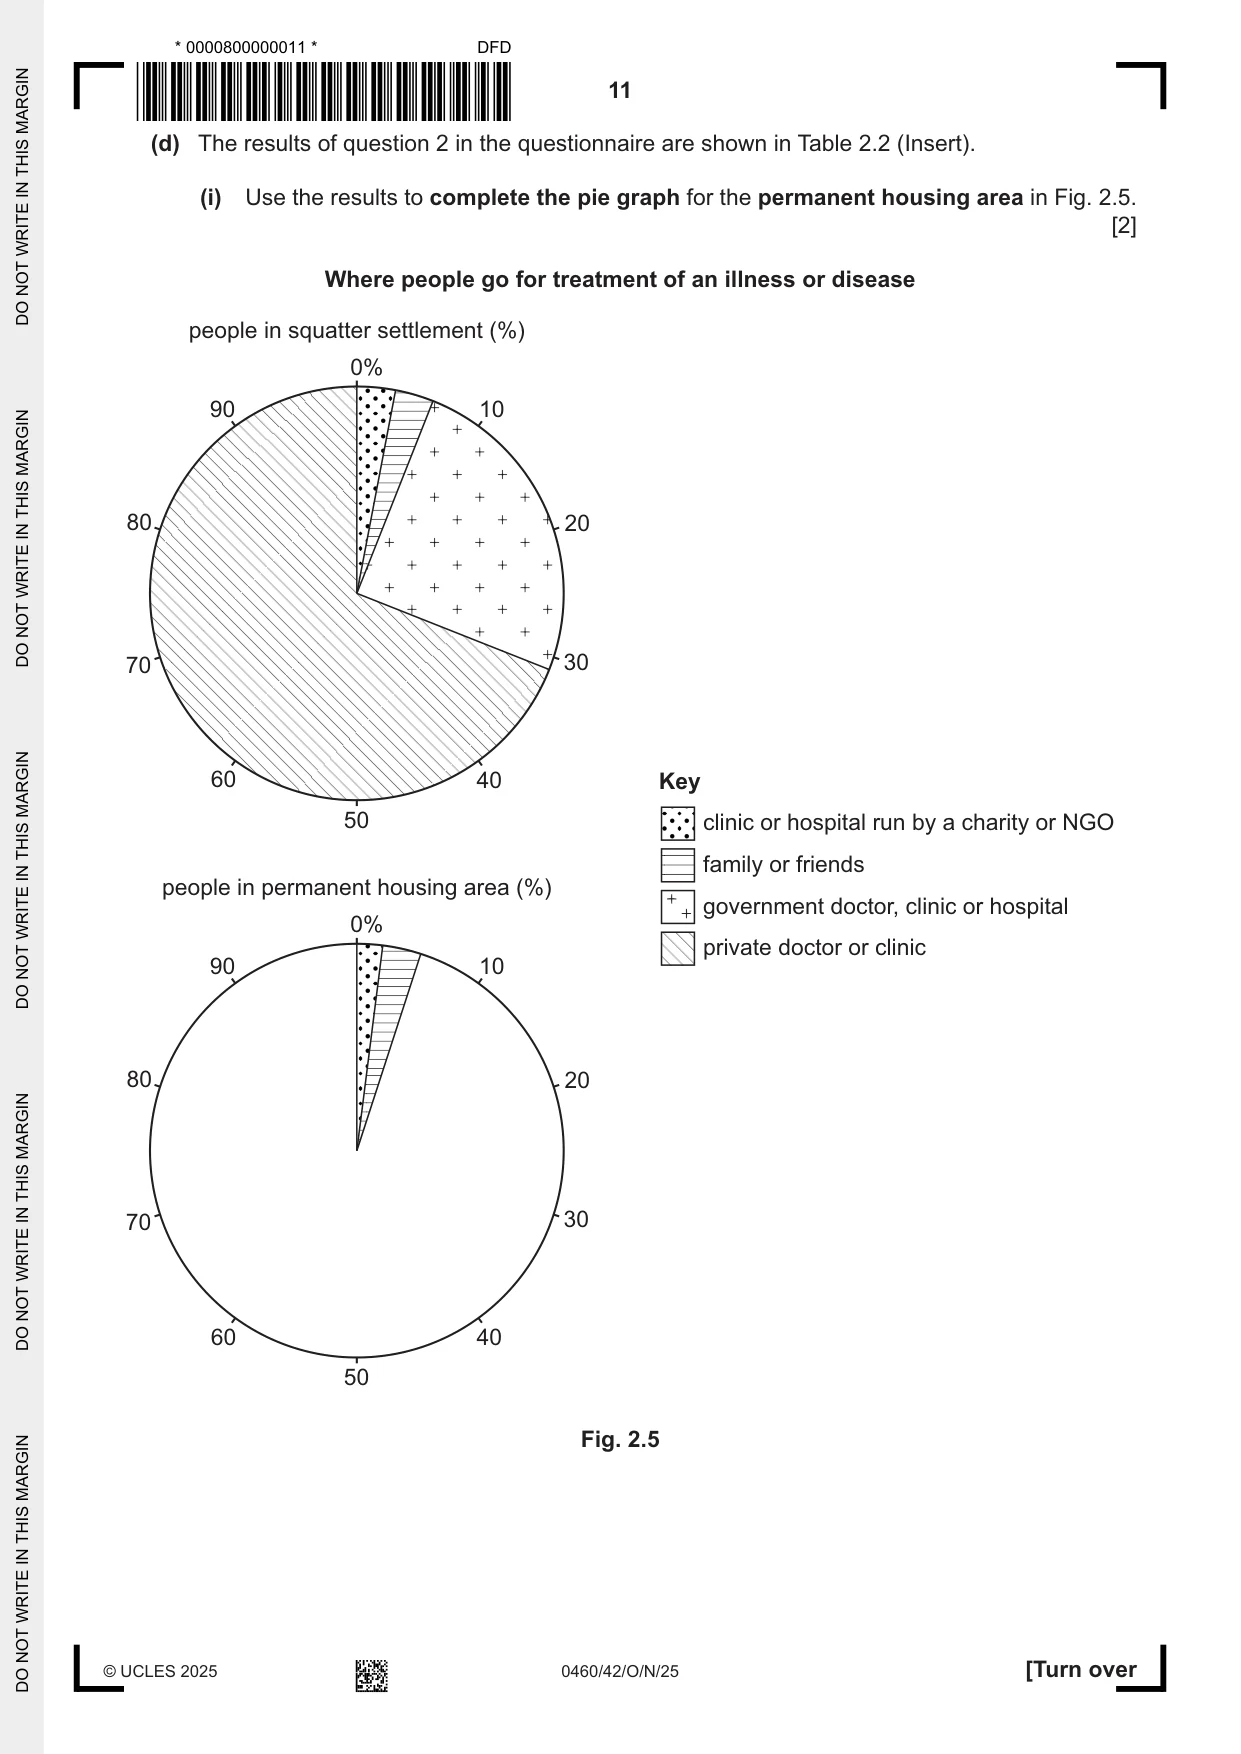
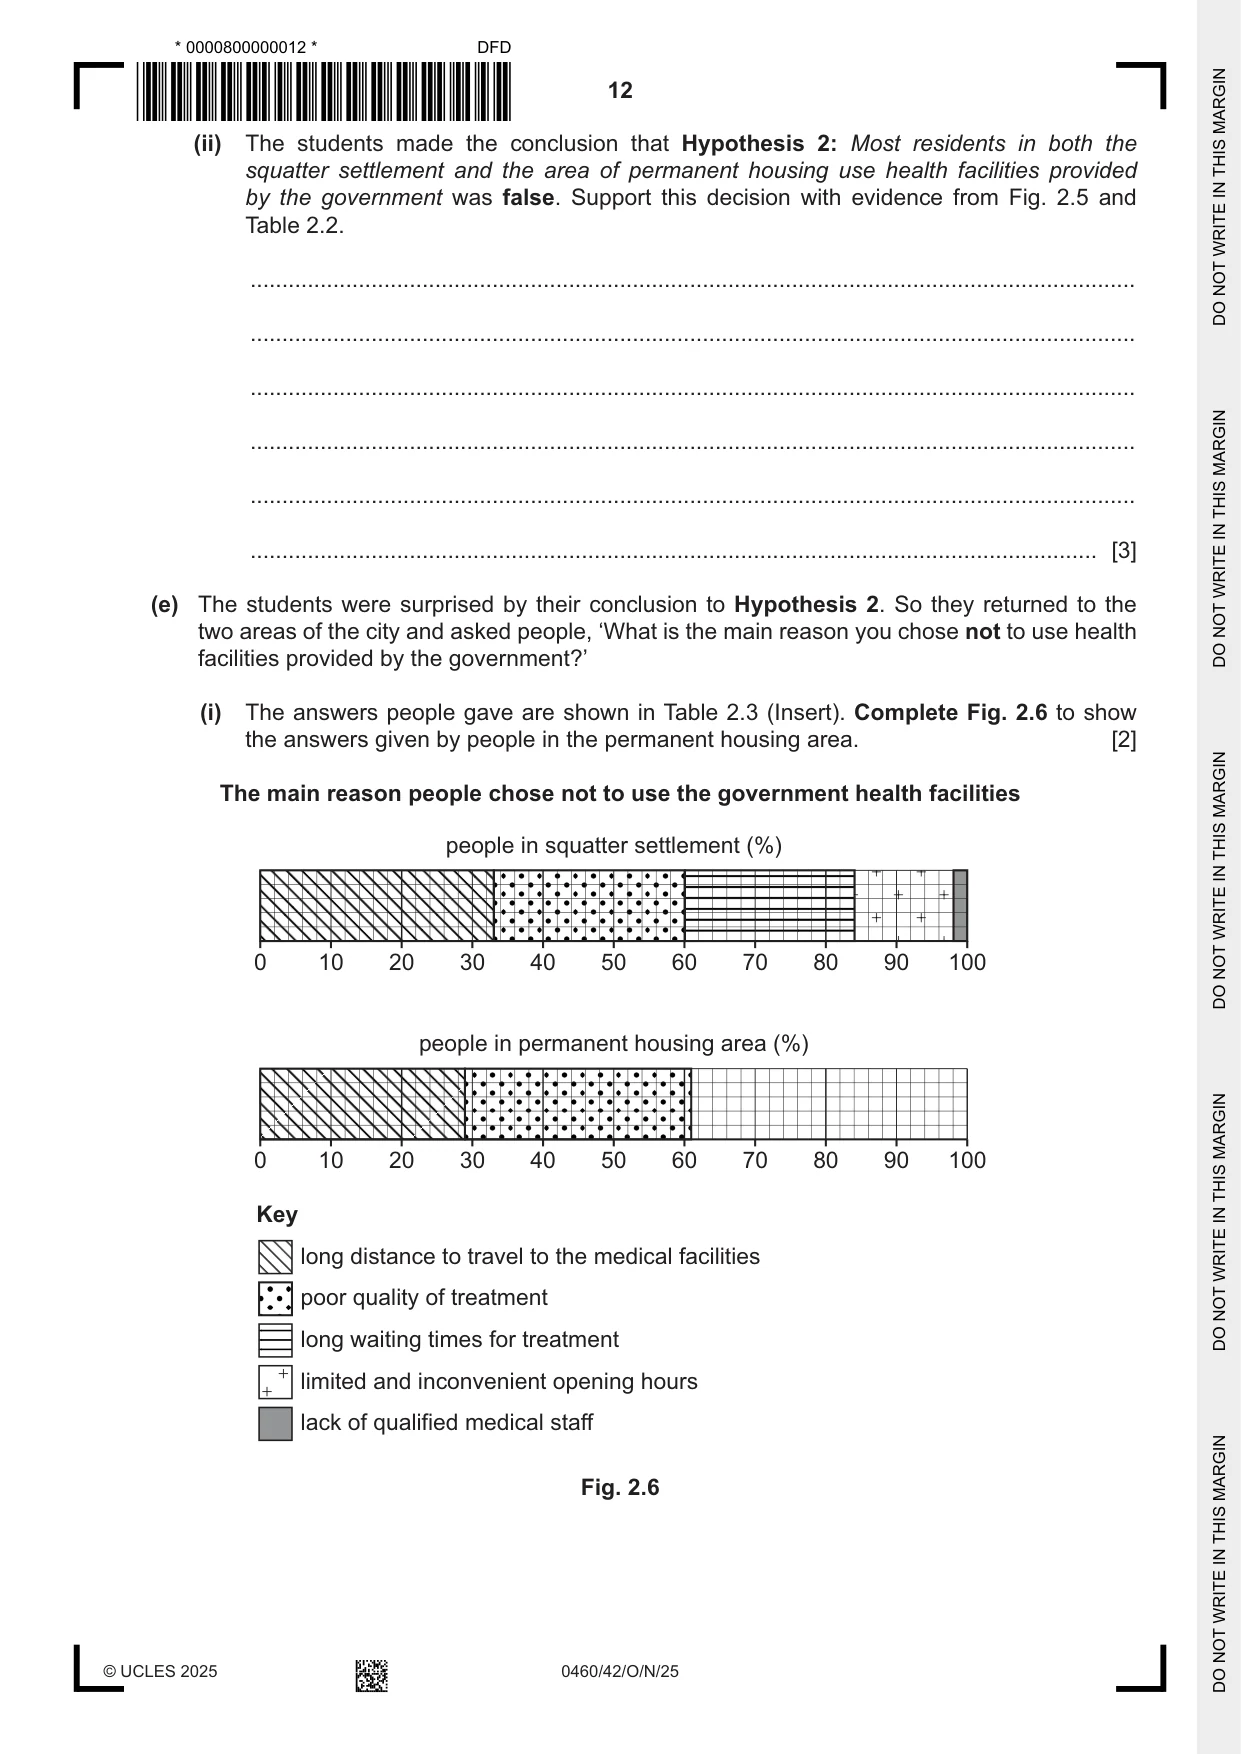
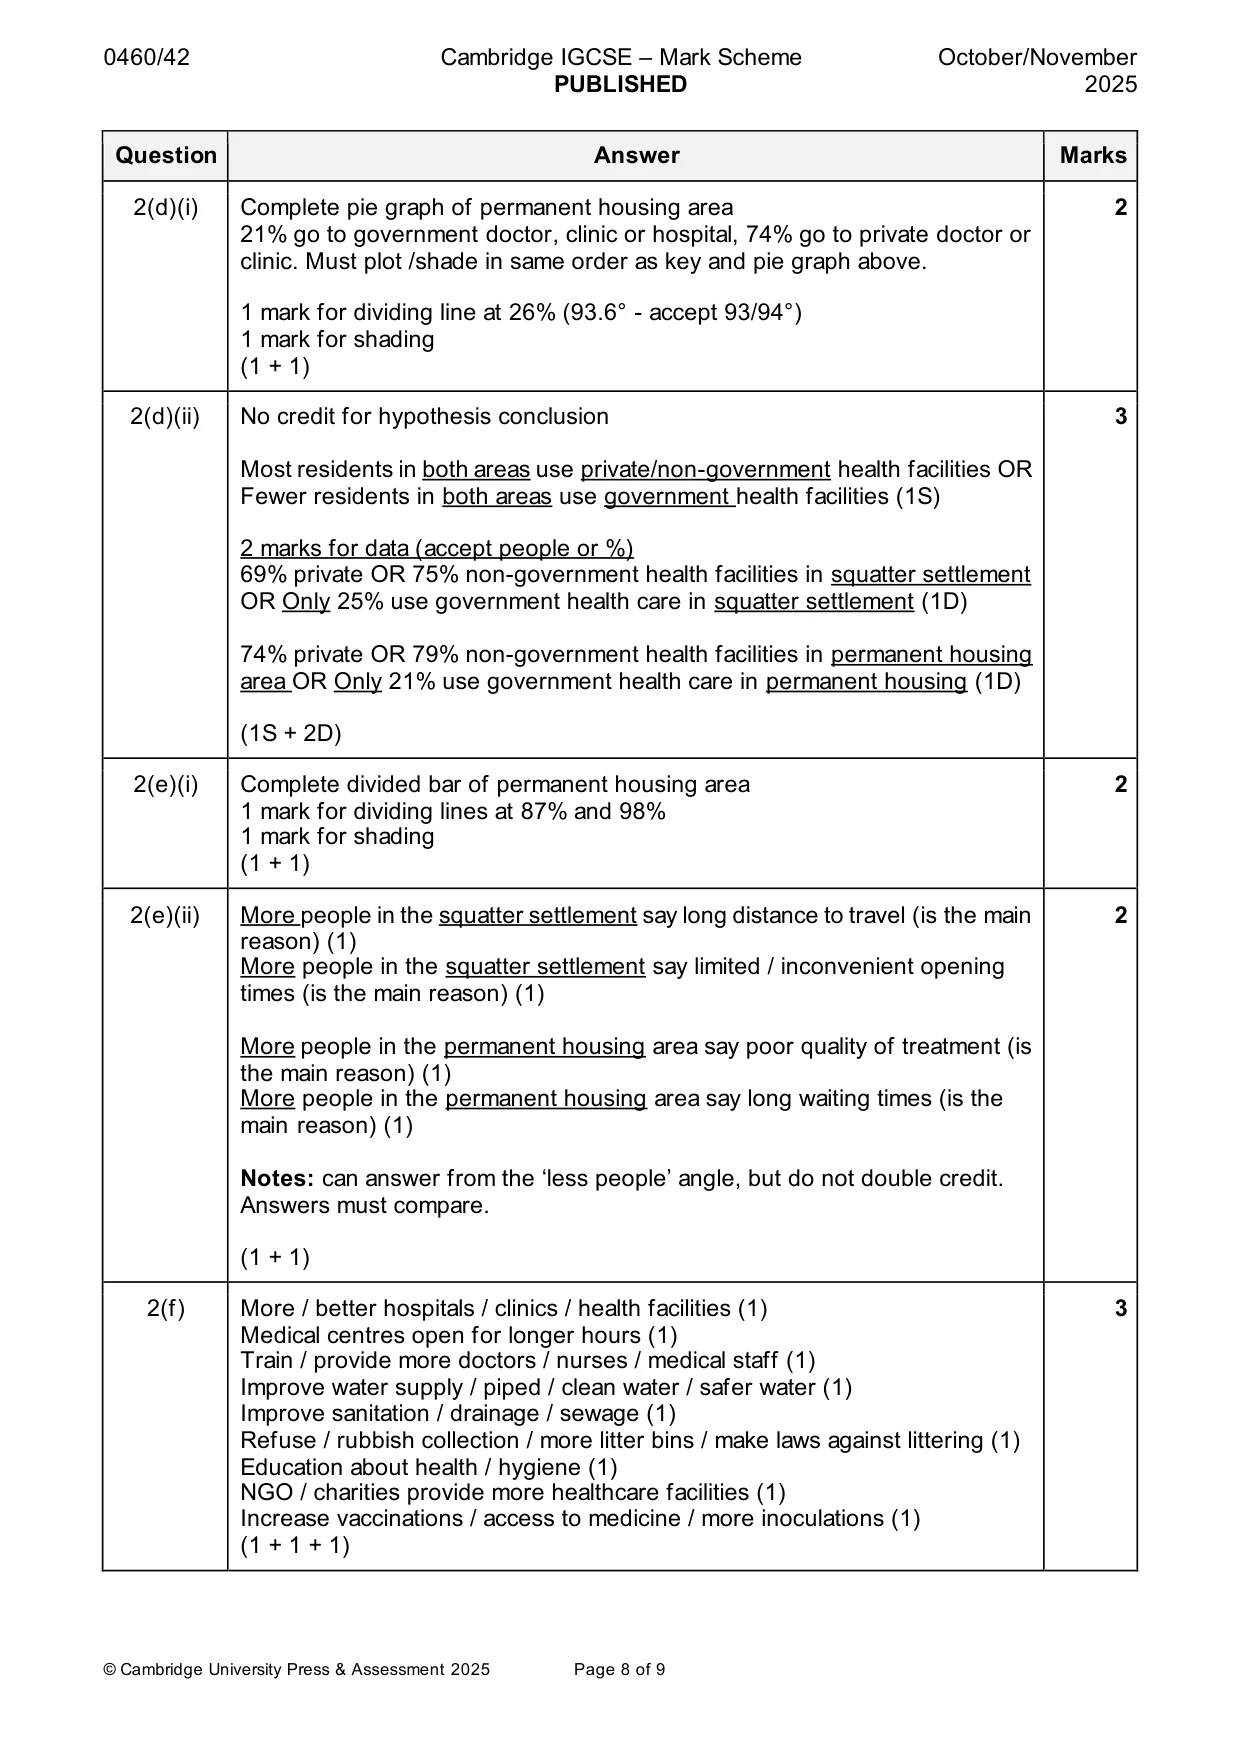
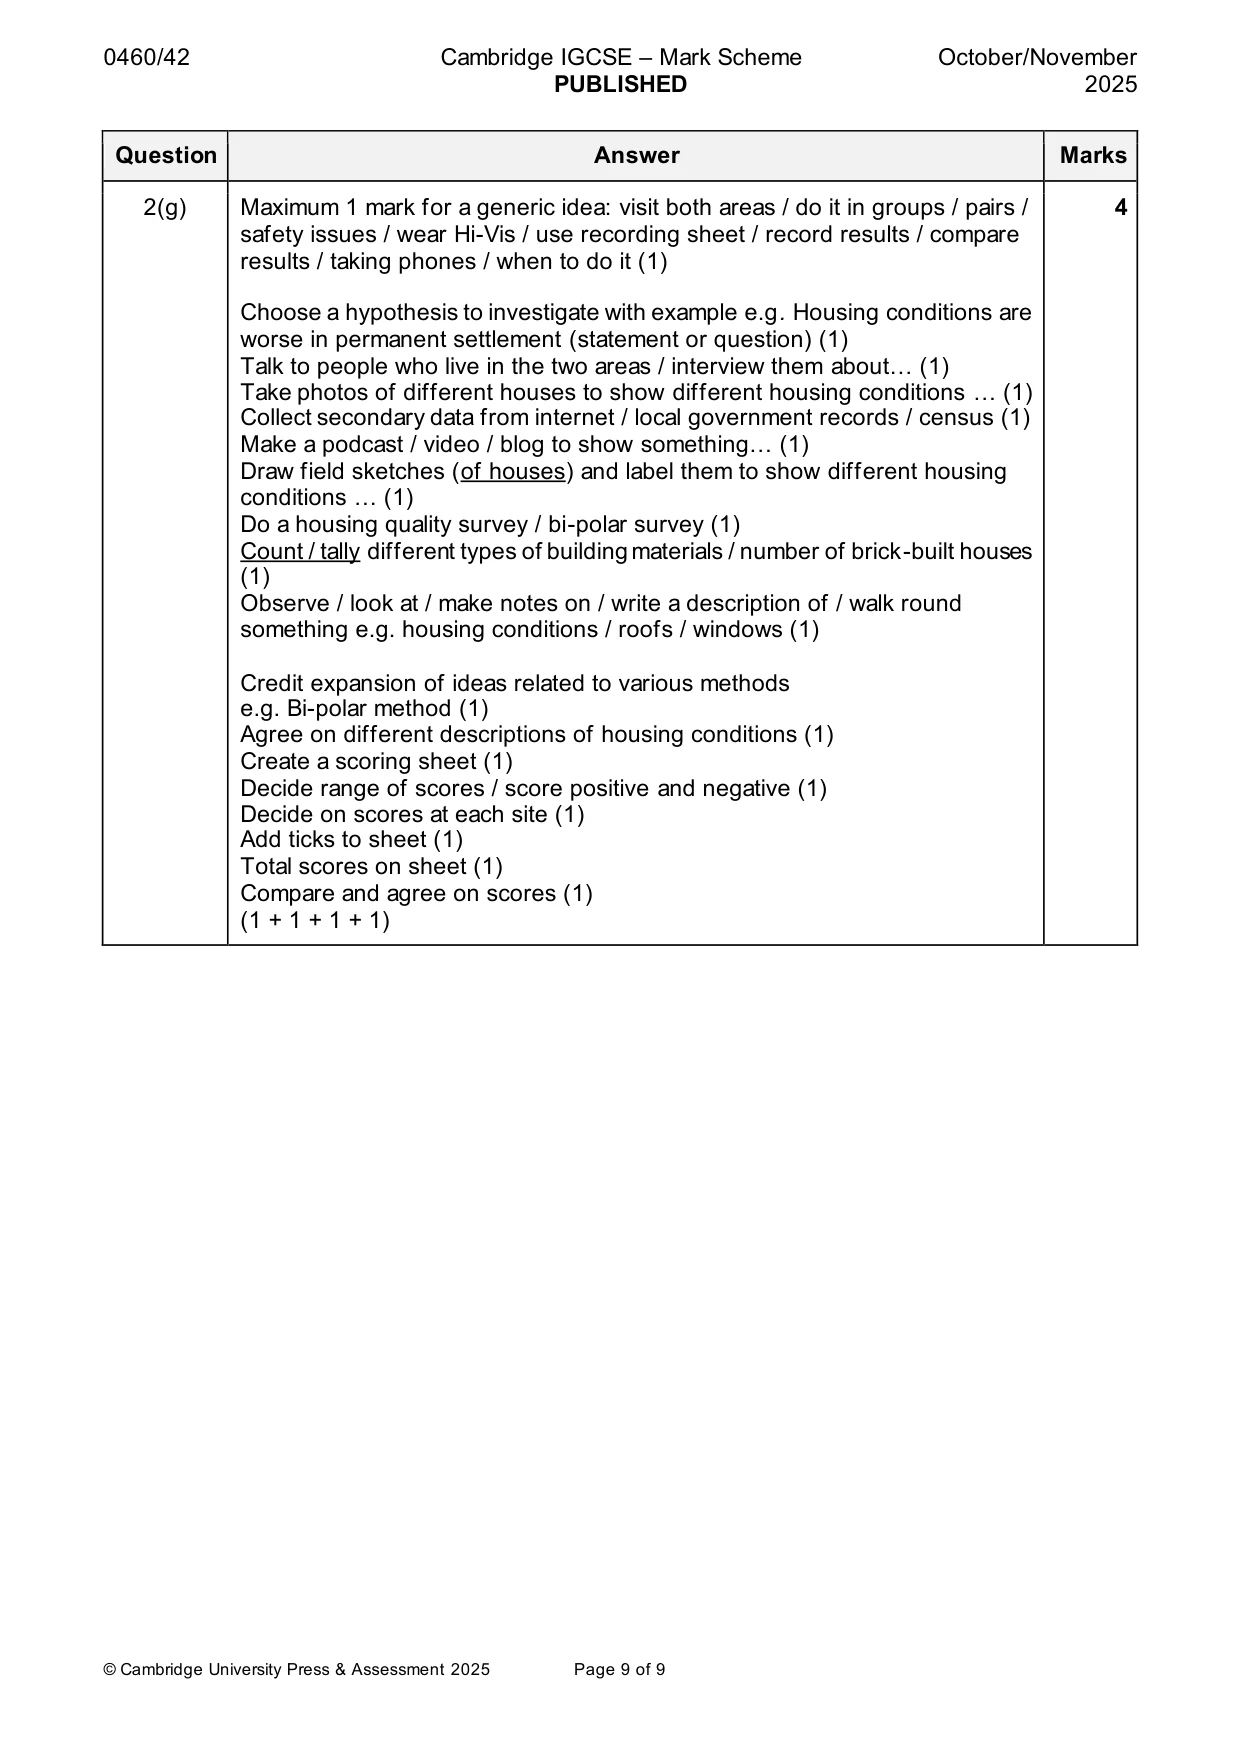
Mark scheme: 2(a) Densely populated / crowded OR congested housing (1) 2 Polluted water / unclean OR dirty water / water-borne diseases / malaria / cholera / typhoid / diarrhoea / attracts mosquitoes (1) Disease spreads quickly / more easily (1) Poor sanitation / drainage / sewage disposal / lack toilets (1) Litter OR waste attracts vermin OR rats (1) Poorly built or constructed or unsafe houses / homes OR houses could collapse (1) Little protection against flooding / heavy rain / damp housing (1) (1 + 1) 2(b)(i) Impossible / impractical to give the questionnaire to all residents (1) 1 Would take too much time / need too many researchers / is quicker (1) 2(b)(ii) Collected / physically collected by people doing the investigation / fieldwork / 1 collected by yourself (1) Collected directly from the people that are sampled (1) Collected by individuals doing interviews/questionnaires (1) Not obtained from another source / not available elsewhere (1) First people to collect this data / first hand data/ not collected before (1) 2(b)(iii) Hypotheses relate to all residents, not one age/gender group (1) 3 Only using the questionnaires with one group of residents / it does not take answers / opinions from men / other women (1) Not representative of the whole population / lack variety / may produce a narrow range / similar answers (1) Will not know who are ‘mothers’/ could be female relatives /friends / may not be ‘mothers’ (1) Not all mothers in area can afford to send children to school (1) (1 + 1 + 1) 2(b)(iv) One mark for 1 of three methods listed; 1 for description; 1 for explanation. 3 Stratified (1M) Ask a balanced number or proportionate number of residents of different age groups and gender (1D) Sample would be similar to structure of the whole population (1E) Not biased / fair test (1E) Systematic (1M) Choose residents at regular intervals / every nth or 10th resident who passes them (1D) Avoids asking people who are together / from same group / family / not biased / fair test (1E) Random (1M) Ask anybody / no designated order / pattern OR Use random number tables or similar method (1D) Not biased / fair test / equal chance of being selected (1E) (1M + 1D + 1E) 2(c)(i) Bar to show 48 suffered from typhoid in squatter settlement 1 2(c)(ii) Hypothesis is true – 1 mark reserve (HA) 3 More people suffer from disease in the squatter settlement with any two or more examples from cholera / diarrhoea / tuberculosis / typhoid OR most / four out of six are higher in squatter settlement OR only two exceptions / malaria and diabetes in permanent settlement (1S) Credit 1 mark for paired data of difference in total number of people affected: 259 in squatter settlement and 161 in permanent housing area / 98 more in squatter settlement (1D) No credit for comparing individual disease numbers. Hypothesis is false / partly true = 0 (XHA) but credit relevant evidence which supports the correct conclusion. If no hypothesis conclusion ^ HA and credit evidence which supports the correct conclusion. (1HA + 1S + 1D) 2(d)(i) Complete pie graph of permanent housing area 2 21% go to government doctor, clinic or hospital, 74% go to private doctor or clinic. Must plot /shade in same order as key and pie graph above. 1 mark for dividing line at 26% (93.6° - accept 93/94°) 1 mark for shading (1 + 1) 2(d)(ii) No credit for hypothesis conclusion 3 Most residents in both areas use private/non-government health facilities OR Fewer residents in both areas use government health facilities (1S) 2 marks for data (accept people or %) 69% private OR 75% non-government health facilities in squatter settlement OR Only 25% use government health care in squatter settlement (1D) 74% private OR 79% non-government health facilities in permanent housing area OR Only 21% use government health care in permanent housing (1D) (1S + 2D) 2(e)(i) Complete divided bar of permanent housing area 2 1 mark for dividing lines at 87% and 98% 1 mark for shading (1 + 1) 2(e)(ii) More people in the squatter settlement say long distance to travel (is the main 2 reason) (1) More people in the squatter settlement say limited / inconvenient opening times (is the main reason) (1) More people in the permanent housing area say poor quality of treatment (is the main reason) (1) More people in the permanent housing area say long waiting times (is the main reason) (1) Notes: can answer from the ‘less people’ angle, but do not double credit. Answers must compare. (1 + 1) 2(f) More / better hospitals / clinics / health facilities (1) 3 Medical centres open for longer hours (1) Train / provide more doctors / nurses / medical staff (1) Improve water supply / piped / clean water / safer water (1) Improve sanitation / drainage / sewage (1) Refuse / rubbish collection / more litter bins / make laws against littering (1) Education about health / hygiene (1) NGO / charities provide more healthcare facilities (1) Increase vaccinations / access to medicine / more inoculations (1) (1 + 1 + 1) 2(g) Maximum 1 mark for a generic idea: visit both areas / do it in groups / pairs / 4 safety issues / wear Hi-Vis / use recording sheet / record results / compare results / taking phones / when to do it (1) Choose a hypothesis to investigate with example e.g. Housing conditions are worse in permanent settlement (statement or question) (1) Talk to people who live in the two areas / interview them about… (1) Take photos of different houses to show different housing conditions … (1) Collect secondary data from internet / local government records / census (1) Make a podcast / video / blog to show something… (1) Draw field sketches (of houses) and label them to show different housing conditions … (1) Do a housing quality survey / bi-polar survey (1) Count / tally different types of building materials / number of brick-built houses (1) Observe / look at / make notes on / write a description of / walk round something e.g. housing conditions / roofs / windows (1) Credit expansion of ideas related to various methods e.g. Bi-polar method (1) Agree on different descriptions of housing conditions (1) Create a scoring sheet (1) Decide range of scores / score positive and negative (1) Decide on scores at each site (1) Add ticks to sheet (1) Total scores on sheet (1) Compare and agree on scores (1) (1 + 1 + 1 + 1)
What was in this paper
The subtopics covered by these 2 questions, and how many questions each got. Open one in a new tab to see every Cambridge question on it.
What you needed in this session
Cambridge’s own grade thresholds for 2025 Oct/Nov, Paper 4 · Variant 2. A higher threshold means an easier paper — the bar moves with how the cohort did.