Cambridge IGCSE Geography 0460 — 2023 Oct/Nov Paper 4 · Variant 3
0460/43/O/N/23 · 2 questions · 60 marks · ≈68 min
The question paper and its mark scheme, free to read here and free to download. This is Cambridge’s own paper, exactly as it was sat.
Question paper20 pages
Mark scheme10 pages
Answers below. Sit the paper first if you are practising.
Questions as text
Q1 · A class of students in northern England were learning how to collect weather data
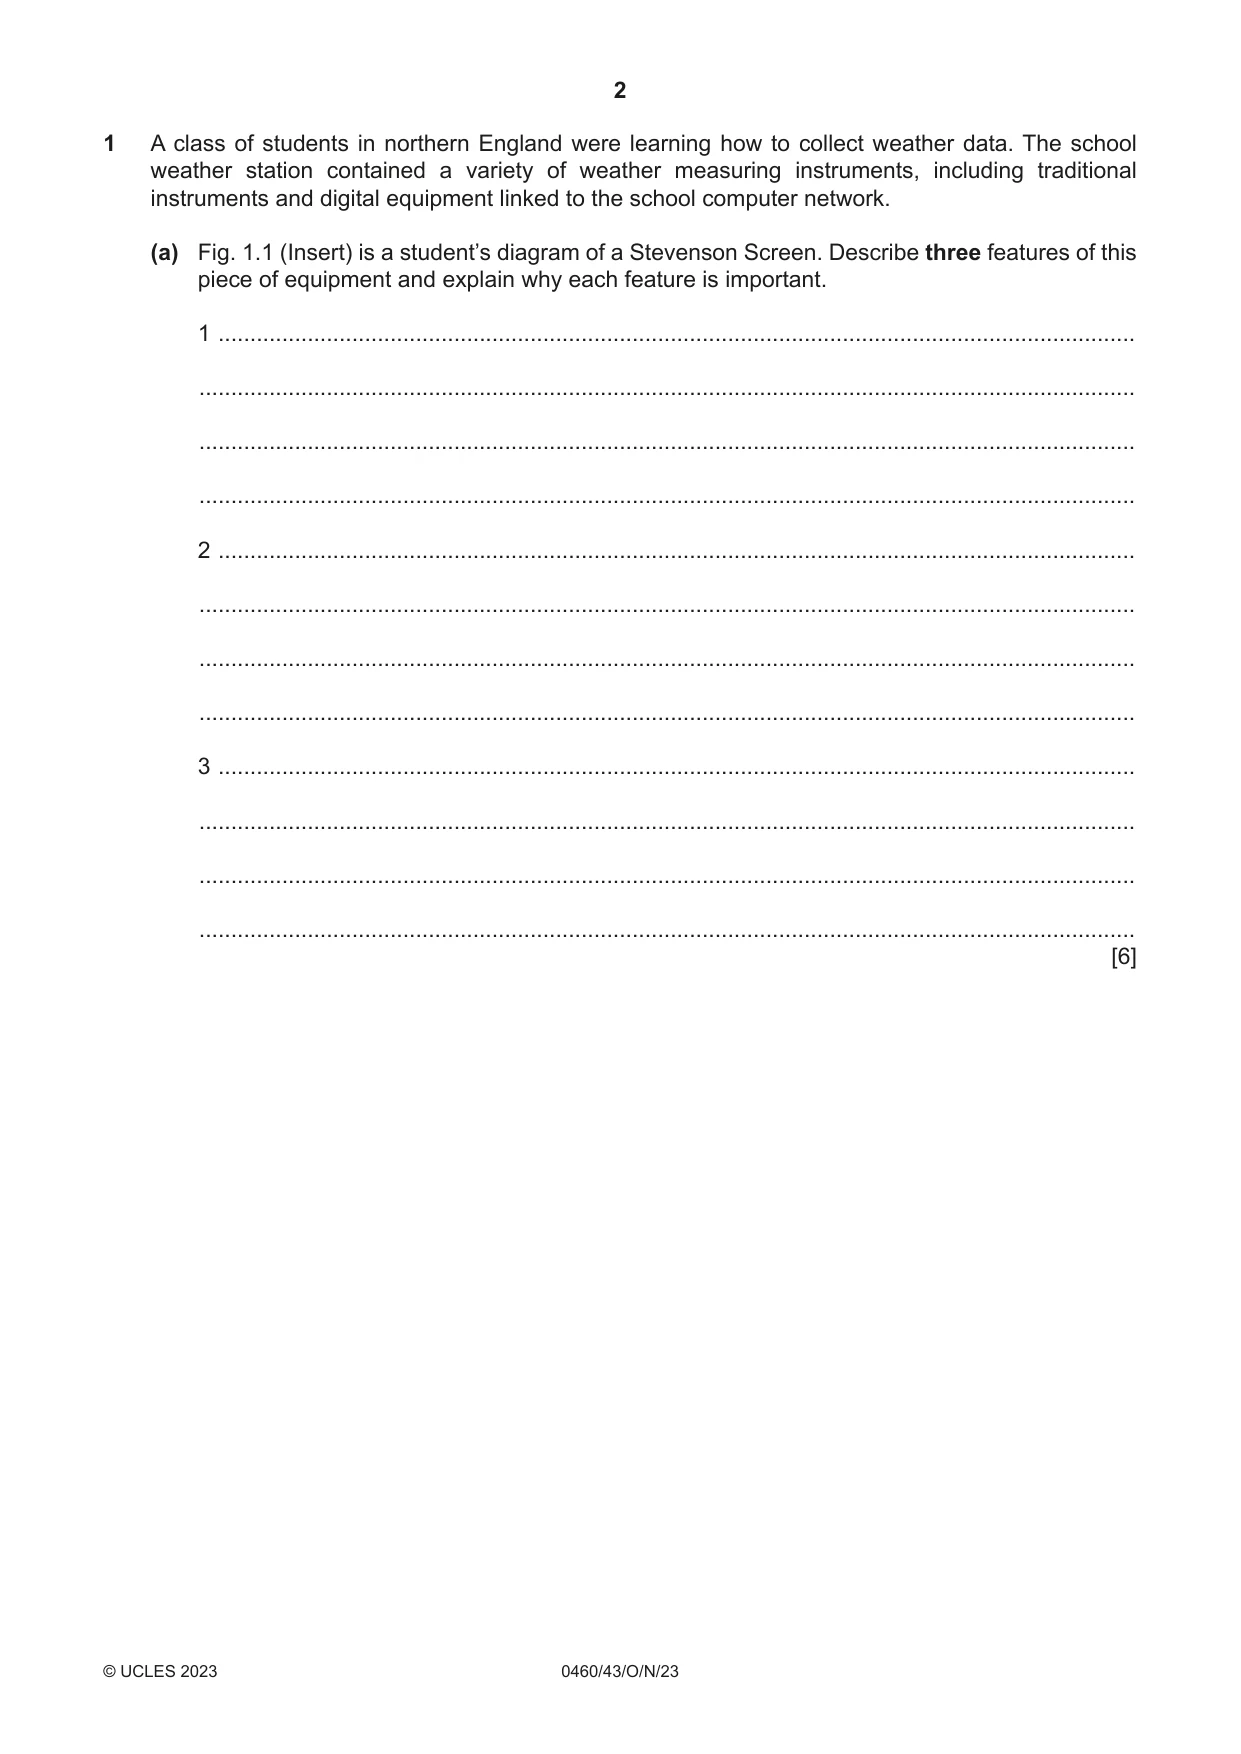
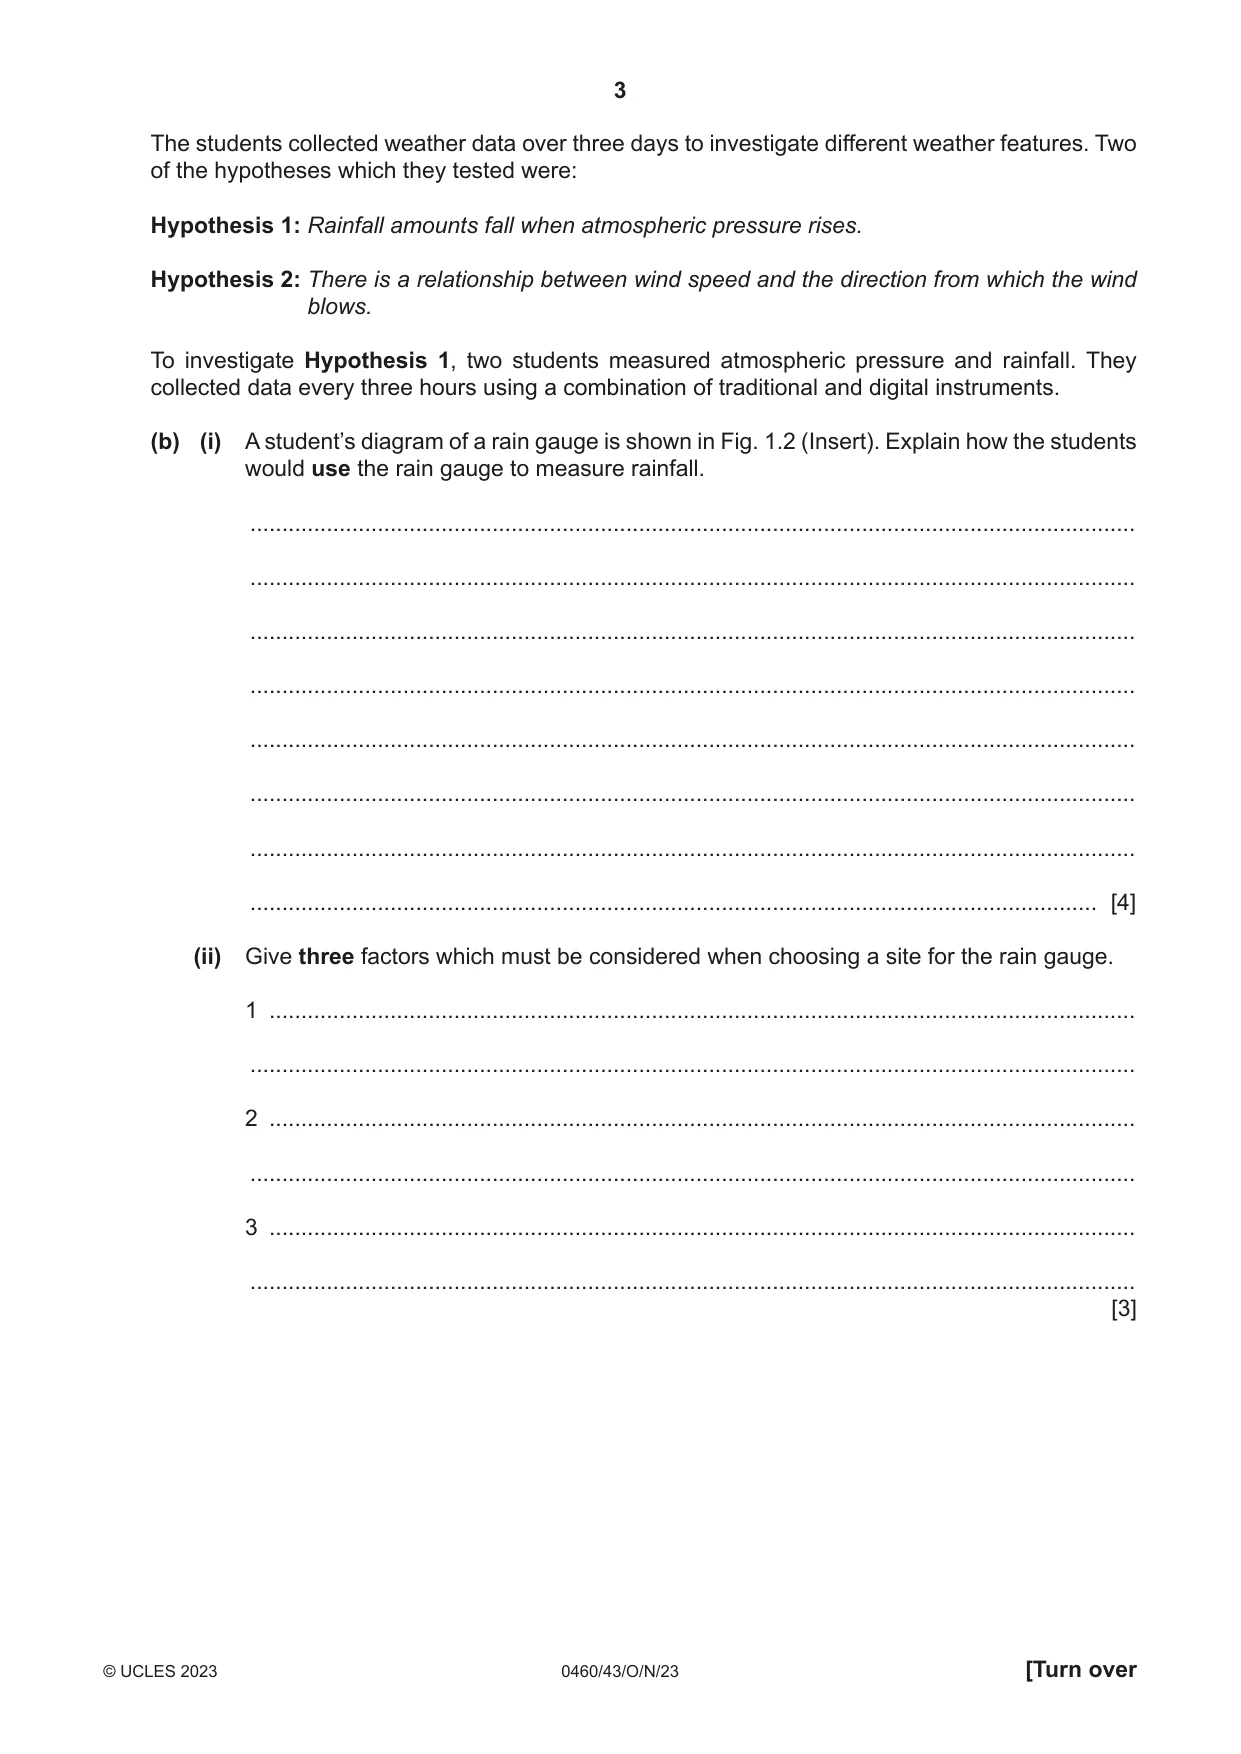
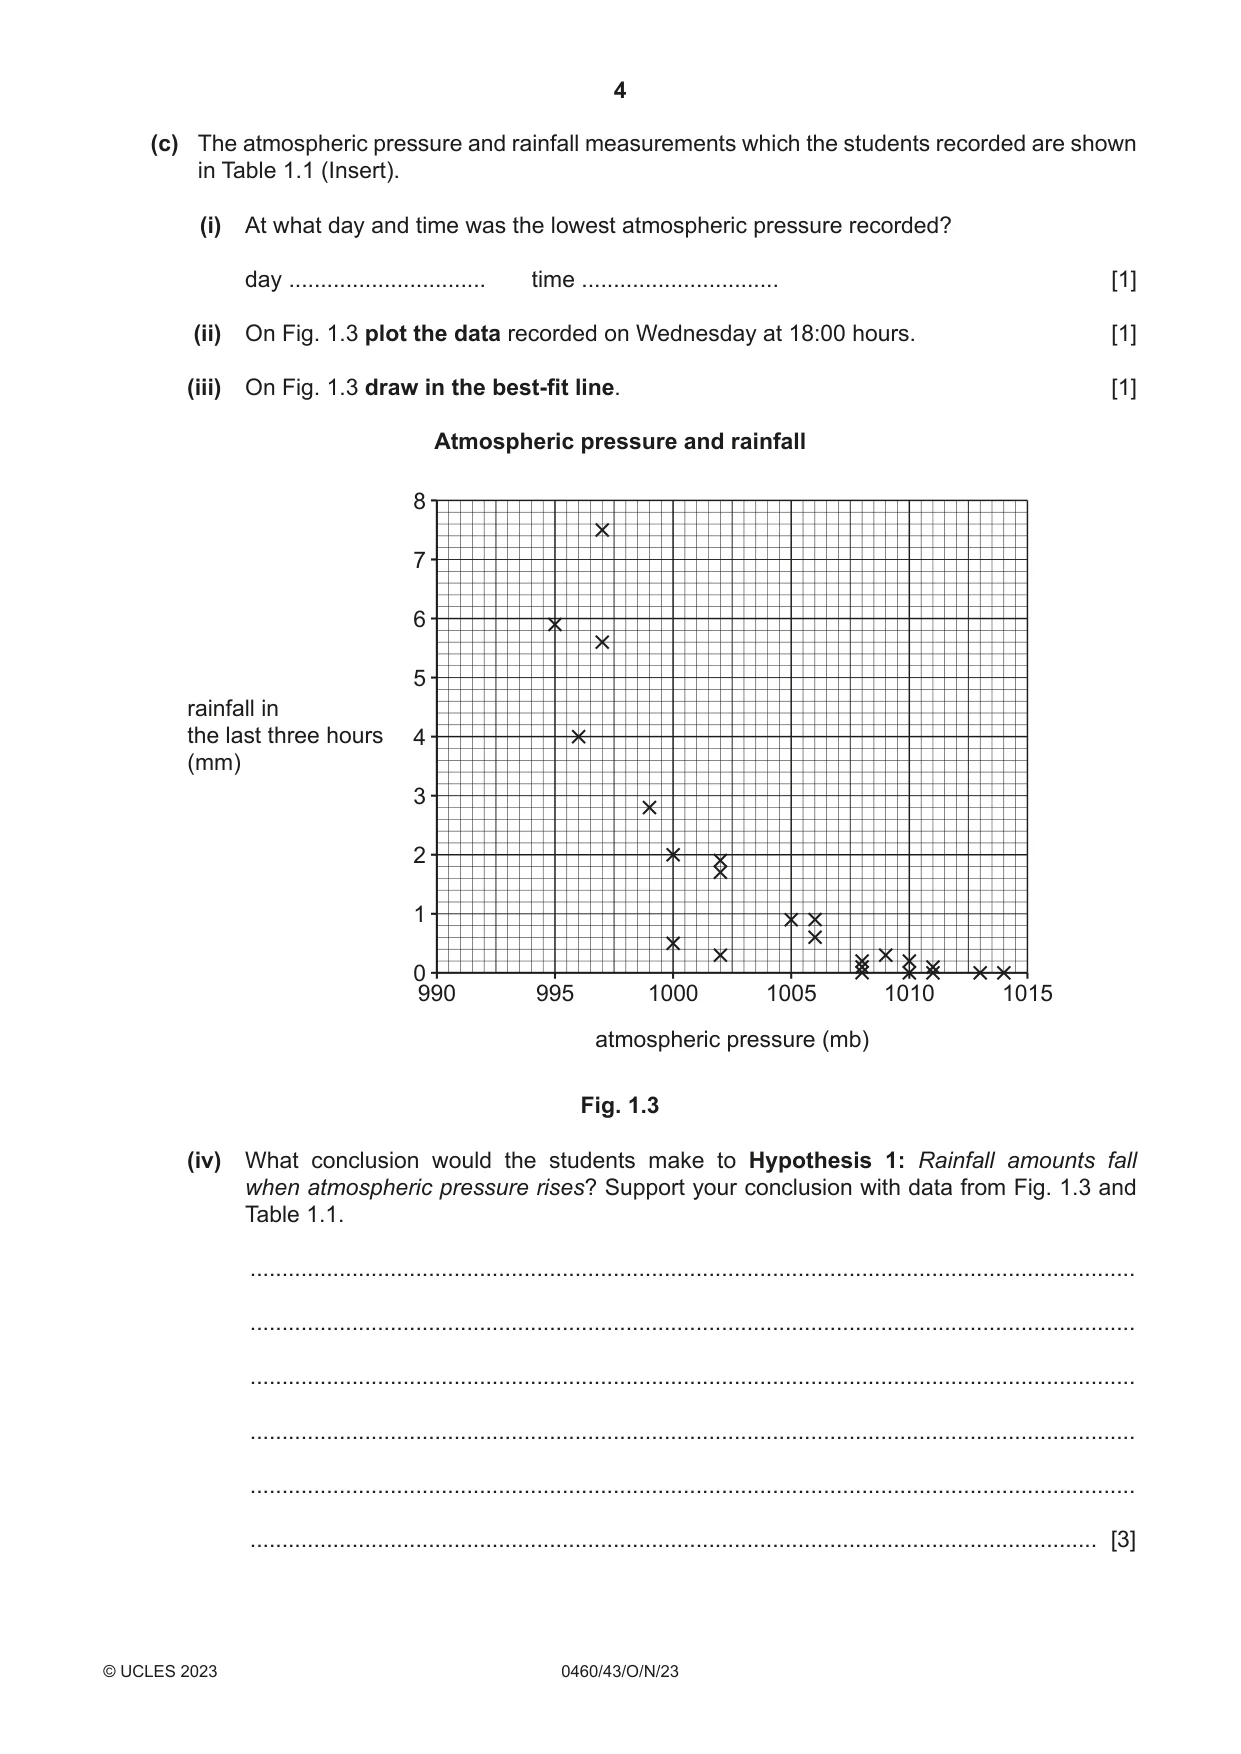
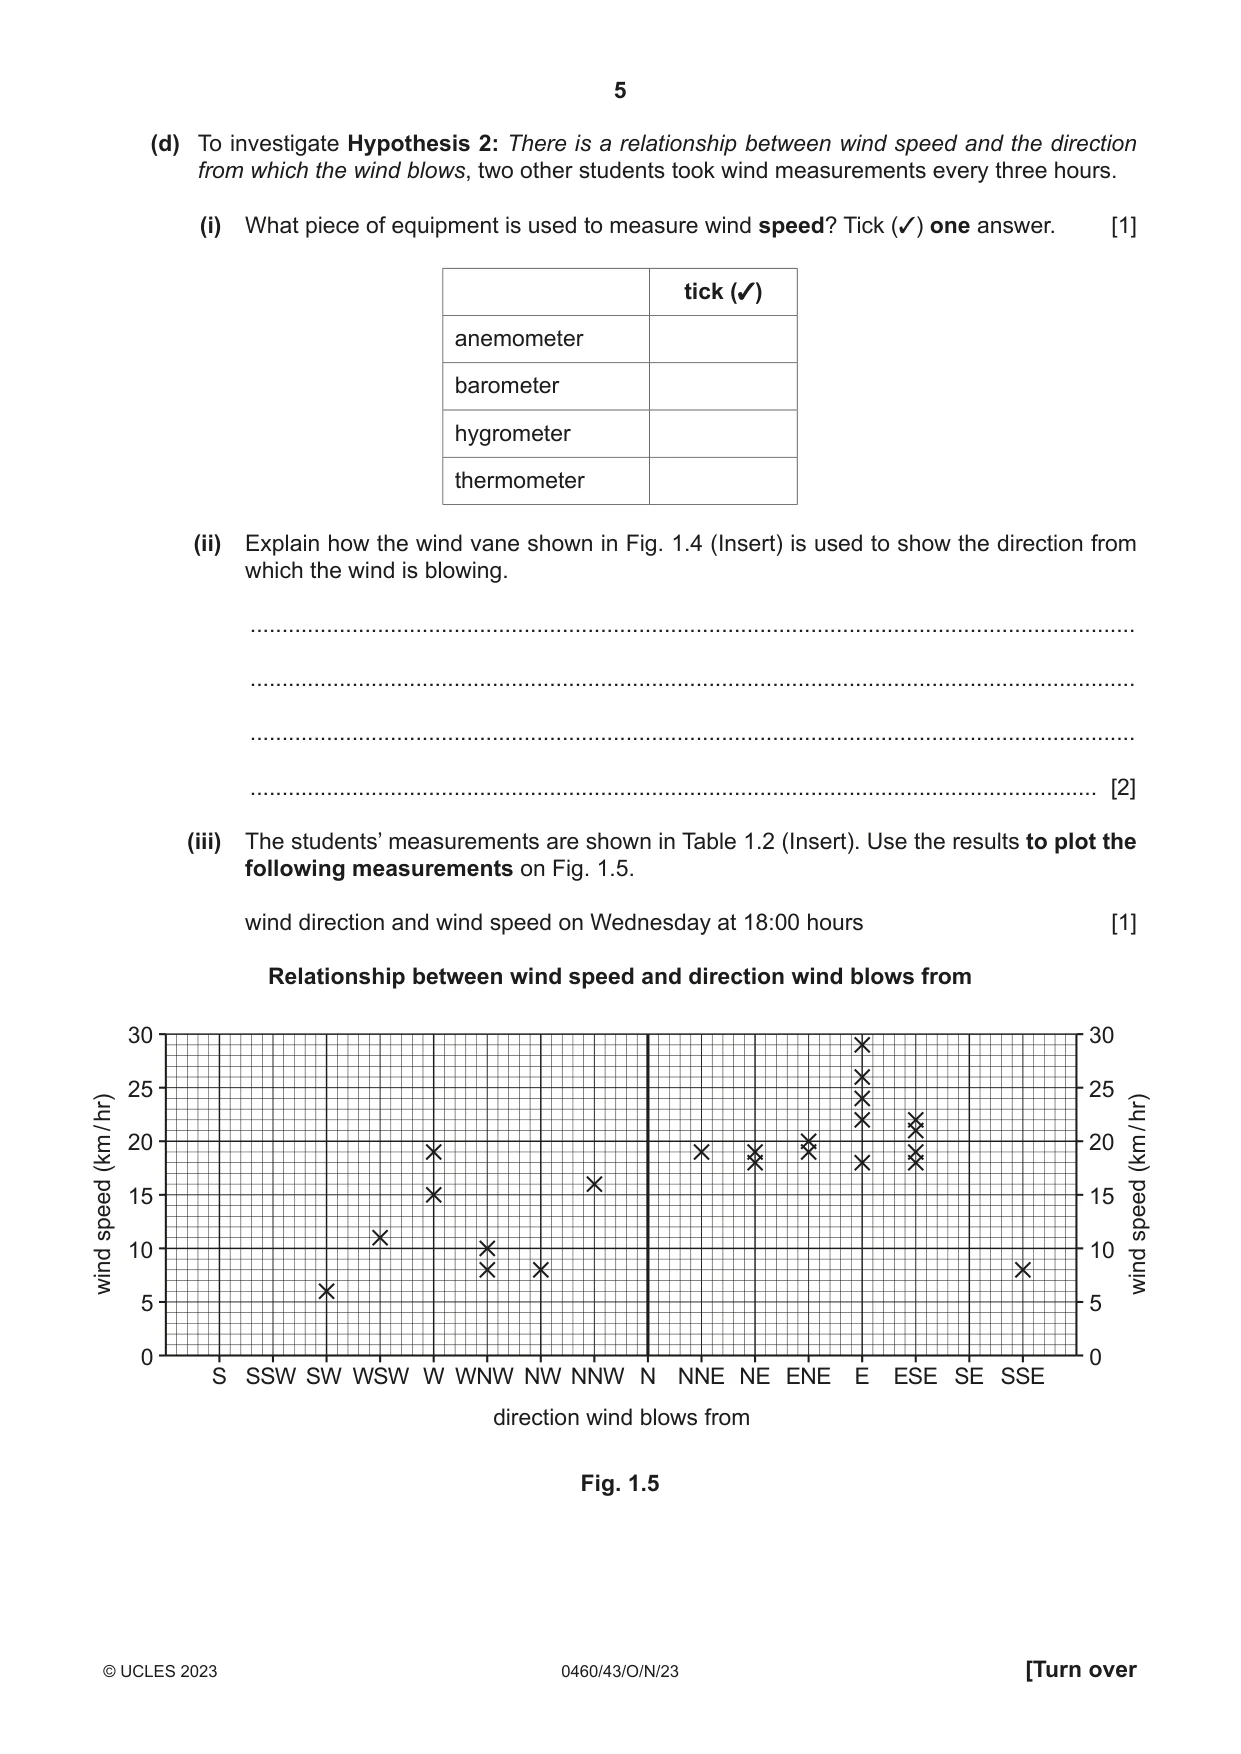
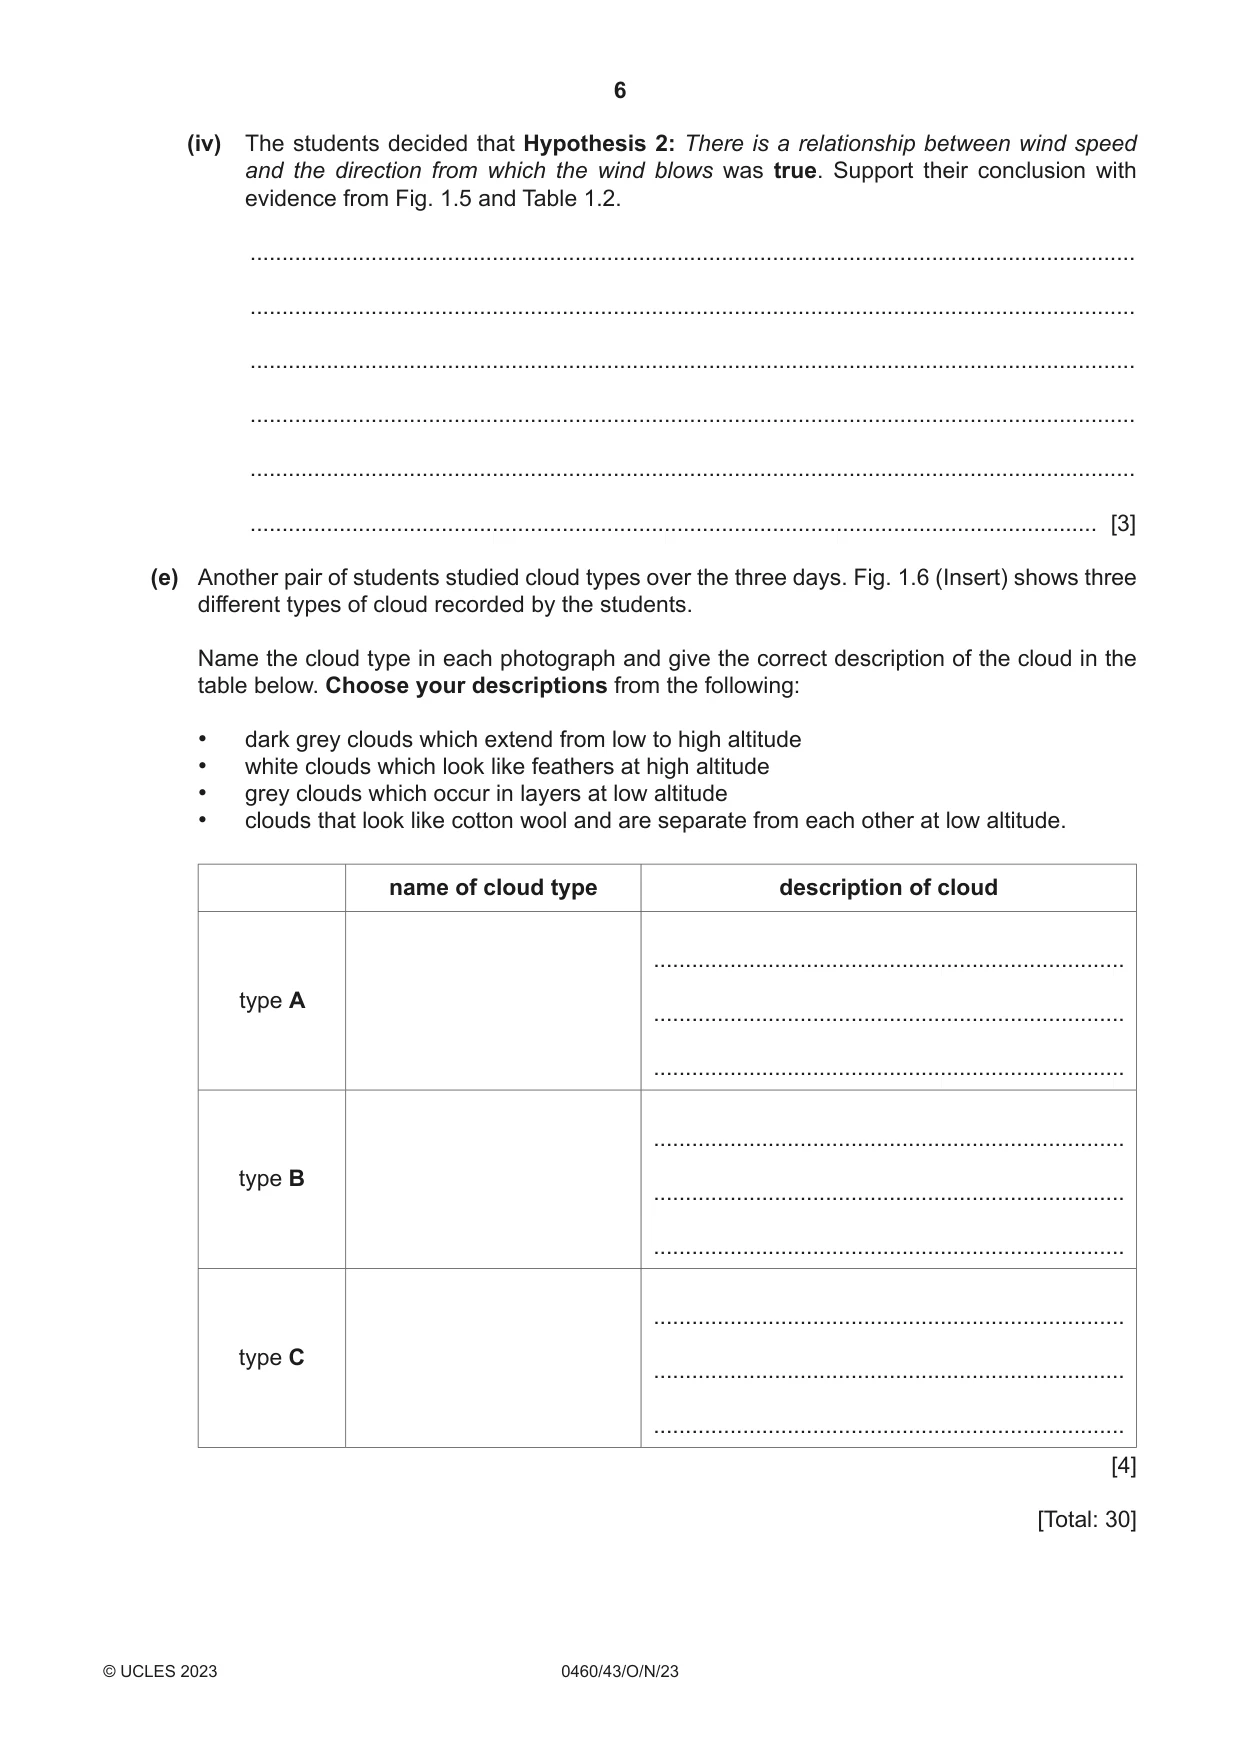
1 A class of students in northern England were learning how to collect weather data. The school weather station contained a variety of weather measuring instruments, including traditional instruments and digital equipment linked to the school computer network. (a) Fig. 1.1 (Insert) is a student’s diagram of a Stevenson Screen. Describe three features of this piece of equipment and explain why each feature is important. 1 ................................................................................................................................................ ................................................................................................................................................... ................................................................................................................................................... ................................................................................................................................................... 2 ................................................................................................................................................ ................................................................................................................................................... ................................................................................................................................................... ................................................................................................................................................... 3 ................................................................................................................................................ ................................................................................................................................................... ................................................................................................................................................... ................................................................................................................................................... [6] The students collected weather data over three days to investigate different weather features. Two of the hypotheses which they tested were: Hypothesis 1: Rainfall amounts fall when atmospheric pressure rises. Hypothesis 2: There is a relationship between wind speed and the direction from which the wind blows. To investigate Hypothesis 1, two students measured atmospheric pressure and rainfall. They collected data every three hours using a combination of traditional and digital instruments. (b) (i) A student’s diagram of a rain gauge is shown in Fig. 1.2 (Insert). Explain how the students would use the rain gauge to measure rainfall. ........................................................................................................................................... ........................................................................................................................................... ........................................................................................................................................... ........................................................................................................................................... ........................................................................................................................................... ........................................................................................................................................... ........................................................................................................................................... ..................................................................................................................................... [4] (ii) Give three factors which must be considered when choosing a site for the rain gauge. 1 ........................................................................................................................................ ........................................................................................................................................... 2 ........................................................................................................................................ ........................................................................................................................................... 3 ........................................................................................................................................ ........................................................................................................................................... [3] (c) The atmospheric pressure and rainfall measurements which the students recorded are shown in Table 1.1 (Insert). (i) At what day and time was the lowest atmospheric pressure recorded? day ............................... time ............................... [1] (ii) On Fig. 1.3 plot the data recorded on Wednesday at 18:00 hours. [1] (iii) On Fig. 1.3 draw in the best-fit line. [1] Atmospheric pressure and rainfall 8 7 6 5 rainfall in the last three hours 4 (mm) 3 2 1 0 990 995 1000 1005 1010 1015 atmospheric pressure (mb) Fig. 1.3 (iv) What conclusion would the students make to Hypothesis 1: Rainfall amounts fall when atmospheric pressure rises? Support your conclusion with data from Fig. 1.3 and Table 1.1. ........................................................................................................................................... ........................................................................................................................................... ........................................................................................................................................... ........................................................................................................................................... ........................................................................................................................................... ..................................................................................................................................... [3] (d) To investigate Hypothesis 2: There is a relationship between wind speed and the direction from which the wind blows, two other students took wind measurements every three hours. (i) What piece of equipment is used to measure wind speed? Tick (3) one answer. [1] tick (3) anemometer barometer hygrometer thermometer (ii) Explain how the wind vane shown in Fig. 1.4 (Insert) is used to show the direction from which the wind is blowing. ........................................................................................................................................... ........................................................................................................................................... ........................................................................................................................................... ..................................................................................................................................... [2] (iii) The students’ measurements are shown in Table 1.2 (Insert). Use the results to plot the following measurements on Fig. 1.5. wind direction and wind speed on Wednesday at 18:00 hours [1] Relationship between wind speed and direction wind blows from 30 30 25 25 hr) hr) / 20 20 /(km (km speed 15 15 speed 10 10 wind wind 5 5 0 0 S SSW SW WSW W WNW NW NNW N NNE NE ENE E ESE SE SSE direction wind blows from Fig. 1.5 (iv) The students decided that Hypothesis 2: There is a relationship between wind speed and the direction from which the wind blows was true. Support their conclusion with evidence from Fig. 1.5 and Table 1.2. ........................................................................................................................................... ........................................................................................................................................... ........................................................................................................................................... ........................................................................................................................................... ........................................................................................................................................... ..................................................................................................................................... [3] (e) Another pair of students studied cloud types over the three days. Fig. 1.6 (Insert) shows three different types of cloud recorded by the students. Name the cloud type in each photograph and give the correct description of the cloud in the table below. Choose your descriptions from the following: • dark grey clouds which extend from low to high altitude • white clouds which look like feathers at high altitude • grey clouds which occur in layers at low altitude • clouds that look like cotton wool and are separate from each other at low altitude. name of cloud type description of cloud .......................................................................... type A .......................................................................... .......................................................................... .......................................................................... type B .......................................................................... .......................................................................... .......................................................................... type C .......................................................................... .......................................................................... [4] [Total: 30]
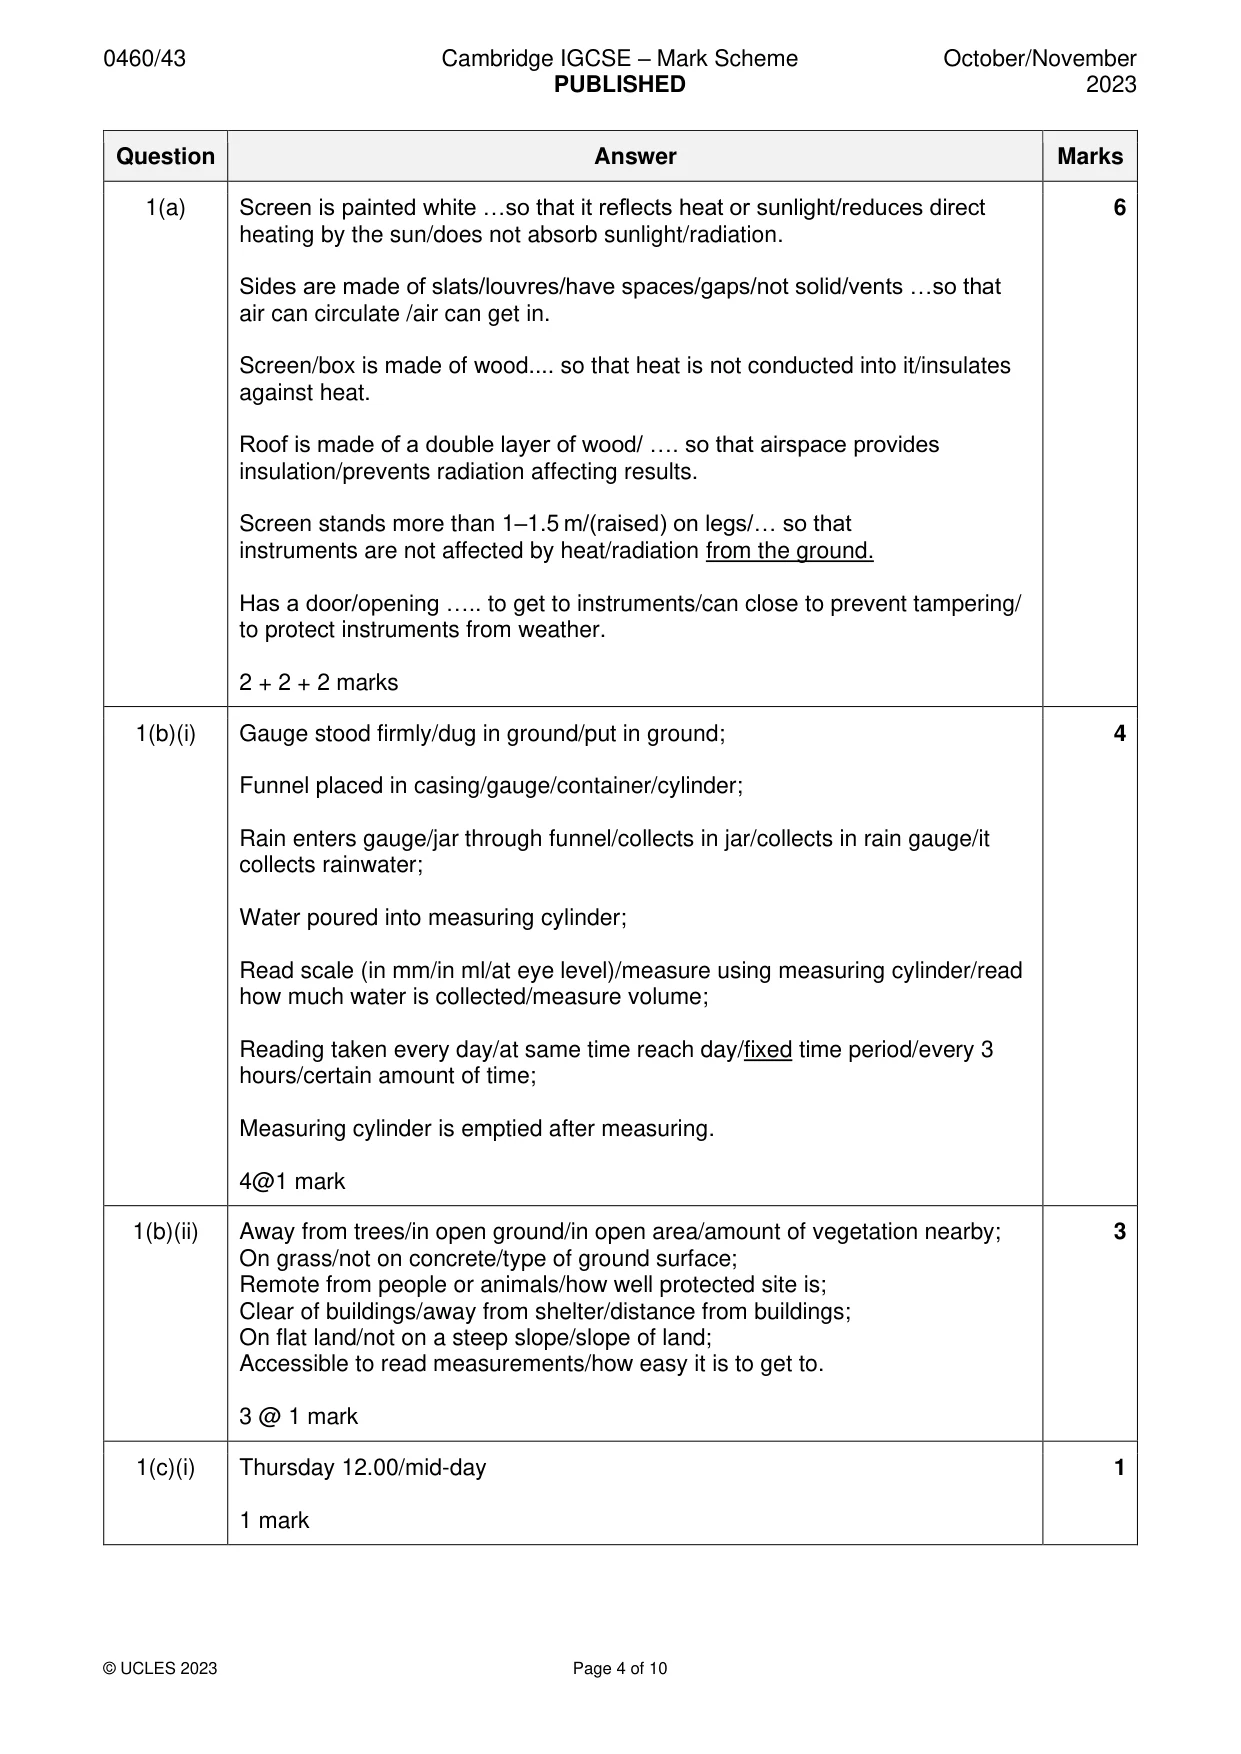
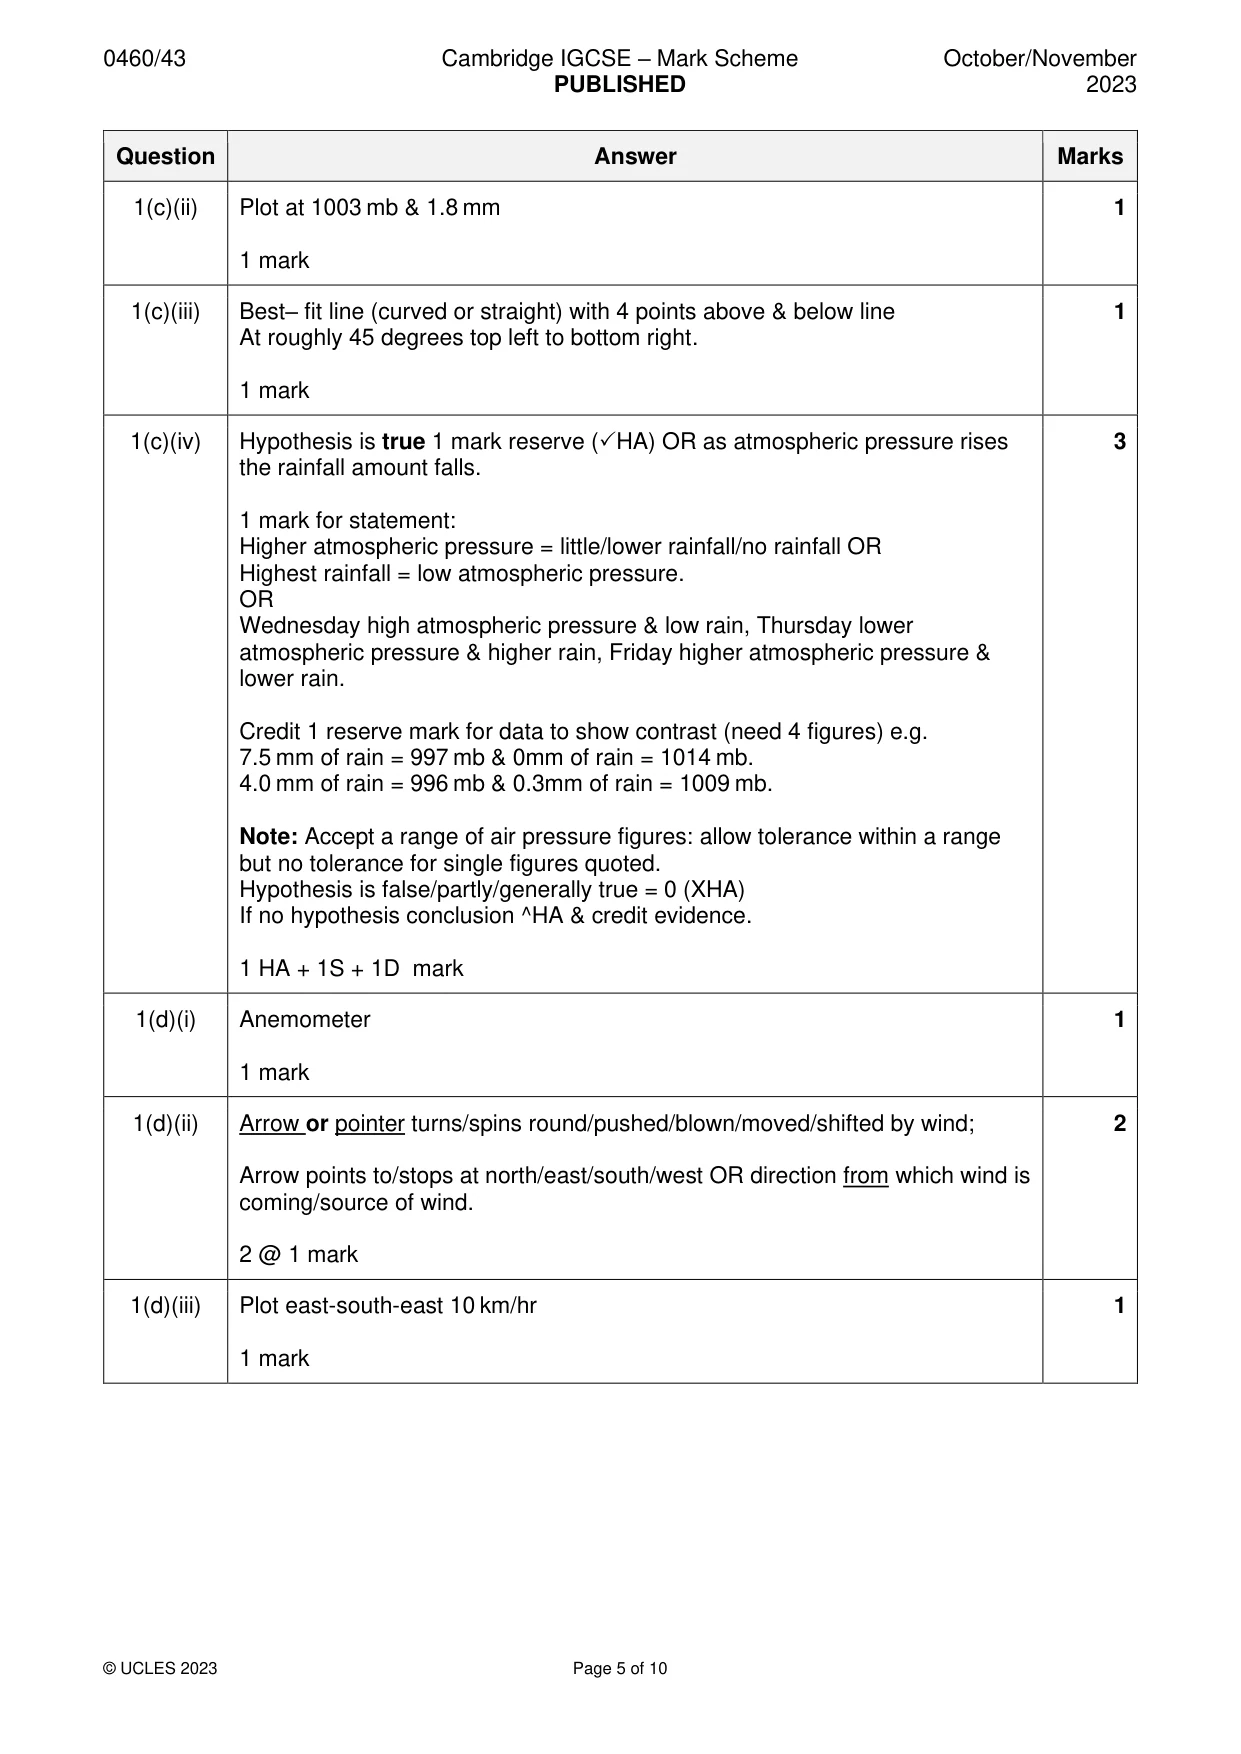
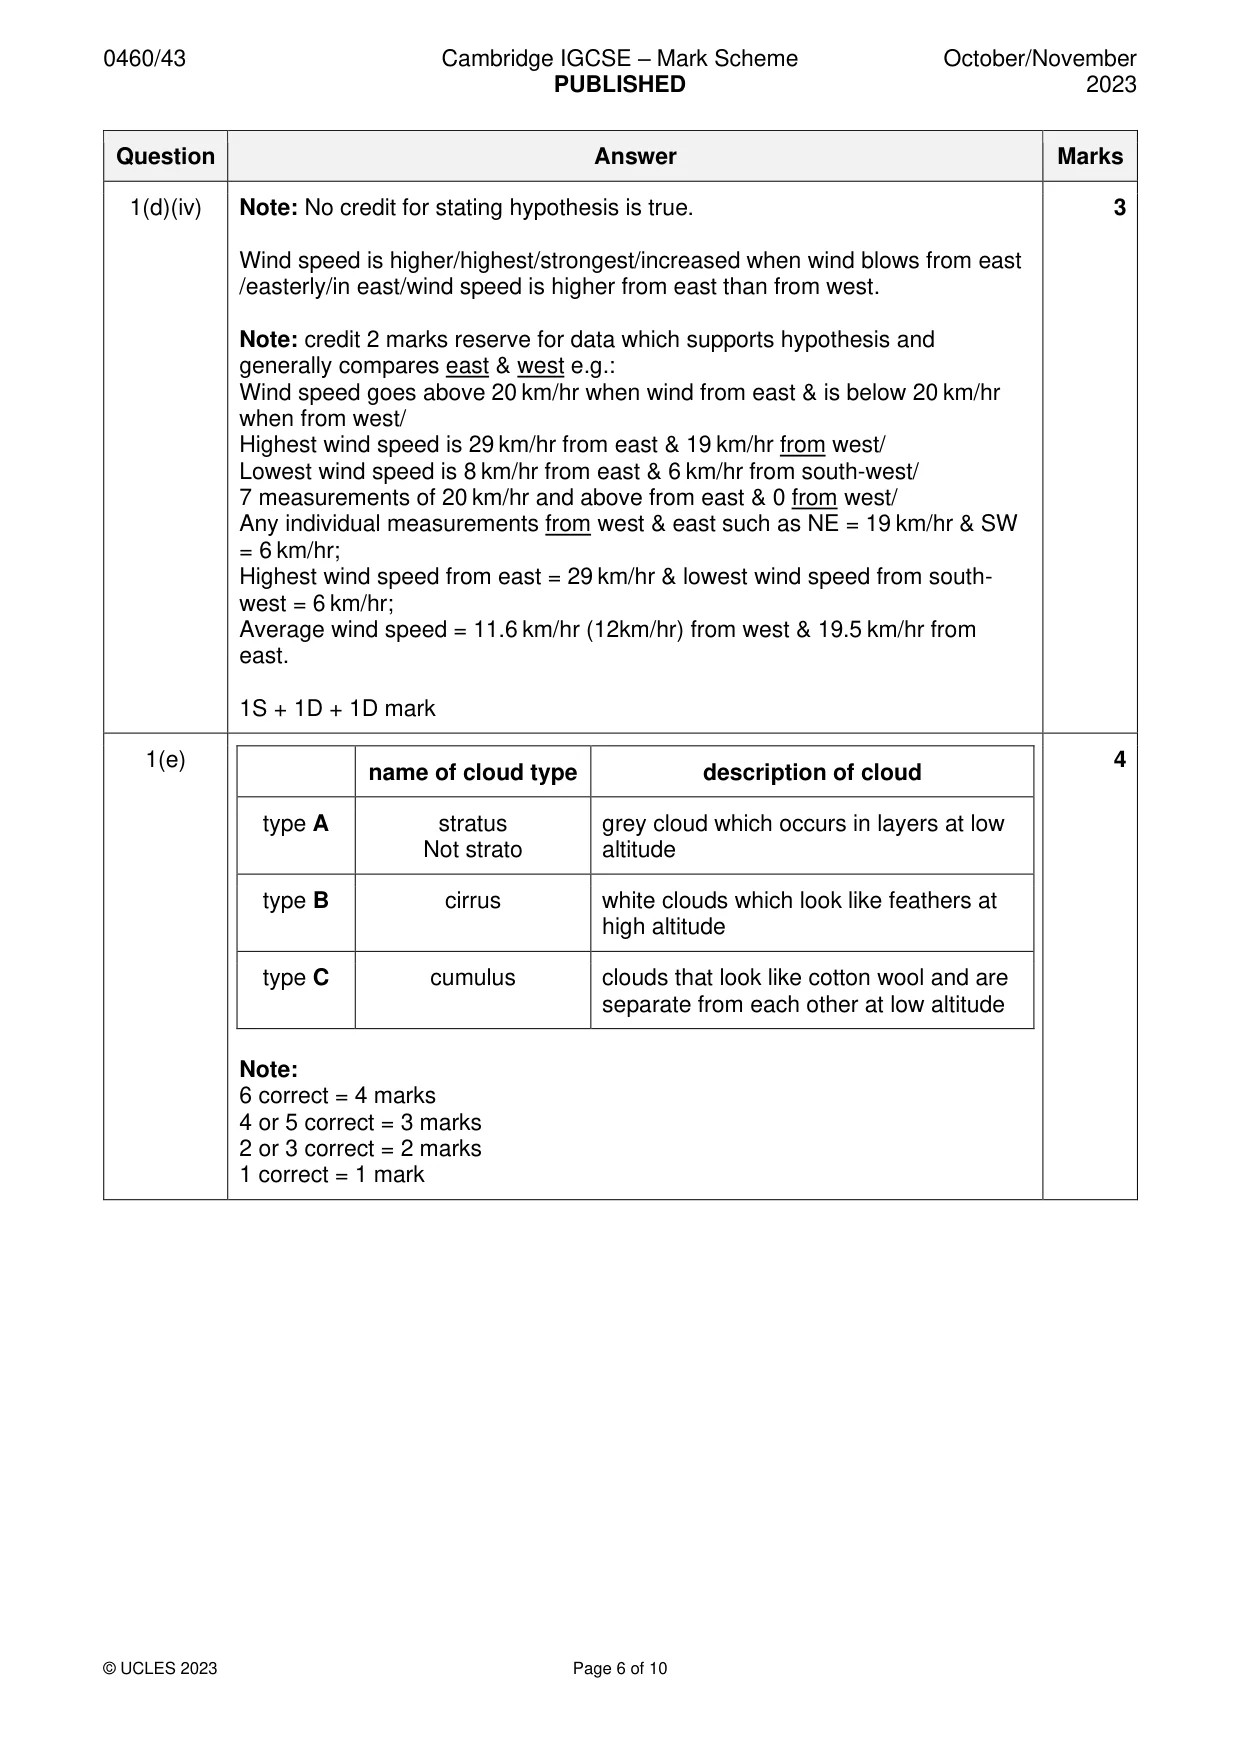
Mark scheme: Question Answer Marks 1(a) Screen is painted white …so that it reflects heat or sunlight/reduces direct 6 heating by the sun/does not absorb sunlight/radiation. Sides are made of slats/louvres/have spaces/gaps/not solid/vents …so that air can circulate /air can get in. Screen/box is made of wood.... so that heat is not conducted into it/insulates against heat. Roof is made of a double layer of wood/ …. so that airspace provides insulation/prevents radiation affecting results. Screen stands more than 1–1.5 m/(raised) on legs/… so that instruments are not affected by heat/radiation from the ground. Has a door/opening ….. to get to instruments/can close to prevent tampering/ to protect instruments from weather. 2 + 2 + 2 marks 1(b)(i) Gauge stood firmly/dug in ground/put in ground; 4 Funnel placed in casing/gauge/container/cylinder; Rain enters gauge/jar through funnel/collects in jar/collects in rain gauge/it collects rainwater; Water poured into measuring cylinder; Read scale (in mm/in ml/at eye level)/measure using measuring cylinder/read how much water is collected/measure volume; Reading taken every day/at same time reach day/fixed time period/every 3 hours/certain amount of time; Measuring cylinder is emptied after measuring. 4@1 mark 1(b)(ii) Away from trees/in open ground/in open area/amount of vegetation nearby; 3 On grass/not on concrete/type of ground surface; Remote from people or animals/how well protected site is; Clear of buildings/away from shelter/distance from buildings; On flat land/not on a steep slope/slope of land; Accessible to read measurements/how easy it is to get to. 3 @ 1 mark 1(c)(i) Thursday 12.00/mid-day 1 1 mark 1(c)(ii) Plot at 1003 mb & 1.8 mm 1 1 mark 1(c)(iii) Best– fit line (curved or straight) with 4 points above & below line 1 At roughly 45 degrees top left to bottom right. 1 mark 1(c)(iv) Hypothesis is true 1 mark reserve (HA) OR as atmospheric pressure rises 3 the rainfall amount falls. 1 mark for statement: Higher atmospheric pressure = little/lower rainfall/no rainfall OR Highest rainfall = low atmospheric pressure. OR Wednesday high atmospheric pressure & low rain, Thursday lower atmospheric pressure & higher rain, Friday higher atmospheric pressure & lower rain. Credit 1 reserve mark for data to show contrast (need 4 figures) e.g. 7.5 mm of rain = 997 mb & 0mm of rain = 1014 mb. 4.0 mm of rain = 996 mb & 0.3mm of rain = 1009 mb. Note: Accept a range of air pressure figures: allow tolerance within a range but no tolerance for single figures quoted. Hypothesis is false/partly/generally true = 0 (XHA) If no hypothesis conclusion ^HA & credit evidence. 1 HA + 1S + 1D mark 1(d)(i) Anemometer 1 1 mark 1(d)(ii) Arrow or pointer turns/spins round/pushed/blown/moved/shifted by wind; 2 Arrow points to/stops at north/east/south/west OR direction from which wind is coming/source of wind. 2 @ 1 mark 1(d)(iii) Plot east-south-east 10 km/hr 1 1 mark 1(d)(iv) Note: No credit for stating hypothesis is true. 3 Wind speed is higher/highest/strongest/increased when wind blows from east /easterly/in east/wind speed is higher from east than from west. Note: credit 2 marks reserve for data which supports hypothesis and generally compares east & west e.g.: Wind speed goes above 20 km/hr when wind from east & is below 20 km/hr when from west/ Highest wind speed is 29 km/hr from east & 19 km/hr from west/ Lowest wind speed is 8 km/hr from east & 6 km/hr from south-west/ 7 measurements of 20 km/hr and above from east & 0 from west/ Any individual measurements from west & east such as NE = 19 km/hr & SW = 6 km/hr; Highest wind speed from east = 29 km/hr & lowest wind speed from south- west = 6 km/hr; Average wind speed = 11.6 km/hr (12km/hr) from west & 19.5 km/hr from east. 1S + 1D + 1D mark 1(e) 4 name of cloud type description of cloud type A stratus grey cloud which occurs in layers at low Not strato altitude type B cirrus white clouds which look like feathers at high altitude type C cumulus clouds that look like cotton wool and are separate from each other at low altitude Note: 6 correct = 4 marks 4 or 5 correct = 3 marks 2 or 3 correct = 2 marks 1 correct = 1 mark
Q2 · Students were doing fieldwork in their local town centre (CBD)
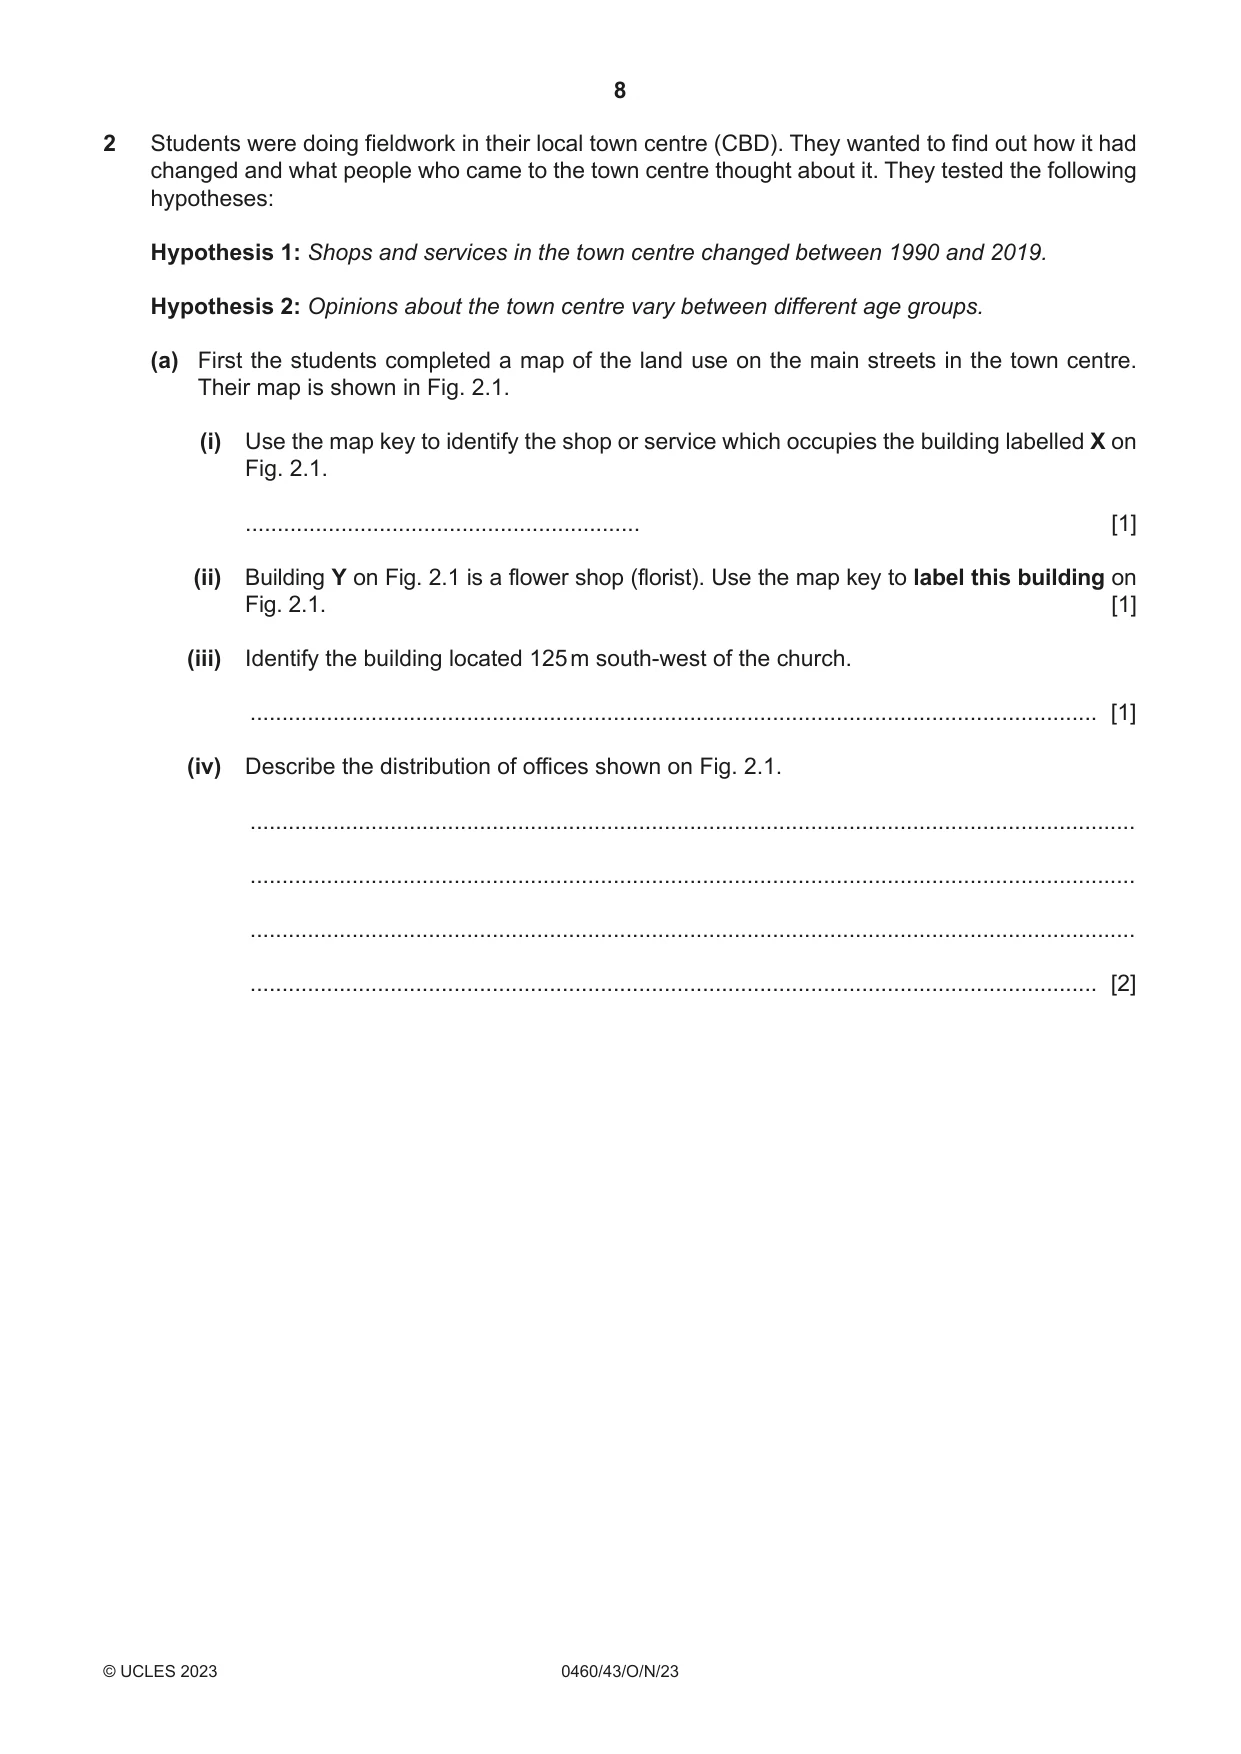
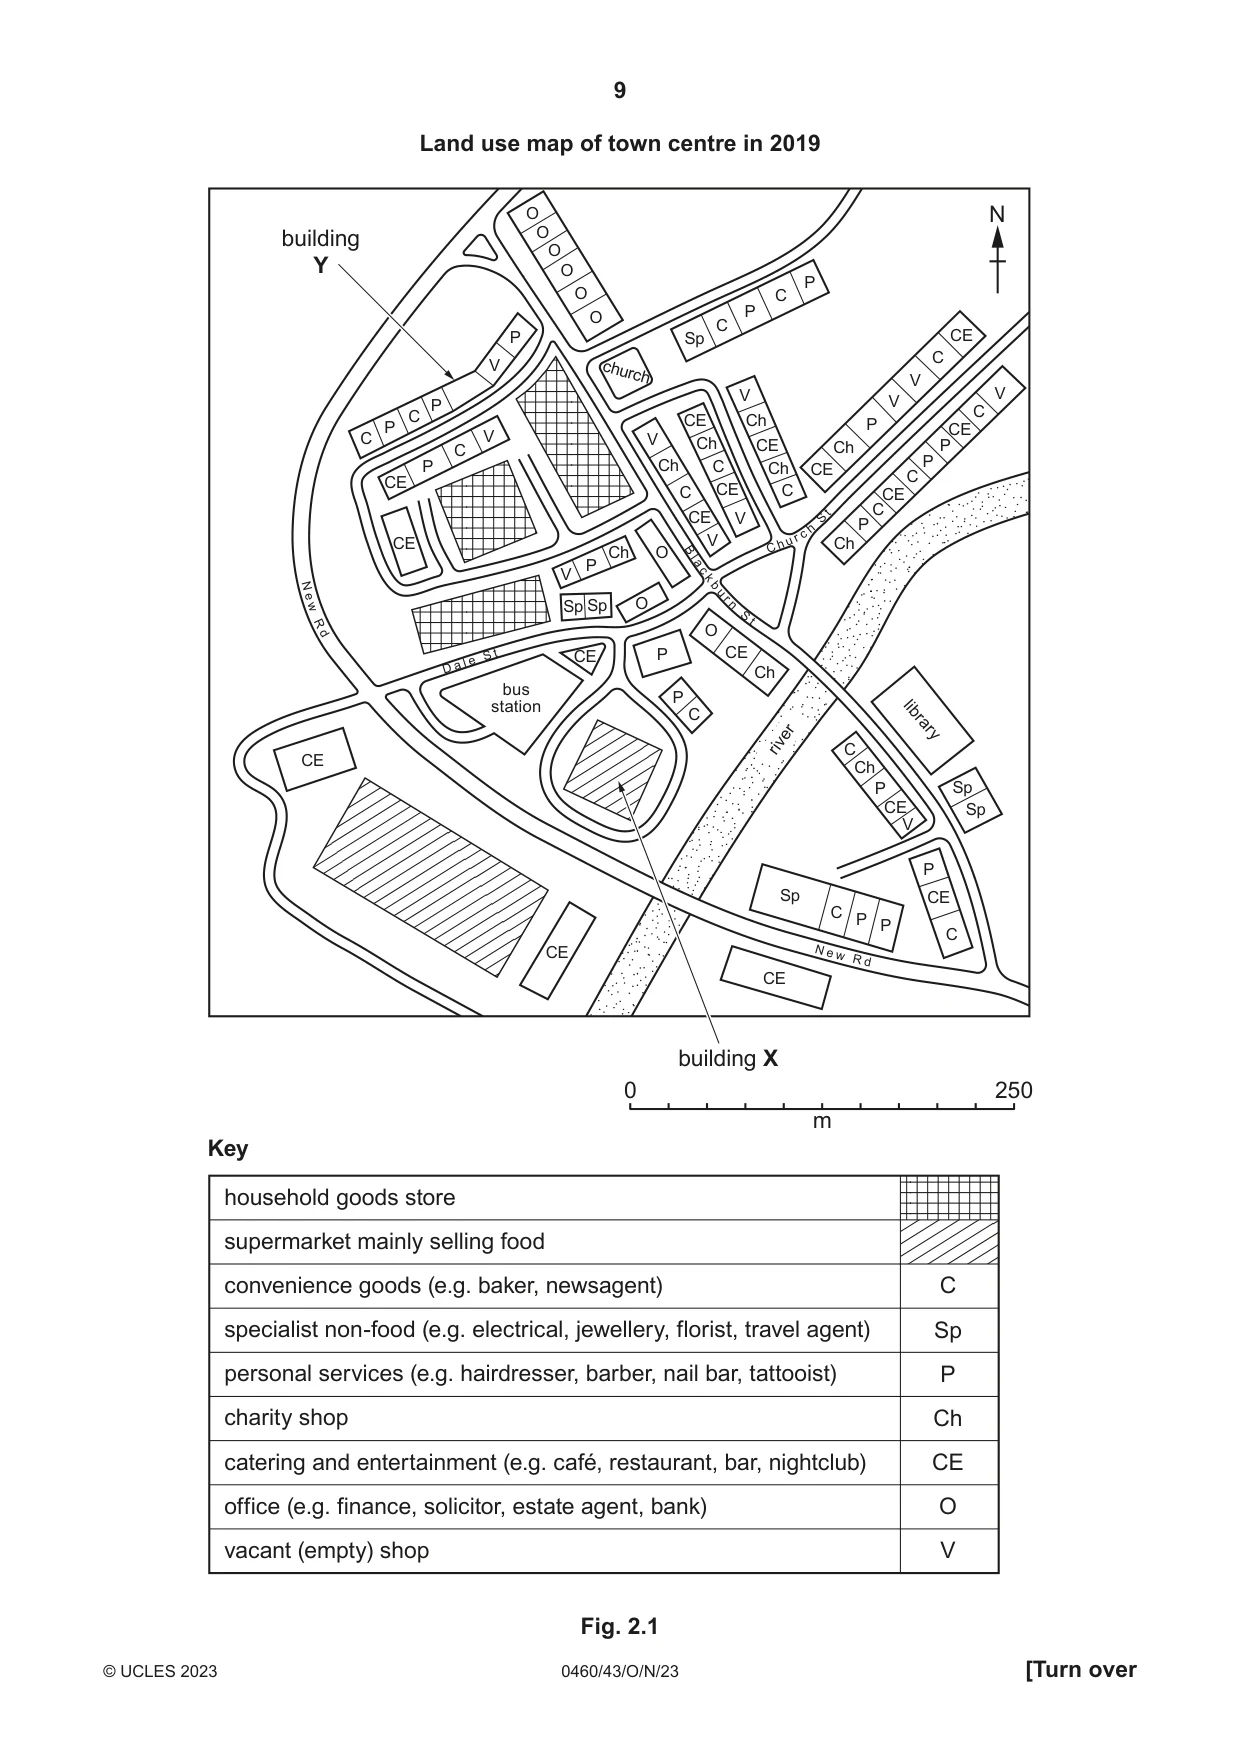
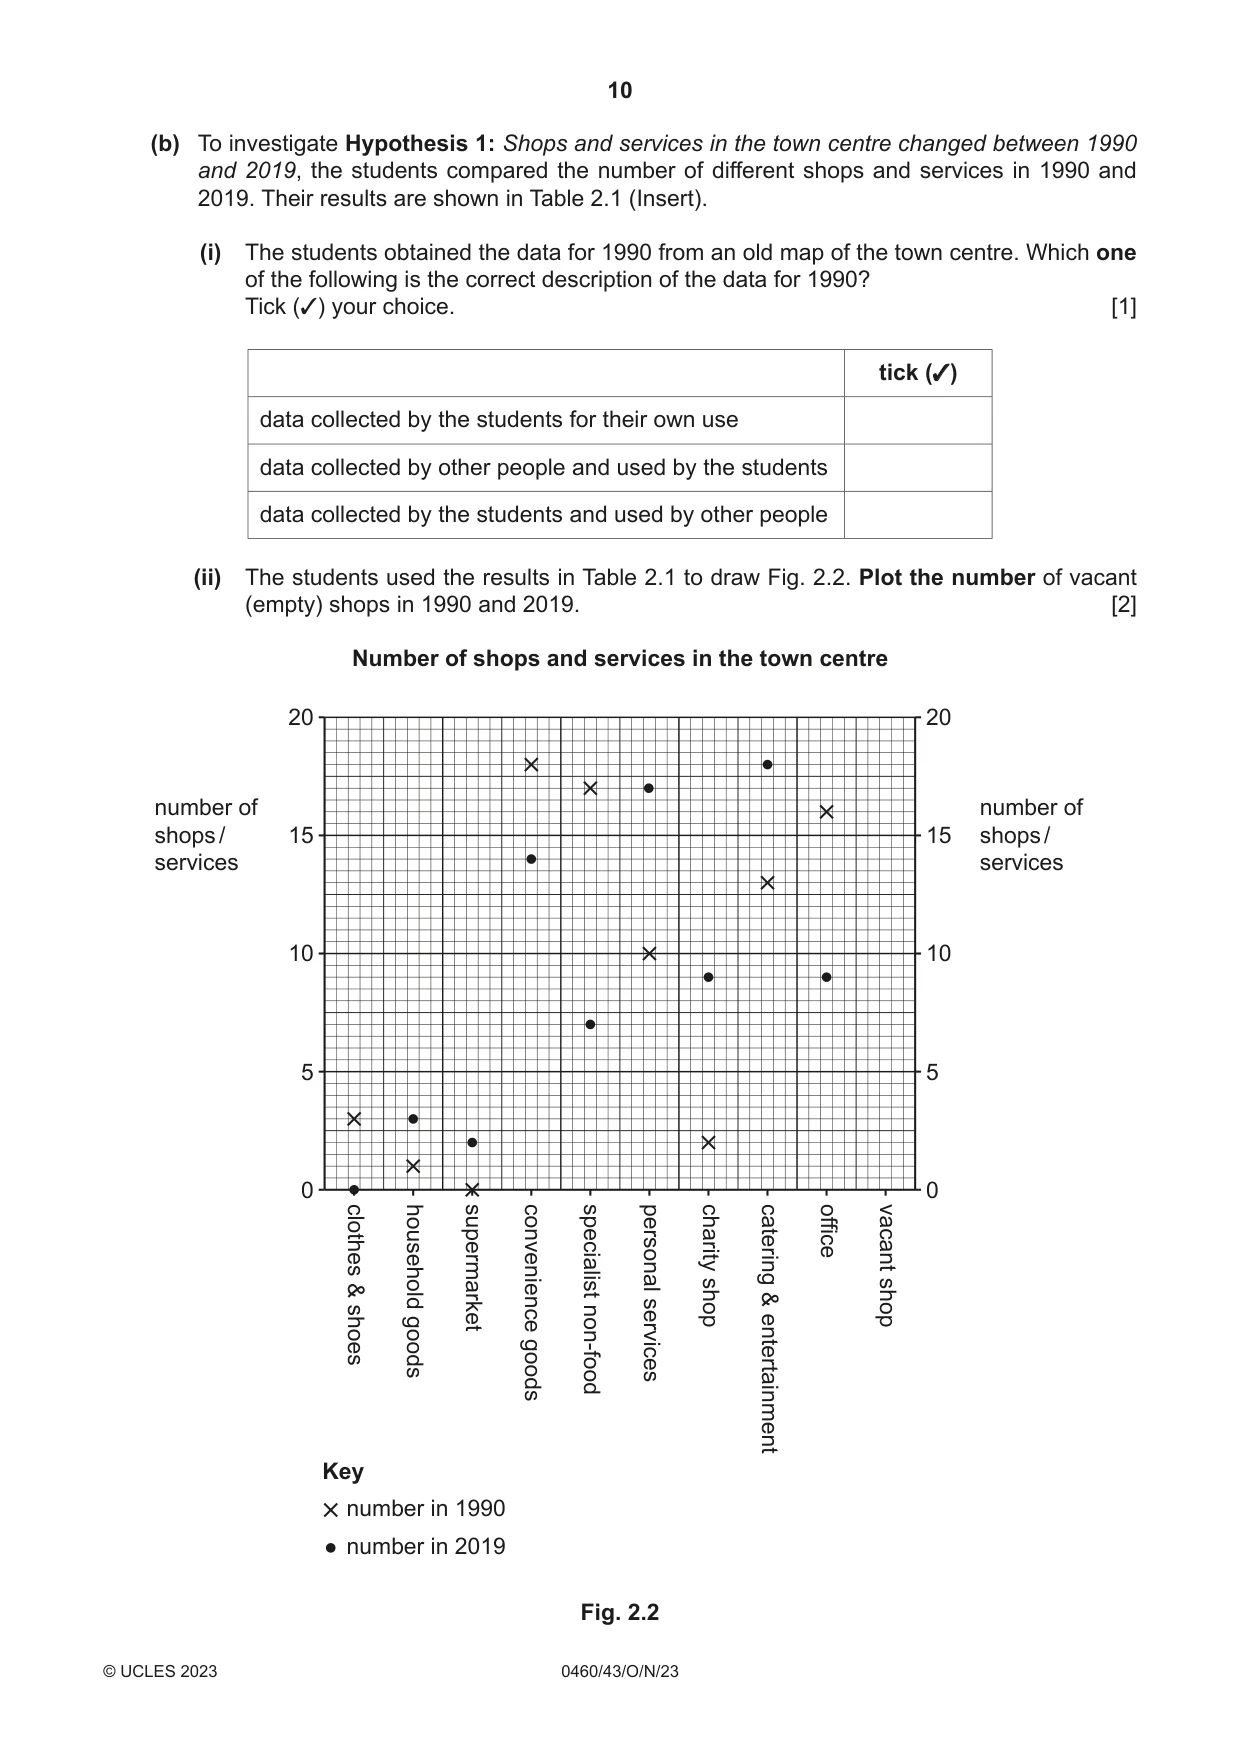
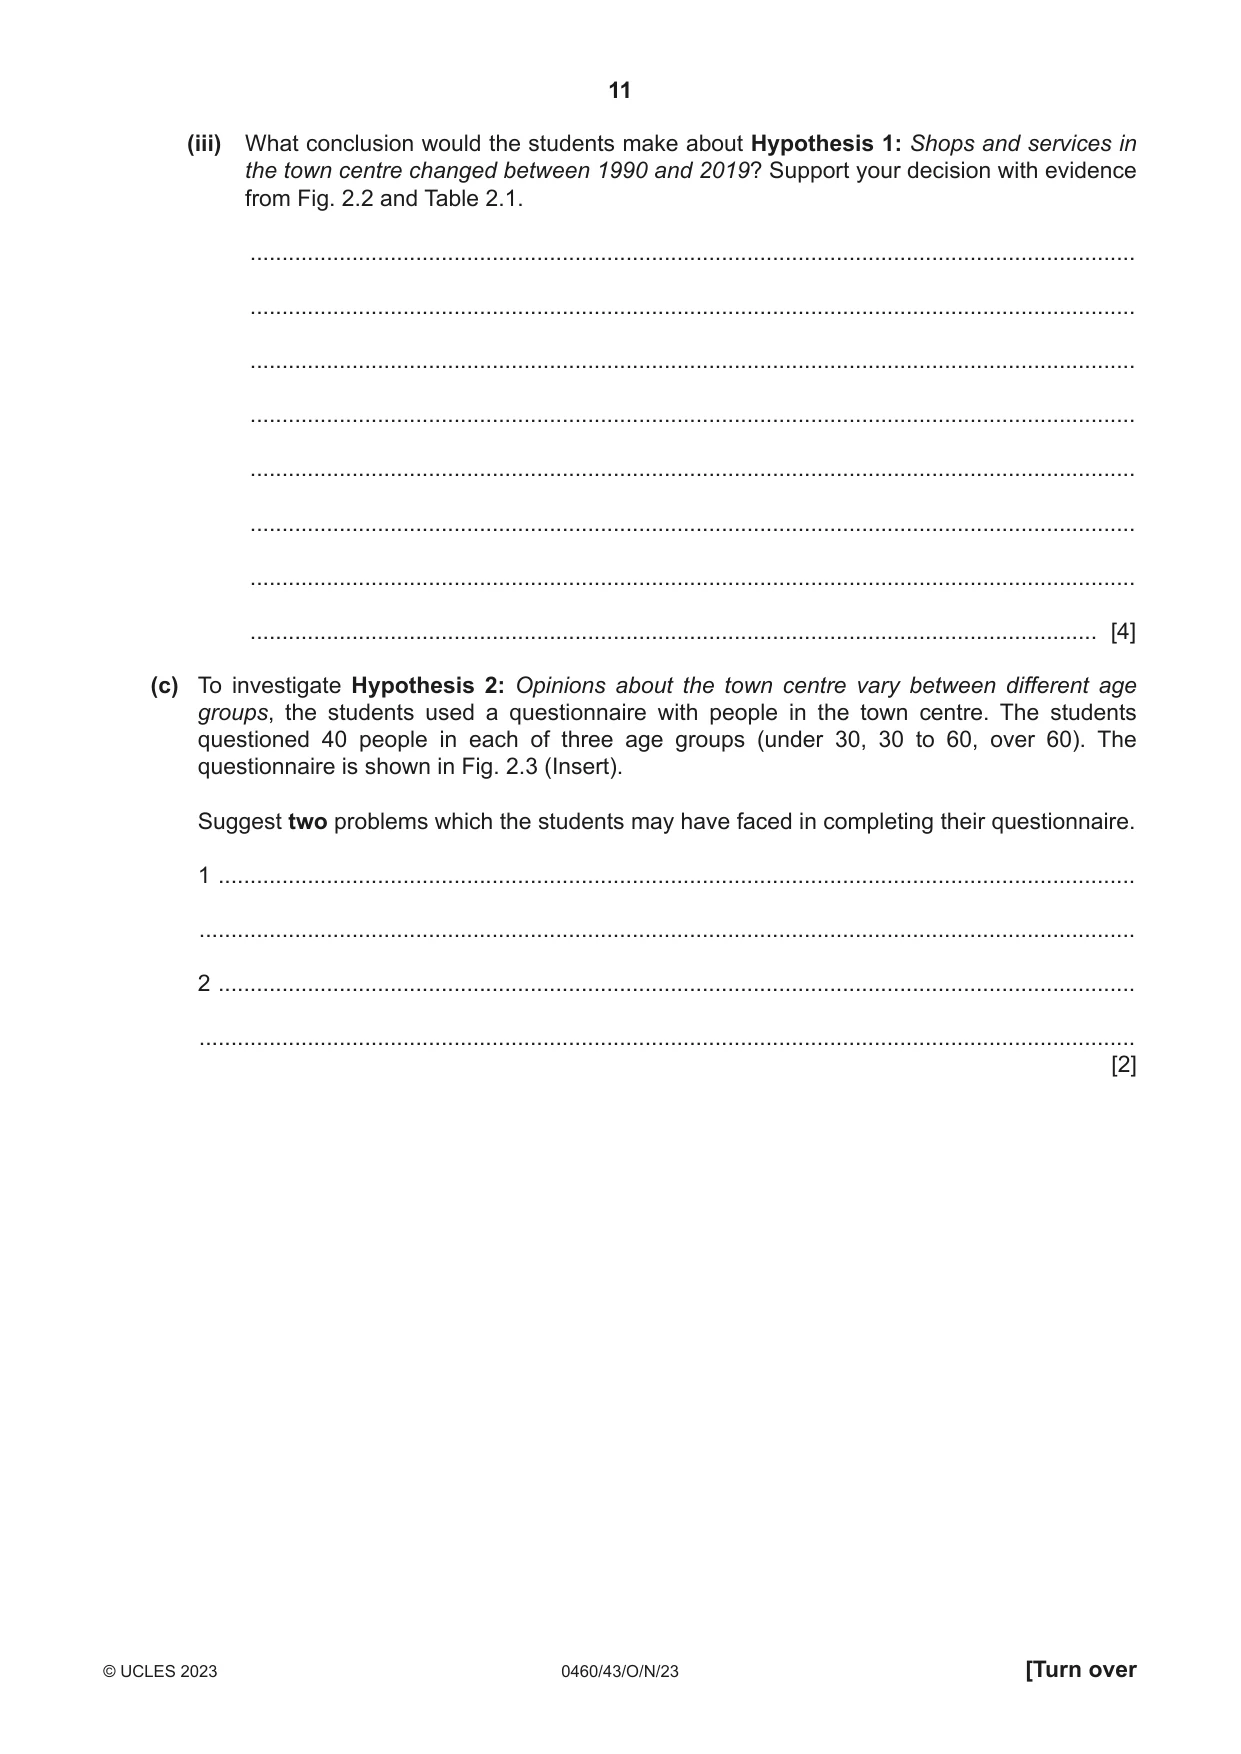
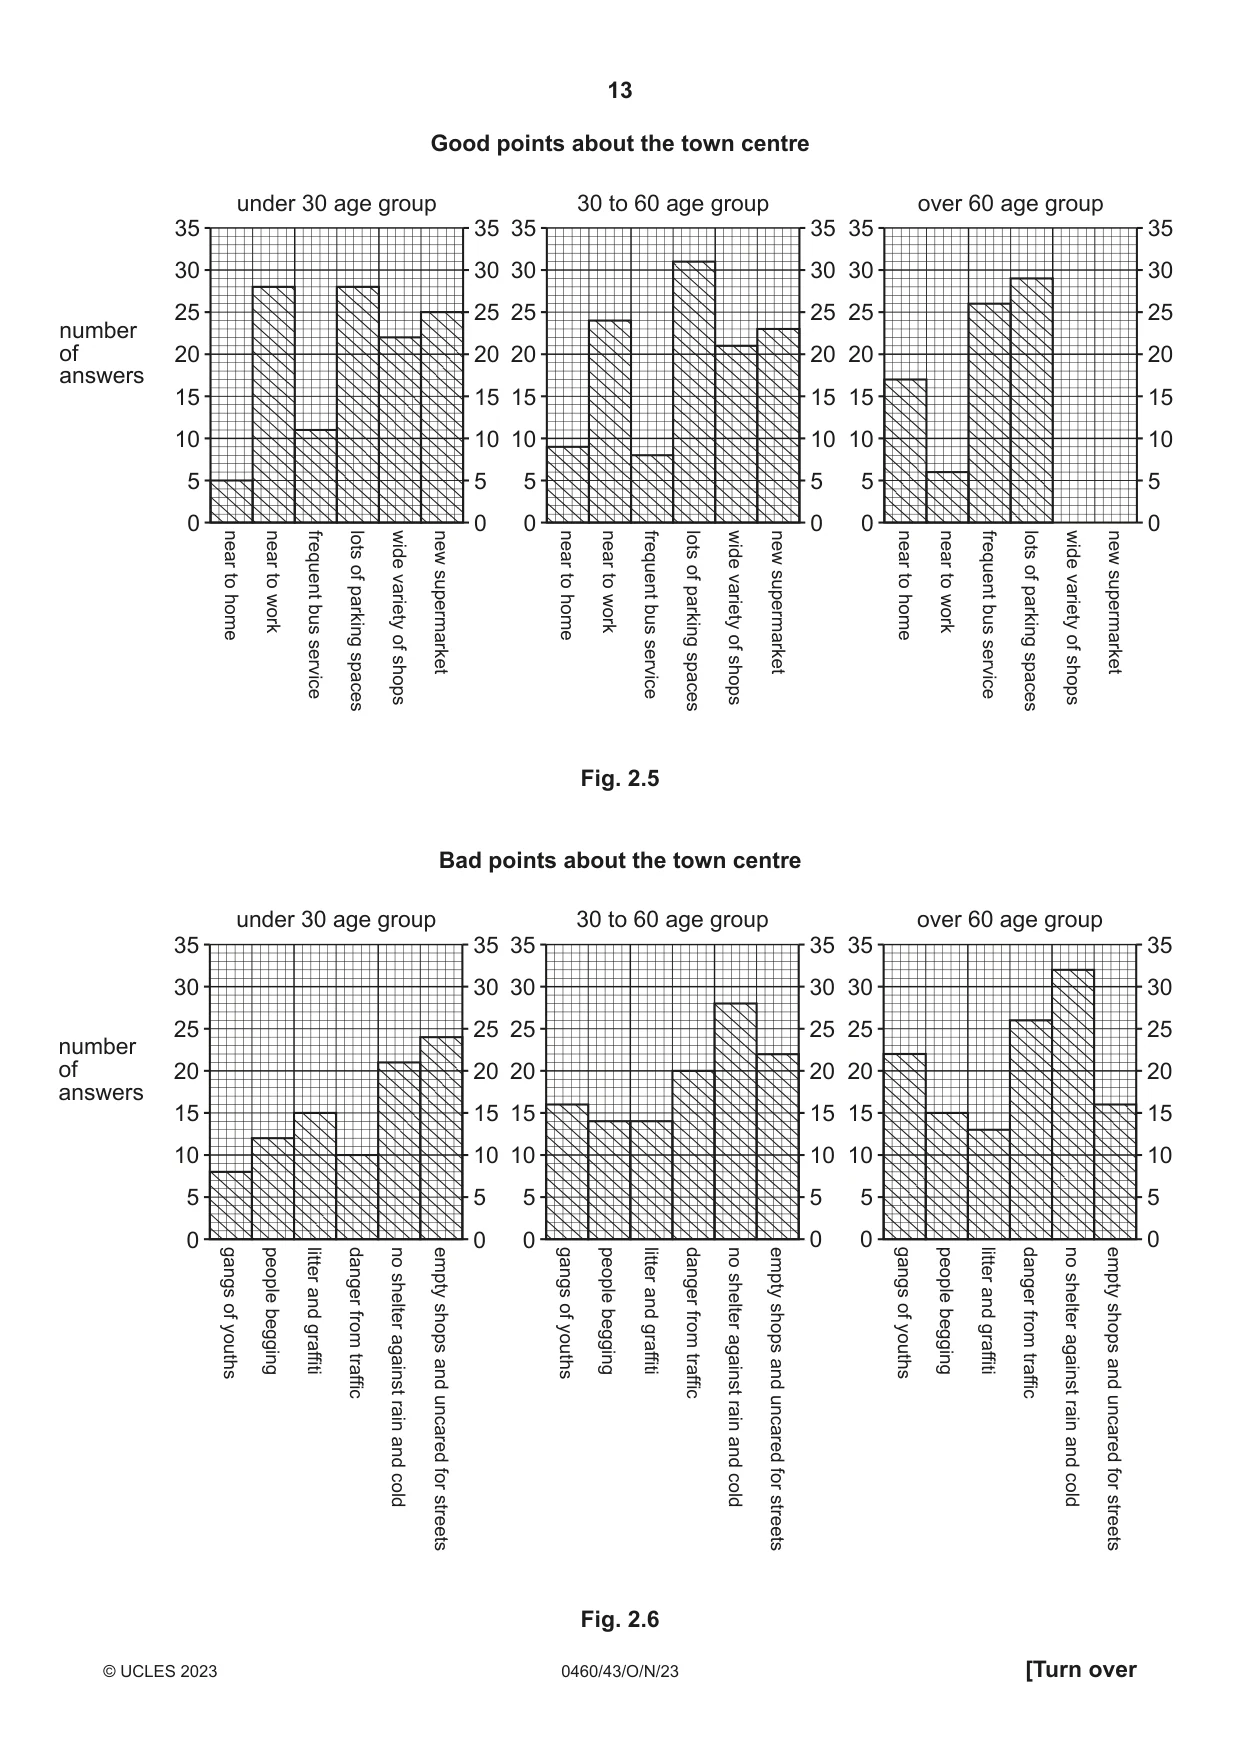
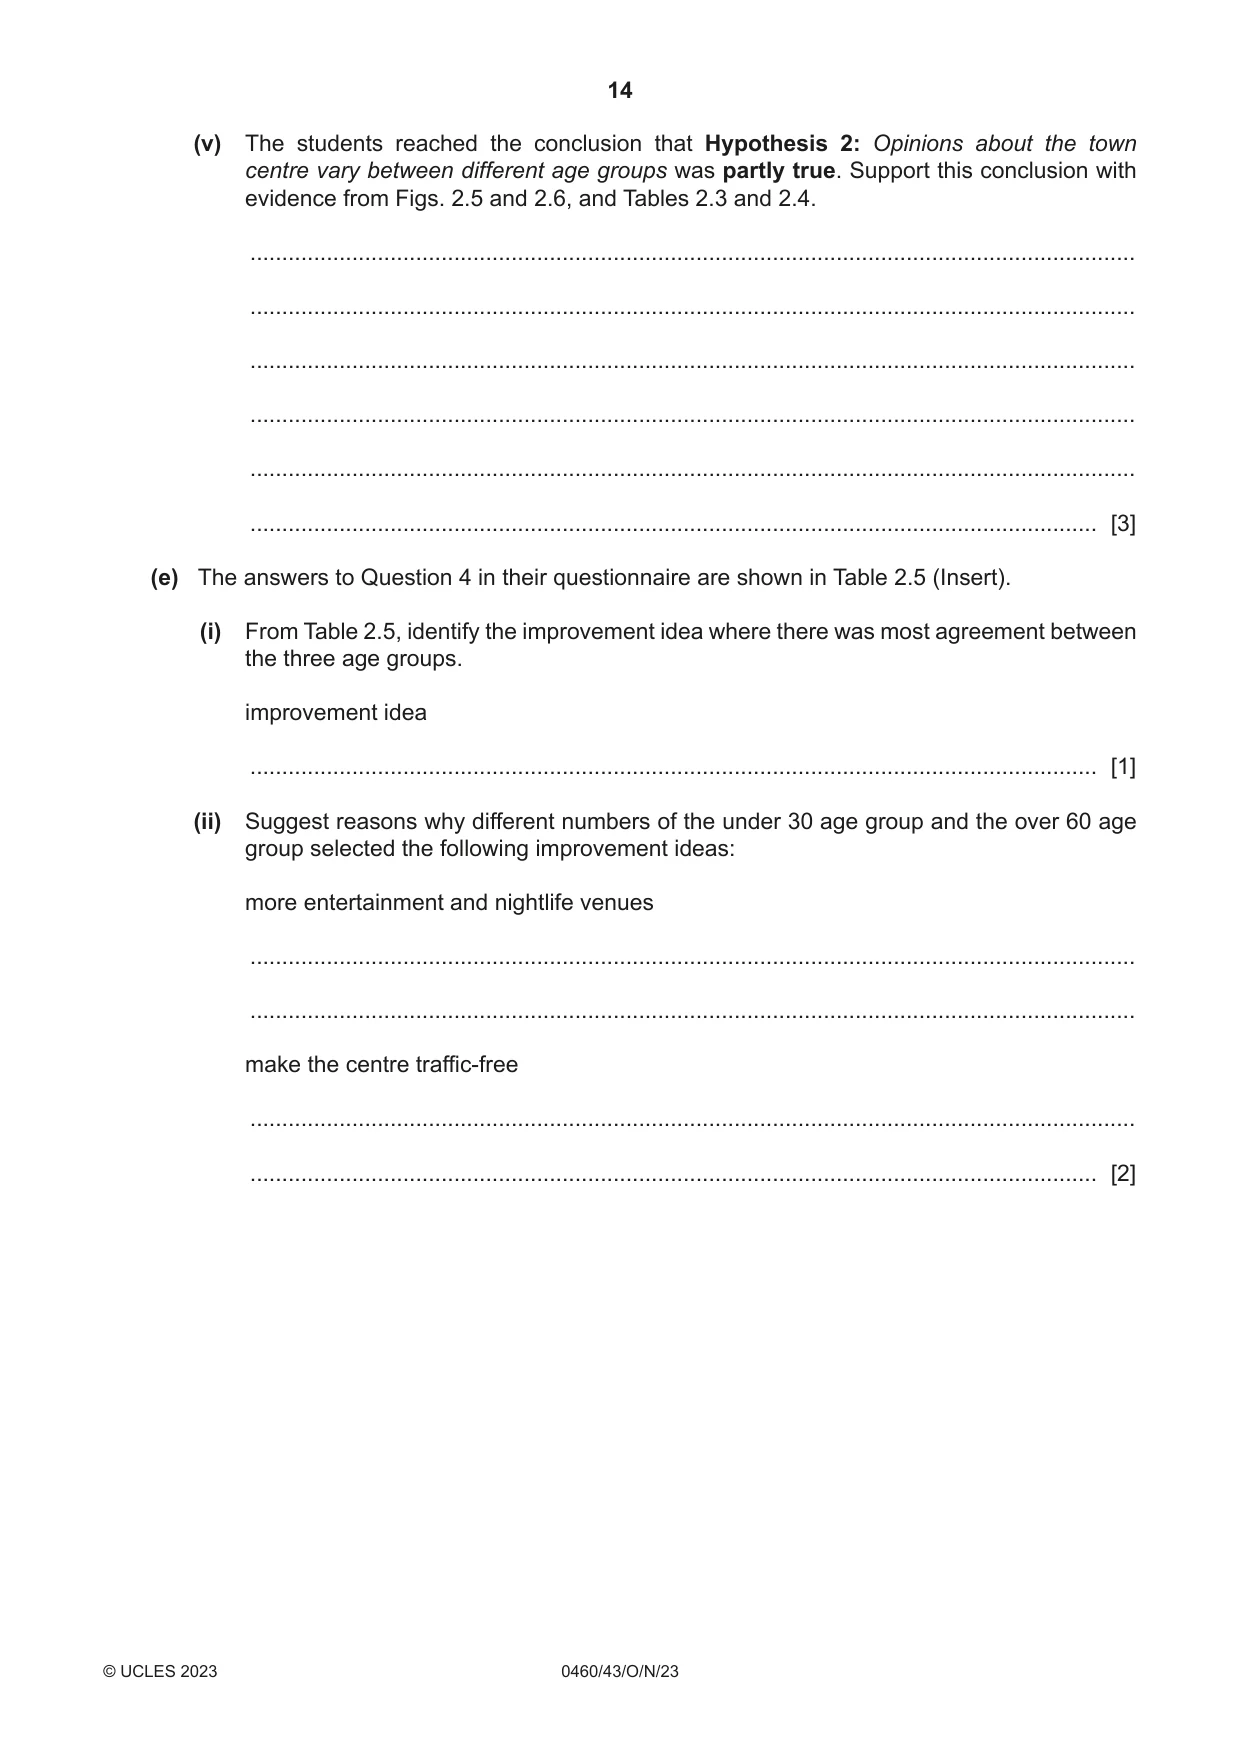
2 Students were doing fieldwork in their local town centre (CBD). They wanted to find out how it had changed and what people who came to the town centre thought about it. They tested the following hypotheses: Hypothesis 1: Shops and services in the town centre changed between 1990 and 2019. Hypothesis 2: Opinions about the town centre vary between different age groups. (a) First the students completed a map of the land use on the main streets in the town centre. Their map is shown in Fig. 2.1. (i) Use the map key to identify the shop or service which occupies the building labelled X on Fig. 2.1. .............................................................. [1] (ii) Building Y on Fig. 2.1 is a flower shop (florist). Use the map key to label this building on Fig. 2.1. [1] (iii) Identify the building located 125 m south-west of the church. ..................................................................................................................................... [1] (iv) Describe the distribution of offices shown on Fig. 2.1. ........................................................................................................................................... ........................................................................................................................................... ........................................................................................................................................... ..................................................................................................................................... [2] Land use map of town centre in 2019 O N building O O Y O P O C O P C P Sp CE C V church V V V V P P C CE Ch P CE C C V V Ch CE Ch P C P Ch C Ch CE P CE C C CE C CE C St CE V P V CE Ch Church Ch O Bl P ac V k N b e ur w Sp Sp O n R St d O Dale St CE P CE Ch bus P station C library river C CE Ch P Sp CE Sp V P Sp CE C P P C CE New Rd CE building X 0 250 m Key household goods store supermarket mainly selling food convenience goods (e.g. baker, newsagent) C specialist non-food (e.g. electrical, jewellery, florist, travel agent) Sp personal services (e.g. hairdresser, barber, nail bar, tattooist) P charity shop Ch catering and entertainment (e.g. café, restaurant, bar, nightclub) CE office (e.g. finance, solicitor, estate agent, bank) O vacant (empty) shop V Fig. 2.1 (b) To investigate Hypothesis 1: Shops and services in the town centre changed between 1990 and 2019, the students compared the number of different shops and services in 1990 and 2019. Their results are shown in Table 2.1 (Insert). (i) The students obtained the data for 1990 from an old map of the town centre. Which one of the following is the correct description of the data for 1990? Tick (3) your choice. [1] tick (3) data collected by the students for their own use data collected by other people and used by the students data collected by the students and used by other people (ii) The students used the results in Table 2.1 to draw Fig. 2.2. Plot the number of vacant (empty) shops in 1990 and 2019. [2] Number of shops and services in the town centre 20 20 number of number of shops / 15 15 shops / services services 10 10 5 5 0 0 clothes & household supermarket convenience specialist personal charityshop catering& office vacantshop shoes goods services non-food goods entertainment Key number in 1990 number in 2019 Fig. 2.2
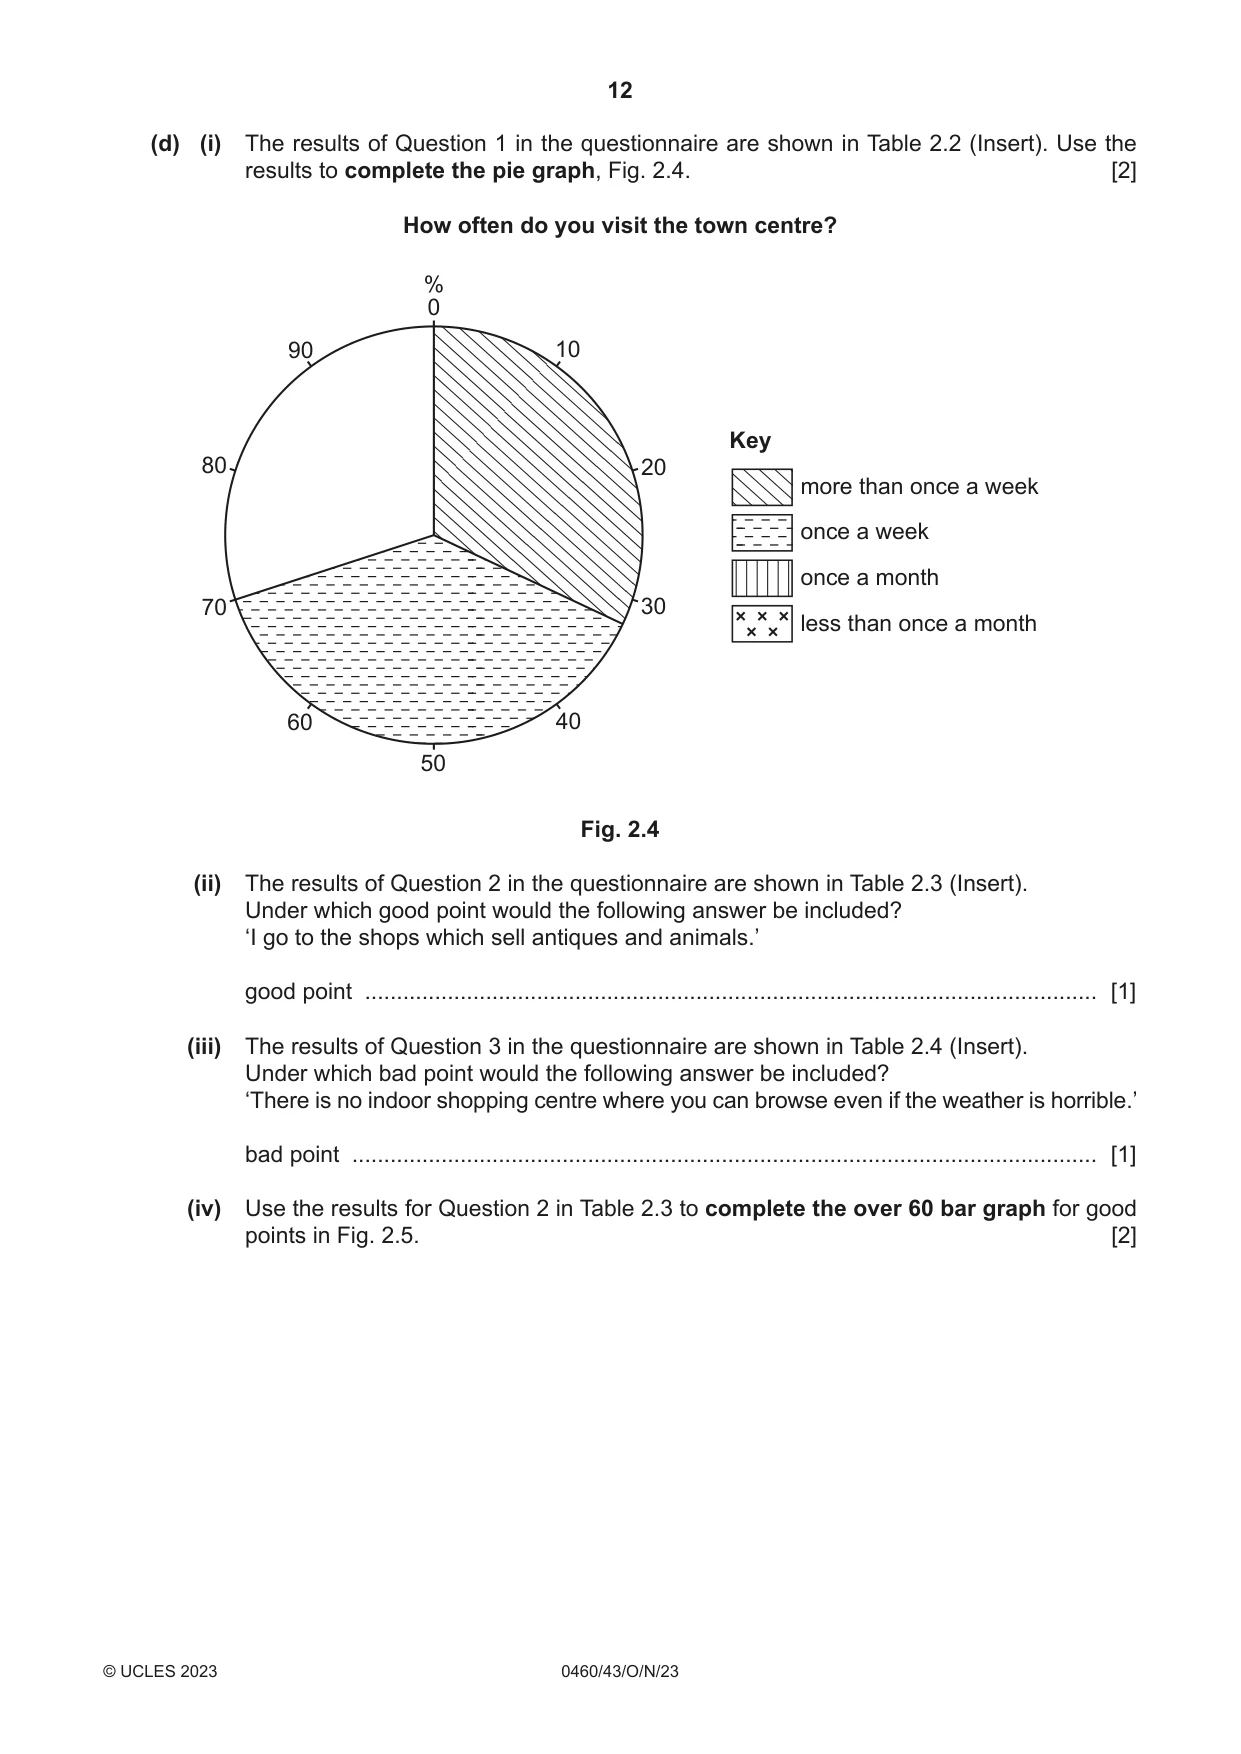
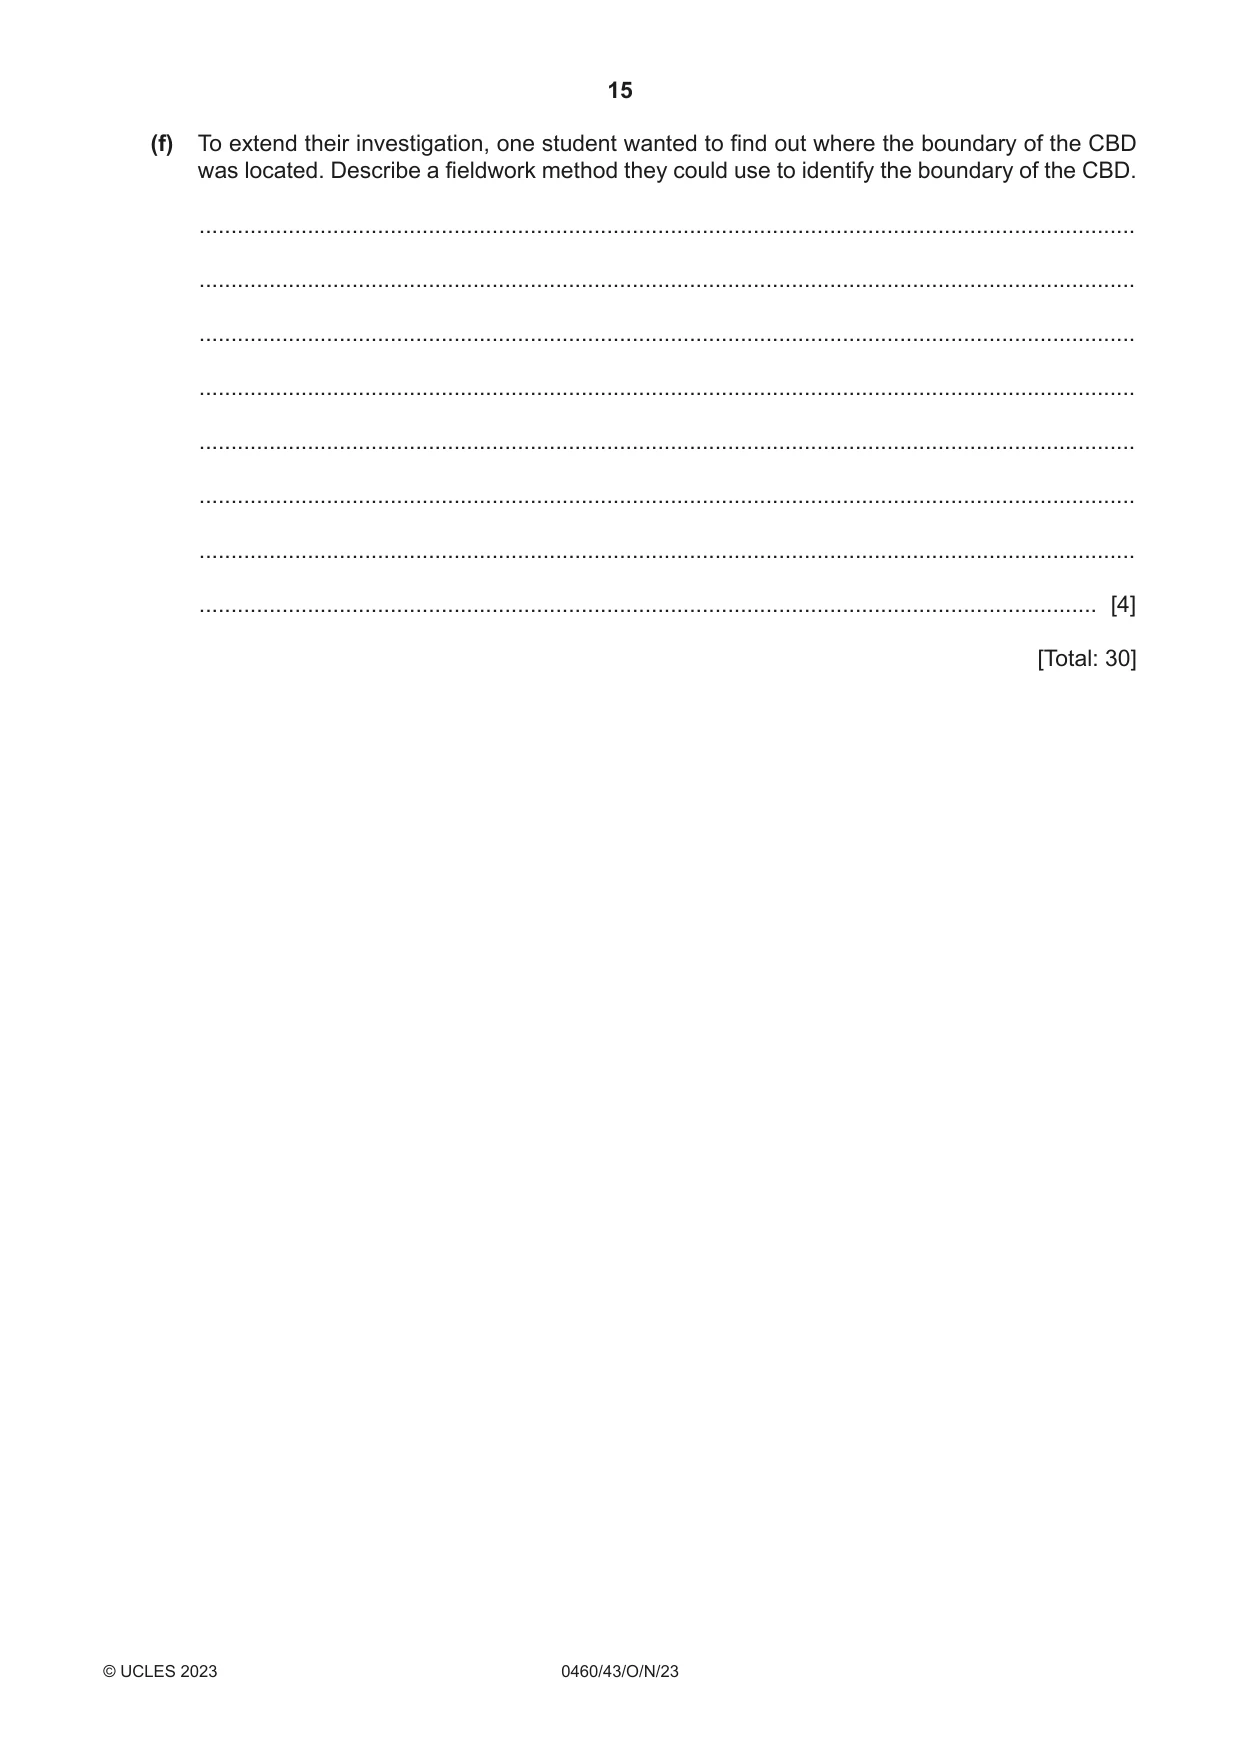
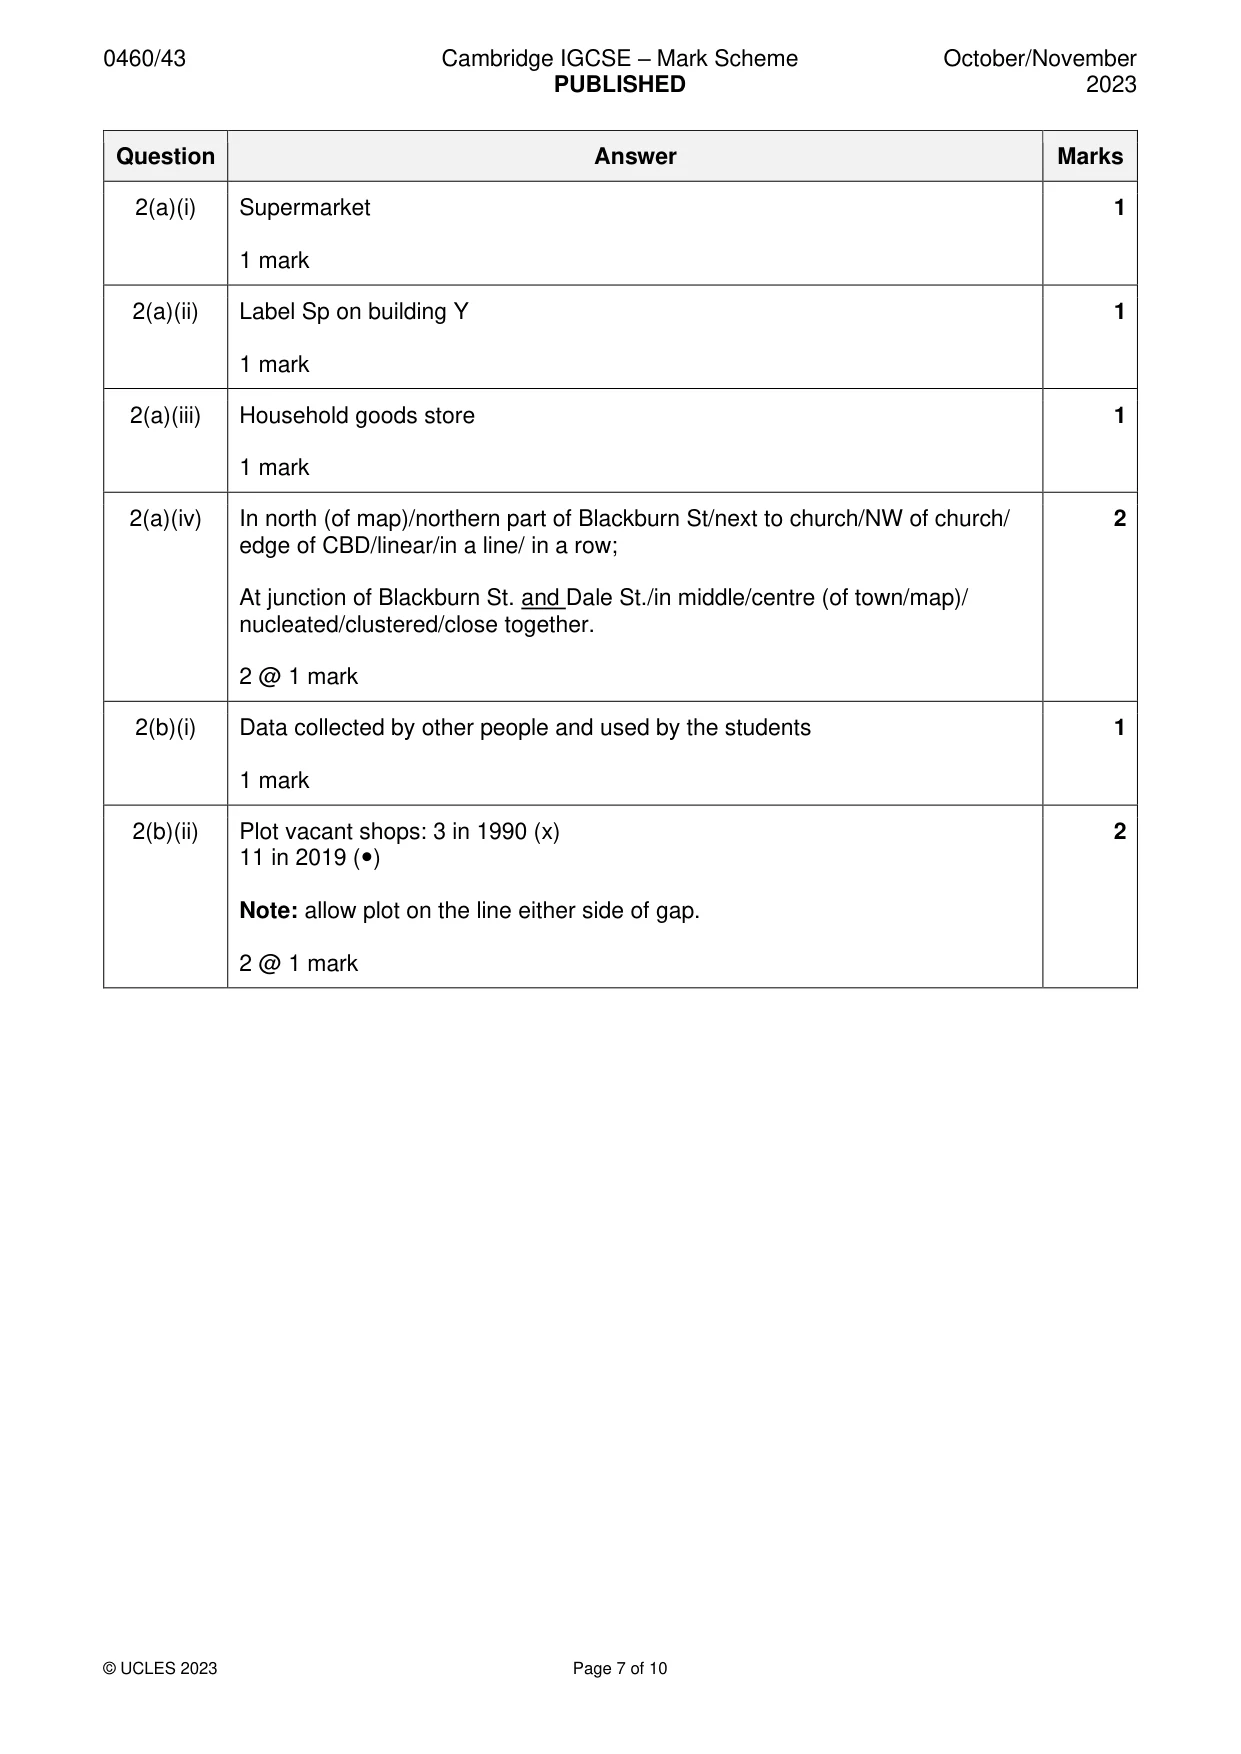
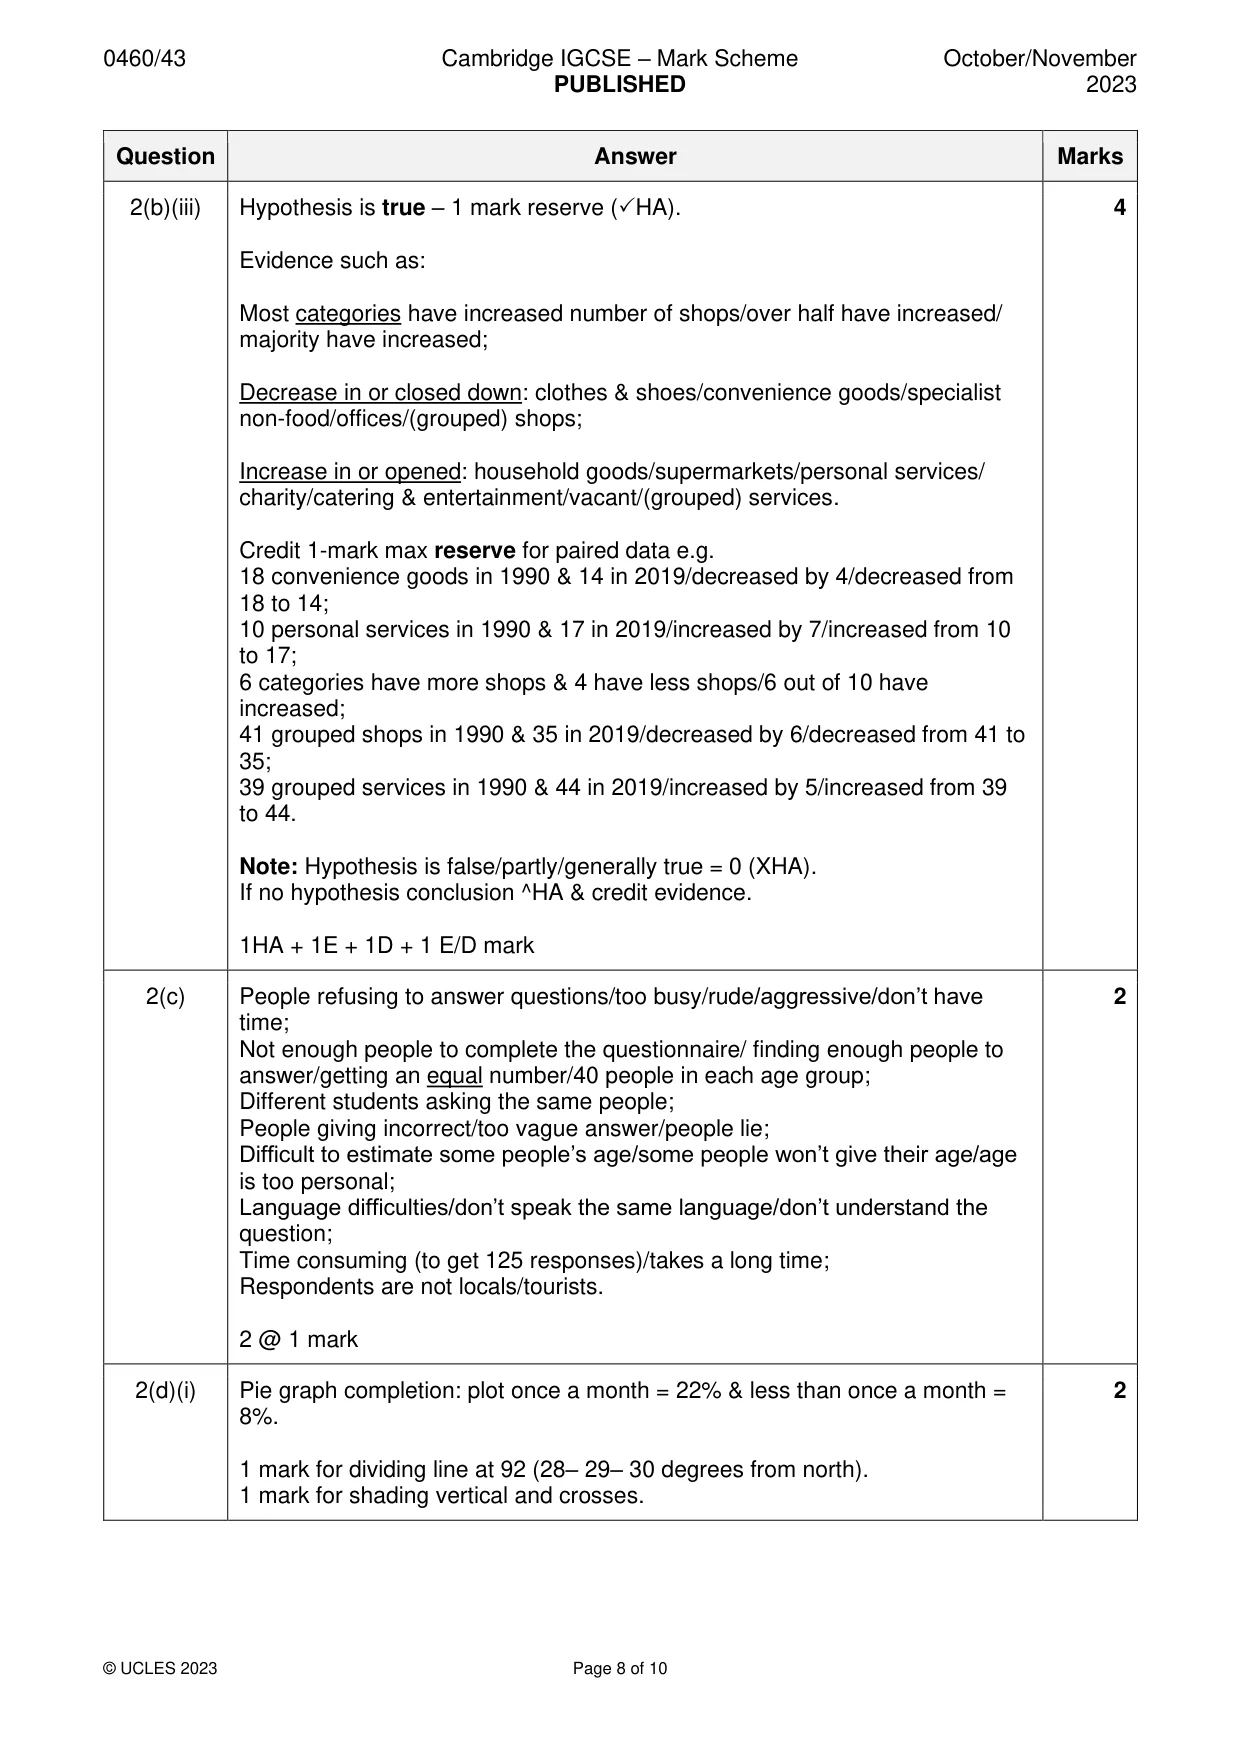
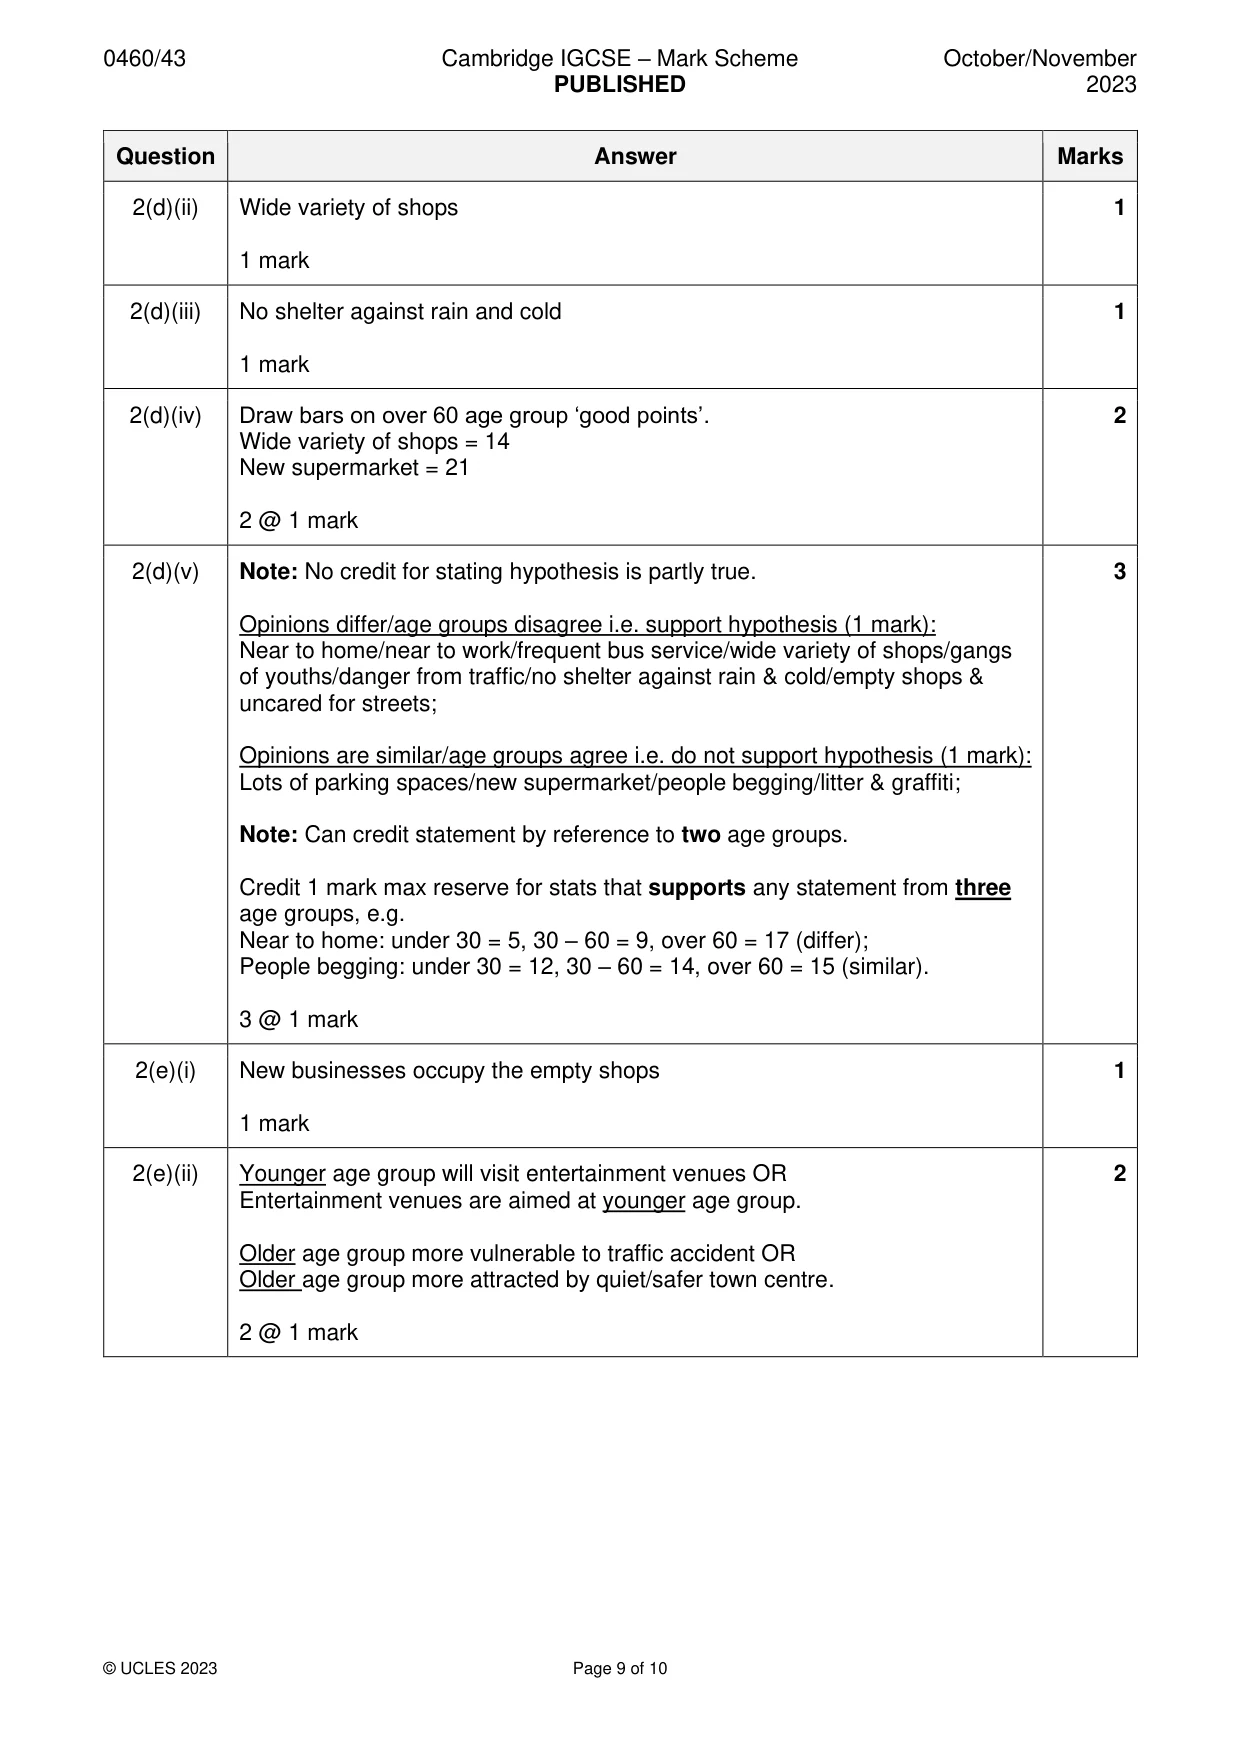
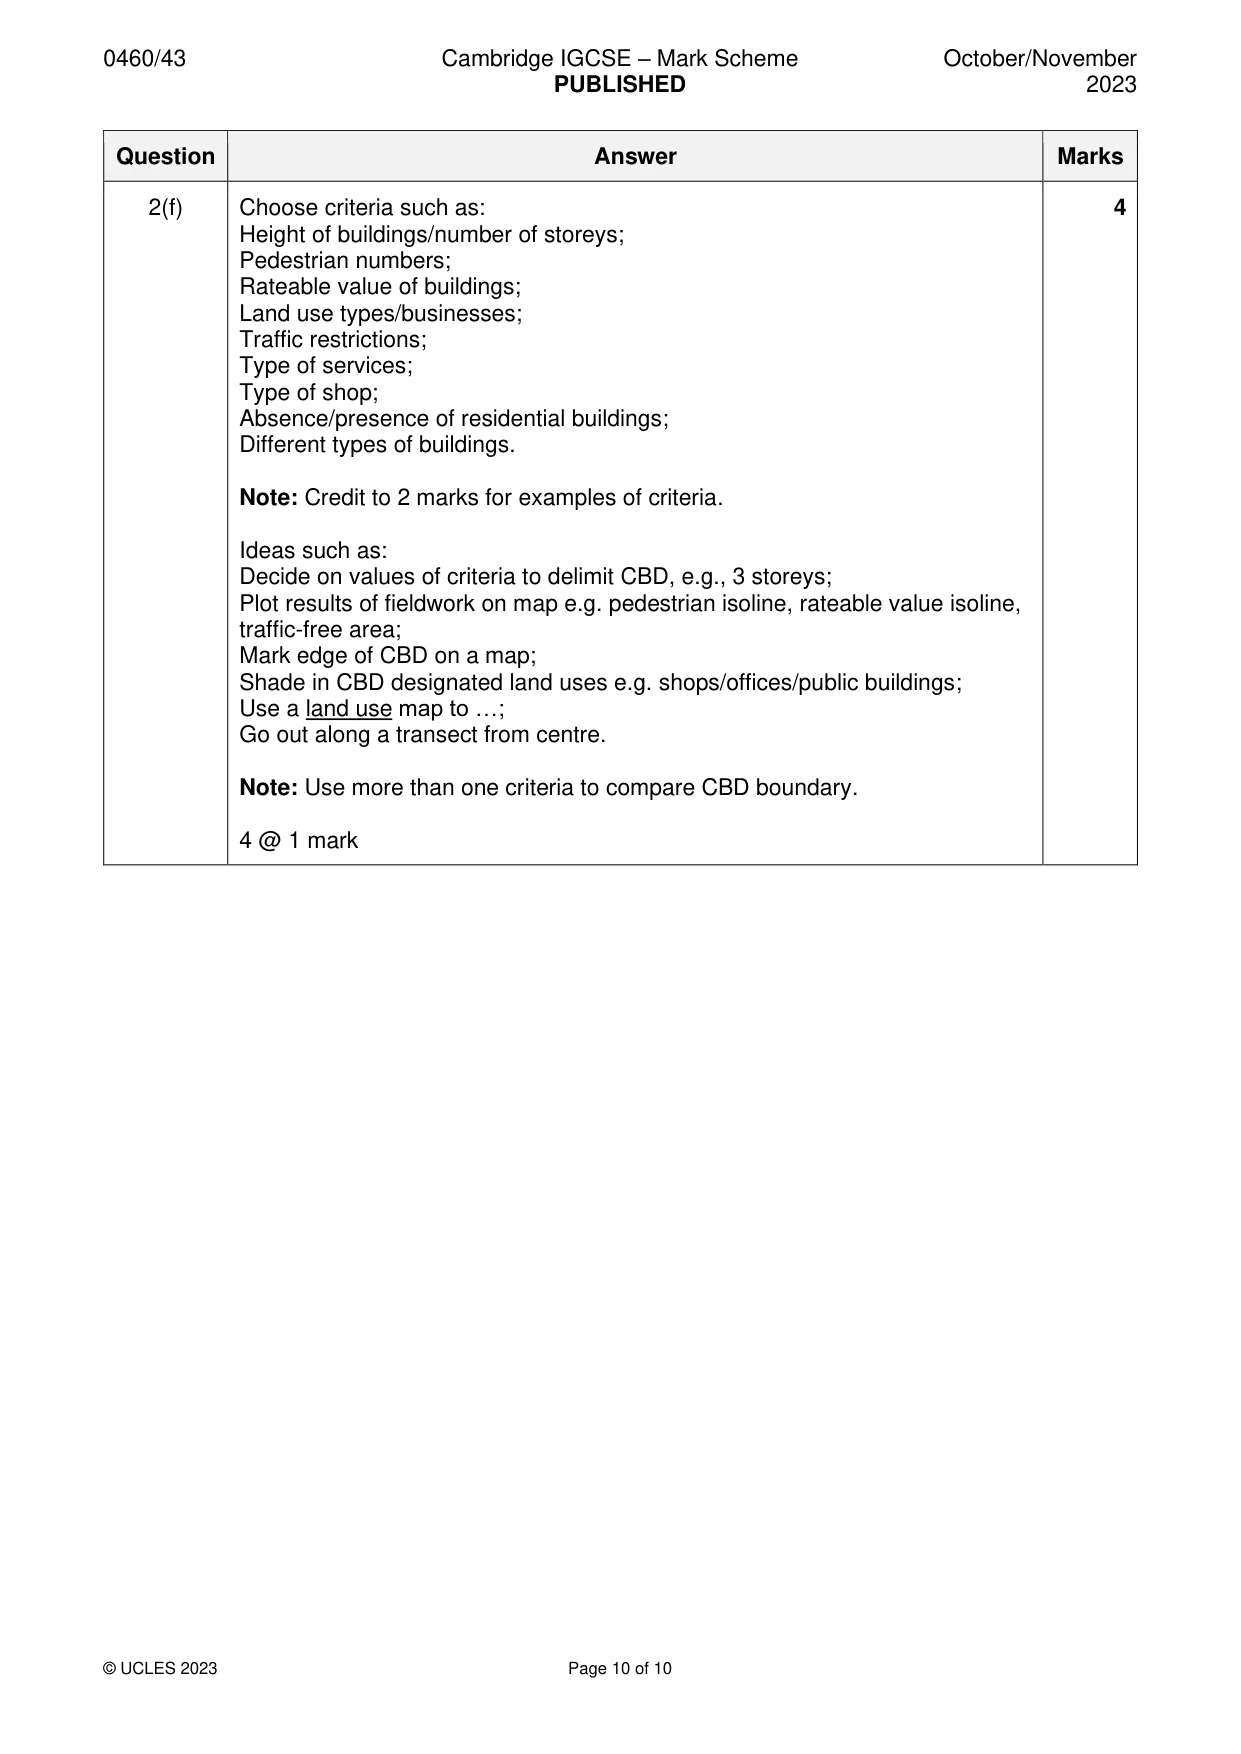
Mark scheme: 2(a)(i) Supermarket 1 1 mark 2(a)(ii) Label Sp on building Y 1 1 mark 2(a)(iii) Household goods store 1 1 mark 2(a)(iv) In north (of map)/northern part of Blackburn St/next to church/NW of church/ 2 edge of CBD/linear/in a line/ in a row; At junction of Blackburn St. and Dale St./in middle/centre (of town/map)/ nucleated/clustered/close together. 2 @ 1 mark 2(b)(i) Data collected by other people and used by the students 1 1 mark 2(b)(ii) Plot vacant shops: 3 in 1990 (x) 2 11 in 2019 () Note: allow plot on the line either side of gap. 2 @ 1 mark 2(b)(iii) Hypothesis is true – 1 mark reserve (HA). 4 Evidence such as: Most categories have increased number of shops/over half have increased/ majority have increased; Decrease in or closed down: clothes & shoes/convenience goods/specialist non-food/offices/(grouped) shops; Increase in or opened: household goods/supermarkets/personal services/ charity/catering & entertainment/vacant/(grouped) services. Credit 1-mark max reserve for paired data e.g. 18 convenience goods in 1990 & 14 in 2019/decreased by 4/decreased from 18 to 14; 10 personal services in 1990 & 17 in 2019/increased by 7/increased from 10 to 17; 6 categories have more shops & 4 have less shops/6 out of 10 have increased; 41 grouped shops in 1990 & 35 in 2019/decreased by 6/decreased from 41 to 35; 39 grouped services in 1990 & 44 in 2019/increased by 5/increased from 39 to 44. Note: Hypothesis is false/partly/generally true = 0 (XHA). If no hypothesis conclusion ^HA & credit evidence. 1HA + 1E + 1D + 1 E/D mark 2(c) People refusing to answer questions/too busy/rude/aggressive/don’t have 2 time; Not enough people to complete the questionnaire/ finding enough people to answer/getting an equal number/40 people in each age group; Different students asking the same people; People giving incorrect/too vague answer/people lie; Difficult to estimate some people’s age/some people won’t give their age/age is too personal; Language difficulties/don’t speak the same language/don’t understand the question; Time consuming (to get 125 responses)/takes a long time; Respondents are not locals/tourists. 2 @ 1 mark 2(d)(i) Pie graph completion: plot once a month = 22% & less than once a month = 2 8%. 1 mark for dividing line at 92 (28– 29– 30 degrees from north). 1 mark for shading vertical and crosses. 2(d)(ii) Wide variety of shops 1 1 mark 2(d)(iii) No shelter against rain and cold 1 1 mark 2(d)(iv) Draw bars on over 60 age group ‘good points’. 2 Wide variety of shops = 14 New supermarket = 21 2 @ 1 mark 2(d)(v) Note: No credit for stating hypothesis is partly true. 3 Opinions differ/age groups disagree i.e. support hypothesis (1 mark): Near to home/near to work/frequent bus service/wide variety of shops/gangs of youths/danger from traffic/no shelter against rain & cold/empty shops & uncared for streets; Opinions are similar/age groups agree i.e. do not support hypothesis (1 mark): Lots of parking spaces/new supermarket/people begging/litter & graffiti; Note: Can credit statement by reference to two age groups. Credit 1 mark max reserve for stats that supports any statement from three age groups, e.g. Near to home: under 30 = 5, 30 – 60 = 9, over 60 = 17 (differ); People begging: under 30 = 12, 30 – 60 = 14, over 60 = 15 (similar). 3 @ 1 mark 2(e)(i) New businesses occupy the empty shops 1 1 mark 2(e)(ii) Younger age group will visit entertainment venues OR 2 Entertainment venues are aimed at younger age group. Older age group more vulnerable to traffic accident OR Older age group more attracted by quiet/safer town centre. 2 @ 1 mark 2(f) Choose criteria such as: 4 Height of buildings/number of storeys; Pedestrian numbers; Rateable value of buildings; Land use types/businesses; Traffic restrictions; Type of services; Type of shop; Absence/presence of residential buildings; Different types of buildings. Note: Credit to 2 marks for examples of criteria. Ideas such as: Decide on values of criteria to delimit CBD, e.g., 3 storeys; Plot results of fieldwork on map e.g. pedestrian isoline, rateable value isoline, traffic-free area; Mark edge of CBD on a map; Shade in CBD designated land uses e.g. shops/offices/public buildings; Use a land use map to …; Go out along a transect from centre. Note: Use more than one criteria to compare CBD boundary. 4 @ 1 mark
More questions on Settlements (rural and urban) and service provision
What was in this paper
The subtopics covered by these 2 questions, and how many questions each got. Open one in a new tab to see every Cambridge question on it.
What you needed in this session
Cambridge’s own grade thresholds for 2023 Oct/Nov, Paper 4 · Variant 3. A higher threshold means an easier paper — the bar moves with how the cohort did.