Cambridge IGCSE Geography 0460 — 2023 May/June Paper 4 · Variant 1
0460/41/M/J/23 · 2 questions · 60 marks · ≈68 min
The question paper and its mark scheme, free to read here and free to download. This is Cambridge’s own paper, exactly as it was sat.
Question paper20 pages





Mark scheme10 pages
Answers below. Sit the paper first if you are practising.

Questions as text
Q1 · A teacher read a newspaper report about the impacts of a new cement factory in Kamalpur…
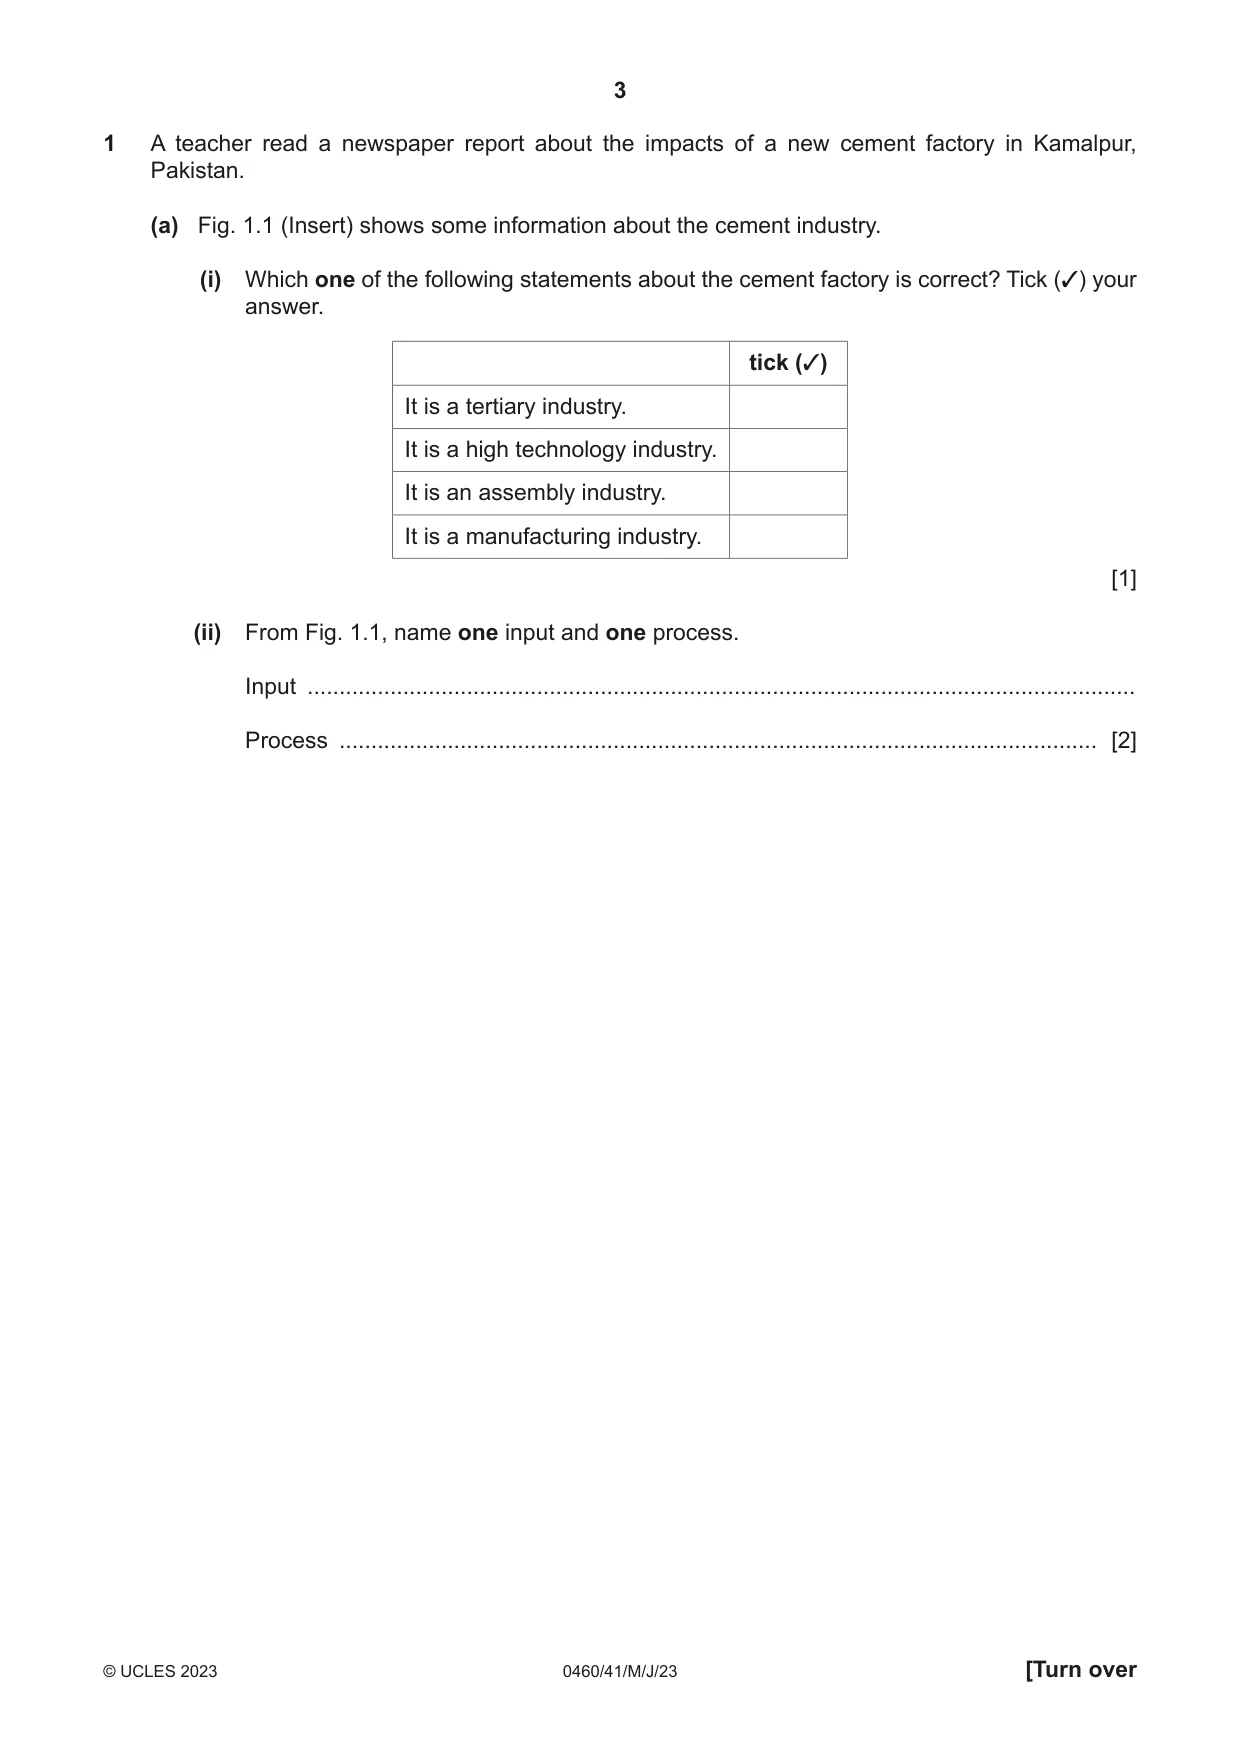
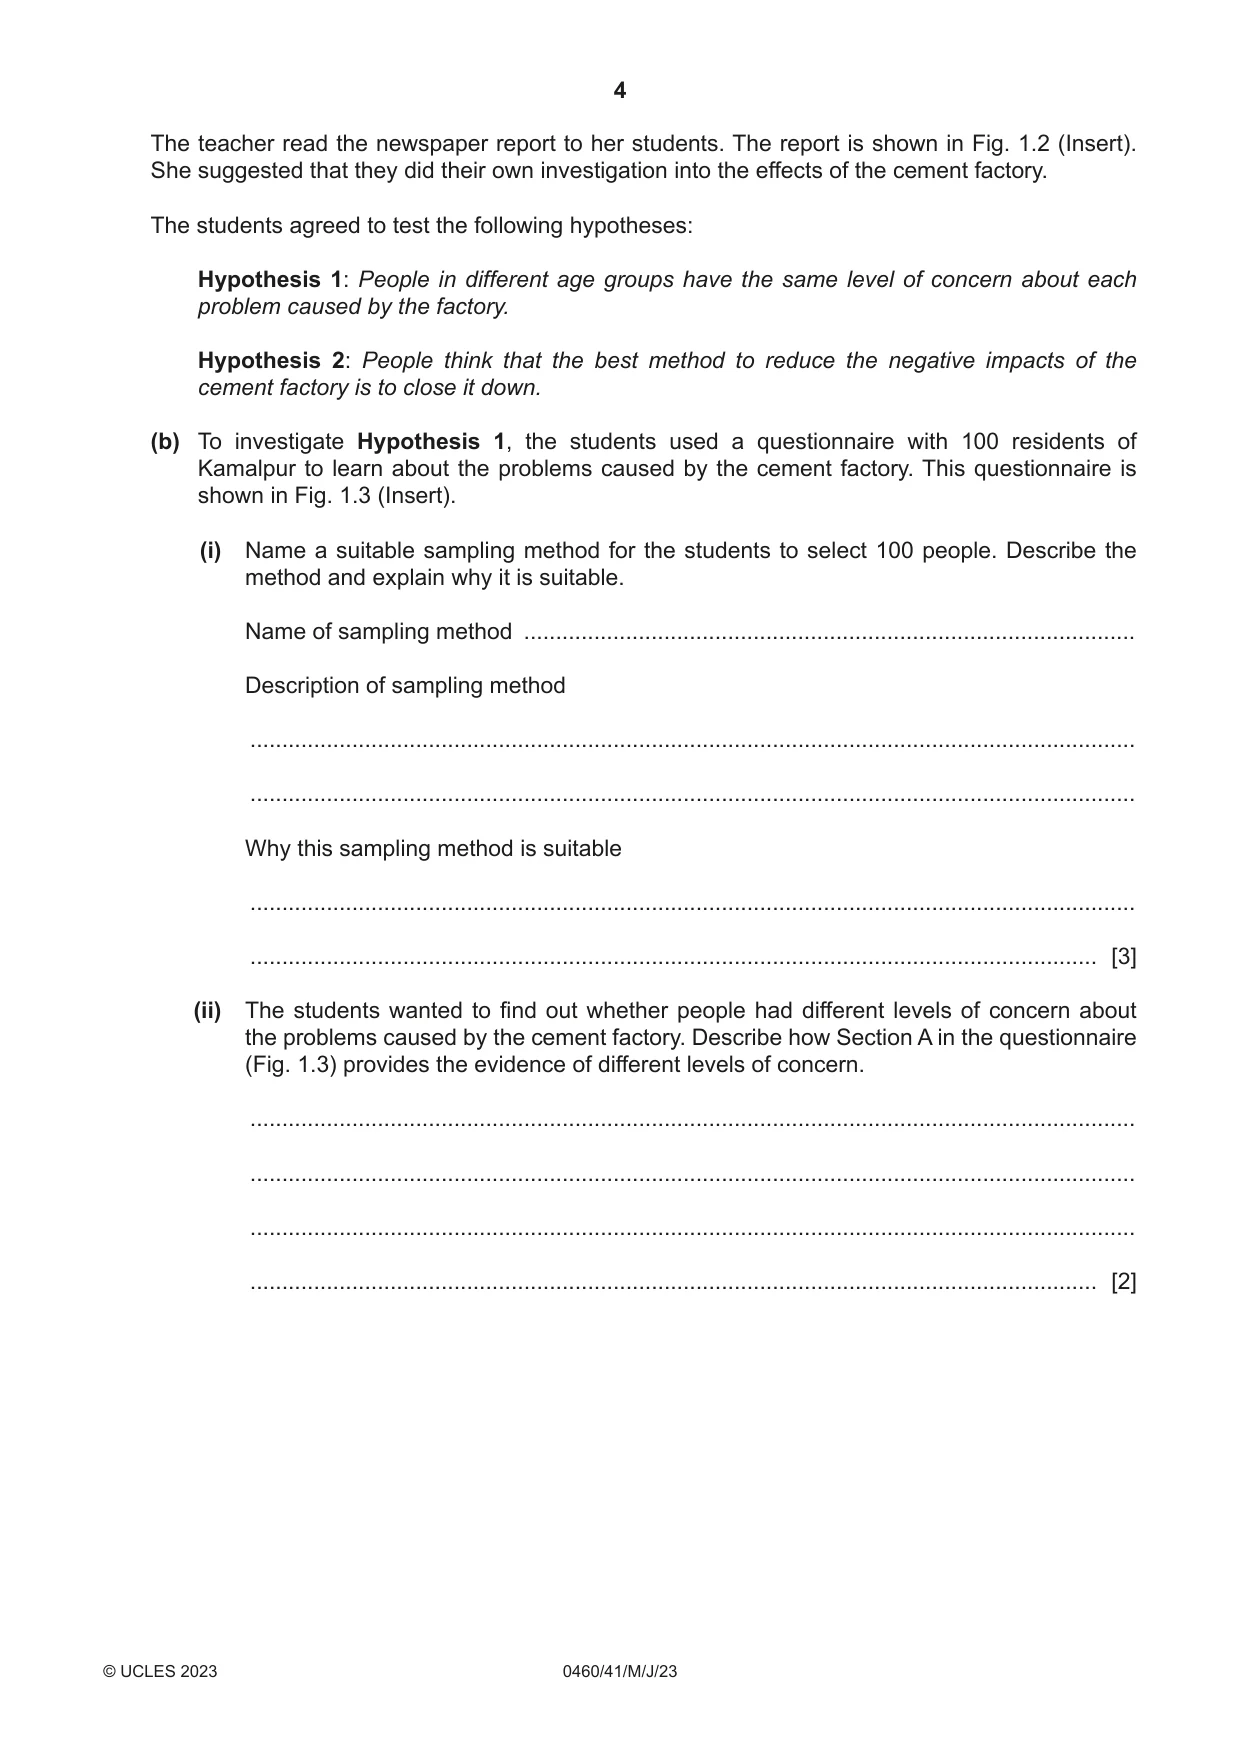
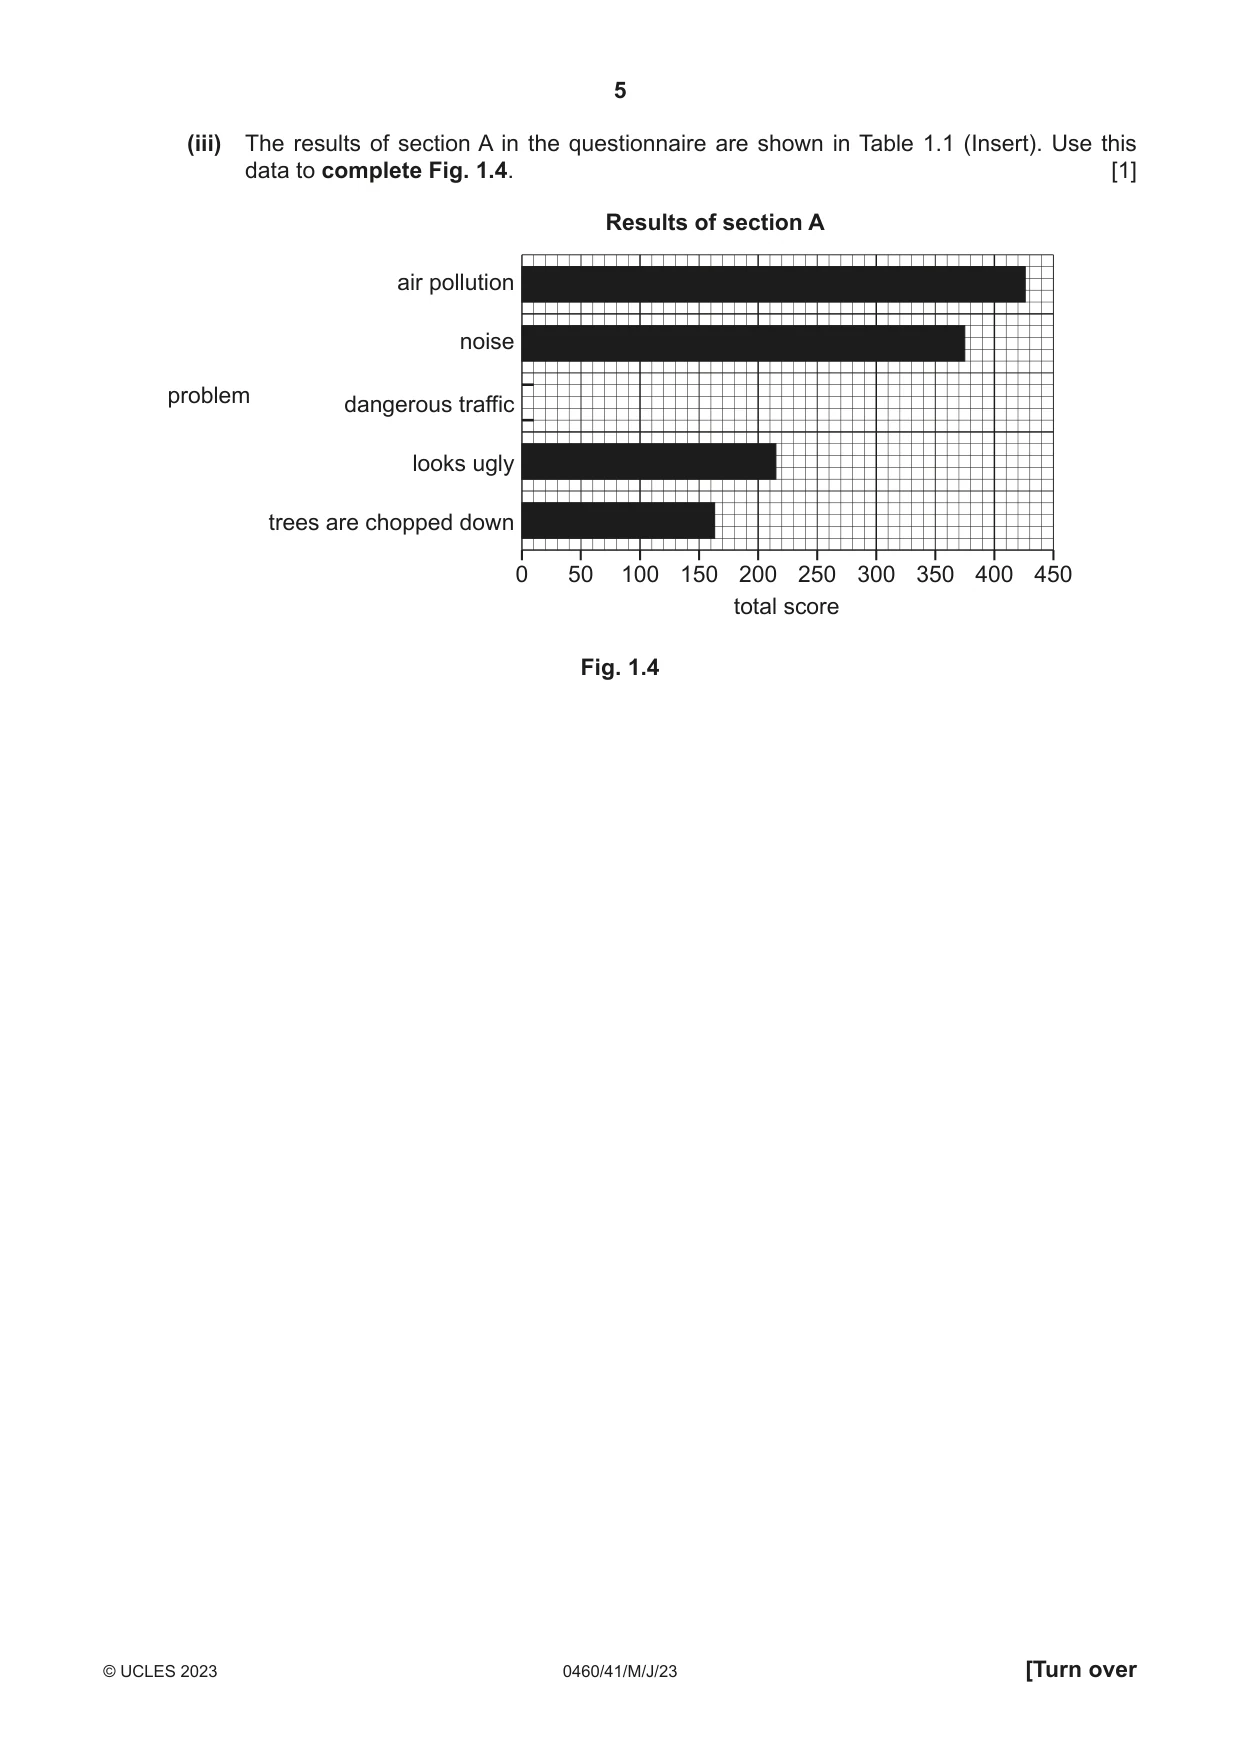
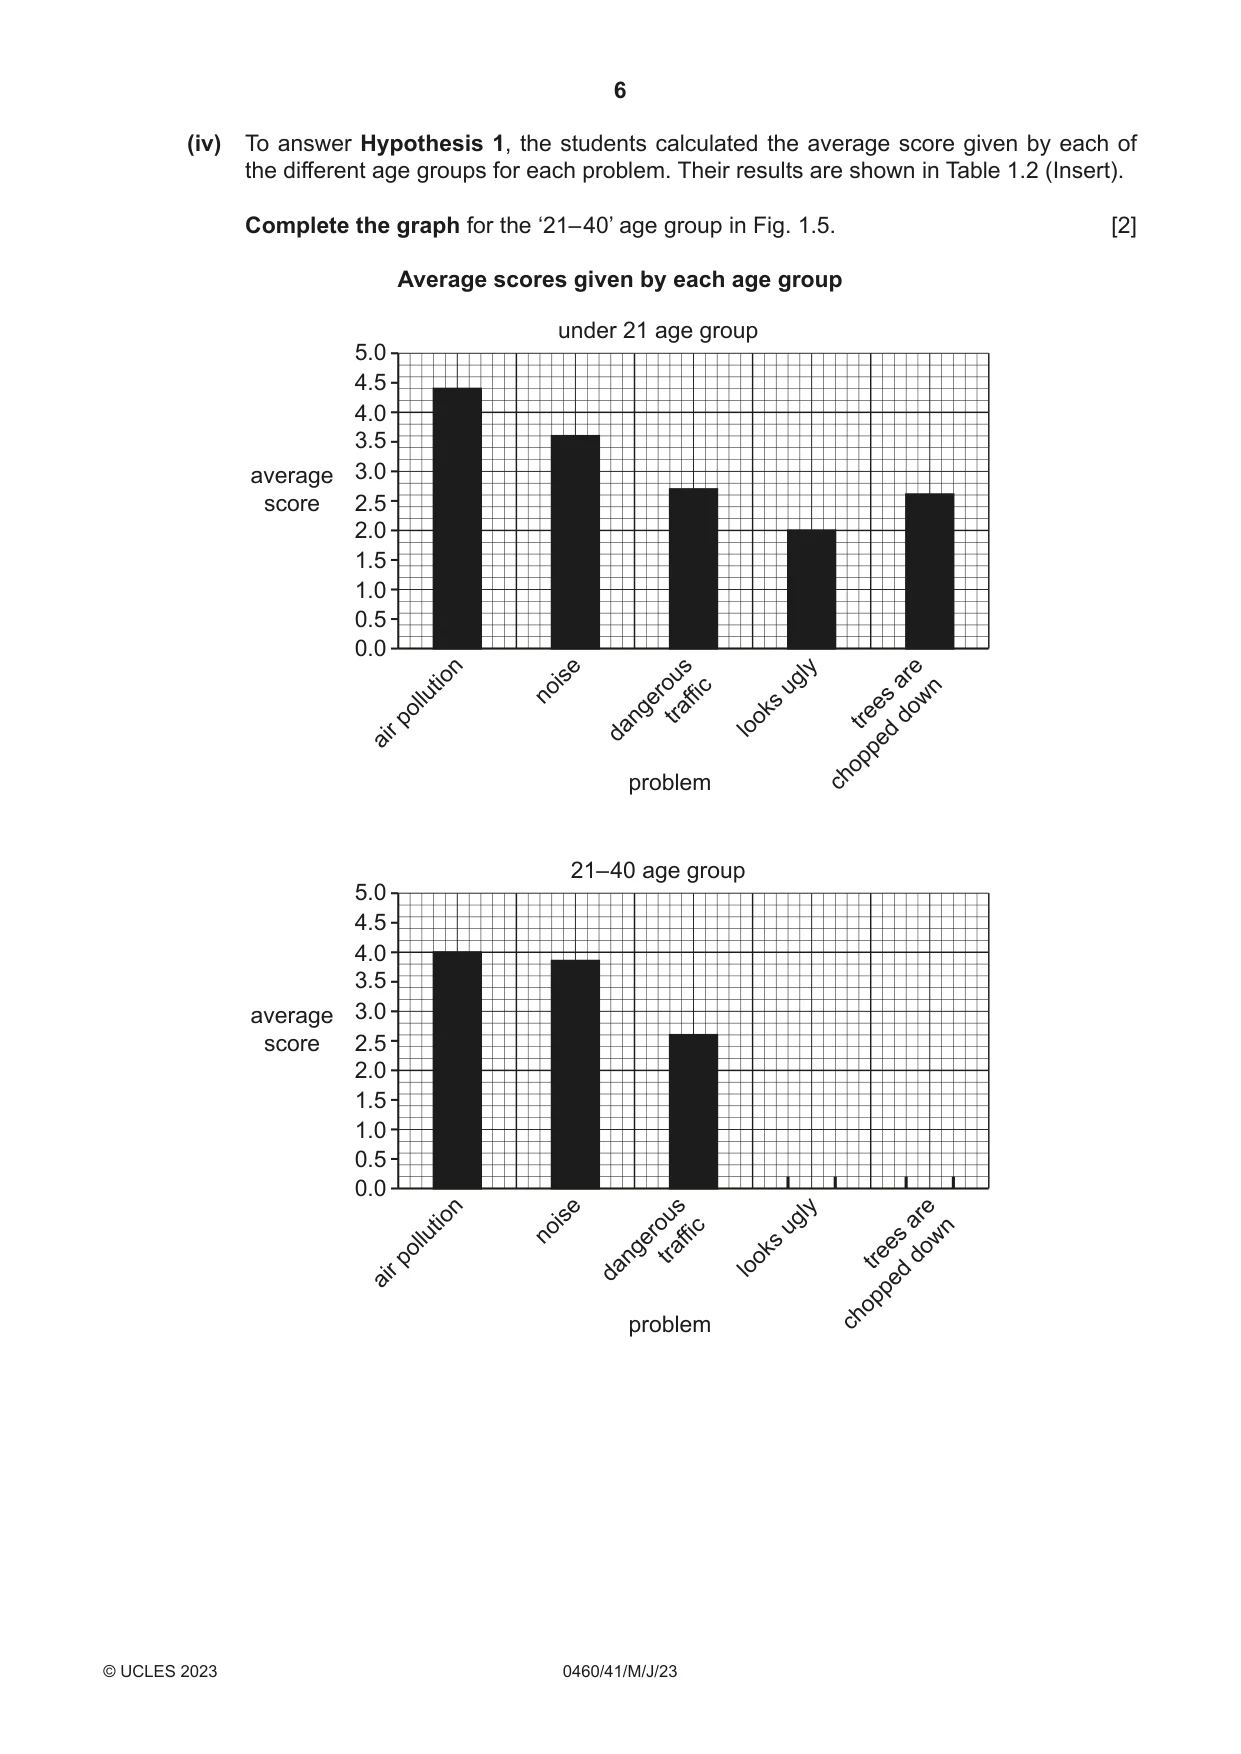
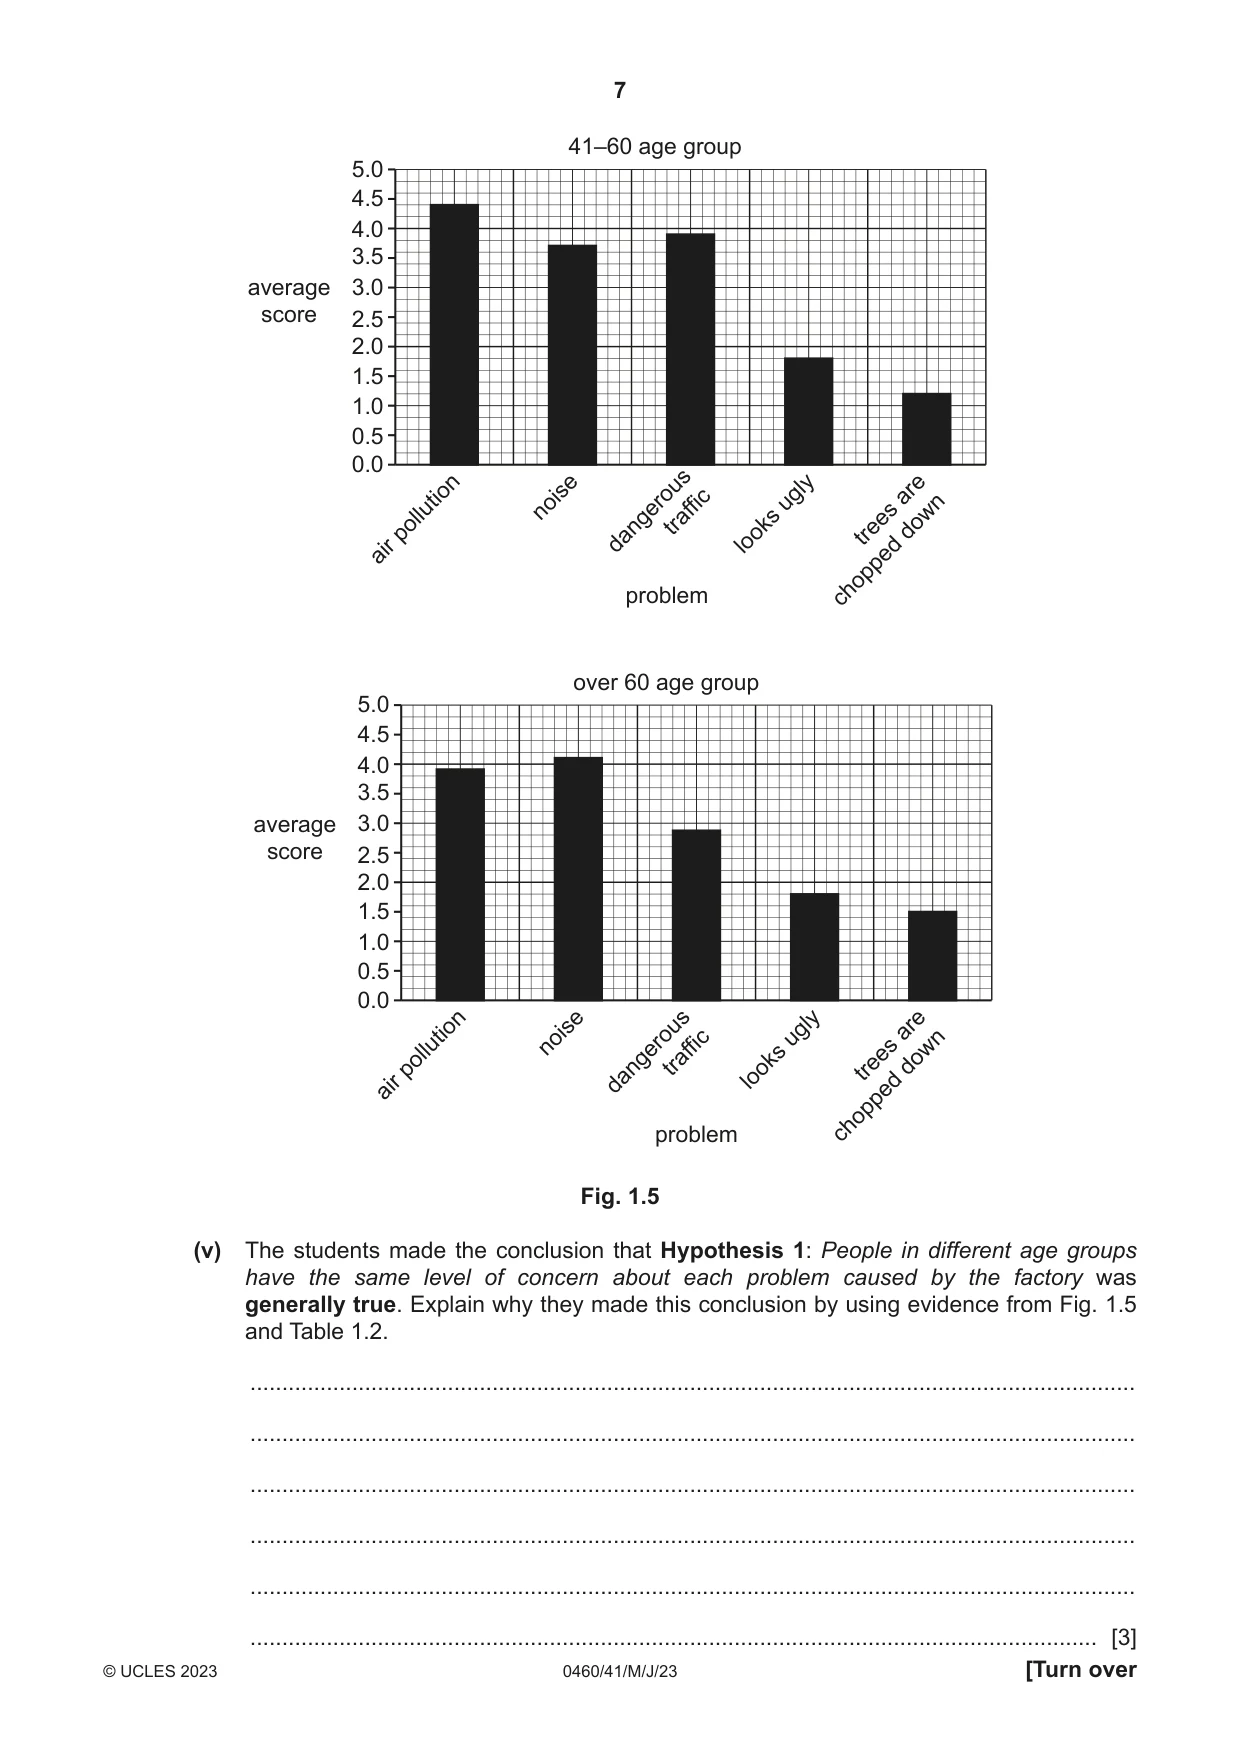
1 A teacher read a newspaper report about the impacts of a new cement factory in Kamalpur, Pakistan. (a) Fig. 1.1 (Insert) shows some information about the cement industry. (i) Which one of the following statements about the cement factory is correct? Tick (✓) your answer. tick (✓) It is a tertiary industry. It is a high technology industry. It is an assembly industry. It is a manufacturing industry. [1] (ii) From Fig. 1.1, name one input and one process. Input .................................................................................................................................. Process ....................................................................................................................... [2] The teacher read the newspaper report to her students. The report is shown in Fig. 1.2 (Insert). She suggested that they did their own investigation into the effects of the cement factory. The students agreed to test the following hypotheses: Hypothesis 1: People in different age groups have the same level of concern about each problem caused by the factory. Hypothesis 2: People think that the best method to reduce the negative impacts of the cement factory is to close it down. (b) To investigate Hypothesis 1, the students used a questionnaire with 100 residents of Kamalpur to learn about the problems caused by the cement factory. This questionnaire is shown in Fig. 1.3 (Insert). (i) Name a suitable sampling method for the students to select 100 people. Describe the method and explain why it is suitable. Name of sampling method ................................................................................................ Description of sampling method ........................................................................................................................................... ........................................................................................................................................... Why this sampling method is suitable ........................................................................................................................................... ..................................................................................................................................... [3] (ii) The students wanted to find out whether people had different levels of concern about the problems caused by the cement factory. Describe how Section A in the questionnaire (Fig. 1.3) provides the evidence of different levels of concern. ........................................................................................................................................... ........................................................................................................................................... ........................................................................................................................................... ..................................................................................................................................... [2] (iii) The results of section A in the questionnaire are shown in Table 1.1 (Insert). Use this data to complete Fig. 1.4. [1] Results of section A air pollution noise problem dangerous traffic looks ugly trees are chopped down 0 50 100 150 200 250 300 350 400 450 total score Fig. 1.4 (iv) To answer Hypothesis 1, the students calculated the average score given by each of the different age groups for each problem. Their results are shown in Table 1.2 (Insert). Complete the graph for the ‘21– 40’ age group in Fig. 1.5. [2] Average scores given by each age group under 21 age group 5.0 4.5 4.0 3.5 average 3.0 score 2.5 2.0 1.5 1.0 0.5 0.0 pollution noise dangeroustraffic looksugly treesaredown air problem chopped 21– 40 age group 5.0 4.5 4.0 3.5 average 3.0 score 2.5 2.0 1.5 1.0 0.5 0.0 pollution noise dangeroustraffic looksugly treesaredown air problem chopped 41–60 age group 5.0 4.5 4.0 3.5 average 3.0 score 2.5 2.0 1.5 1.0 0.5 0.0 traffic treesdown pollution noise dangerous ugly are looks air problem chopped over 60 age group 5.0 4.5 4.0 3.5 average 3.0 score 2.5 2.0 1.5 1.0 0.5 0.0 pollution noise dangeroustraffic looksugly treesaredown air problem chopped Fig. 1.5 (v) The students made the conclusion that Hypothesis 1: People in different age groups have the same level of concern about each problem caused by the factory was generally true. Explain why they made this conclusion by using evidence from Fig. 1.5 and Table 1.2. ........................................................................................................................................... ........................................................................................................................................... ........................................................................................................................................... ........................................................................................................................................... ........................................................................................................................................... ..................................................................................................................................... [3] (vi) Suggest reasons why some people in Kamalpur are more concerned than others about the impacts of the cement factory. ........................................................................................................................................... ........................................................................................................................................... ........................................................................................................................................... ........................................................................................................................................... ........................................................................................................................................... ..................................................................................................................................... [3]
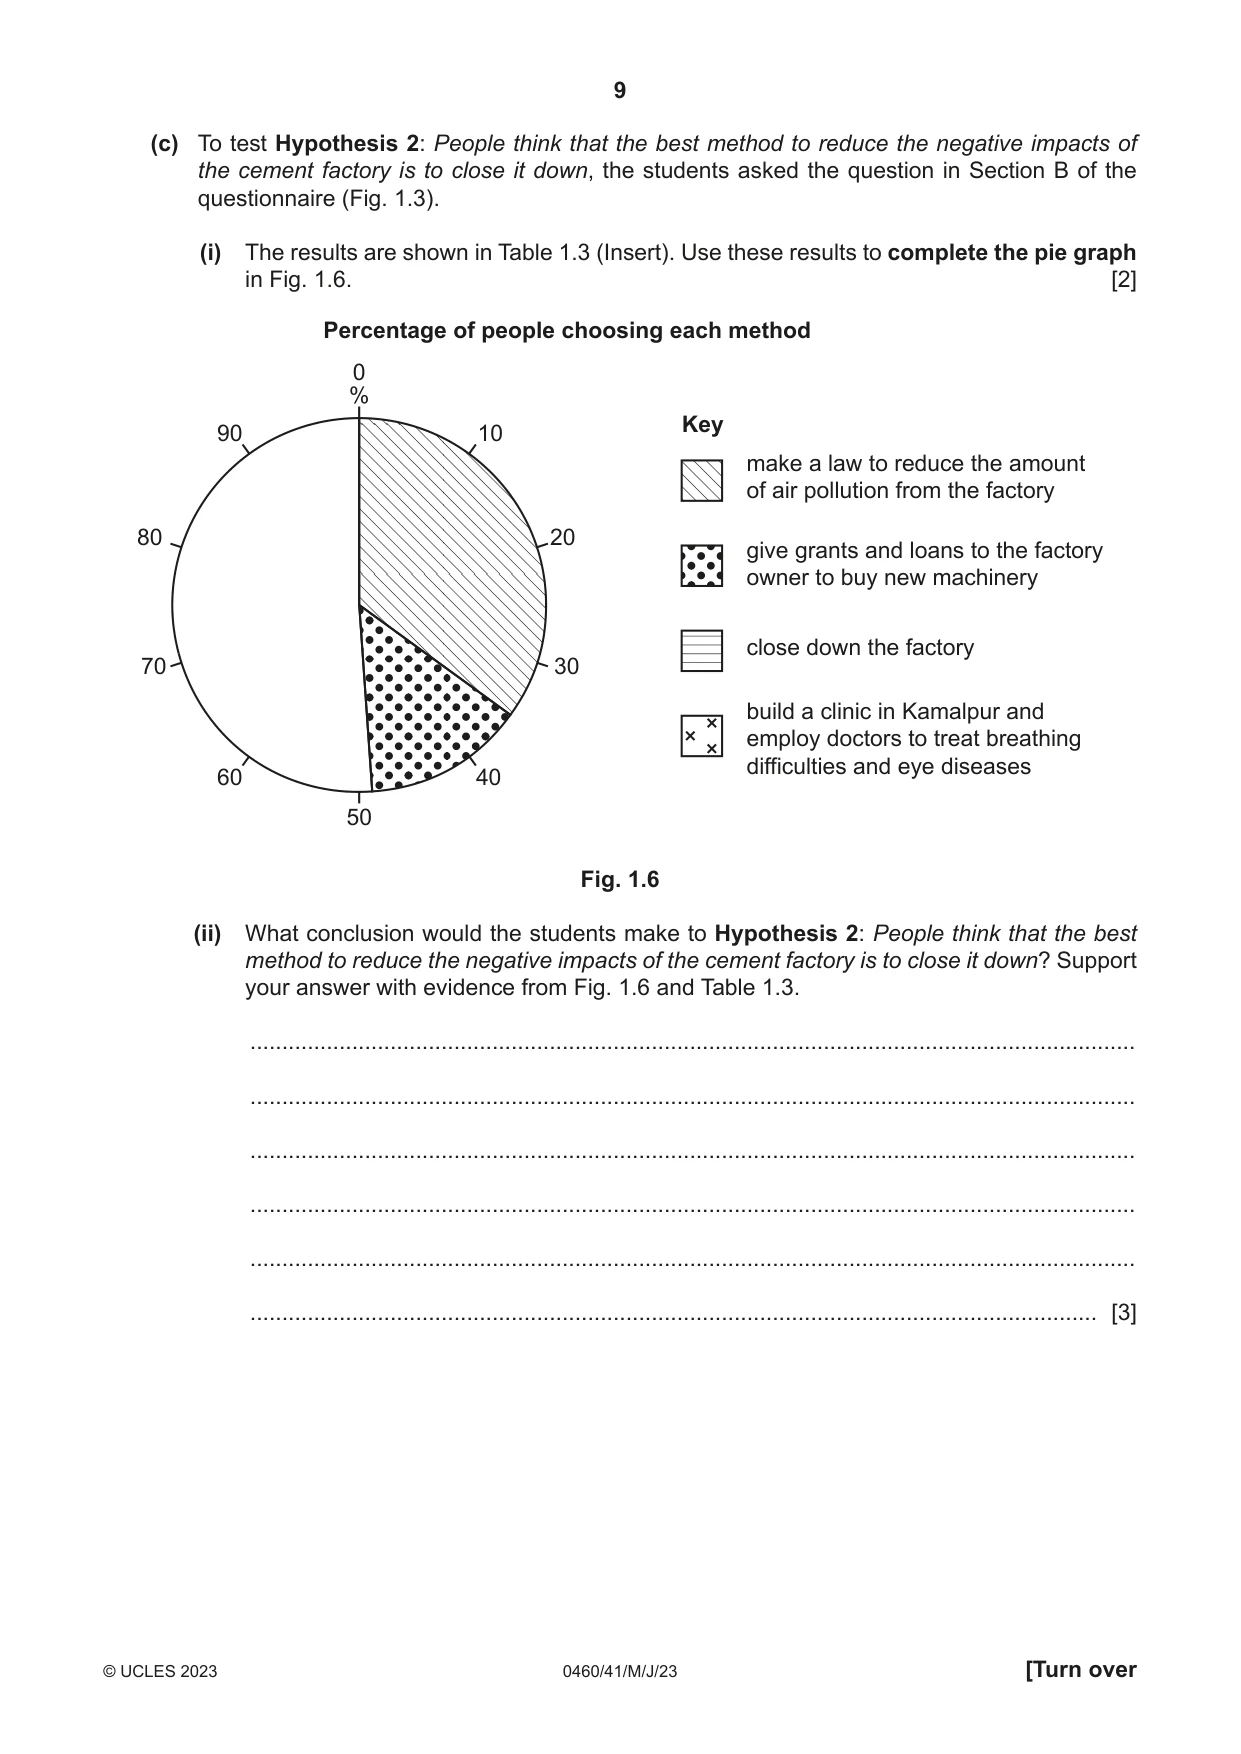
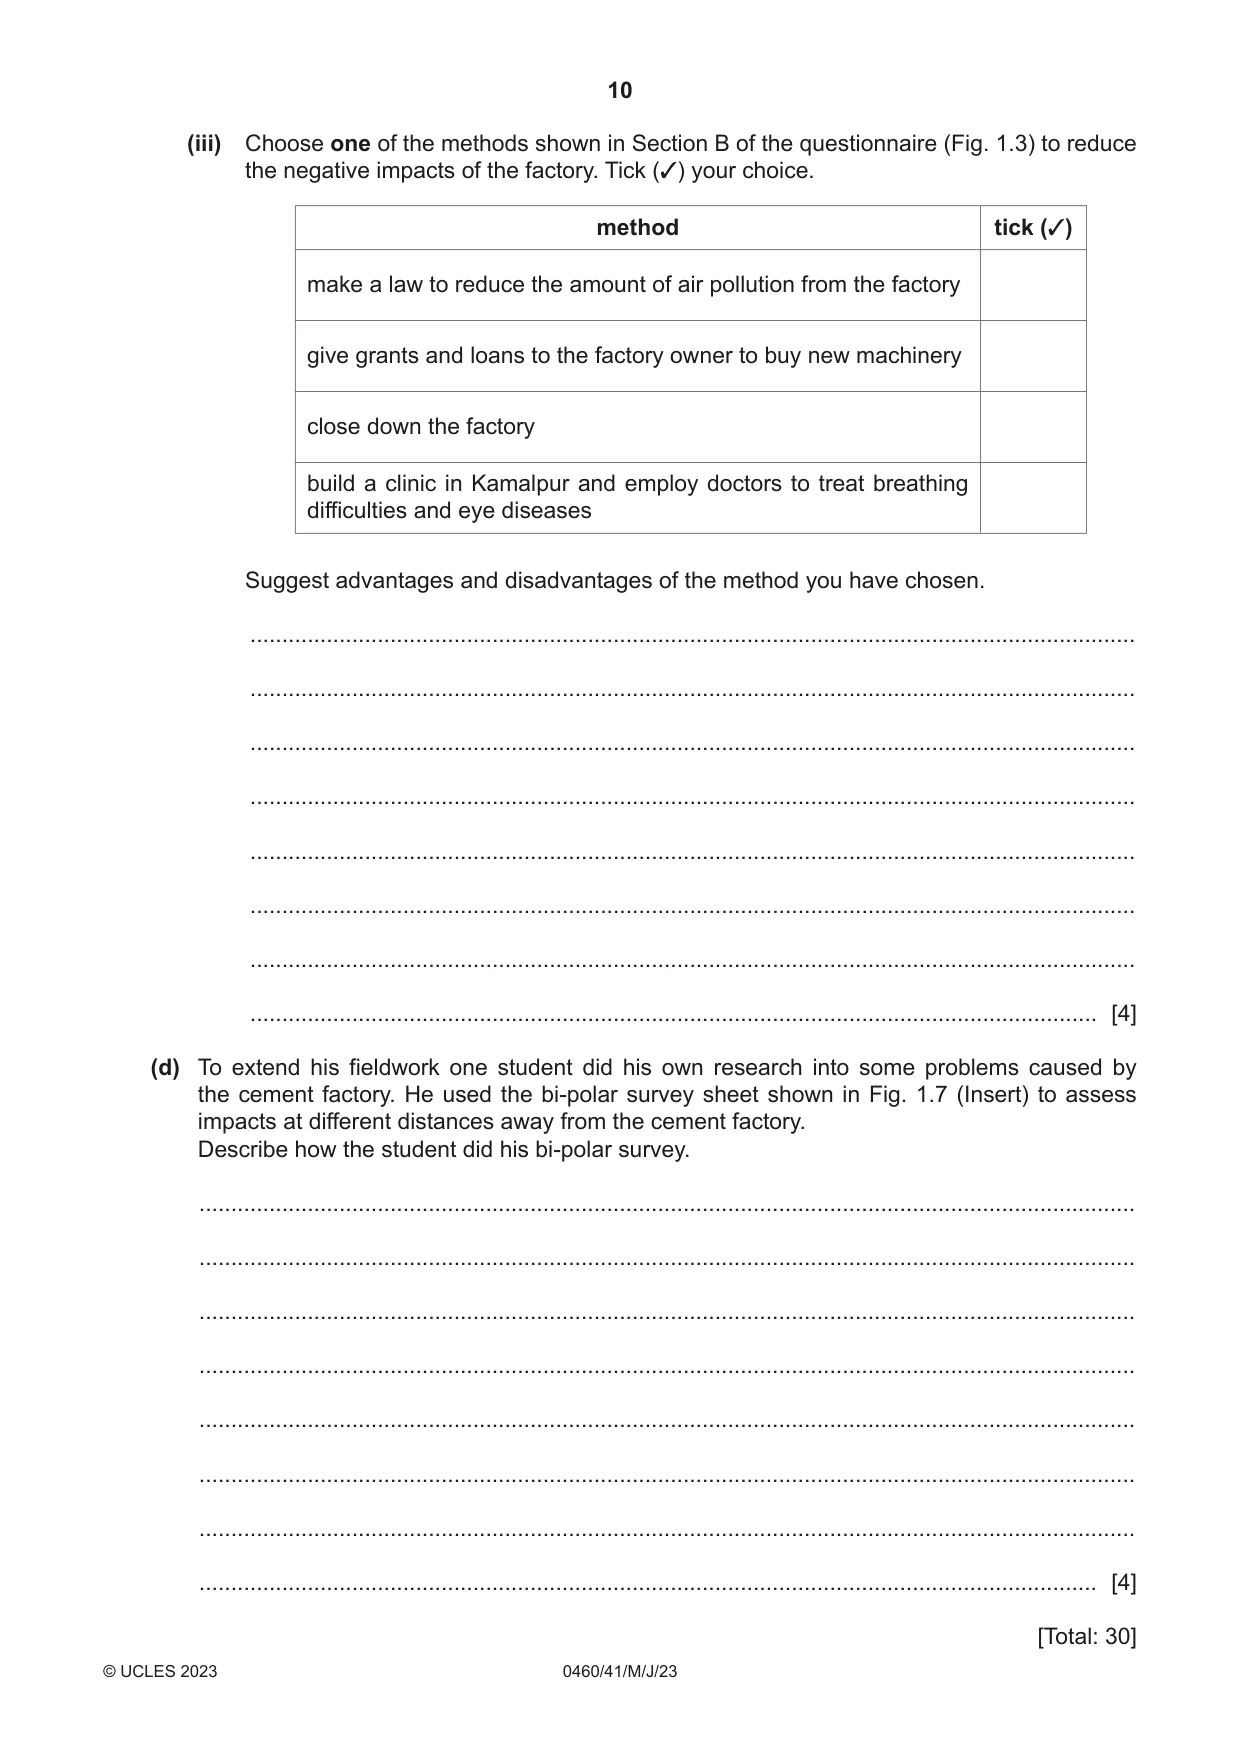
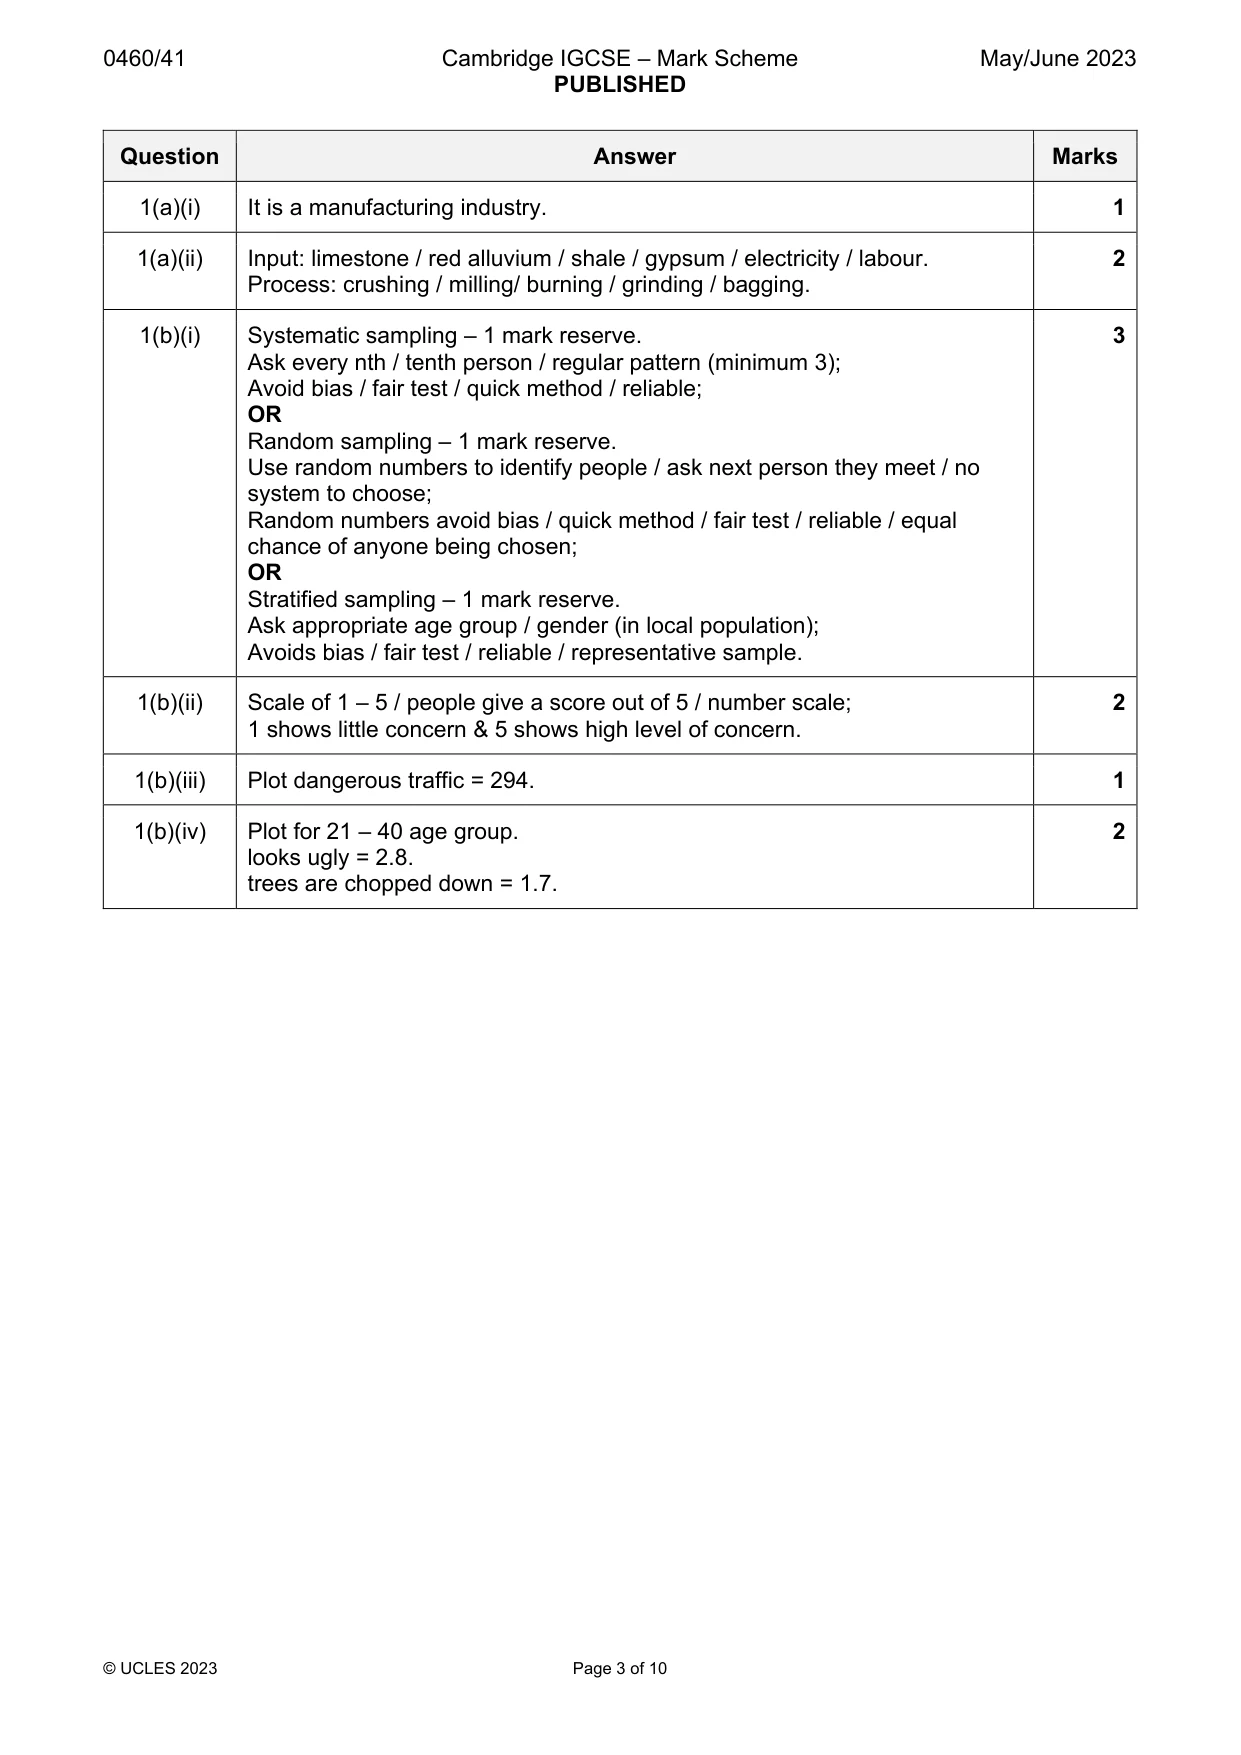
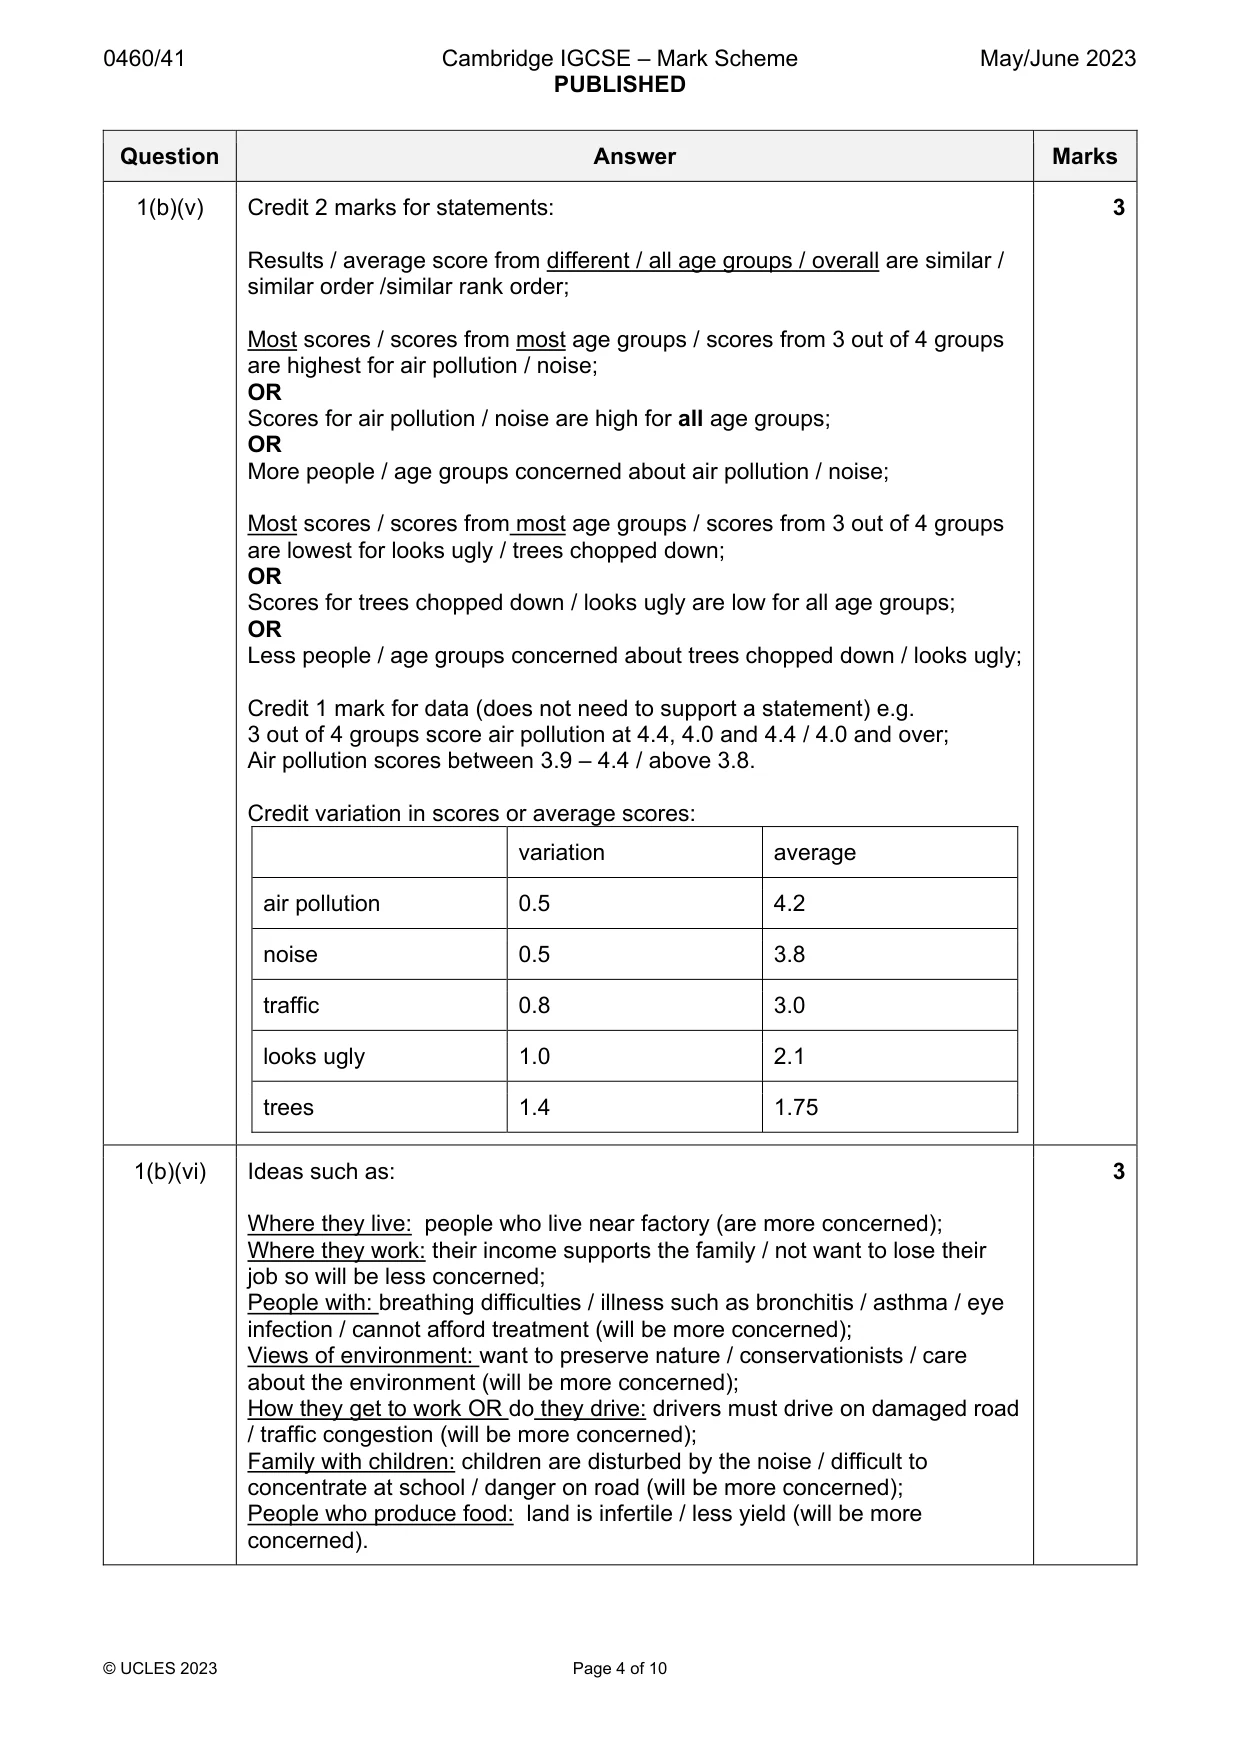
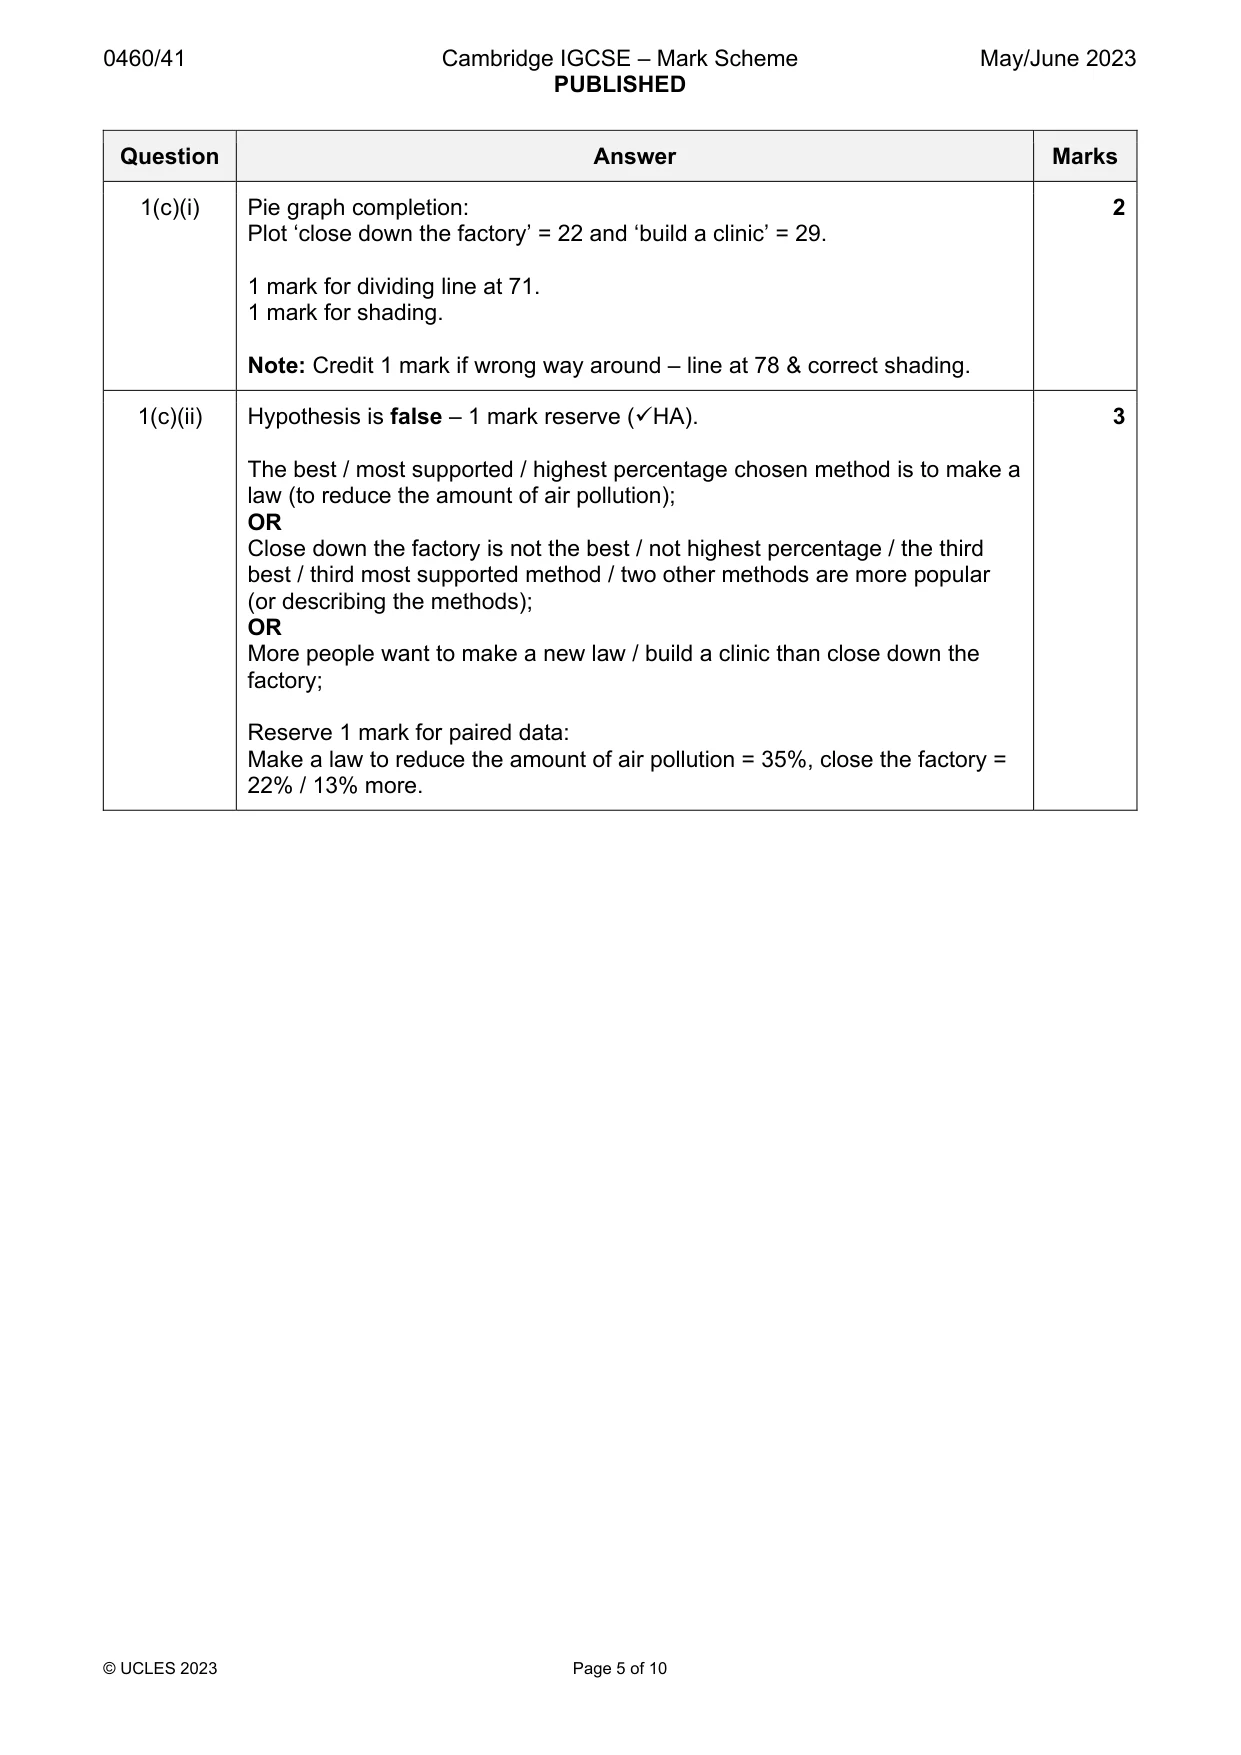
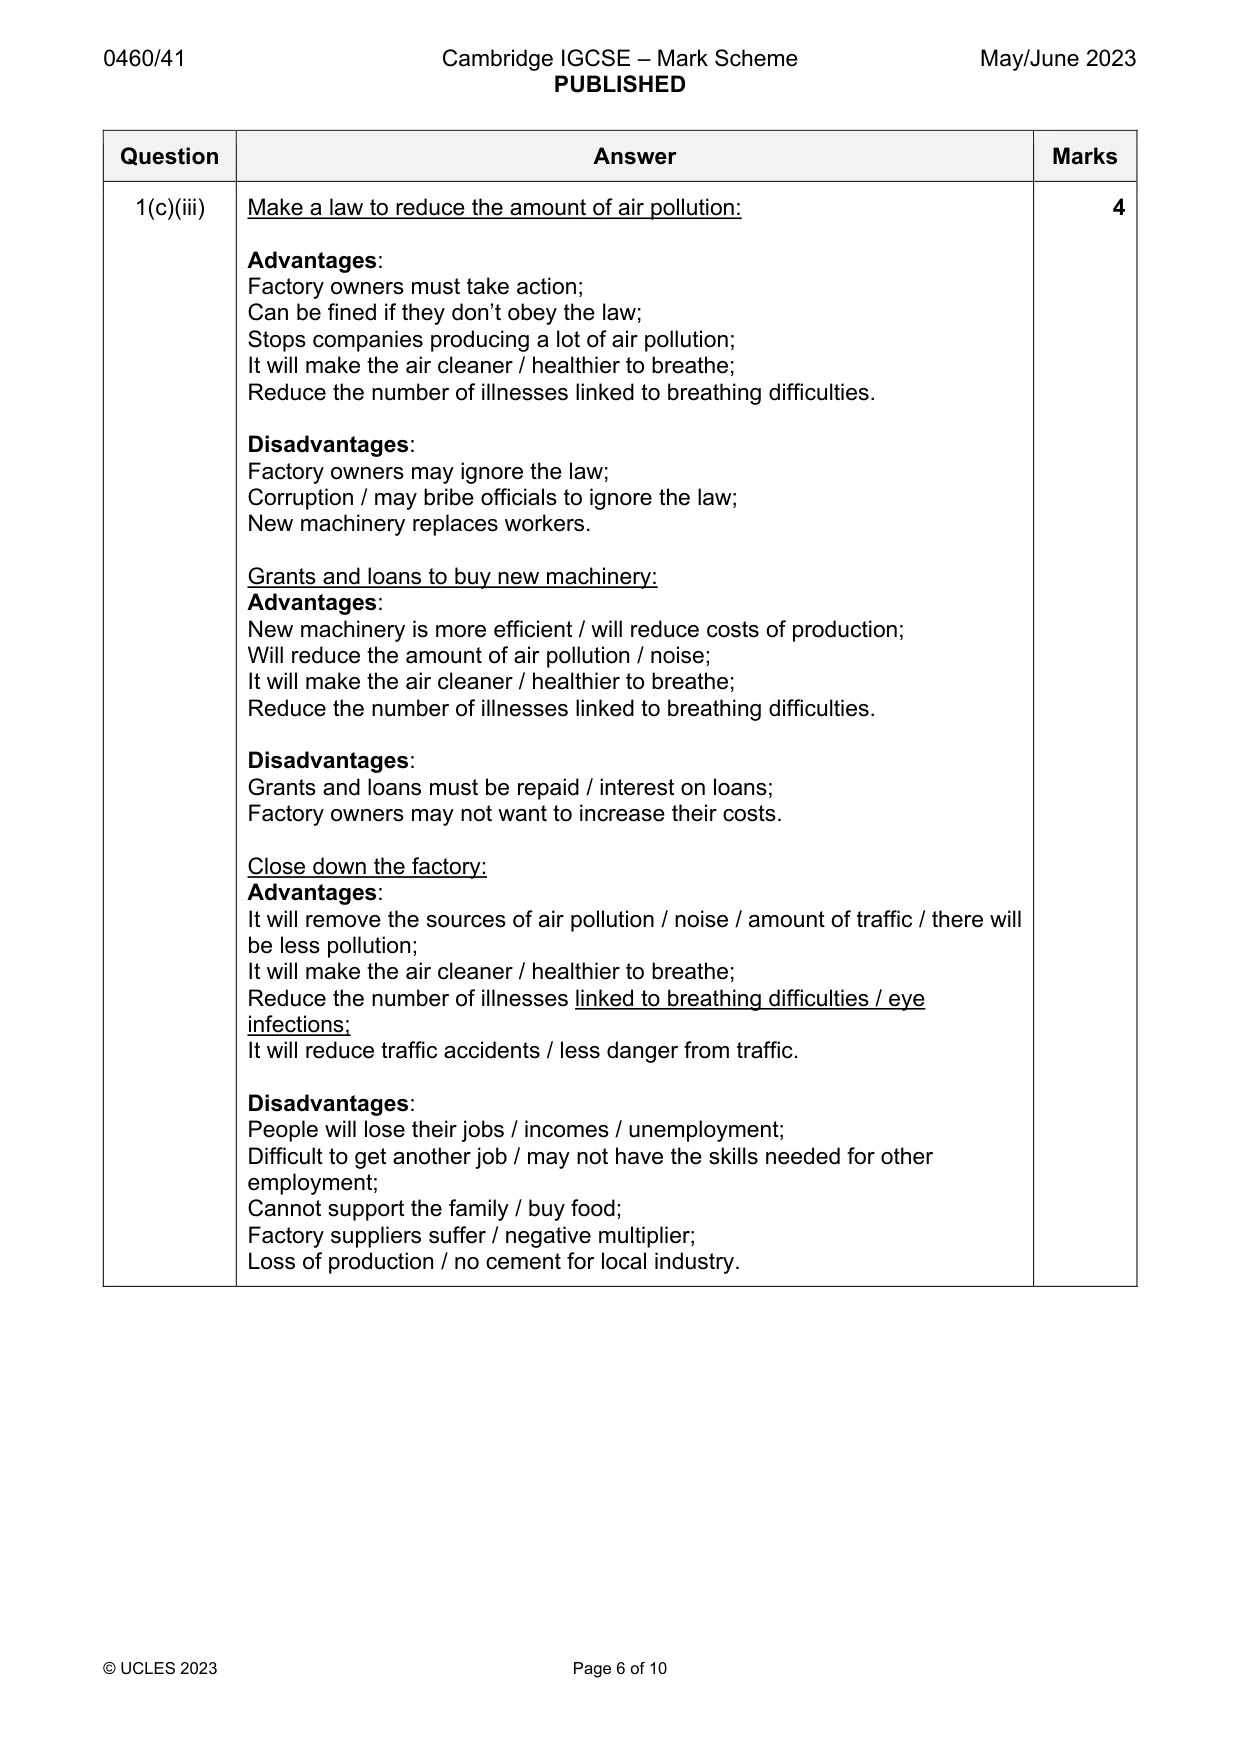
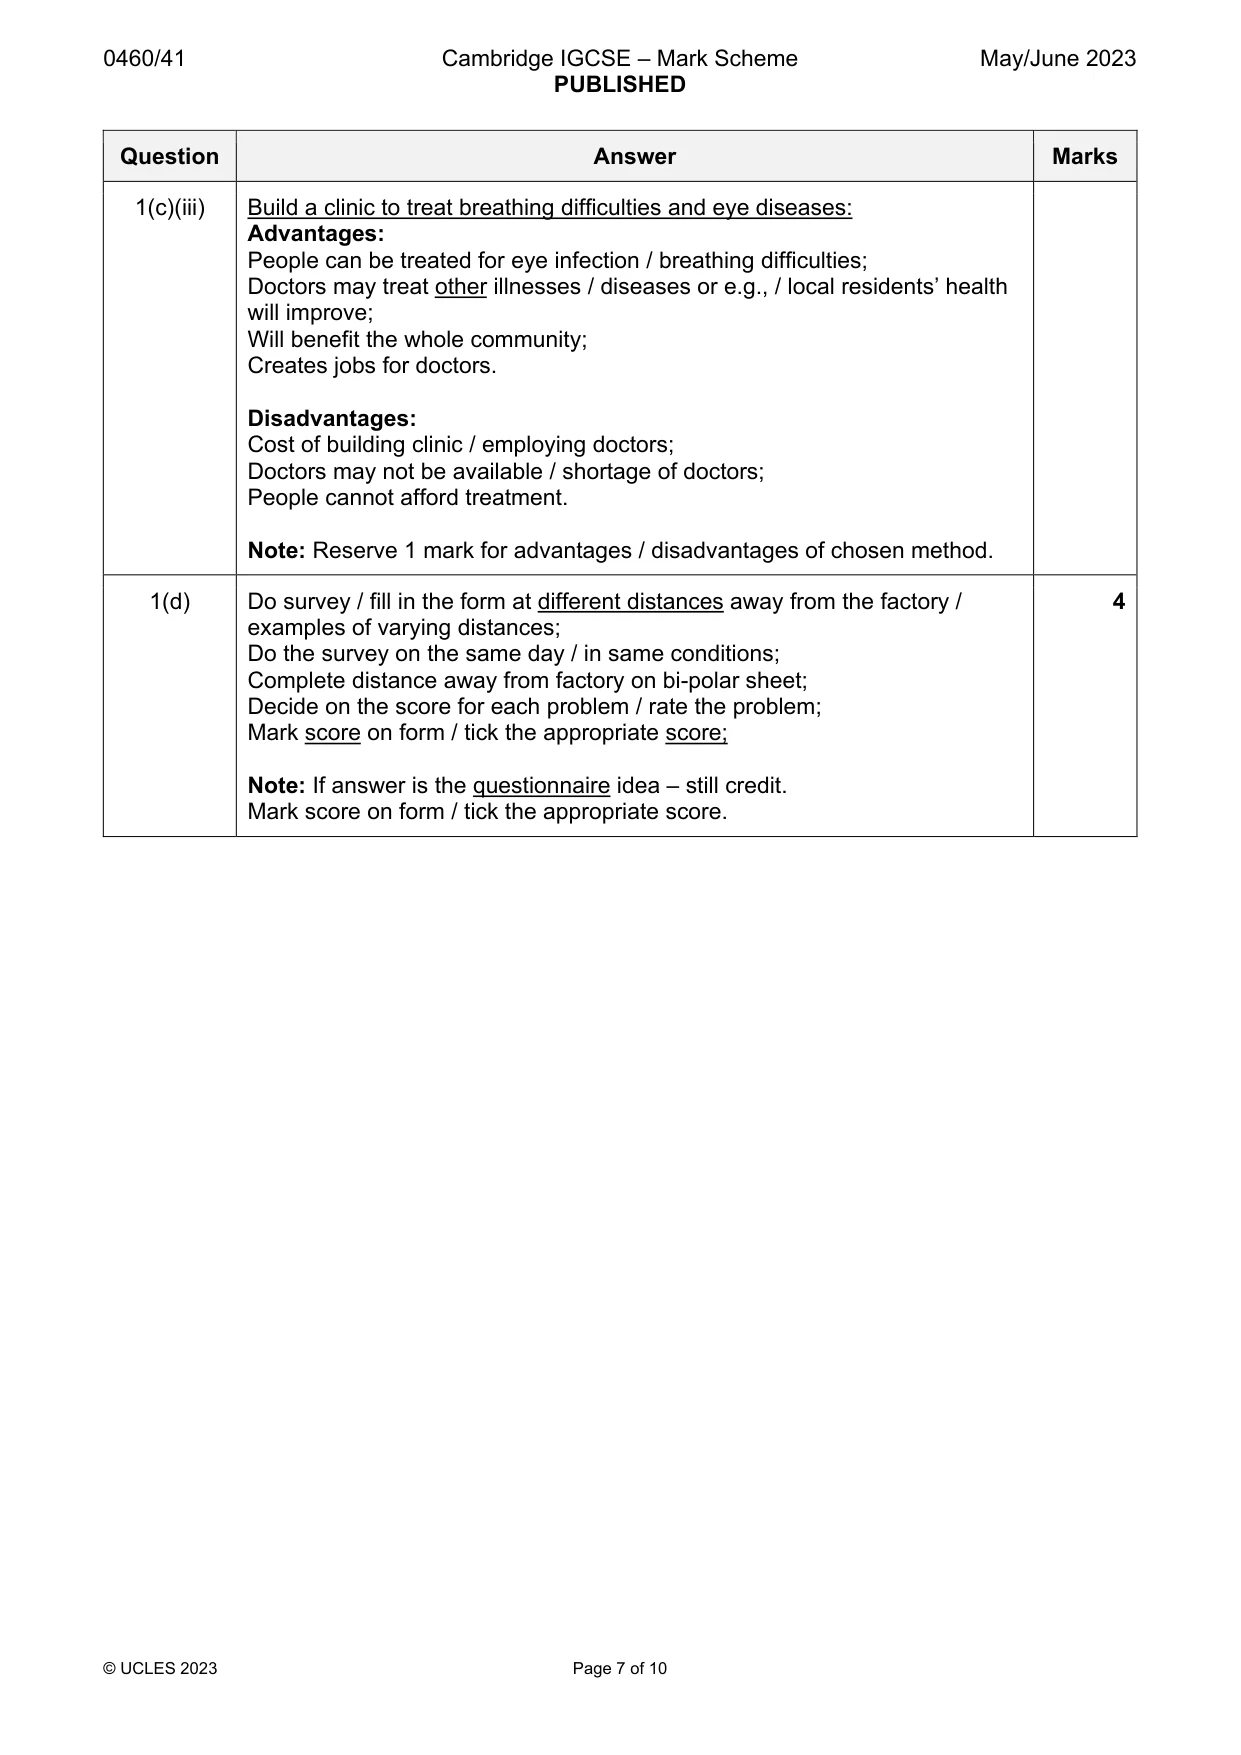
Mark scheme: Question Answer Marks 1(a)(i) It is a manufacturing industry. 1 1(a)(ii) Input: limestone / red alluvium / shale / gypsum / electricity / labour. 2 Process: crushing / milling/ burning / grinding / bagging. 1(b)(i) Systematic sampling – 1 mark reserve. 3 Ask every nth / tenth person / regular pattern (minimum 3); Avoid bias / fair test / quick method / reliable; OR Random sampling – 1 mark reserve. Use random numbers to identify people / ask next person they meet / no system to choose; Random numbers avoid bias / quick method / fair test / reliable / equal chance of anyone being chosen; OR Stratified sampling – 1 mark reserve. Ask appropriate age group / gender (in local population); Avoids bias / fair test / reliable / representative sample. 1(b)(ii) Scale of 1 – 5 / people give a score out of 5 / number scale; 2 1 shows little concern & 5 shows high level of concern. 1(b)(iii) Plot dangerous traffic = 294. 1 1(b)(iv) Plot for 21 – 40 age group. 2 looks ugly = 2.8. trees are chopped down = 1.7. 1(b)(v) Credit 2 marks for statements: 3 Results / average score from different / all age groups / overall are similar / similar order /similar rank order; Most scores / scores from most age groups / scores from 3 out of 4 groups are highest for air pollution / noise; OR Scores for air pollution / noise are high for all age groups; OR More people / age groups concerned about air pollution / noise; Most scores / scores from most age groups / scores from 3 out of 4 groups are lowest for looks ugly / trees chopped down; OR Scores for trees chopped down / looks ugly are low for all age groups; OR Less people / age groups concerned about trees chopped down / looks ugly; Credit 1 mark for data (does not need to support a statement) e.g. 3 out of 4 groups score air pollution at 4.4, 4.0 and 4.4 / 4.0 and over; Air pollution scores between 3.9 – 4.4 / above 3.8. Credit variation in scores or average scores: variation average air pollution 0.5 4.2 noise 0.5 3.8 traffic 0.8 3.0 looks ugly 1.0 2.1 trees 1.4 1.75 1(b)(vi) Ideas such as: 3 Where they live: people who live near factory (are more concerned); Where they work: their income supports the family / not want to lose their job so will be less concerned; People with: breathing difficulties / illness such as bronchitis / asthma / eye infection / cannot afford treatment (will be more concerned); Views of environment: want to preserve nature / conservationists / care about the environment (will be more concerned); How they get to work OR do they drive: drivers must drive on damaged road / traffic congestion (will be more concerned); Family with children: children are disturbed by the noise / difficult to concentrate at school / danger on road (will be more concerned); People who produce food: land is infertile / less yield (will be more concerned). 1(c)(i) Pie graph completion: 2 Plot ‘close down the factory’ = 22 and ‘build a clinic’ = 29. 1 mark for dividing line at 71. 1 mark for shading. Note: Credit 1 mark if wrong way around – line at 78 & correct shading. 1(c)(ii) Hypothesis is false – 1 mark reserve (HA). 3 The best / most supported / highest percentage chosen method is to make a law (to reduce the amount of air pollution); OR Close down the factory is not the best / not highest percentage / the third best / third most supported method / two other methods are more popular (or describing the methods); OR More people want to make a new law / build a clinic than close down the factory; Reserve 1 mark for paired data: Make a law to reduce the amount of air pollution = 35%, close the factory = 22% / 13% more. 1(c)(iii) Make a law to reduce the amount of air pollution: 4 Advantages: Factory owners must take action; Can be fined if they don’t obey the law; Stops companies producing a lot of air pollution; It will make the air cleaner / healthier to breathe; Reduce the number of illnesses linked to breathing difficulties. Disadvantages: Factory owners may ignore the law; Corruption / may bribe officials to ignore the law; New machinery replaces workers. Grants and loans to buy new machinery: Advantages: New machinery is more efficient / will reduce costs of production; Will reduce the amount of air pollution / noise; It will make the air cleaner / healthier to breathe; Reduce the number of illnesses linked to breathing difficulties. Disadvantages: Grants and loans must be repaid / interest on loans; Factory owners may not want to increase their costs. Close down the factory: Advantages: It will remove the sources of air pollution / noise / amount of traffic / there will be less pollution; It will make the air cleaner / healthier to breathe; Reduce the number of illnesses linked to breathing difficulties / eye infections; It will reduce traffic accidents / less danger from traffic. Disadvantages: People will lose their jobs / incomes / unemployment; Difficult to get another job / may not have the skills needed for other employment; Cannot support the family / buy food; Factory suppliers suffer / negative multiplier; Loss of production / no cement for local industry. 1(c)(iii) Build a clinic to treat breathing difficulties and eye diseases: Advantages: People can be treated for eye infection / breathing difficulties; Doctors may treat other illnesses / diseases or e.g., / local residents’ health will improve; Will benefit the whole community; Creates jobs for doctors. Disadvantages: Cost of building clinic / employing doctors; Doctors may not be available / shortage of doctors; People cannot afford treatment. Note: Reserve 1 mark for advantages / disadvantages of chosen method. 1(d) Do survey / fill in the form at different distances away from the factory / 4 examples of varying distances; Do the survey on the same day / in same conditions; Complete distance away from factory on bi-polar sheet; Decide on the score for each problem / rate the problem; Mark score on form / tick the appropriate score; Note: If answer is the questionnaire idea – still credit. Mark score on form / tick the appropriate score.
More questions on Environmental risks of economic development
Q2 · A group of students in Thailand studied how the characteristics of a river change…
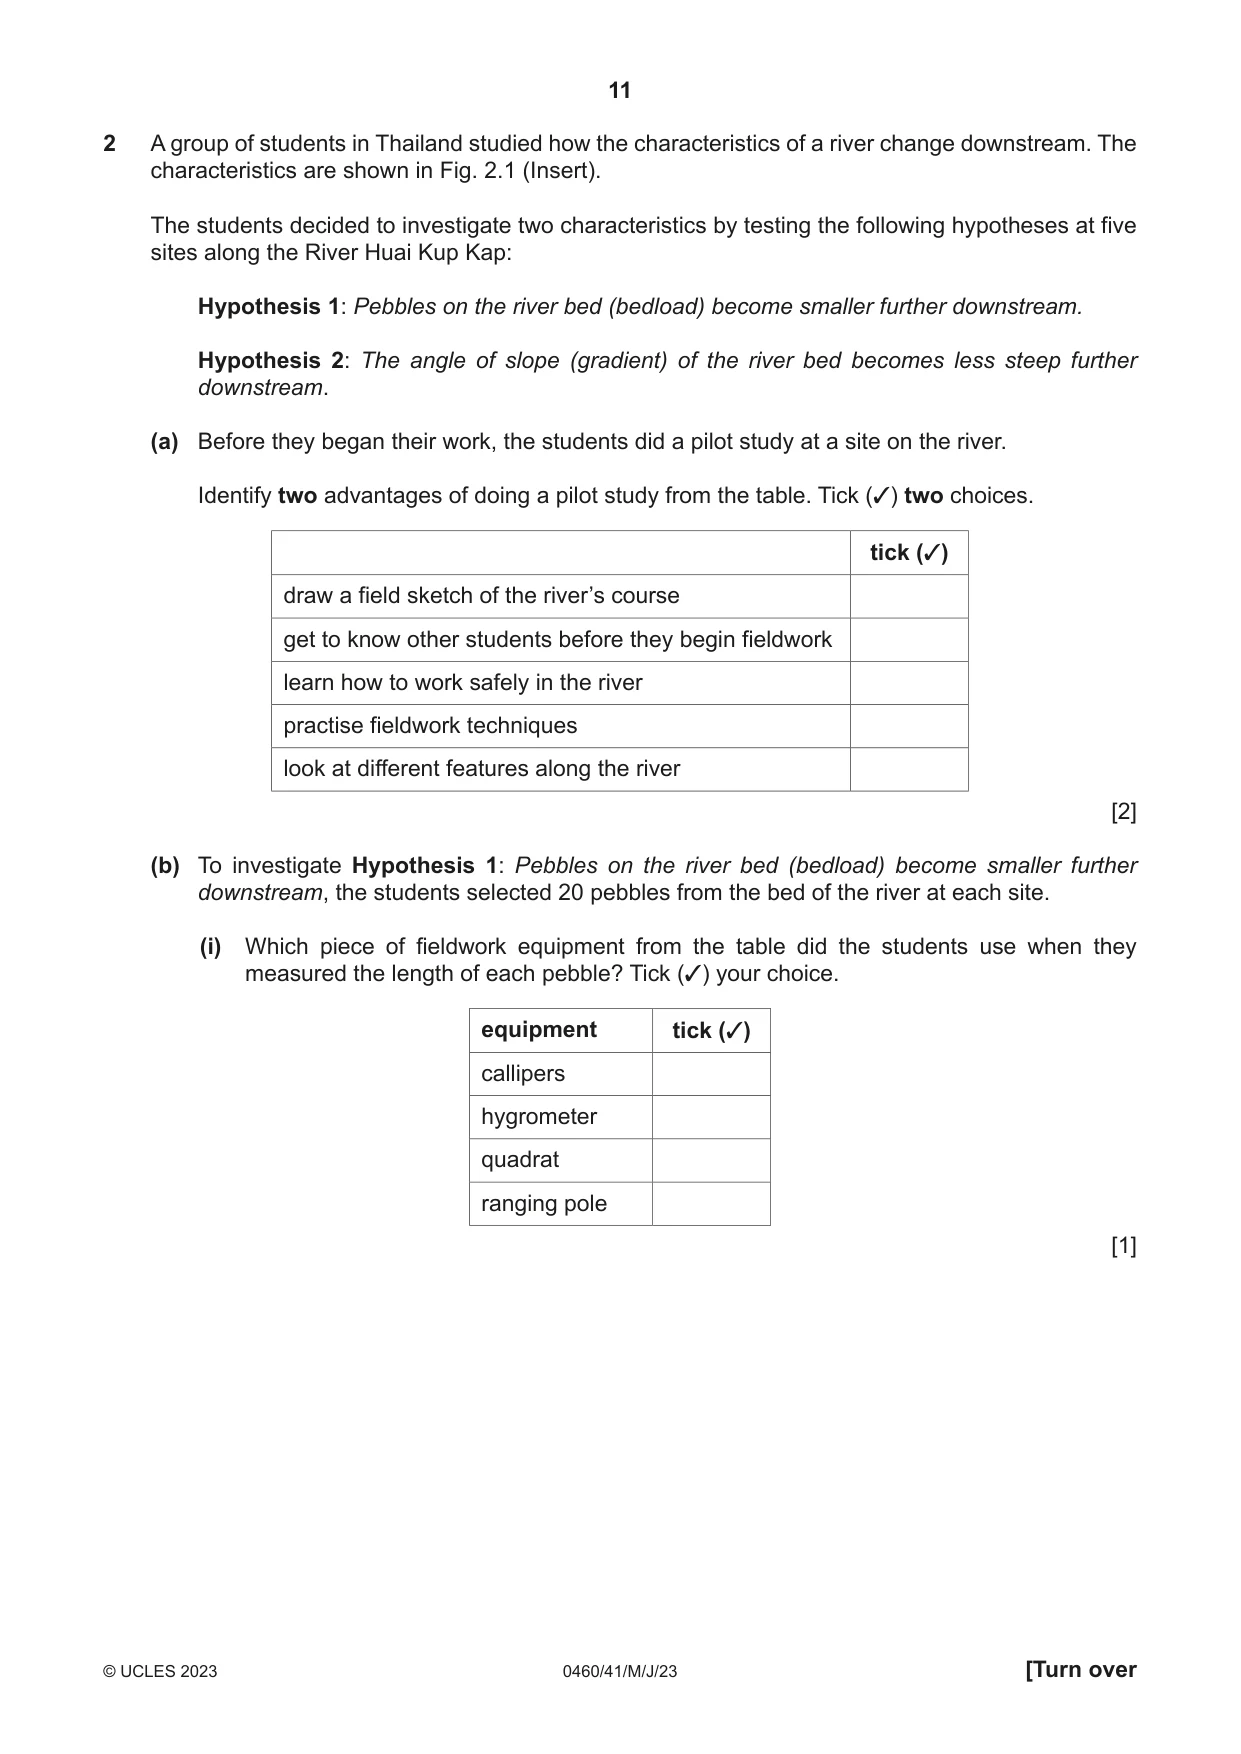
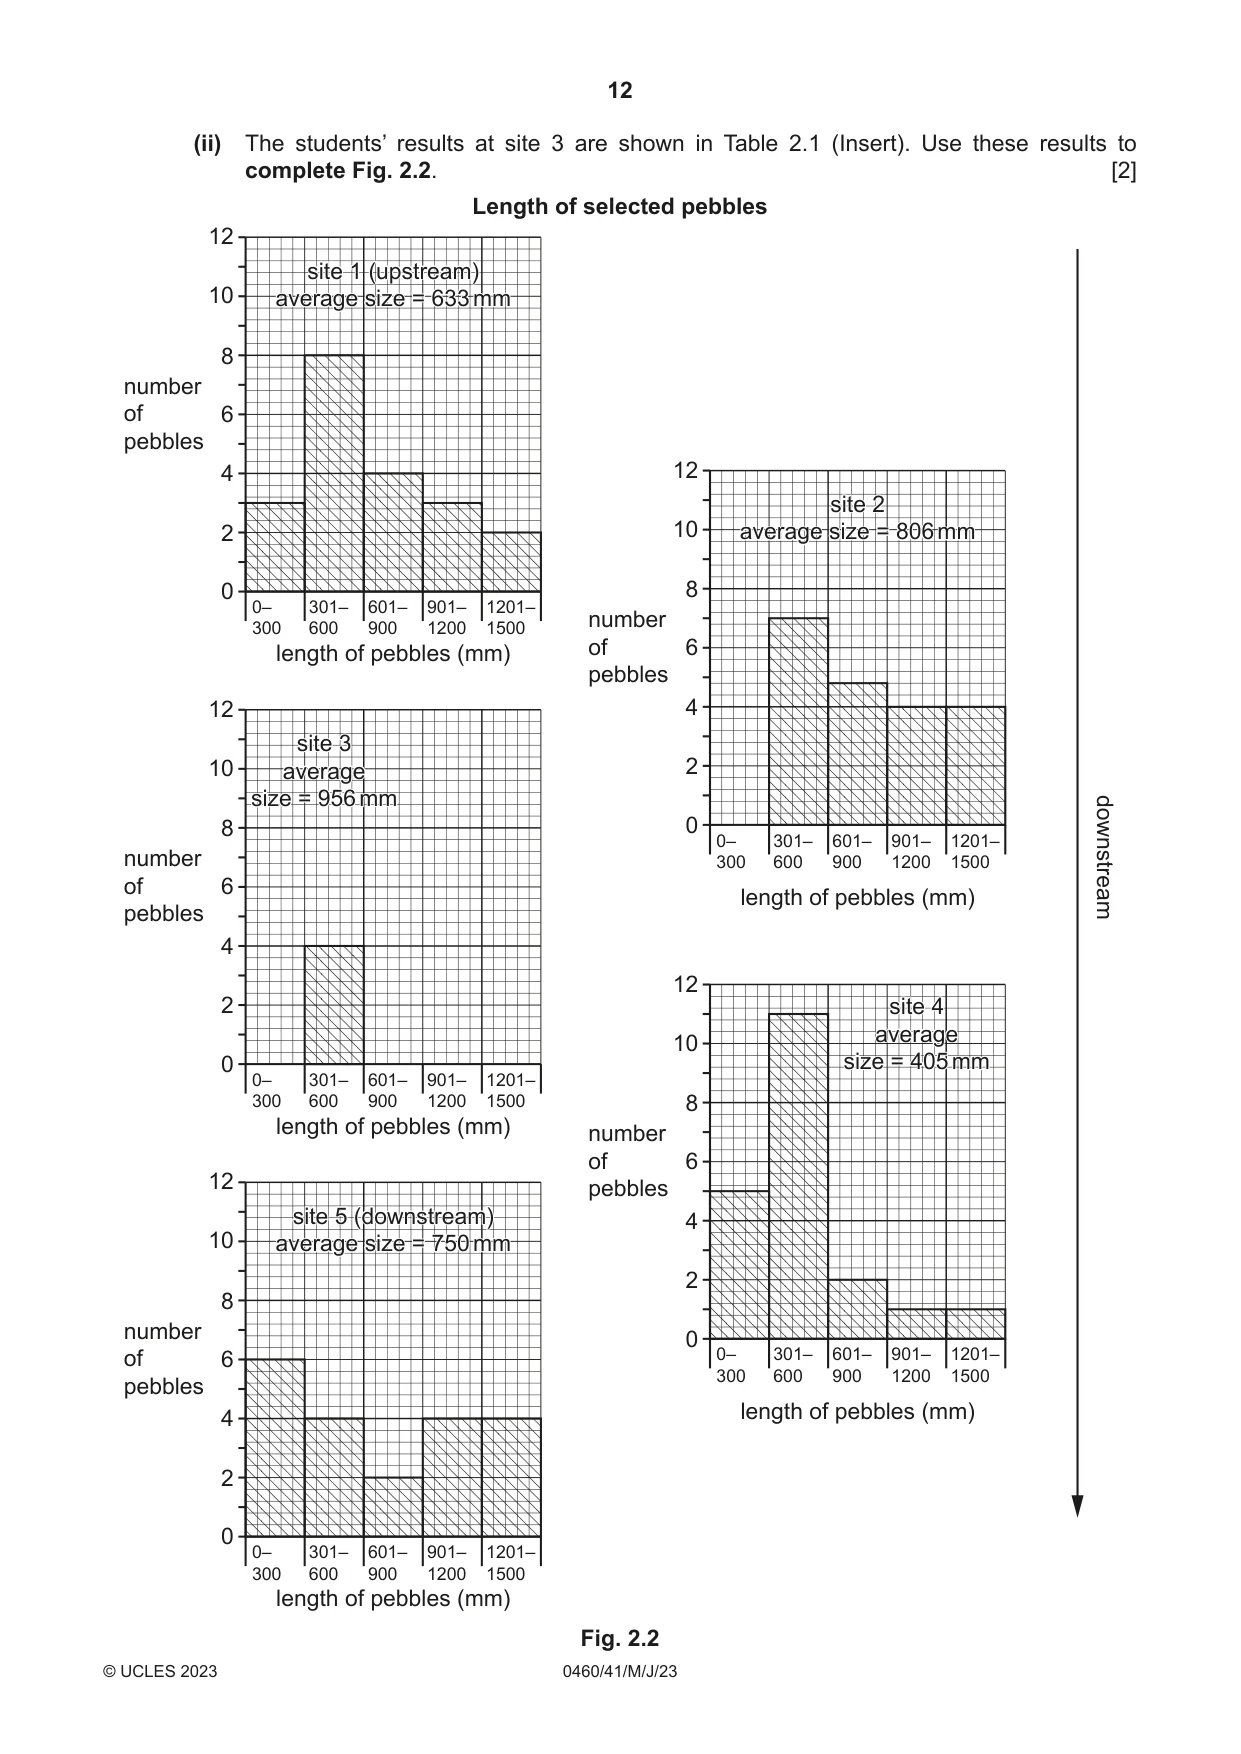
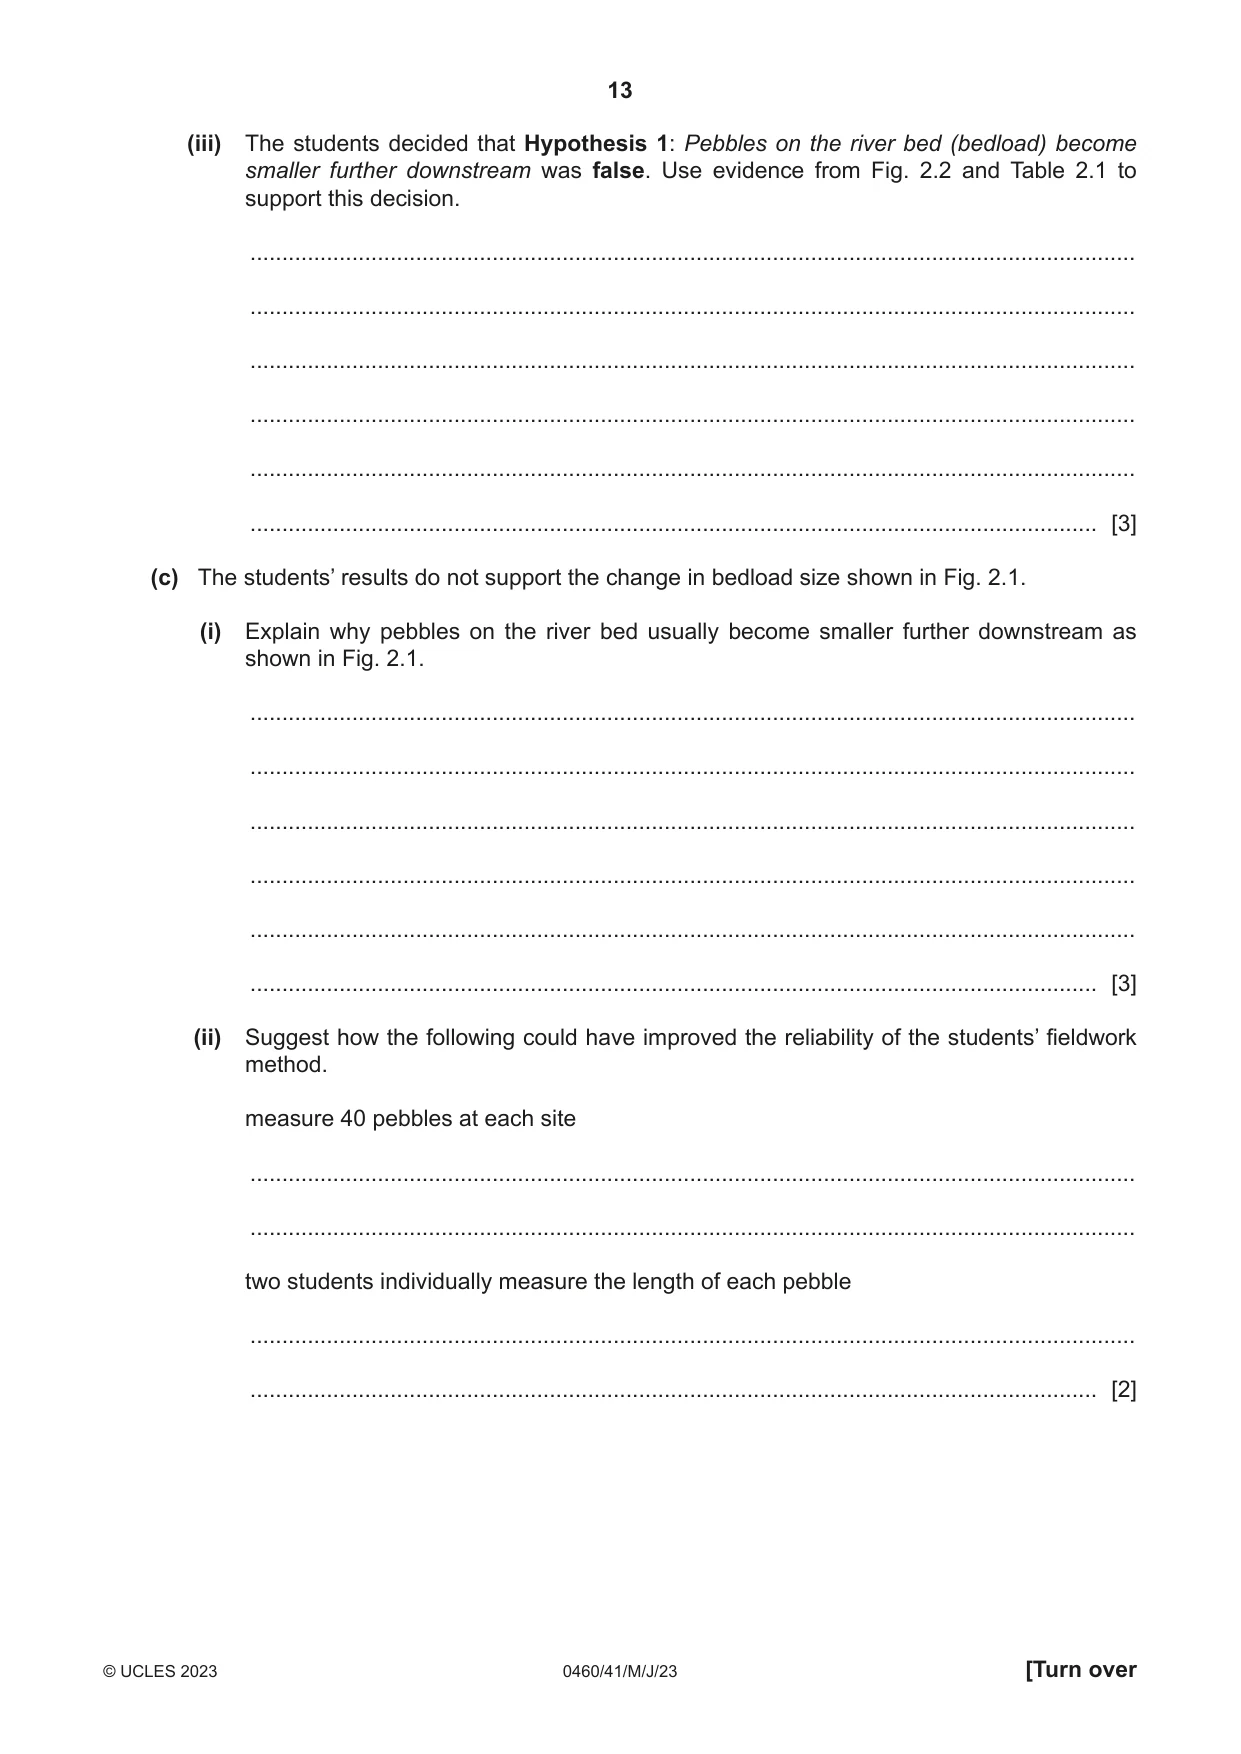
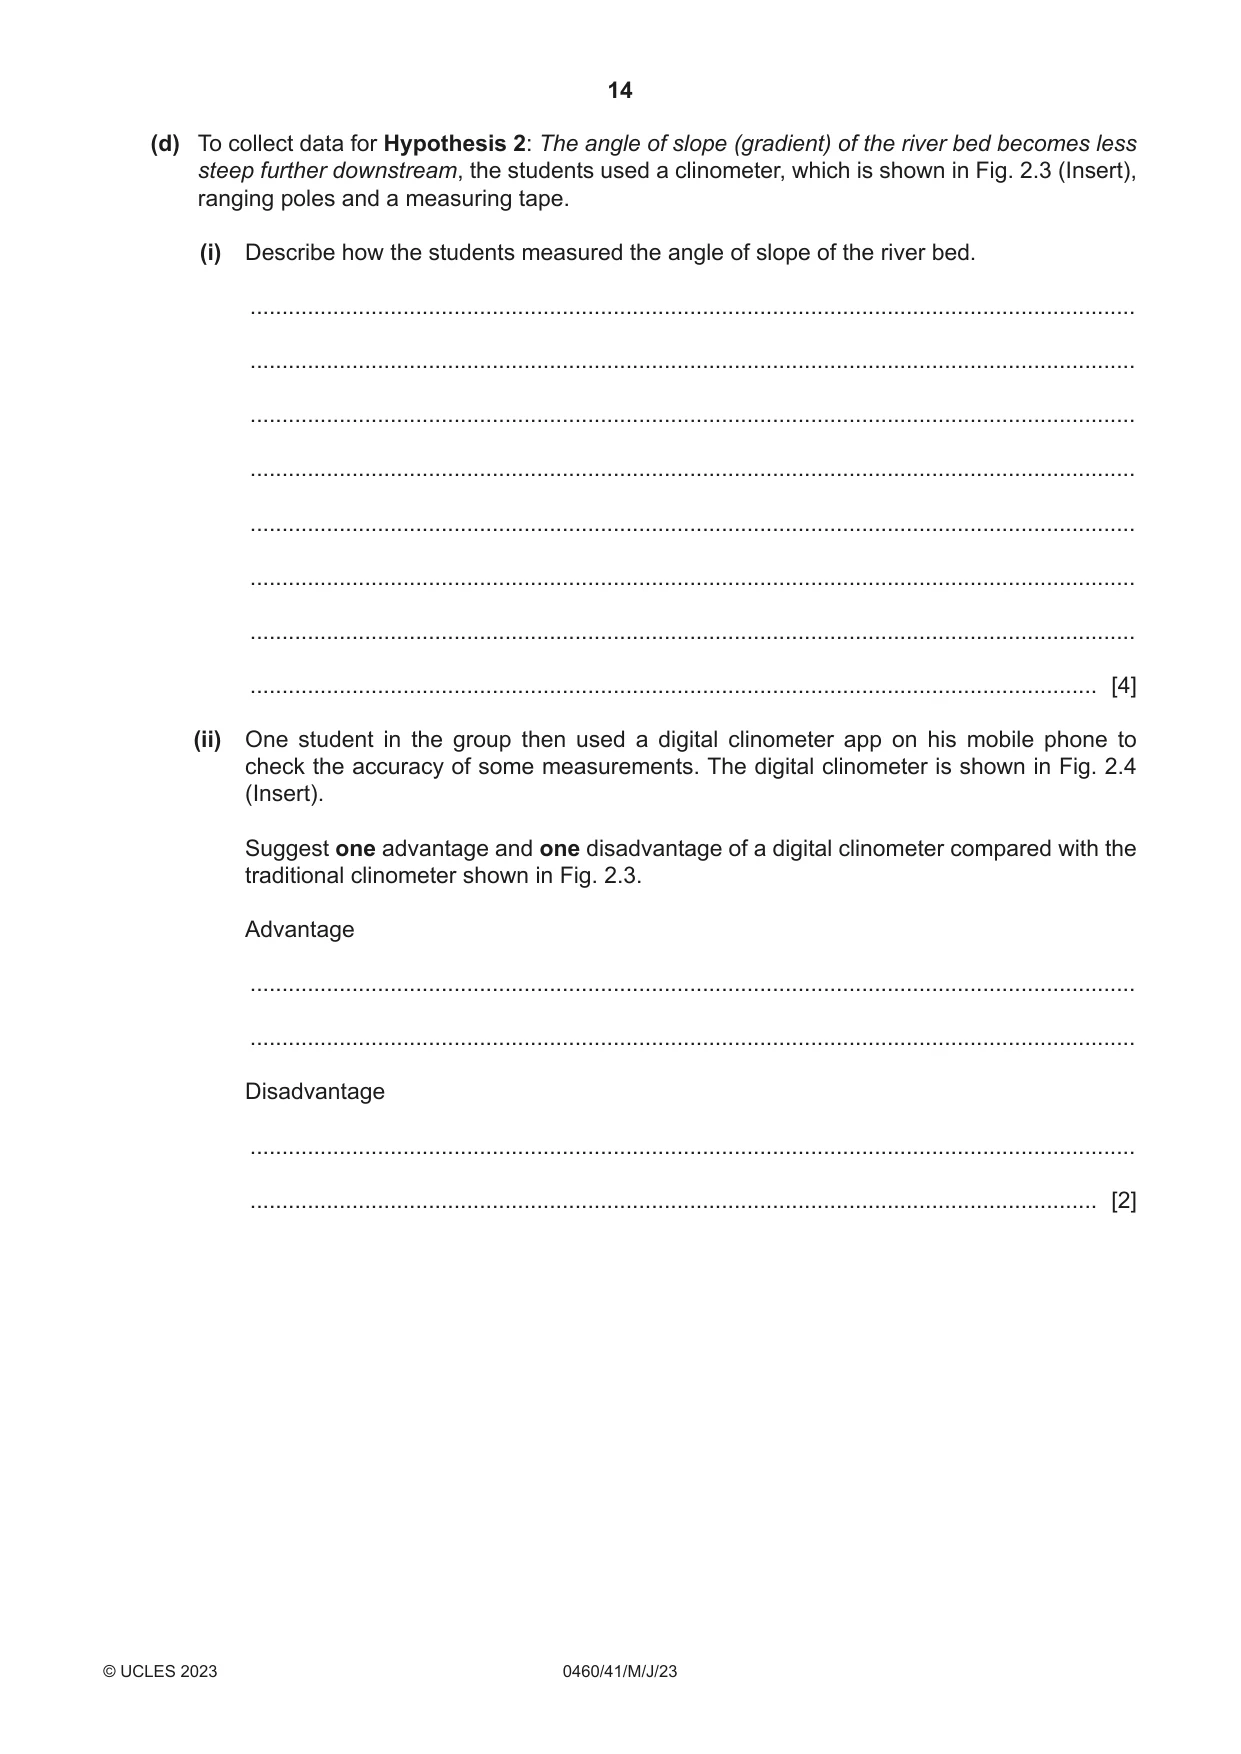
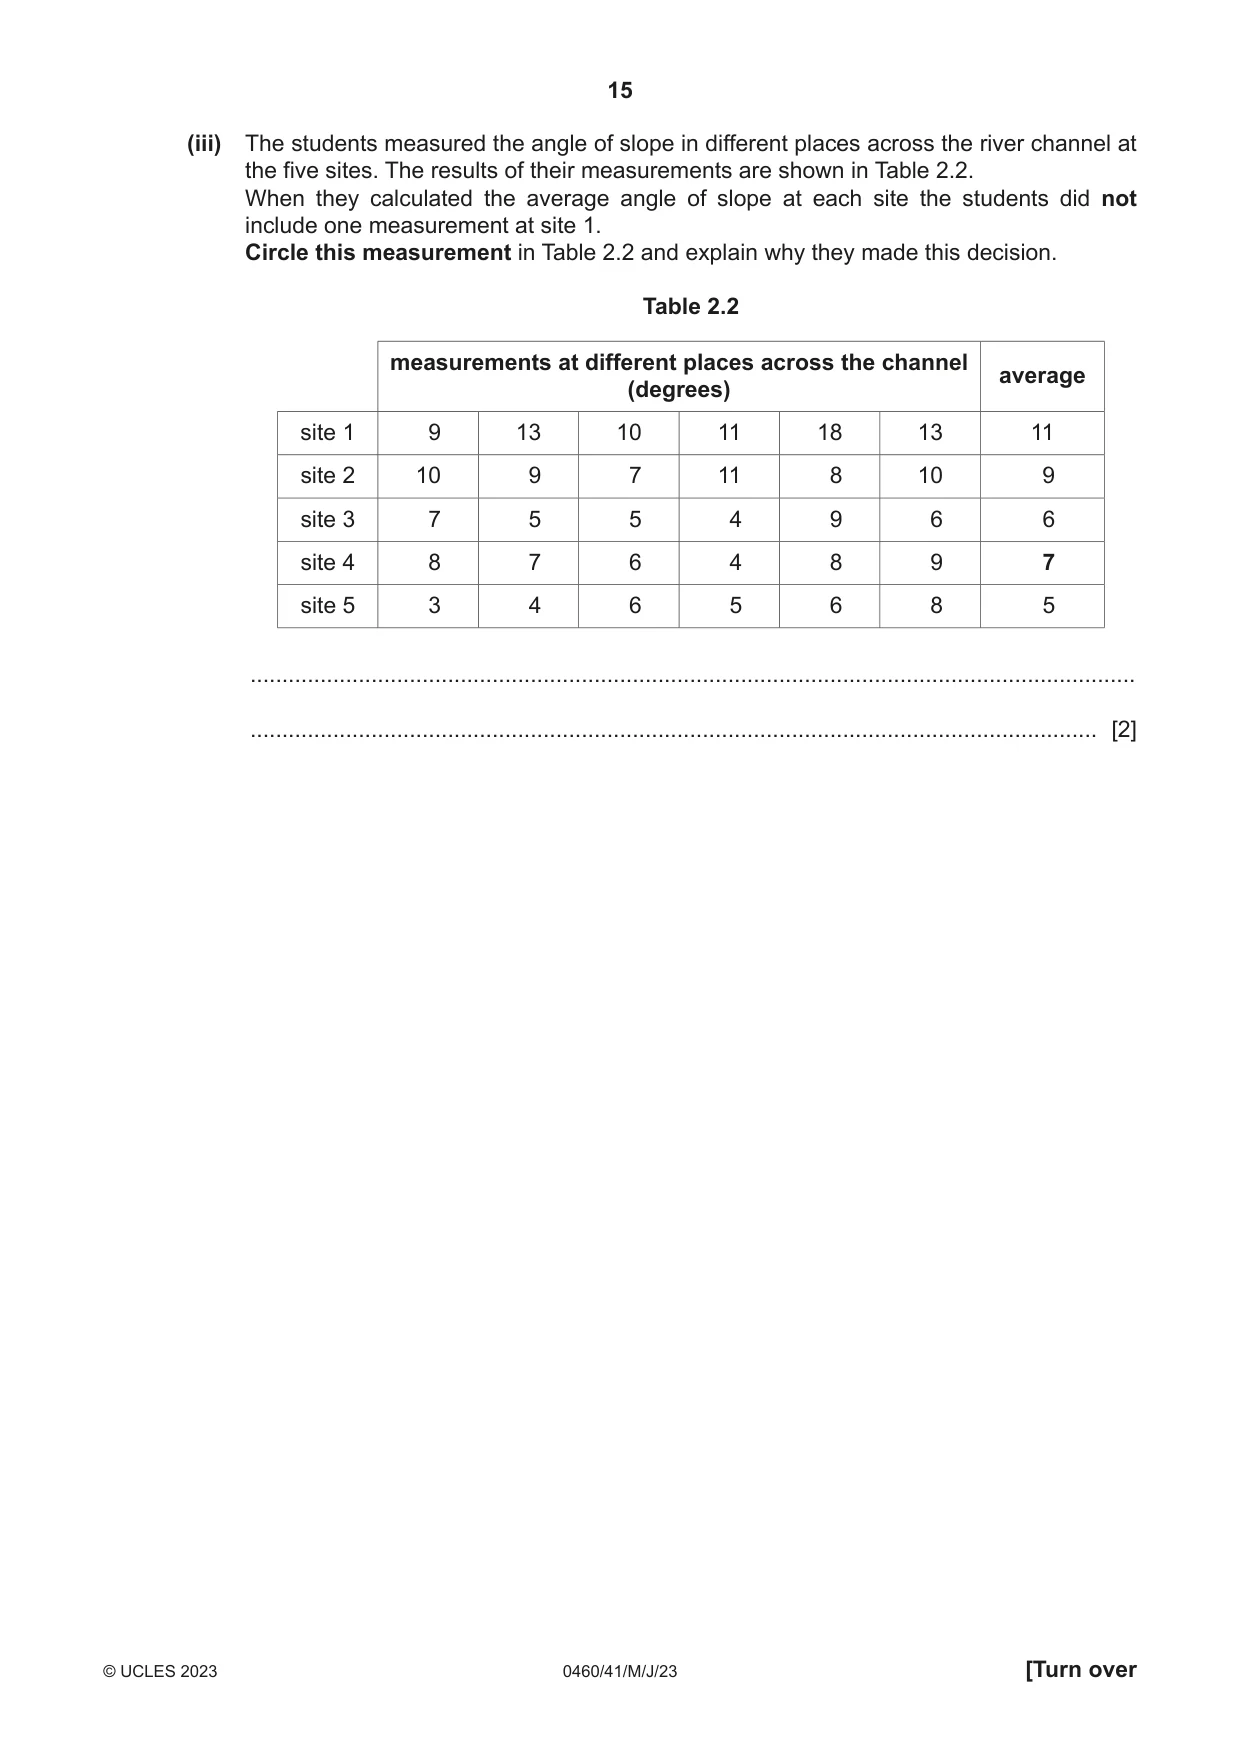
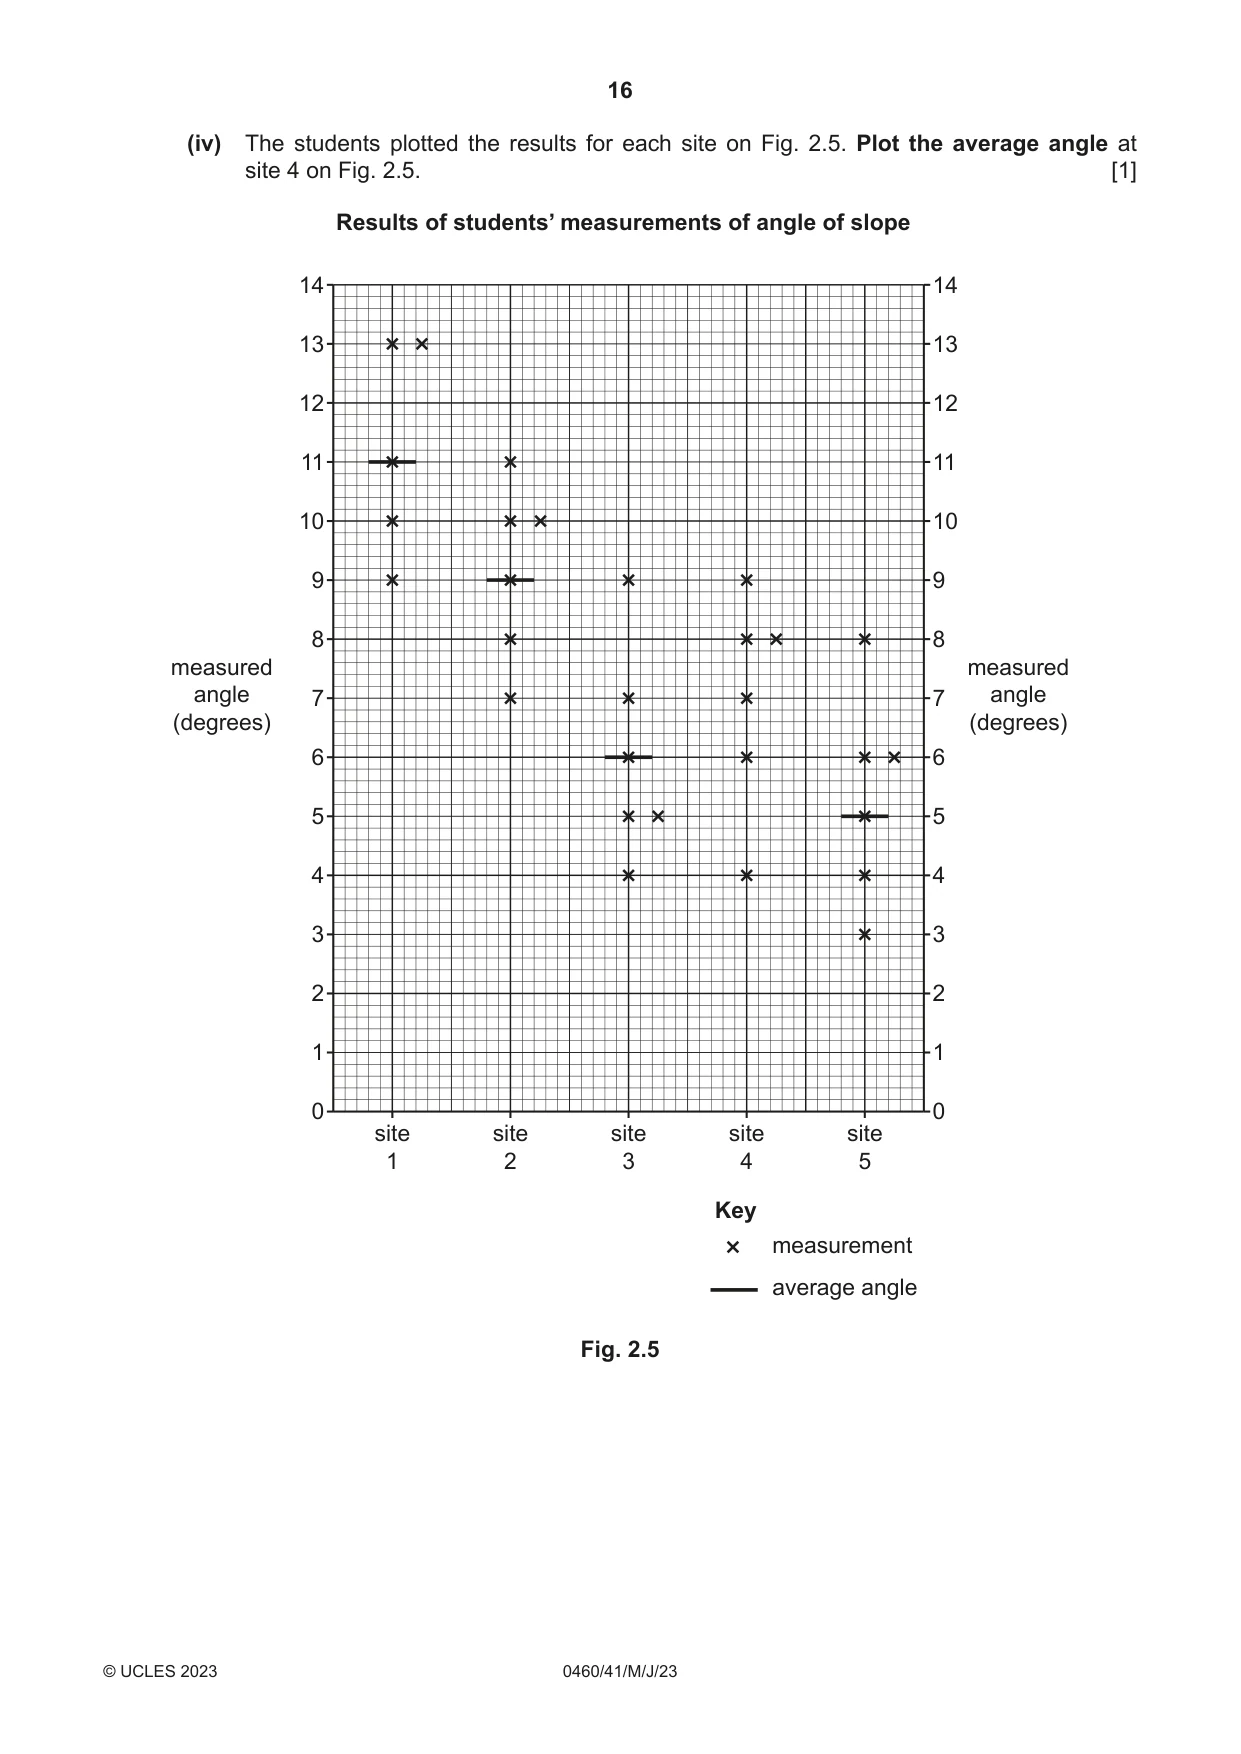
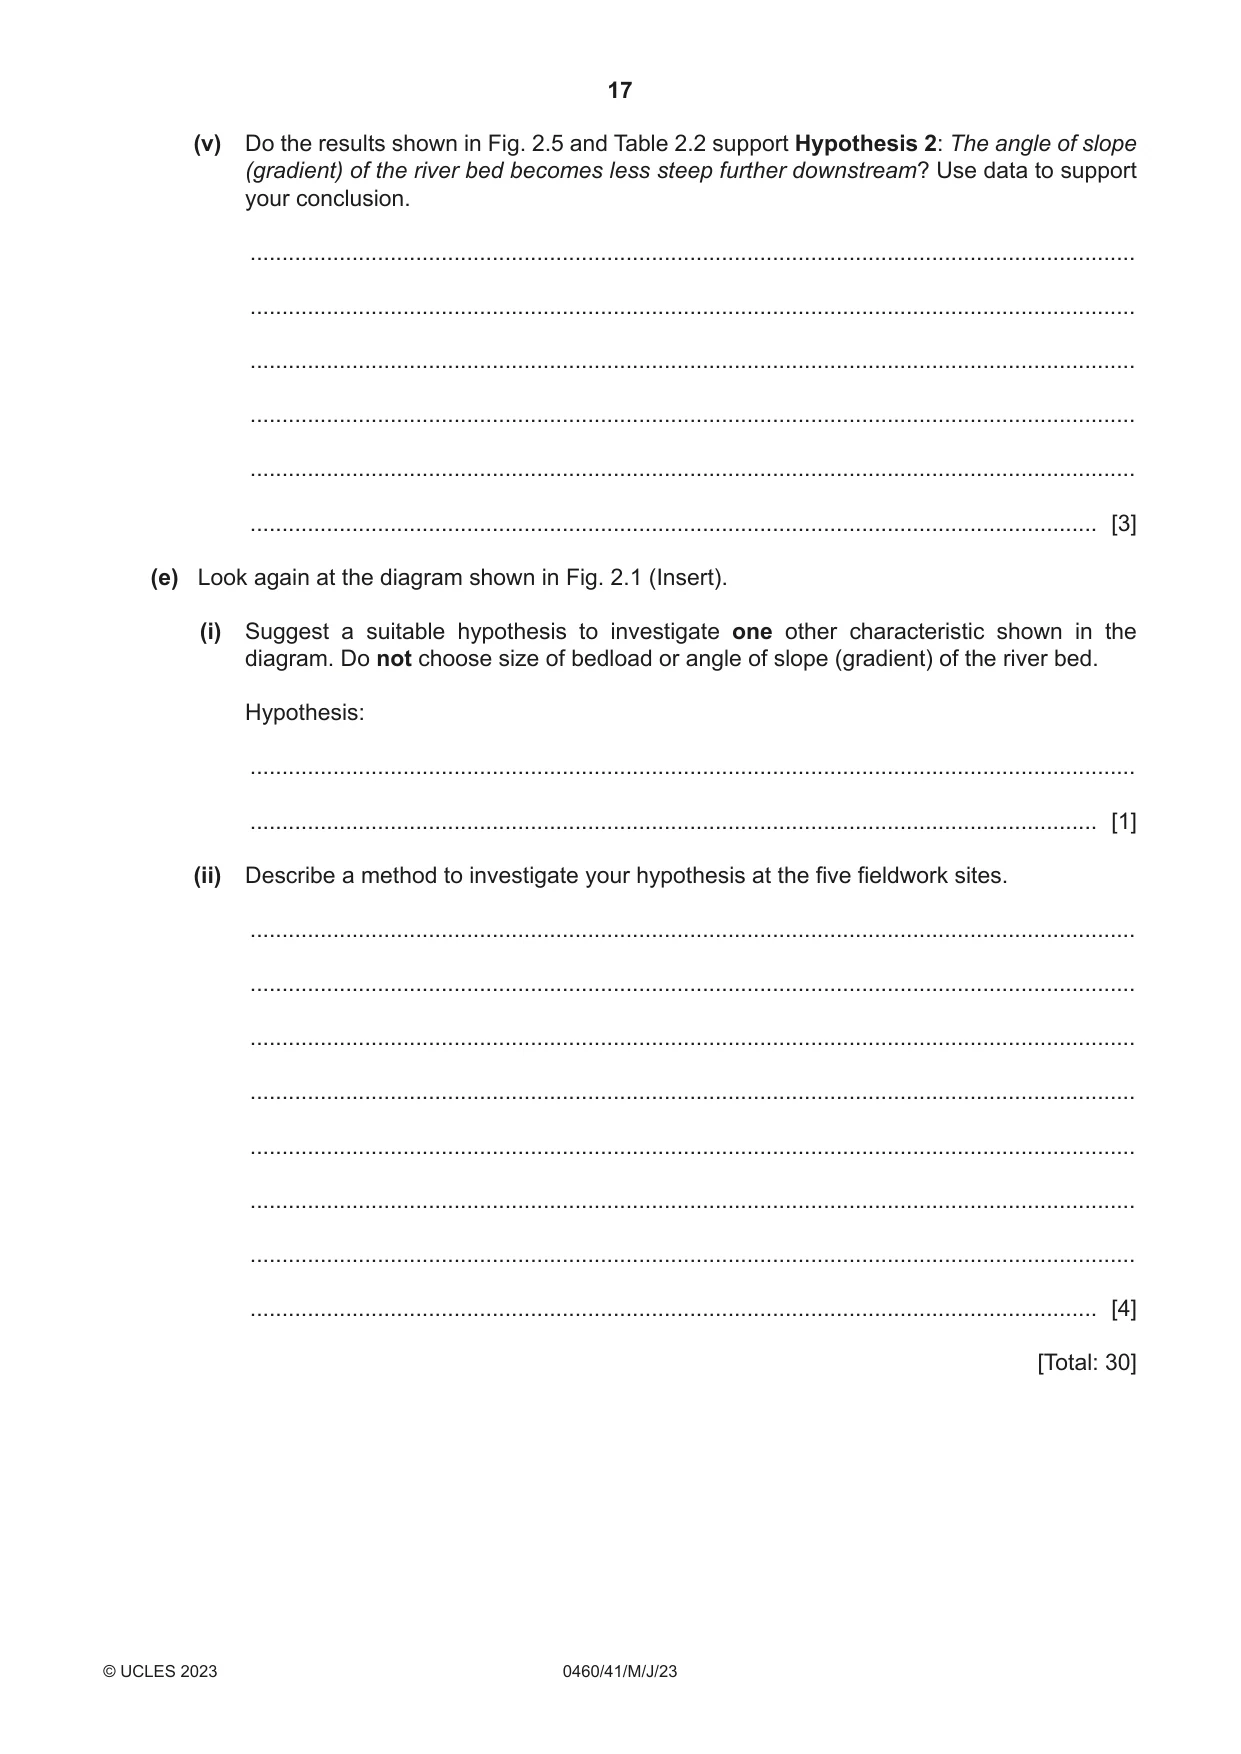
2 A group of students in Thailand studied how the characteristics of a river change downstream. The characteristics are shown in Fig. 2.1 (Insert). The students decided to investigate two characteristics by testing the following hypotheses at five sites along the River Huai Kup Kap: Hypothesis 1: Pebbles on the river bed (bedload) become smaller further downstream. Hypothesis 2: The angle of slope (gradient) of the river bed becomes less steep further downstream. (a) Before they began their work, the students did a pilot study at a site on the river. Identify two advantages of doing a pilot study from the table. Tick (✓) two choices. tick (✓) draw a field sketch of the river’s course get to know other students before they begin fieldwork learn how to work safely in the river practise fieldwork techniques look at different features along the river [2] (b) To investigate Hypothesis 1: Pebbles on the river bed (bedload) become smaller further downstream, the students selected 20 pebbles from the bed of the river at each site. (i) Which piece of fieldwork equipment from the table did the students use when they measured the length of each pebble? Tick (✓) your choice. equipment tick (✓) callipers hygrometer quadrat ranging pole [1] (ii) The students’ results at site 3 are shown in Table 2.1 (Insert). Use these res complete Fig. 2.2. Length of selected pebbles 12 site 1 (upstream) 10 average size = 633 mm 8 number of 6 pebbles 4 12 site 2 2 10 average size = 806 mm 0 8 0– 301– 601– 901– 1201– 300 600 900 1200 1500 number of 6 length of pebbles (mm) pebbles 12 4 sitesite 33 10 averageaverage 2 sizesize == 956956 mmmm 8 0 0– 301– 601– 901– 1201– number 300 600 900 1200 1500 of 6 length of pebbles (mm) pebbles 4 12 2 site 4 average 10 0 size = 405 mm 0– 301– 601– 901– 1201– 300 600 900 1200 1500 8 length of pebbles (mm) number of 6 12 pebbles site 5 (downstream) 4 10 average size = 750 mm 2 8 number 0 of 6 0– 301– 601– 901– 1201– 300 600 900 1200 1500pebbles length of pebbles (mm) 4 2 0 0– 301– 601– 901– 1201– 300 600 900 1200 1500 length of pebbles (mm) Fig. 2.2 (iii) The students decided that Hypothesis 1: Pebbles on the river bed (bedload) become smaller further downstream was false. Use evidence from Fig. 2.2 and Table 2.1 to support this decision. ........................................................................................................................................... ........................................................................................................................................... ........................................................................................................................................... ........................................................................................................................................... ........................................................................................................................................... ..................................................................................................................................... [3] (c) The students’ results do not support the change in bedload size shown in Fig. 2.1. (i) Explain why pebbles on the river bed usually become smaller further downstream as shown in Fig. 2.1. ........................................................................................................................................... ........................................................................................................................................... ........................................................................................................................................... ........................................................................................................................................... ........................................................................................................................................... ..................................................................................................................................... [3] (ii) Suggest how the following could have improved the reliability of the students’ fieldwork method. measure 40 pebbles at each site ........................................................................................................................................... ........................................................................................................................................... two students individually measure the length of each pebble ........................................................................................................................................... ..................................................................................................................................... [2]
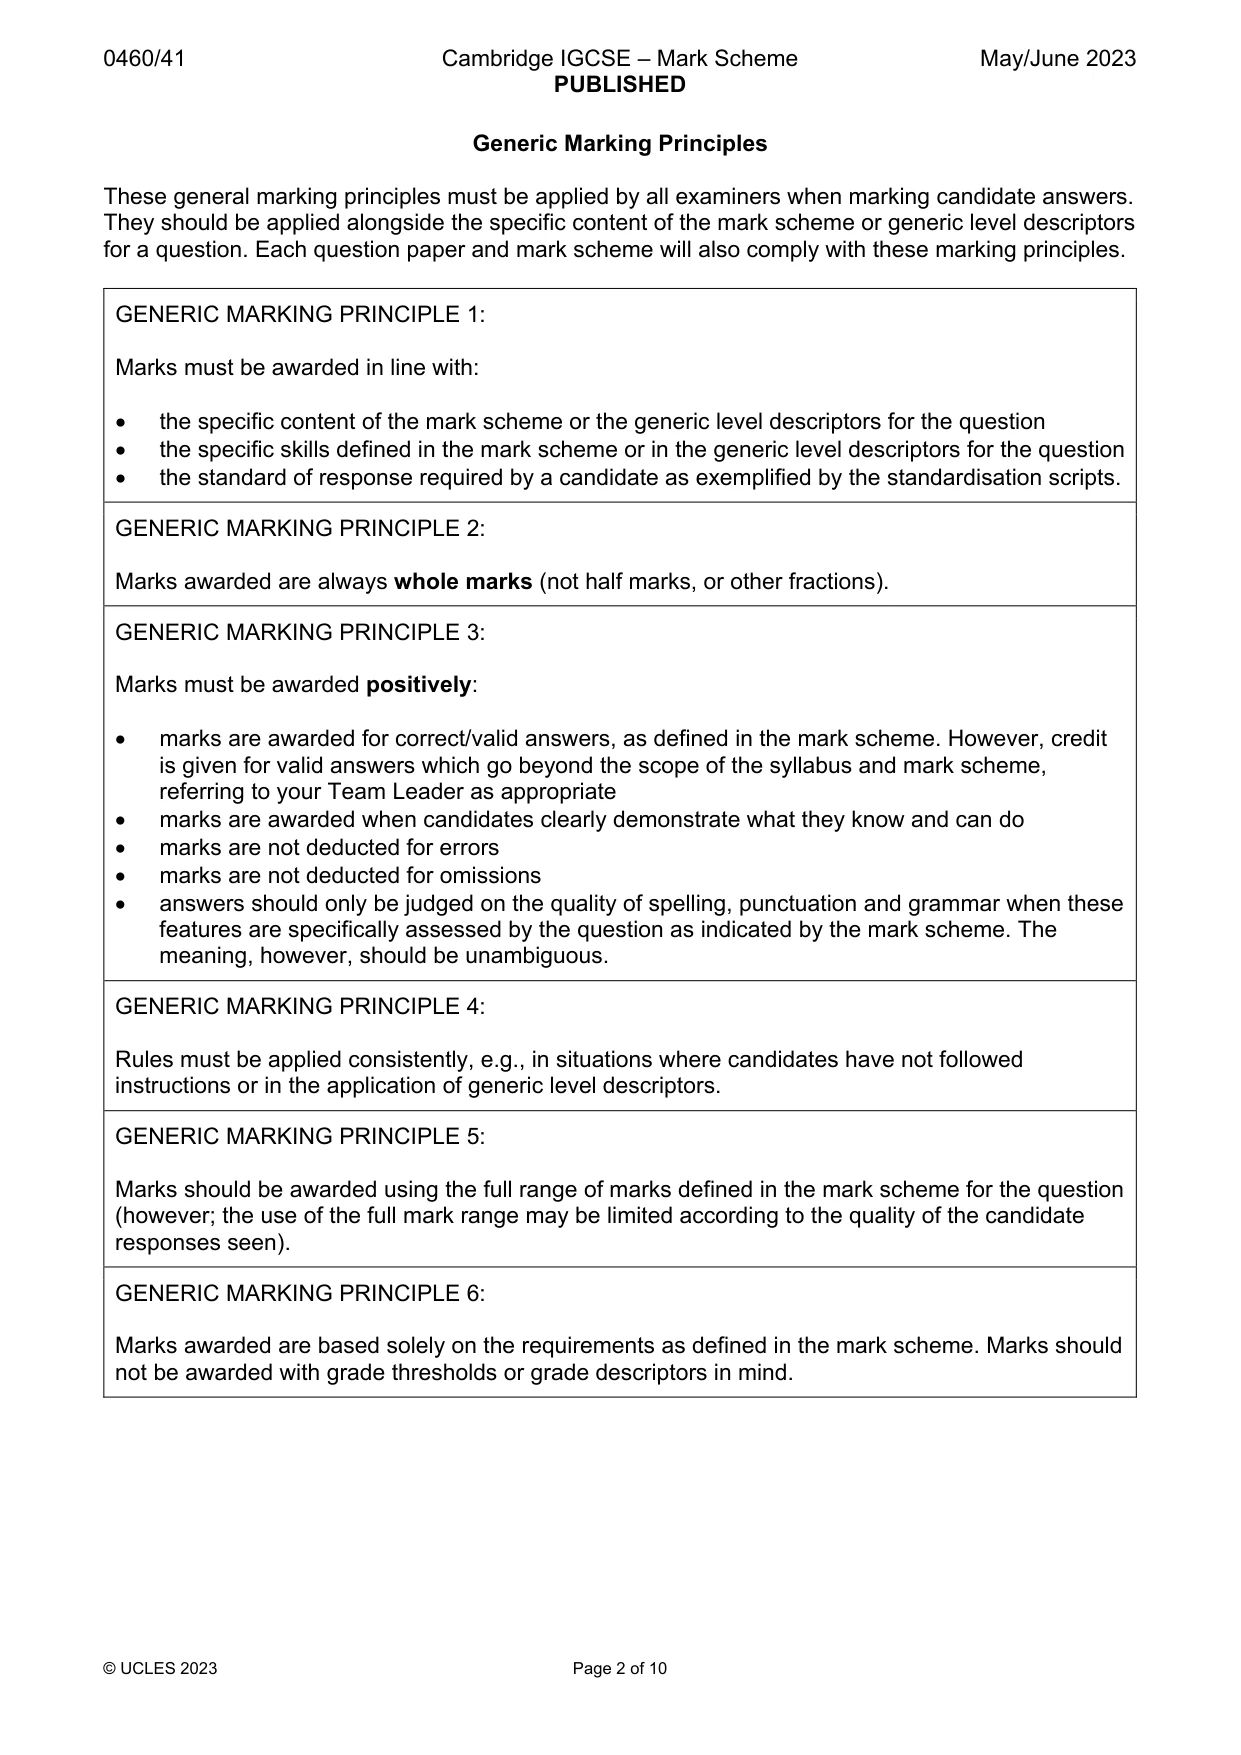
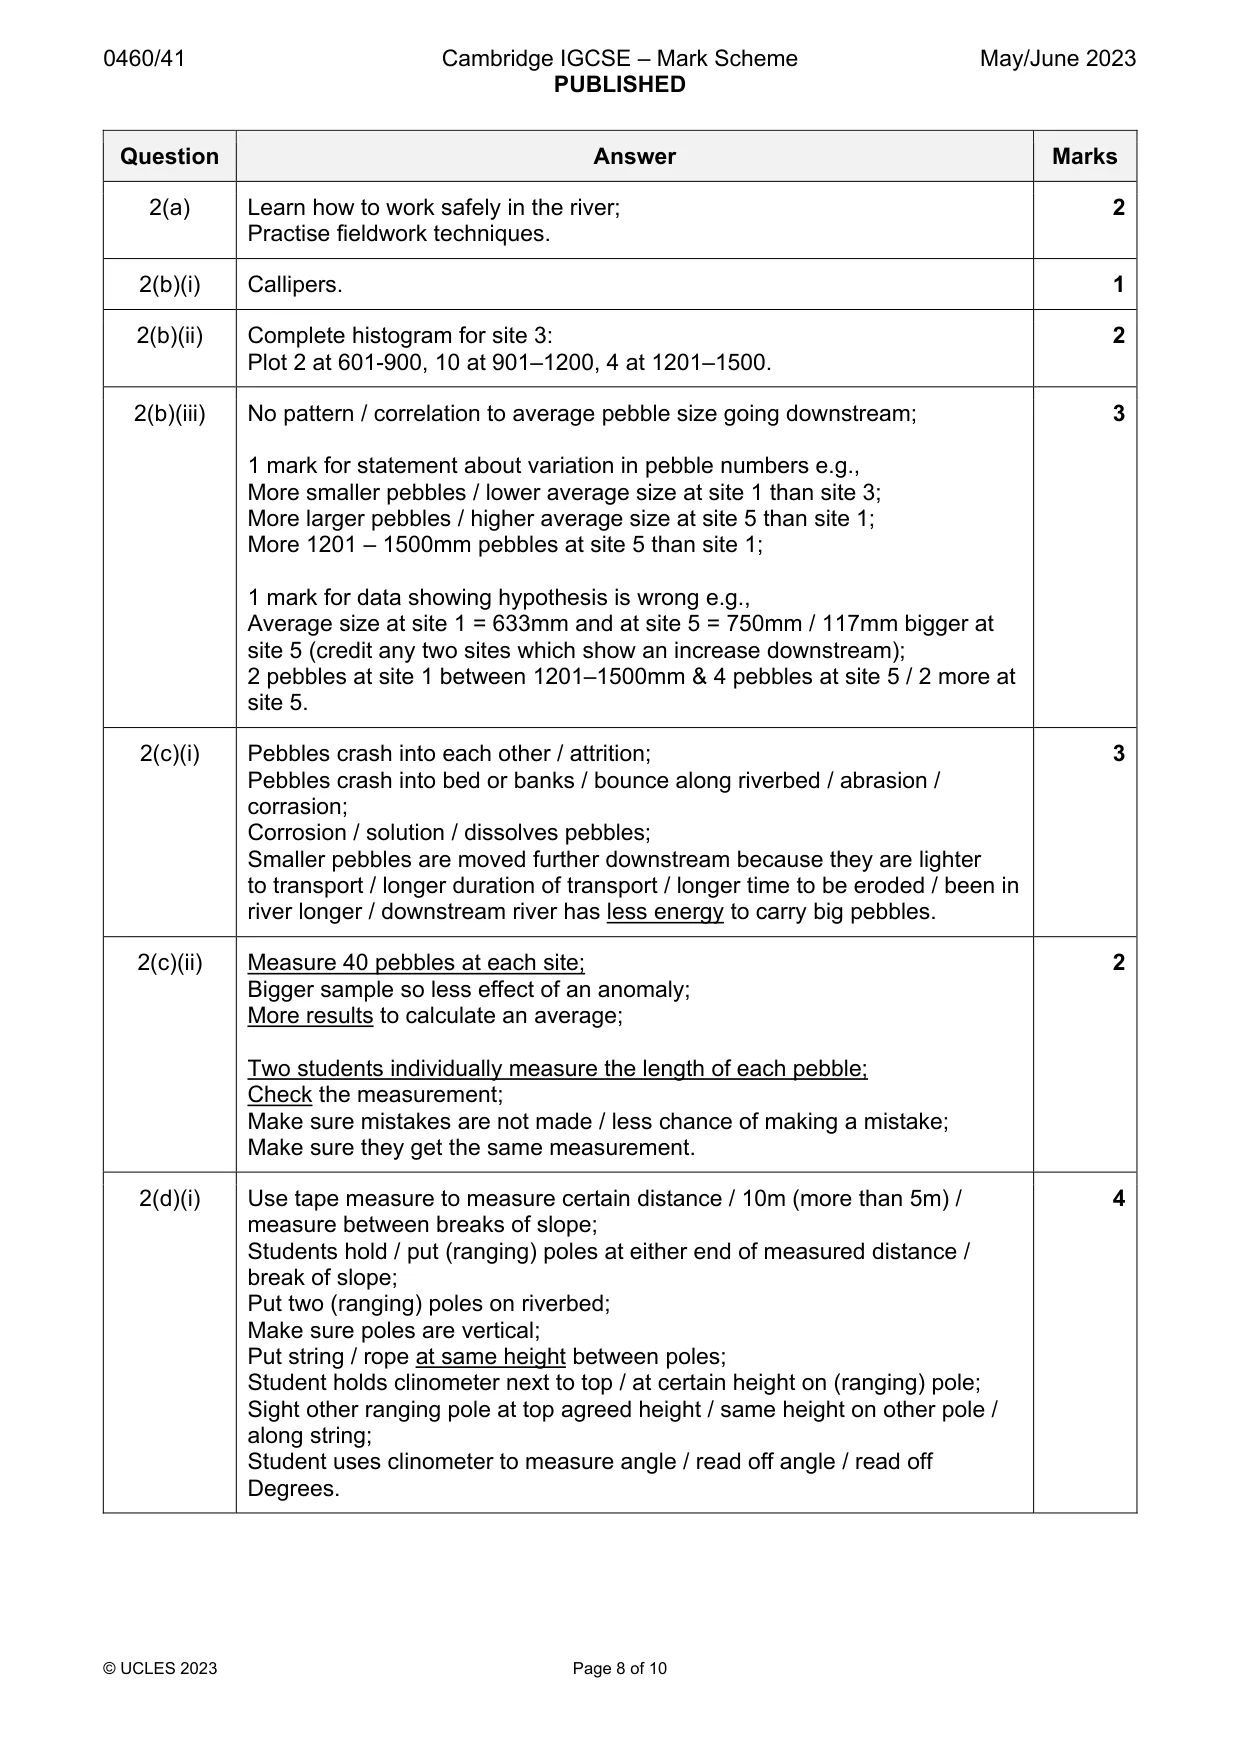
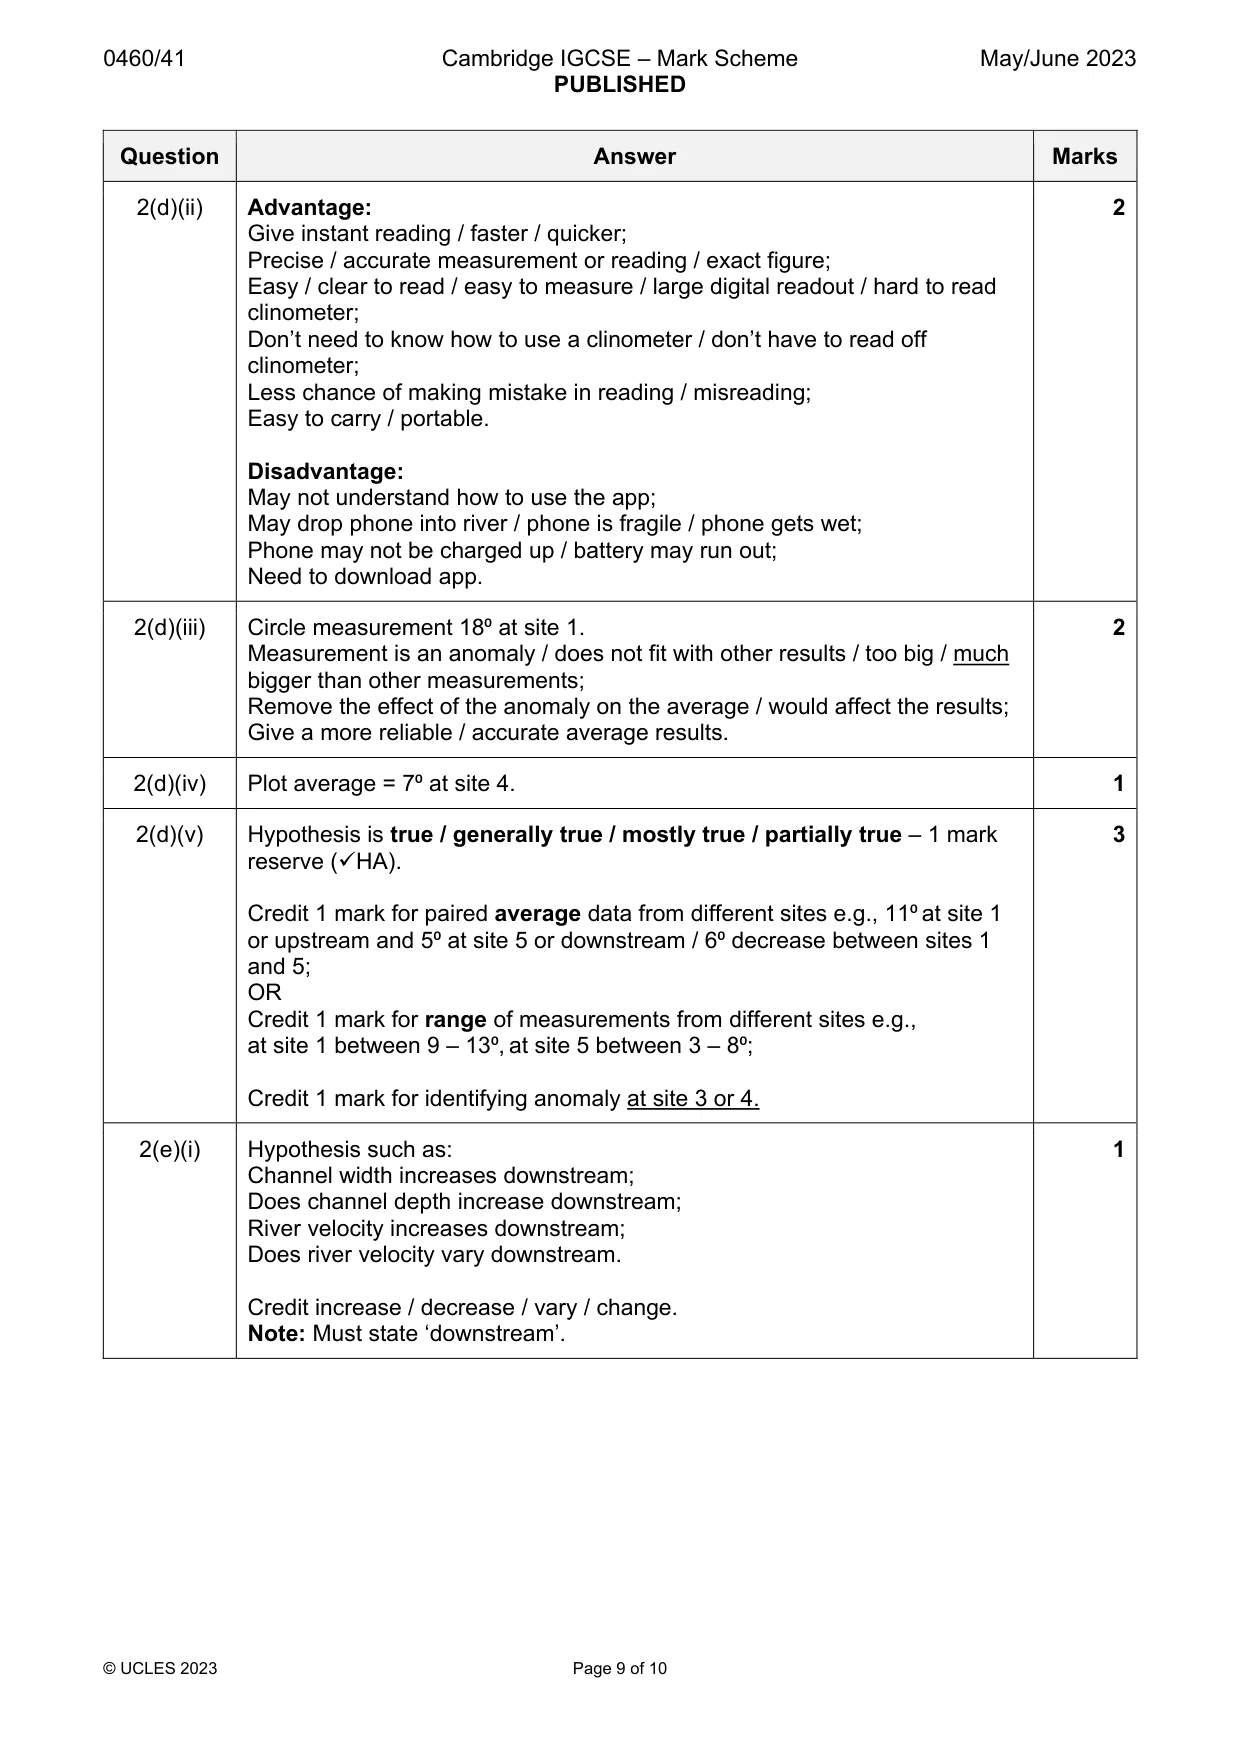
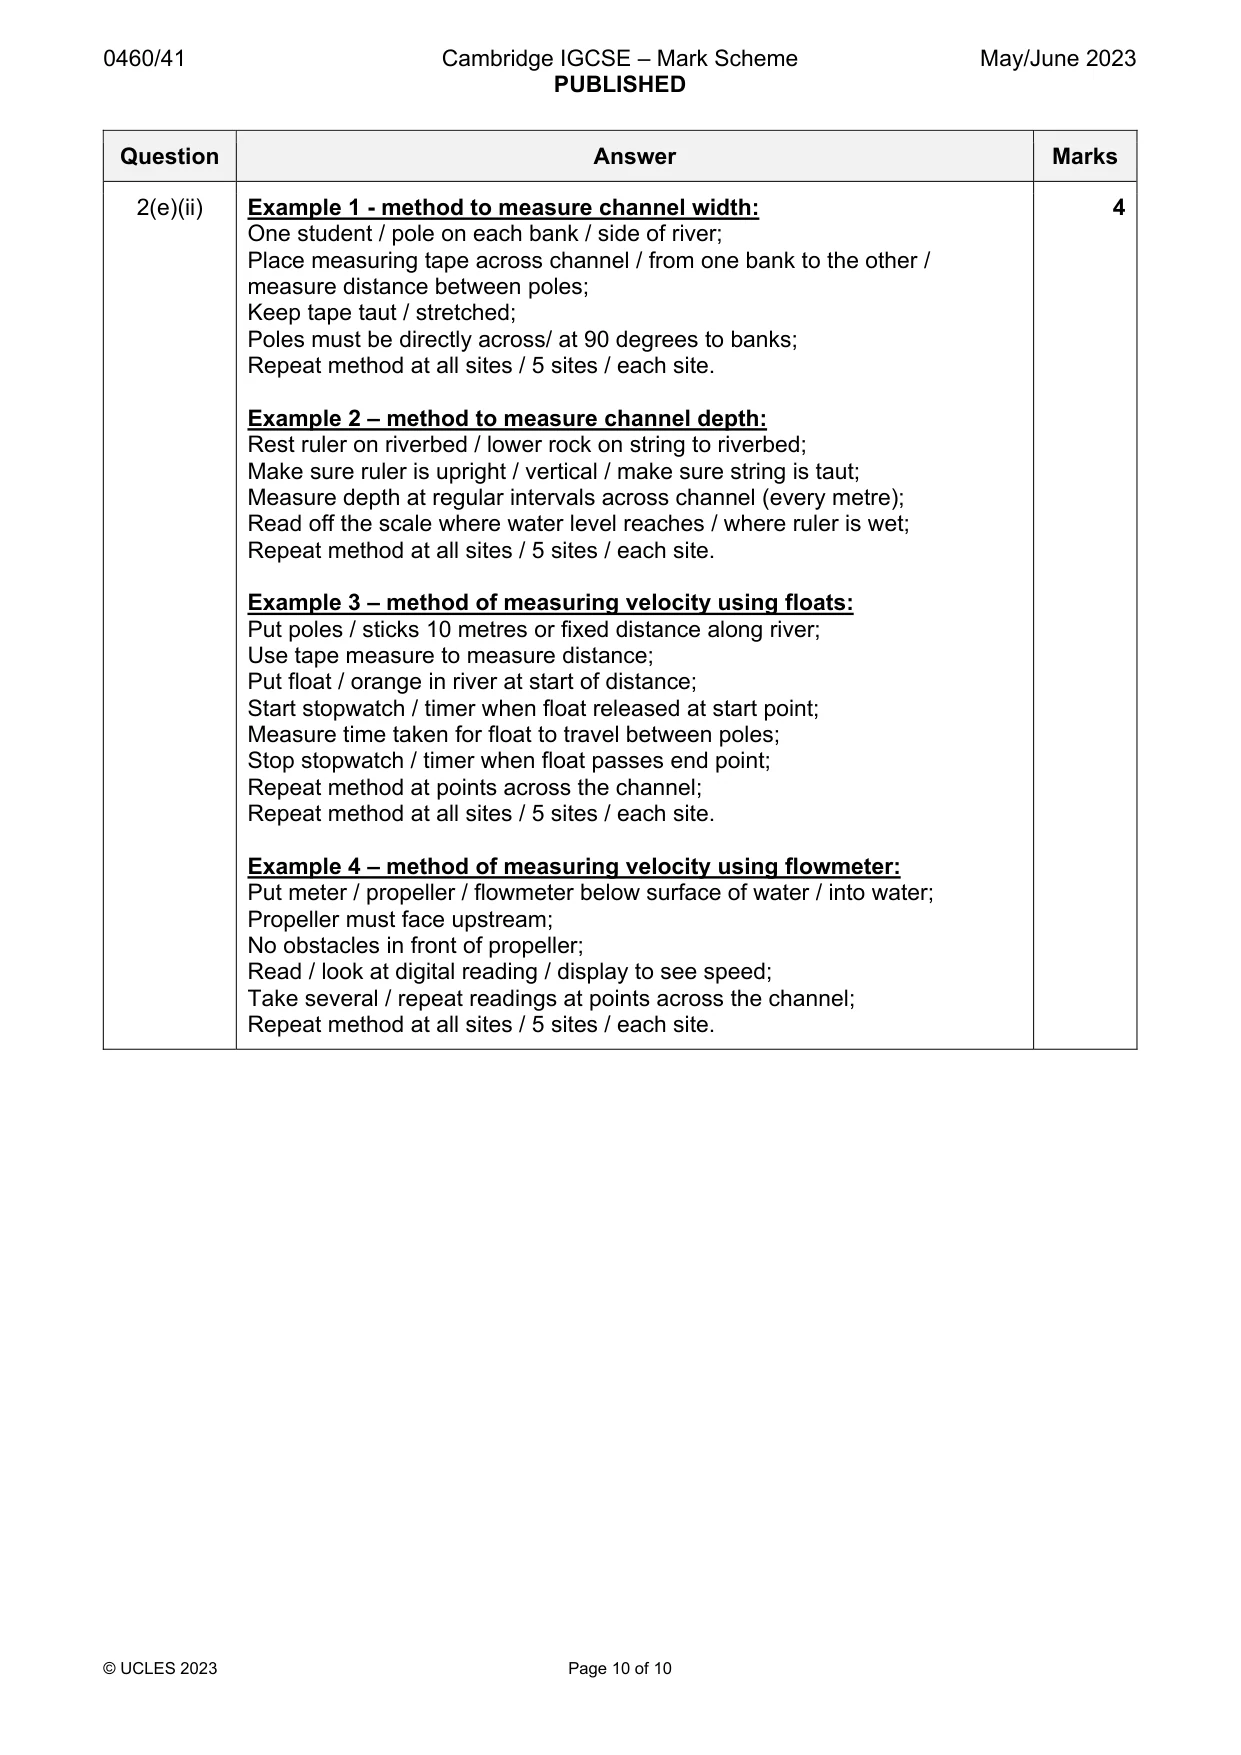
Mark scheme: 2(a) Learn how to work safely in the river; 2 Practise fieldwork techniques. 2(b)(i) Callipers. 1 2(b)(ii) Complete histogram for site 3: 2 Plot 2 at 601-900, 10 at 901–1200, 4 at 1201–1500. 2(b)(iii) No pattern / correlation to average pebble size going downstream; 3 1 mark for statement about variation in pebble numbers e.g., More smaller pebbles / lower average size at site 1 than site 3; More larger pebbles / higher average size at site 5 than site 1; More 1201 – 1500mm pebbles at site 5 than site 1; 1 mark for data showing hypothesis is wrong e.g., Average size at site 1 = 633mm and at site 5 = 750mm / 117mm bigger at site 5 (credit any two sites which show an increase downstream); 2 pebbles at site 1 between 1201–1500mm & 4 pebbles at site 5 / 2 more at site 5. 2(c)(i) Pebbles crash into each other / attrition; 3 Pebbles crash into bed or banks / bounce along riverbed / abrasion / corrasion; Corrosion / solution / dissolves pebbles; Smaller pebbles are moved further downstream because they are lighter to transport / longer duration of transport / longer time to be eroded / been in river longer / downstream river has less energy to carry big pebbles. 2(c)(ii) Measure 40 pebbles at each site; 2 Bigger sample so less effect of an anomaly; More results to calculate an average; Two students individually measure the length of each pebble; Check the measurement; Make sure mistakes are not made / less chance of making a mistake; Make sure they get the same measurement. 2(d)(i) Use tape measure to measure certain distance / 10m (more than 5m) / 4 measure between breaks of slope; Students hold / put (ranging) poles at either end of measured distance / break of slope; Put two (ranging) poles on riverbed; Make sure poles are vertical; Put string / rope at same height between poles; Student holds clinometer next to top / at certain height on (ranging) pole; Sight other ranging pole at top agreed height / same height on other pole / along string; Student uses clinometer to measure angle / read off angle / read off Degrees. 2(d)(ii) Advantage: 2 Give instant reading / faster / quicker; Precise / accurate measurement or reading / exact figure; Easy / clear to read / easy to measure / large digital readout / hard to read clinometer; Don’t need to know how to use a clinometer / don’t have to read off clinometer; Less chance of making mistake in reading / misreading; Easy to carry / portable. Disadvantage: May not understand how to use the app; May drop phone into river / phone is fragile / phone gets wet; Phone may not be charged up / battery may run out; Need to download app. 2(d)(iii) Circle measurement 18⁰ at site 1. 2 Measurement is an anomaly / does not fit with other results / too big / much bigger than other measurements; Remove the effect of the anomaly on the average / would affect the results; Give a more reliable / accurate average results. 2(d)(iv) Plot average = 7⁰ at site 4. 1 2(d)(v) Hypothesis is true / generally true / mostly true / partially true – 1 mark 3 reserve (HA). Credit 1 mark for paired average data from different sites e.g., 11⁰ at site 1 or upstream and 5⁰ at site 5 or downstream / 6⁰ decrease between sites 1 and 5; OR Credit 1 mark for range of measurements from different sites e.g., at site 1 between 9 – 13⁰, at site 5 between 3 – 8⁰; Credit 1 mark for identifying anomaly at site 3 or 4. 2(e)(i) Hypothesis such as: 1 Channel width increases downstream; Does channel depth increase downstream; River velocity increases downstream; Does river velocity vary downstream. Credit increase / decrease / vary / change. Note: Must state ‘downstream’. 2(e)(ii) Example 1 - method to measure channel width: 4 One student / pole on each bank / side of river; Place measuring tape across channel / from one bank to the other / measure distance between poles; Keep tape taut / stretched; Poles must be directly across/ at 90 degrees to banks; Repeat method at all sites / 5 sites / each site. Example 2 – method to measure channel depth: Rest ruler on riverbed / lower rock on string to riverbed; Make sure ruler is upright / vertical / make sure string is taut; Measure depth at regular intervals across channel (every metre); Read off the scale where water level reaches / where ruler is wet; Repeat method at all sites / 5 sites / each site. Example 3 – method of measuring velocity using floats: Put poles / sticks 10 metres or fixed distance along river; Use tape measure to measure distance; Put float / orange in river at start of distance; Start stopwatch / timer when float released at start point; Measure time taken for float to travel between poles; Stop stopwatch / timer when float passes end point; Repeat method at points across the channel; Repeat method at all sites / 5 sites / each site. Example 4 – method of measuring velocity using flowmeter: Put meter / propeller / flowmeter below surface of water / into water; Propeller must face upstream; No obstacles in front of propeller; Read / look at digital reading / display to see speed; Take several / repeat readings at points across the channel; Repeat method at all sites / 5 sites / each site.
What was in this paper
The subtopics covered by these 2 questions, and how many questions each got. Open one in a new tab to see every Cambridge question on it.
What you needed in this session
Cambridge’s own grade thresholds for 2023 May/June, Paper 4 · Variant 1. A higher threshold means an easier paper — the bar moves with how the cohort did.