Cambridge IGCSE Geography 0460 — 2023 Oct/Nov Paper 4 · Variant 1
0460/41/O/N/23 · 2 questions · 60 marks · ≈68 min
The question paper and its mark scheme, free to read here and free to download. This is Cambridge’s own paper, exactly as it was sat.
Question paper20 pages



Mark scheme10 pages
Answers below. Sit the paper first if you are practising.
Questions as text
Q1 · Students from a school in Singapore, a country in Southeast Asia, were studying tourism
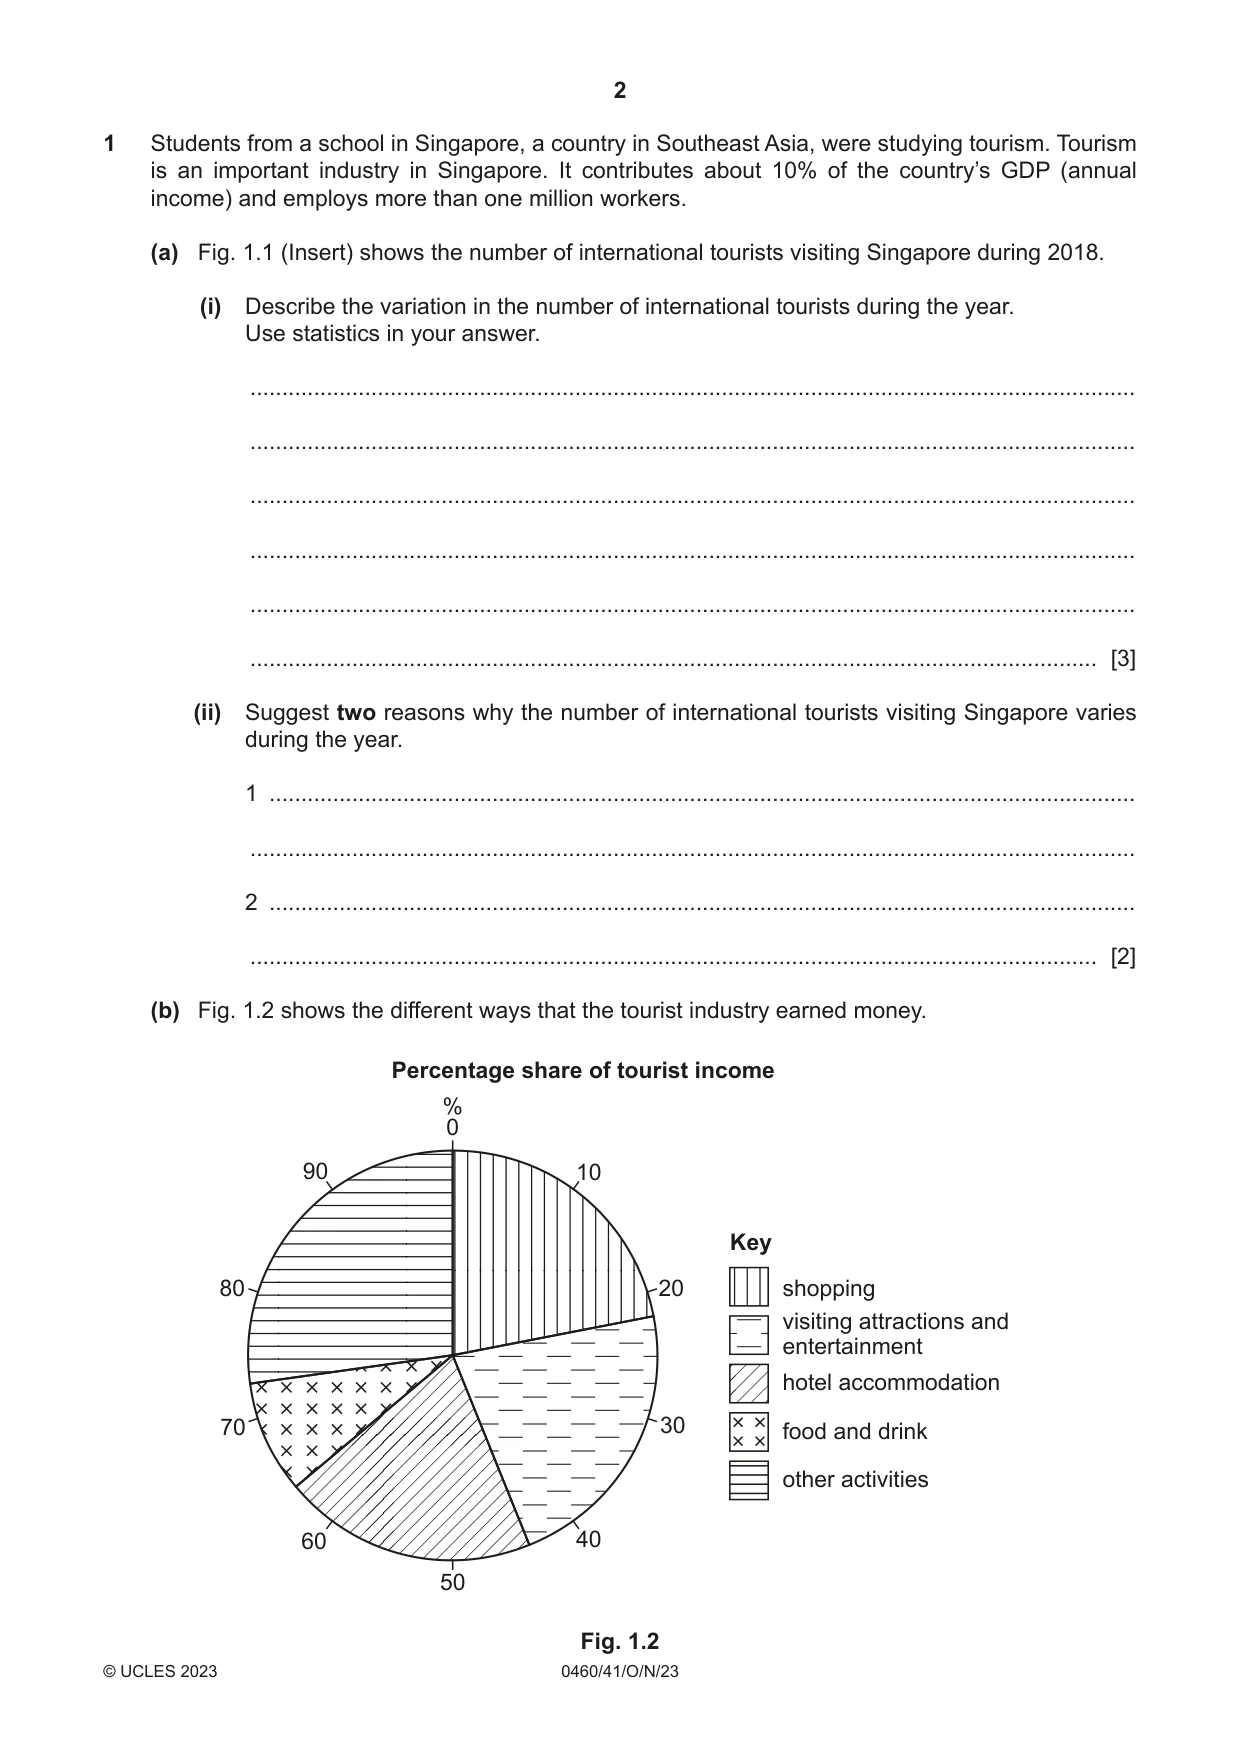
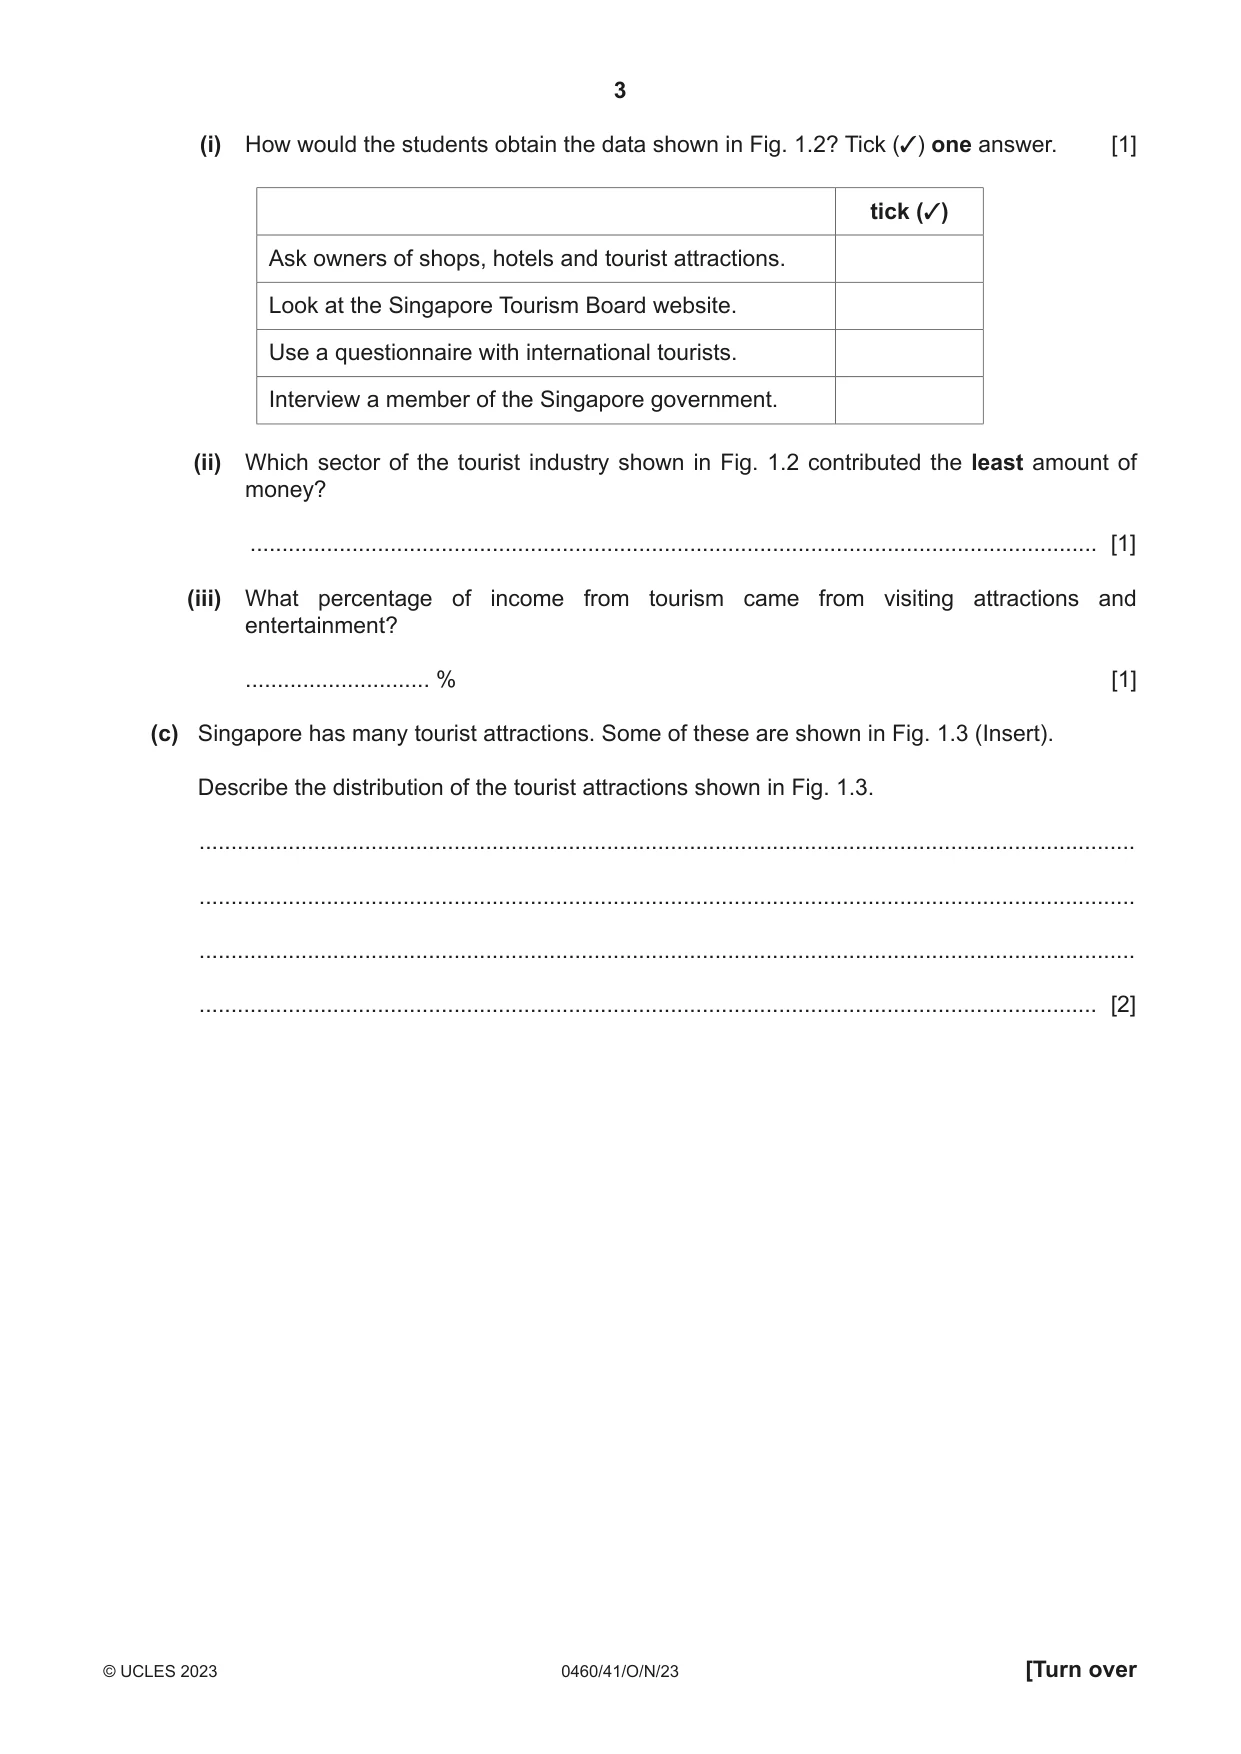
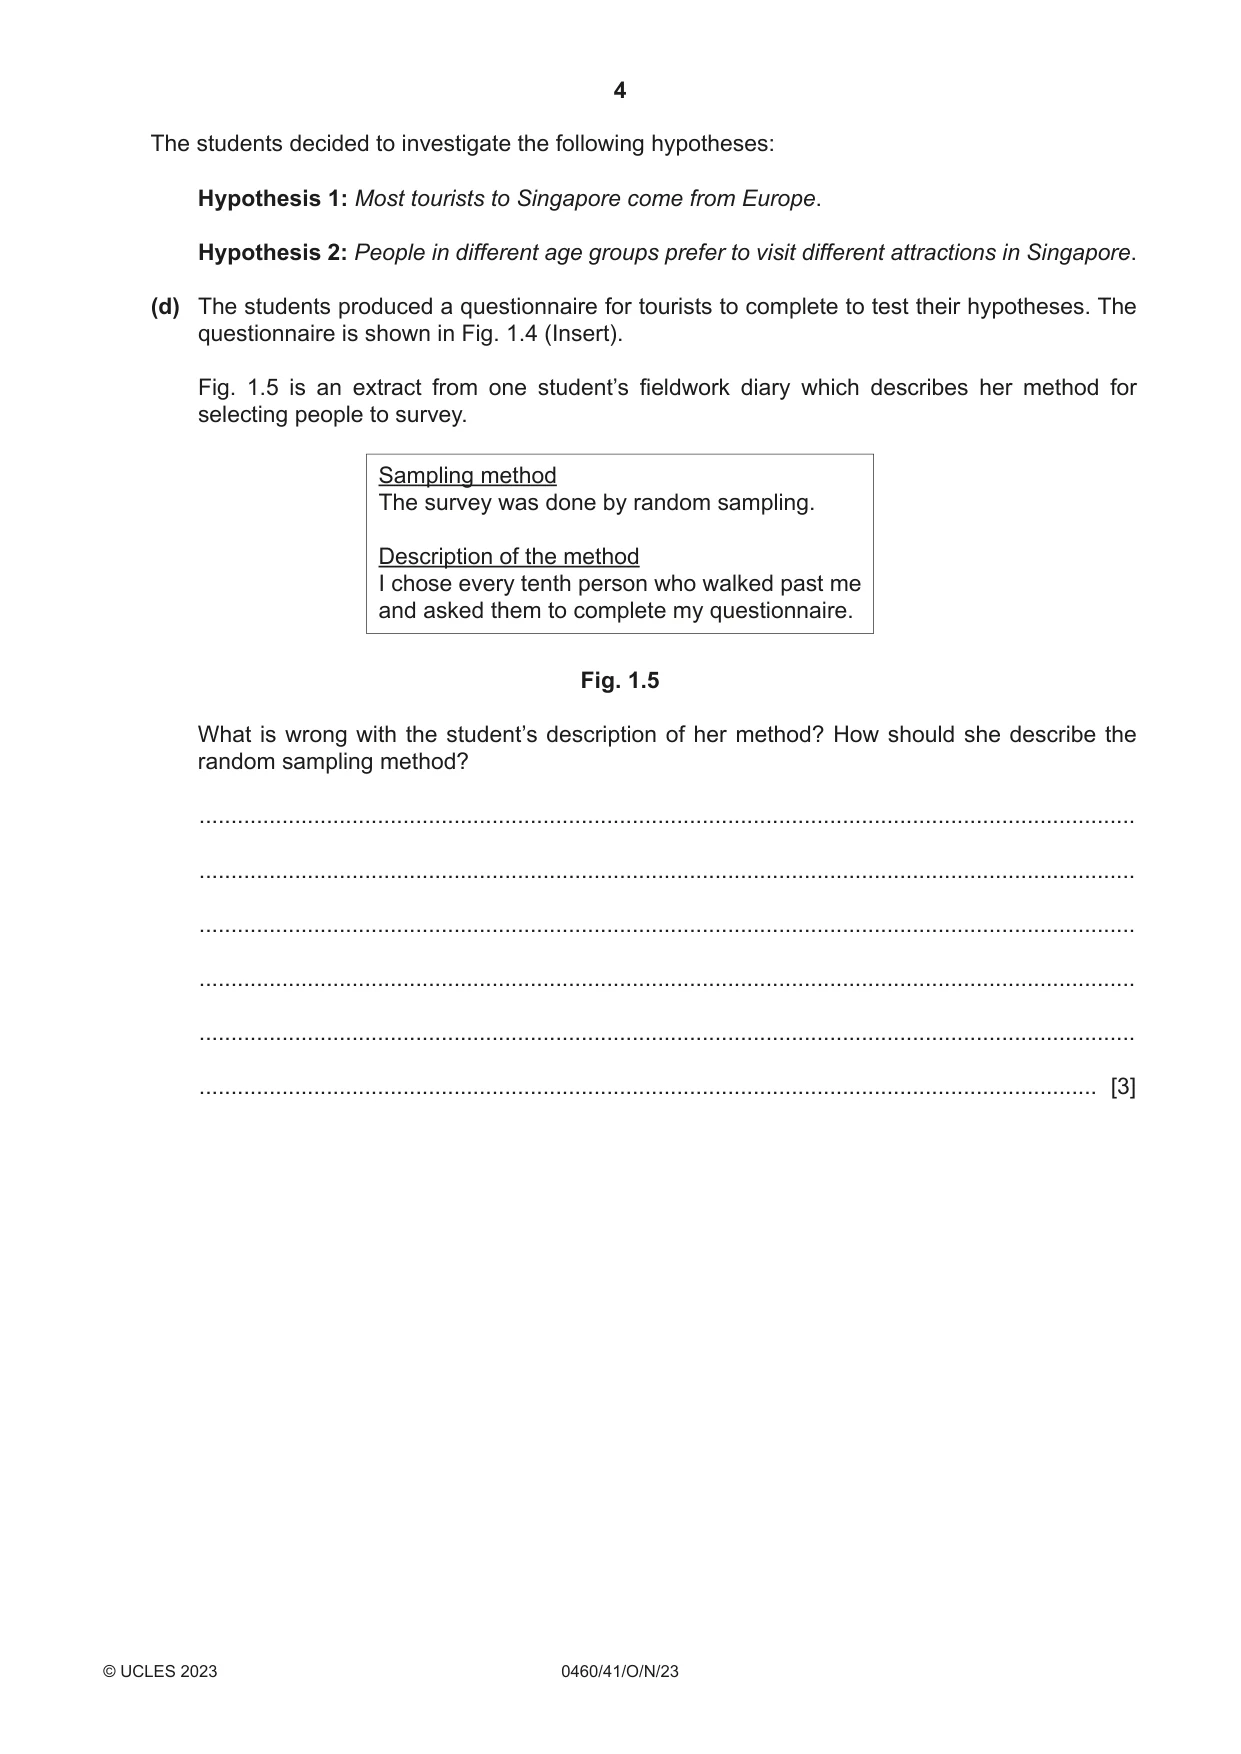
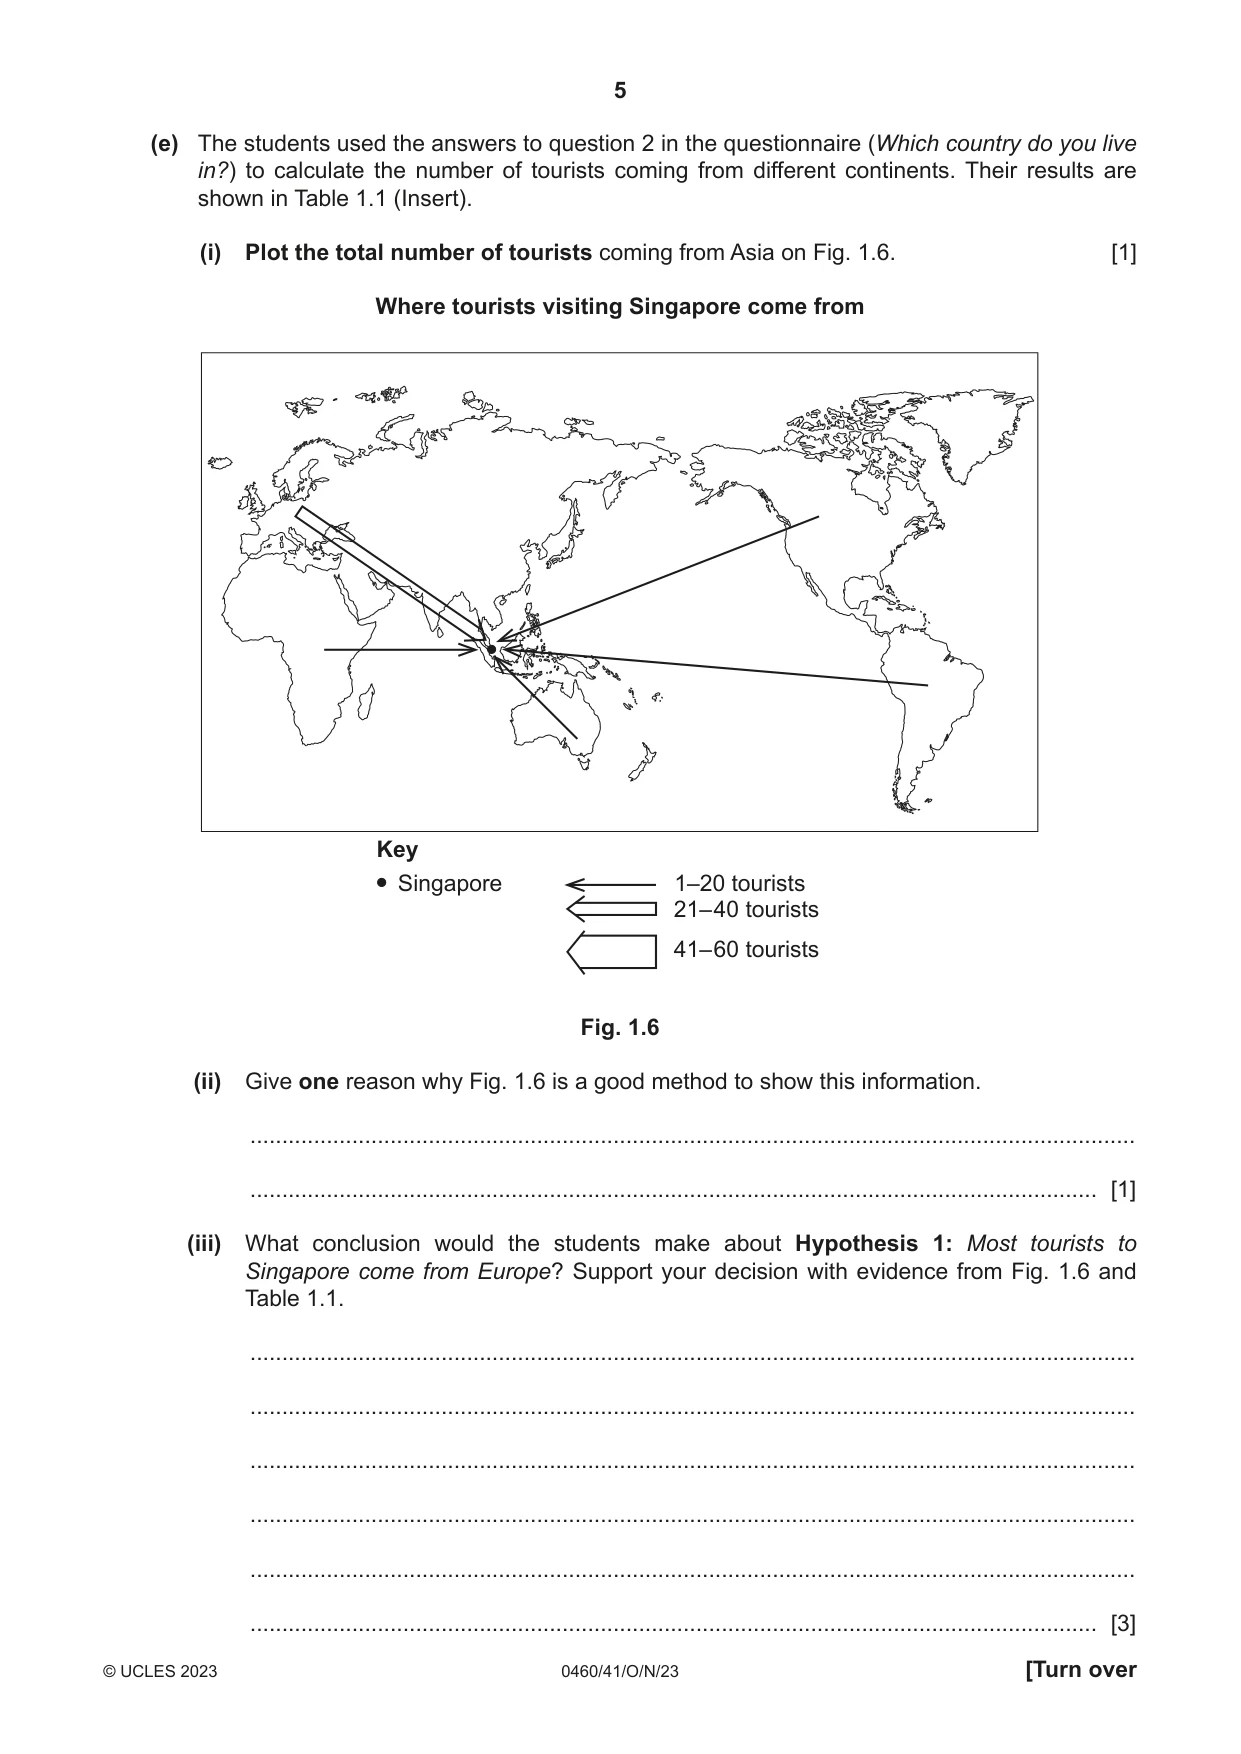
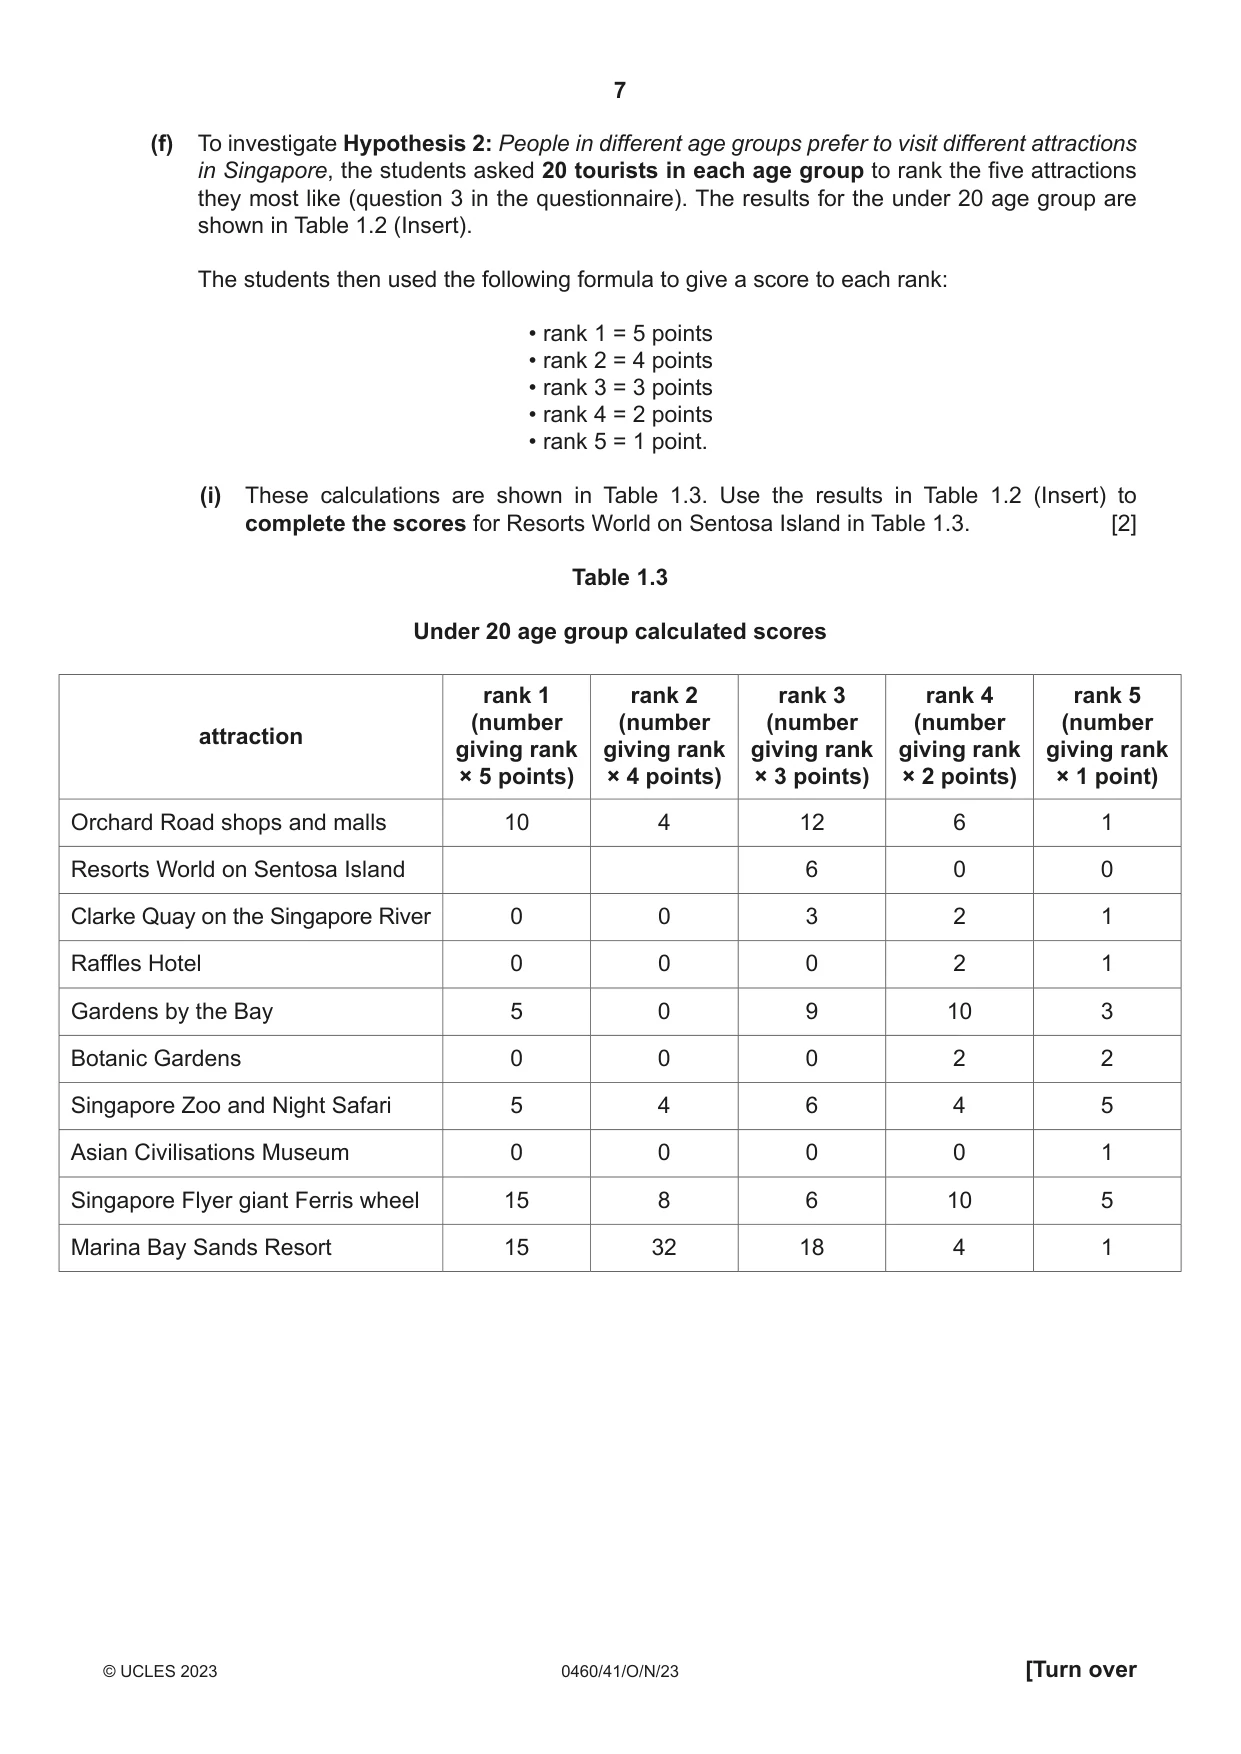
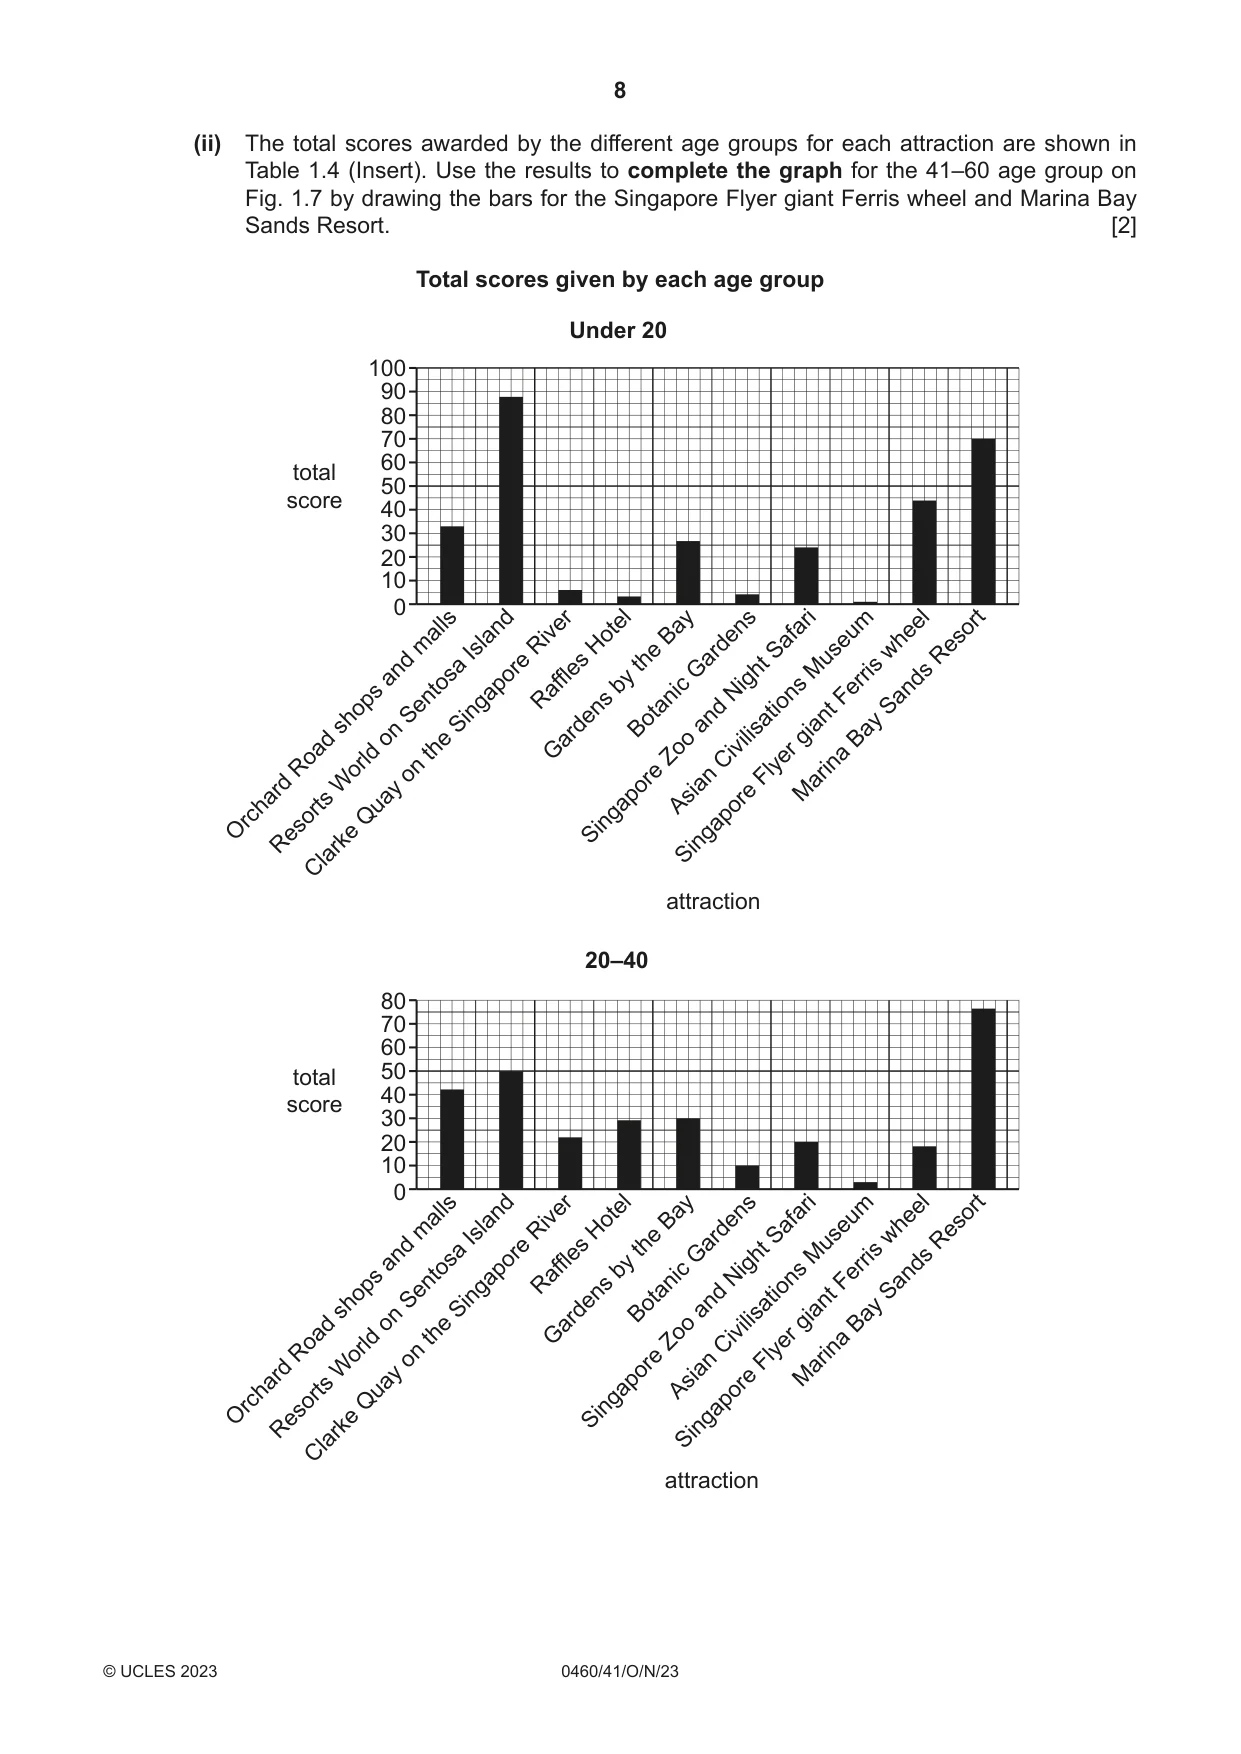
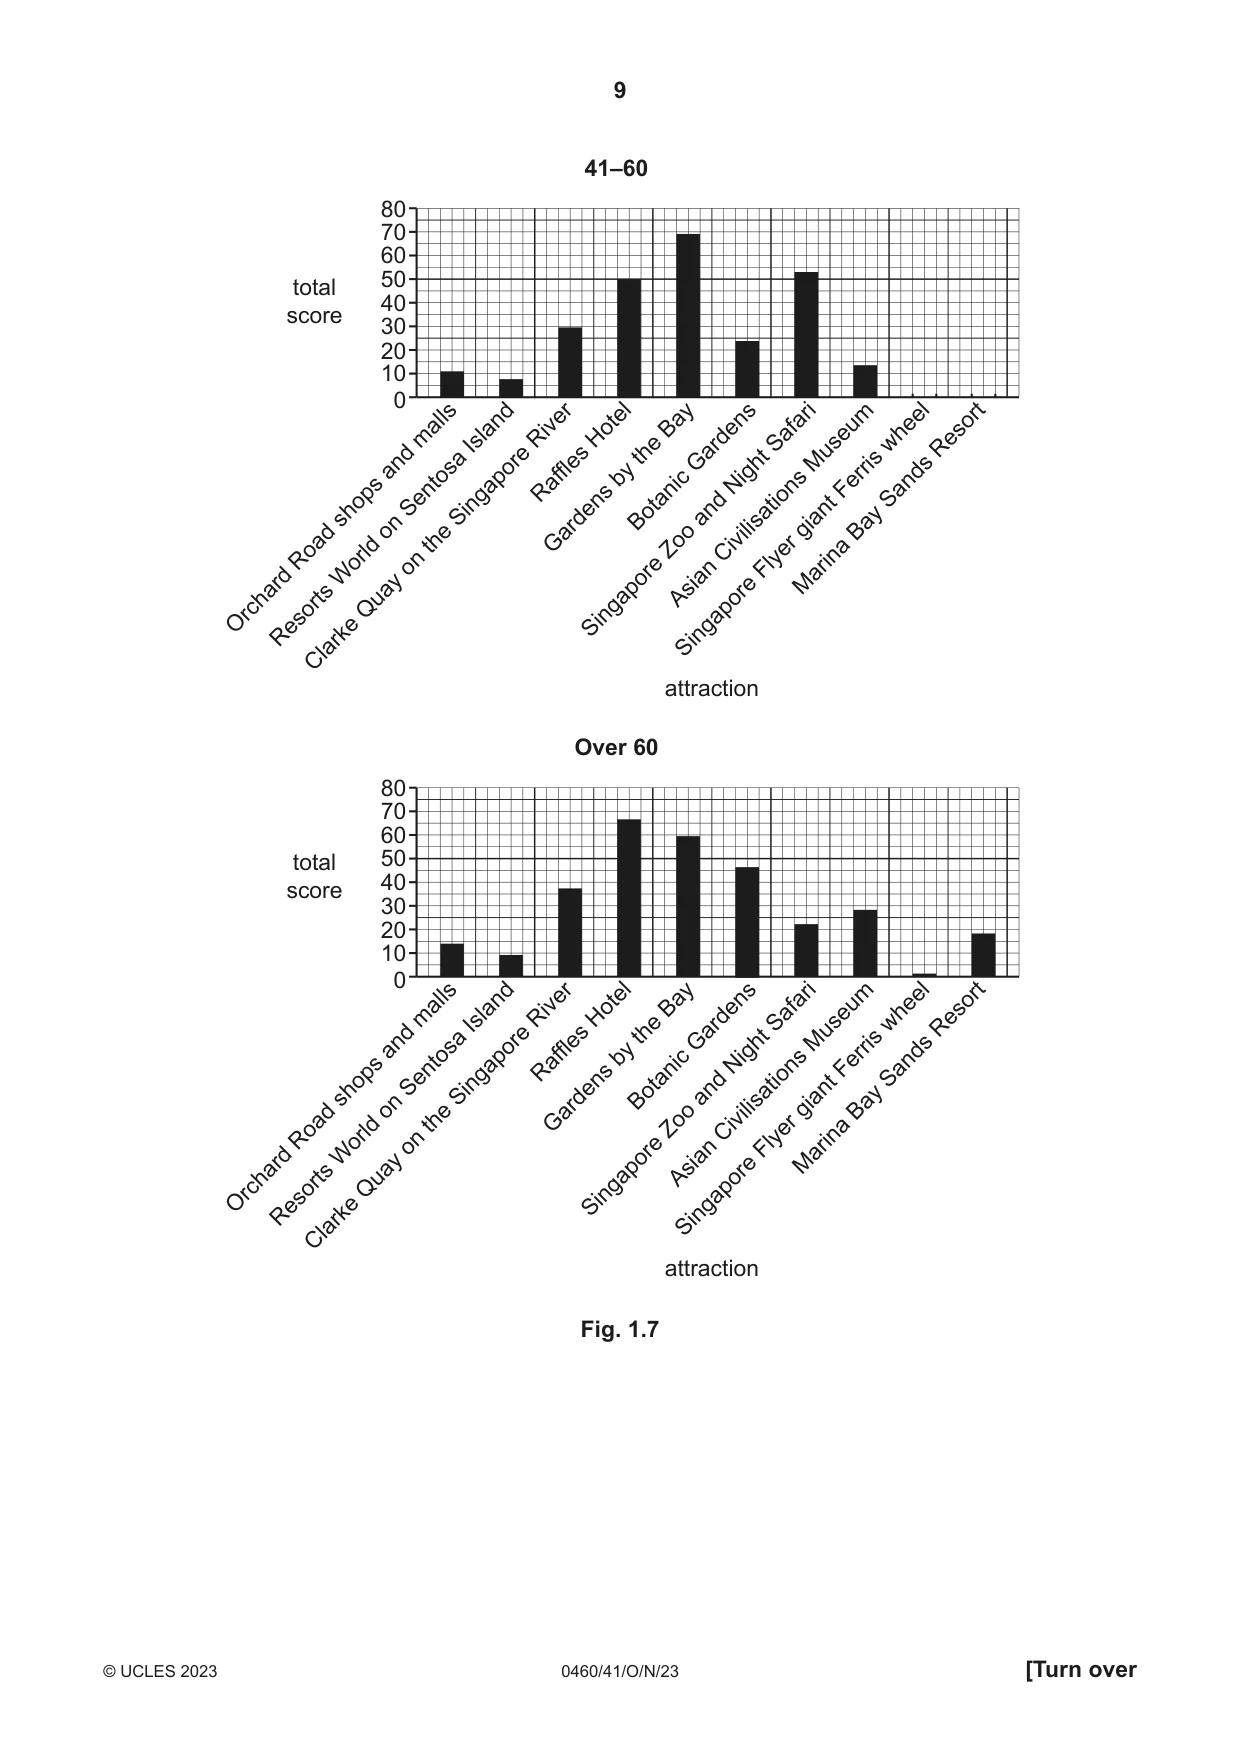
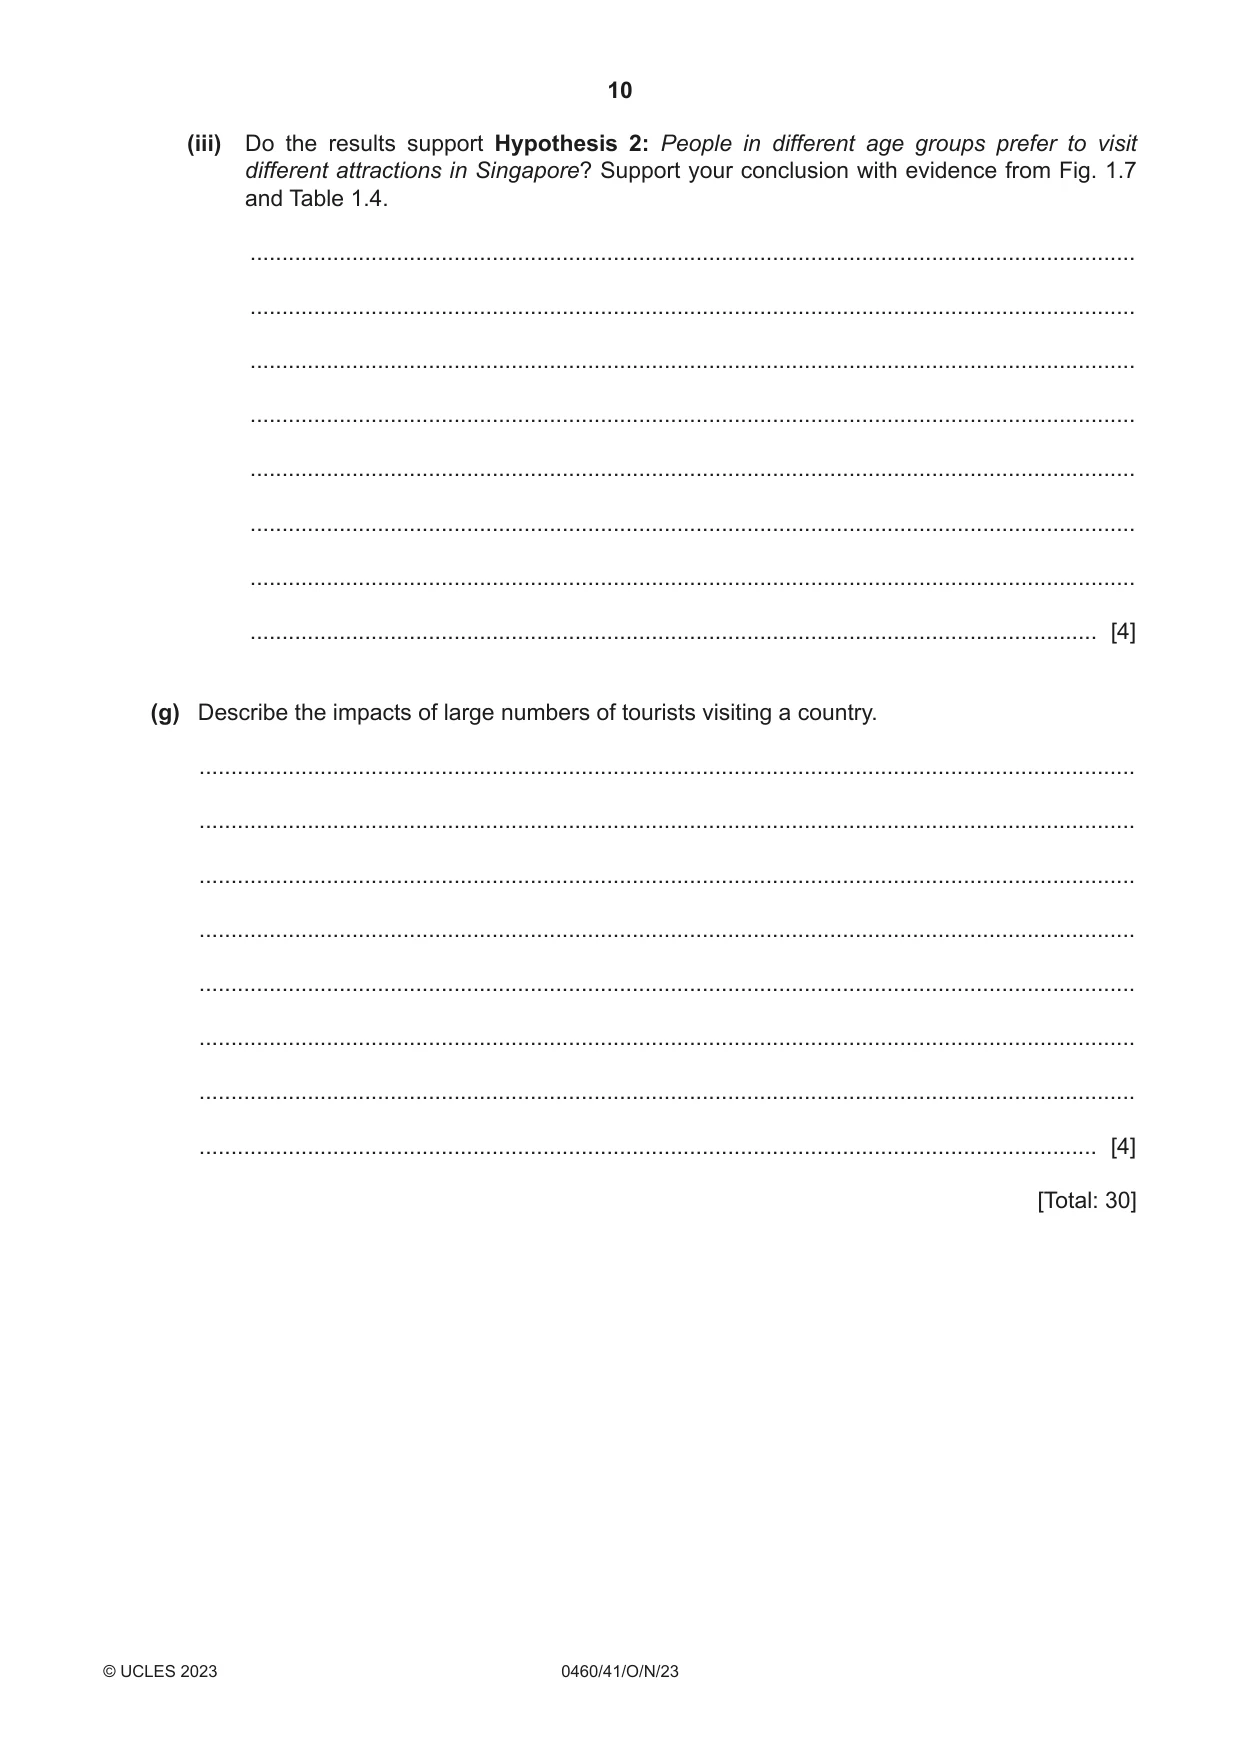
1 Students from a school in Singapore, a country in Southeast Asia, were studying tourism. Tourism is an important industry in Singapore. It contributes about 10% of the country’s GDP (annual income) and employs more than one million workers. (a) Fig. 1.1 (Insert) shows the number of international tourists visiting Singapore during 2018. (i) Describe the variation in the number of international tourists during the year. Use statistics in your answer. ........................................................................................................................................... ........................................................................................................................................... ........................................................................................................................................... ........................................................................................................................................... ........................................................................................................................................... ..................................................................................................................................... [3] (ii) Suggest two reasons why the number of international tourists visiting Singapore varies during the year. 1 ........................................................................................................................................ ........................................................................................................................................... 2 ........................................................................................................................................ ..................................................................................................................................... [2] (b) Fig. 1.2 shows the different ways that the tourist industry earned money. Percentage share of tourist income % 0 90 10 Key 80 20 shopping visiting attractions and entertainment hotel accommodation 70 30 food and drink other activities 60 40 50 Fig. 1.2 (i) How would the students obtain the data shown in Fig. 1.2? Tick (3) one answer. [1] tick (3) Ask owners of shops, hotels and tourist attractions. Look at the Singapore Tourism Board website. Use a questionnaire with international tourists. Interview a member of the Singapore government. (ii) Which sector of the tourist industry shown in Fig. 1.2 contributed the least amount of money? ..................................................................................................................................... [1] (iii) What percentage of income from tourism came from visiting attractions and entertainment? ............................. % [1] (c) Singapore has many tourist attractions. Some of these are shown in Fig. 1.3 (Insert). Describe the distribution of the tourist attractions shown in Fig. 1.3. ................................................................................................................................................... ................................................................................................................................................... ................................................................................................................................................... ............................................................................................................................................. [2] The students decided to investigate the following hypotheses: Hypothesis 1: Most tourists to Singapore come from Europe. Hypothesis 2: People in different age groups prefer to visit different attractions in Singapore. (d) The students produced a questionnaire for tourists to complete to test their hypotheses. The questionnaire is shown in Fig. 1.4 (Insert). Fig. 1.5 is an extract from one student’s fieldwork diary which describes her method for selecting people to survey. Sampling method The survey was done by random sampling. Description of the method I chose every tenth person who walked past me and asked them to complete my questionnaire. Fig. 1.5 What is wrong with the student’s description of her method? How should she describe the random sampling method? ................................................................................................................................................... ................................................................................................................................................... ................................................................................................................................................... ................................................................................................................................................... ................................................................................................................................................... ............................................................................................................................................. [3] (e) The students used the answers to question 2 in the questionnaire (Which country do you live in?) to calculate the number of tourists coming from different continents. Their results are shown in Table 1.1 (Insert). (i) Plot the total number of tourists coming from Asia on Fig. 1.6. [1] Where tourists visiting Singapore come from Key Singapore 1–20 tourists 21– 40 tourists 41– 60 tourists Fig. 1.6 (ii) Give one reason why Fig. 1.6 is a good method to show this information. ........................................................................................................................................... ..................................................................................................................................... [1] (iii) What conclusion would the students make about Hypothesis 1: Most tourists to Singapore come from Europe? Support your decision with evidence from Fig. 1.6 and Table 1.1. ........................................................................................................................................... ........................................................................................................................................... ........................................................................................................................................... ........................................................................................................................................... ........................................................................................................................................... ..................................................................................................................................... [3] (f) To investigate Hypothesis 2: People in different age groups prefer to visit different attractions in Singapore, the students asked 20 tourists in each age group to rank the five attractions they most like (question 3 in the questionnaire). The results for the under 20 age group are shown in Table 1.2 (Insert). The students then used the following formula to give a score to each rank: • rank 1 = 5 points • rank 2 = 4 points • rank 3 = 3 points • rank 4 = 2 points • rank 5 = 1 point. (i) These calculations are shown in Table 1.3. Use the results in Table 1.2 (Insert) to complete the scores for Resorts World on Sentosa Island in Table 1.3. [2] Table 1.3 Under 20 age group calculated scores rank 1 rank 2 rank 3 rank 4 rank 5 (number (number (number (number (number attraction giving rank giving rank giving rank giving rank giving rank × 5 points) × 4 points) × 3 points) × 2 points) × 1 point) Orchard Road shops and malls 10 4 12 6 1 Resorts World on Sentosa Island 6 0 0 Clarke Quay on the Singapore River 0 0 3 2 1 Raffles Hotel 0 0 0 2 1 Gardens by the Bay 5 0 9 10 3 Botanic Gardens 0 0 0 2 2 Singapore Zoo and Night Safari 5 4 6 4 5 Asian Civilisations Museum 0 0 0 0 1 Singapore Flyer giant Ferris wheel 15 8 6 10 5 Marina Bay Sands Resort 15 32 18 4 1 (ii) The total scores awarded by the different age groups for each attraction are shown in Table 1.4 (Insert). Use the results to complete the graph for the 41–60 age group on Fig. 1.7 by drawing the bars for the Singapore Flyer giant Ferris wheel and Marina Bay Sands Resort. [2] Total scores given by each age group Under 20 100 90 80 70 60 total 50 score 40 30 20 10 0 mallsIslandRiverHotel Bay Safari wheelResort the Gardens Museum and by Sands Sentosa Raffles Night Ferris shops Singapore Botanicand on giantBay the Gardens Zoo Civilisations Road on Flyer World Marina Asian Orchard Quay Singapore Resorts Singapore Clarke attraction 20–40 80 70 60 50 total 40 score 30 20 10 0 mallsIslandRiverHotel Bay Safari wheelResort the Gardens Museum and by Sands Sentosa Raffles Night Ferris shops Singapore Botanicand on giantBay the Gardens Zoo Civilisations Road on Flyer World Marina Asian Orchard Quay Singapore Resorts Singapore Clarke attraction 41–60 80 70 60 50 total 40 score 30 20 10 0 mallsIslandRiverHotel Bay Safari wheelResort the Gardens Museum and by Sands Sentosa Raffles Night Ferris shops Singapore Botanicand on giantBay the Gardens Zoo Civilisations Road on Flyer World Marina AsianOrchard Quay Singapore Resorts Singapore Clarke attraction Over 60 80 70 60 total 50 40 score 30 20 10 0 mallsIslandRiverHotel Bay Safari wheelResort the Gardens Museum and by Sands Sentosa Raffles Night Ferris shops Singapore Botanicand on giantBay the Gardens Zoo Civilisations Road on Flyer World Marina AsianOrchard Quay Singapore Resorts Singapore Clarke attraction Fig. 1.7 (iii) Do the results support Hypothesis 2: People in different age groups prefer to visit different attractions in Singapore? Support your conclusion with evidence from Fig. 1.7 and Table 1.4. ........................................................................................................................................... ........................................................................................................................................... ........................................................................................................................................... ........................................................................................................................................... ........................................................................................................................................... ........................................................................................................................................... ........................................................................................................................................... ..................................................................................................................................... [4] (g) Describe the impacts of large numbers of tourists visiting a country. ................................................................................................................................................... ................................................................................................................................................... ................................................................................................................................................... ................................................................................................................................................... ................................................................................................................................................... ................................................................................................................................................... ................................................................................................................................................... ............................................................................................................................................. [4] [Total: 30]
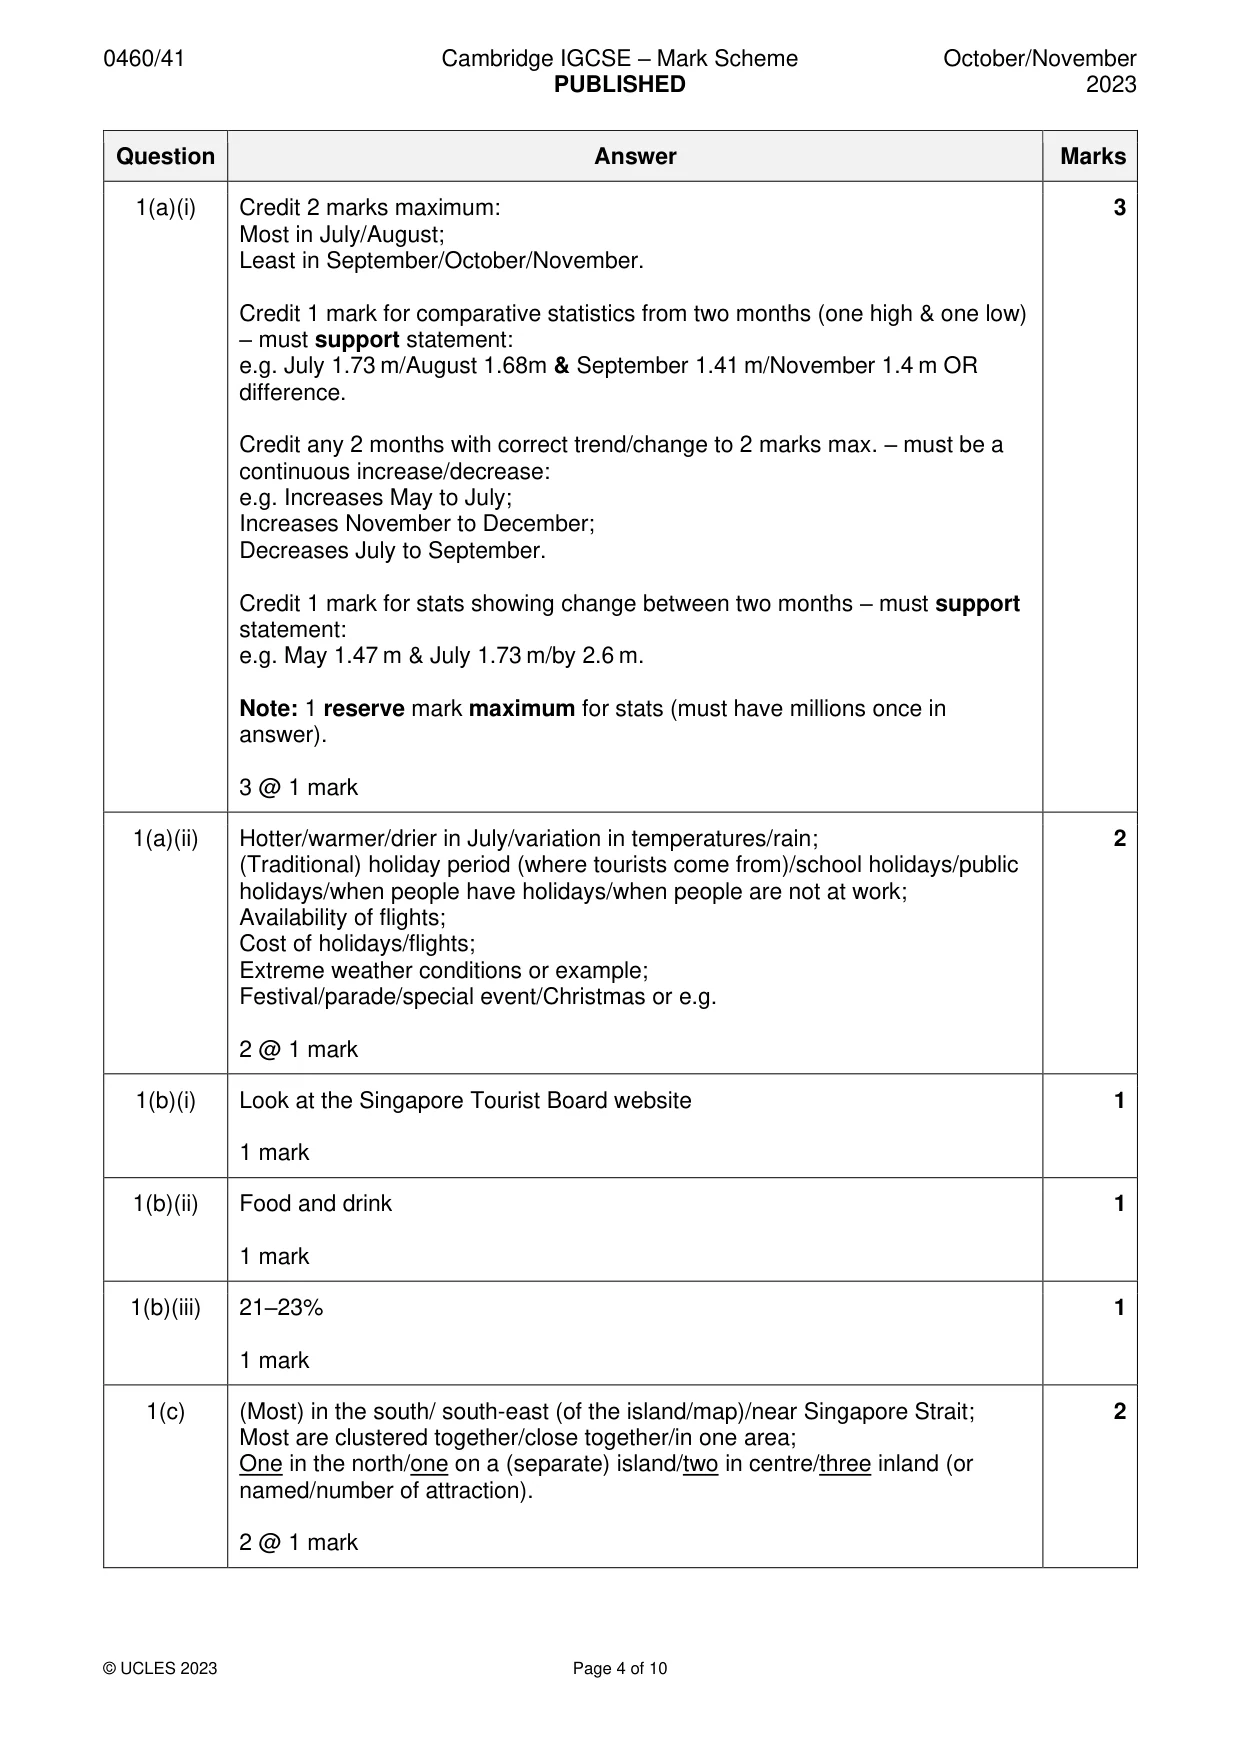
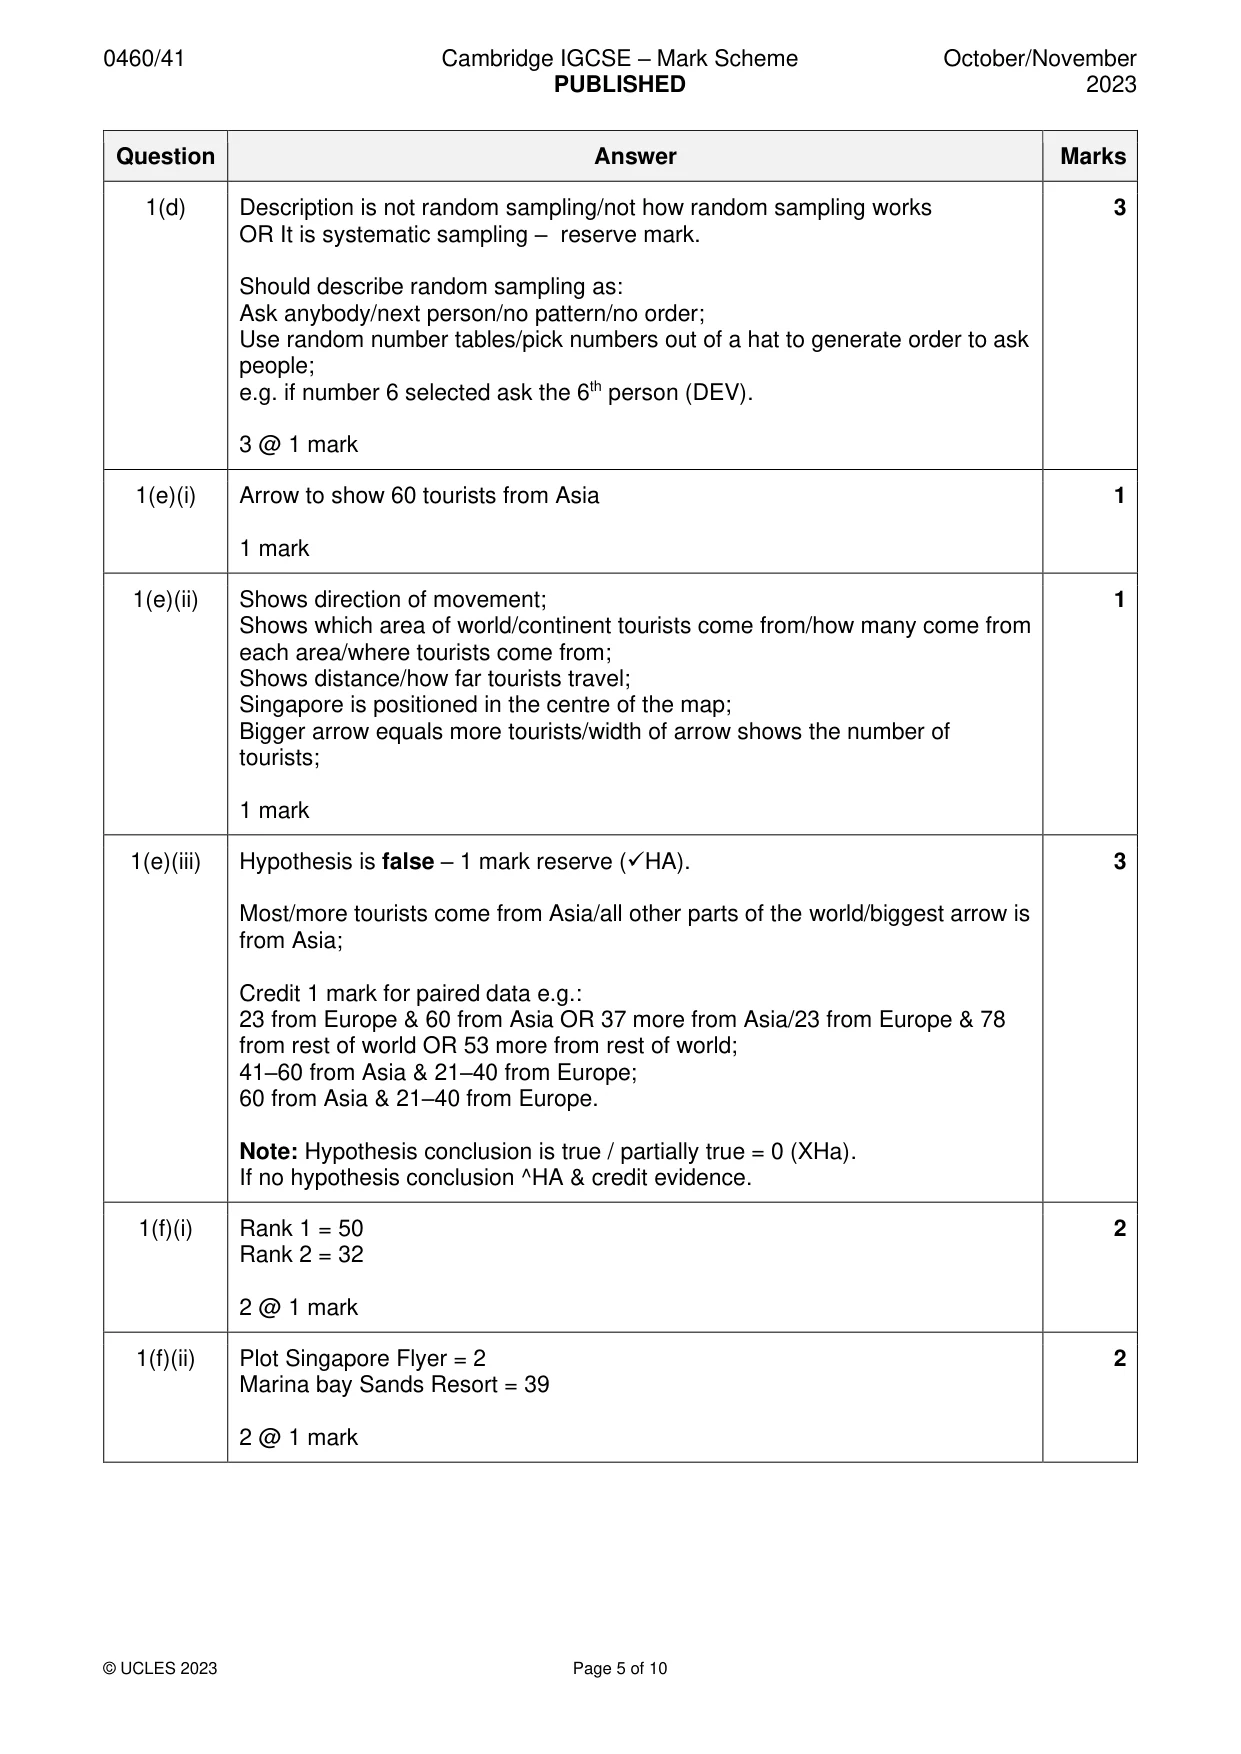
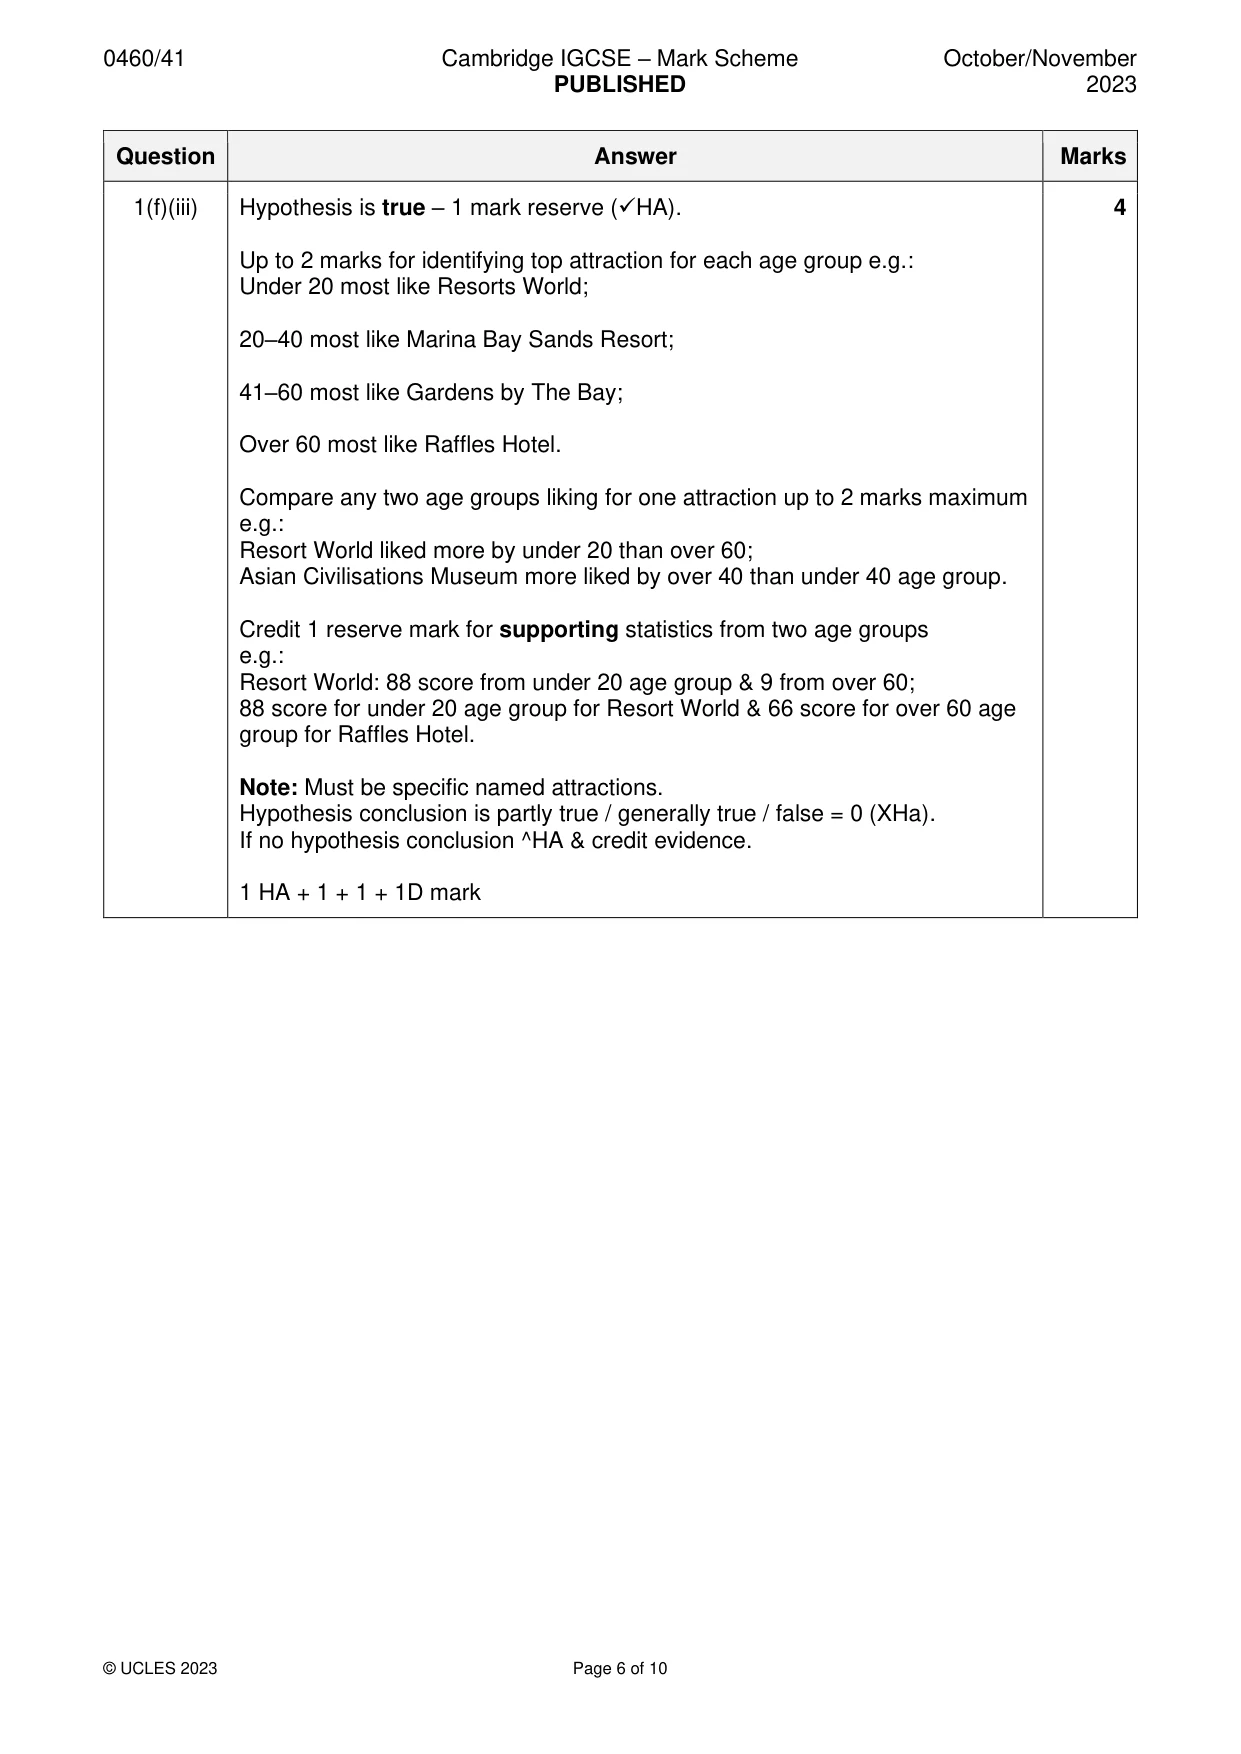
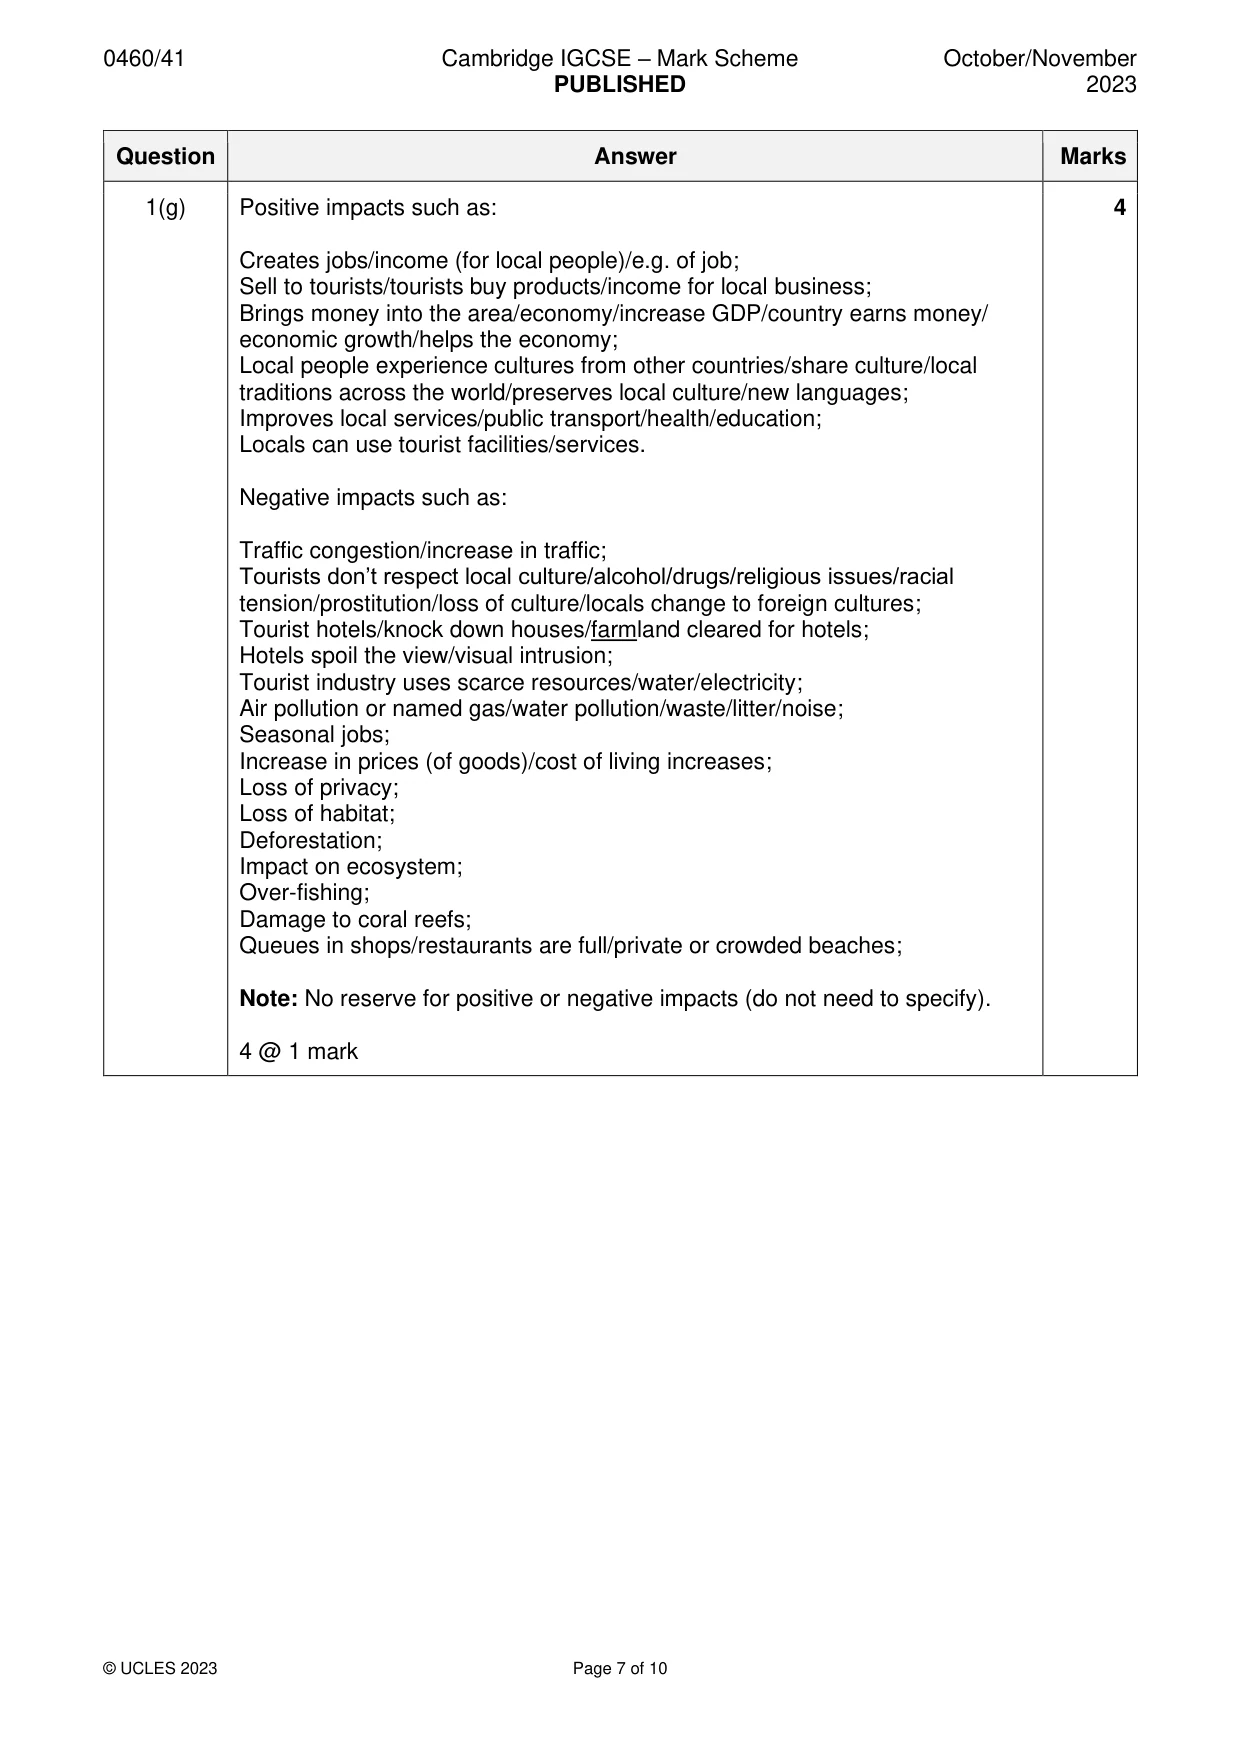
Mark scheme: Question Answer Marks 1(a)(i) Credit 2 marks maximum: 3 Most in July/August; Least in September/October/November. Credit 1 mark for comparative statistics from two months (one high & one low) – must support statement: e.g. July 1.73 m/August 1.68m & September 1.41 m/November 1.4 m OR difference. Credit any 2 months with correct trend/change to 2 marks max. – must be a continuous increase/decrease: e.g. Increases May to July; Increases November to December; Decreases July to September. Credit 1 mark for stats showing change between two months – must support statement: e.g. May 1.47 m & July 1.73 m/by 2.6 m. Note: 1 reserve mark maximum for stats (must have millions once in answer). 3 @ 1 mark 1(a)(ii) Hotter/warmer/drier in July/variation in temperatures/rain; 2 (Traditional) holiday period (where tourists come from)/school holidays/public holidays/when people have holidays/when people are not at work; Availability of flights; Cost of holidays/flights; Extreme weather conditions or example; Festival/parade/special event/Christmas or e.g. 2 @ 1 mark 1(b)(i) Look at the Singapore Tourist Board website 1 1 mark 1(b)(ii) Food and drink 1 1 mark 1(b)(iii) 21–23% 1 1 mark 1(c) (Most) in the south/ south-east (of the island/map)/near Singapore Strait; 2 Most are clustered together/close together/in one area; One in the north/one on a (separate) island/two in centre/three inland (or named/number of attraction). 2 @ 1 mark 1(d) Description is not random sampling/not how random sampling works 3 OR It is systematic sampling – reserve mark. Should describe random sampling as: Ask anybody/next person/no pattern/no order; Use random number tables/pick numbers out of a hat to generate order to ask people; e.g. if number 6 selected ask the 6th person (DEV). 3 @ 1 mark 1(e)(i) Arrow to show 60 tourists from Asia 1 1 mark 1(e)(ii) Shows direction of movement; 1 Shows which area of world/continent tourists come from/how many come from each area/where tourists come from; Shows distance/how far tourists travel; Singapore is positioned in the centre of the map; Bigger arrow equals more tourists/width of arrow shows the number of tourists; 1 mark 1(e)(iii) Hypothesis is false – 1 mark reserve (✓HA). 3 Most/more tourists come from Asia/all other parts of the world/biggest arrow is from Asia; Credit 1 mark for paired data e.g.: 23 from Europe & 60 from Asia OR 37 more from Asia/23 from Europe & 78 from rest of world OR 53 more from rest of world; 41–60 from Asia & 21–40 from Europe; 60 from Asia & 21–40 from Europe. Note: Hypothesis conclusion is true / partially true = 0 (XHa). If no hypothesis conclusion ^HA & credit evidence. 1(f)(i) Rank 1 = 50 2 Rank 2 = 32 2 @ 1 mark 1(f)(ii) Plot Singapore Flyer = 2 2 Marina bay Sands Resort = 39 2 @ 1 mark 1(f)(iii) Hypothesis is true – 1 mark reserve (✓HA). 4 Up to 2 marks for identifying top attraction for each age group e.g.: Under 20 most like Resorts World; 20–40 most like Marina Bay Sands Resort; 41–60 most like Gardens by The Bay; Over 60 most like Raffles Hotel. Compare any two age groups liking for one attraction up to 2 marks maximum e.g.: Resort World liked more by under 20 than over 60; Asian Civilisations Museum more liked by over 40 than under 40 age group. Credit 1 reserve mark for supporting statistics from two age groups e.g.: Resort World: 88 score from under 20 age group & 9 from over 60; 88 score for under 20 age group for Resort World & 66 score for over 60 age group for Raffles Hotel. Note: Must be specific named attractions. Hypothesis conclusion is partly true / generally true / false = 0 (XHa). If no hypothesis conclusion ^HA & credit evidence. 1 HA + 1 + 1 + 1D mark 1(g) Positive impacts such as: 4 Creates jobs/income (for local people)/e.g. of job; Sell to tourists/tourists buy products/income for local business; Brings money into the area/economy/increase GDP/country earns money/ economic growth/helps the economy; Local people experience cultures from other countries/share culture/local traditions across the world/preserves local culture/new languages; Improves local services/public transport/health/education; Locals can use tourist facilities/services. Negative impacts such as: Traffic congestion/increase in traffic; Tourists don’t respect local culture/alcohol/drugs/religious issues/racial tension/prostitution/loss of culture/locals change to foreign cultures; Tourist hotels/knock down houses/farmland cleared for hotels; Hotels spoil the view/visual intrusion; Tourist industry uses scarce resources/water/electricity; Air pollution or named gas/water pollution/waste/litter/noise; Seasonal jobs; Increase in prices (of goods)/cost of living increases; Loss of privacy; Loss of habitat; Deforestation; Impact on ecosystem; Over-fishing; Damage to coral reefs; Queues in shops/restaurants are full/private or crowded beaches; Note: No reserve for positive or negative impacts (do not need to specify). 4 @ 1 mark
Q2 · Students were studying how a river changes downstream
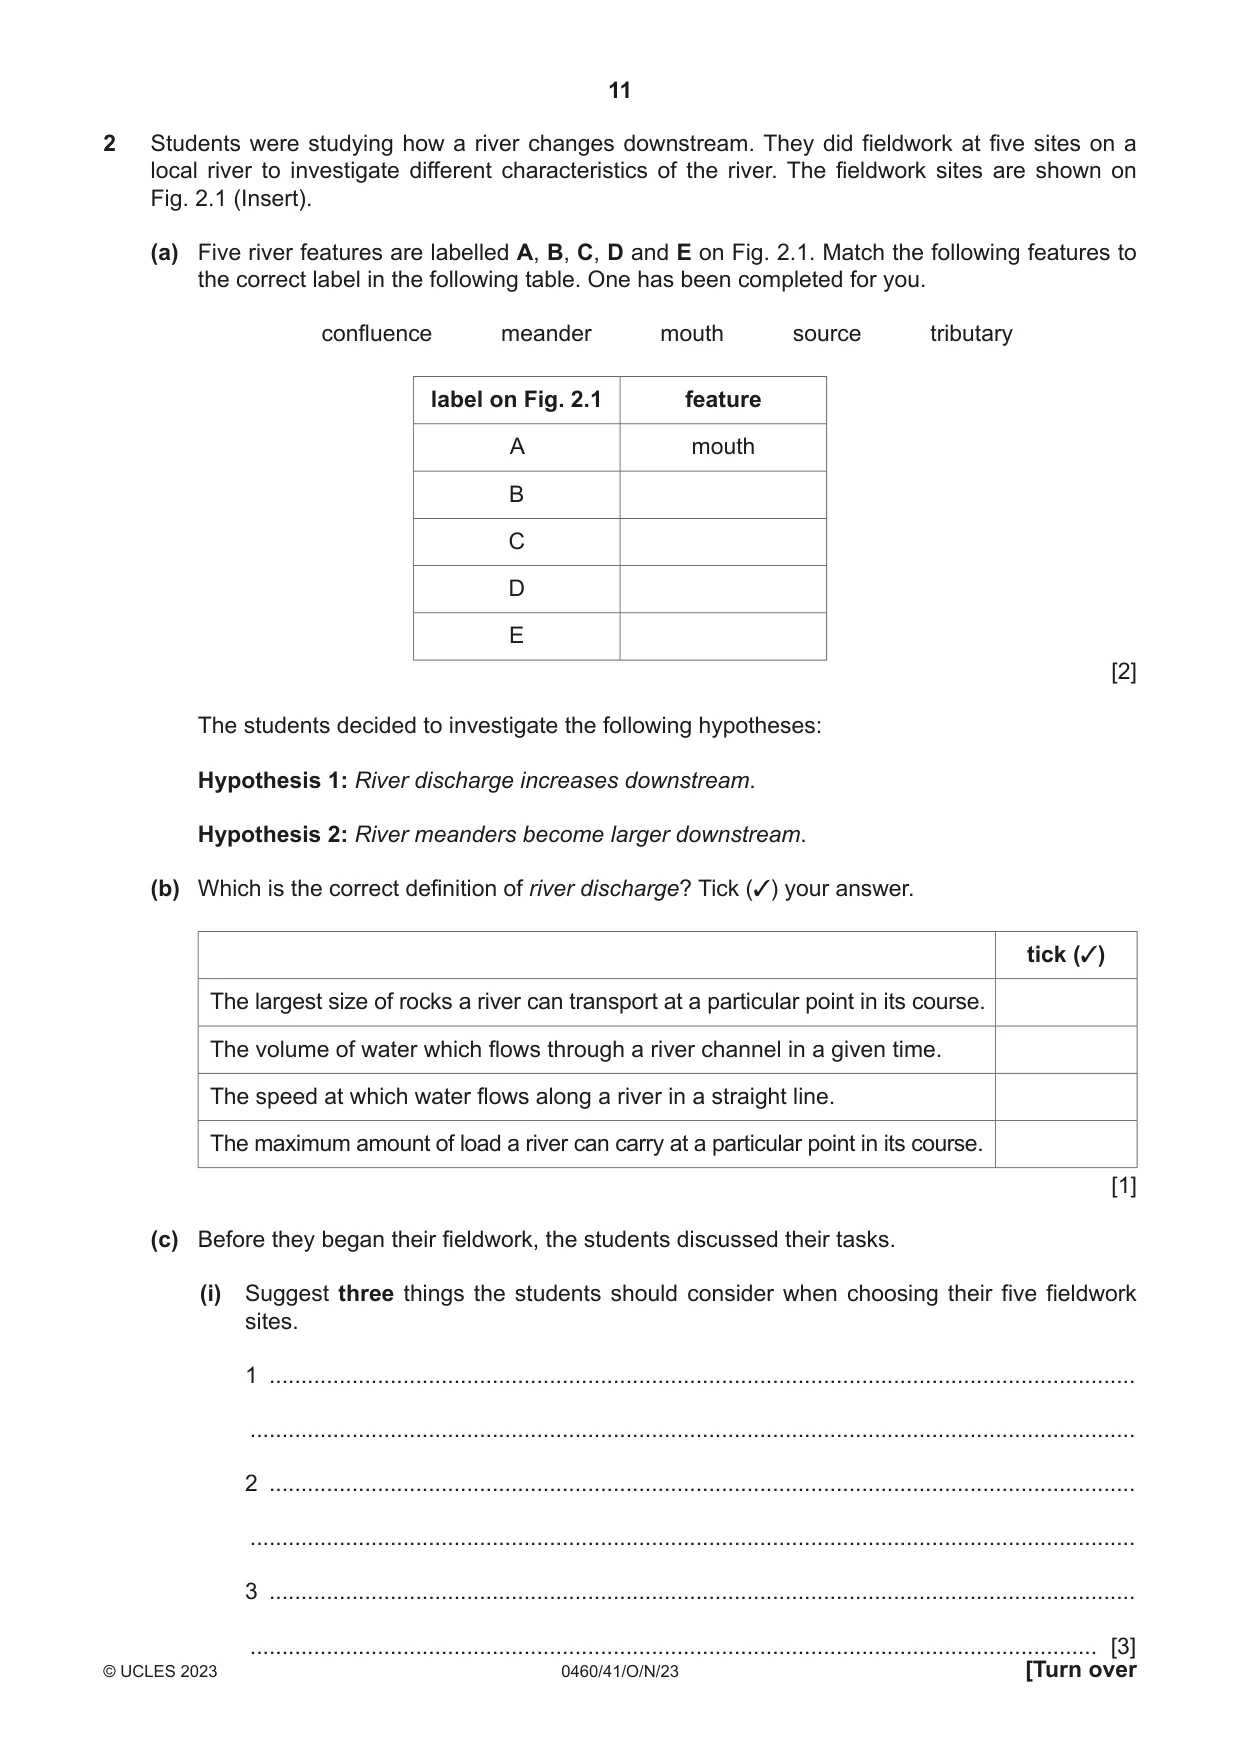
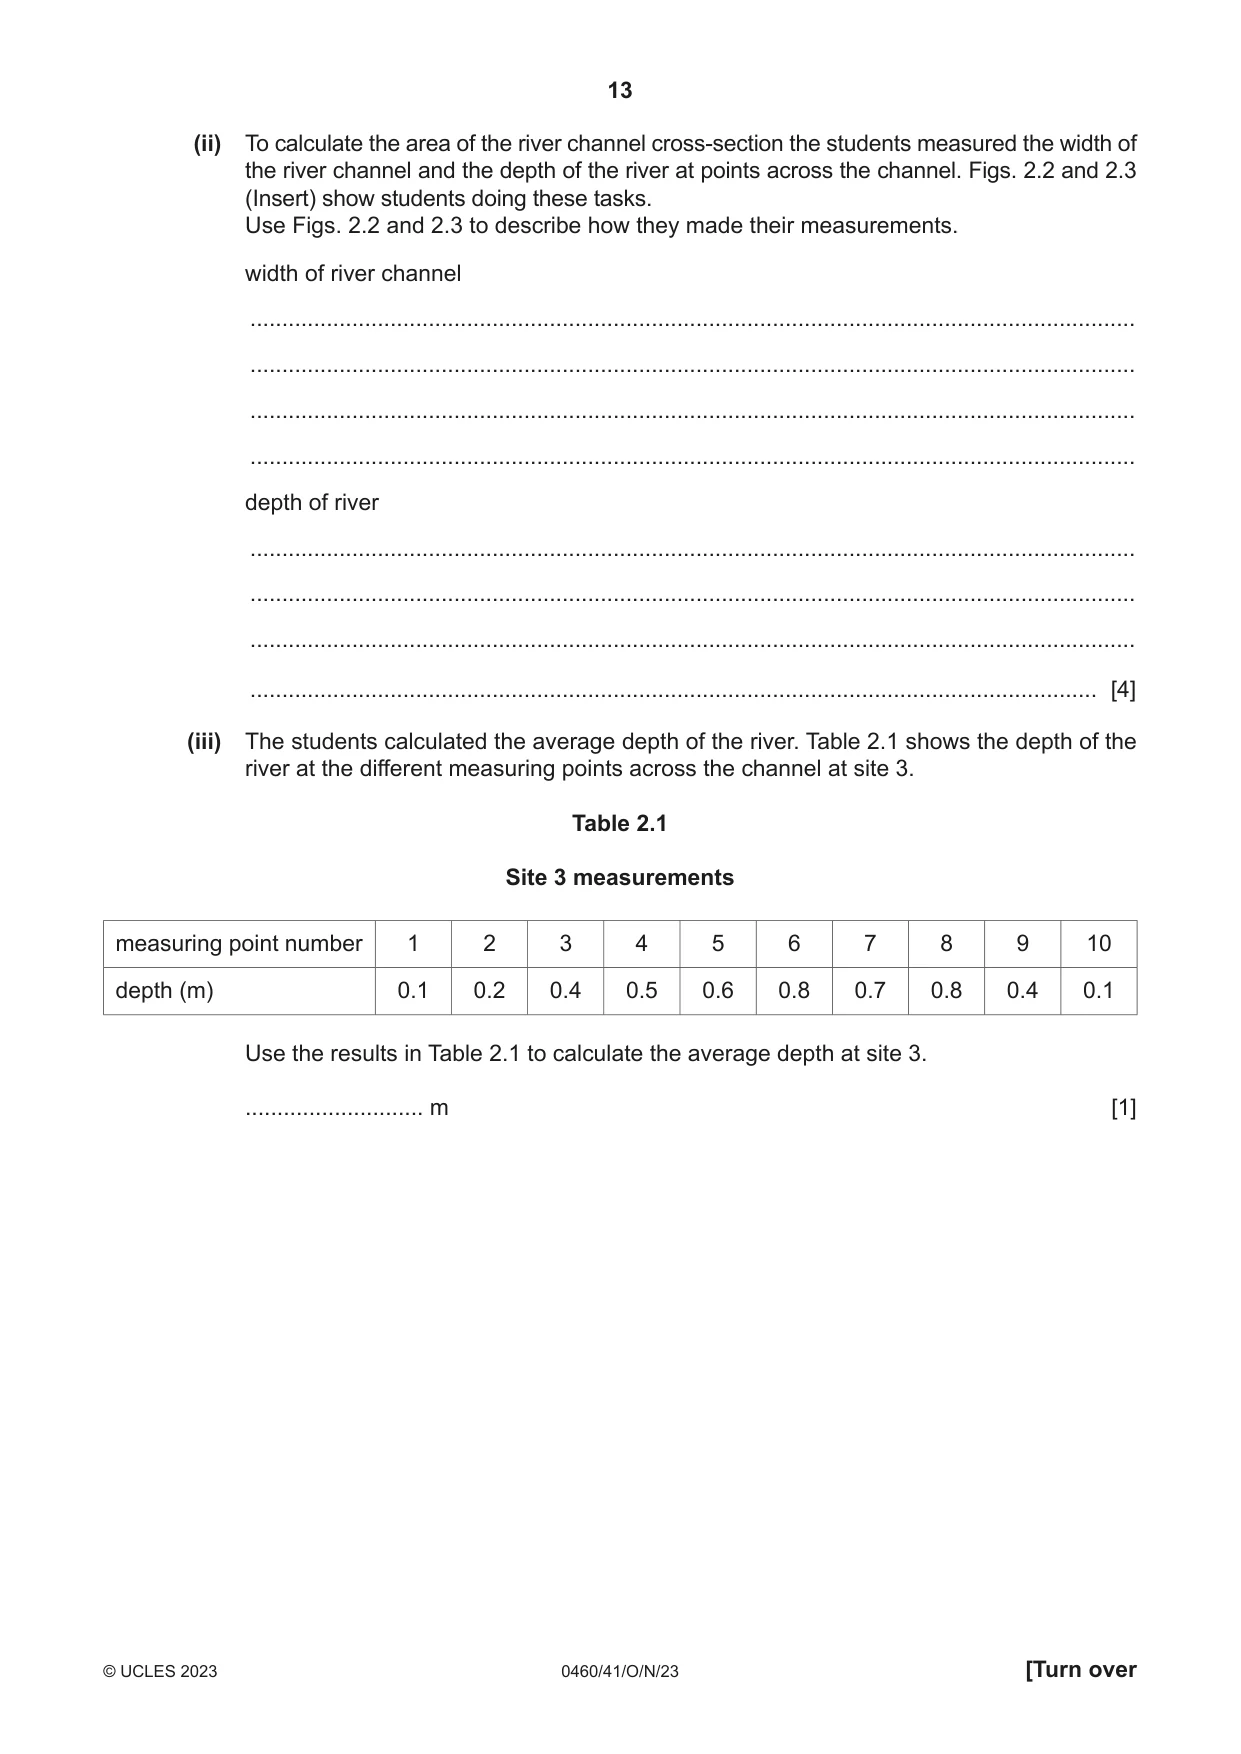
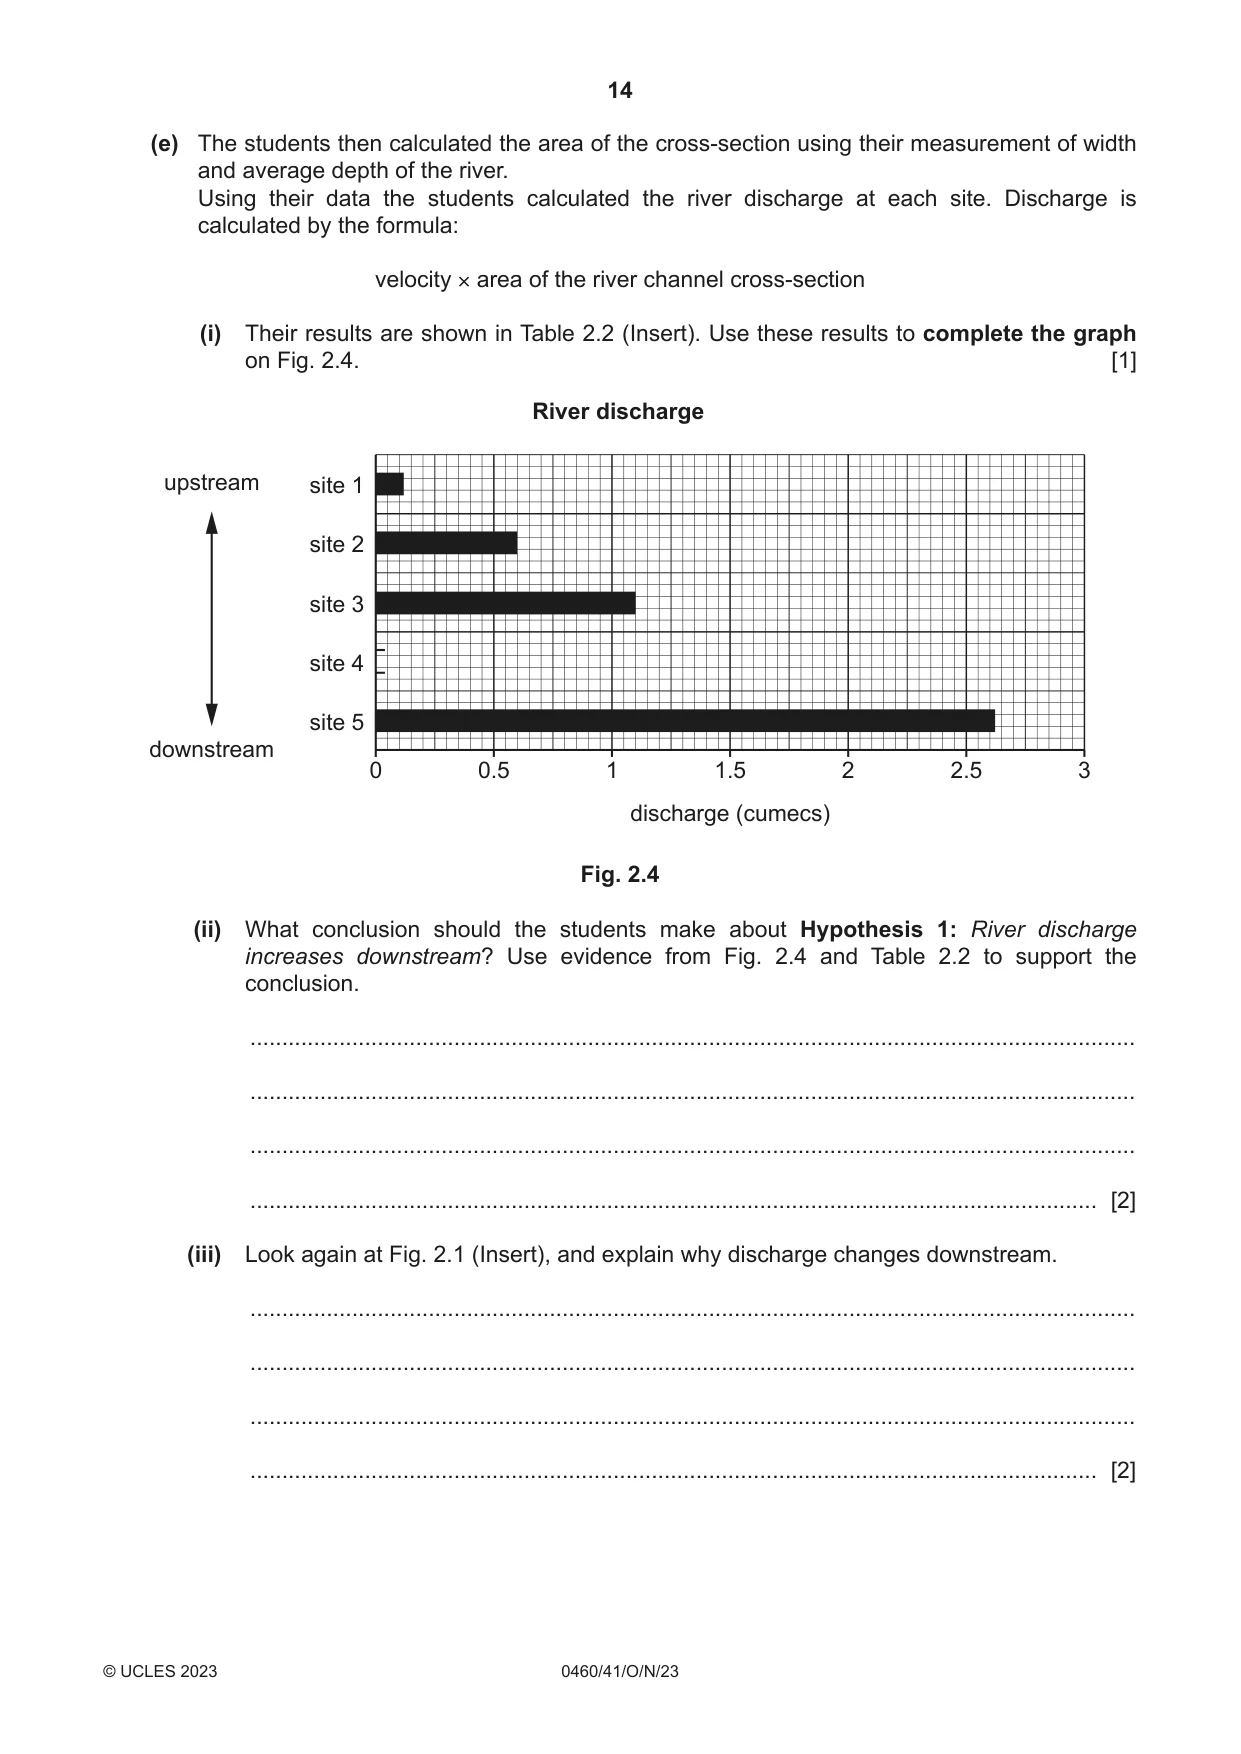
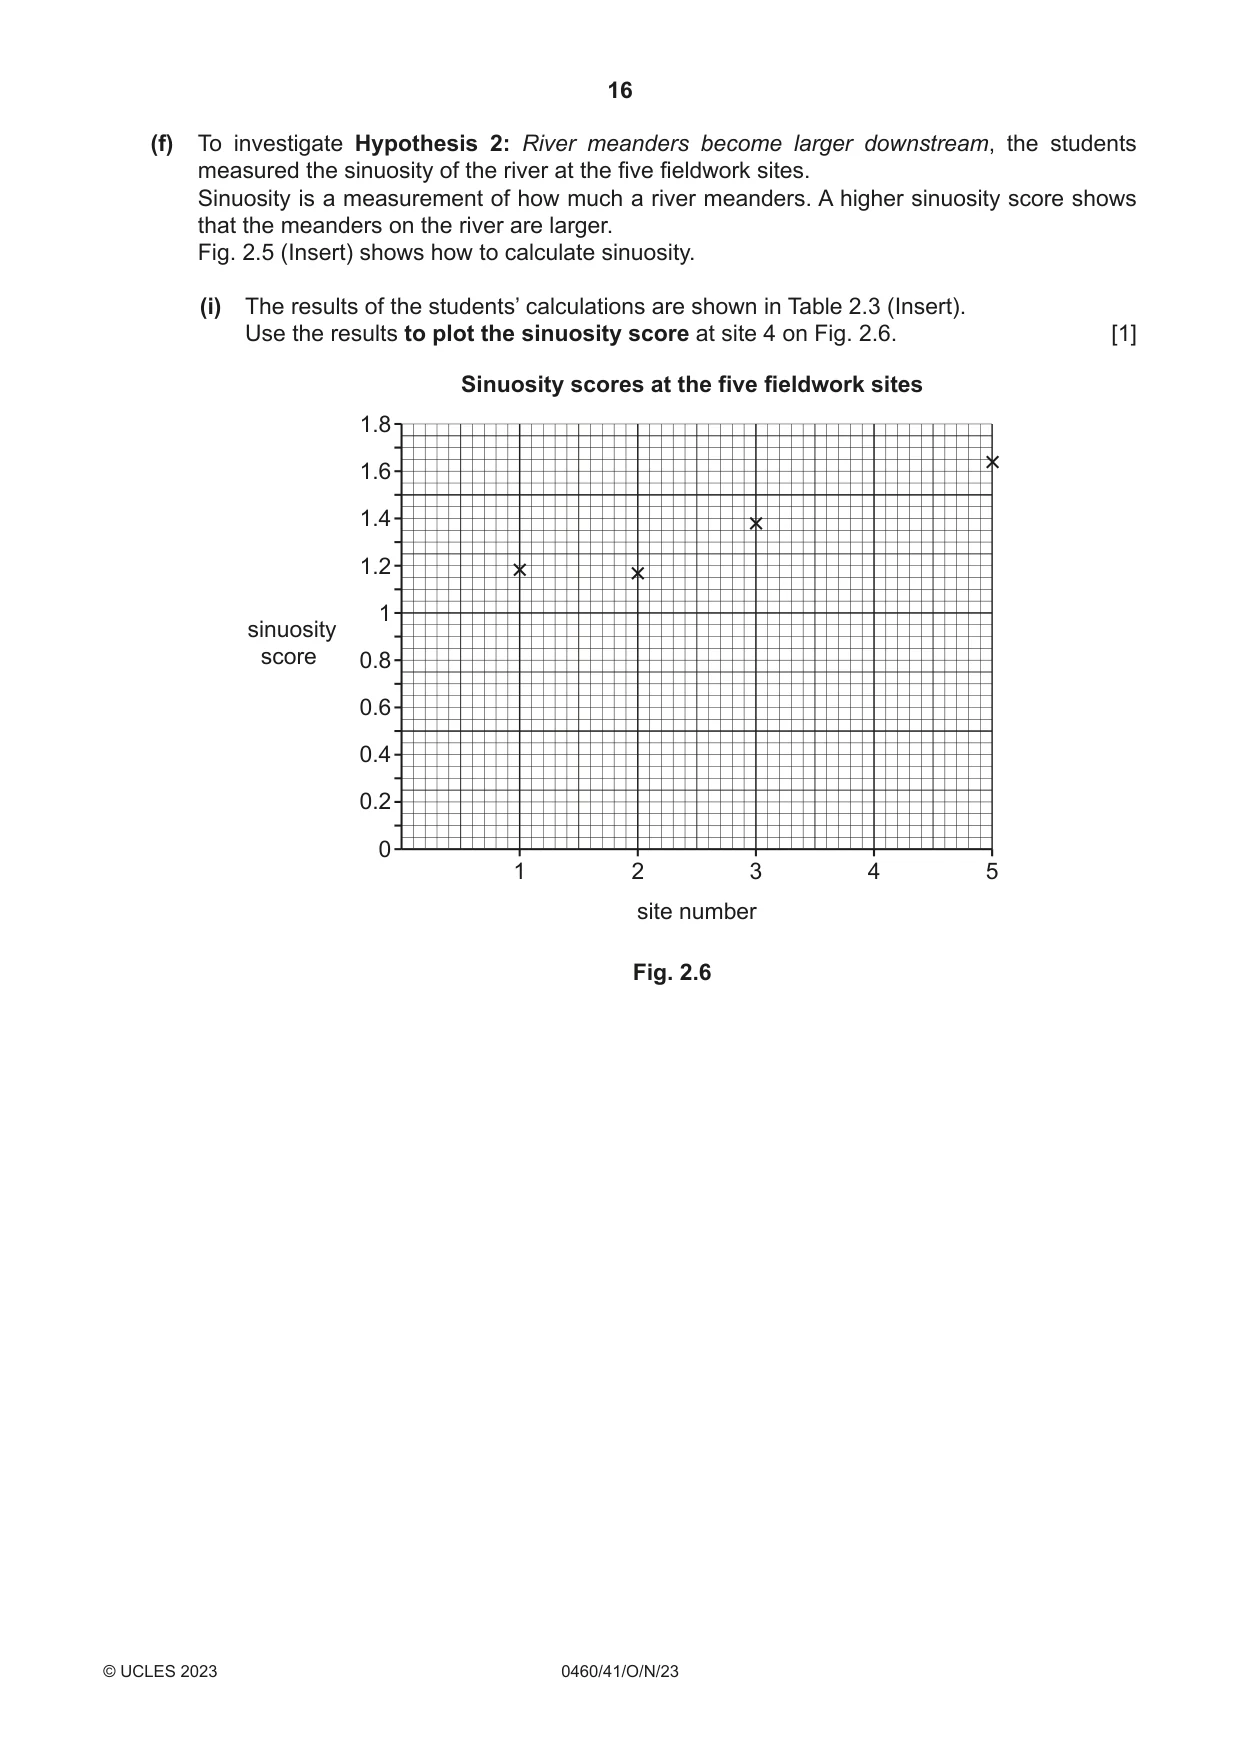
2 Students were studying how a river changes downstream. They did fieldwork at five sites on a local river to investigate different characteristics of the river. The fieldwork sites are shown on Fig. 2.1 (Insert). (a) Five river features are labelled A, B, C, D and E on Fig. 2.1. Match the following features to the correct label in the following table. One has been completed for you. confluence meander mouth source tributary label on Fig. 2.1 feature A mouth B C D E [2] The students decided to investigate the following hypotheses: Hypothesis 1: River discharge increases downstream. Hypothesis 2: River meanders become larger downstream. (b) Which is the correct definition of river discharge? Tick (3) your answer. tick (3) The largest size of rocks a river can transport at a particular point in its course. The volume of water which flows through a river channel in a given time. The speed at which water flows along a river in a straight line. The maximum amount of load a river can carry at a particular point in its course. [1] (c) Before they began their fieldwork, the students discussed their tasks. (i) Suggest three things the students should consider when choosing their five fieldwork sites. 1 ........................................................................................................................................ ........................................................................................................................................... 2 ........................................................................................................................................ ........................................................................................................................................... 3 ........................................................................................................................................ (ii) The students decided to do a pilot study at a site on the river. How would this help them to prepare for their fieldwork tasks? ........................................................................................................................................... ........................................................................................................................................... ........................................................................................................................................... ..................................................................................................................................... [2] (d) To calculate river discharge at each site the students needed to measure river velocity and find out the area of the river cross-section. (i) Describe a fieldwork method used to measure river velocity. ........................................................................................................................................... ........................................................................................................................................... ........................................................................................................................................... ........................................................................................................................................... ........................................................................................................................................... ........................................................................................................................................... ........................................................................................................................................... ..................................................................................................................................... [4] (ii) To calculate the area of the river channel cross-section the students measured the width of the river channel and the depth of the river at points across the channel. Figs. 2.2 and 2.3 (Insert) show students doing these tasks. Use Figs. 2.2 and 2.3 to describe how they made their measurements. width of river channel ........................................................................................................................................... ........................................................................................................................................... ........................................................................................................................................... ........................................................................................................................................... depth of river ........................................................................................................................................... ........................................................................................................................................... ........................................................................................................................................... ..................................................................................................................................... [4] (iii) The students calculated the average depth of the river. Table 2.1 shows the depth of the river at the different measuring points across the channel at site 3. Table 2.1 Site 3 measurements measuring point number 1 2 3 4 5 6 7 8 9 10 depth (m) 0.1 0.2 0.4 0.5 0.6 0.8 0.7 0.8 0.4 0.1 Use the results in Table 2.1 to calculate the average depth at site 3. ............................ m [1]
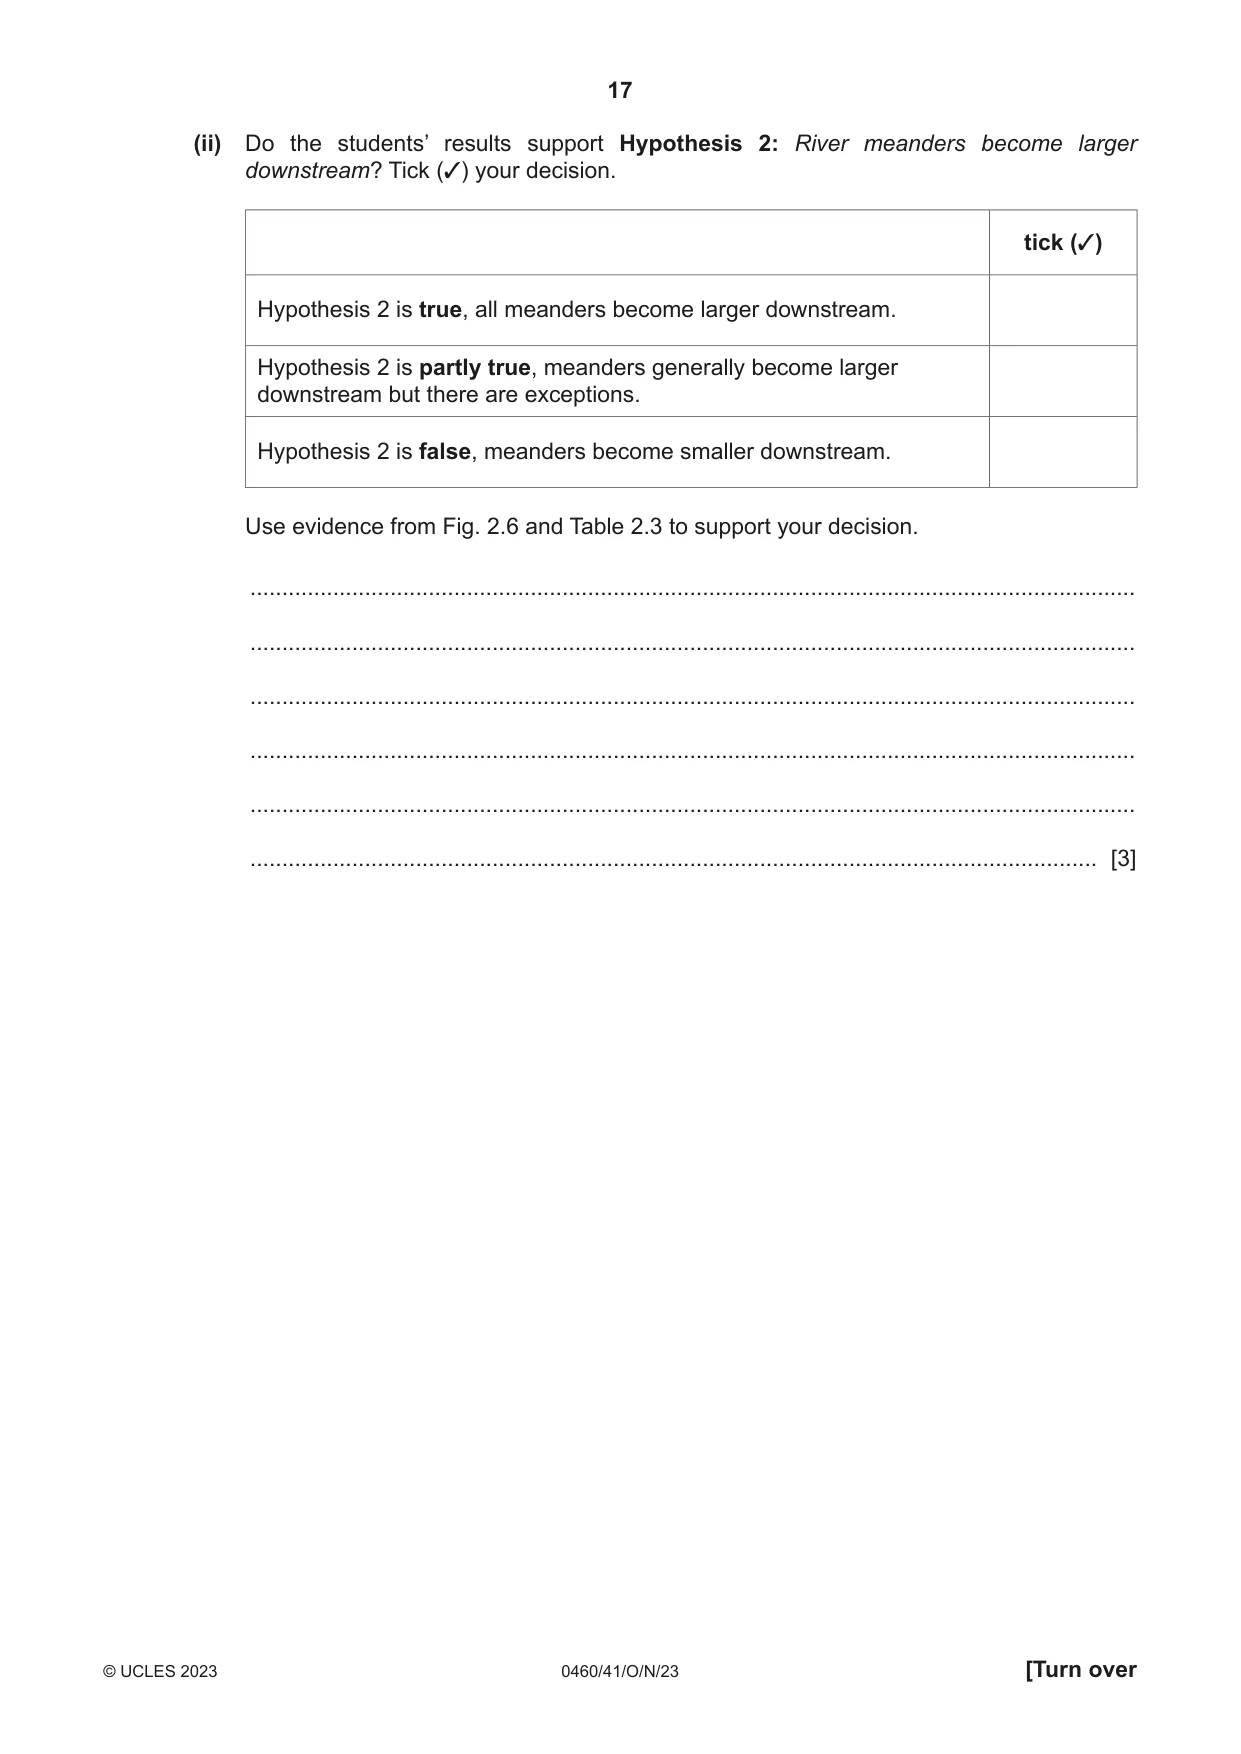
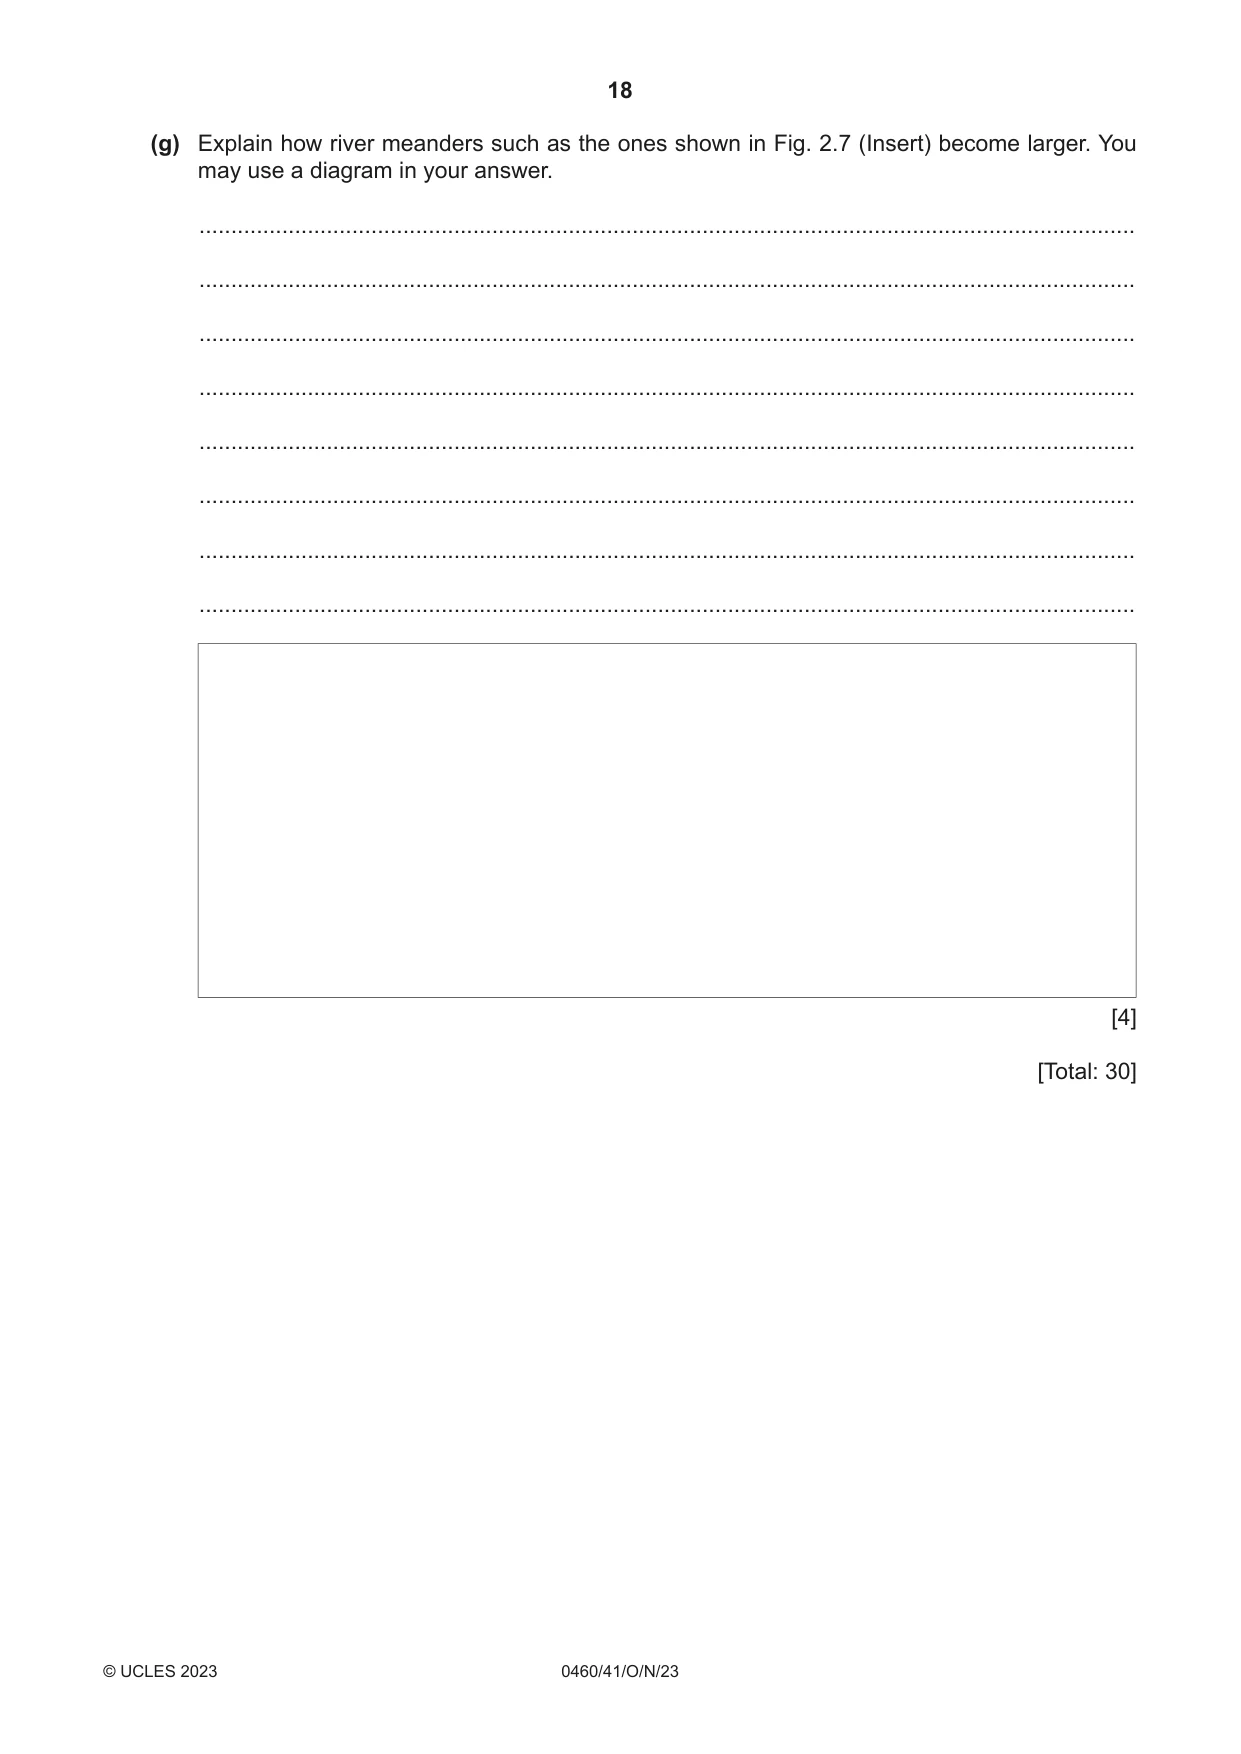
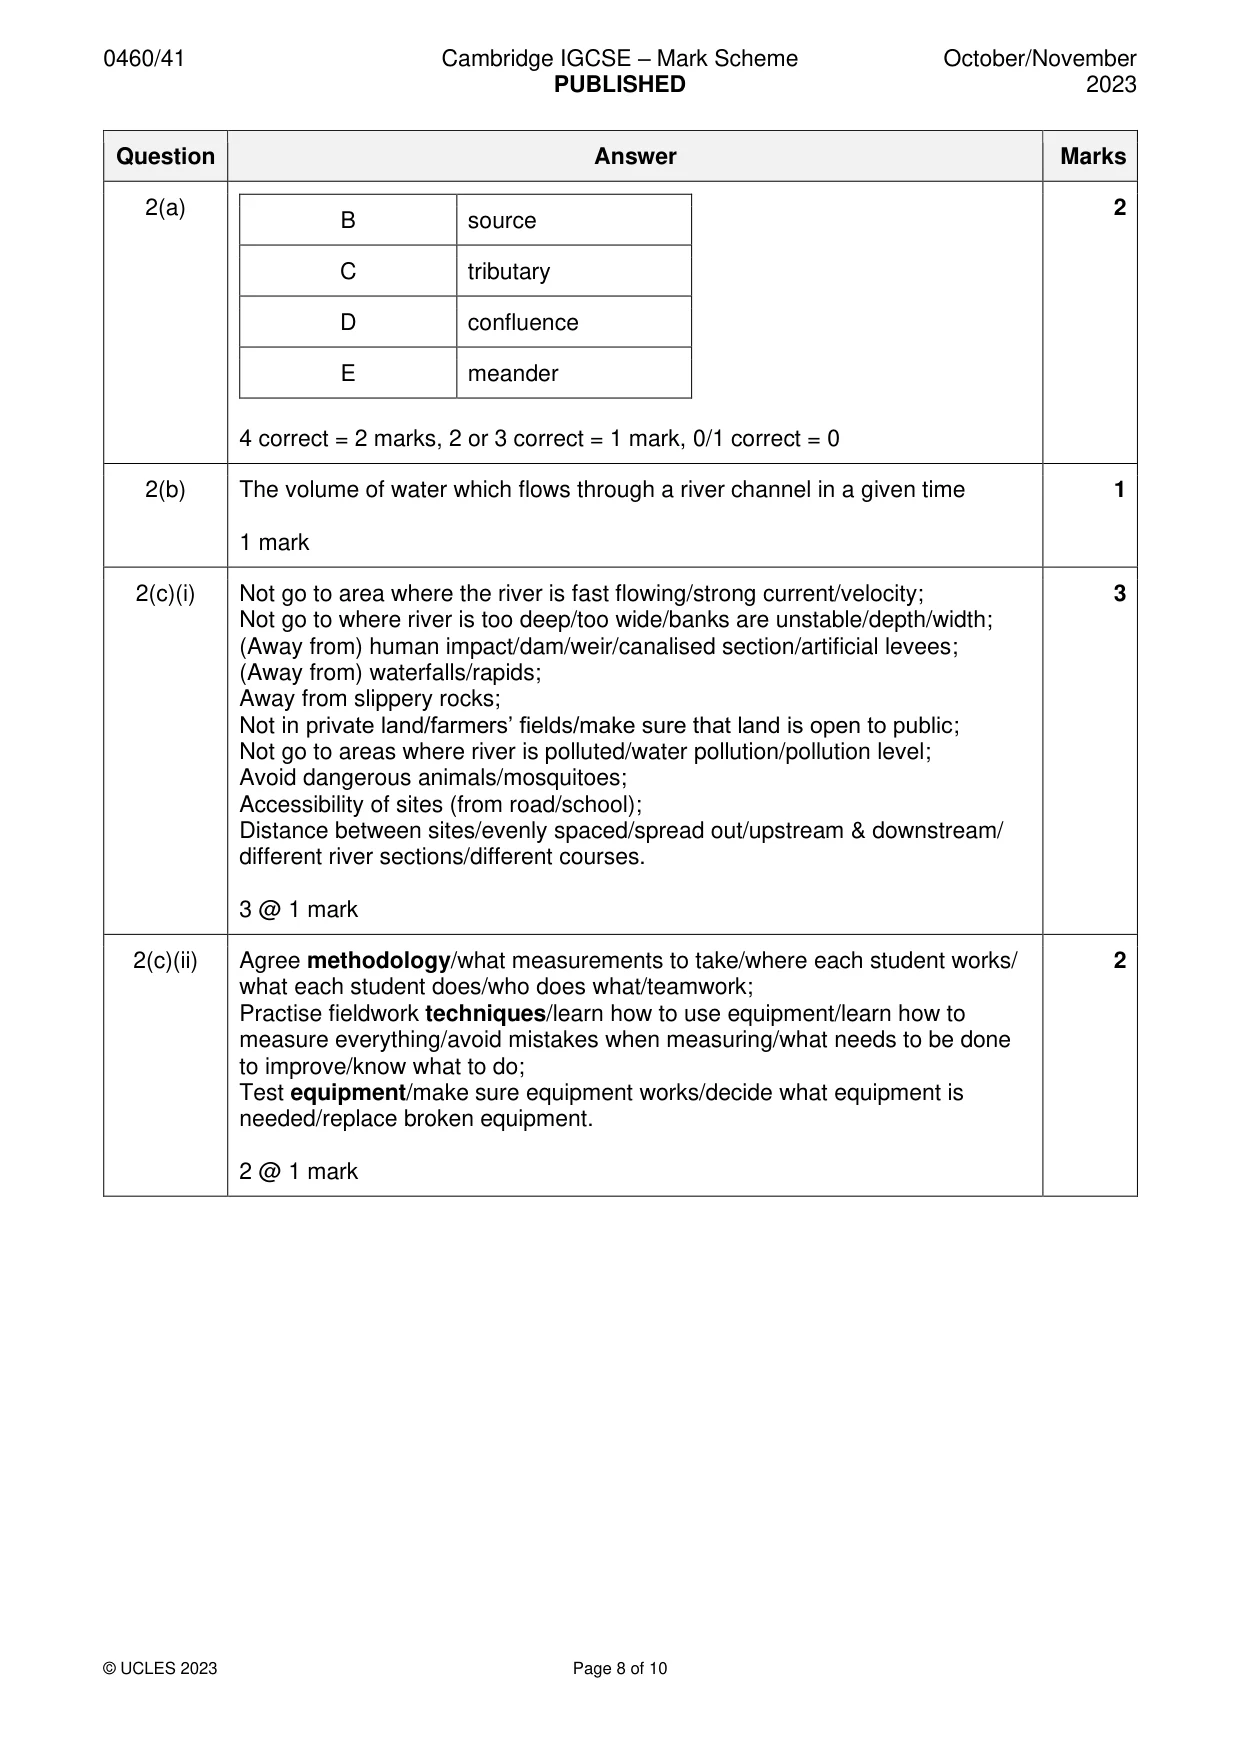
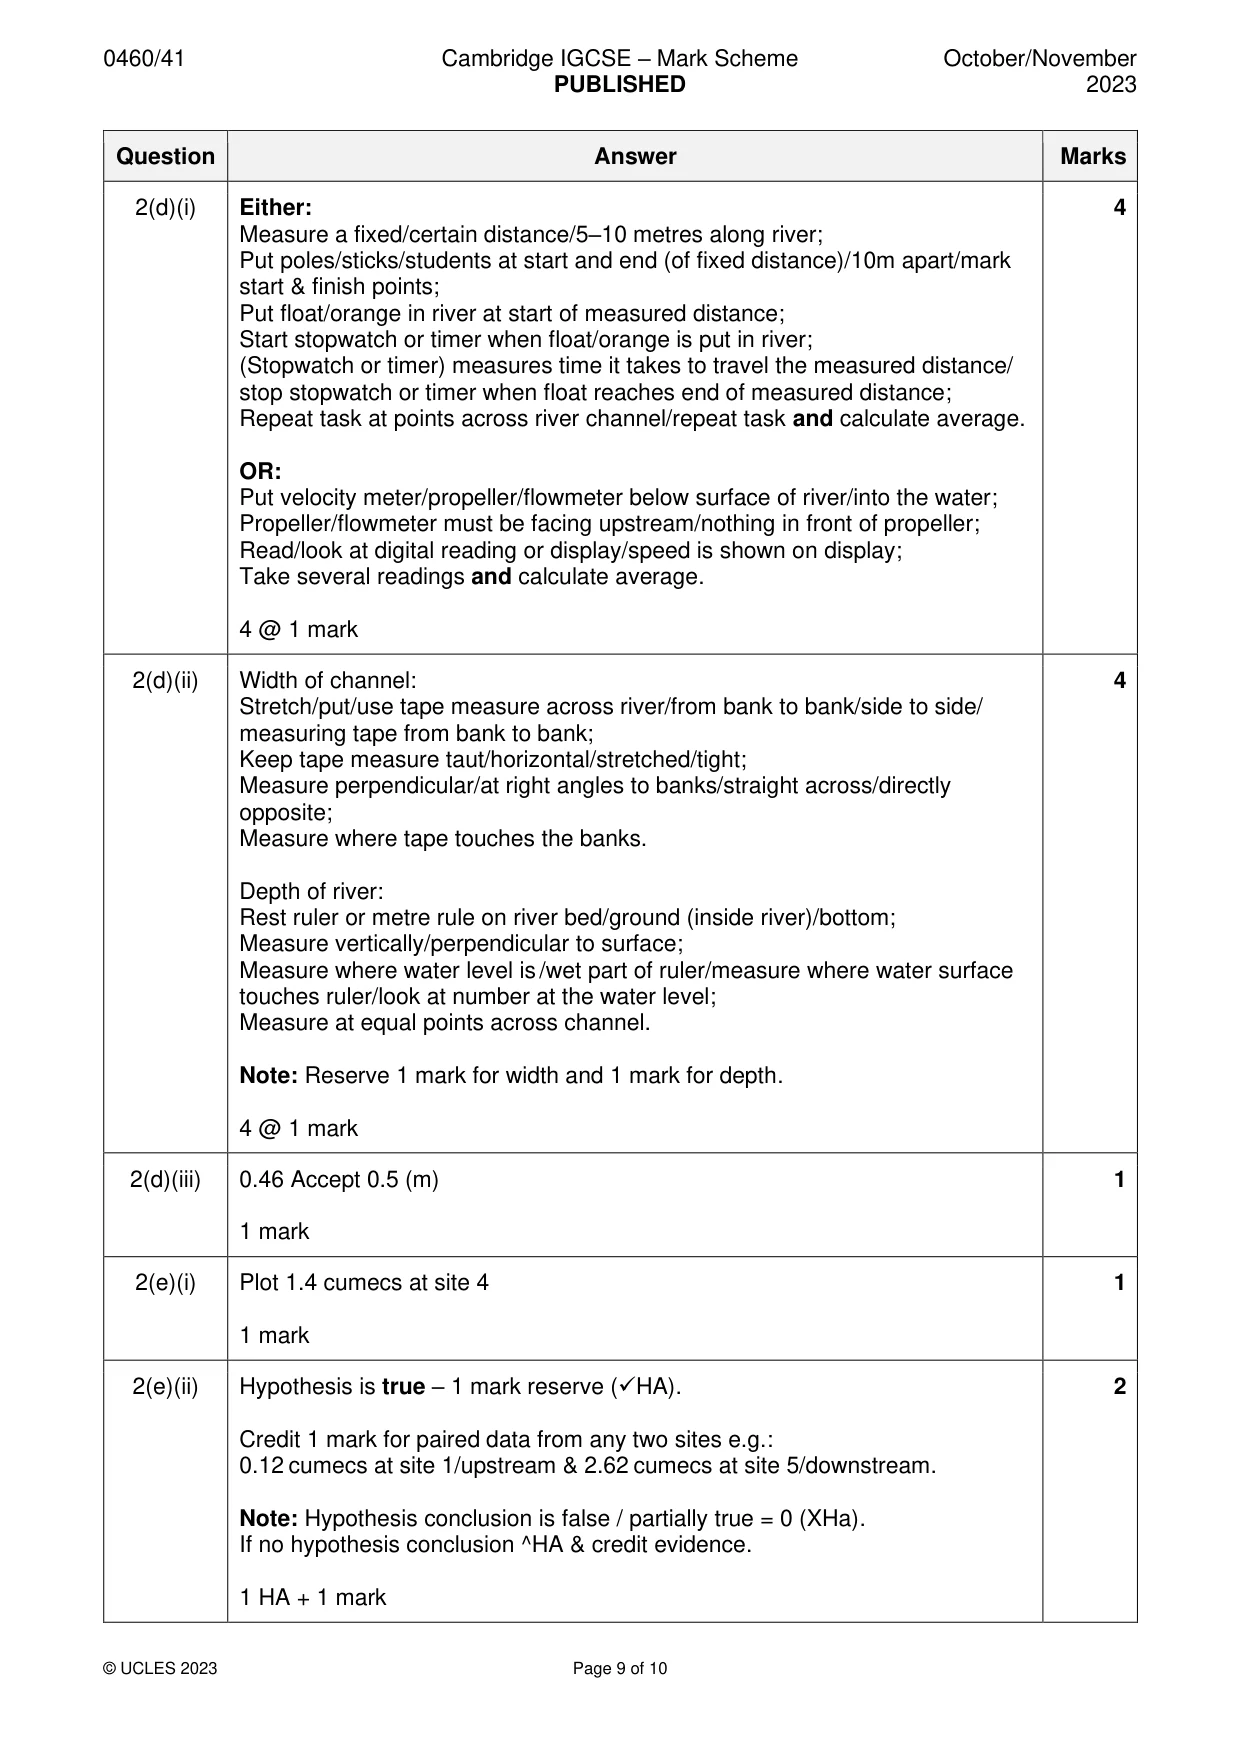
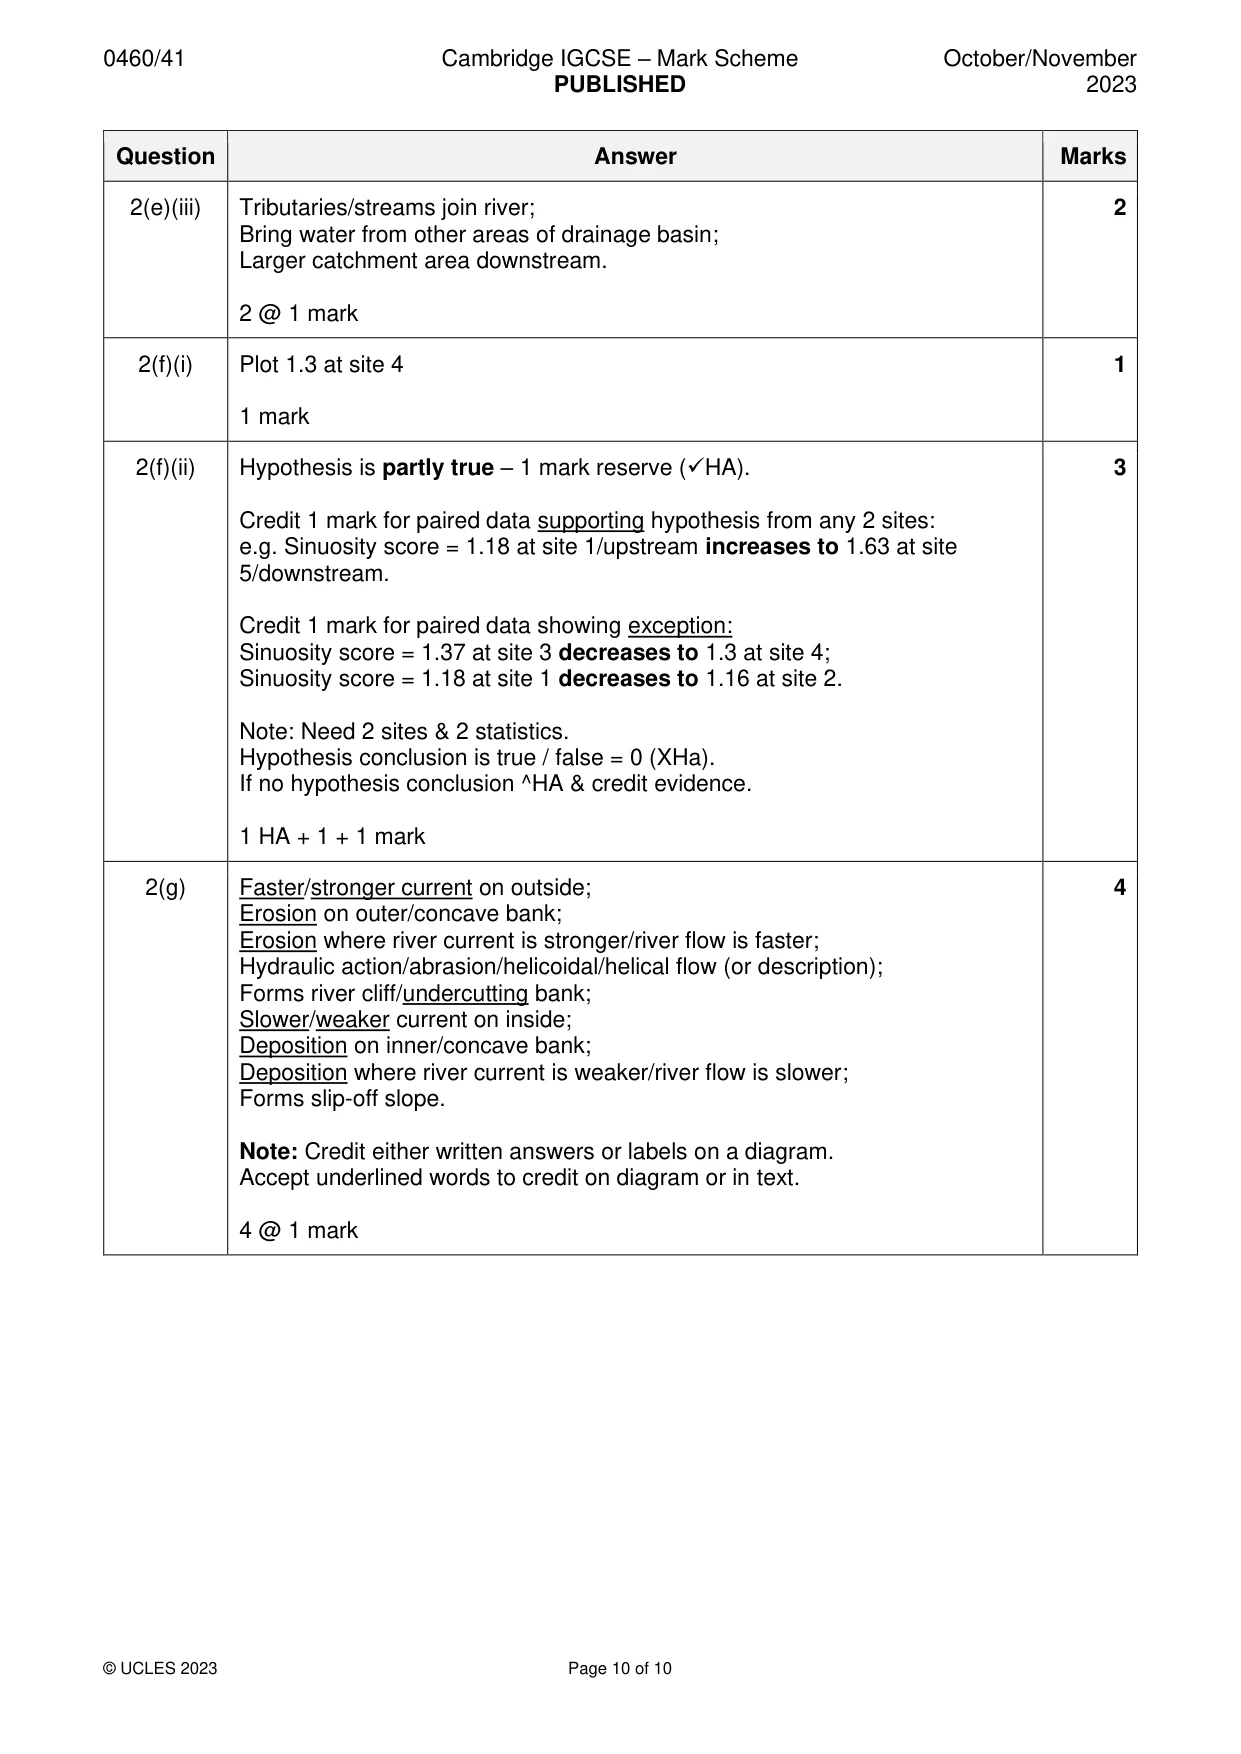
Mark scheme: 2(a) 2 B source C tributary D confluence E meander 4 correct = 2 marks, 2 or 3 correct = 1 mark, 0/1 correct = 0 2(b) The volume of water which flows through a river channel in a given time 1 1 mark 2(c)(i) Not go to area where the river is fast flowing/strong current/velocity; 3 Not go to where river is too deep/too wide/banks are unstable/depth/width; (Away from) human impact/dam/weir/canalised section/artificial levees; (Away from) waterfalls/rapids; Away from slippery rocks; Not in private land/farmers’ fields/make sure that land is open to public; Not go to areas where river is polluted/water pollution/pollution level; Avoid dangerous animals/mosquitoes; Accessibility of sites (from road/school); Distance between sites/evenly spaced/spread out/upstream & downstream/ different river sections/different courses. 3 @ 1 mark 2(c)(ii) Agree methodology/what measurements to take/where each student works/ 2 what each student does/who does what/teamwork; Practise fieldwork techniques/learn how to use equipment/learn how to measure everything/avoid mistakes when measuring/what needs to be done to improve/know what to do; Test equipment/make sure equipment works/decide what equipment is needed/replace broken equipment. 2 @ 1 mark 2(d)(i) Either: 4 Measure a fixed/certain distance/5–10 metres along river; Put poles/sticks/students at start and end (of fixed distance)/10m apart/mark start & finish points; Put float/orange in river at start of measured distance; Start stopwatch or timer when float/orange is put in river; (Stopwatch or timer) measures time it takes to travel the measured distance/ stop stopwatch or timer when float reaches end of measured distance; Repeat task at points across river channel/repeat task and calculate average. OR: Put velocity meter/propeller/flowmeter below surface of river/into the water; Propeller/flowmeter must be facing upstream/nothing in front of propeller; Read/look at digital reading or display/speed is shown on display; Take several readings and calculate average. 4 @ 1 mark 2(d)(ii) Width of channel: 4 Stretch/put/use tape measure across river/from bank to bank/side to side/ measuring tape from bank to bank; Keep tape measure taut/horizontal/stretched/tight; Measure perpendicular/at right angles to banks/straight across/directly opposite; Measure where tape touches the banks. Depth of river: Rest ruler or metre rule on river bed/ground (inside river)/bottom; Measure vertically/perpendicular to surface; Measure where water level is /wet part of ruler/measure where water surface touches ruler/look at number at the water level; Measure at equal points across channel. Note: Reserve 1 mark for width and 1 mark for depth. 4 @ 1 mark 2(d)(iii) 0.46 Accept 0.5 (m) 1 1 mark 2(e)(i) Plot 1.4 cumecs at site 4 1 1 mark 2(e)(ii) Hypothesis is true – 1 mark reserve (✓HA). 2 Credit 1 mark for paired data from any two sites e.g.: 0.12 cumecs at site 1/upstream & 2.62 cumecs at site 5/downstream. Note: Hypothesis conclusion is false / partially true = 0 (XHa). If no hypothesis conclusion ^HA & credit evidence. 1 HA + 1 mark 2(e)(iii) Tributaries/streams join river; 2 Bring water from other areas of drainage basin; Larger catchment area downstream. 2 @ 1 mark 2(f)(i) Plot 1.3 at site 4 1 1 mark 2(f)(ii) Hypothesis is partly true – 1 mark reserve (✓HA). 3 Credit 1 mark for paired data supporting hypothesis from any 2 sites: e.g. Sinuosity score = 1.18 at site 1/upstream increases to 1.63 at site 5/downstream. Credit 1 mark for paired data showing exception: Sinuosity score = 1.37 at site 3 decreases to 1.3 at site 4; Sinuosity score = 1.18 at site 1 decreases to 1.16 at site 2. Note: Need 2 sites & 2 statistics. Hypothesis conclusion is true / false = 0 (XHa). If no hypothesis conclusion ^HA & credit evidence. 1 HA + 1 + 1 mark 2(g) Faster/stronger current on outside; 4 Erosion on outer/concave bank; Erosion where river current is stronger/river flow is faster; Hydraulic action/abrasion/helicoidal/helical flow (or description); Forms river cliff/undercutting bank; Slower/weaker current on inside; Deposition on inner/concave bank; Deposition where river current is weaker/river flow is slower; Forms slip-off slope. Note: Credit either written answers or labels on a diagram. Accept underlined words to credit on diagram or in text. 4 @ 1 mark
What was in this paper
The subtopics covered by these 2 questions, and how many questions each got. Open one in a new tab to see every Cambridge question on it.
What you needed in this session
Cambridge’s own grade thresholds for 2023 Oct/Nov, Paper 4 · Variant 1. A higher threshold means an easier paper — the bar moves with how the cohort did.