Cambridge IGCSE Geography 0460 — 2024 Oct/Nov Paper 4 · Variant 1
0460/41/O/N/24 · 2 questions · 60 marks · ≈68 min
The question paper and its mark scheme, free to read here and free to download. This is Cambridge’s own paper, exactly as it was sat.
Question paper20 pages

Mark scheme10 pages
Answers below. Sit the paper first if you are practising.
Questions as text
Q1 · Students in a class in Foshan, China, did fieldwork at a large new commercial centre…
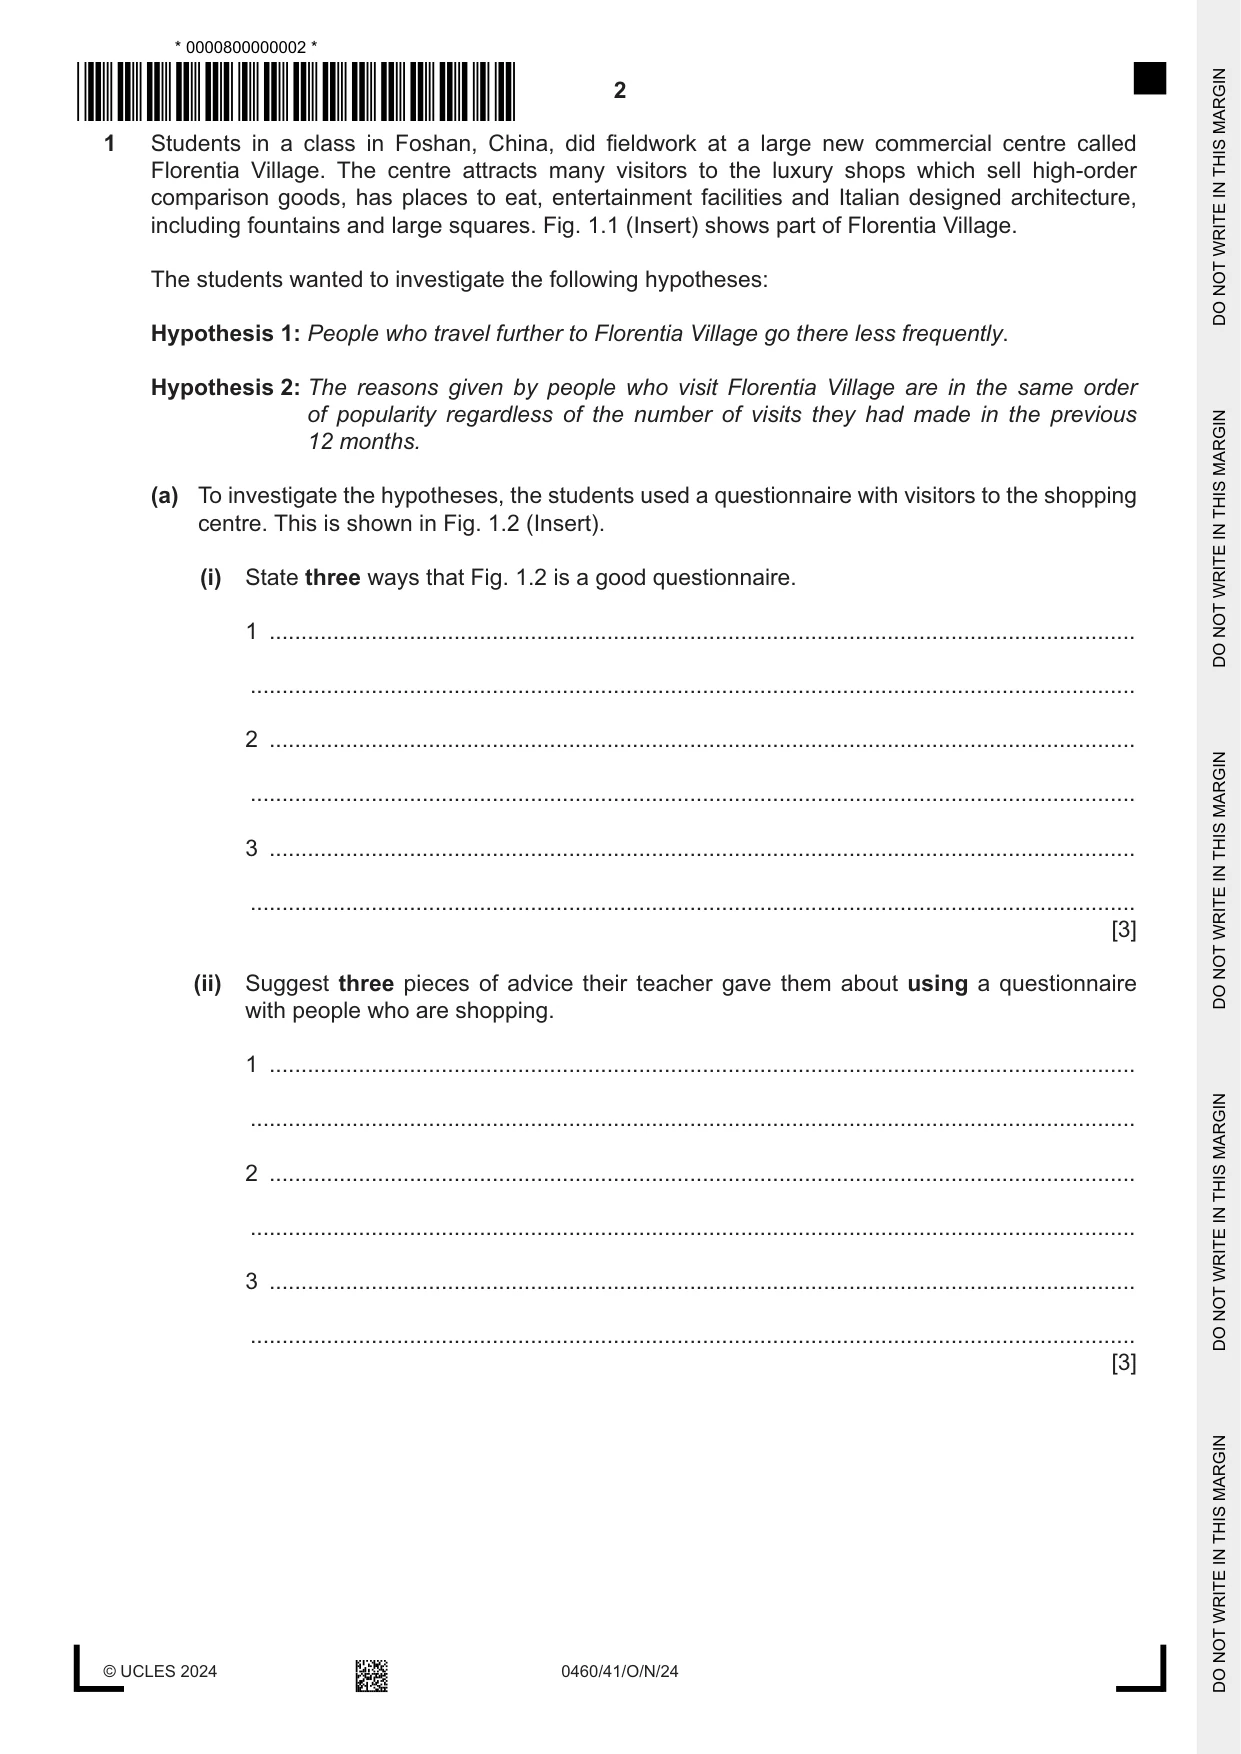
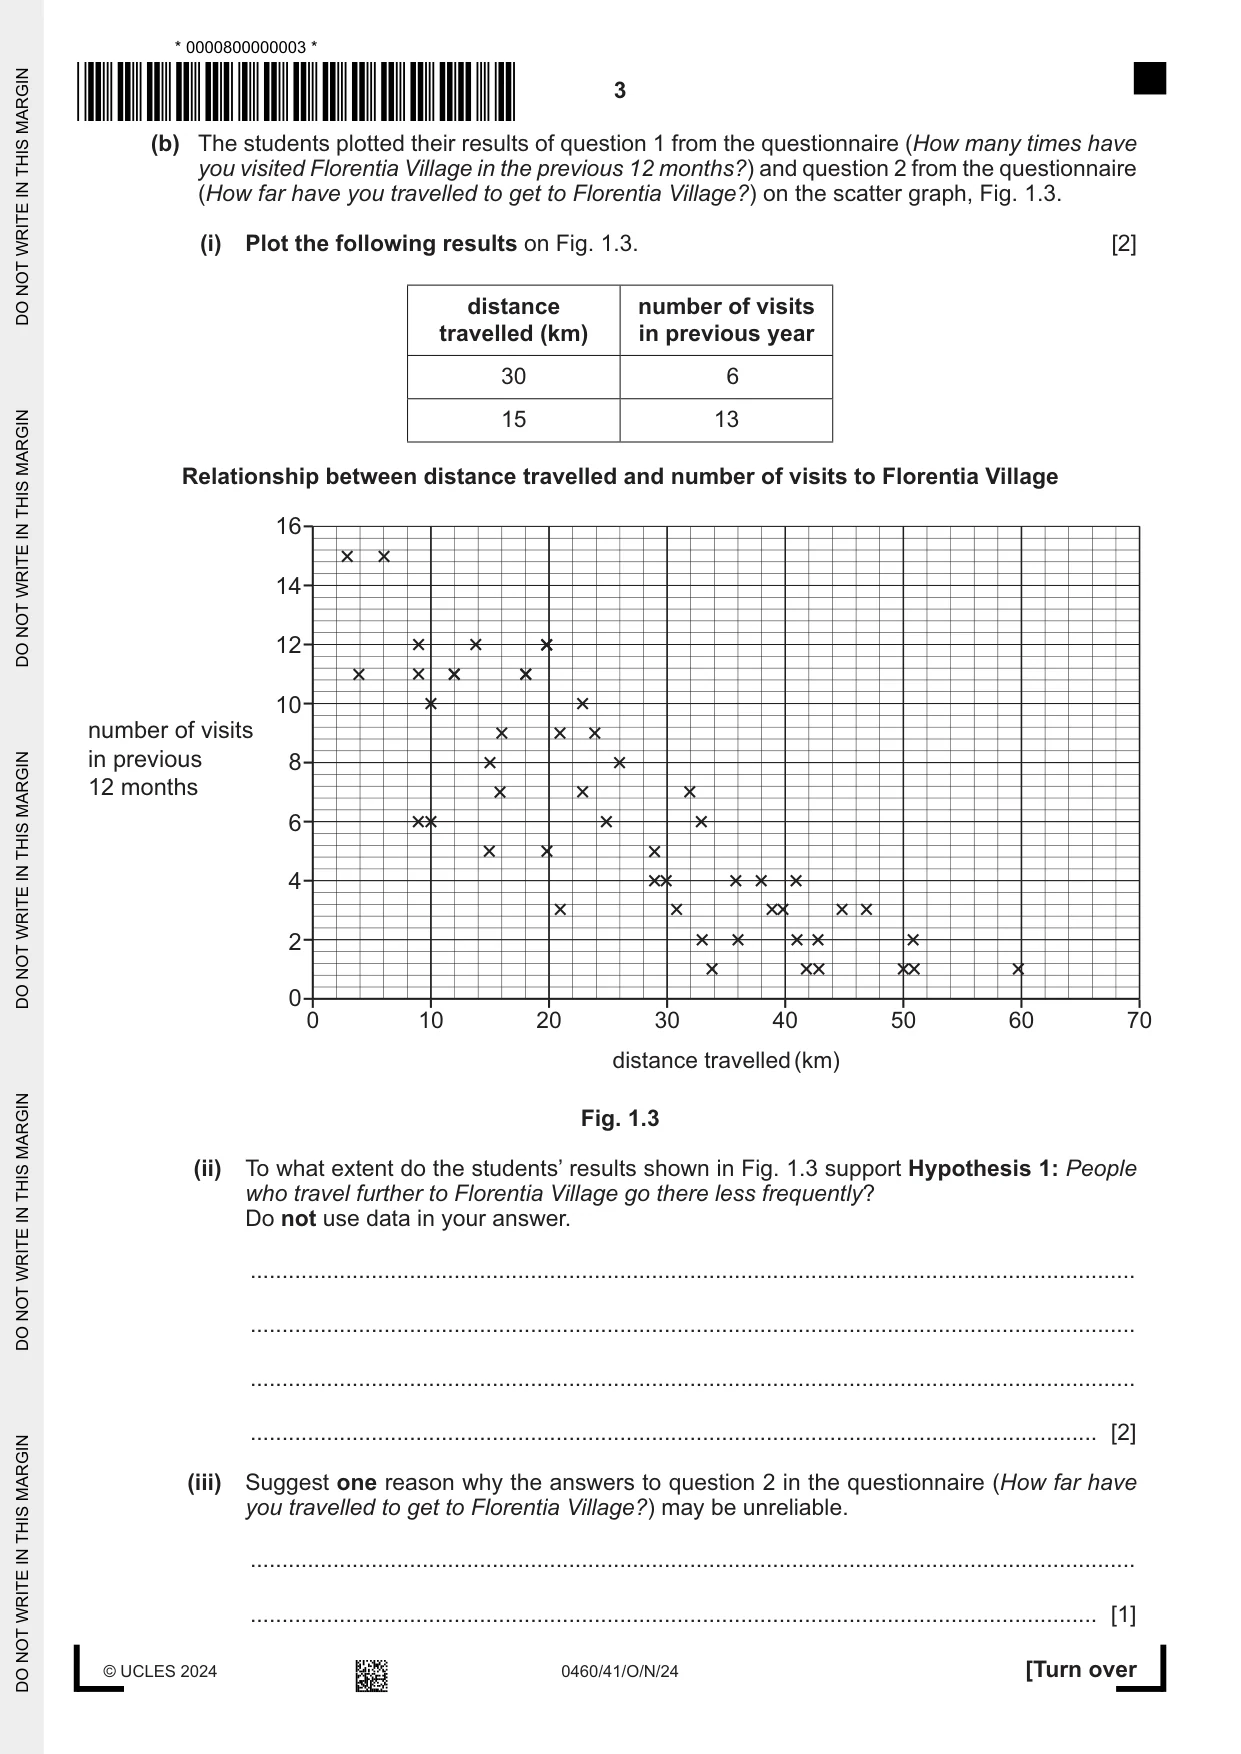
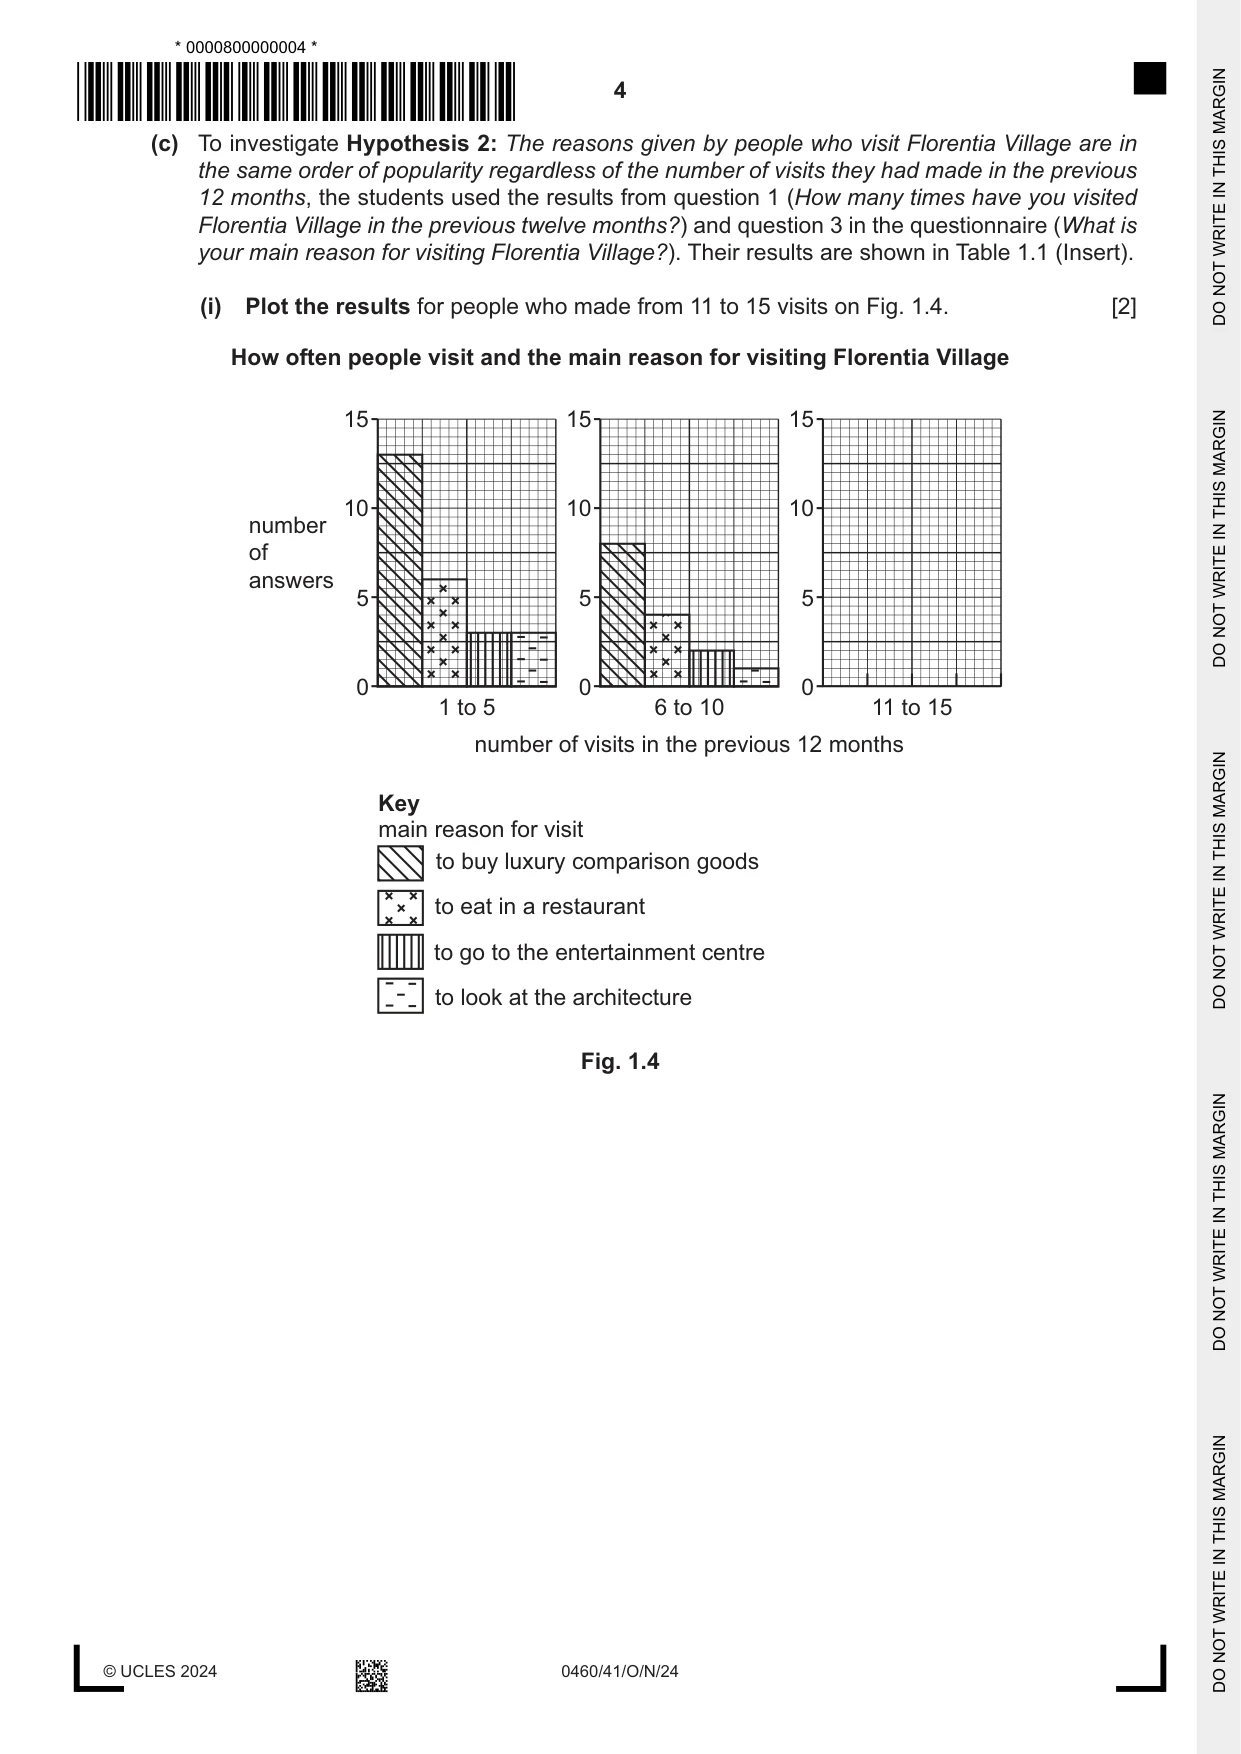
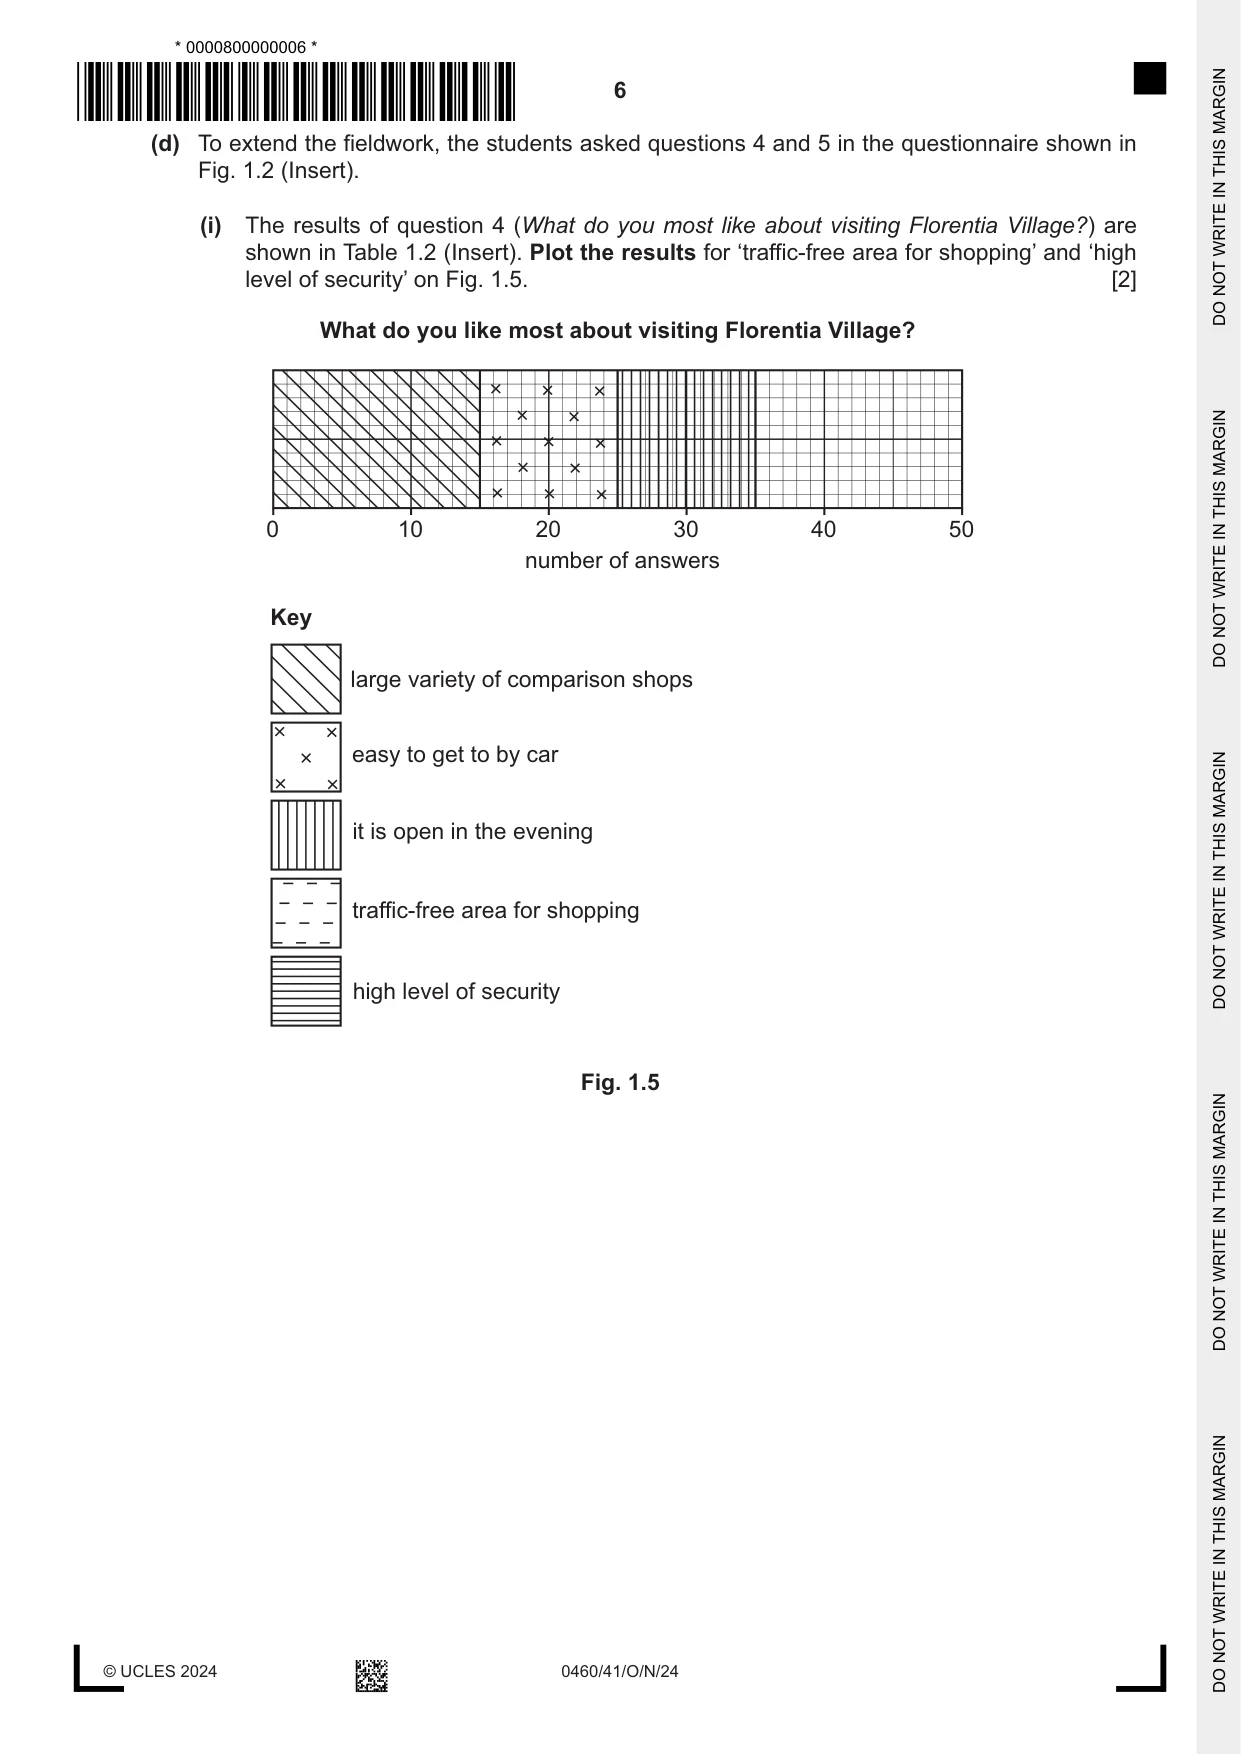
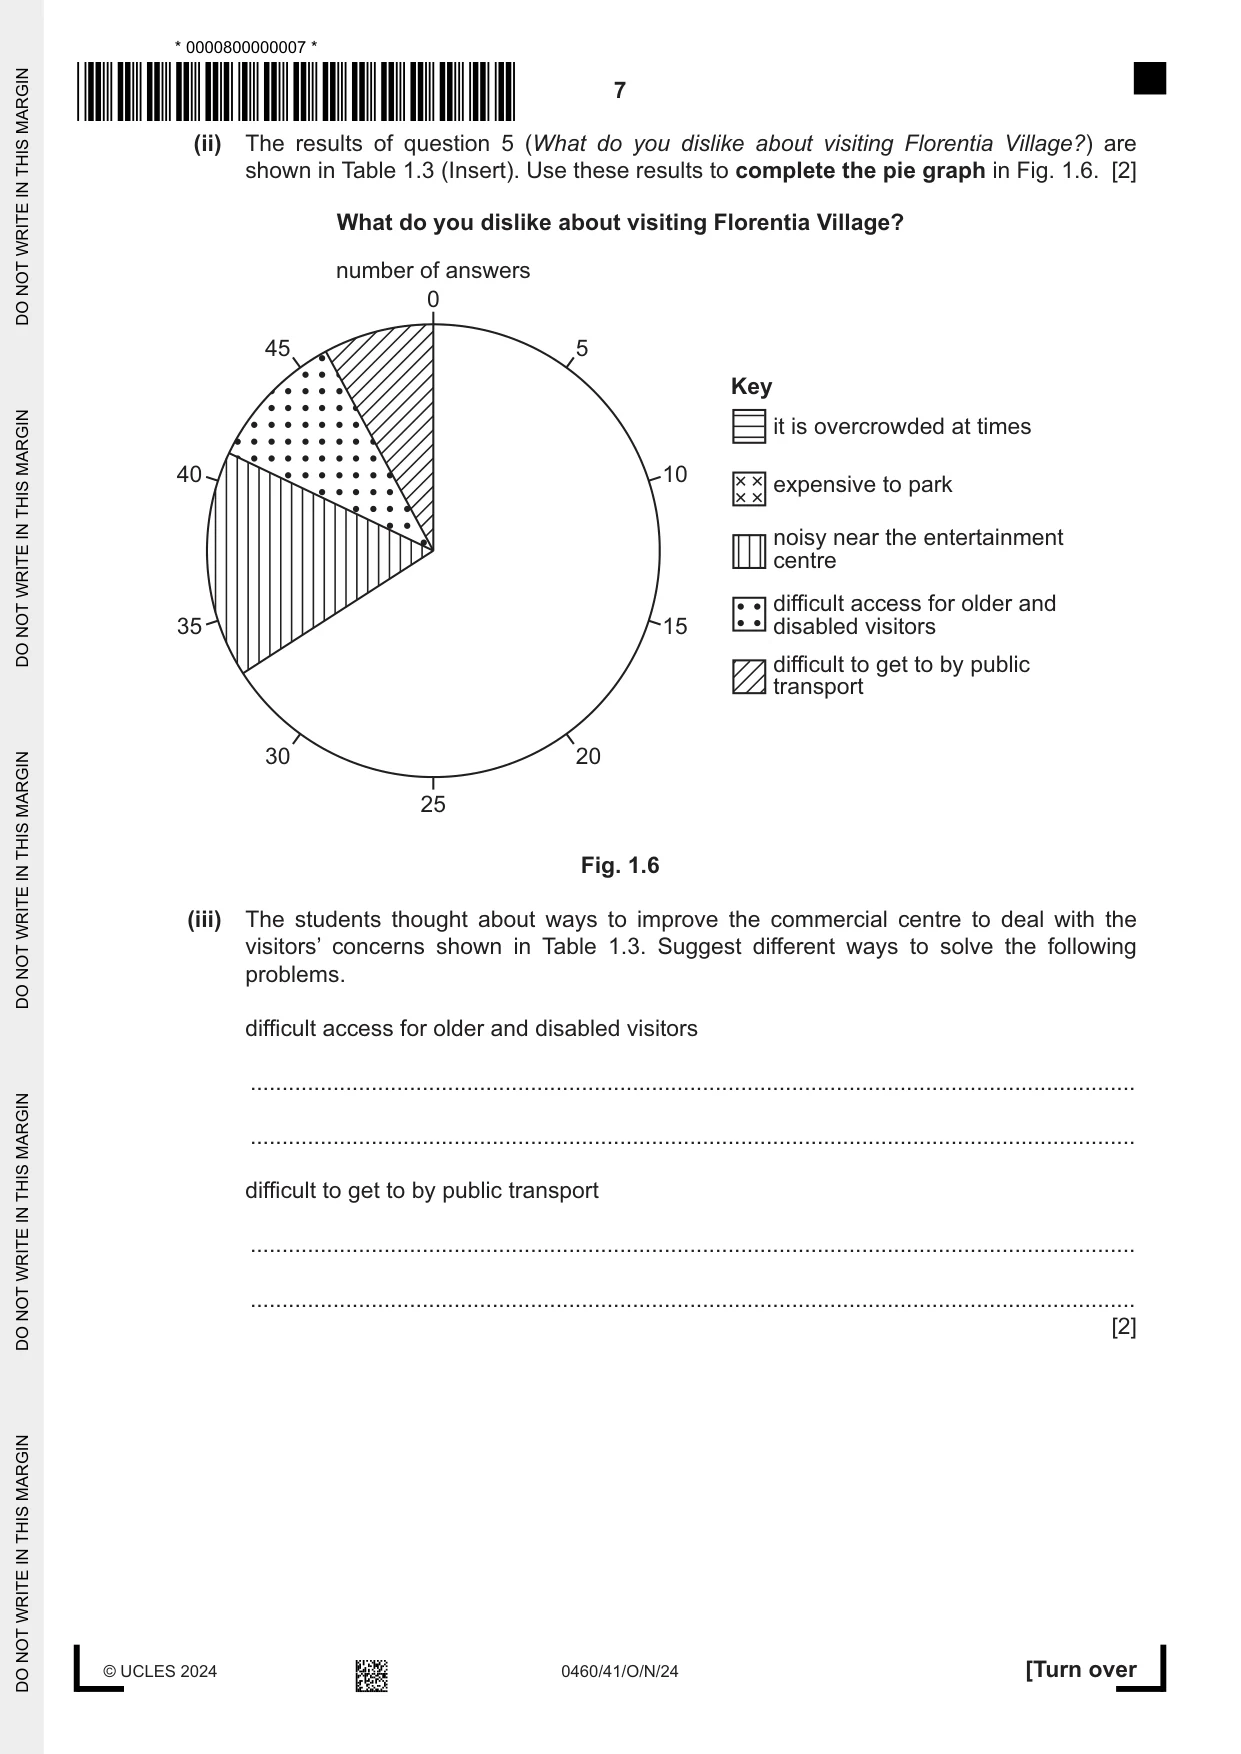
1 Students in a class in Foshan, China, did fieldwork at a large new commercial centre called Florentia Village. The centre attracts many visitors to the luxury shops which sell high-order comparison goods, has places to eat, entertainment facilities and Italian designed architecture, including fountains and large squares. Fig. 1.1 (Insert) shows part of Florentia Village. The students wanted to investigate the following hypotheses: Hypothesis 1: People who travel further to Florentia Village go there less frequently. Hypothesis 2: The reasons given by people who visit Florentia Village are in the same order of popularity regardless of the number of visits they had made in the previous 12 months. (a) To investigate the hypotheses, the students used a questionnaire with visitors to the shopping centre. This is shown in Fig. 1.2 (Insert). (i) State three ways that Fig. 1.2 is a good questionnaire. 1 ........................................................................................................................................ ........................................................................................................................................... 2 ........................................................................................................................................ ........................................................................................................................................... 3 ........................................................................................................................................ ........................................................................................................................................... [3] (ii) Suggest three pieces of advice their teacher gave them about using a questionnaire with people who are shopping. 1 ........................................................................................................................................ ........................................................................................................................................... 2 ........................................................................................................................................ ........................................................................................................................................... 3 ........................................................................................................................................ ........................................................................................................................................... [3] (b) The students plotted their results of question 1 from the questionnaire (How many times have you visited Florentia Village in the previous 12 months?) and question 2 from the questionnaire (How far have you travelled to get to Florentia Village?) on the scatter graph, Fig. 1.3. (i) Plot the following results on Fig. 1.3. [2] distance number of visits travelled (km) in previous year 30 6 15 13 Relationship between distance travelled and number of visits to Florentia Village 16 14 12 10 number of visits in previous 8 12 months 6 4 2 0 0 10 20 30 40 50 60 70 distance travelled (km) Fig. 1.3 (ii) To what extent do the students’ results shown in Fig. 1.3 support Hypothesis 1: People who travel further to Florentia Village go there less frequently? Do not use data in your answer. ........................................................................................................................................... ........................................................................................................................................... ........................................................................................................................................... ..................................................................................................................................... [2] (iii) Suggest one reason why the answers to question 2 in the questionnaire (How far have you travelled to get to Florentia Village?) may be unreliable. ........................................................................................................................................... ..................................................................................................................................... [1] (c) To investigate Hypothesis 2: The reasons given by people who visit Florentia Village are in the same order of popularity regardless of the number of visits they had made in the previous 12 months, the students used the results from question 1 (How many times have you visited Florentia Village in the previous twelve months?) and question 3 in the questionnaire (What is your main reason for visiting Florentia Village?). Their results are shown in Table 1.1 (Insert). (i) Plot the results for people who made from 11 to 15 visits on Fig. 1.4. [2] How often people visit and the main reason for visiting Florentia Village 1515 1515 1515 1010 1010 1010 numbernumber ofof answersanswers 5 5 5 0 0 0 11 toto 55 66 toto 1010 1111 toto 1515 numbernumber ofof visitsvisits inin thethe previousprevious 1212 monthsmonths KeyKey mainmain reasonreason forfor visitvisit toto buybuy luxuryluxury comparisoncomparison goodsgoods toto eateat inin aa restaurantrestaurant toto gogo toto thethe entertainmententertainment centrecentre toto looklook atat thethe architecturearchitecture Fig. 1.4 (ii) The students decided that Hypothesis 2: The reasons given by people who visit Florentia Village are in the same order of popularity regardless of the number of visits they had made in the previous 12 months was true. From Table 1.1 and Fig. 1.4, identify evidence that supports this decision and evidence that does not support it. evidence that supports the decision ........................................................................................................................................... ........................................................................................................................................... ........................................................................................................................................... ........................................................................................................................................... evidence that does not support the decision ........................................................................................................................................... ........................................................................................................................................... ........................................................................................................................................... ........................................................................................................................................... [4] (iii) Suggest two reasons why people go to commercial centres such as Florentia Village to buy luxury comparison goods. 1 ........................................................................................................................................ ........................................................................................................................................... 2 ........................................................................................................................................ ........................................................................................................................................... [2] (d) To extend the fieldwork, the students asked questions 4 and 5 in the questionnaire shown in Fig. 1.2 (Insert). (i) The results of question 4 (What do you most like about visiting Florentia Village?) are shown in Table 1.2 (Insert). Plot the results for ‘traffic-free area for shopping’ and ‘high level of security’ on Fig. 1.5. [2] What do you like most about visiting Florentia Village? 0 10 20 30 40 50 number of answers Key largelarge varietyvariety ofof comparisoncomparison shopsshops easyeasy toto getget toto byby carcar itit isis openopen inin thethe eveningevening traffic-freetraffic-free areaarea forfor shoppingshopping highhigh levellevel ofof securitysecurity Fig. 1.5 (ii) The results of question 5 (What do you dislike about visiting Florentia Village?) are shown in Table 1.3 (Insert). Use these results to complete the pie graph in Fig. 1.6. [2] What do you dislike about visiting Florentia Village? number of answers 0 45 5 Key it is overcrowded at times 40 10 expensive to park noisy near the entertainment centre difficult access for older and 35 15 disabled visitors difficult to get to by public transport 30 20 25 Fig. 1.6 (iii) The students thought about ways to improve the commercial centre to deal with the visitors’ concerns shown in Table 1.3. Suggest different ways to solve the following problems. difficult access for older and disabled visitors ........................................................................................................................................... ........................................................................................................................................... difficult to get to by public transport ........................................................................................................................................... ........................................................................................................................................... [2] (e) Some students did a pedestrian count as part of their fieldwork at the commercial centre. (i) Suggest a hypothesis they could investigate using their pedestrian count. ........................................................................................................................................... ..................................................................................................................................... [1] (ii) Describe how they would plan and do the pedestrian count. ........................................................................................................................................... ........................................................................................................................................... ........................................................................................................................................... ........................................................................................................................................... ........................................................................................................................................... ........................................................................................................................................... ........................................................................................................................................... ..................................................................................................................................... [4] [Total: 30]
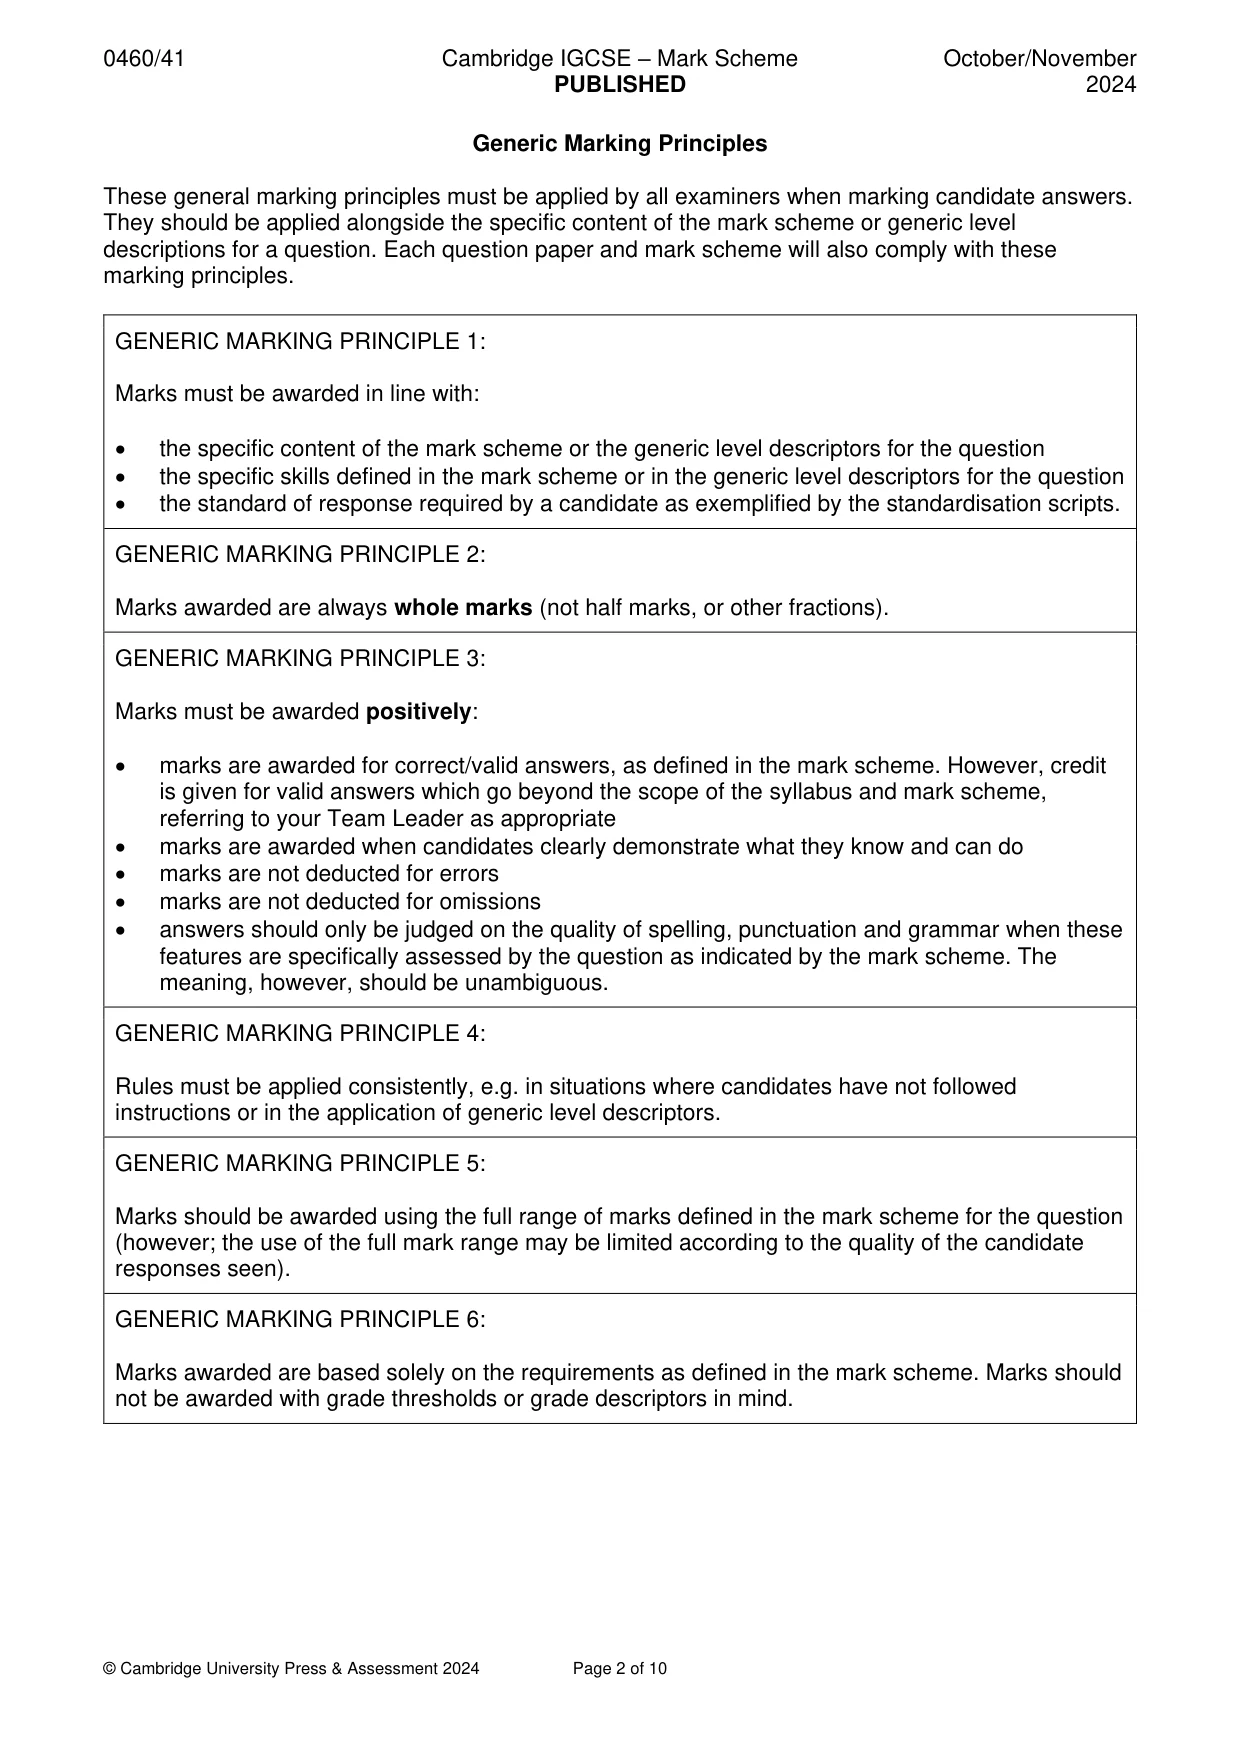
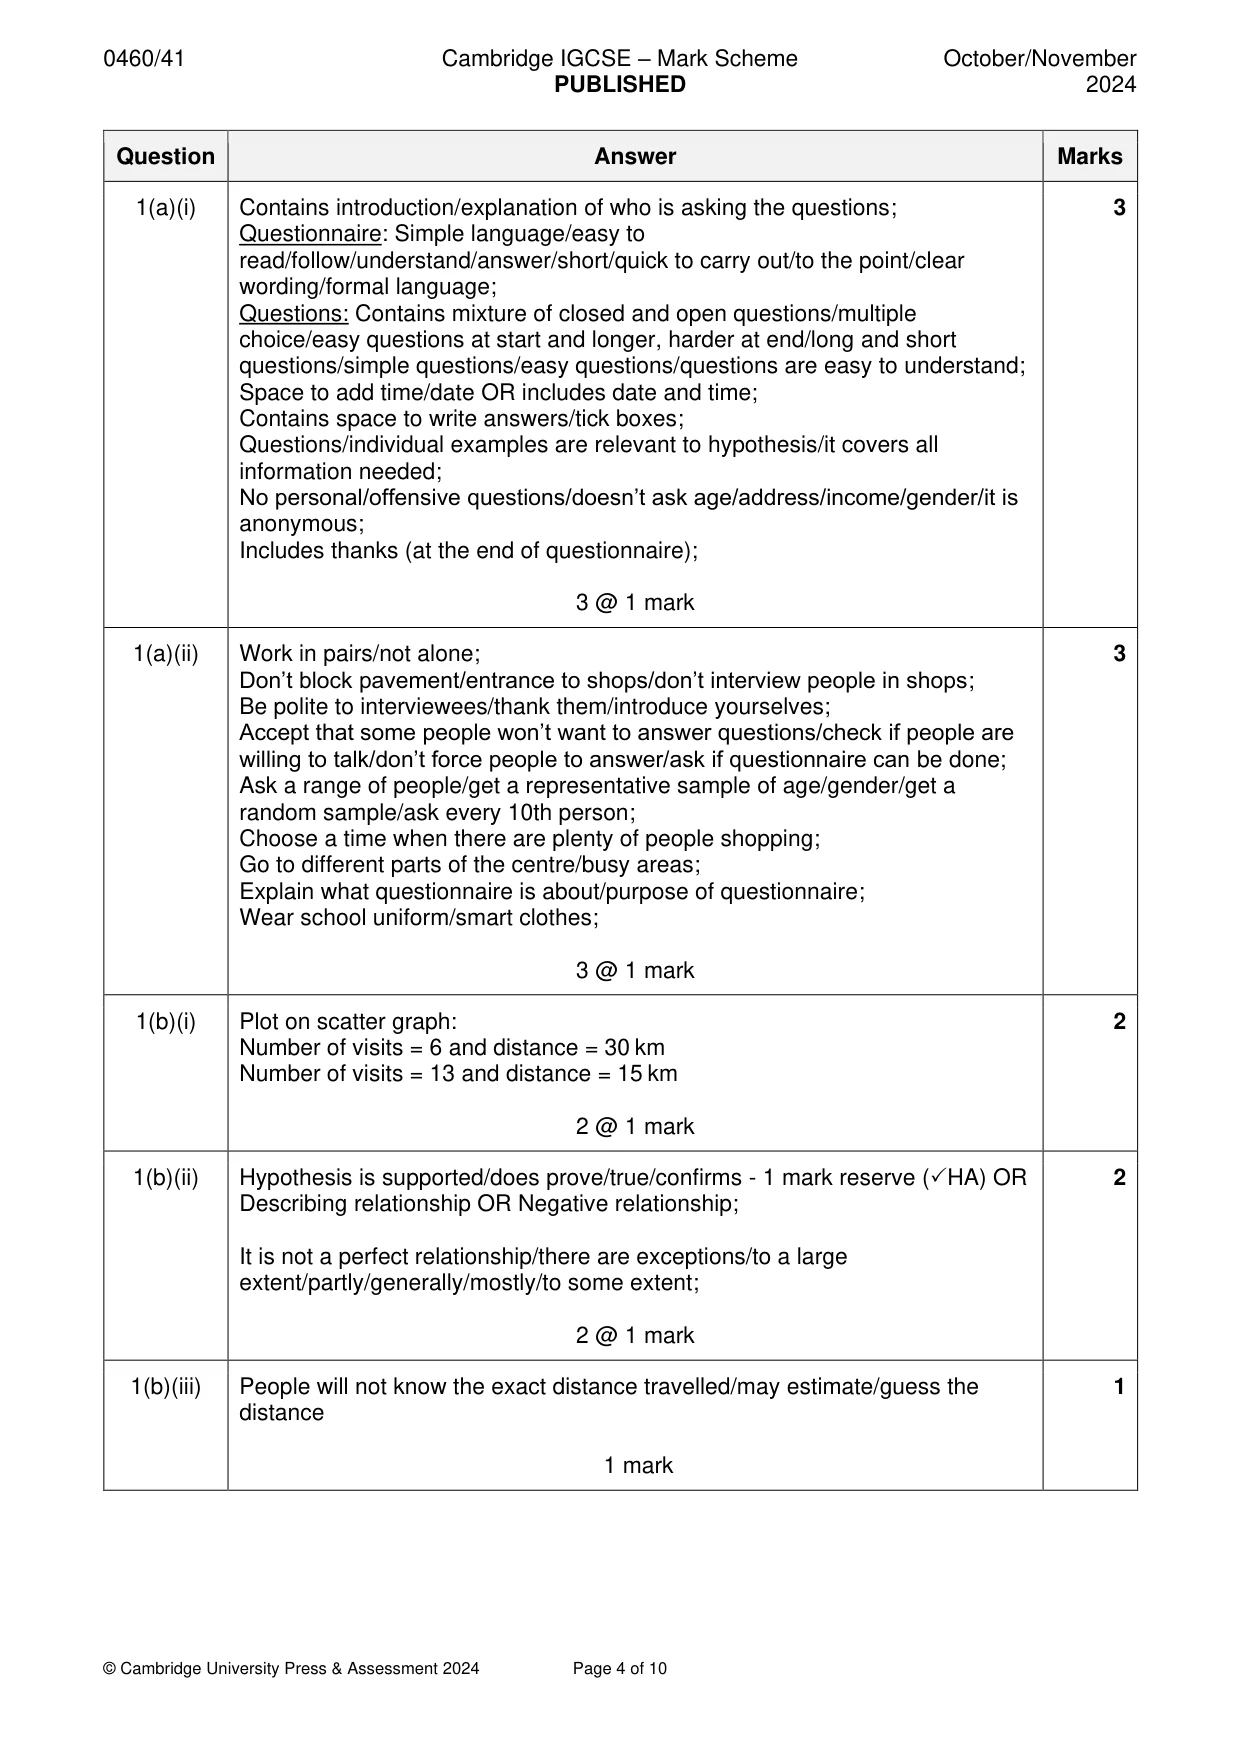
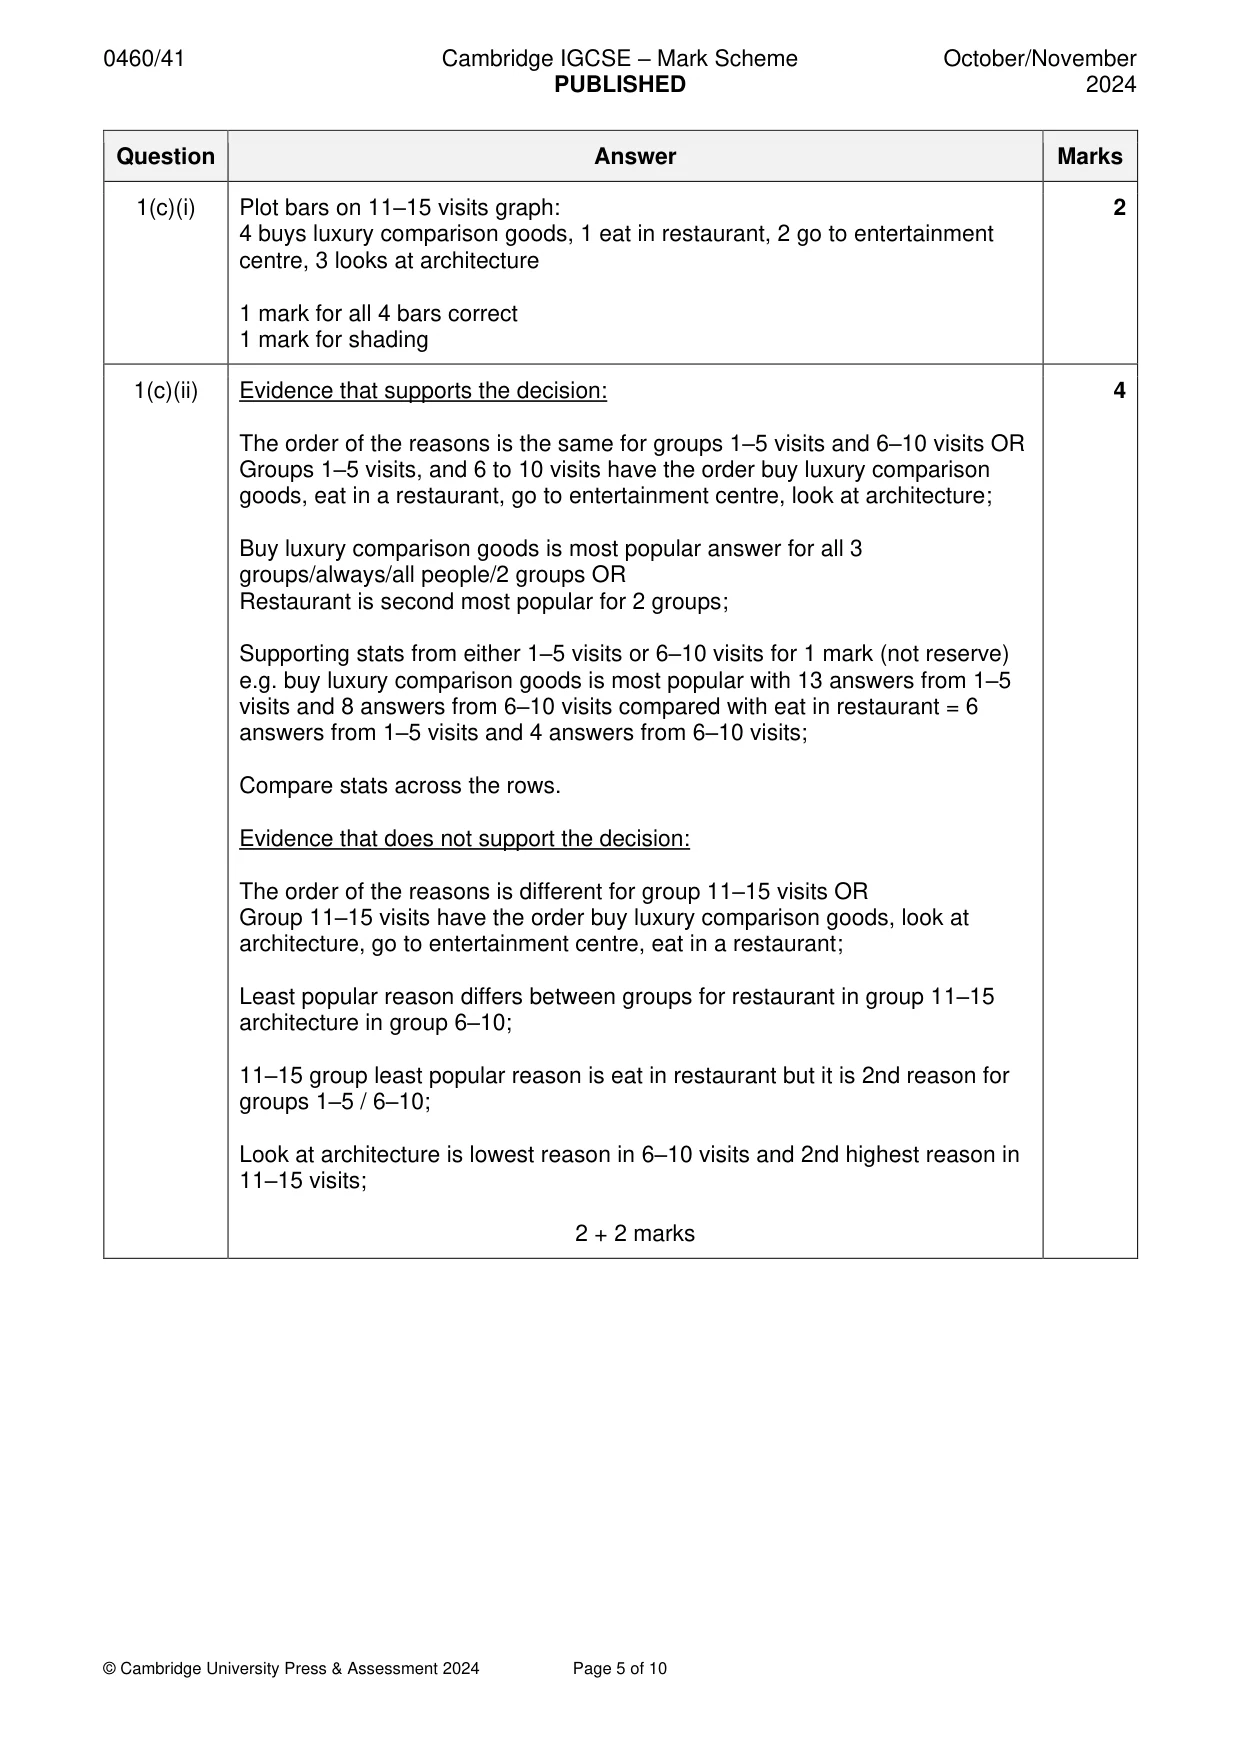
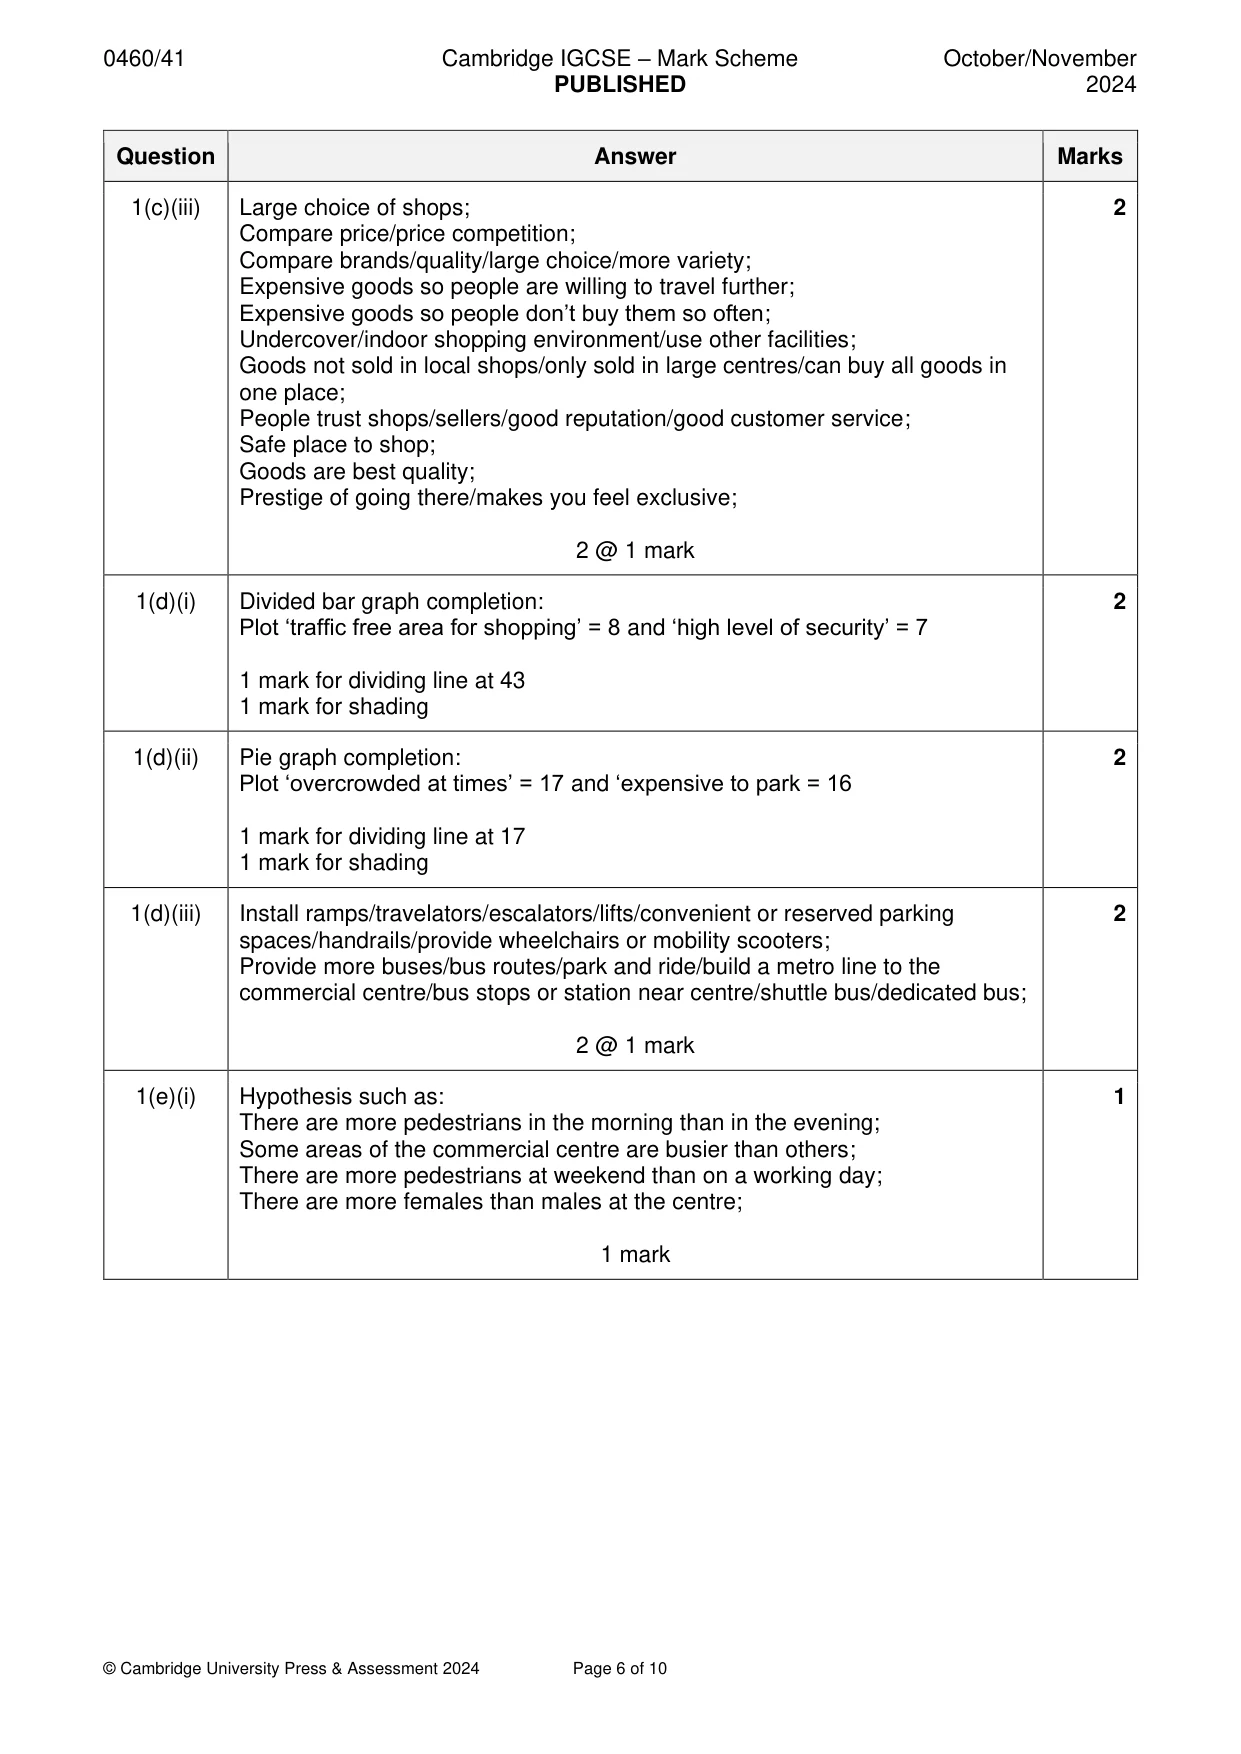
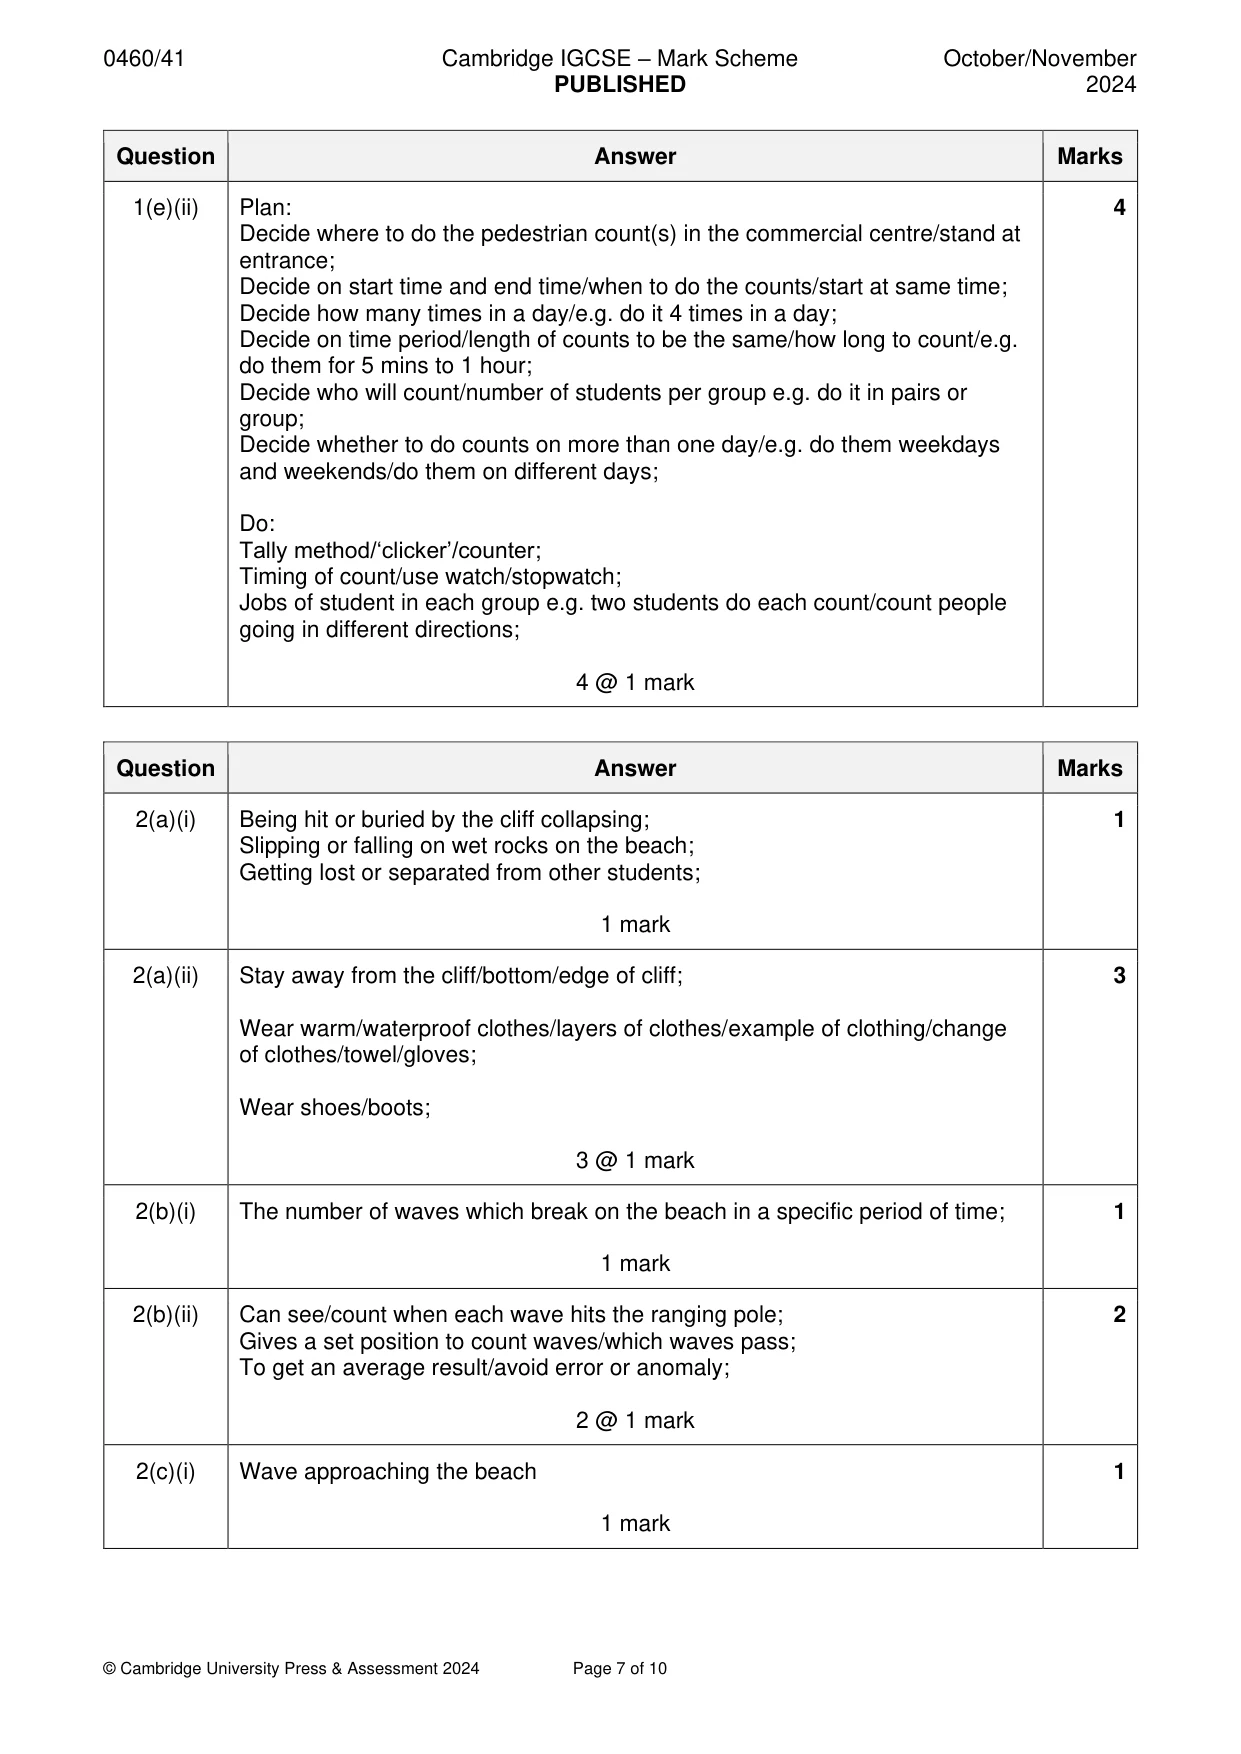
Mark scheme: Question Answer Marks 1(a)(i) Contains introduction/explanation of who is asking the questions; 3 Questionnaire: Simple language/easy to read/follow/understand/answer/short/quick to carry out/to the point/clear wording/formal language; Questions: Contains mixture of closed and open questions/multiple choice/easy questions at start and longer, harder at end/long and short questions/simple questions/easy questions/questions are easy to understand; Space to add time/date OR includes date and time; Contains space to write answers/tick boxes; Questions/individual examples are relevant to hypothesis/it covers all information needed; No personal/offensive questions/doesn’t ask age/address/income/gender/it is anonymous; Includes thanks (at the end of questionnaire); 3 @ 1 mark 1(a)(ii) Work in pairs/not alone; 3 Don’t block pavement/entrance to shops/don’t interview people in shops; Be polite to interviewees/thank them/introduce yourselves; Accept that some people won’t want to answer questions/check if people are willing to talk/don’t force people to answer/ask if questionnaire can be done; Ask a range of people/get a representative sample of age/gender/get a random sample/ask every 10th person; Choose a time when there are plenty of people shopping; Go to different parts of the centre/busy areas; Explain what questionnaire is about/purpose of questionnaire; Wear school uniform/smart clothes; 3 @ 1 mark 1(b)(i) Plot on scatter graph: 2 Number of visits = 6 and distance = 30 km Number of visits = 13 and distance = 15 km 2 @ 1 mark 1(b)(ii) Hypothesis is supported/does prove/true/confirms - 1 mark reserve (HA) OR 2 Describing relationship OR Negative relationship; It is not a perfect relationship/there are exceptions/to a large extent/partly/generally/mostly/to some extent; 2 @ 1 mark 1(b)(iii) People will not know the exact distance travelled/may estimate/guess the 1 distance 1 mark 1(c)(i) Plot bars on 11–15 visits graph: 2 4 buys luxury comparison goods, 1 eat in restaurant, 2 go to entertainment centre, 3 looks at architecture 1 mark for all 4 bars correct 1 mark for shading 1(c)(ii) Evidence that supports the decision: 4 The order of the reasons is the same for groups 1–5 visits and 6–10 visits OR Groups 1–5 visits, and 6 to 10 visits have the order buy luxury comparison goods, eat in a restaurant, go to entertainment centre, look at architecture; Buy luxury comparison goods is most popular answer for all 3 groups/always/all people/2 groups OR Restaurant is second most popular for 2 groups; Supporting stats from either 1–5 visits or 6–10 visits for 1 mark (not reserve) e.g. buy luxury comparison goods is most popular with 13 answers from 1–5 visits and 8 answers from 6–10 visits compared with eat in restaurant = 6 answers from 1–5 visits and 4 answers from 6–10 visits; Compare stats across the rows. Evidence that does not support the decision: The order of the reasons is different for group 11–15 visits OR Group 11–15 visits have the order buy luxury comparison goods, look at architecture, go to entertainment centre, eat in a restaurant; Least popular reason differs between groups for restaurant in group 11–15 architecture in group 6–10; 11–15 group least popular reason is eat in restaurant but it is 2nd reason for groups 1–5 / 6–10; Look at architecture is lowest reason in 6–10 visits and 2nd highest reason in 11–15 visits; 2 + 2 marks 1(c)(iii) Large choice of shops; 2 Compare price/price competition; Compare brands/quality/large choice/more variety; Expensive goods so people are willing to travel further; Expensive goods so people don’t buy them so often; Undercover/indoor shopping environment/use other facilities; Goods not sold in local shops/only sold in large centres/can buy all goods in one place; People trust shops/sellers/good reputation/good customer service; Safe place to shop; Goods are best quality; Prestige of going there/makes you feel exclusive; 2 @ 1 mark 1(d)(i) Divided bar graph completion: 2 Plot ‘traffic free area for shopping’ = 8 and ‘high level of security’ = 7 1 mark for dividing line at 43 1 mark for shading 1(d)(ii) Pie graph completion: 2 Plot ‘overcrowded at times’ = 17 and ‘expensive to park = 16 1 mark for dividing line at 17 1 mark for shading 1(d)(iii) Install ramps/travelators/escalators/lifts/convenient or reserved parking 2 spaces/handrails/provide wheelchairs or mobility scooters; Provide more buses/bus routes/park and ride/build a metro line to the commercial centre/bus stops or station near centre/shuttle bus/dedicated bus; 2 @ 1 mark 1(e)(i) Hypothesis such as: 1 There are more pedestrians in the morning than in the evening; Some areas of the commercial centre are busier than others; There are more pedestrians at weekend than on a working day; There are more females than males at the centre; 1 mark 1(e)(ii) Plan: 4 Decide where to do the pedestrian count(s) in the commercial centre/stand at entrance; Decide on start time and end time/when to do the counts/start at same time; Decide how many times in a day/e.g. do it 4 times in a day; Decide on time period/length of counts to be the same/how long to count/e.g. do them for 5 mins to 1 hour; Decide who will count/number of students per group e.g. do it in pairs or group; Decide whether to do counts on more than one day/e.g. do them weekdays and weekends/do them on different days; Do: Tally method/‘clicker’/counter; Timing of count/use watch/stopwatch; Jobs of student in each group e.g. two students do each count/count people going in different directions; 4 @ 1 mark
More questions on Settlements (rural and urban) and service provision
Q2 · Students did fieldwork on a beach near to their school
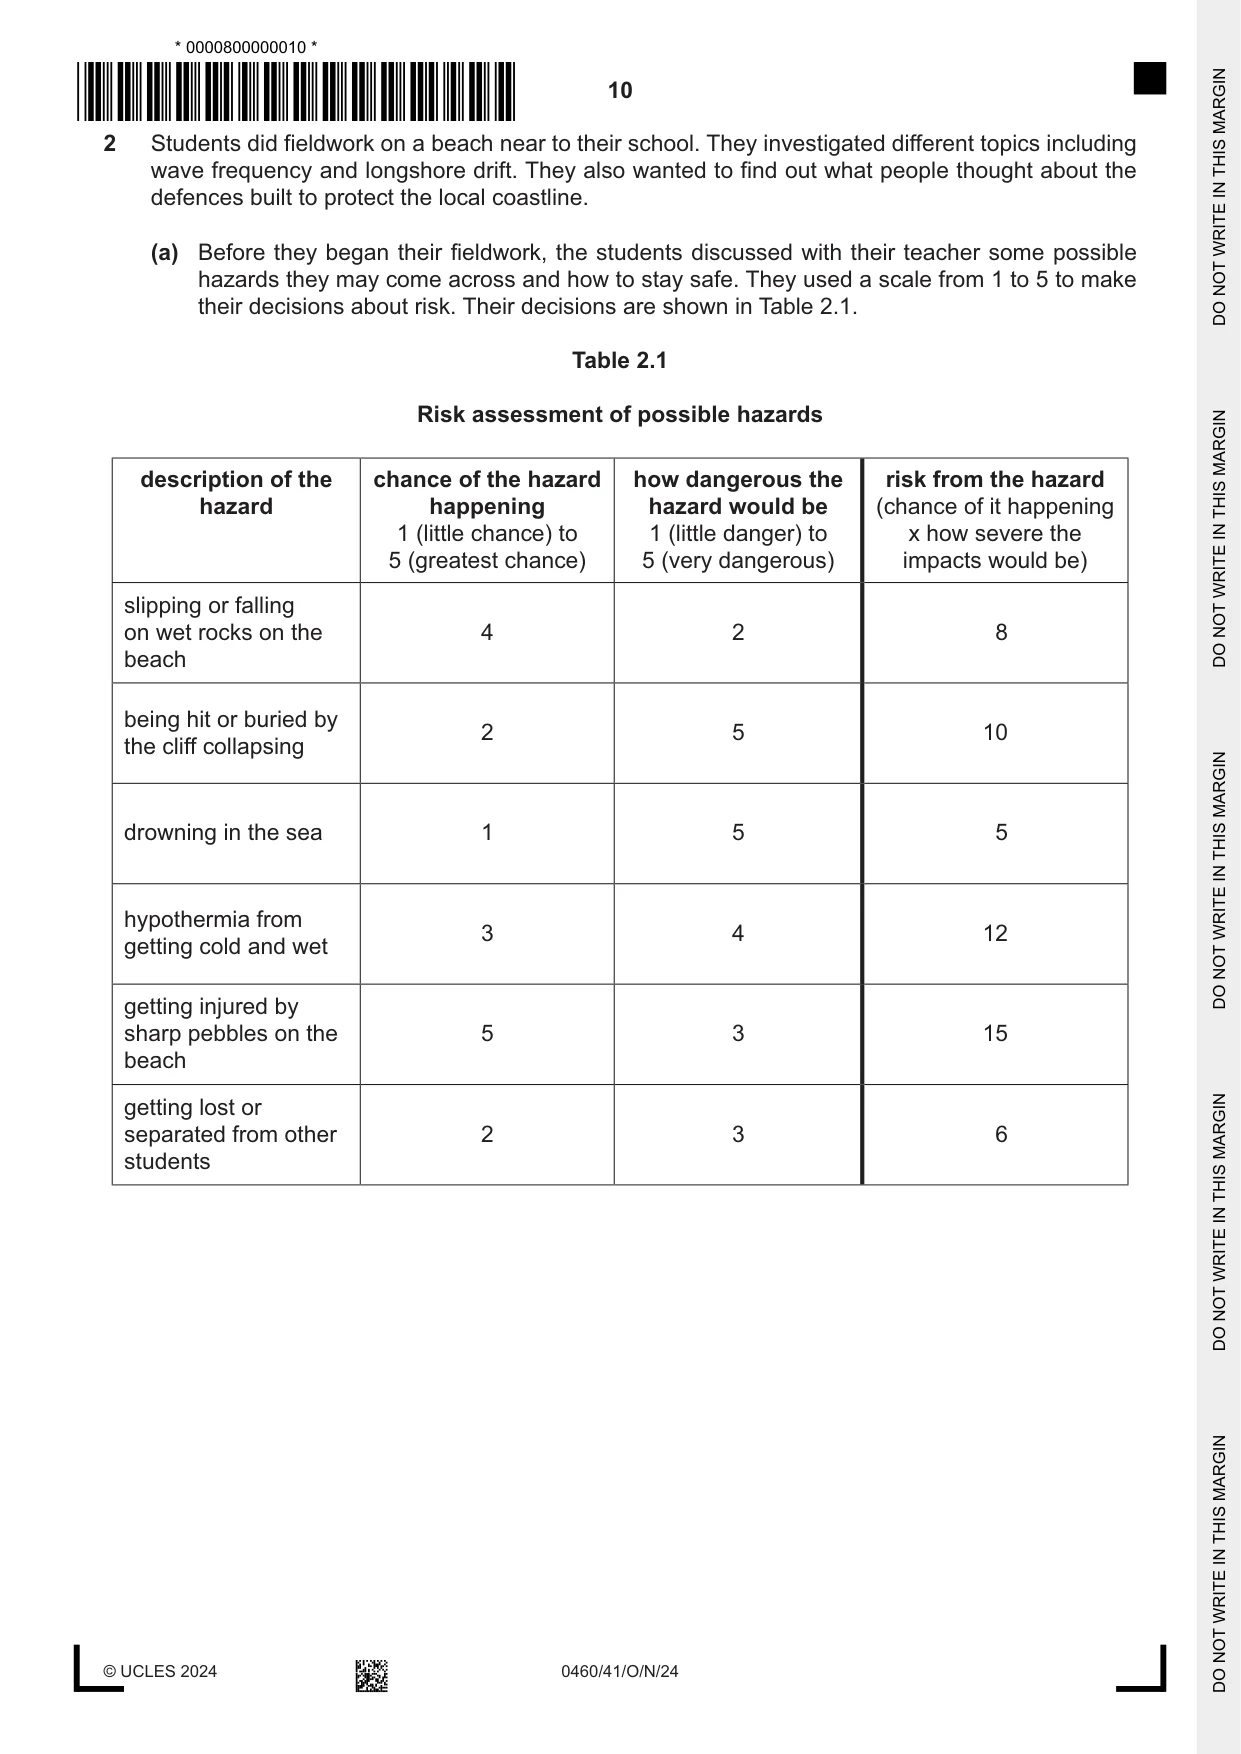
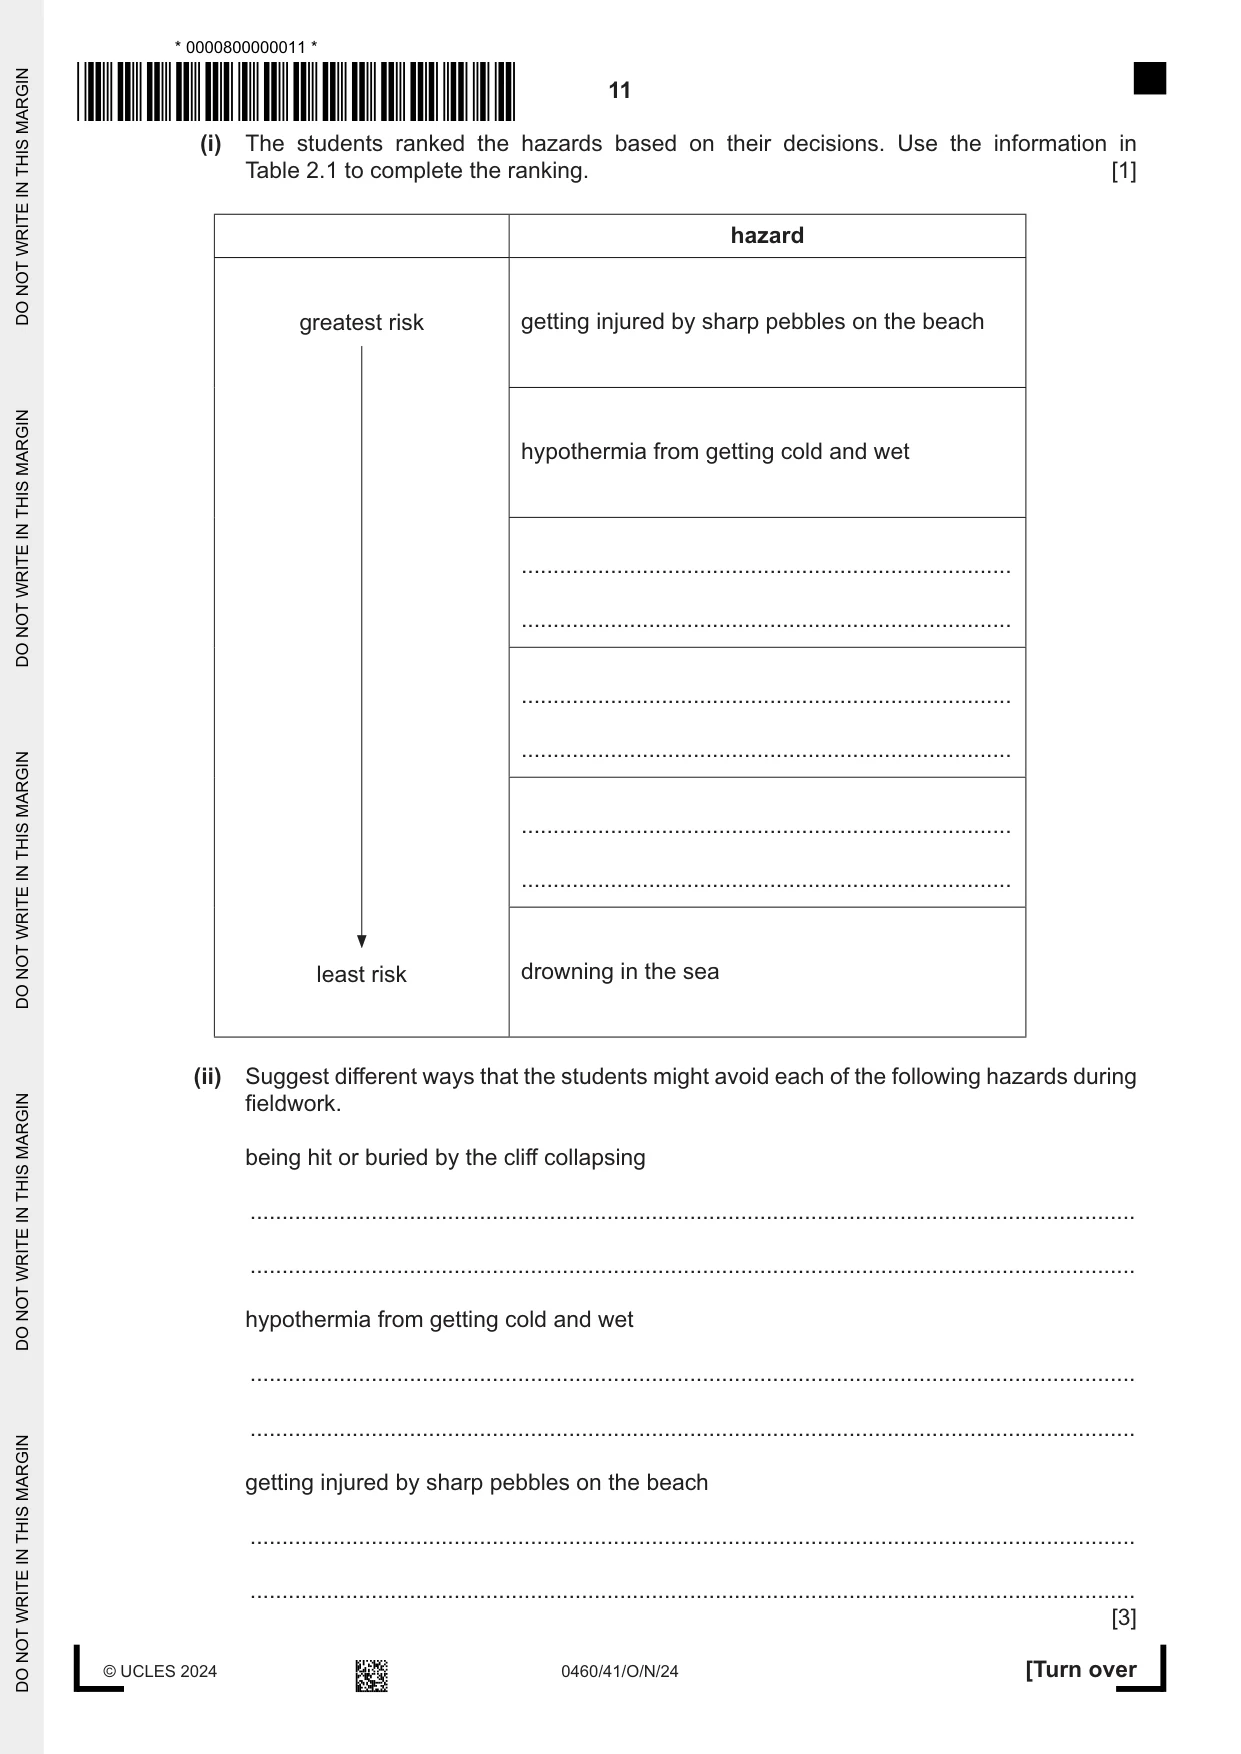
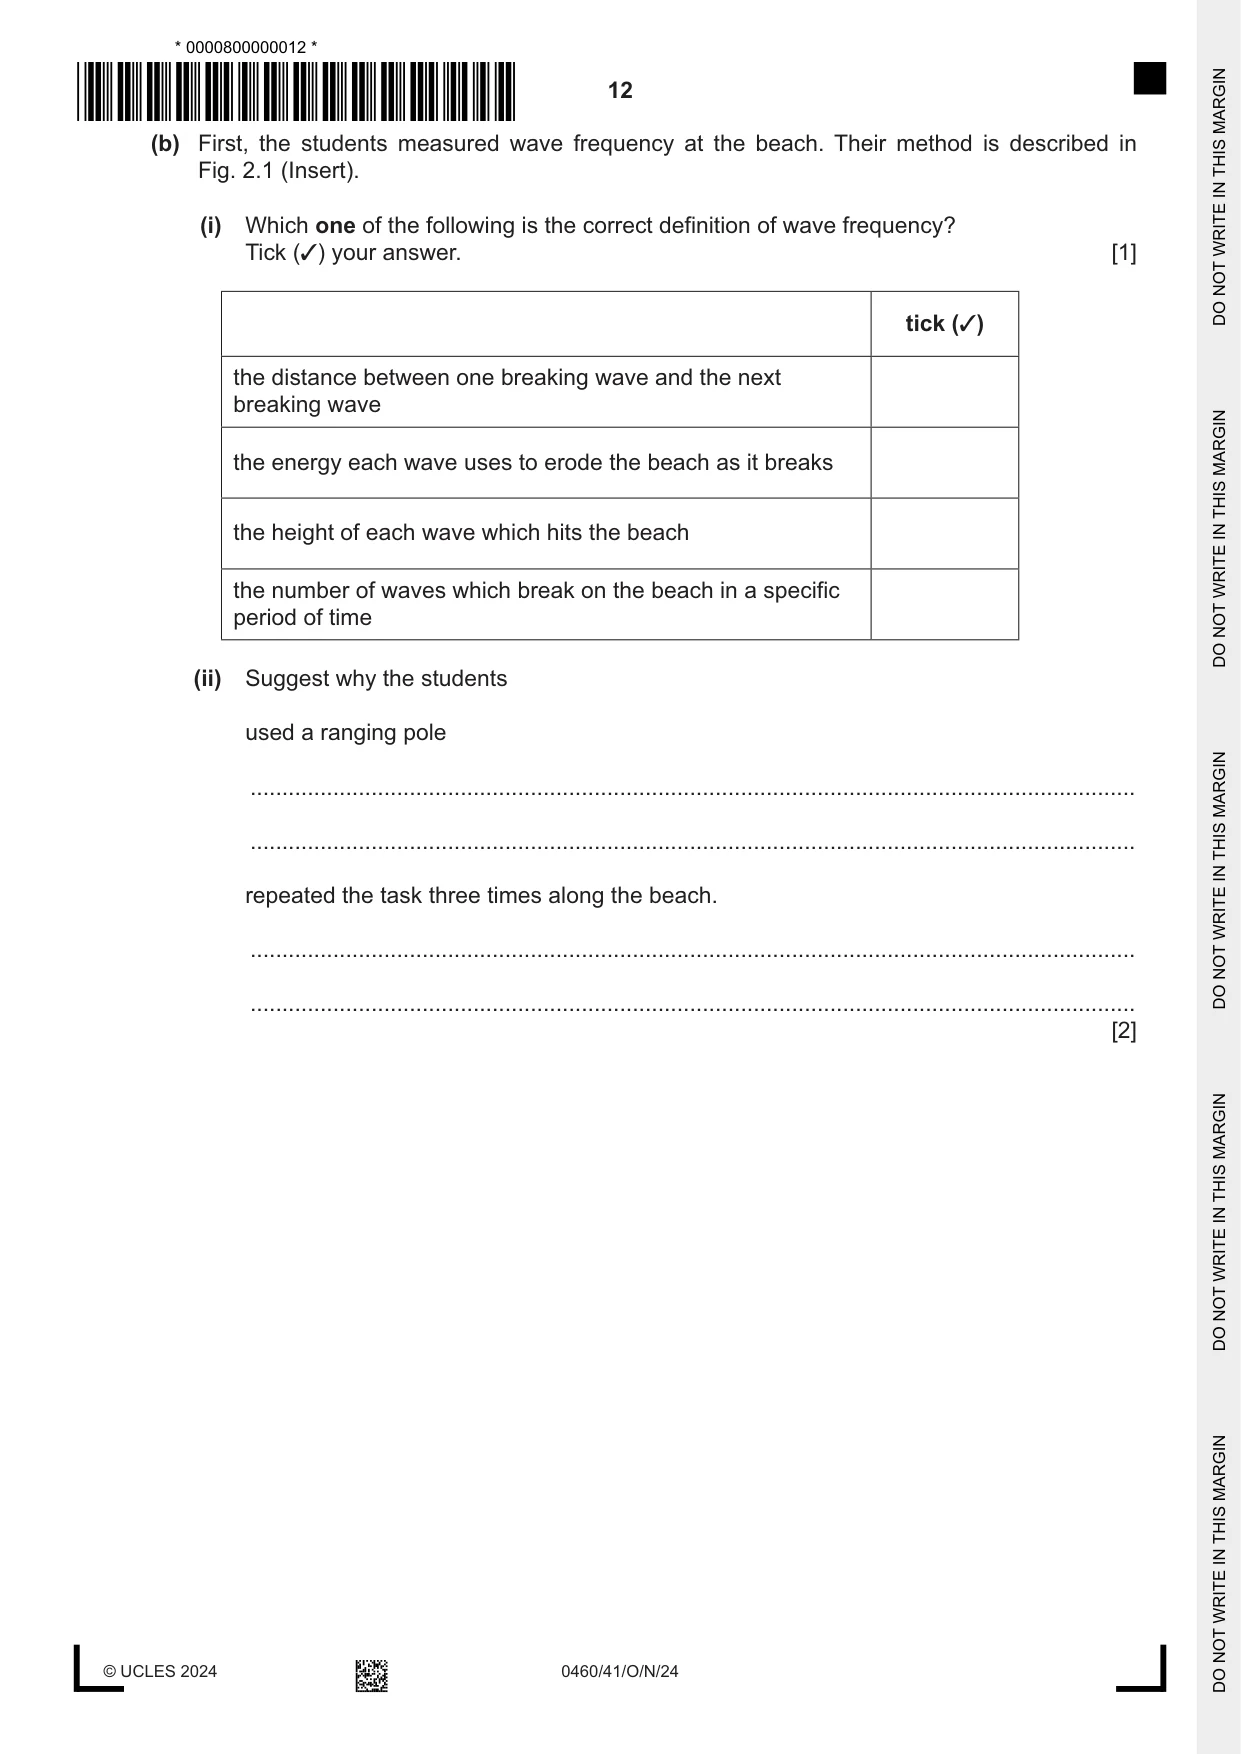
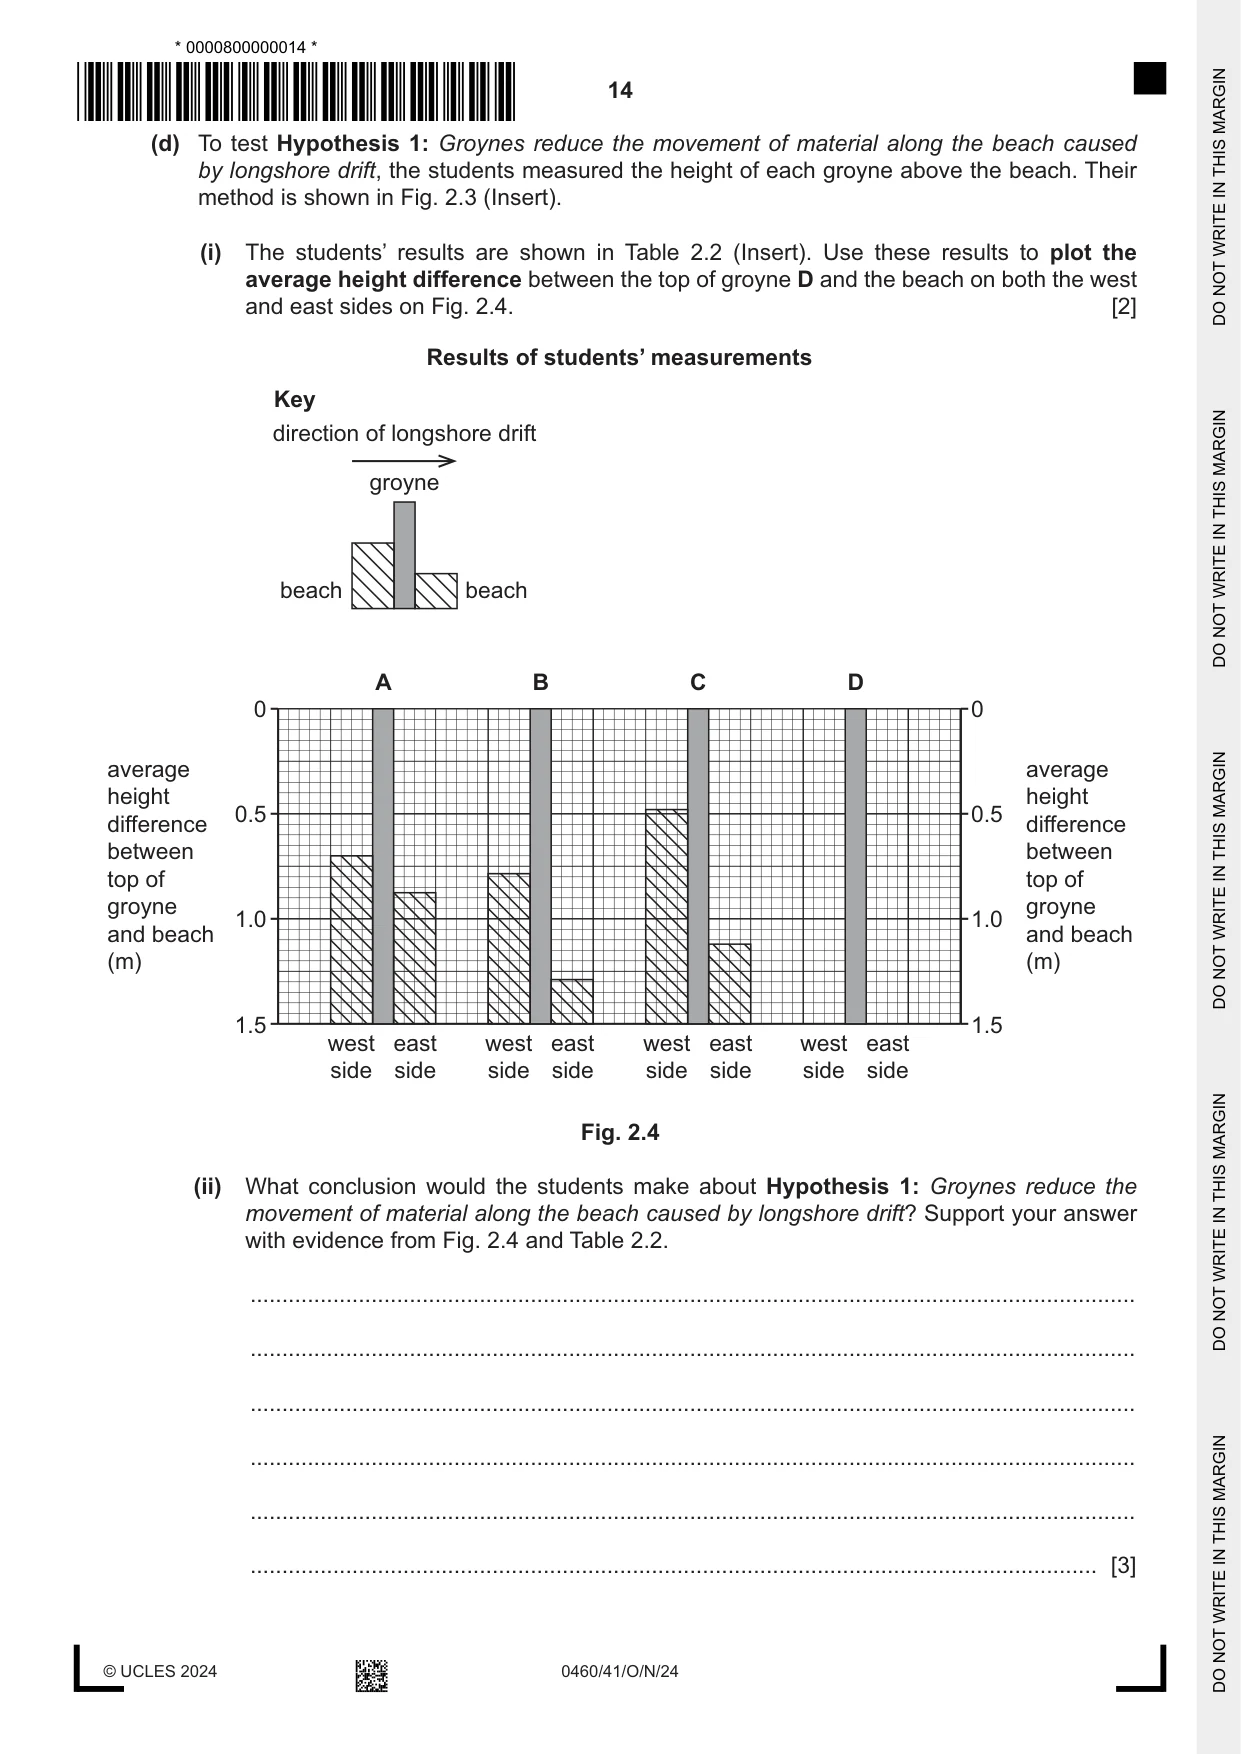
2 Students did fieldwork on a beach near to their school. They investigated different topics including wave frequency and longshore drift. They also wanted to find out what people thought about the defences built to protect the local coastline. (a) Before they began their fieldwork, the students discussed with their teacher some possible hazards they may come across and how to stay safe. They used a scale from 1 to 5 to make their decisions about risk. Their decisions are shown in Table 2.1. Table 2.1 Risk assessment of possible hazards description of the chance of the hazard how dangerous the risk from the hazard hazard happening hazard would be (chance of it happening 1 (little chance) to 1 (little danger) to x how severe the 5 (greatest chance) 5 (very dangerous) impacts would be) slipping or falling on wet rocks on the 4 2 8 beach being hit or buried by 2 5 10 the cliff collapsing drowning in the sea 1 5 5 hypothermia from 3 4 12 getting cold and wet getting injured by sharp pebbles on the 5 3 15 beach getting lost or separated from other 2 3 6 students (i) The students ranked the hazards based on their decisions. Use the information in Table 2.1 to complete the ranking. [1] hazard greatest risk getting injured by sharp pebbles on the beach hypothermia from getting cold and wet ............................................................................. ............................................................................. ............................................................................. ............................................................................. ............................................................................. ............................................................................. least risk drowning in the sea (ii) Suggest different ways that the students might avoid each of the following hazards during fieldwork. being hit or buried by the cliff collapsing ........................................................................................................................................... ........................................................................................................................................... hypothermia from getting cold and wet ........................................................................................................................................... ........................................................................................................................................... getting injured by sharp pebbles on the beach ........................................................................................................................................... ........................................................................................................................................... [3] (b) First, the students measured wave frequency at the beach. Their method is described in Fig. 2.1 (Insert). (i) Which one of the following is the correct definition of wave frequency? Tick (✓) your answer. [1] tick (✓) the distance between one breaking wave and the next breaking wave the energy each wave uses to erode the beach as it breaks the height of each wave which hits the beach the number of waves which break on the beach in a specific period of time (ii) Suggest why the students used a ranging pole ........................................................................................................................................... ........................................................................................................................................... repeated the task three times along the beach. ........................................................................................................................................... ........................................................................................................................................... [2]
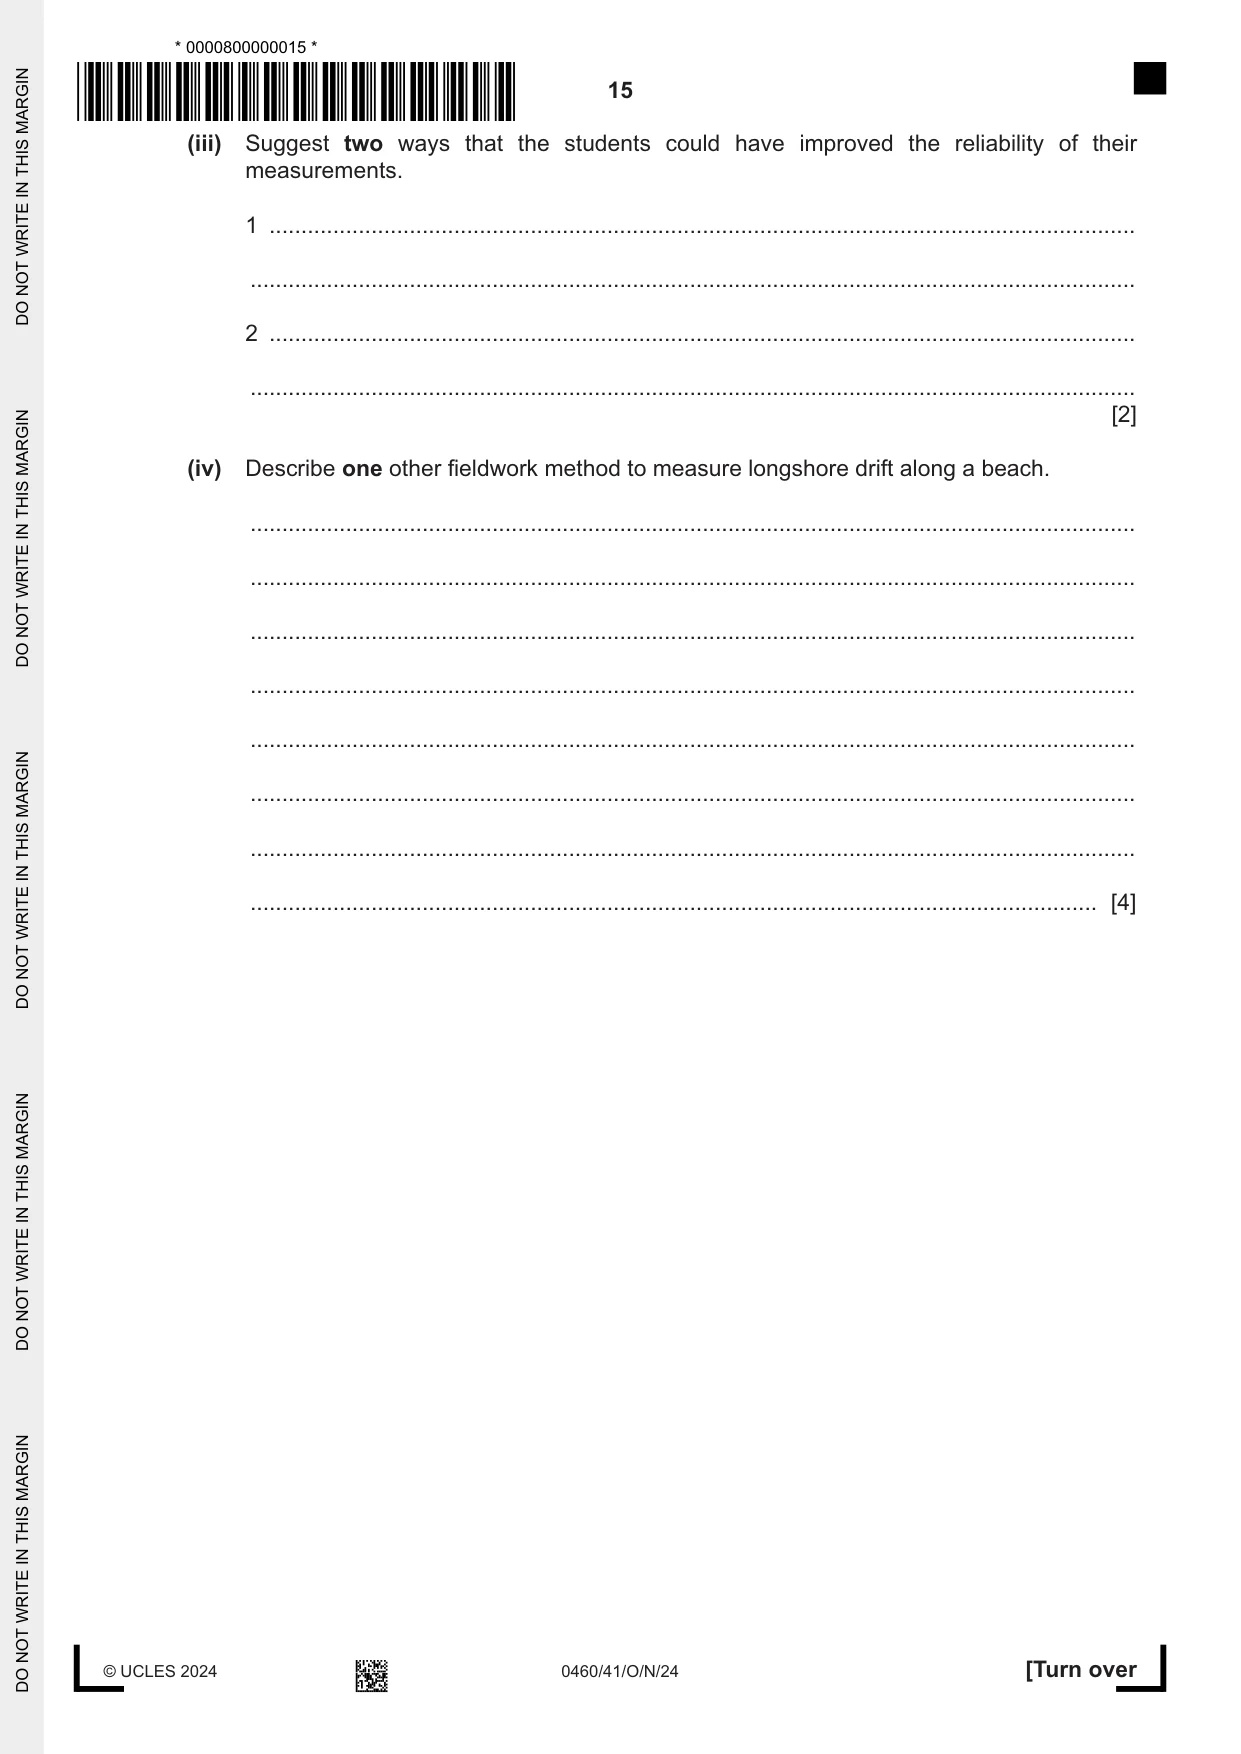
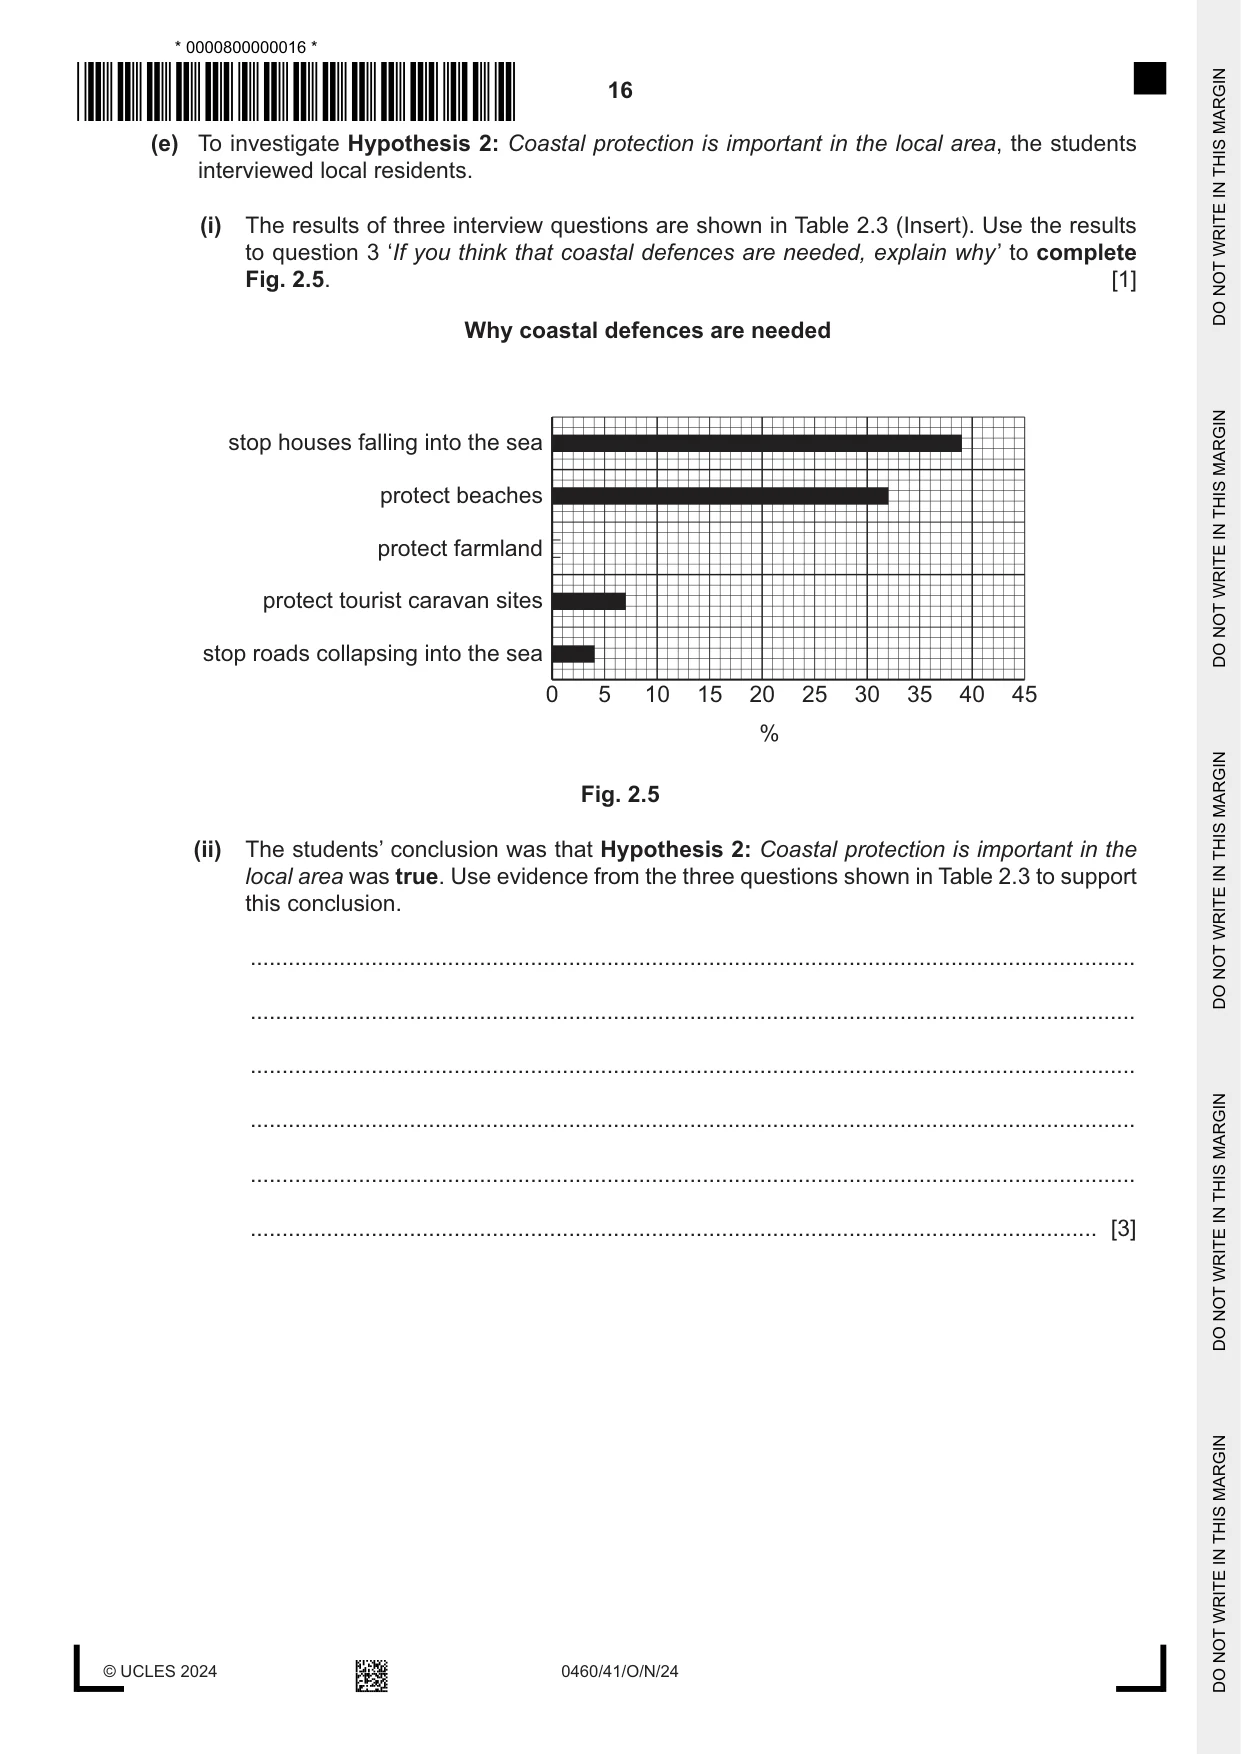
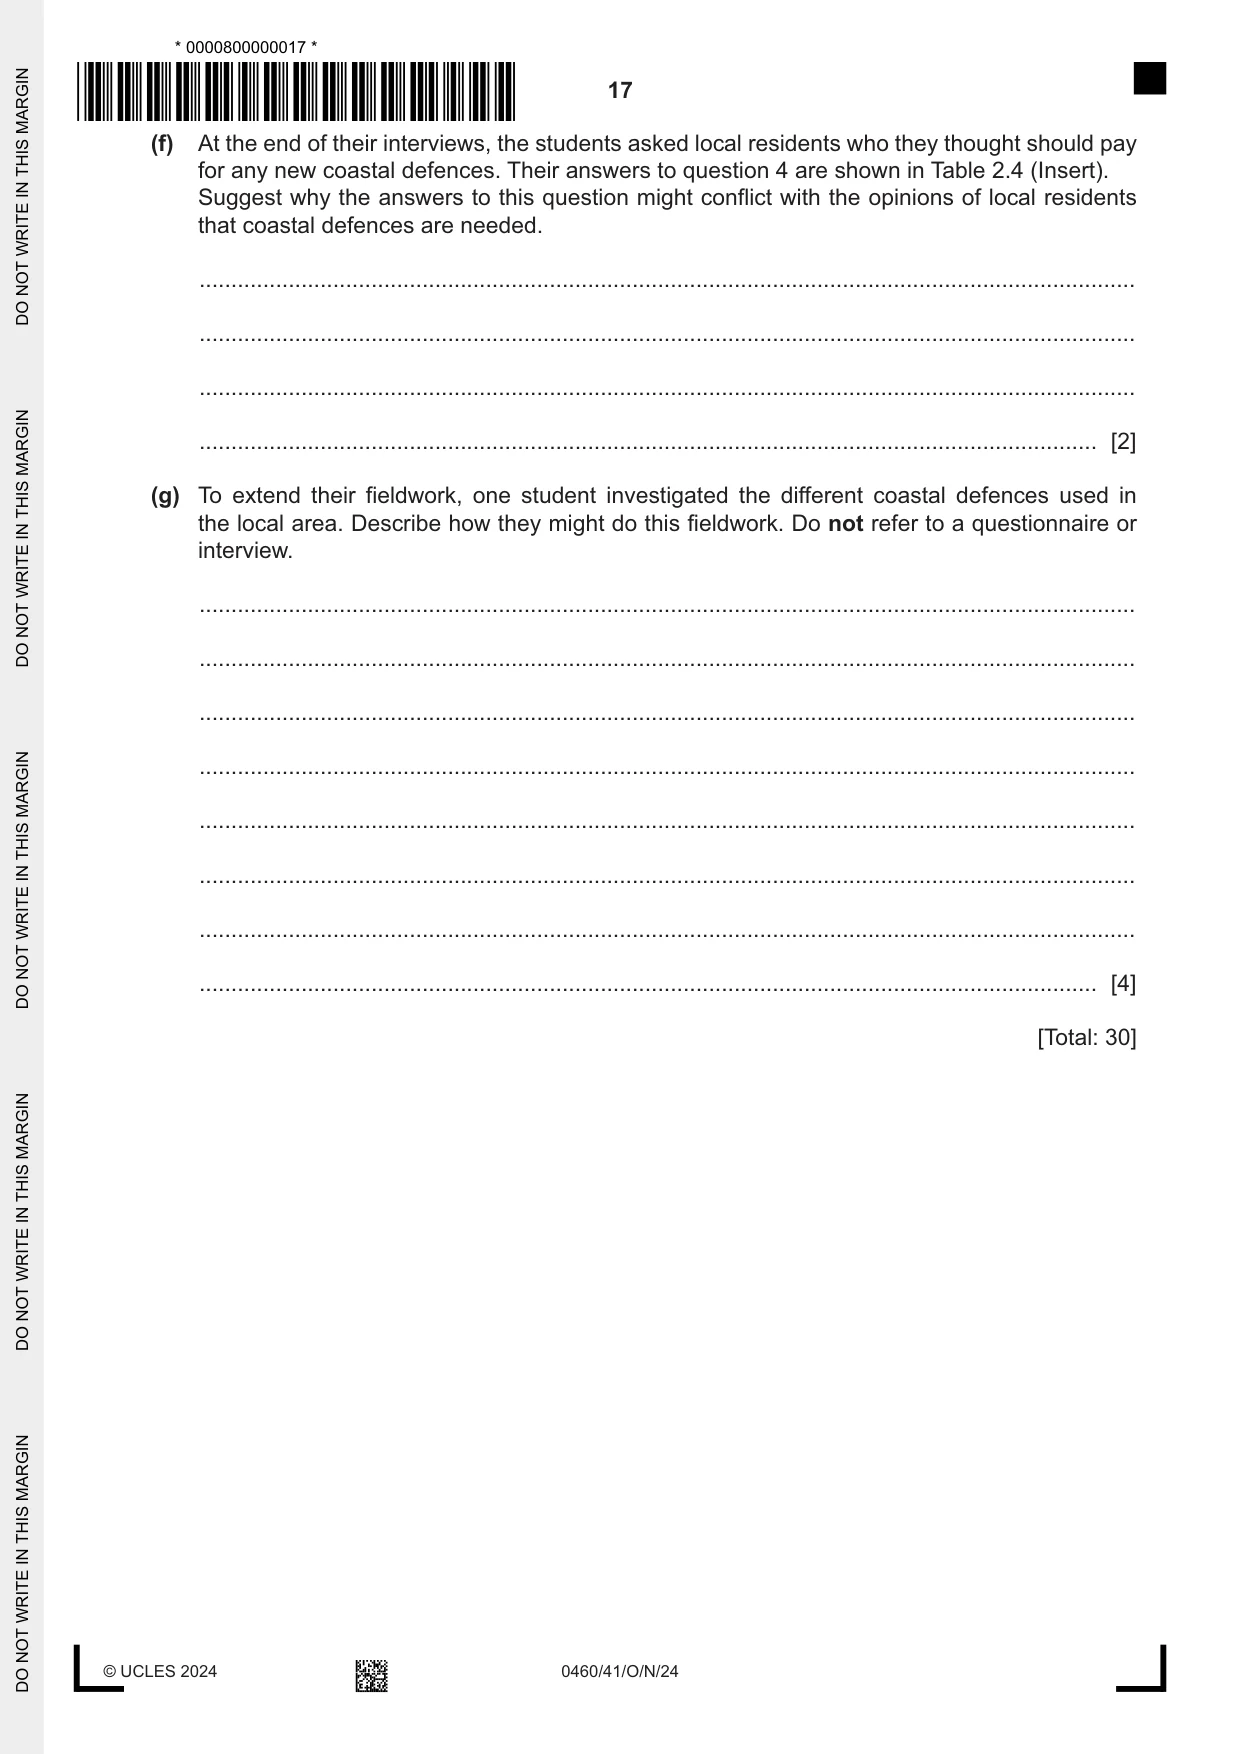
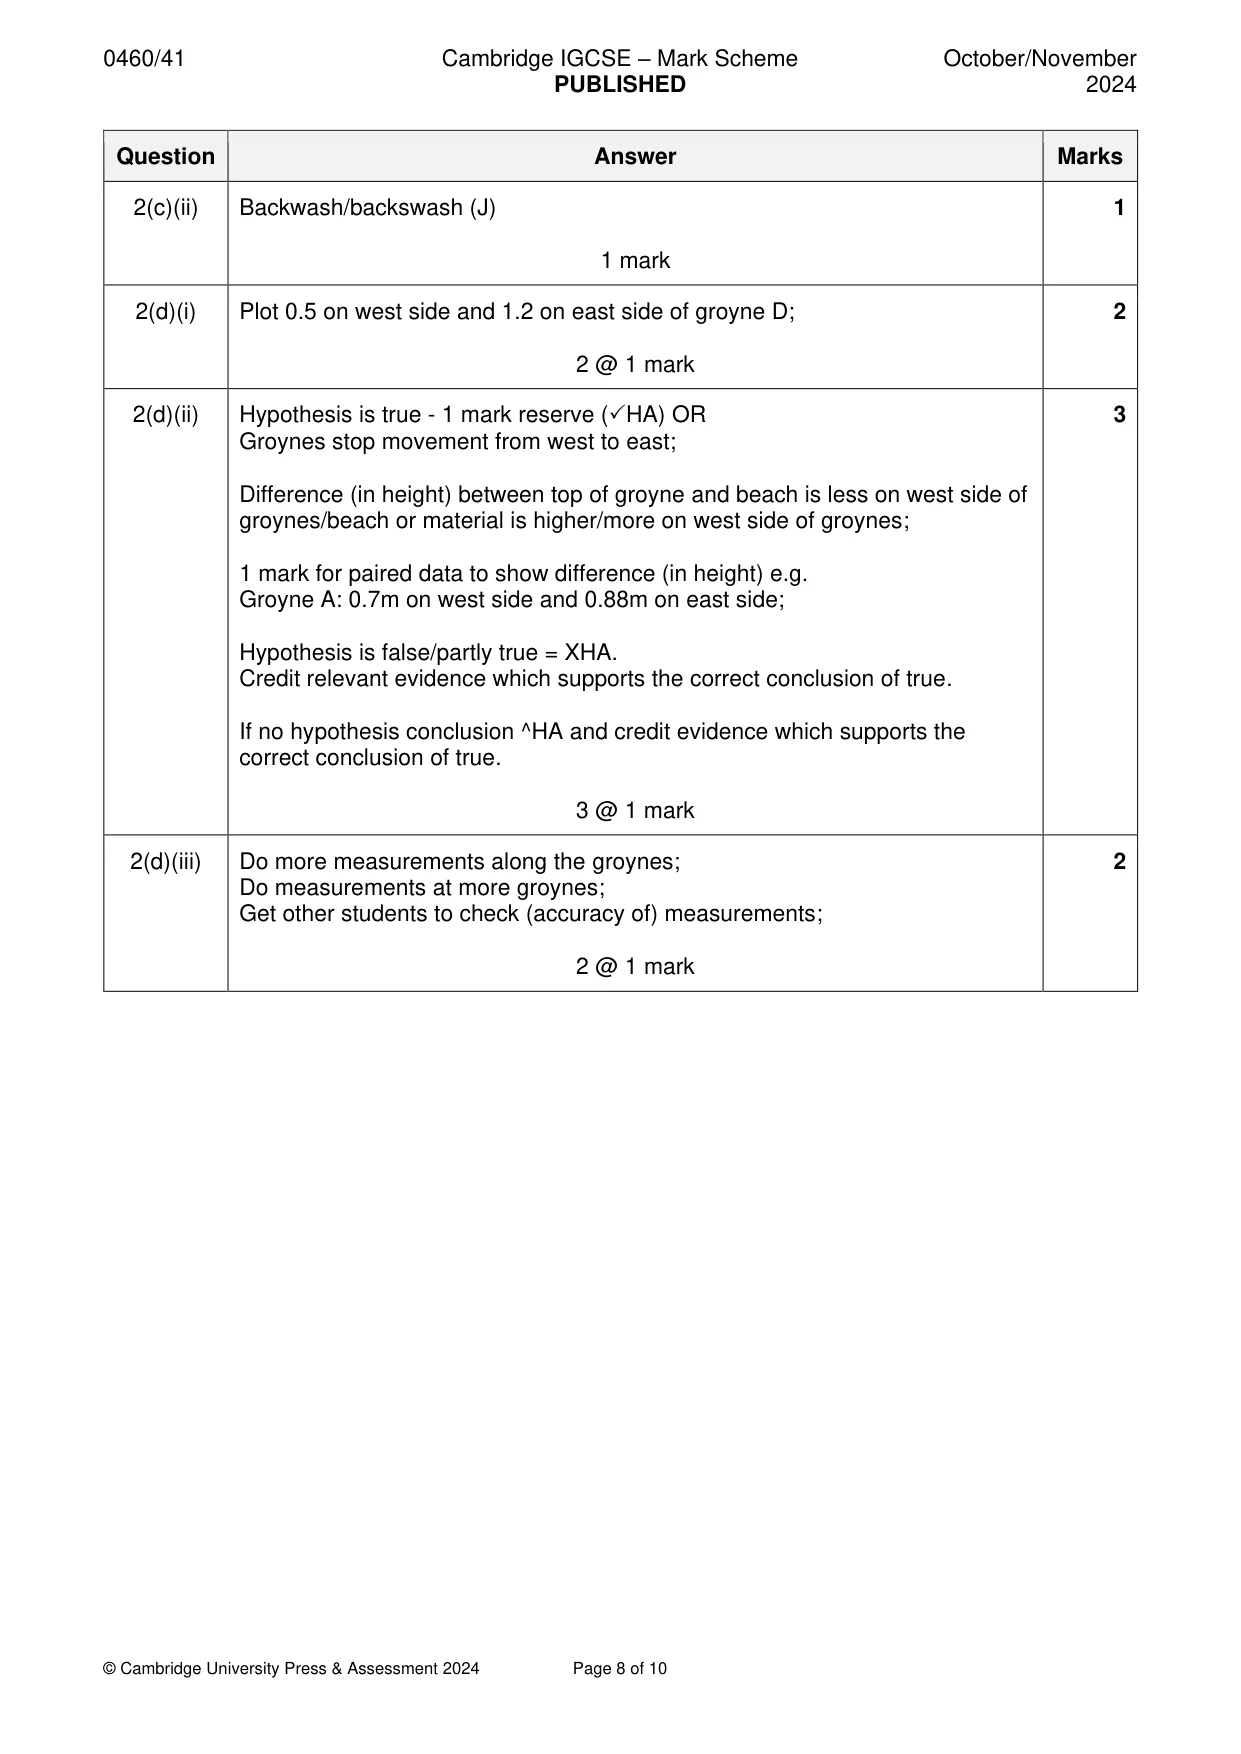
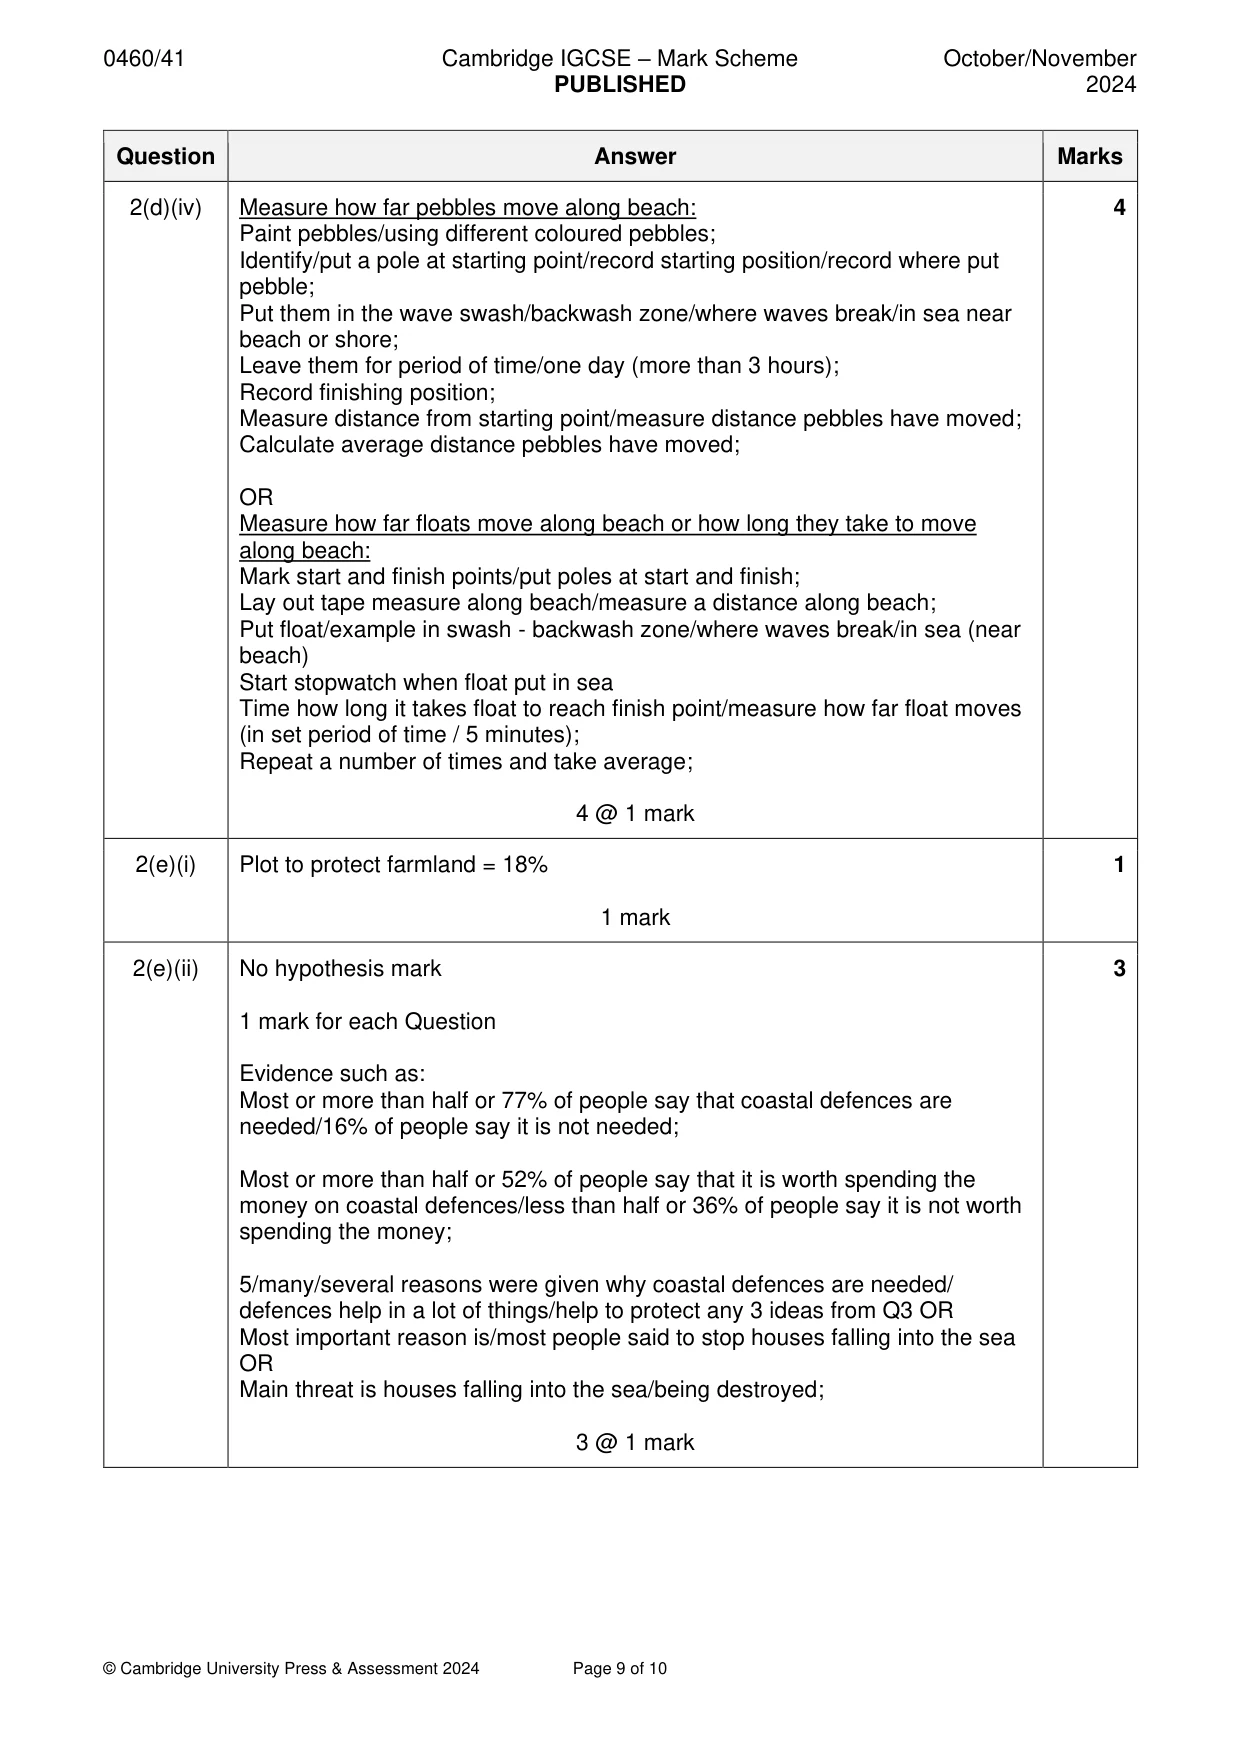
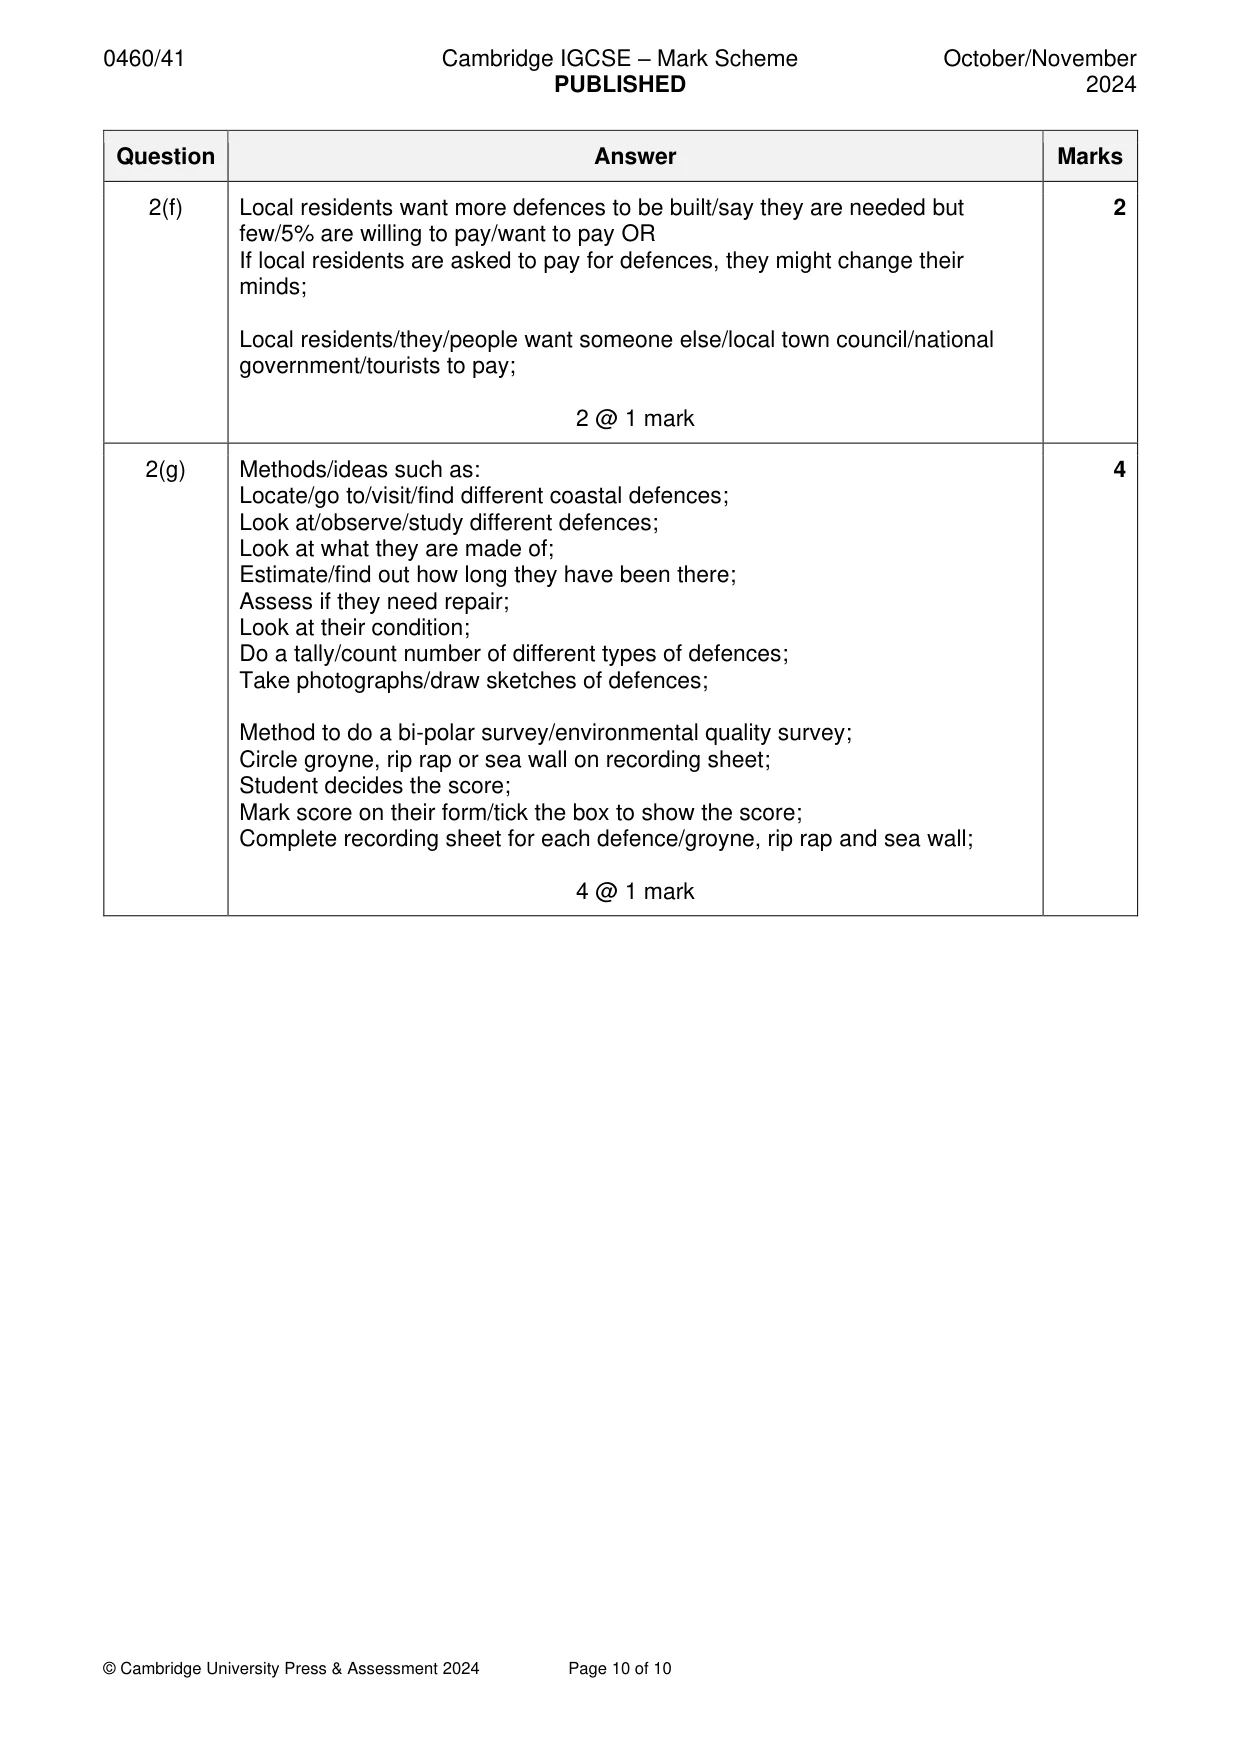
Mark scheme: 2(a)(i) Being hit or buried by the cliff collapsing; 1 Slipping or falling on wet rocks on the beach; Getting lost or separated from other students; 1 mark 2(a)(ii) Stay away from the cliff/bottom/edge of cliff; 3 Wear warm/waterproof clothes/layers of clothes/example of clothing/change of clothes/towel/gloves; Wear shoes/boots; 3 @ 1 mark 2(b)(i) The number of waves which break on the beach in a specific period of time; 1 1 mark 2(b)(ii) Can see/count when each wave hits the ranging pole; 2 Gives a set position to count waves/which waves pass; To get an average result/avoid error or anomaly; 2 @ 1 mark 2(c)(i) Wave approaching the beach 1 1 mark 2(c)(ii) Backwash/backswash (J) 1 1 mark 2(d)(i) Plot 0.5 on west side and 1.2 on east side of groyne D; 2 2 @ 1 mark 2(d)(ii) Hypothesis is true - 1 mark reserve (HA) OR 3 Groynes stop movement from west to east; Difference (in height) between top of groyne and beach is less on west side of groynes/beach or material is higher/more on west side of groynes; 1 mark for paired data to show difference (in height) e.g. Groyne A: 0.7m on west side and 0.88m on east side; Hypothesis is false/partly true = XHA. Credit relevant evidence which supports the correct conclusion of true. If no hypothesis conclusion ^HA and credit evidence which supports the correct conclusion of true. 3 @ 1 mark 2(d)(iii) Do more measurements along the groynes; 2 Do measurements at more groynes; Get other students to check (accuracy of) measurements; 2 @ 1 mark 2(d)(iv) Measure how far pebbles move along beach: 4 Paint pebbles/using different coloured pebbles; Identify/put a pole at starting point/record starting position/record where put pebble; Put them in the wave swash/backwash zone/where waves break/in sea near beach or shore; Leave them for period of time/one day (more than 3 hours); Record finishing position; Measure distance from starting point/measure distance pebbles have moved; Calculate average distance pebbles have moved; OR Measure how far floats move along beach or how long they take to move along beach: Mark start and finish points/put poles at start and finish; Lay out tape measure along beach/measure a distance along beach; Put float/example in swash - backwash zone/where waves break/in sea (near beach) Start stopwatch when float put in sea Time how long it takes float to reach finish point/measure how far float moves (in set period of time / 5 minutes); Repeat a number of times and take average; 4 @ 1 mark 2(e)(i) Plot to protect farmland = 18% 1 1 mark 2(e)(ii) No hypothesis mark 3 1 mark for each Question Evidence such as: Most or more than half or 77% of people say that coastal defences are needed/16% of people say it is not needed; Most or more than half or 52% of people say that it is worth spending the money on coastal defences/less than half or 36% of people say it is not worth spending the money; 5/many/several reasons were given why coastal defences are needed/ defences help in a lot of things/help to protect any 3 ideas from Q3 OR Most important reason is/most people said to stop houses falling into the sea OR Main threat is houses falling into the sea/being destroyed; 3 @ 1 mark 2(f) Local residents want more defences to be built/say they are needed but 2 few/5% are willing to pay/want to pay OR If local residents are asked to pay for defences, they might change their minds; Local residents/they/people want someone else/local town council/national government/tourists to pay; 2 @ 1 mark 2(g) Methods/ideas such as: 4 Locate/go to/visit/find different coastal defences; Look at/observe/study different defences; Look at what they are made of; Estimate/find out how long they have been there; Assess if they need repair; Look at their condition; Do a tally/count number of different types of defences; Take photographs/draw sketches of defences; Method to do a bi-polar survey/environmental quality survey; Circle groyne, rip rap or sea wall on recording sheet; Student decides the score; Mark score on their form/tick the box to show the score; Complete recording sheet for each defence/groyne, rip rap and sea wall; 4 @ 1 mark
What was in this paper
The subtopics covered by these 2 questions, and how many questions each got. Open one in a new tab to see every Cambridge question on it.
What you needed in this session
Cambridge’s own grade thresholds for 2024 Oct/Nov, Paper 4 · Variant 1. A higher threshold means an easier paper — the bar moves with how the cohort did.