Cambridge IGCSE Geography 0460 — 2024 May/June Paper 4 · Variant 1
0460/41/M/J/24 · 2 questions · 60 marks · ≈68 min
The question paper and its mark scheme, free to read here and free to download. This is Cambridge’s own paper, exactly as it was sat.
Question paper20 pages






Mark scheme9 pages
Answers below. Sit the paper first if you are practising.
Questions as text
Q1 · Students in Johannesburg, South Africa, were studying weather
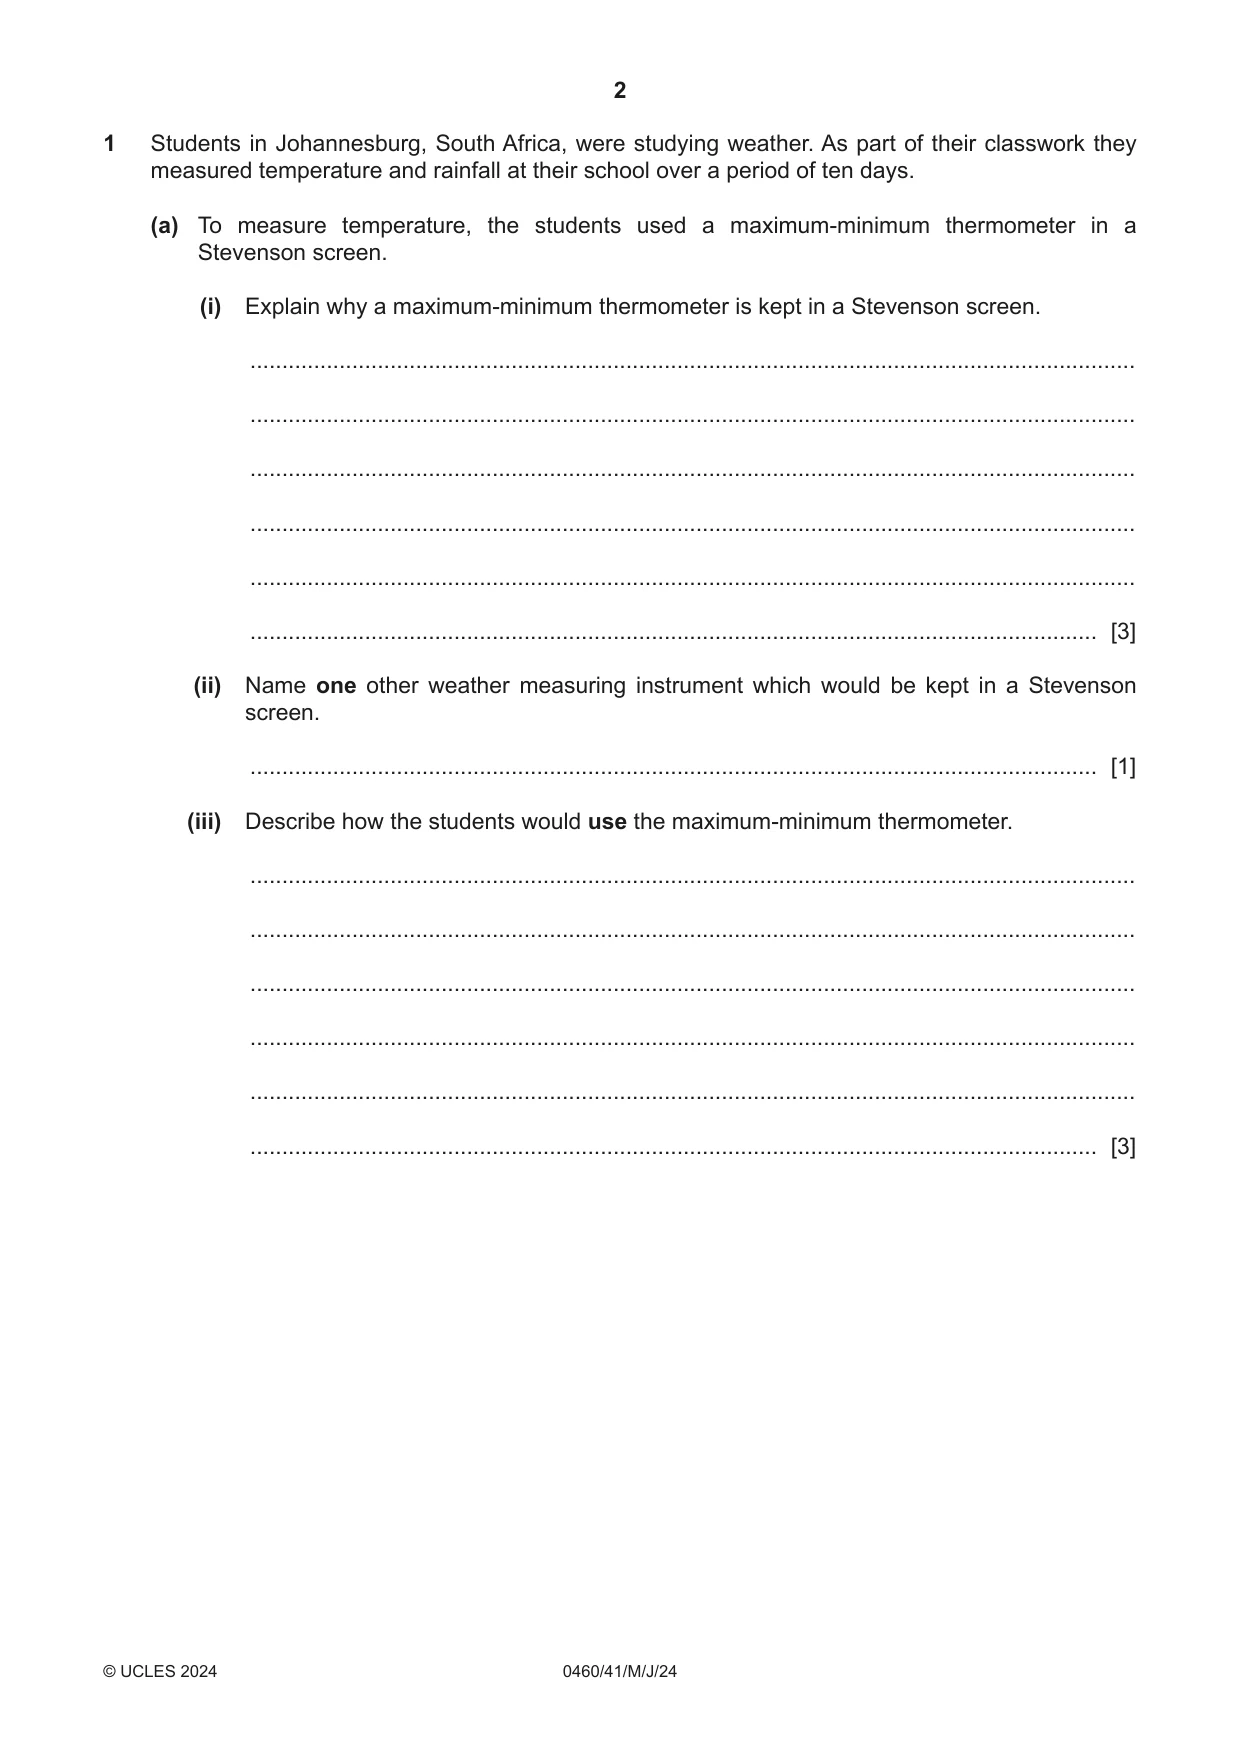
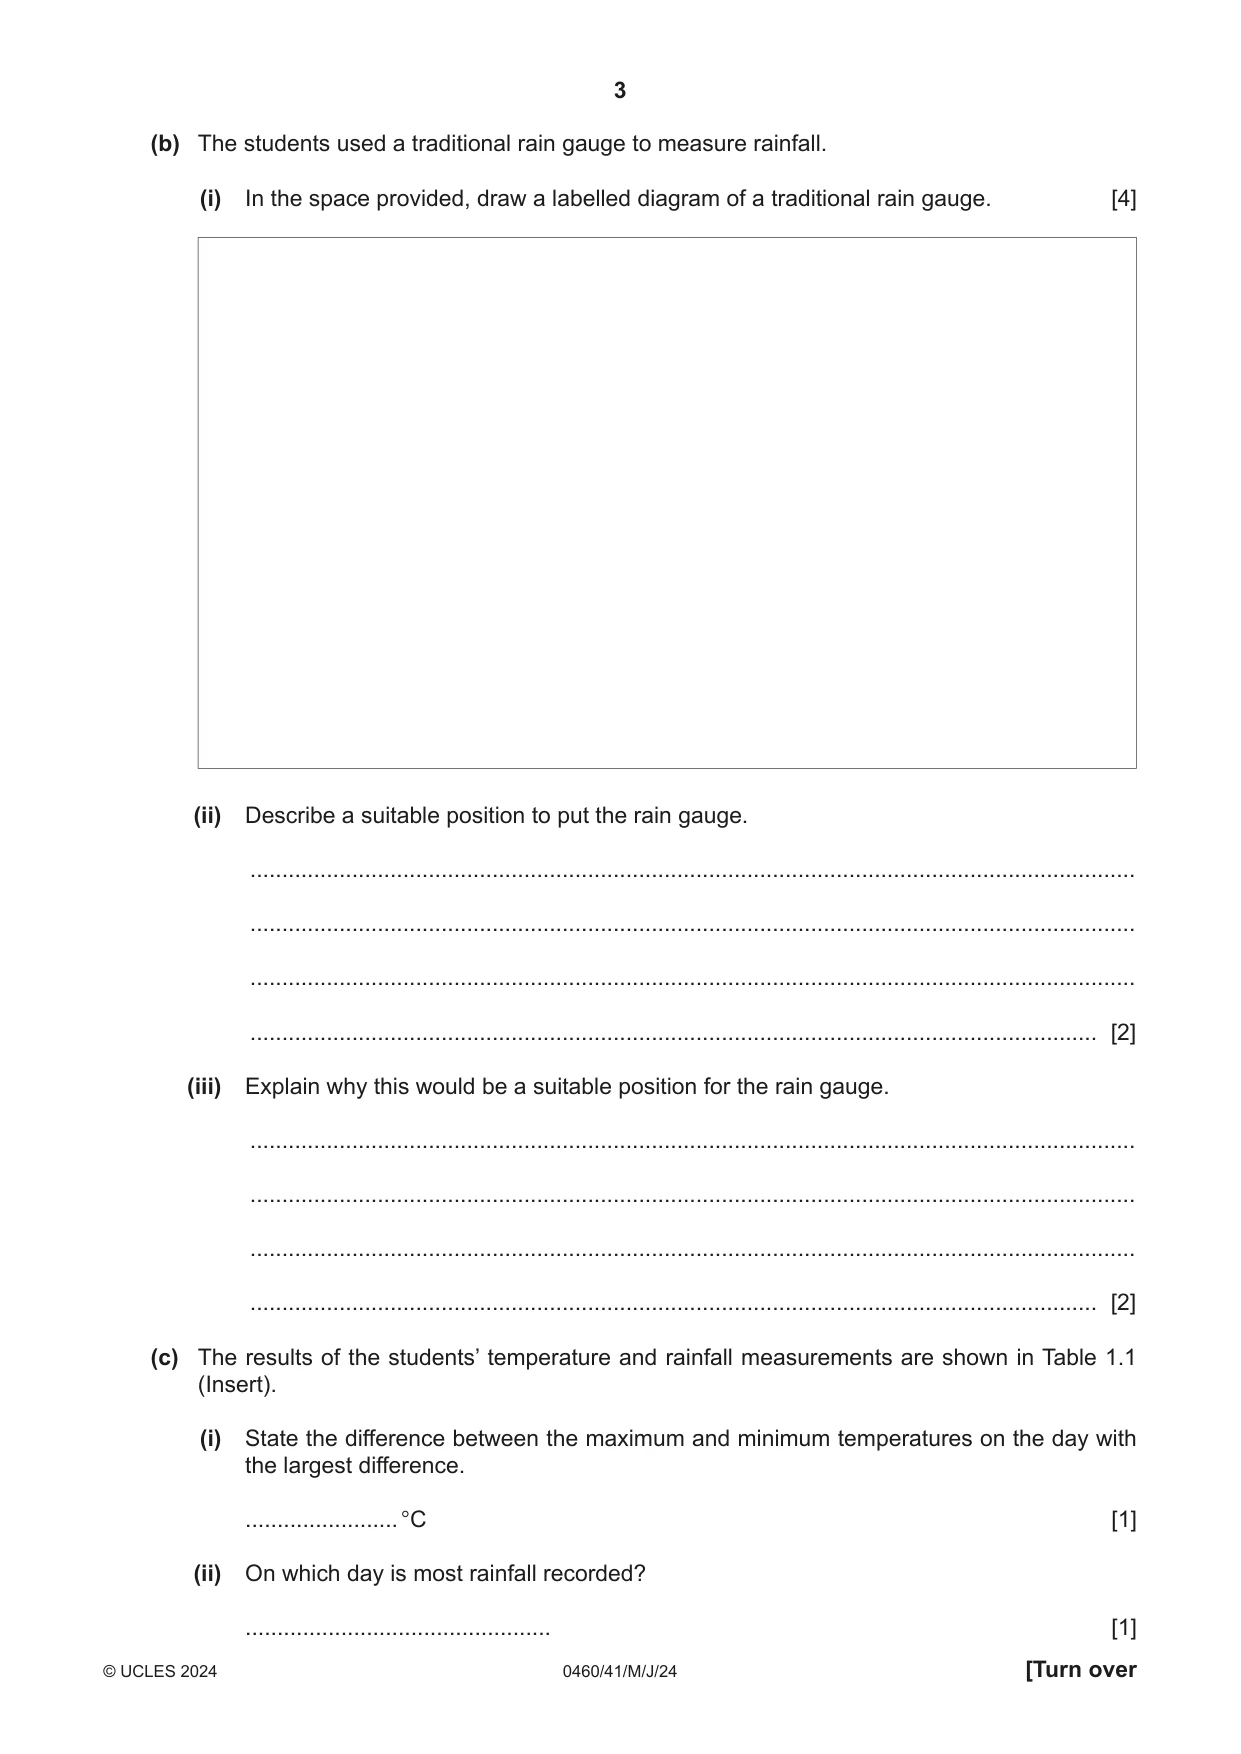
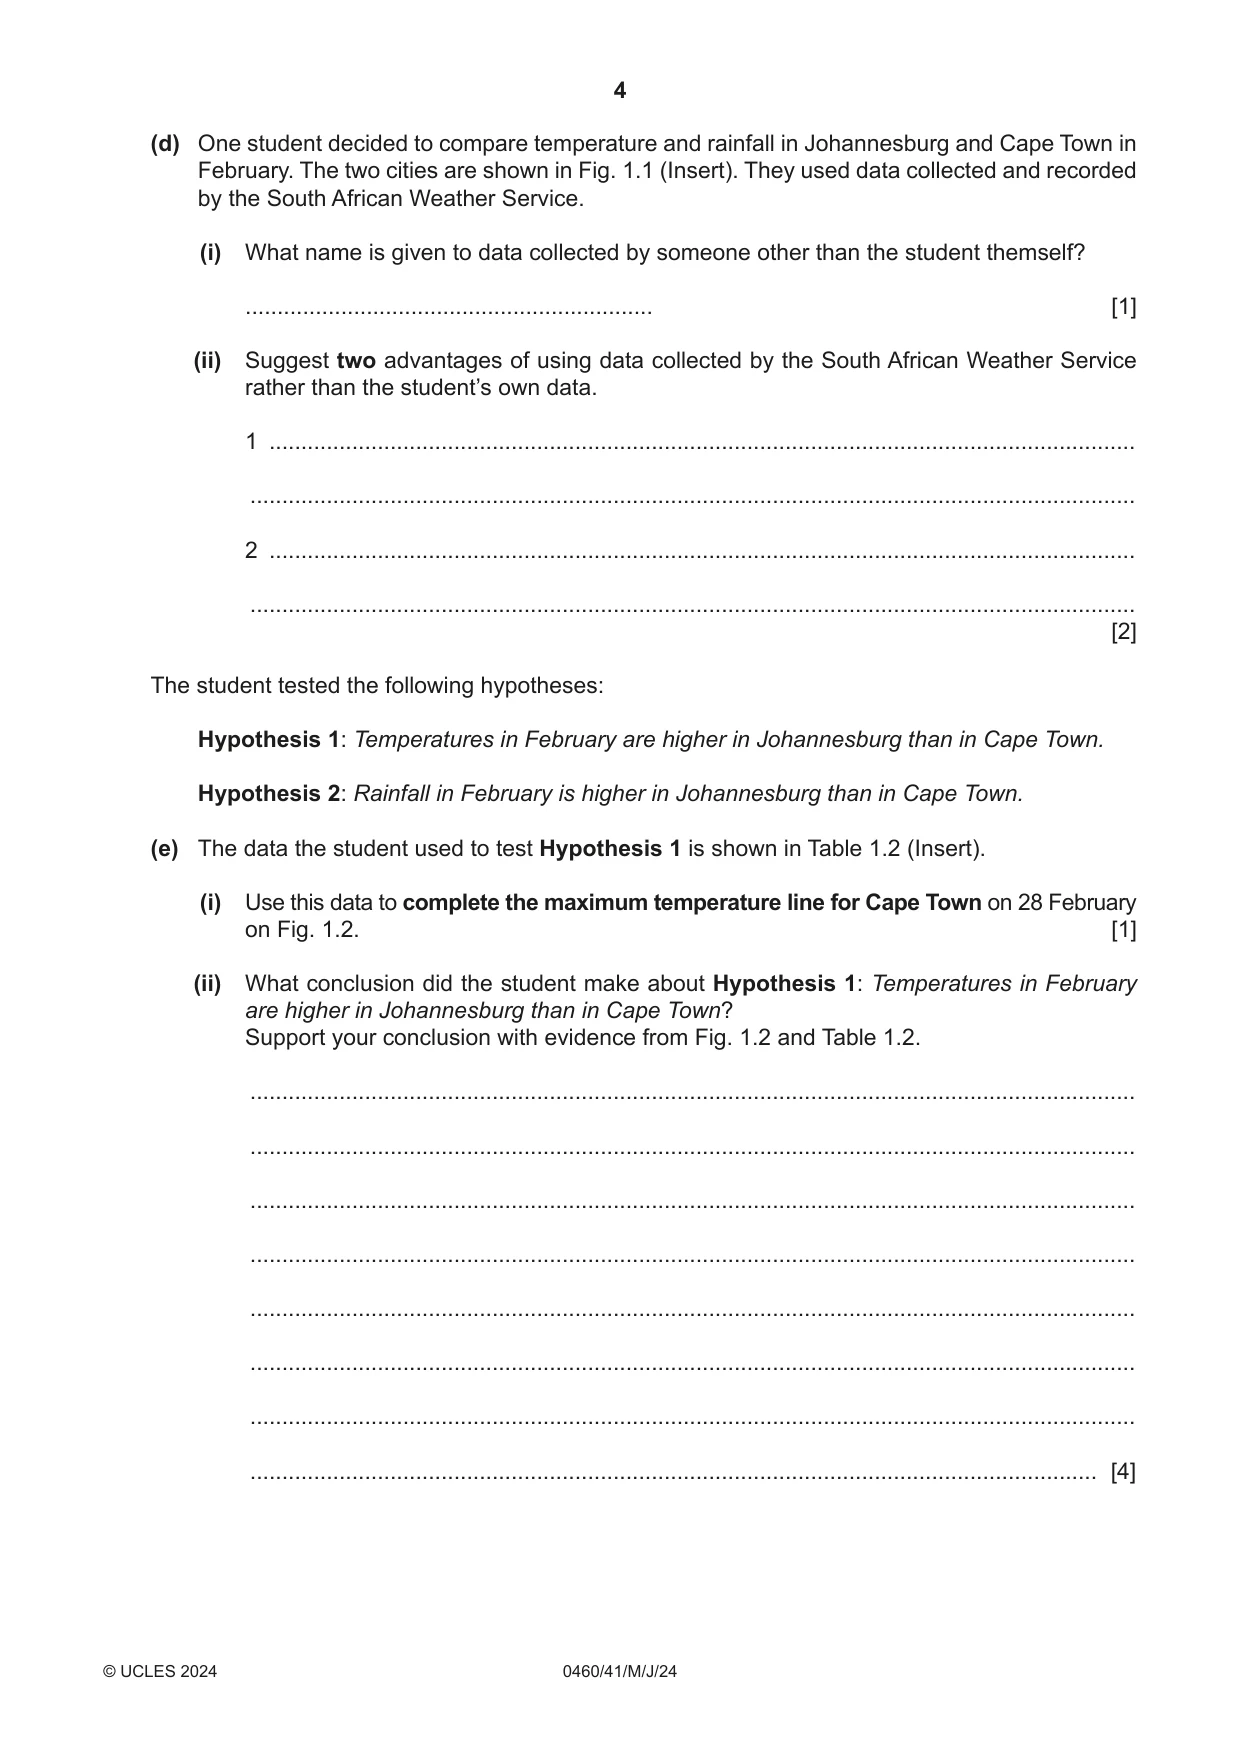
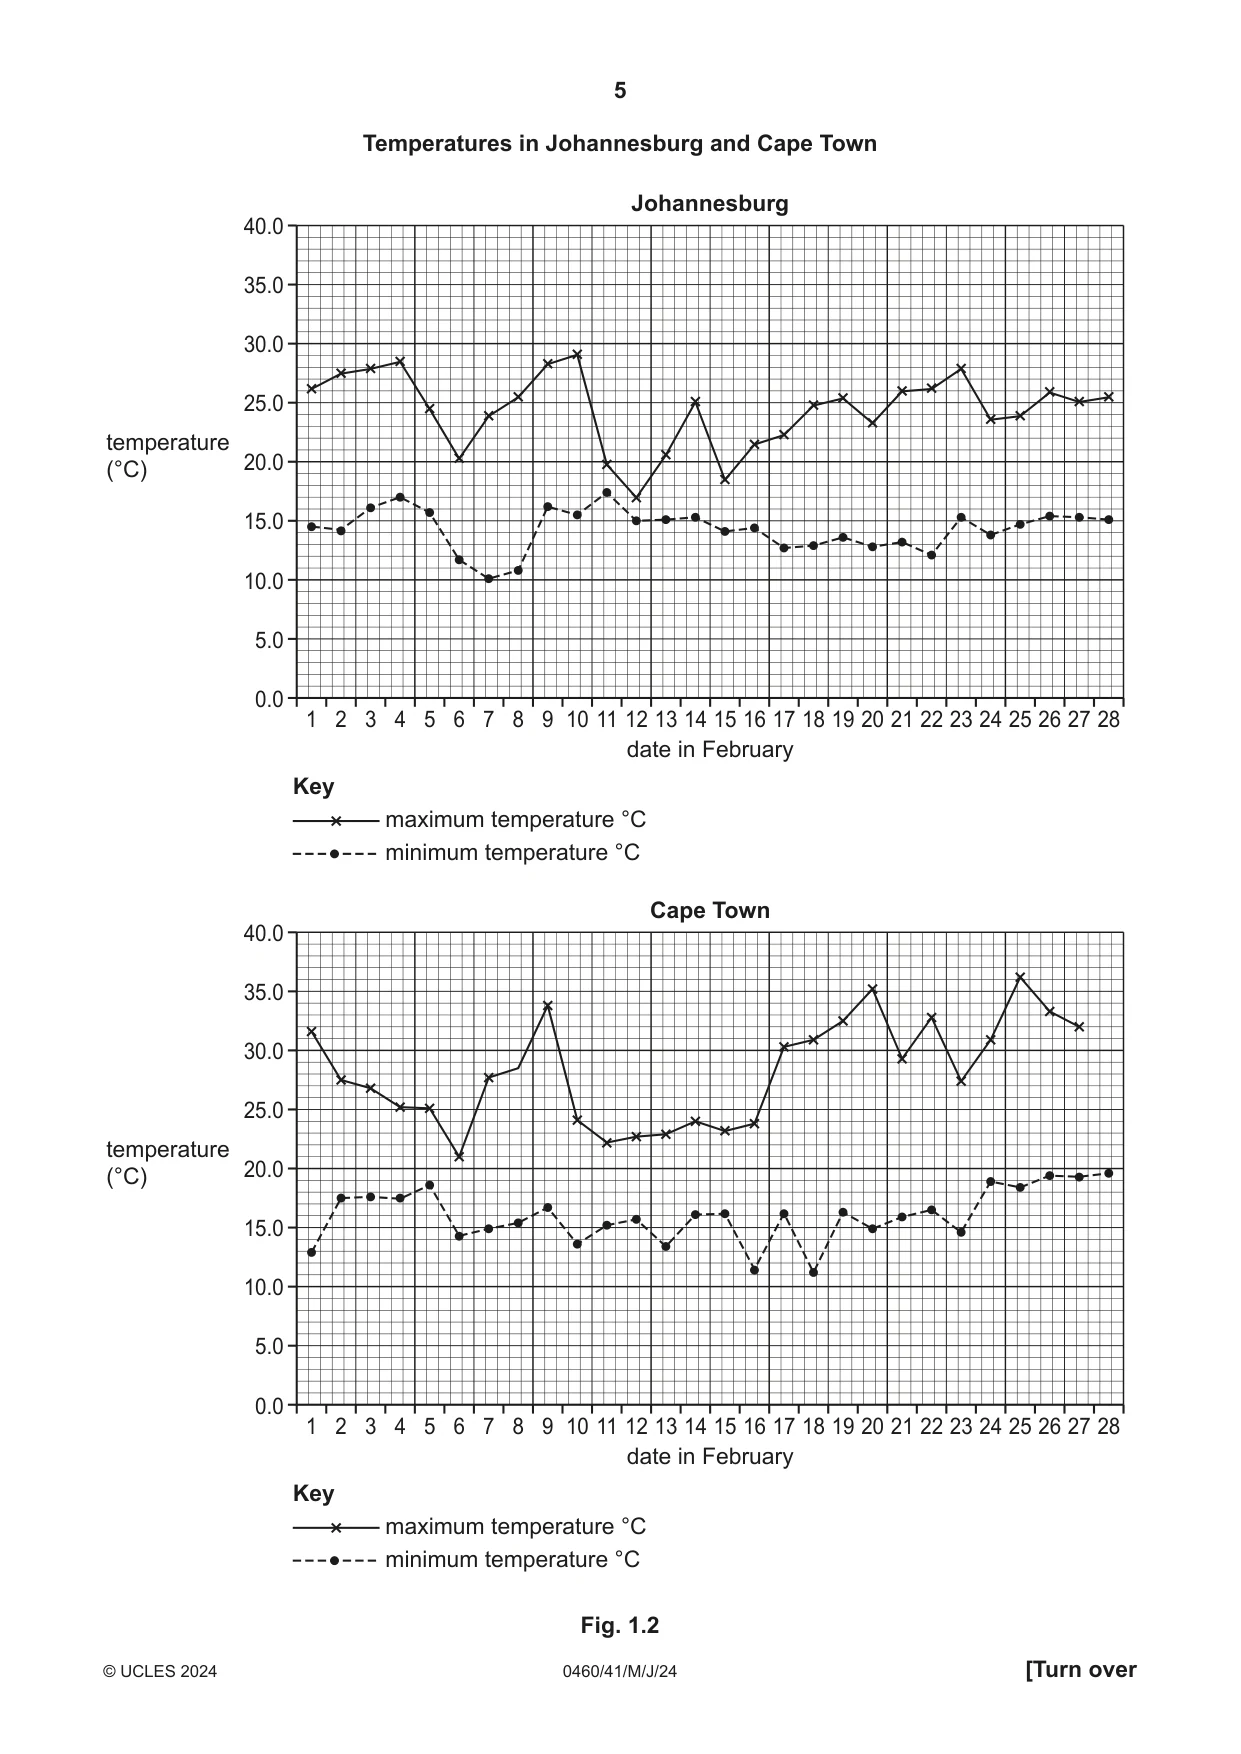
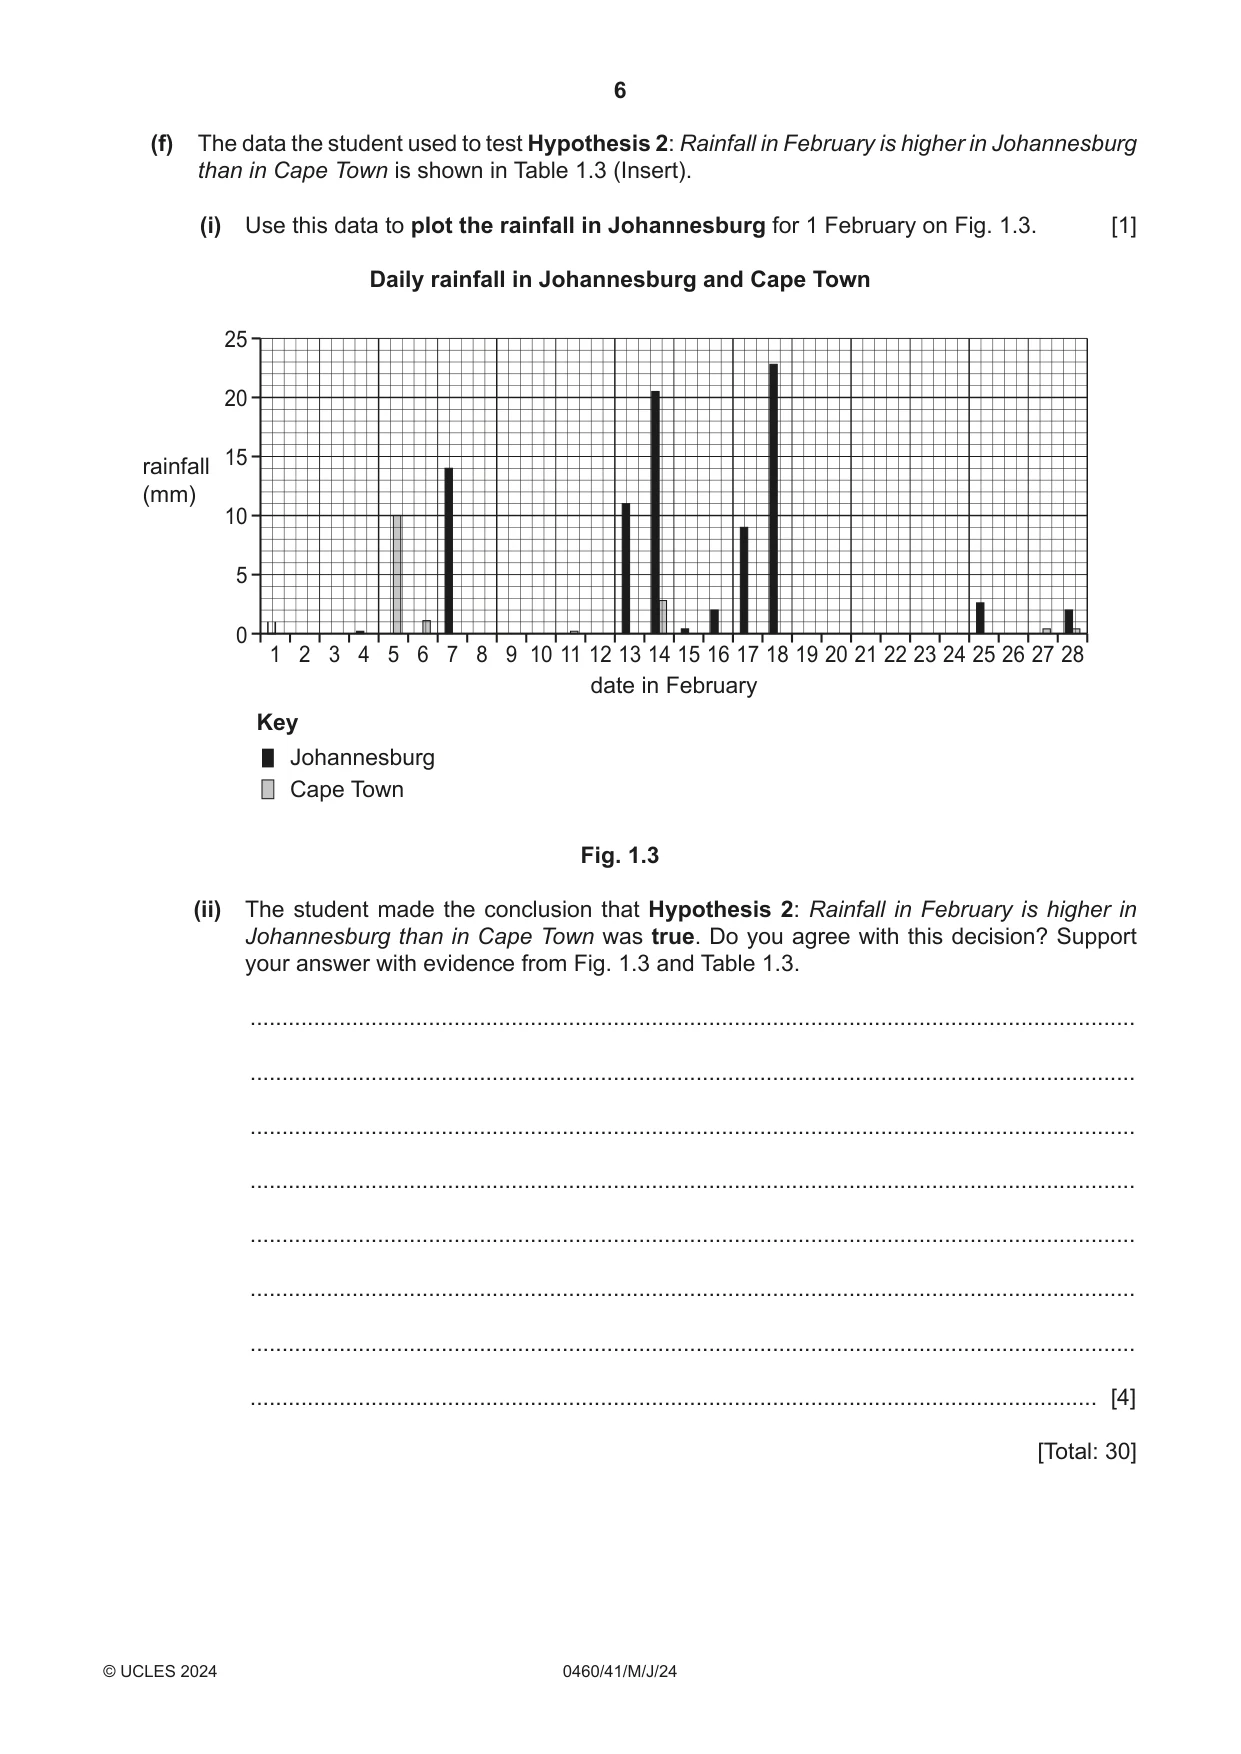
1 Students in Johannesburg, South Africa, were studying weather. As part of their classwork they measured temperature and rainfall at their school over a period of ten days. (a) To measure temperature, the students used a maximum-minimum thermometer in a Stevenson screen. (i) Explain why a maximum-minimum thermometer is kept in a Stevenson screen. ........................................................................................................................................... ........................................................................................................................................... ........................................................................................................................................... ........................................................................................................................................... ........................................................................................................................................... ..................................................................................................................................... [3] (ii) Name one other weather measuring instrument which would be kept in a Stevenson screen. ..................................................................................................................................... [1] (iii) Describe how the students would use the maximum-minimum thermometer. ........................................................................................................................................... ........................................................................................................................................... ........................................................................................................................................... ........................................................................................................................................... ........................................................................................................................................... ..................................................................................................................................... [3] (b) The students used a traditional rain gauge to measure rainfall. (i) In the space provided, draw a labelled diagram of a traditional rain gauge. [4] (ii) Describe a suitable position to put the rain gauge. ........................................................................................................................................... ........................................................................................................................................... ........................................................................................................................................... ..................................................................................................................................... [2] (iii) Explain why this would be a suitable position for the rain gauge. ........................................................................................................................................... ........................................................................................................................................... ........................................................................................................................................... ..................................................................................................................................... [2] (c) The results of the students’ temperature and rainfall measurements are shown in Table 1.1 (Insert). (i) State the difference between the maximum and minimum temperatures on the day with the largest difference. ........................ °C [1] (ii) On which day is most rainfall recorded? ................................................ [1] (d) One student decided to compare temperature and rainfall in Johannesburg and Cape Town in February. The two cities are shown in Fig. 1.1 (Insert). They used data collected and recorded by the South African Weather Service. (i) What name is given to data collected by someone other than the student themself? ................................................................ [1] (ii) Suggest two advantages of using data collected by the South African Weather Service rather than the student’s own data. 1 ........................................................................................................................................ ........................................................................................................................................... 2 ........................................................................................................................................ ........................................................................................................................................... [2] The student tested the following hypotheses: Hypothesis 1: Temperatures in February are higher in Johannesburg than in Cape Town. Hypothesis 2: Rainfall in February is higher in Johannesburg than in Cape Town. (e) The data the student used to test Hypothesis 1 is shown in Table 1.2 (Insert). (i) Use this data to complete the maximum temperature line for Cape Town on 28 February on Fig. 1.2. [1] (ii) What conclusion did the student make about Hypothesis 1: Temperatures in February are higher in Johannesburg than in Cape Town? Support your conclusion with evidence from Fig. 1.2 and Table 1.2. ........................................................................................................................................... ........................................................................................................................................... ........................................................................................................................................... ........................................................................................................................................... ........................................................................................................................................... ........................................................................................................................................... ........................................................................................................................................... ..................................................................................................................................... [4] Temperatures in Johannesburg and Cape Town Johannesburg 40.0 35.0 30.0 25.0 temperature 20.0(°C) 15.0 10.0 5.0 0.0 1 2 3 4 5 6 7 8 9 10 11 12 13 14 15 16 17 18 19 20 21 22 23 24 25 26 27 28 date in February Key maximum temperature °C minimum temperature °C Cape Town 40.0 35.0 30.0 25.0 temperature 20.0(°C) 15.0 10.0 5.0 0.0 1 2 3 4 5 6 7 8 9 10 11 12 13 14 15 16 17 18 19 20 21 22 23 24 25 26 27 28 date in February Key maximum temperature °C minimum temperature °C Fig. 1.2 (f) The data the student used to test Hypothesis 2: Rainfall in February is higher in Johannesburg than in Cape Town is shown in Table 1.3 (Insert). (i) Use this data to plot the rainfall in Johannesburg for 1 February on Fig. 1.3. [1] Daily rainfall in Johannesburg and Cape Town 25 20 15rainfall (mm) 10 5 0 1 2 3 4 5 6 7 8 9 10 11 12 13 14 15 16 17 18 19 20 21 22 23 24 25 26 27 28 date in February Key Johannesburg Cape Town Fig. 1.3 (ii) The student made the conclusion that Hypothesis 2: Rainfall in February is higher in Johannesburg than in Cape Town was true. Do you agree with this decision? Support your answer with evidence from Fig. 1.3 and Table 1.3. ........................................................................................................................................... ........................................................................................................................................... ........................................................................................................................................... ........................................................................................................................................... ........................................................................................................................................... ........................................................................................................................................... ........................................................................................................................................... ..................................................................................................................................... [4] [Total: 30]
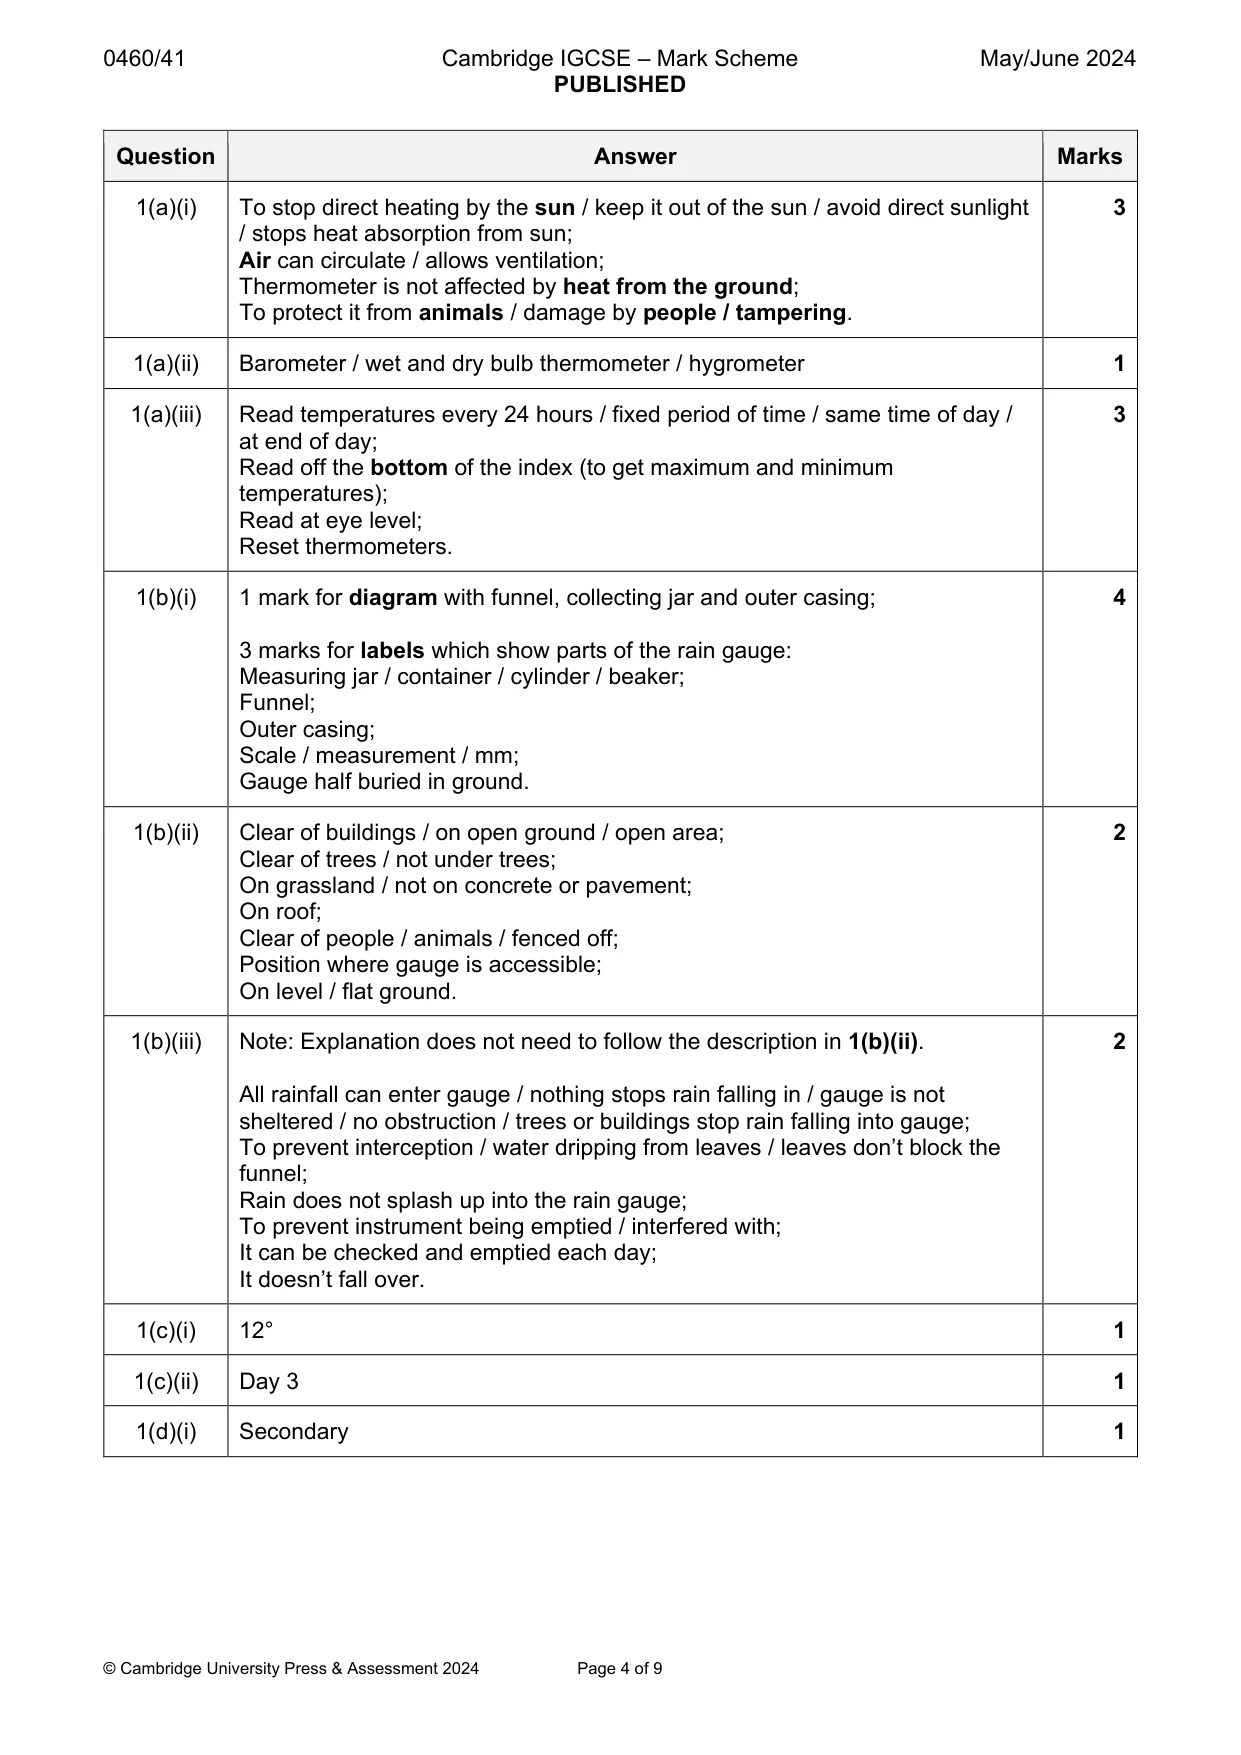
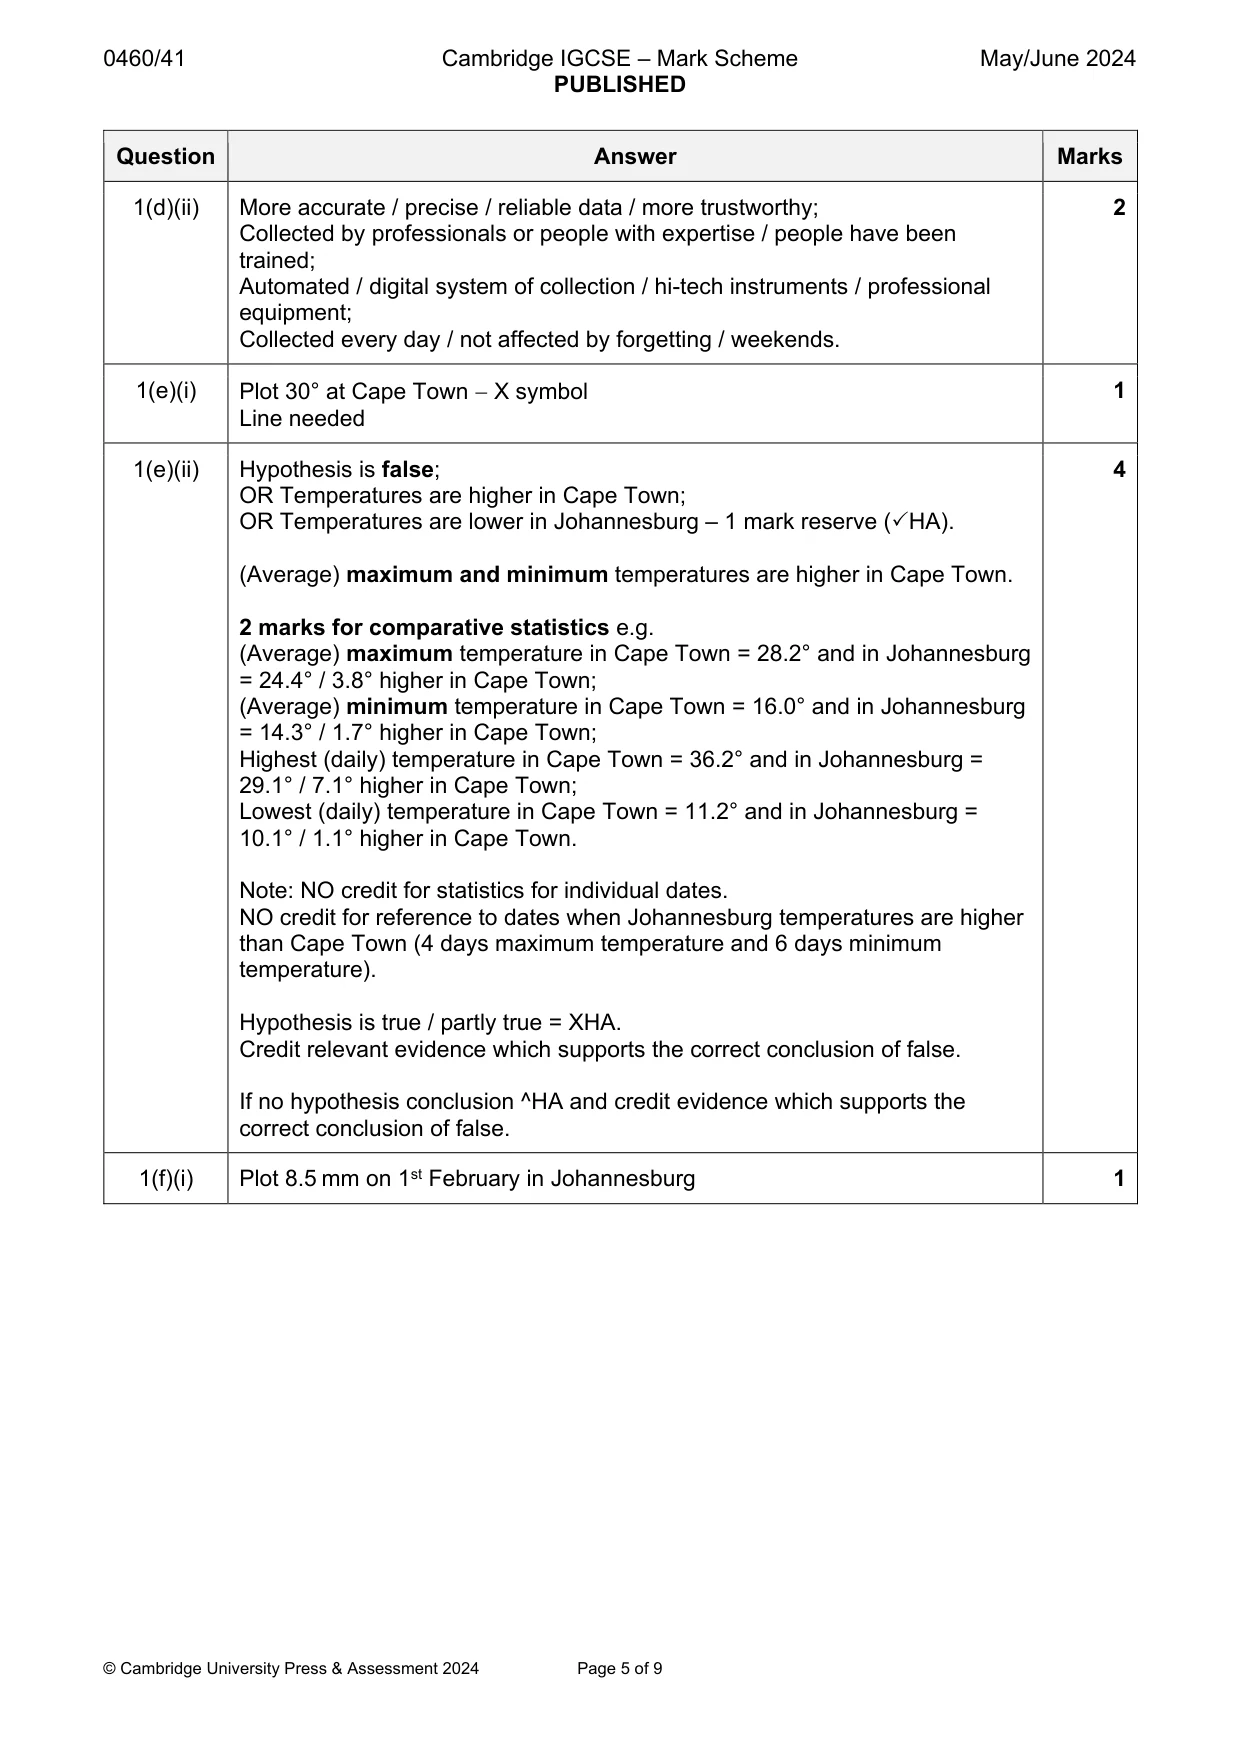
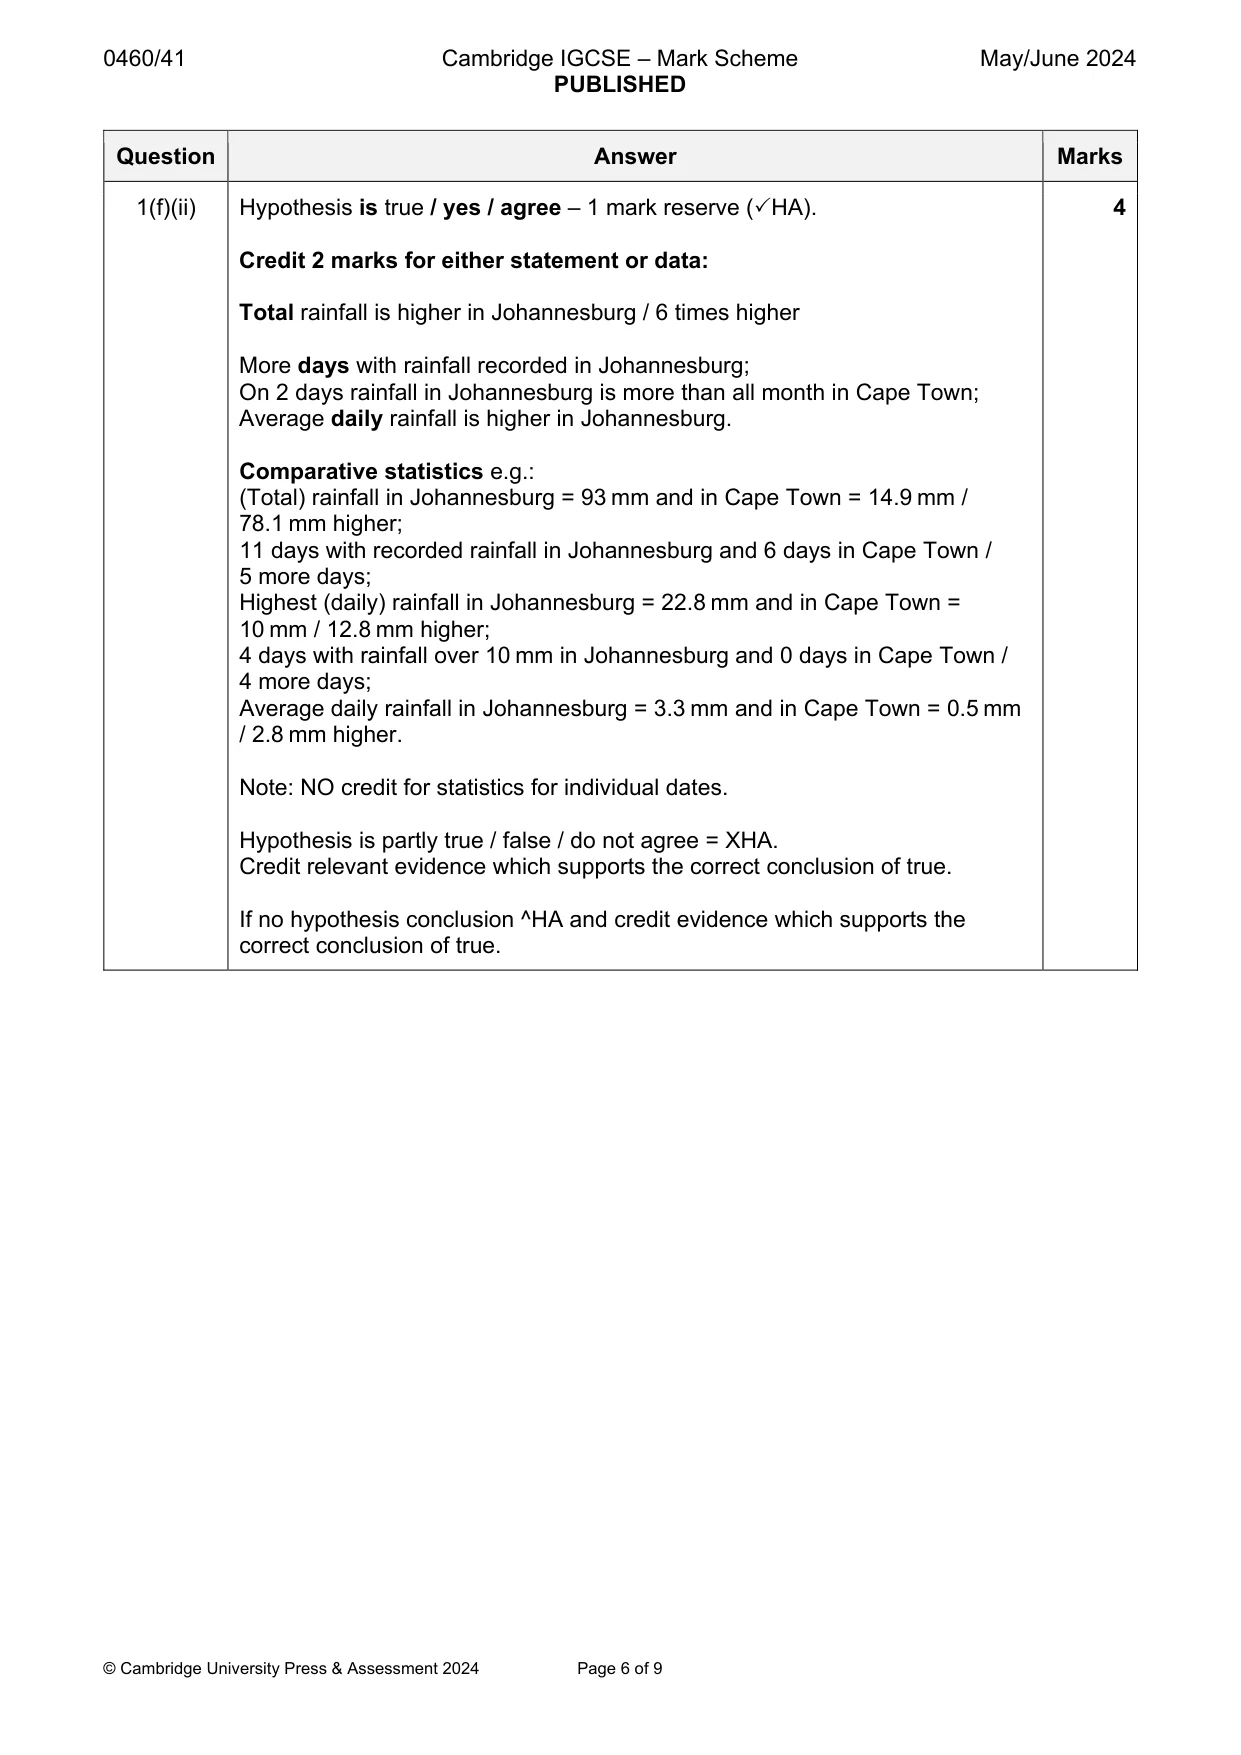
Mark scheme: Question Answer Marks 1(a)(i) To stop direct heating by the sun / keep it out of the sun / avoid direct sunlight 3 / stops heat absorption from sun; Air can circulate / allows ventilation; Thermometer is not affected by heat from the ground; To protect it from animals / damage by people / tampering. 1(a)(ii) Barometer / wet and dry bulb thermometer / hygrometer 1 1(a)(iii) Read temperatures every 24 hours / fixed period of time / same time of day / 3 at end of day; Read off the bottom of the index (to get maximum and minimum temperatures); Read at eye level; Reset thermometers. 1(b)(i) 1 mark for diagram with funnel, collecting jar and outer casing; 4 3 marks for labels which show parts of the rain gauge: Measuring jar / container / cylinder / beaker; Funnel; Outer casing; Scale / measurement / mm; Gauge half buried in ground. 1(b)(ii) Clear of buildings / on open ground / open area; 2 Clear of trees / not under trees; On grassland / not on concrete or pavement; On roof; Clear of people / animals / fenced off; Position where gauge is accessible; On level / flat ground. 1(b)(iii) Note: Explanation does not need to follow the description in 1(b)(ii). 2 All rainfall can enter gauge / nothing stops rain falling in / gauge is not sheltered / no obstruction / trees or buildings stop rain falling into gauge; To prevent interception / water dripping from leaves / leaves don’t block the funnel; Rain does not splash up into the rain gauge; To prevent instrument being emptied / interfered with; It can be checked and emptied each day; It doesn’t fall over. 1(c)(i) 12° 1 1(c)(ii) Day 3 1 1(d)(i) Secondary 1 1(d)(ii) More accurate / precise / reliable data / more trustworthy; 2 Collected by professionals or people with expertise / people have been trained; Automated / digital system of collection / hi-tech instruments / professional equipment; Collected every day / not affected by forgetting / weekends. 1(e)(i) Plot 30° at Cape Town X symbol 1 Line needed 1(e)(ii) Hypothesis is false; 4 OR Temperatures are higher in Cape Town; OR Temperatures are lower in Johannesburg – 1 mark reserve (HA). (Average) maximum and minimum temperatures are higher in Cape Town. 2 marks for comparative statistics e.g. (Average) maximum temperature in Cape Town = 28.2° and in Johannesburg = 24.4° / 3.8° higher in Cape Town; (Average) minimum temperature in Cape Town = 16.0° and in Johannesburg = 14.3° / 1.7° higher in Cape Town; Highest (daily) temperature in Cape Town = 36.2° and in Johannesburg = 29.1° / 7.1° higher in Cape Town; Lowest (daily) temperature in Cape Town = 11.2° and in Johannesburg = 10.1° / 1.1° higher in Cape Town. Note: NO credit for statistics for individual dates. NO credit for reference to dates when Johannesburg temperatures are higher than Cape Town (4 days maximum temperature and 6 days minimum temperature). Hypothesis is true / partly true = XHA. Credit relevant evidence which supports the correct conclusion of false. If no hypothesis conclusion ^HA and credit evidence which supports the correct conclusion of false. 1(f)(i) Plot 8.5 mm on 1st February in Johannesburg 1 1(f)(ii) Hypothesis is true / yes / agree – 1 mark reserve (HA). 4 Credit 2 marks for either statement or data: Total rainfall is higher in Johannesburg / 6 times higher More days with rainfall recorded in Johannesburg; On 2 days rainfall in Johannesburg is more than all month in Cape Town; Average daily rainfall is higher in Johannesburg. Comparative statistics e.g.: (Total) rainfall in Johannesburg = 93 mm and in Cape Town = 14.9 mm / 78.1 mm higher; 11 days with recorded rainfall in Johannesburg and 6 days in Cape Town / 5 more days; Highest (daily) rainfall in Johannesburg = 22.8 mm and in Cape Town = 10 mm / 12.8 mm higher; 4 days with rainfall over 10 mm in Johannesburg and 0 days in Cape Town / 4 more days; Average daily rainfall in Johannesburg = 3.3 mm and in Cape Town = 0.5 mm / 2.8 mm higher. Note: NO credit for statistics for individual dates. Hypothesis is partly true / false / do not agree = XHA. Credit relevant evidence which supports the correct conclusion of true. If no hypothesis conclusion ^HA and credit evidence which supports the correct conclusion of true.
Q2 · Students carried out some fieldwork about tourism at two sites near Kuala Lumpur, the…
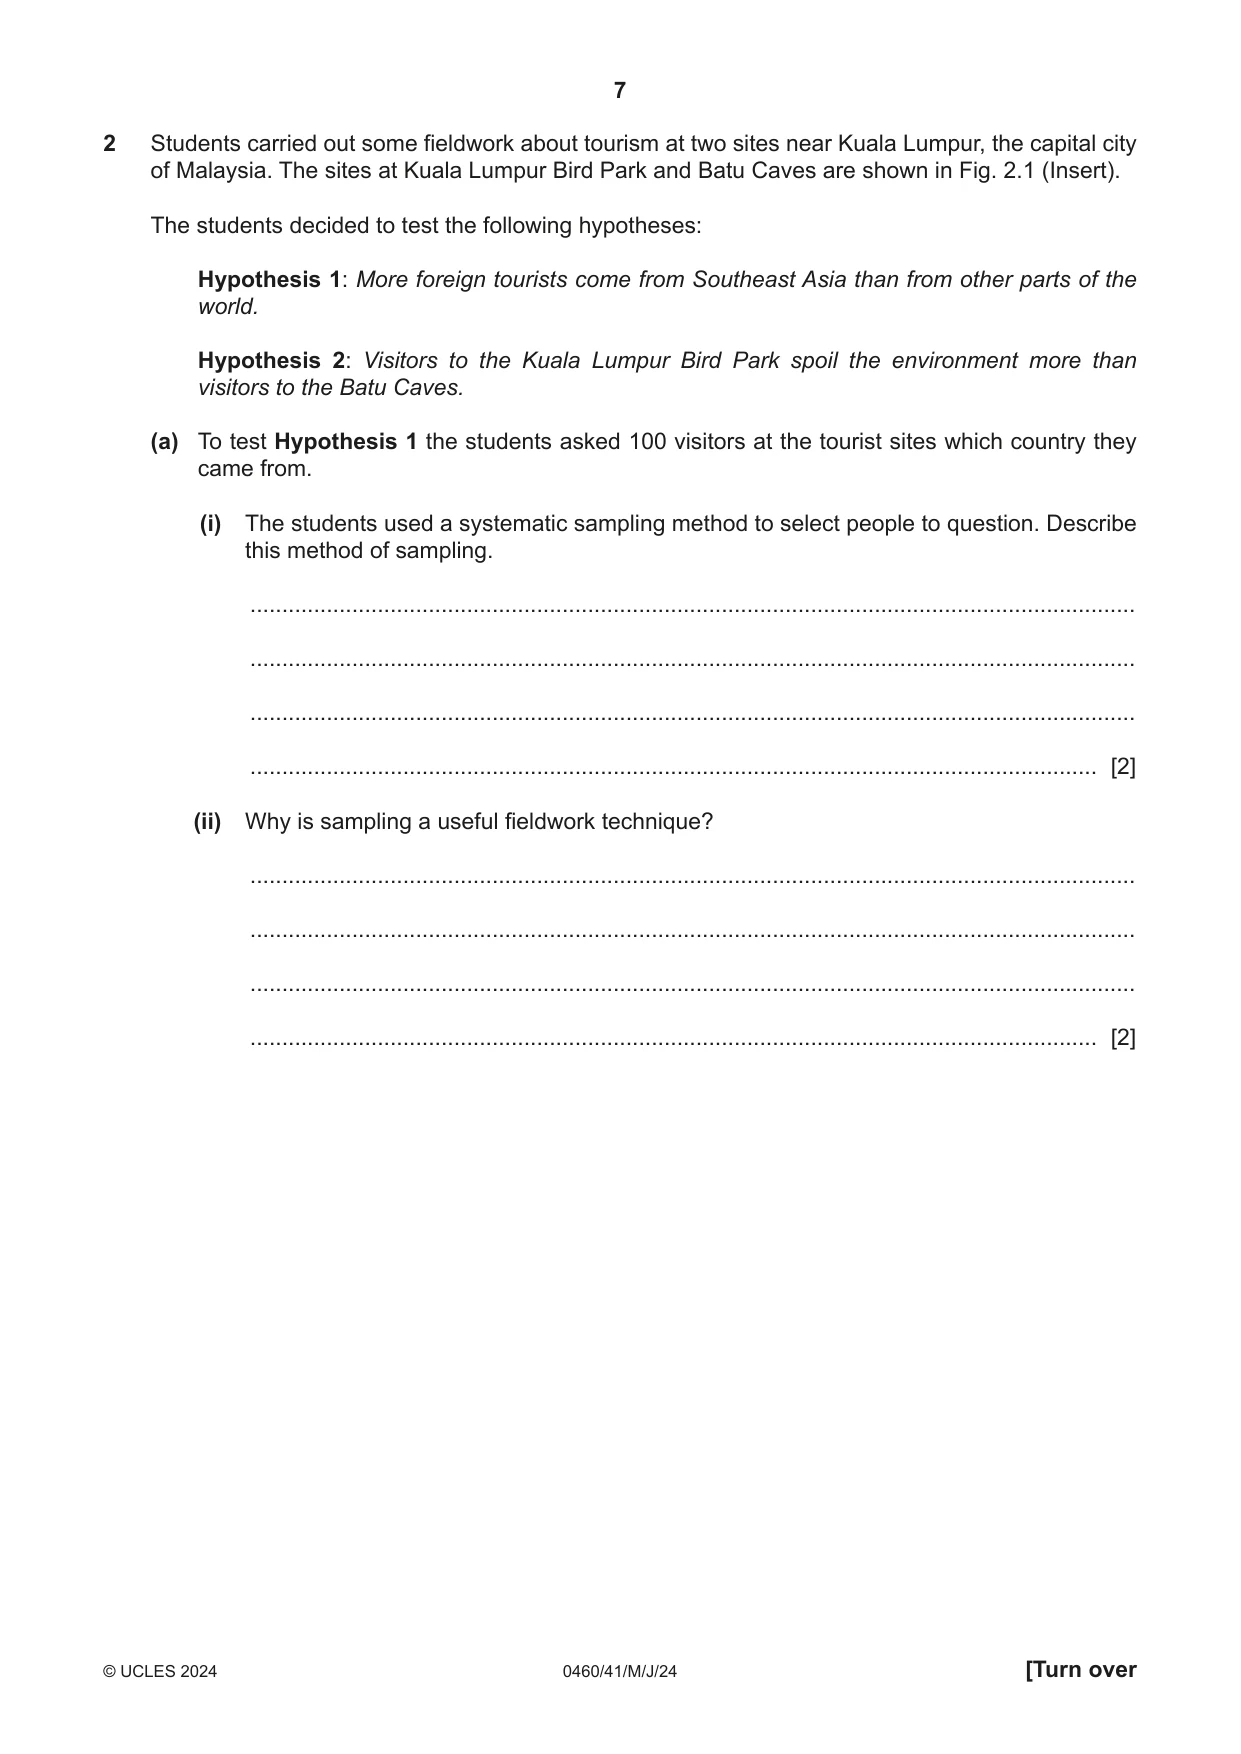
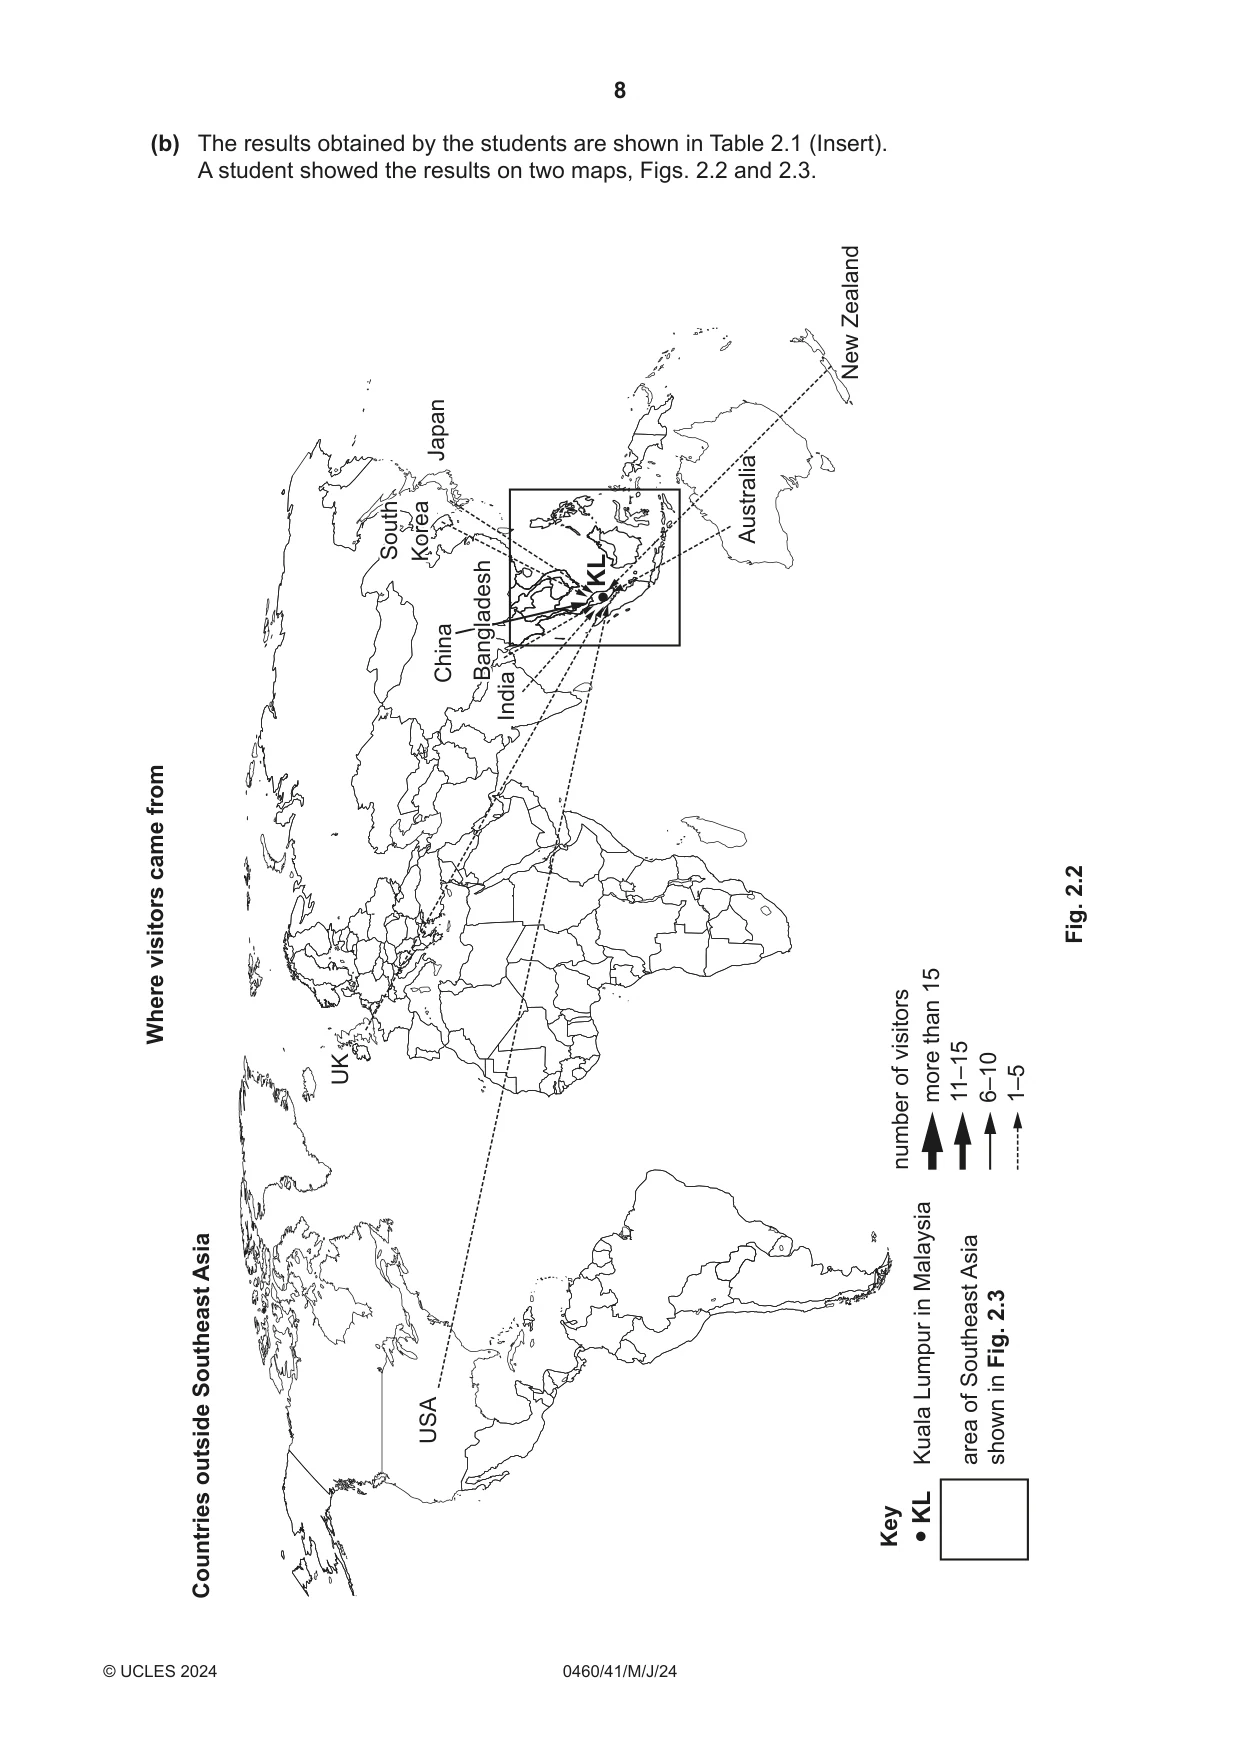
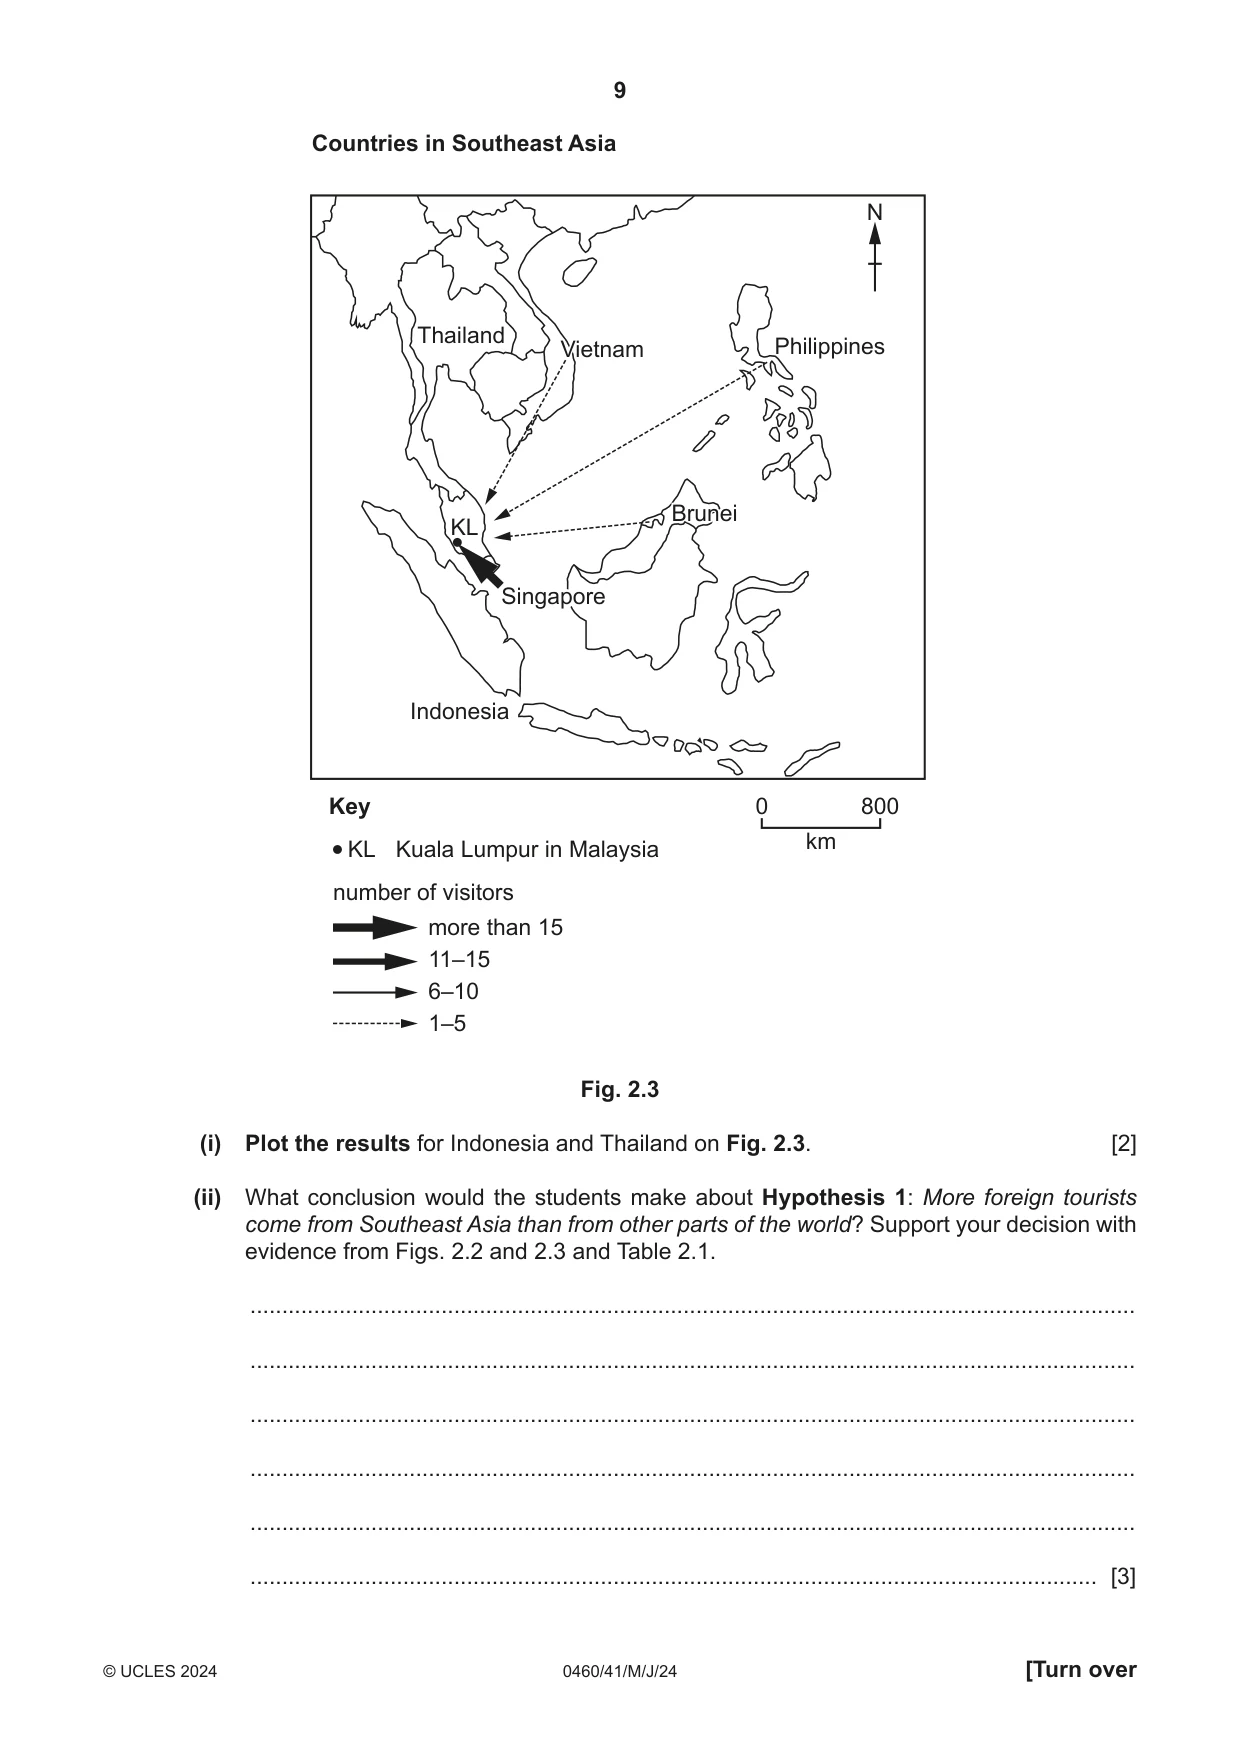
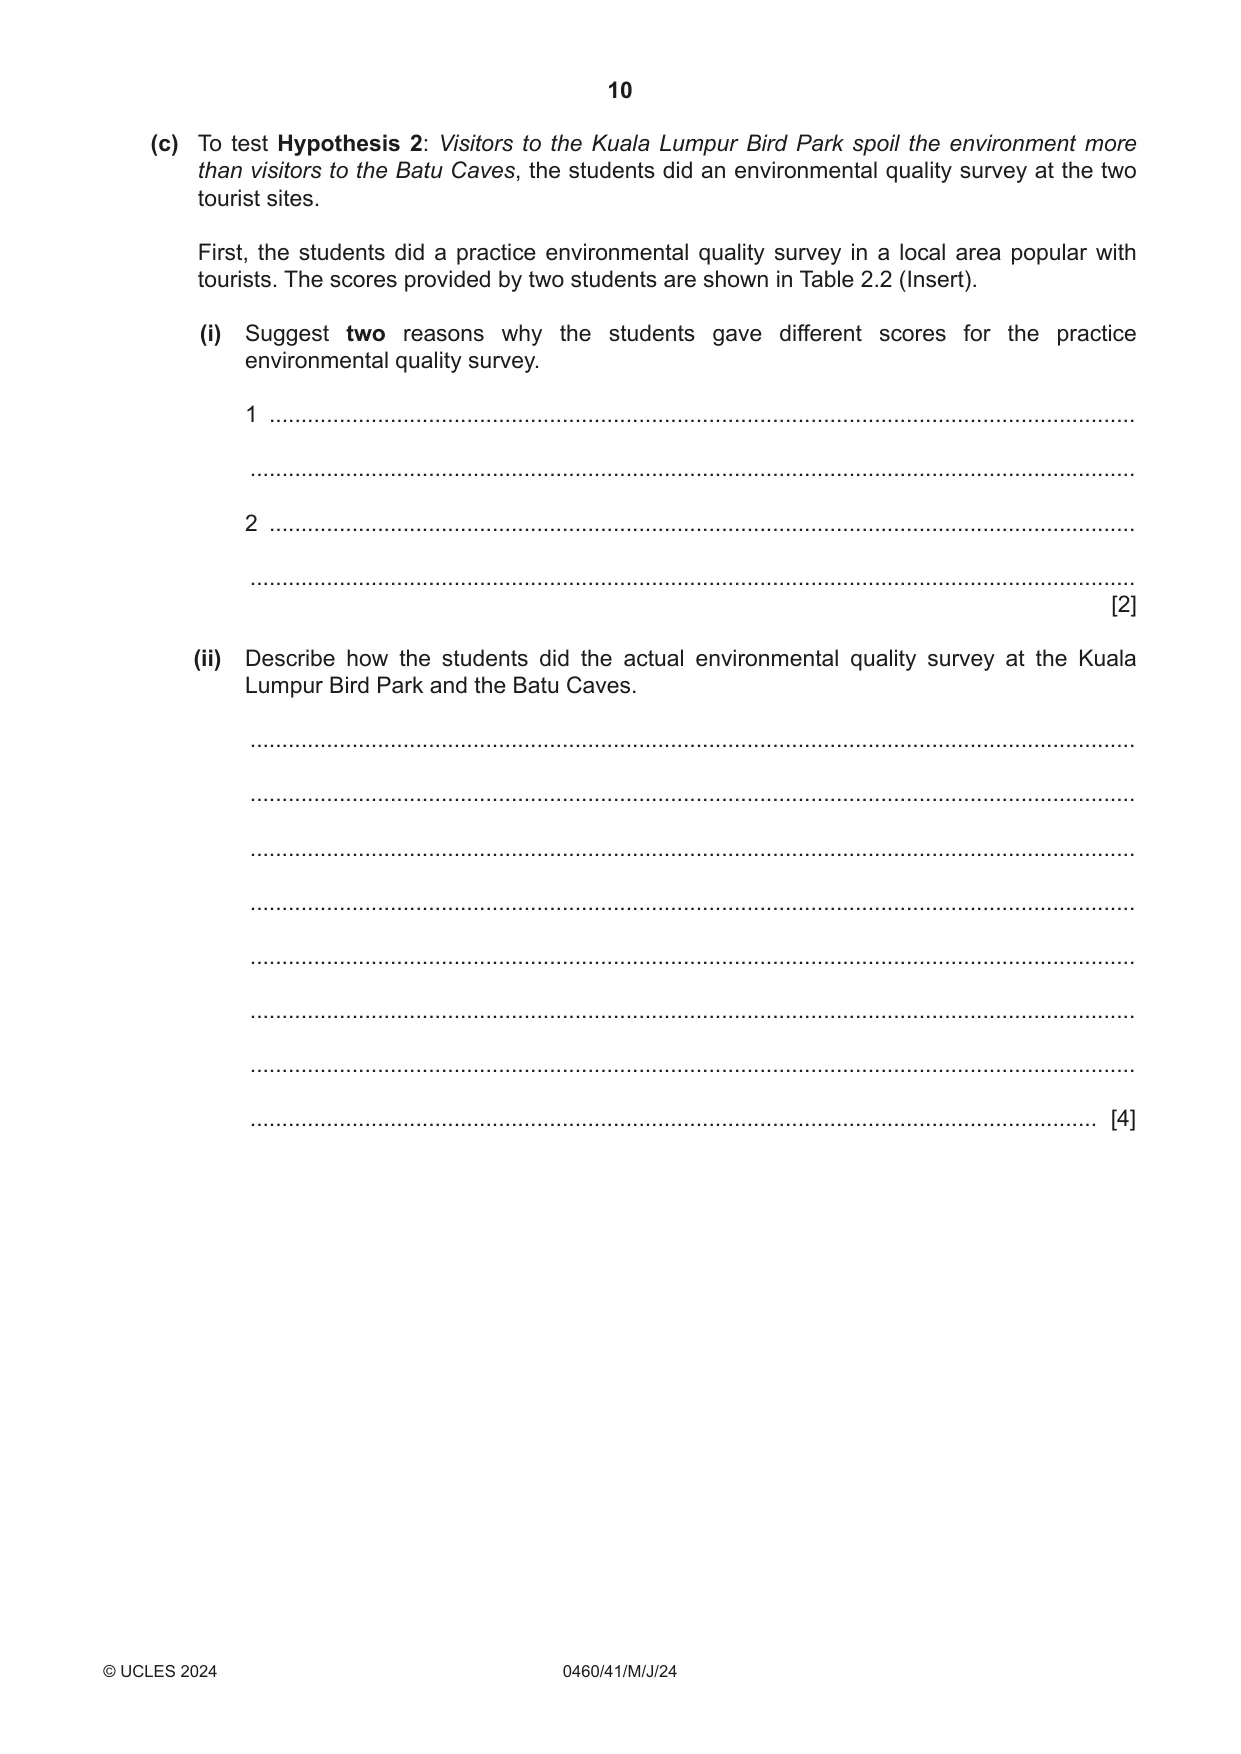
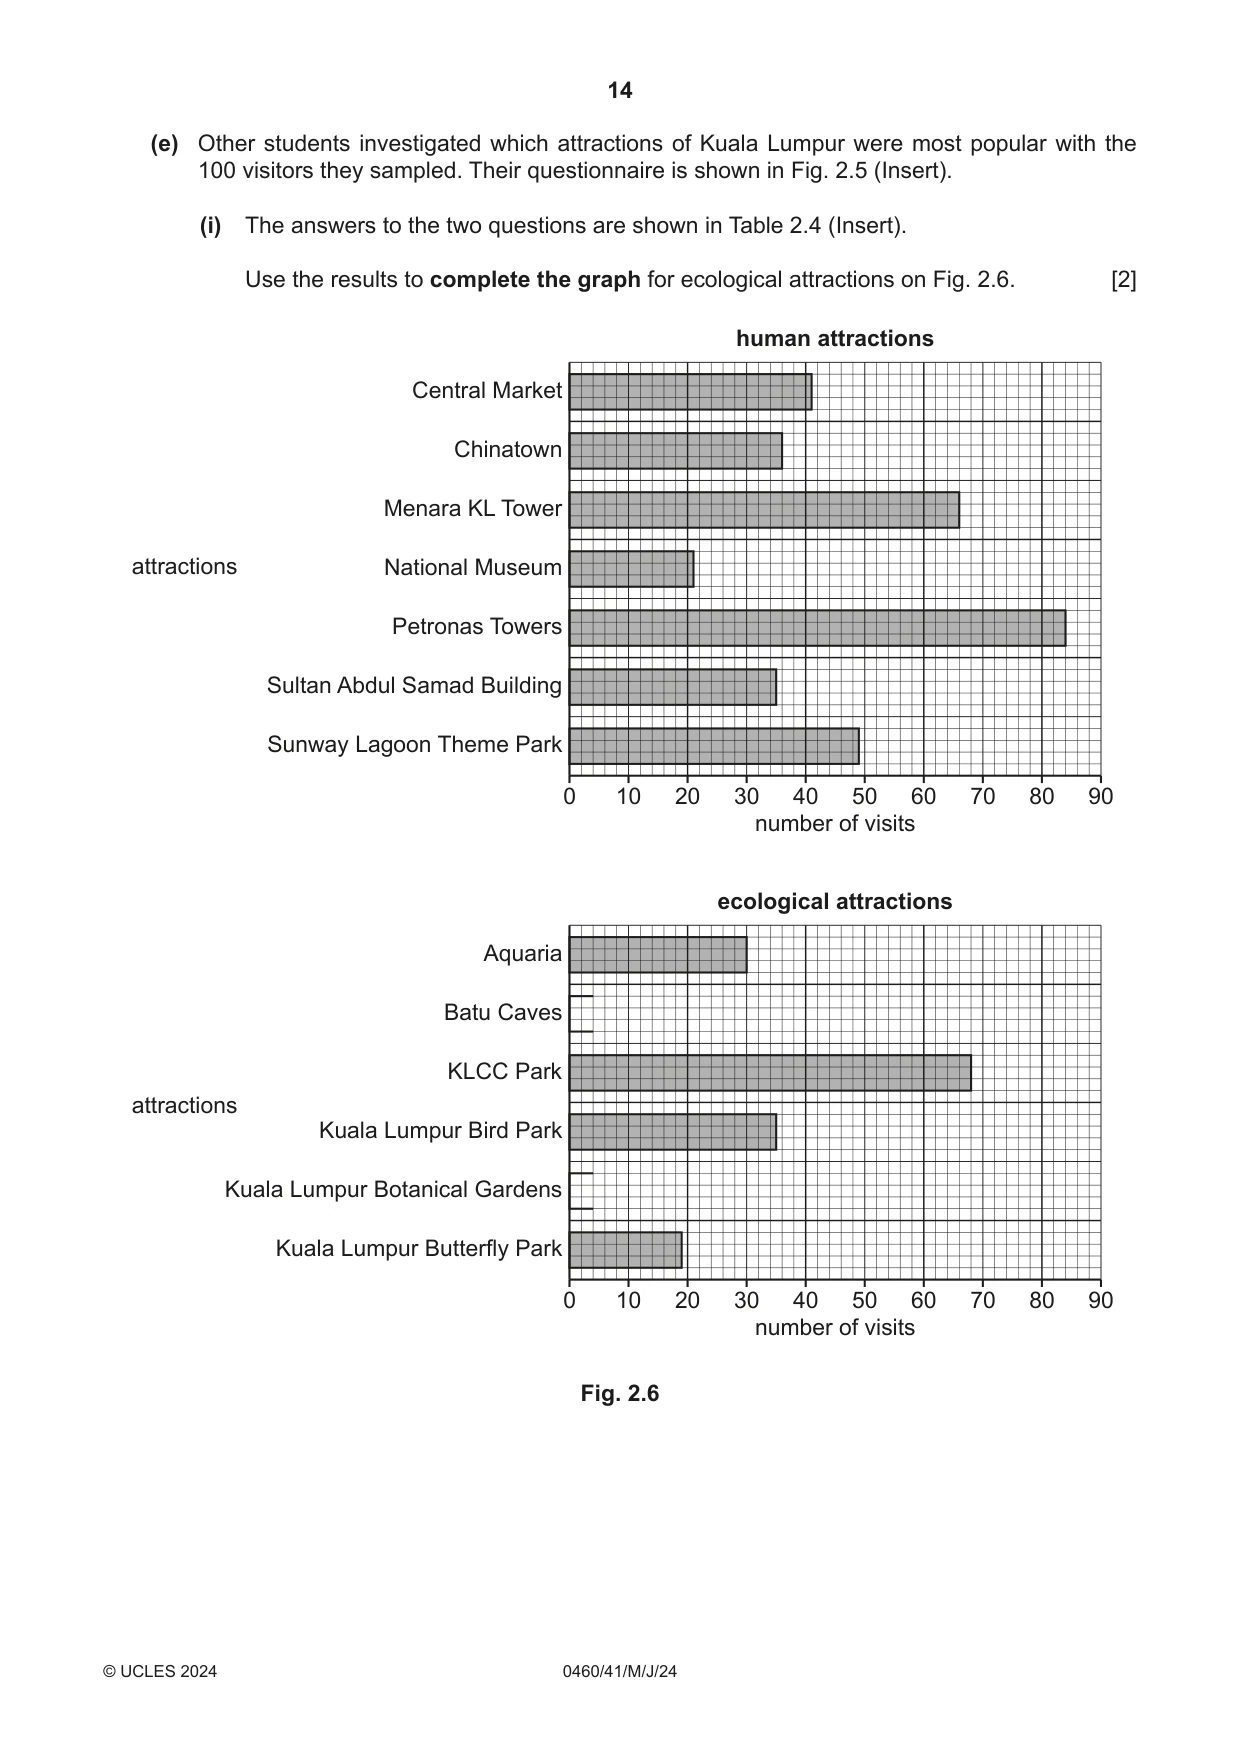
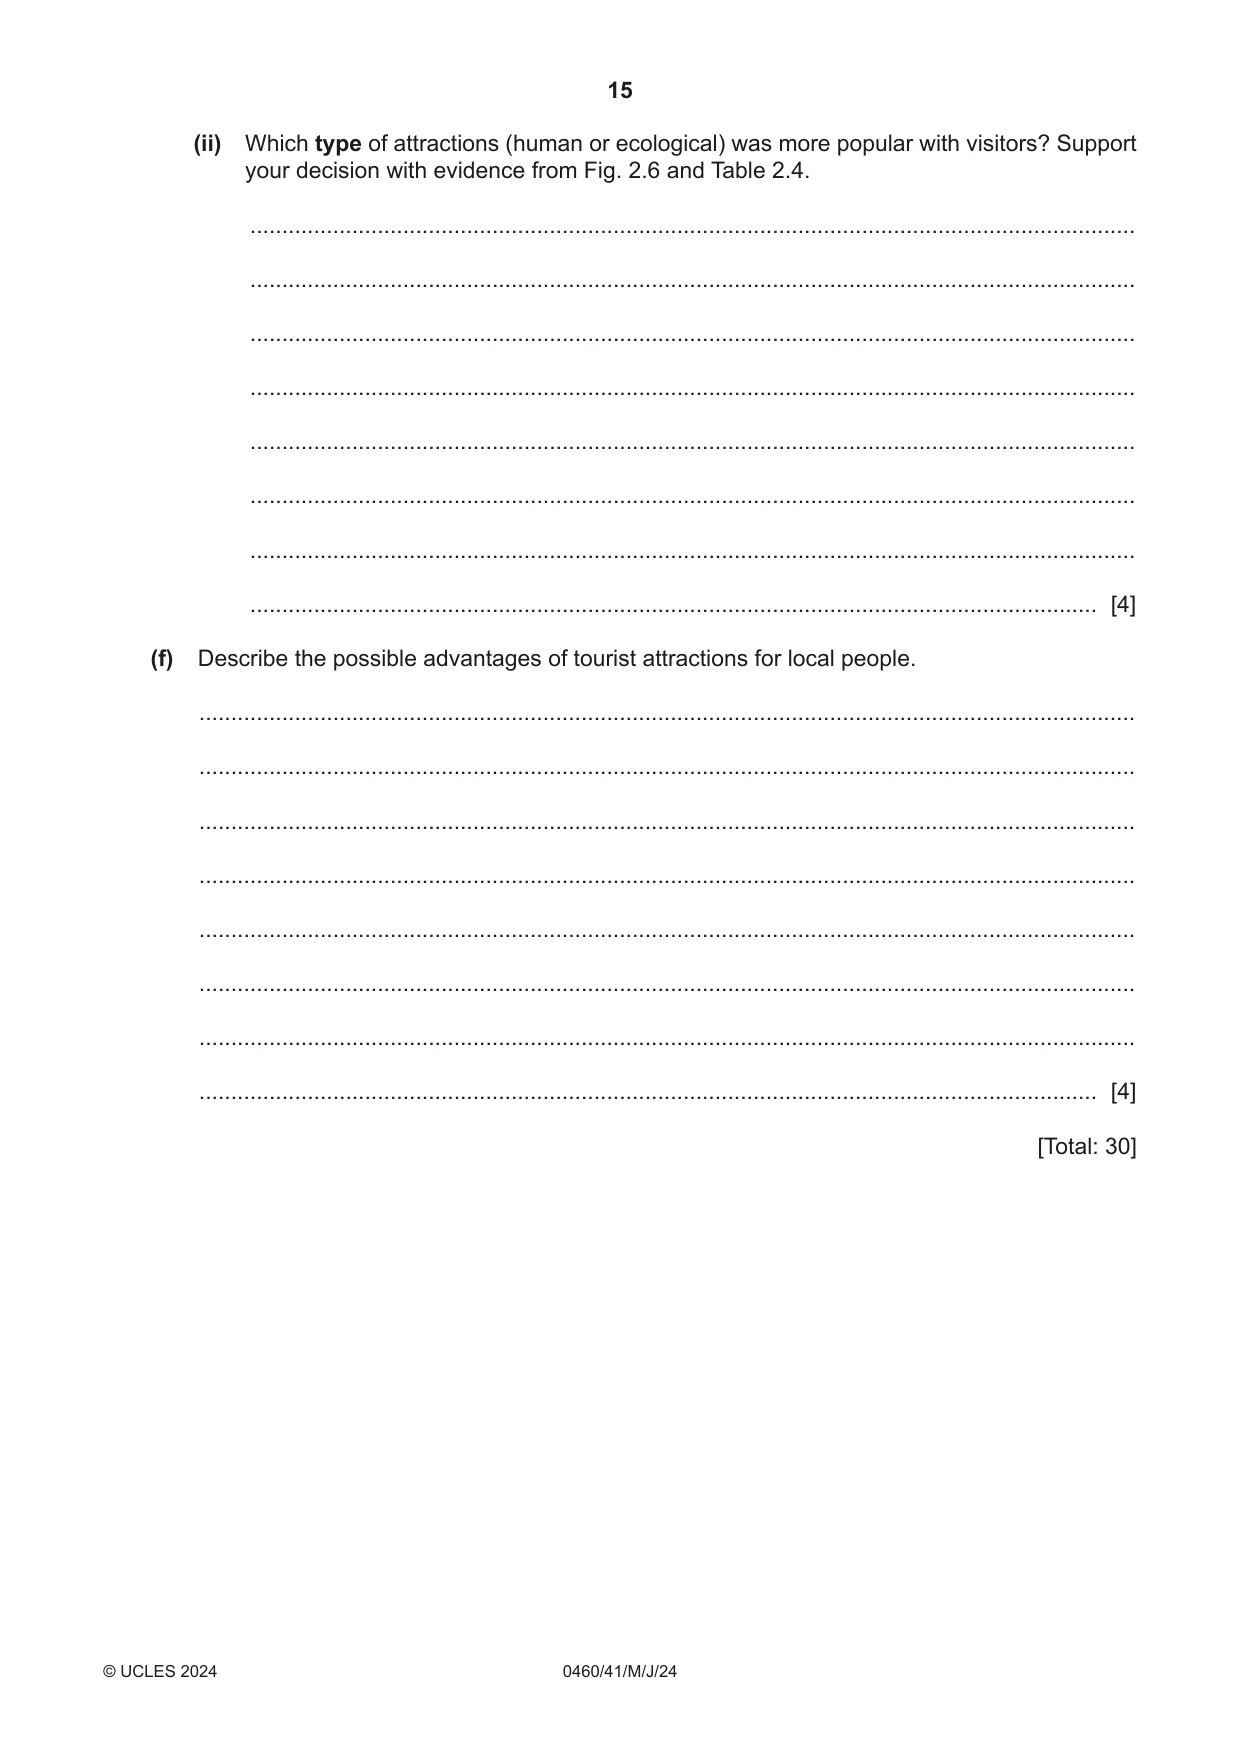
2 Students carried out some fieldwork about tourism at two sites near Kuala Lumpur, the capital city of Malaysia. The sites at Kuala Lumpur Bird Park and Batu Caves are shown in Fig. 2.1 (Insert). The students decided to test the following hypotheses: Hypothesis 1: More foreign tourists come from Southeast Asia than from other parts of the world. Hypothesis 2: Visitors to the Kuala Lumpur Bird Park spoil the environment more than visitors to the Batu Caves. (a) To test Hypothesis 1 the students asked 100 visitors at the tourist sites which country they came from. (i) The students used a systematic sampling method to select people to question. Describe this method of sampling. ........................................................................................................................................... ........................................................................................................................................... ........................................................................................................................................... ..................................................................................................................................... [2] (ii) Why is sampling a useful fieldwork technique? ........................................................................................................................................... ........................................................................................................................................... ........................................................................................................................................... ..................................................................................................................................... [2] (b) The results obtained by the students are shown in Table 2.1 (Insert). A student showed the results on two maps, Figs. 2.2 and 2.3. Zealand New Japan Australia SouthSouth KoreaKorea China BangladeshBangladesh KL India from came 2.2 Fig.visitors 15 Where than visitors UK ofmore11–156–101–5 number Asia Asia Malaysia in 2.3 Fig. in Southeast Lumpur Southeast USA of areashown outside Kuala KL Key Countries Countries in Southeast Asia N Thailand VietnamVietnam Philippines BruneiBrunei KL SingaporeSingapore Indonesia Key 0 800 km KL Kuala Lumpur in Malaysia number of visitors more than 15 11–15 6–10 1–5 Fig. 2.3 (i) Plot the results for Indonesia and Thailand on Fig. 2.3. [2] (ii) What conclusion would the students make about Hypothesis 1: More foreign tourists come from Southeast Asia than from other parts of the world? Support your decision with evidence from Figs. 2.2 and 2.3 and Table 2.1. ........................................................................................................................................... ........................................................................................................................................... ........................................................................................................................................... ........................................................................................................................................... ........................................................................................................................................... ..................................................................................................................................... [3]
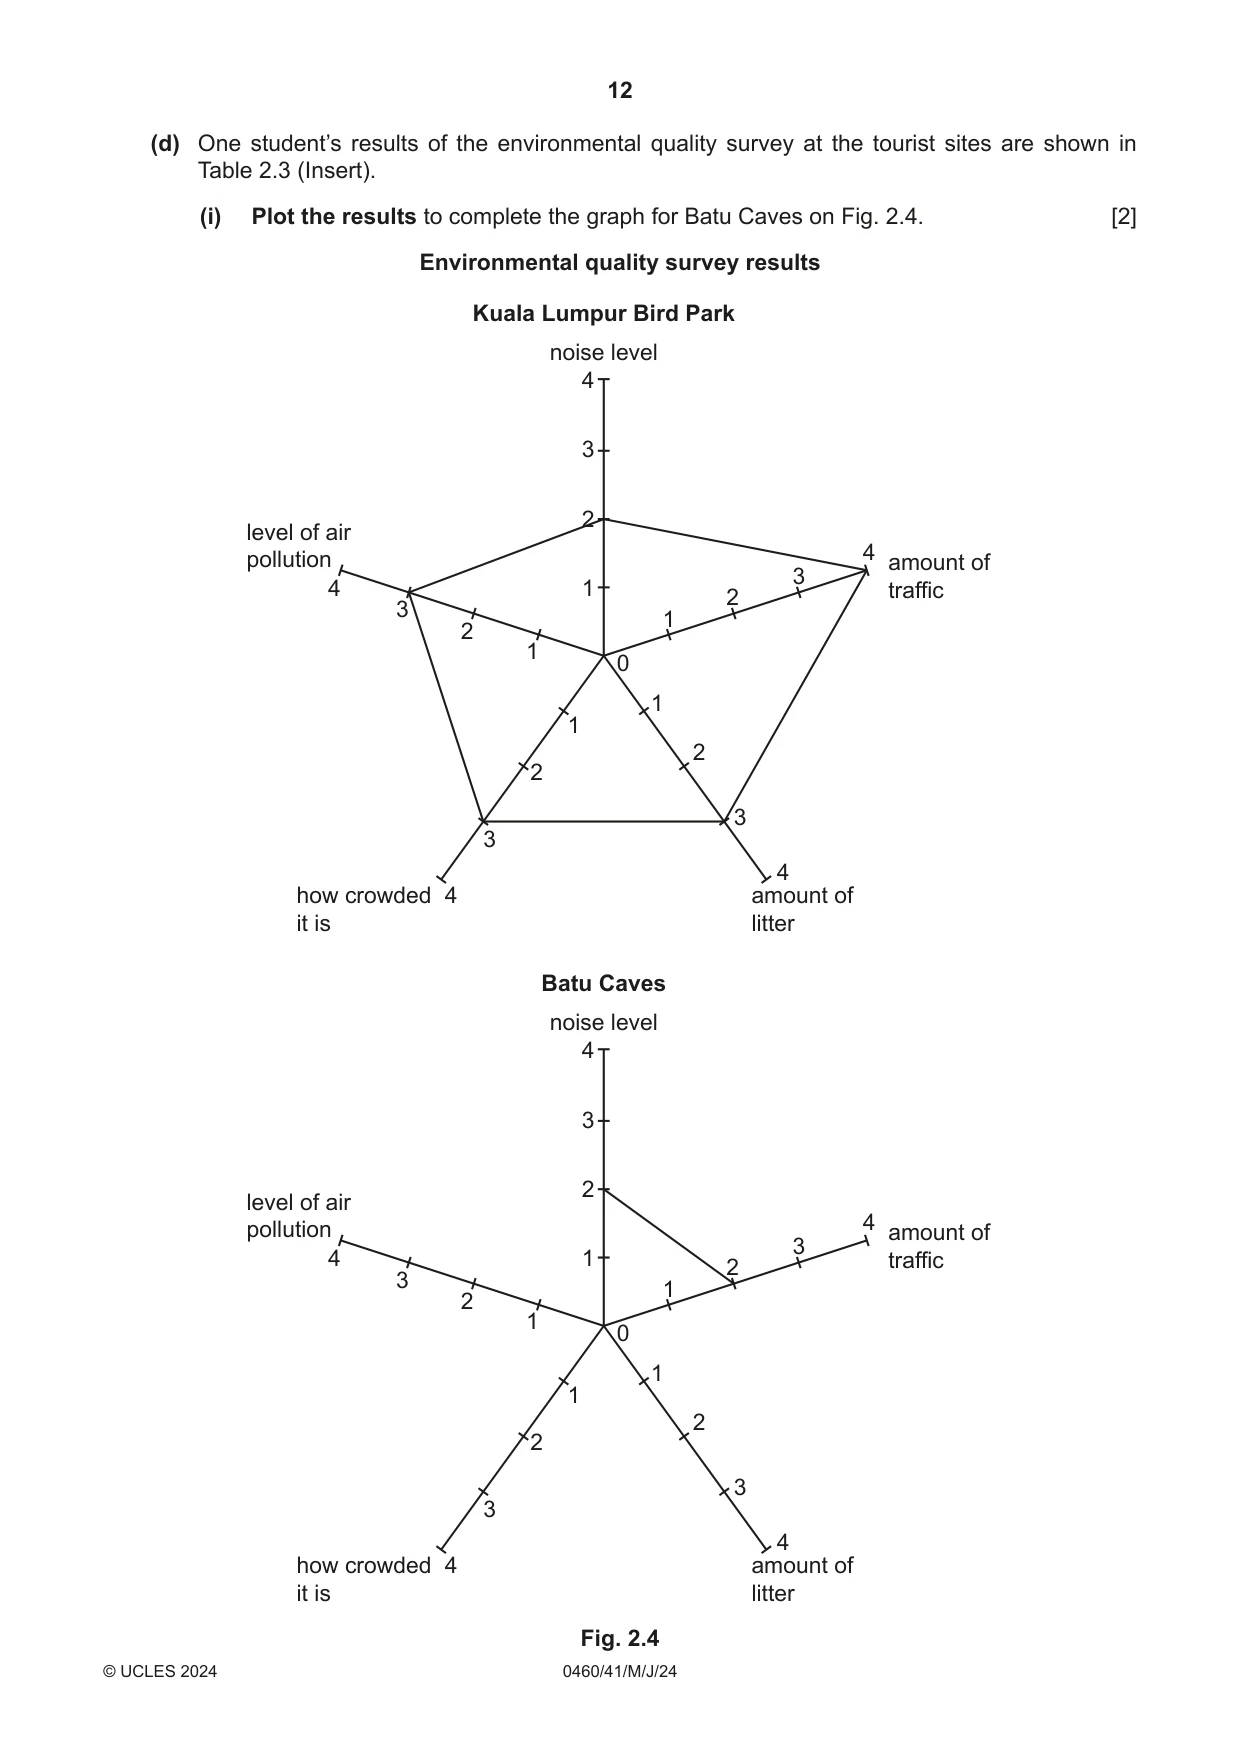
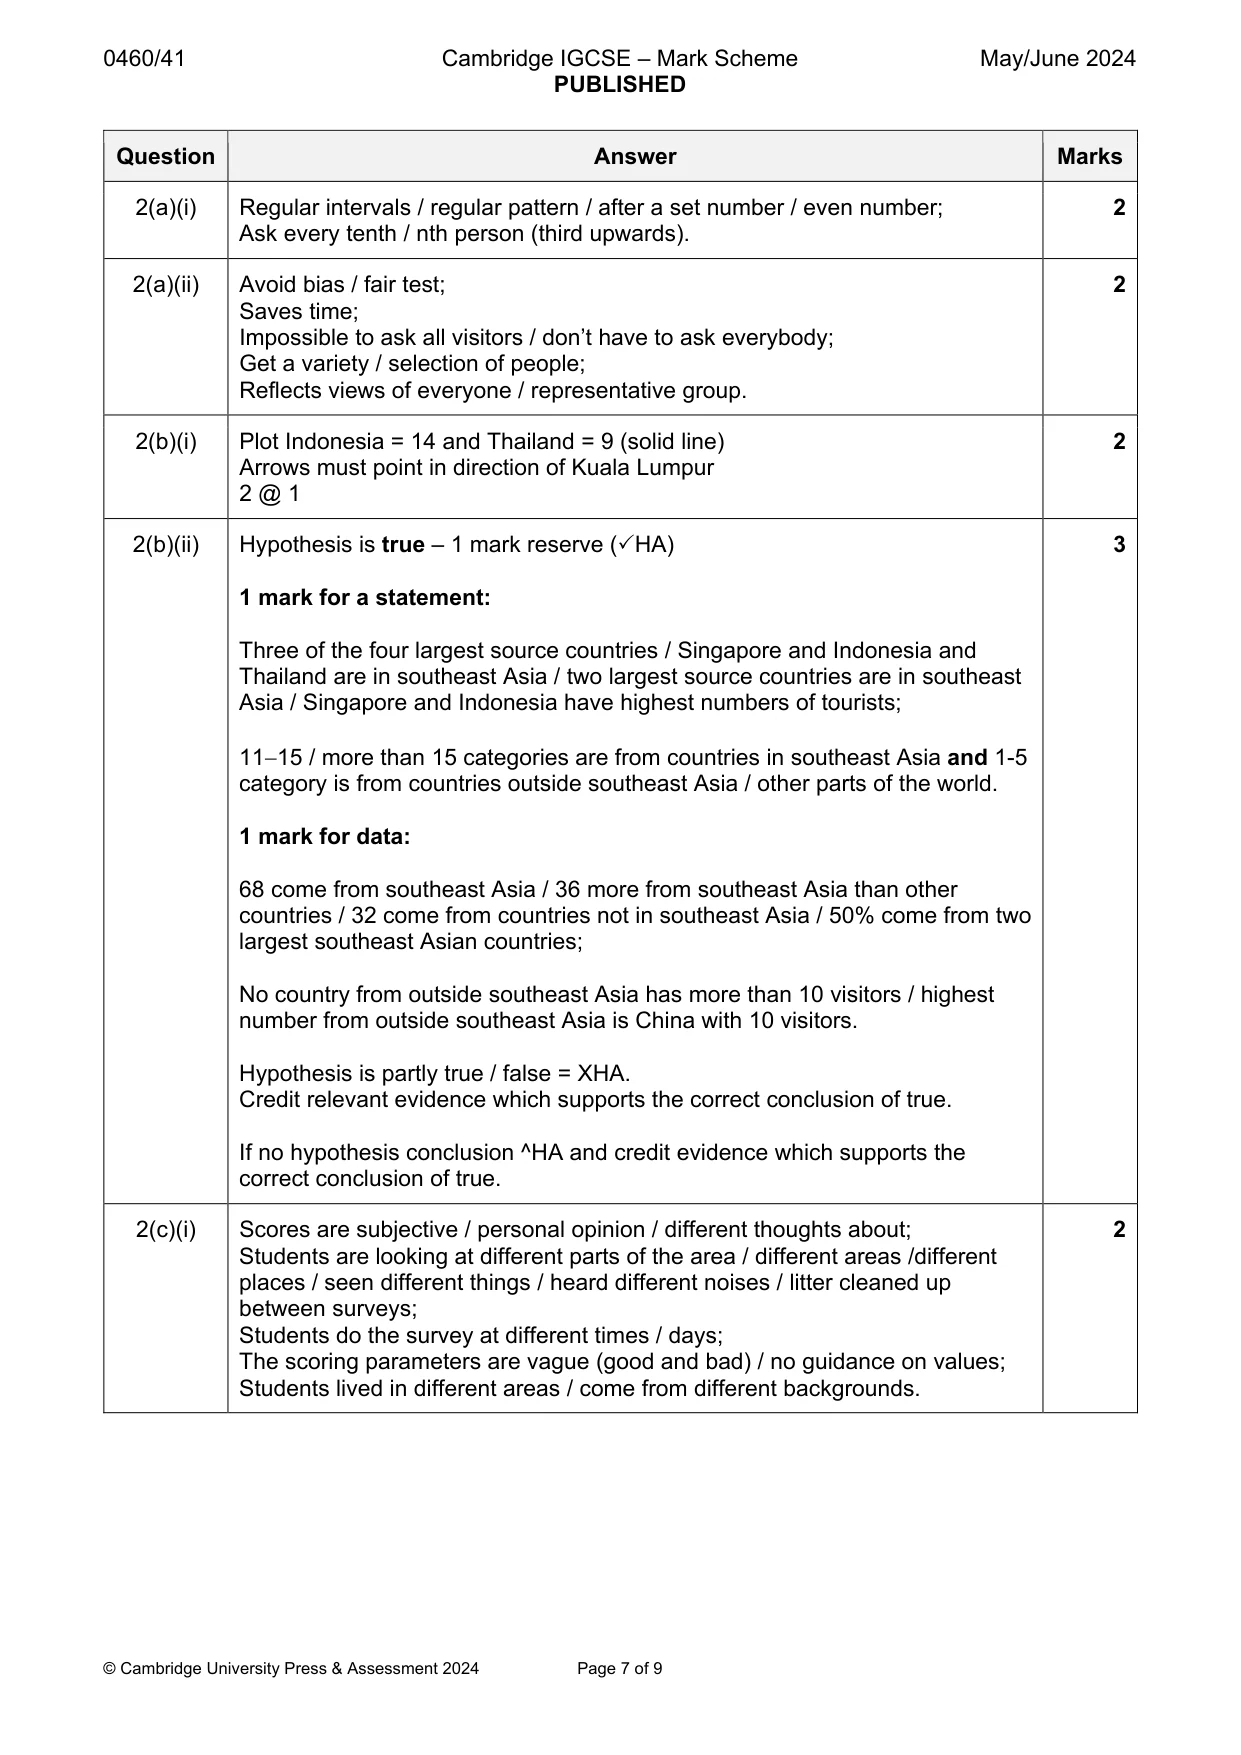
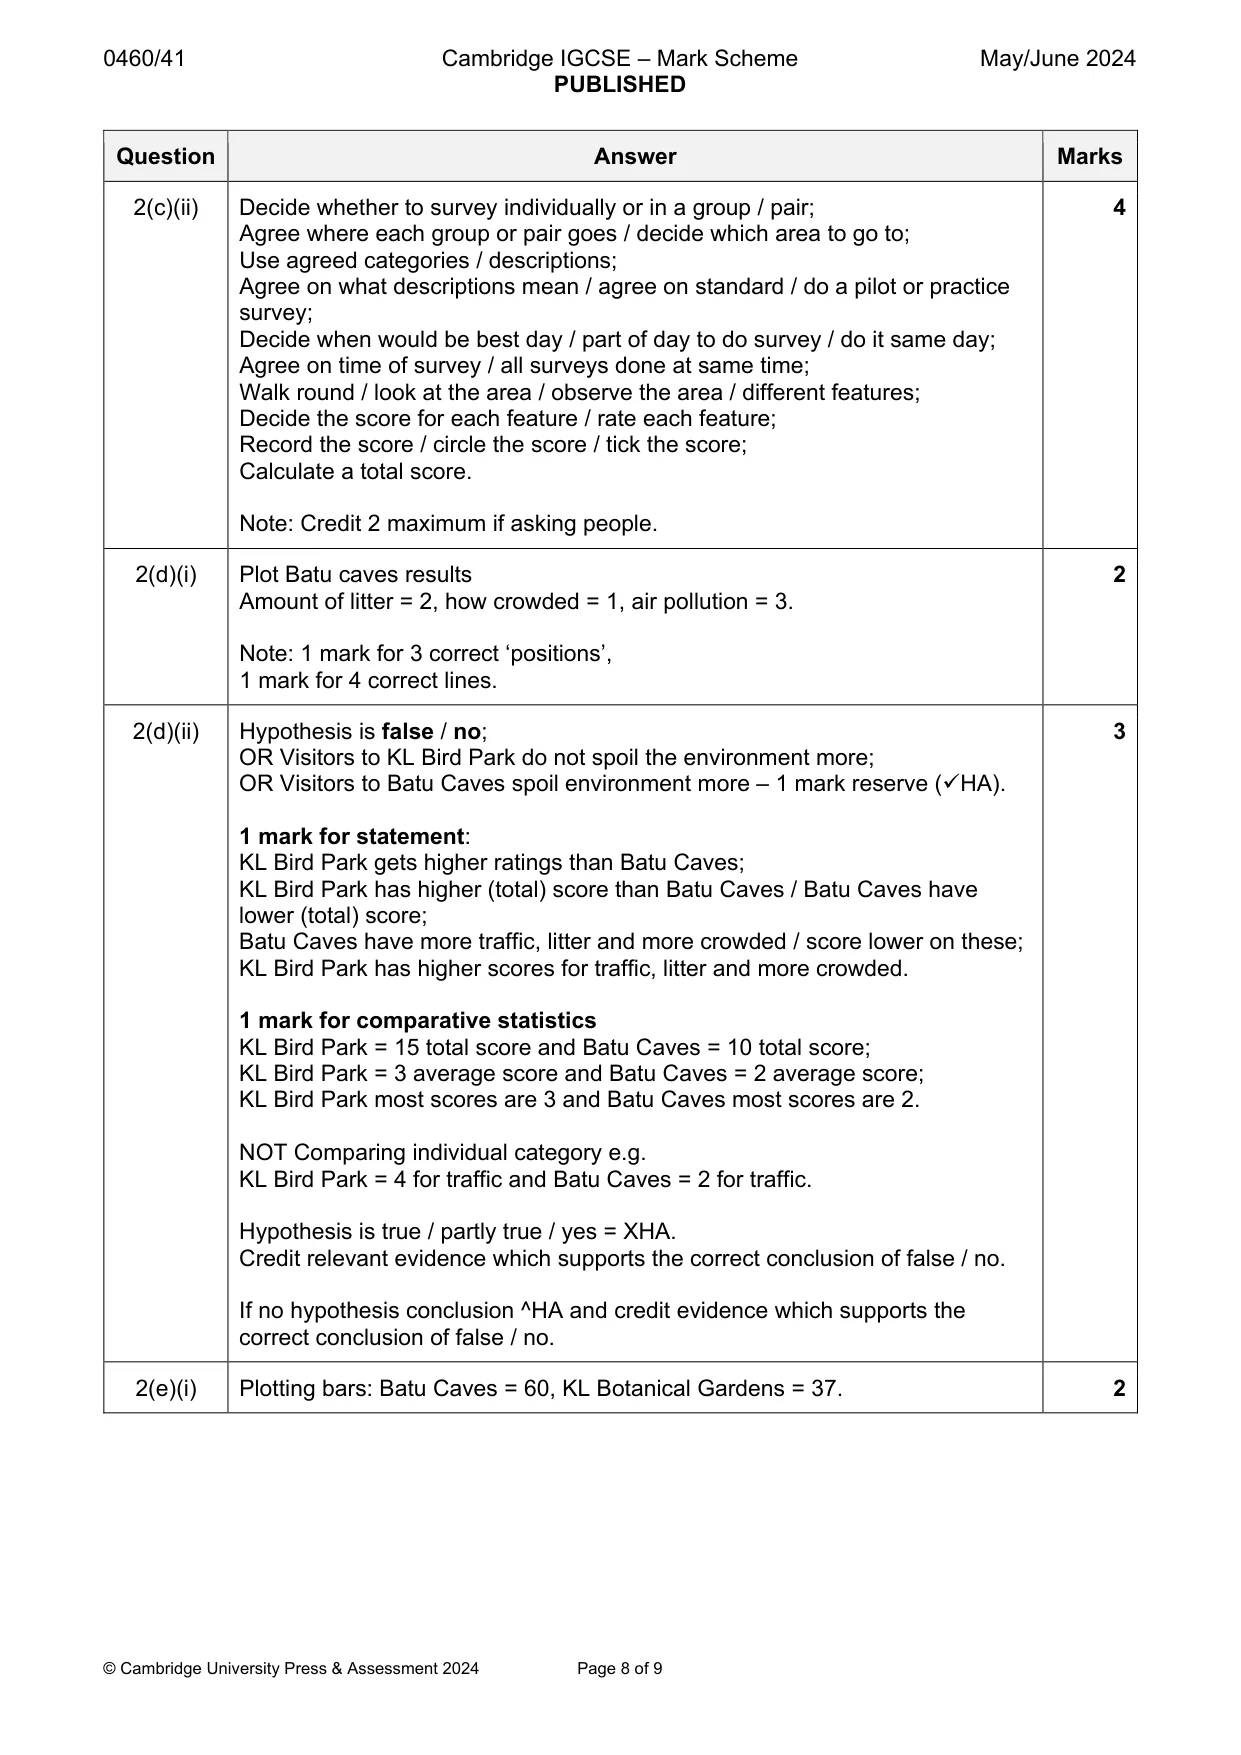
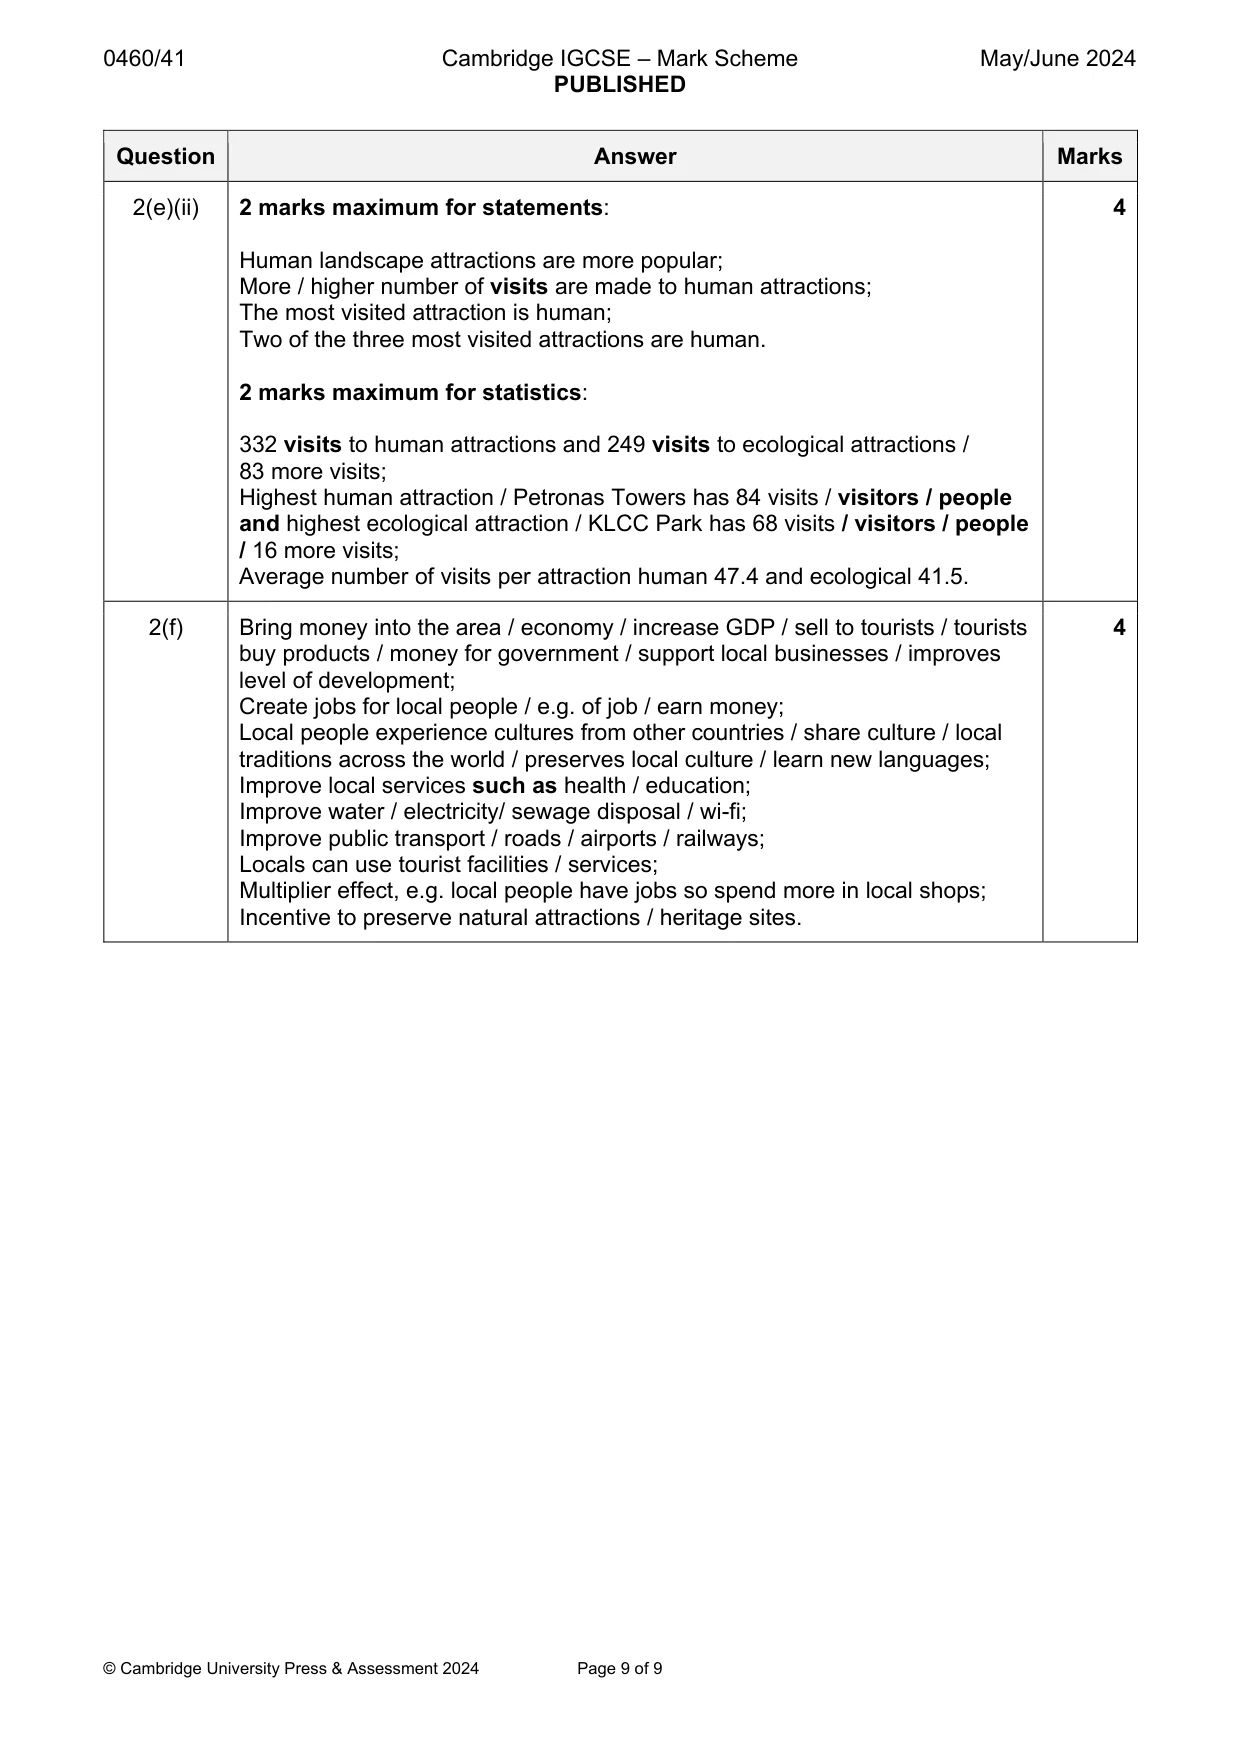
Mark scheme: 2(a)(i) Regular intervals / regular pattern / after a set number / even number; 2 Ask every tenth / nth person (third upwards). 2(a)(ii) Avoid bias / fair test; 2 Saves time; Impossible to ask all visitors / don’t have to ask everybody; Get a variety / selection of people; Reflects views of everyone / representative group. 2(b)(i) Plot Indonesia = 14 and Thailand = 9 (solid line) 2 Arrows must point in direction of Kuala Lumpur 2 @ 1 2(b)(ii) Hypothesis is true – 1 mark reserve (HA) 3 1 mark for a statement: Three of the four largest source countries / Singapore and Indonesia and Thailand are in southeast Asia / two largest source countries are in southeast Asia / Singapore and Indonesia have highest numbers of tourists; 1115 / more than 15 categories are from countries in southeast Asia and 1-5 category is from countries outside southeast Asia / other parts of the world. 1 mark for data: 68 come from southeast Asia / 36 more from southeast Asia than other countries / 32 come from countries not in southeast Asia / 50% come from two largest southeast Asian countries; No country from outside southeast Asia has more than 10 visitors / highest number from outside southeast Asia is China with 10 visitors. Hypothesis is partly true / false = XHA. Credit relevant evidence which supports the correct conclusion of true. If no hypothesis conclusion ^HA and credit evidence which supports the correct conclusion of true. 2(c)(i) Scores are subjective / personal opinion / different thoughts about; 2 Students are looking at different parts of the area / different areas /different places / seen different things / heard different noises / litter cleaned up between surveys; Students do the survey at different times / days; The scoring parameters are vague (good and bad) / no guidance on values; Students lived in different areas / come from different backgrounds. 2(c)(ii) Decide whether to survey individually or in a group / pair; 4 Agree where each group or pair goes / decide which area to go to; Use agreed categories / descriptions; Agree on what descriptions mean / agree on standard / do a pilot or practice survey; Decide when would be best day / part of day to do survey / do it same day; Agree on time of survey / all surveys done at same time; Walk round / look at the area / observe the area / different features; Decide the score for each feature / rate each feature; Record the score / circle the score / tick the score; Calculate a total score. Note: Credit 2 maximum if asking people. 2(d)(i) Plot Batu caves results 2 Amount of litter = 2, how crowded = 1, air pollution = 3. Note: 1 mark for 3 correct ‘positions’, 1 mark for 4 correct lines. 2(d)(ii) Hypothesis is false / no; 3 OR Visitors to KL Bird Park do not spoil the environment more; OR Visitors to Batu Caves spoil environment more – 1 mark reserve (HA). 1 mark for statement: KL Bird Park gets higher ratings than Batu Caves; KL Bird Park has higher (total) score than Batu Caves / Batu Caves have lower (total) score; Batu Caves have more traffic, litter and more crowded / score lower on these; KL Bird Park has higher scores for traffic, litter and more crowded. 1 mark for comparative statistics KL Bird Park = 15 total score and Batu Caves = 10 total score; KL Bird Park = 3 average score and Batu Caves = 2 average score; KL Bird Park most scores are 3 and Batu Caves most scores are 2. NOT Comparing individual category e.g. KL Bird Park = 4 for traffic and Batu Caves = 2 for traffic. Hypothesis is true / partly true / yes = XHA. Credit relevant evidence which supports the correct conclusion of false / no. If no hypothesis conclusion ^HA and credit evidence which supports the correct conclusion of false / no. 2(e)(i) Plotting bars: Batu Caves = 60, KL Botanical Gardens = 37. 2 2(e)(ii) 2 marks maximum for statements: 4 Human landscape attractions are more popular; More / higher number of visits are made to human attractions; The most visited attraction is human; Two of the three most visited attractions are human. 2 marks maximum for statistics: 332 visits to human attractions and 249 visits to ecological attractions / 83 more visits; Highest human attraction / Petronas Towers has 84 visits / visitors / people and highest ecological attraction / KLCC Park has 68 visits / visitors / people / 16 more visits; Average number of visits per attraction human 47.4 and ecological 41.5. 2(f) Bring money into the area / economy / increase GDP / sell to tourists / tourists 4 buy products / money for government / support local businesses / improves level of development; Create jobs for local people / e.g. of job / earn money; Local people experience cultures from other countries / share culture / local traditions across the world / preserves local culture / learn new languages; Improve local services such as health / education; Improve water / electricity/ sewage disposal / wi-fi; Improve public transport / roads / airports / railways; Locals can use tourist facilities / services; Multiplier effect, e.g. local people have jobs so spend more in local shops; Incentive to preserve natural attractions / heritage sites.
What was in this paper
The subtopics covered by these 2 questions, and how many questions each got. Open one in a new tab to see every Cambridge question on it.
What you needed in this session
Cambridge’s own grade thresholds for 2024 May/June, Paper 4 · Variant 1. A higher threshold means an easier paper — the bar moves with how the cohort did.