Cambridge IGCSE Geography 0460 — 2022 May/June Paper 4 · Variant 1
0460/41/M/J/22 · 2 questions · 60 marks · ≈68 min
The question paper and its mark scheme, free to read here and free to download. This is Cambridge’s own paper, exactly as it was sat.
Question paper16 pages





Mark scheme7 pages
Answers below. Sit the paper first if you are practising.

Questions as text
Q1 · Students were learning about processes which take place in a drainage basin
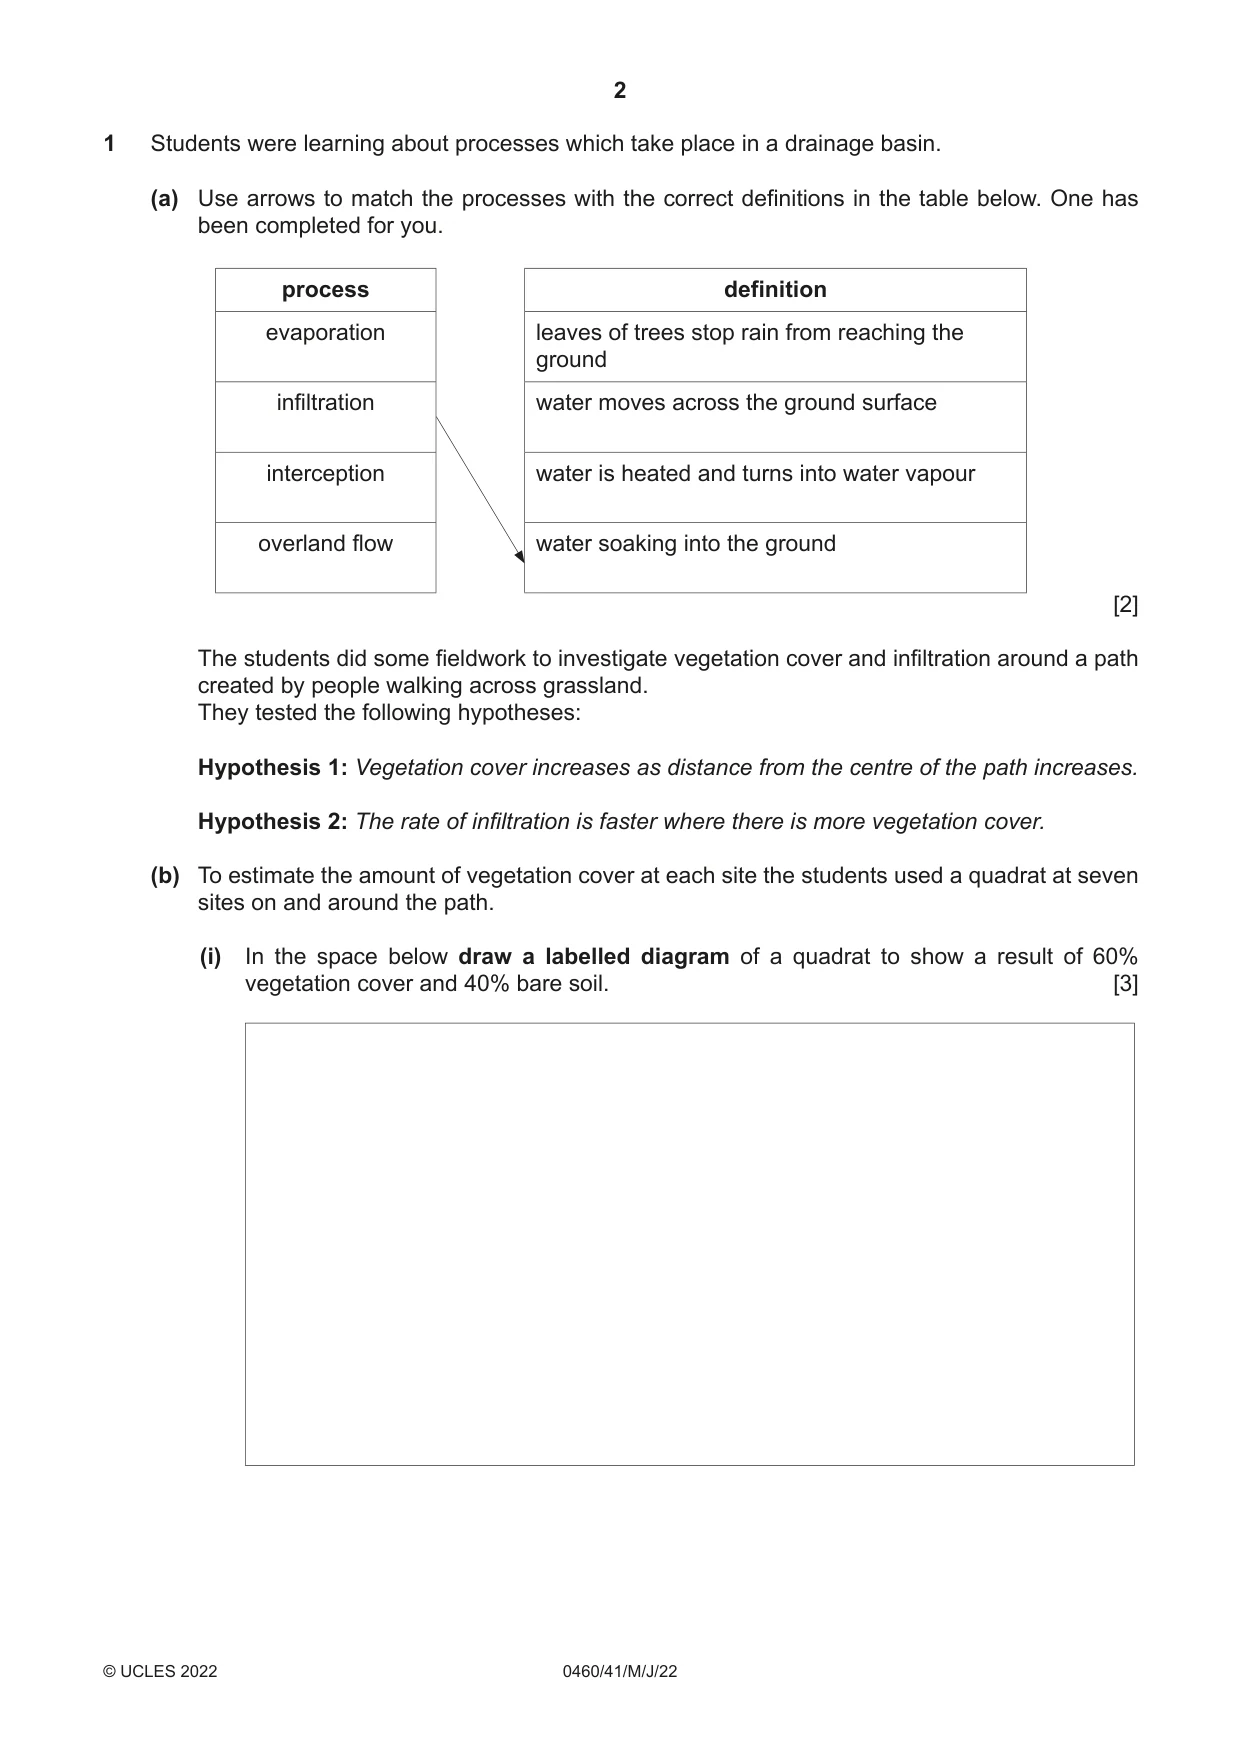
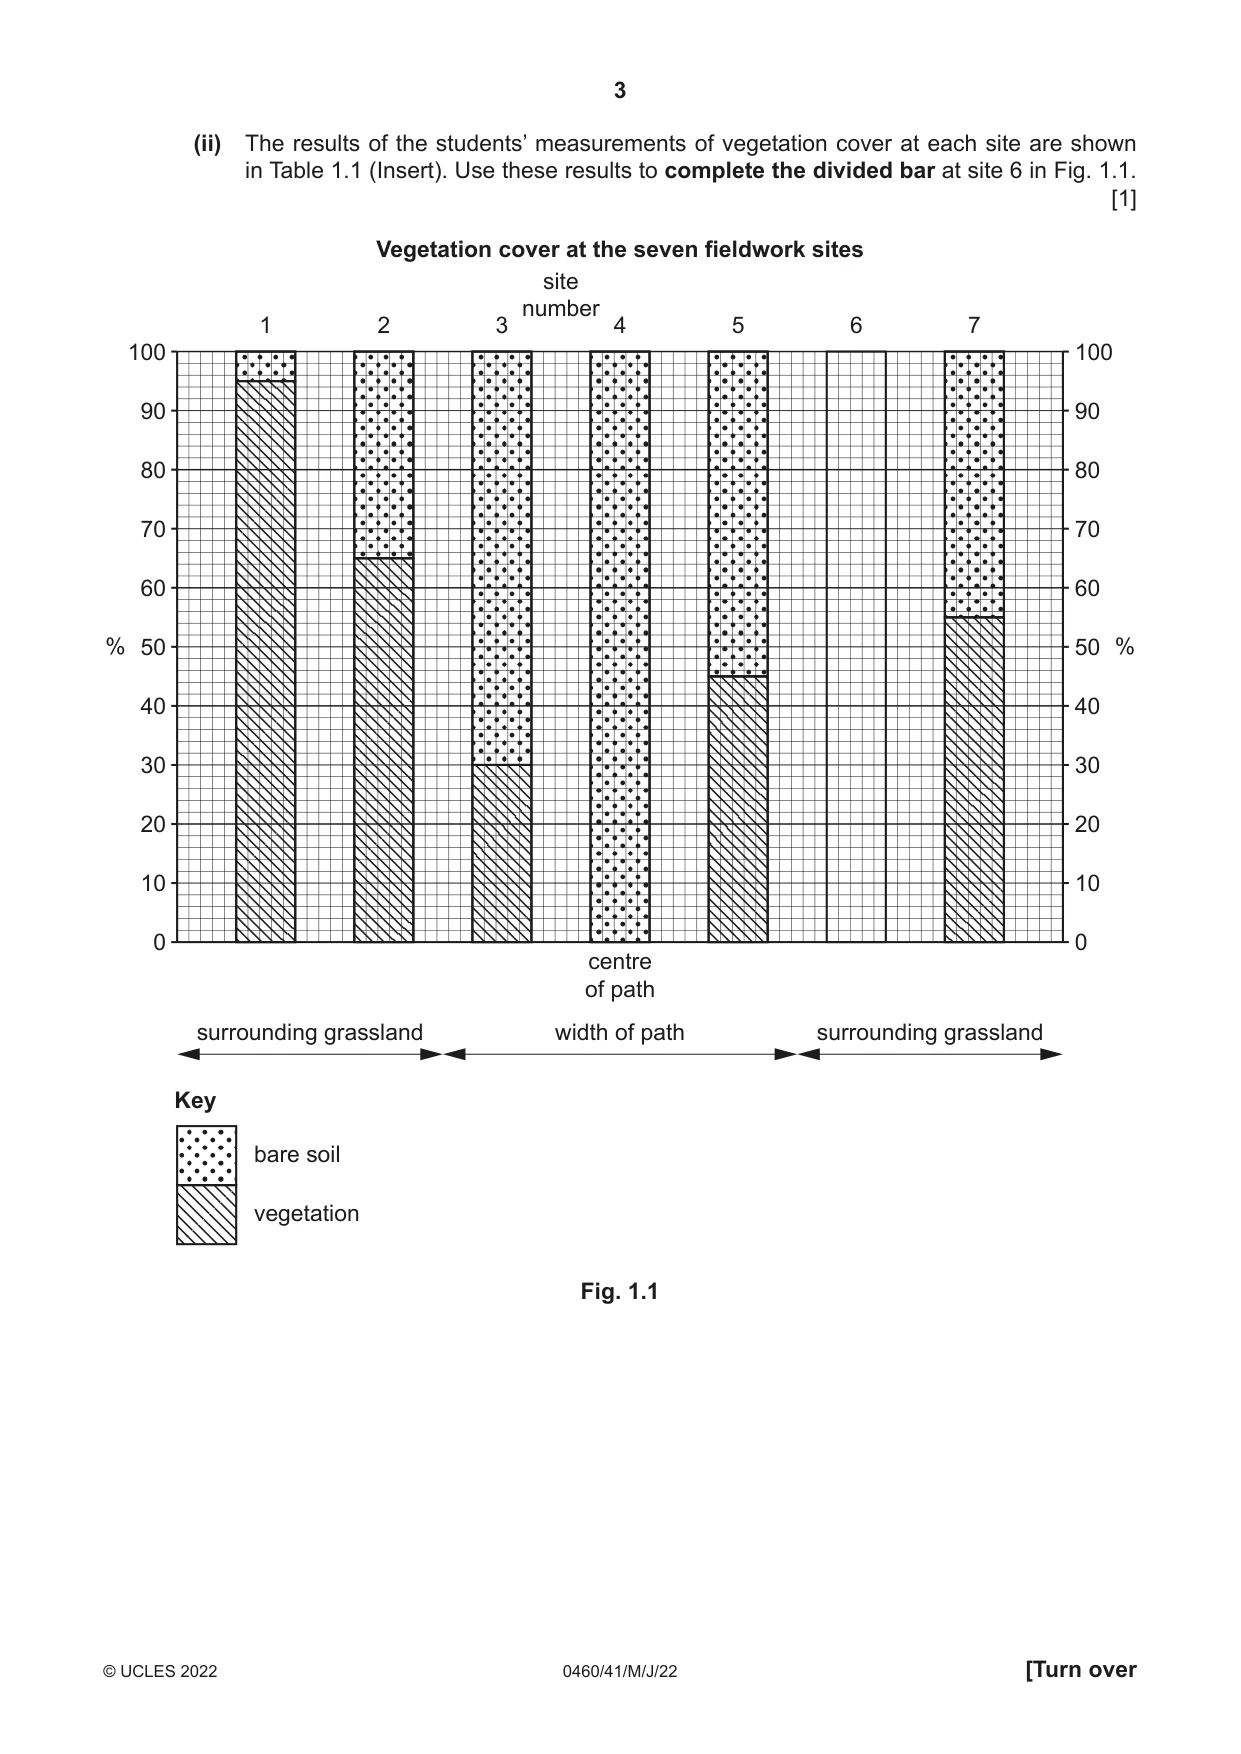
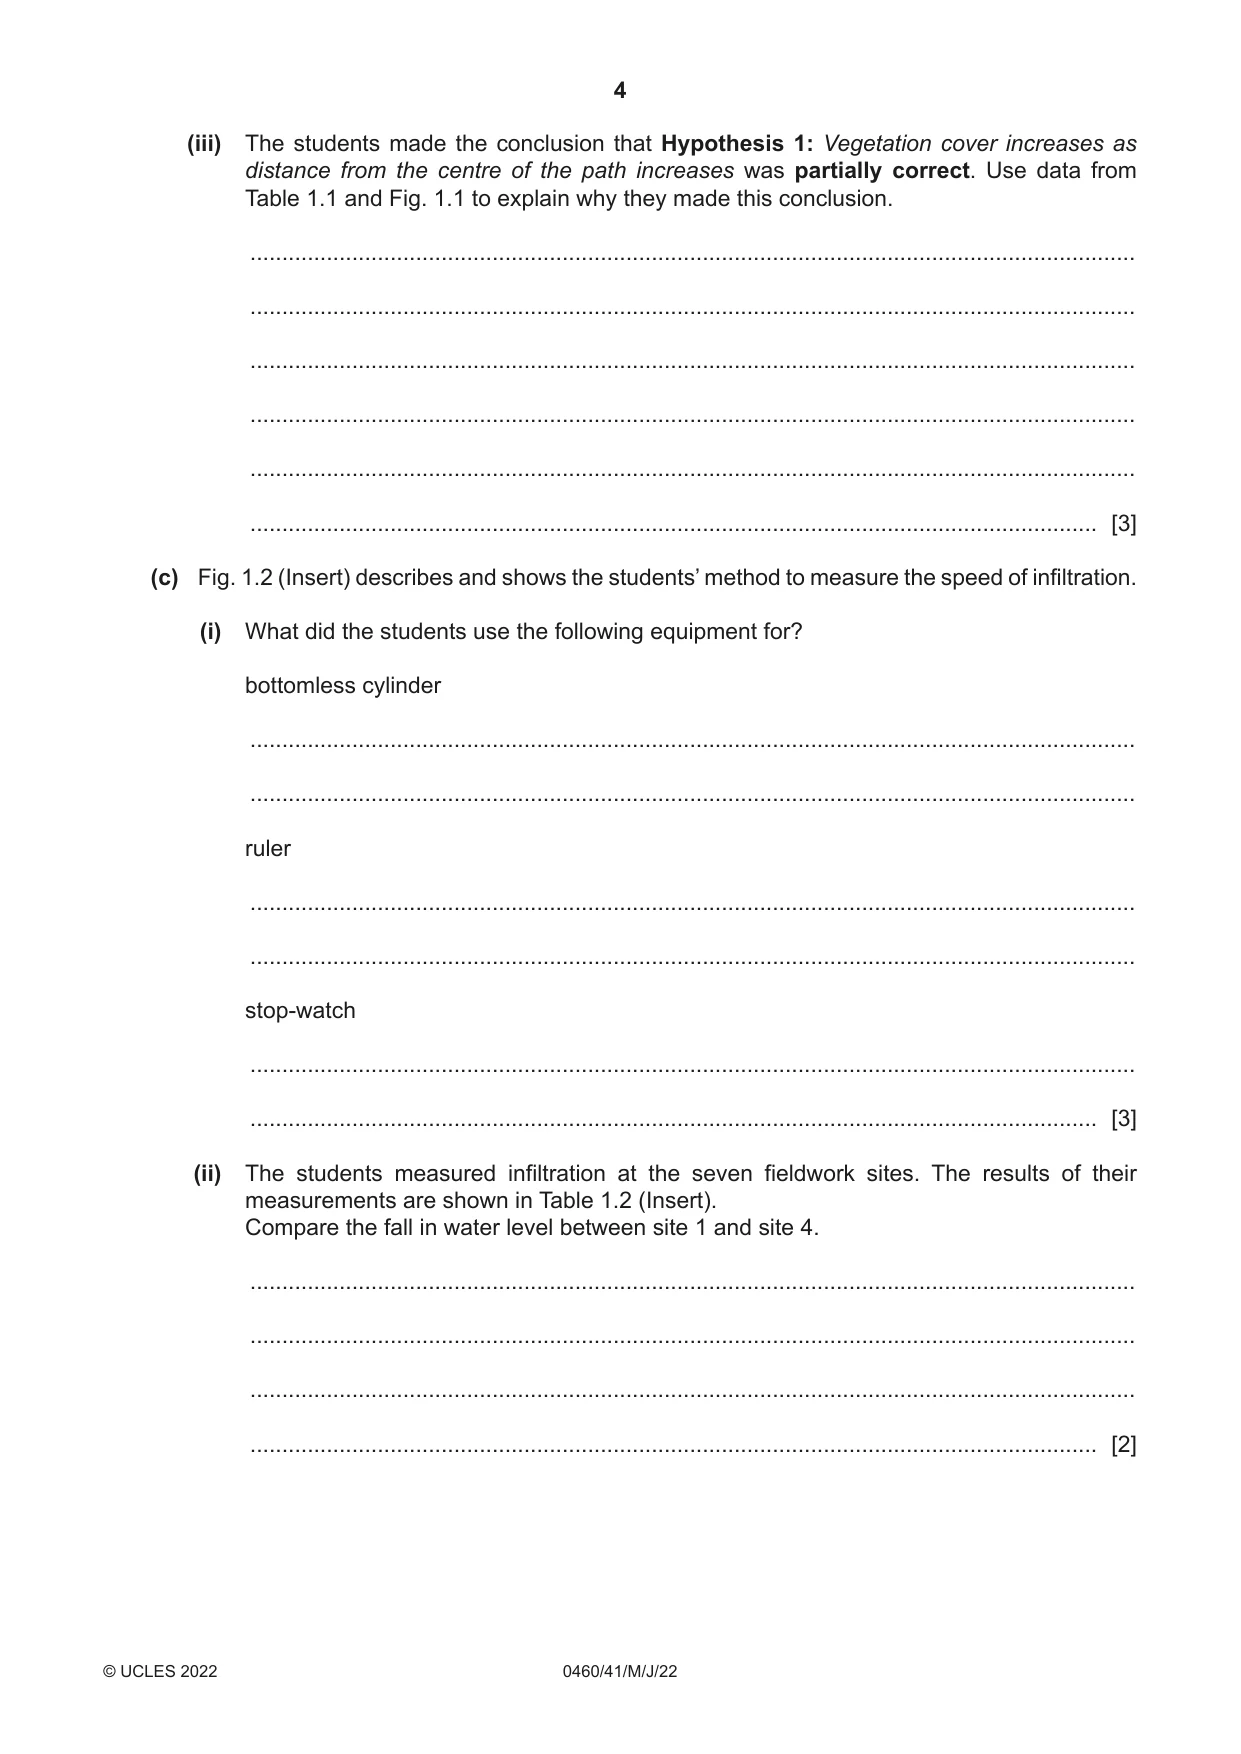
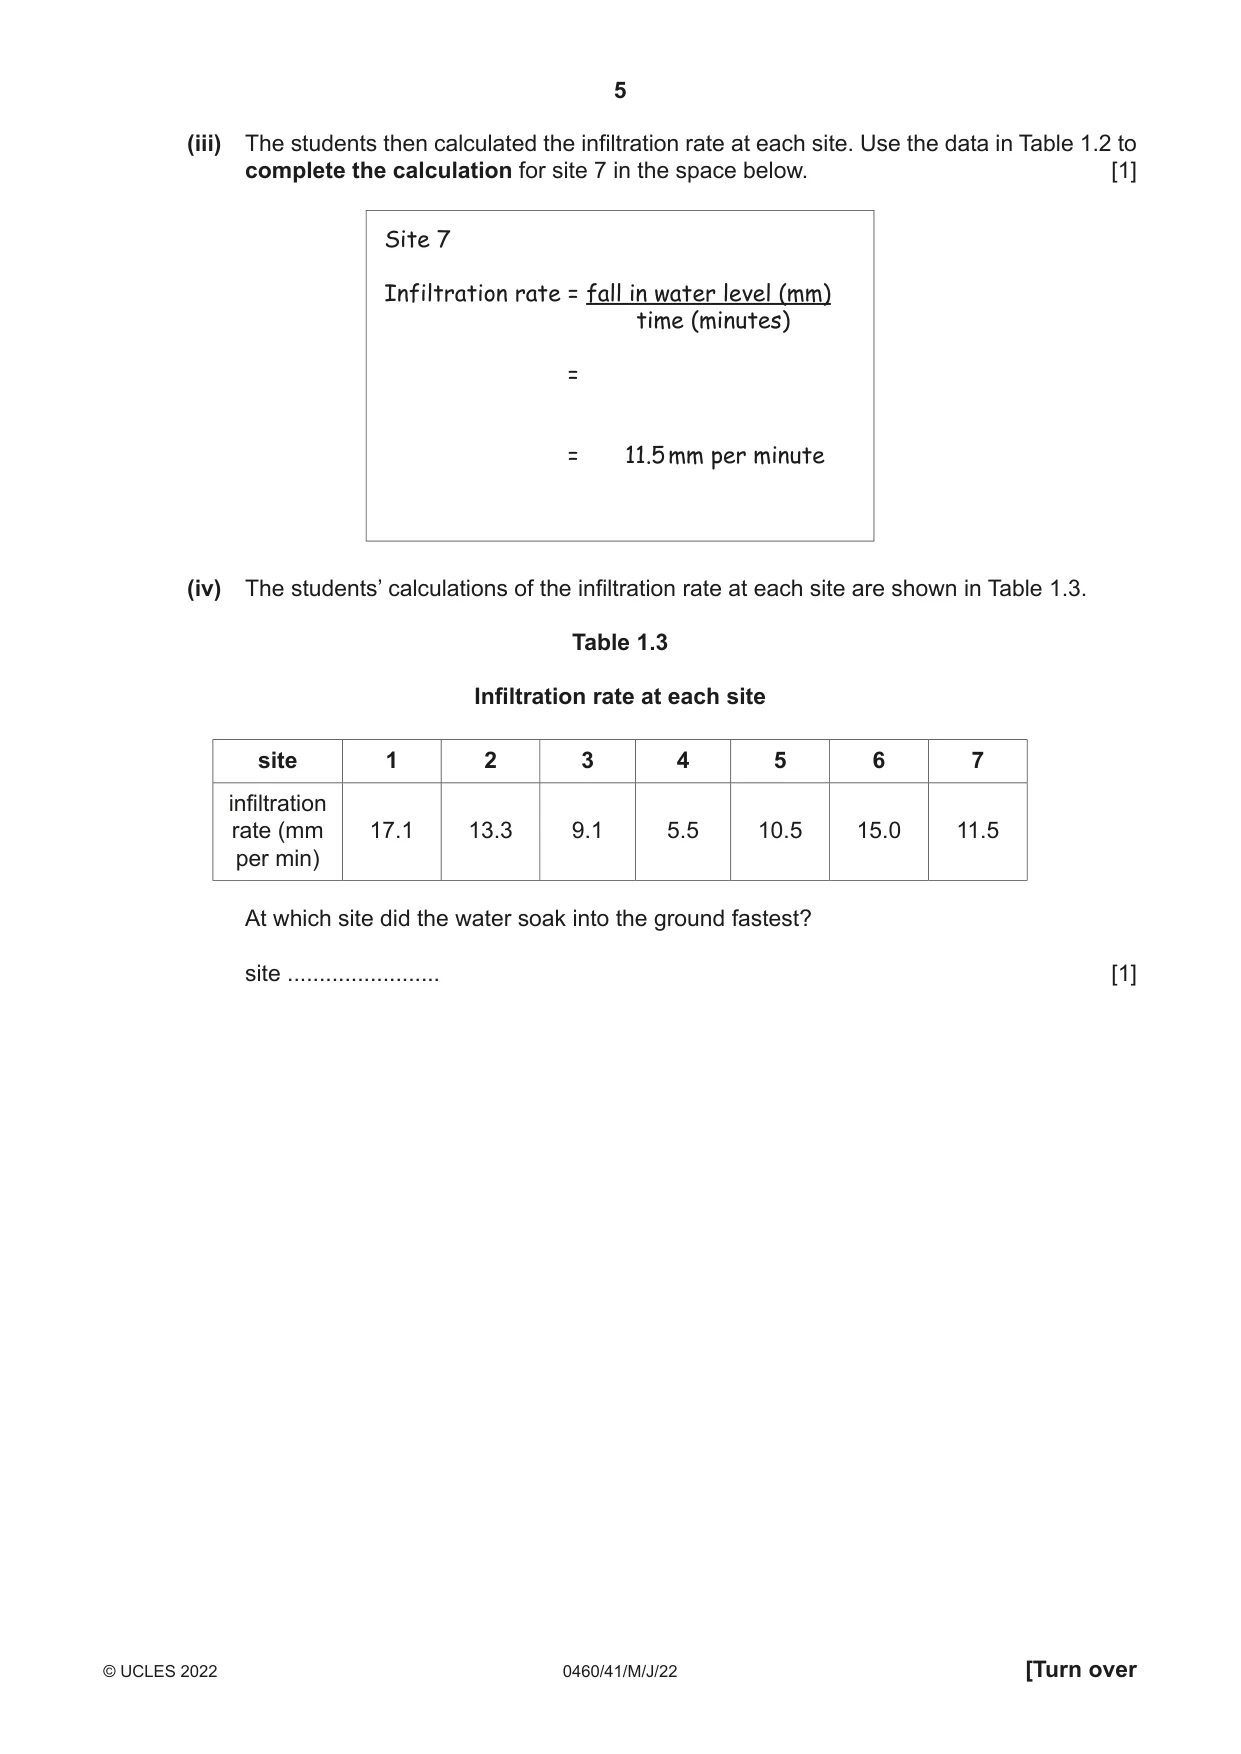
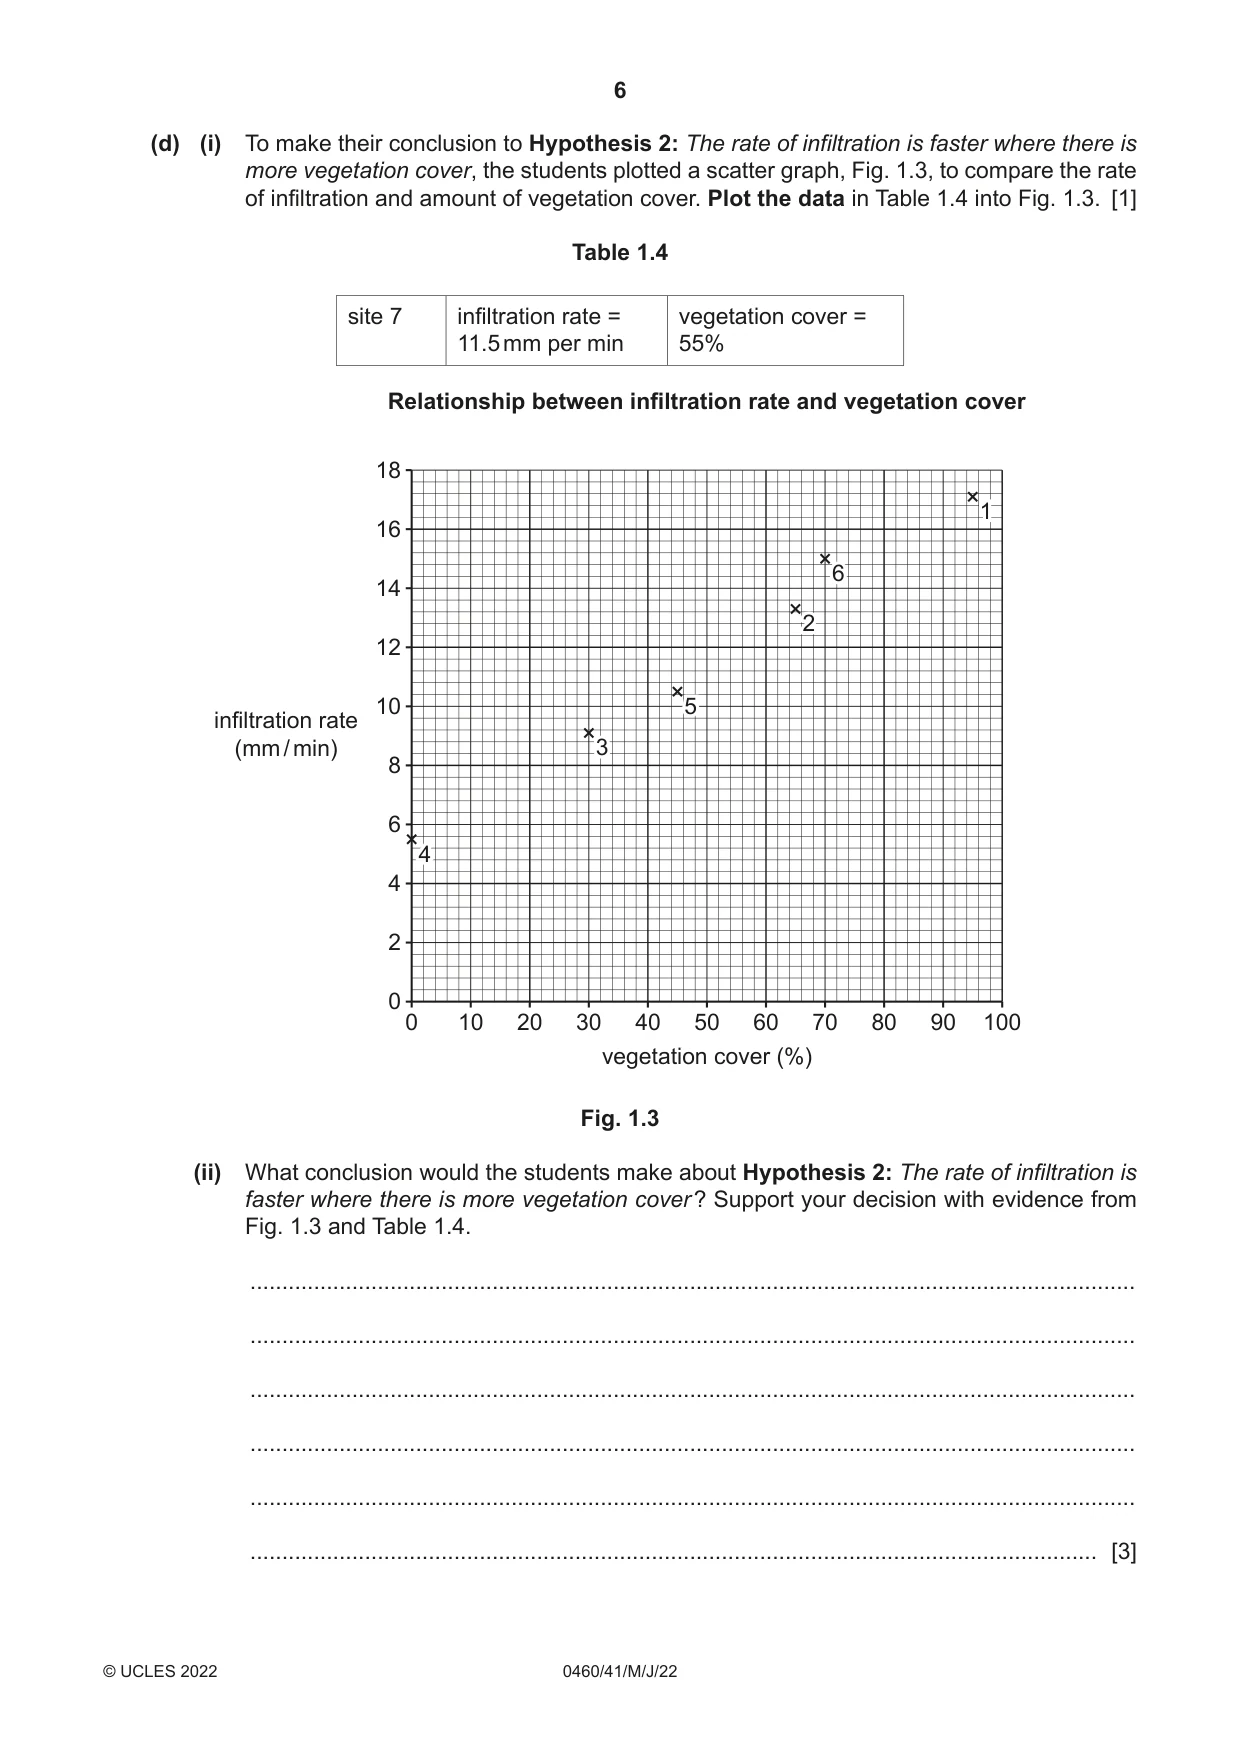
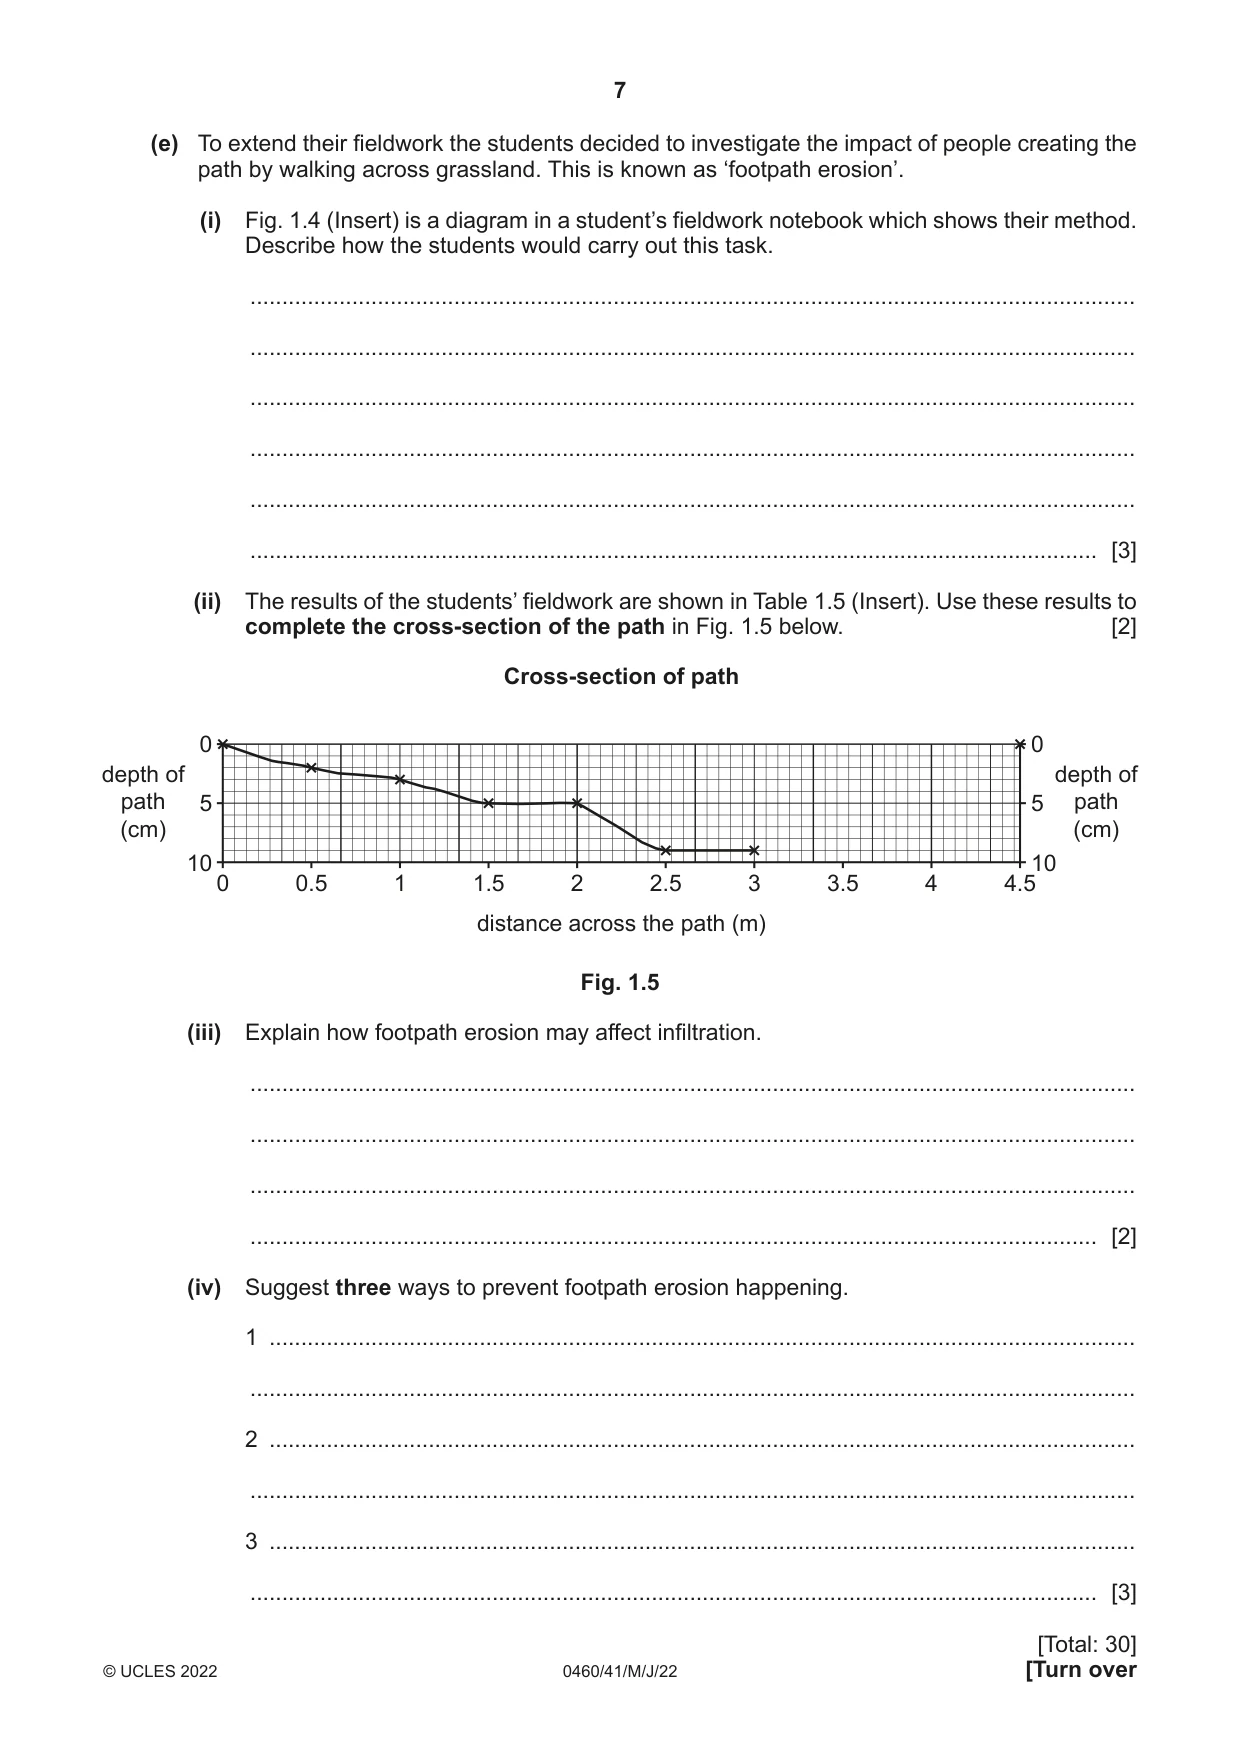
1 Students were learning about processes which take place in a drainage basin. (a) Use arrows to match the processes with the correct definitions in the table below. One has been completed for you. process definition evaporation leaves of trees stop rain from reaching the ground infiltration water moves across the ground surface interception water is heated and turns into water vapour overland flow water soaking into the ground [2] The students did some fieldwork to investigate vegetation cover and infiltration around a path created by people walking across grassland. They tested the following hypotheses: Hypothesis 1: Vegetation cover increases as distance from the centre of the path increases. Hypothesis 2: The rate of infiltration is faster where there is more vegetation cover. (b) To estimate the amount of vegetation cover at each site the students used a quadrat at seven sites on and around the path. (i) In the space below draw a labelled diagram of a quadrat to show a result of 60% vegetation cover and 40% bare soil. [3] (ii) The results of the students’ measurements of vegetation cover at each site are shown in Table 1.1 (Insert). Use these results to complete the divided bar at site 6 in Fig. 1.1. [1] Vegetation cover at the seven fieldwork sites site number 1 2 3 4 5 6 7 100 100 90 90 80 80 70 70 60 60 % 50 50 % 40 40 30 30 20 20 10 10 0 0 centre of path surrounding grassland width of path surrounding grassland Key bare soil vegetation Fig. 1.1 (iii) The students made the conclusion that Hypothesis 1: Vegetation cover increases as distance from the centre of the path increases was partially correct. Use data from Table 1.1 and Fig. 1.1 to explain why they made this conclusion. ........................................................................................................................................... ........................................................................................................................................... ........................................................................................................................................... ........................................................................................................................................... ........................................................................................................................................... ..................................................................................................................................... [3] (c) Fig. 1.2 (Insert) describes and shows the students’ method to measure the speed of infiltration. (i) What did the students use the following equipment for? bottomless cylinder ........................................................................................................................................... ........................................................................................................................................... ruler ........................................................................................................................................... ........................................................................................................................................... stop-watch ........................................................................................................................................... ..................................................................................................................................... [3] (ii) The students measured infiltration at the seven fieldwork sites. The results of their measurements are shown in Table 1.2 (Insert). Compare the fall in water level between site 1 and site 4. ........................................................................................................................................... ........................................................................................................................................... ........................................................................................................................................... ..................................................................................................................................... [2] (iii) The students then calculated the infiltration rate at each site. Use the data in Table 1.2 to complete the calculation for site 7 in the space below. [1] Site 7 Infiltration rate = fall in water level (mm) time (minutes) = = 11.5 mm per minute (iv) The students’ calculations of the infiltration rate at each site are shown in Table 1.3. Table 1.3 Infiltration rate at each site site 1 2 3 4 5 6 7 infiltration rate (mm 17.1 13.3 9.1 5.5 10.5 15.0 11.5 per min) At which site did the water soak into the ground fastest? site ........................ [1] (d) (i) To make their conclusion to Hypothesis 2: The rate of infiltration is faster where there is more vegetation cover, the students plotted a scatter graph, Fig. 1.3, to compare the rate of infiltration and amount of vegetation cover. Plot the data in Table 1.4 into Fig. 1.3. [1] Table 1.4 site 7 infiltration rate = vegetation cover = 11.5 mm per min 55% Relationship between infiltration rate and vegetation cover 18 1 16 6 14 2 12 10 5 infiltration rate (mm / min) 3 8 6 4 4 2 0 0 10 20 30 40 50 60 70 80 90 100 vegetation cover (%) Fig. 1.3 (ii) What conclusion would the students make about Hypothesis 2: The rate of infiltration is faster where there is more vegetation cover ? Support your decision with evidence from Fig. 1.3 and Table 1.4. ........................................................................................................................................... ........................................................................................................................................... ........................................................................................................................................... ........................................................................................................................................... ........................................................................................................................................... ..................................................................................................................................... [3] (e) To extend their fieldwork the students decided to investigate the impact of people creating the path by walking across grassland. This is known as ‘footpath erosion’. (i) Fig. 1.4 (Insert) is a diagram in a student’s fieldwork notebook which shows their method. Describe how the students would carry out this task. ........................................................................................................................................... ........................................................................................................................................... ........................................................................................................................................... ........................................................................................................................................... ........................................................................................................................................... ..................................................................................................................................... [3] (ii) The results of the students’ fieldwork are shown in Table 1.5 (Insert). Use these results to complete the cross-section of the path in Fig. 1.5 below. [2] Cross-section of path 0 0 depth of depth of path 5 5 path (cm) (cm) 10 10 0 0.5 1 1.5 2 2.5 3 3.5 4 4.5 distance across the path (m) Fig. 1.5 (iii) Explain how footpath erosion may affect infiltration. ........................................................................................................................................... ........................................................................................................................................... ........................................................................................................................................... ..................................................................................................................................... [2] (iv) Suggest three ways to prevent footpath erosion happening. 1 ........................................................................................................................................ ........................................................................................................................................... 2 ........................................................................................................................................ ........................................................................................................................................... 3 ........................................................................................................................................ ..................................................................................................................................... [3]
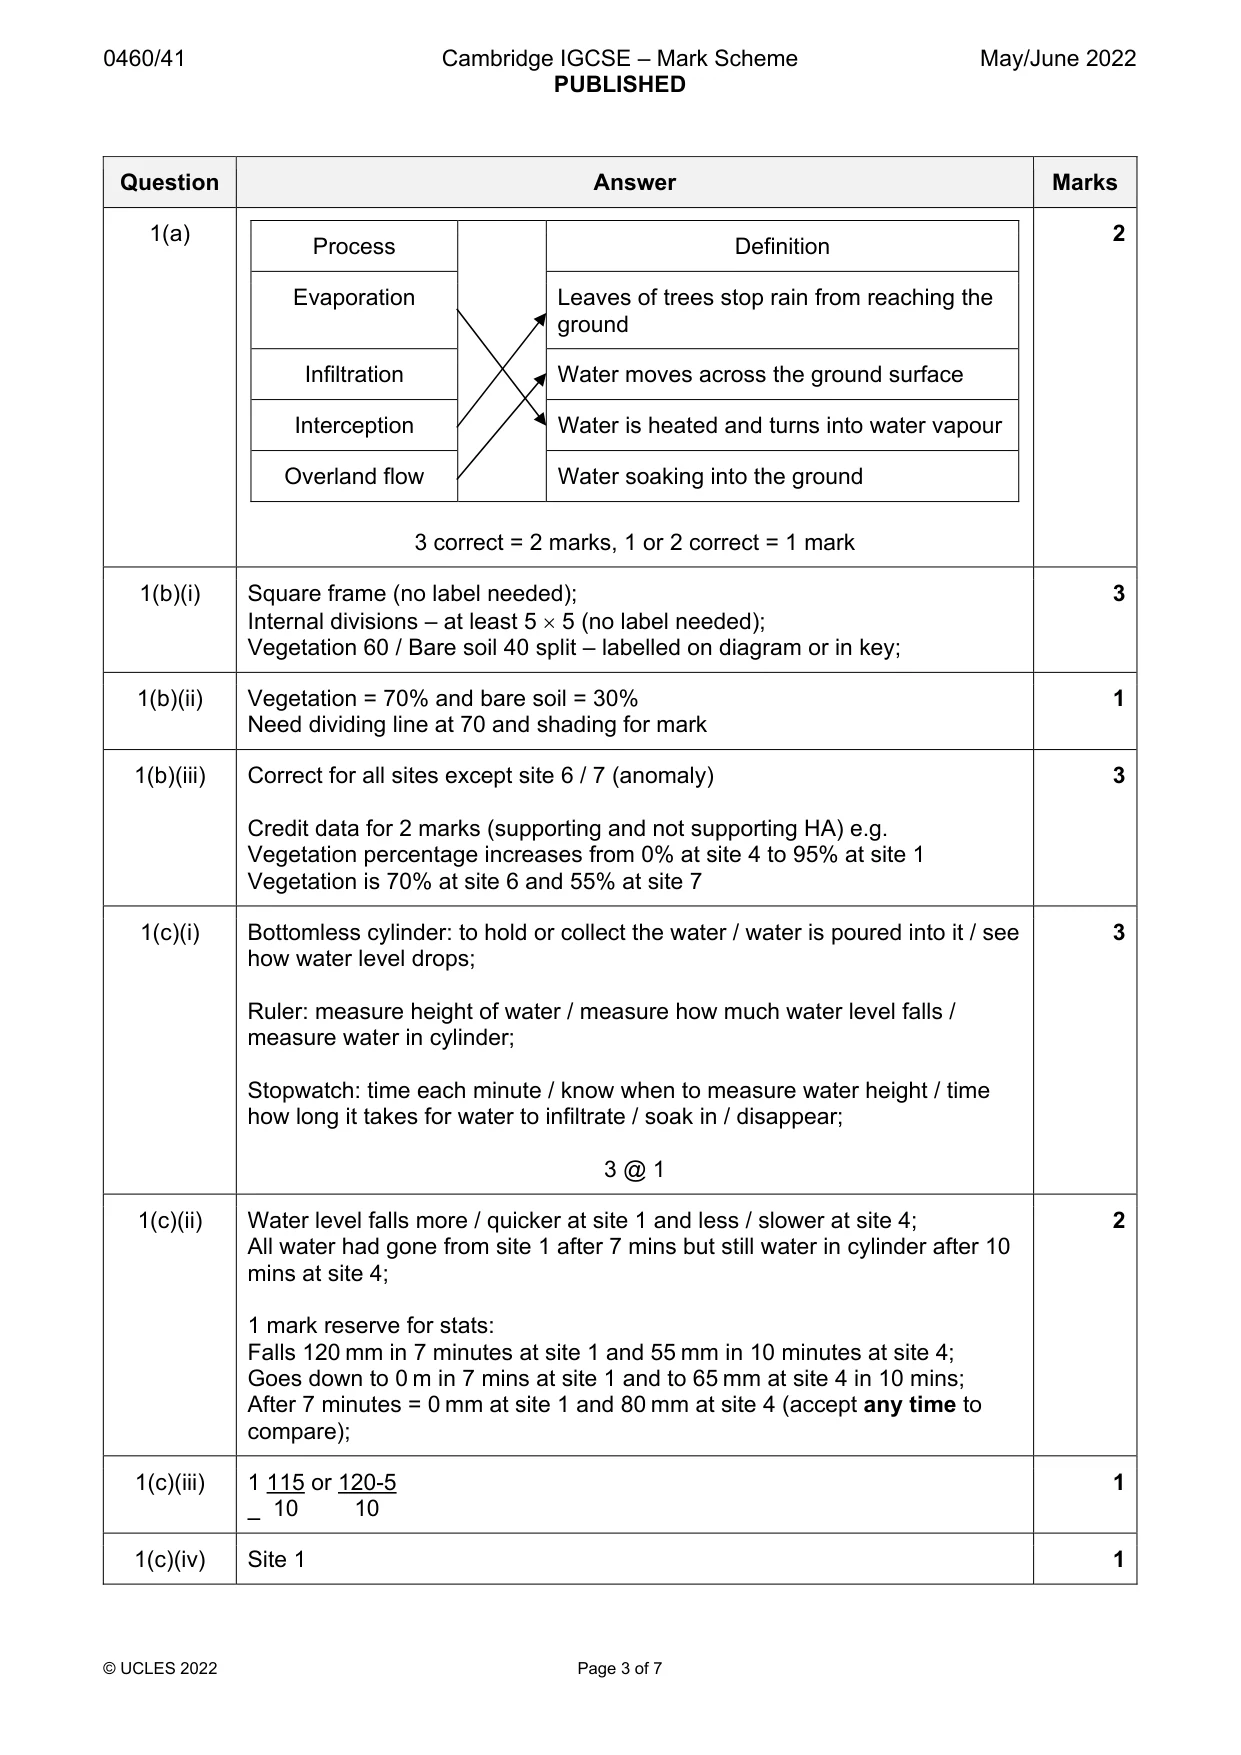
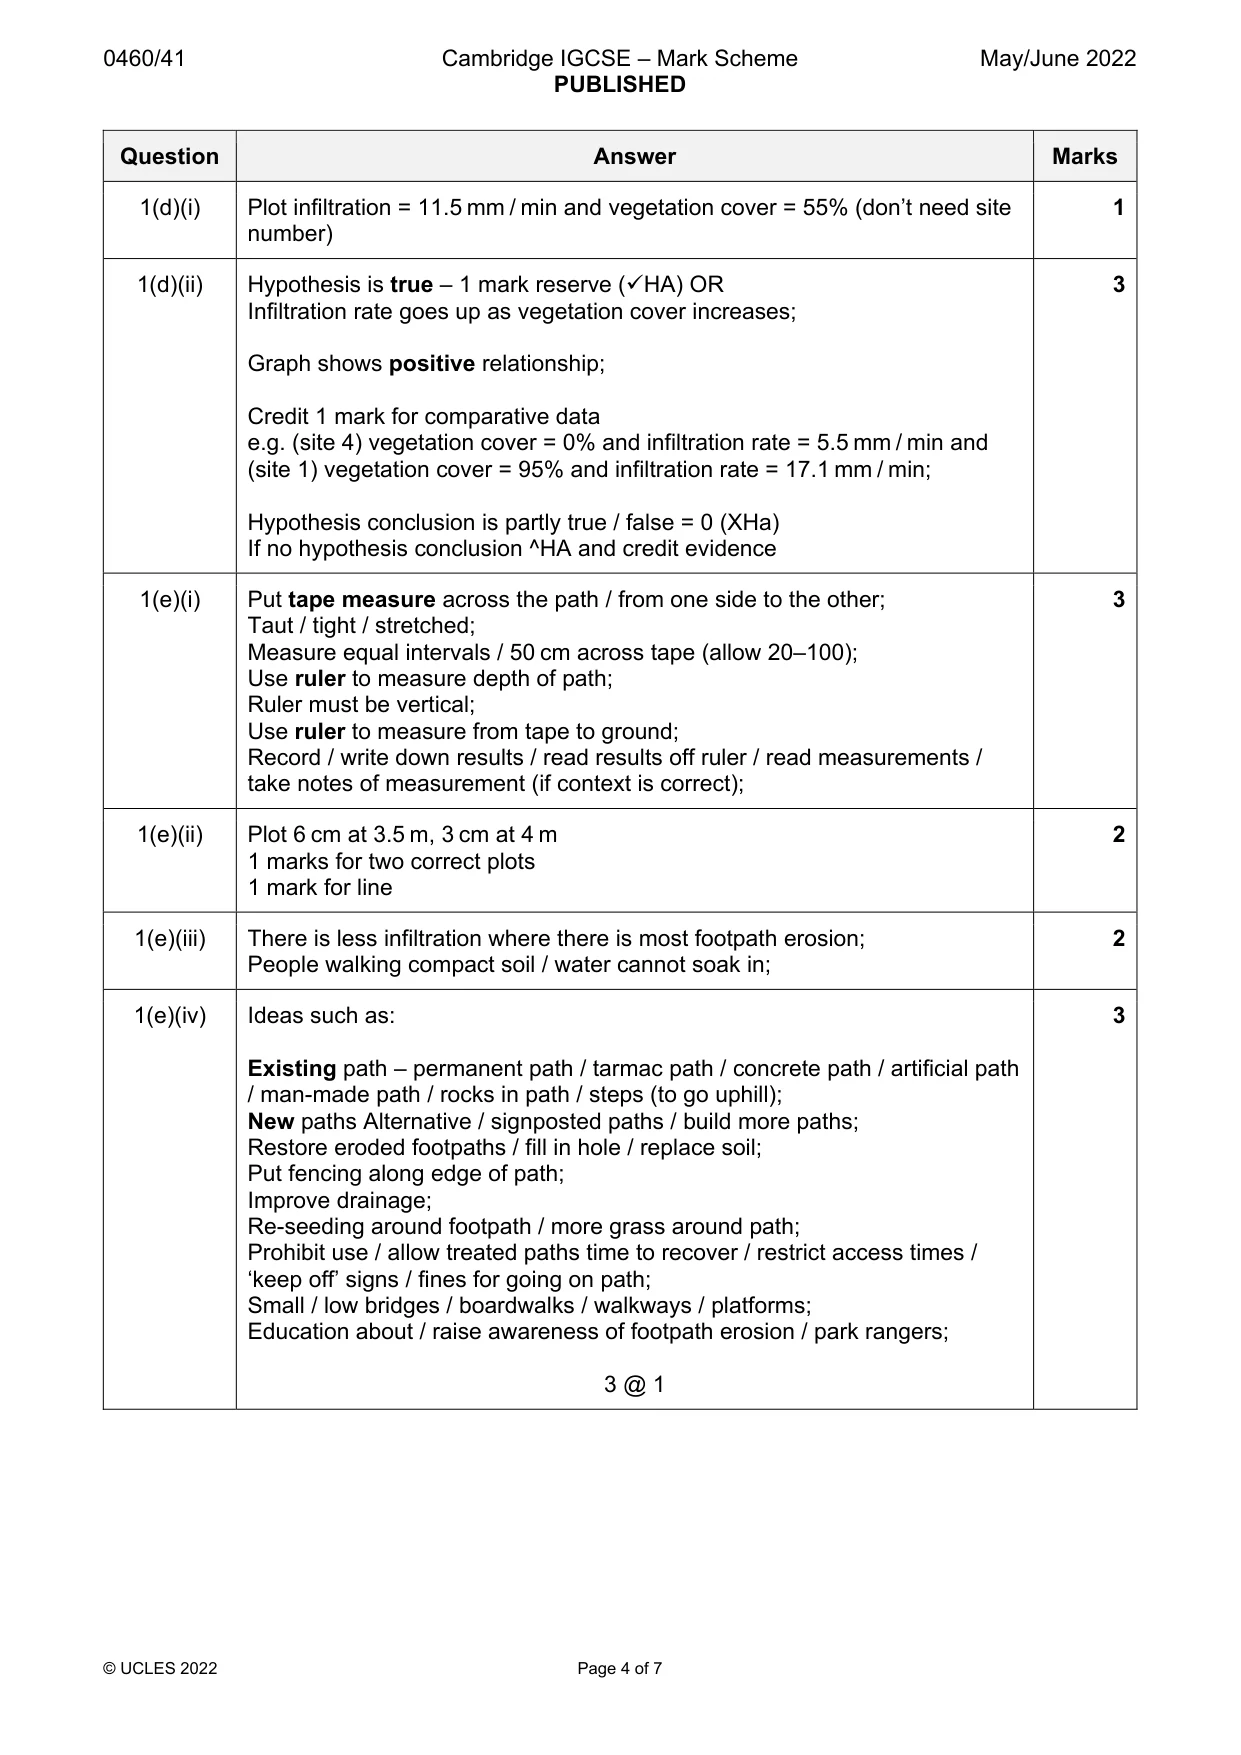
Mark scheme: Question Answer Marks 1(a) 2 Process Definition Evaporation Leaves of trees stop rain from reaching the ground Infiltration Water moves across the ground surface Interception Water is heated and turns into water vapour Overland flow Water soaking into the ground 3 correct = 2 marks, 1 or 2 correct = 1 mark 1(b)(i) Square frame (no label needed); 3 Internal divisions – at least 5 5 (no label needed); Vegetation 60 / Bare soil 40 split – labelled on diagram or in key; 1(b)(ii) Vegetation = 70% and bare soil = 30% 1 Need dividing line at 70 and shading for mark 1(b)(iii) Correct for all sites except site 6 / 7 (anomaly) 3 Credit data for 2 marks (supporting and not supporting HA) e.g. Vegetation percentage increases from 0% at site 4 to 95% at site 1 Vegetation is 70% at site 6 and 55% at site 7 1(c)(i) Bottomless cylinder: to hold or collect the water / water is poured into it / see 3 how water level drops; Ruler: measure height of water / measure how much water level falls / measure water in cylinder; Stopwatch: time each minute / know when to measure water height / time how long it takes for water to infiltrate / soak in / disappear; 3 @ 1 1(c)(ii) Water level falls more / quicker at site 1 and less / slower at site 4; 2 All water had gone from site 1 after 7 mins but still water in cylinder after 10 mins at site 4; 1 mark reserve for stats: Falls 120 mm in 7 minutes at site 1 and 55 mm in 10 minutes at site 4; Goes down to 0 m in 7 mins at site 1 and to 65 mm at site 4 in 10 mins; After 7 minutes = 0 mm at site 1 and 80 mm at site 4 (accept any time to compare); 1(c)(iii) 1 115 or 120-5 1 10 10 1(c)(iv) Site 1 1 1(d)(i) Plot infiltration = 11.5 mm / min and vegetation cover = 55% (don’t need site 1 number) 1(d)(ii) Hypothesis is true – 1 mark reserve (HA) OR 3 Infiltration rate goes up as vegetation cover increases; Graph shows positive relationship; Credit 1 mark for comparative data e.g. (site 4) vegetation cover = 0% and infiltration rate = 5.5 mm / min and (site 1) vegetation cover = 95% and infiltration rate = 17.1 mm / min; Hypothesis conclusion is partly true / false = 0 (XHa) If no hypothesis conclusion ^HA and credit evidence 1(e)(i) Put tape measure across the path / from one side to the other; 3 Taut / tight / stretched; Measure equal intervals / 50 cm across tape (allow 20–100); Use ruler to measure depth of path; Ruler must be vertical; Use ruler to measure from tape to ground; Record / write down results / read results off ruler / read measurements / take notes of measurement (if context is correct); 1(e)(ii) Plot 6 cm at 3.5 m, 3 cm at 4 m 2 1 marks for two correct plots 1 mark for line 1(e)(iii) There is less infiltration where there is most footpath erosion; 2 People walking compact soil / water cannot soak in; 1(e)(iv) Ideas such as: 3 Existing path – permanent path / tarmac path / concrete path / artificial path / man-made path / rocks in path / steps (to go uphill); New paths Alternative / signposted paths / build more paths; Restore eroded footpaths / fill in hole / replace soil; Put fencing along edge of path; Improve drainage; Re-seeding around footpath / more grass around path; Prohibit use / allow treated paths time to recover / restrict access times / ‘keep off’ signs / fines for going on path; Small / low bridges / boardwalks / walkways / platforms; Education about / raise awareness of footpath erosion / park rangers; 3 @ 1
Q2 · Students in Manchester, England were studying shops and service provision
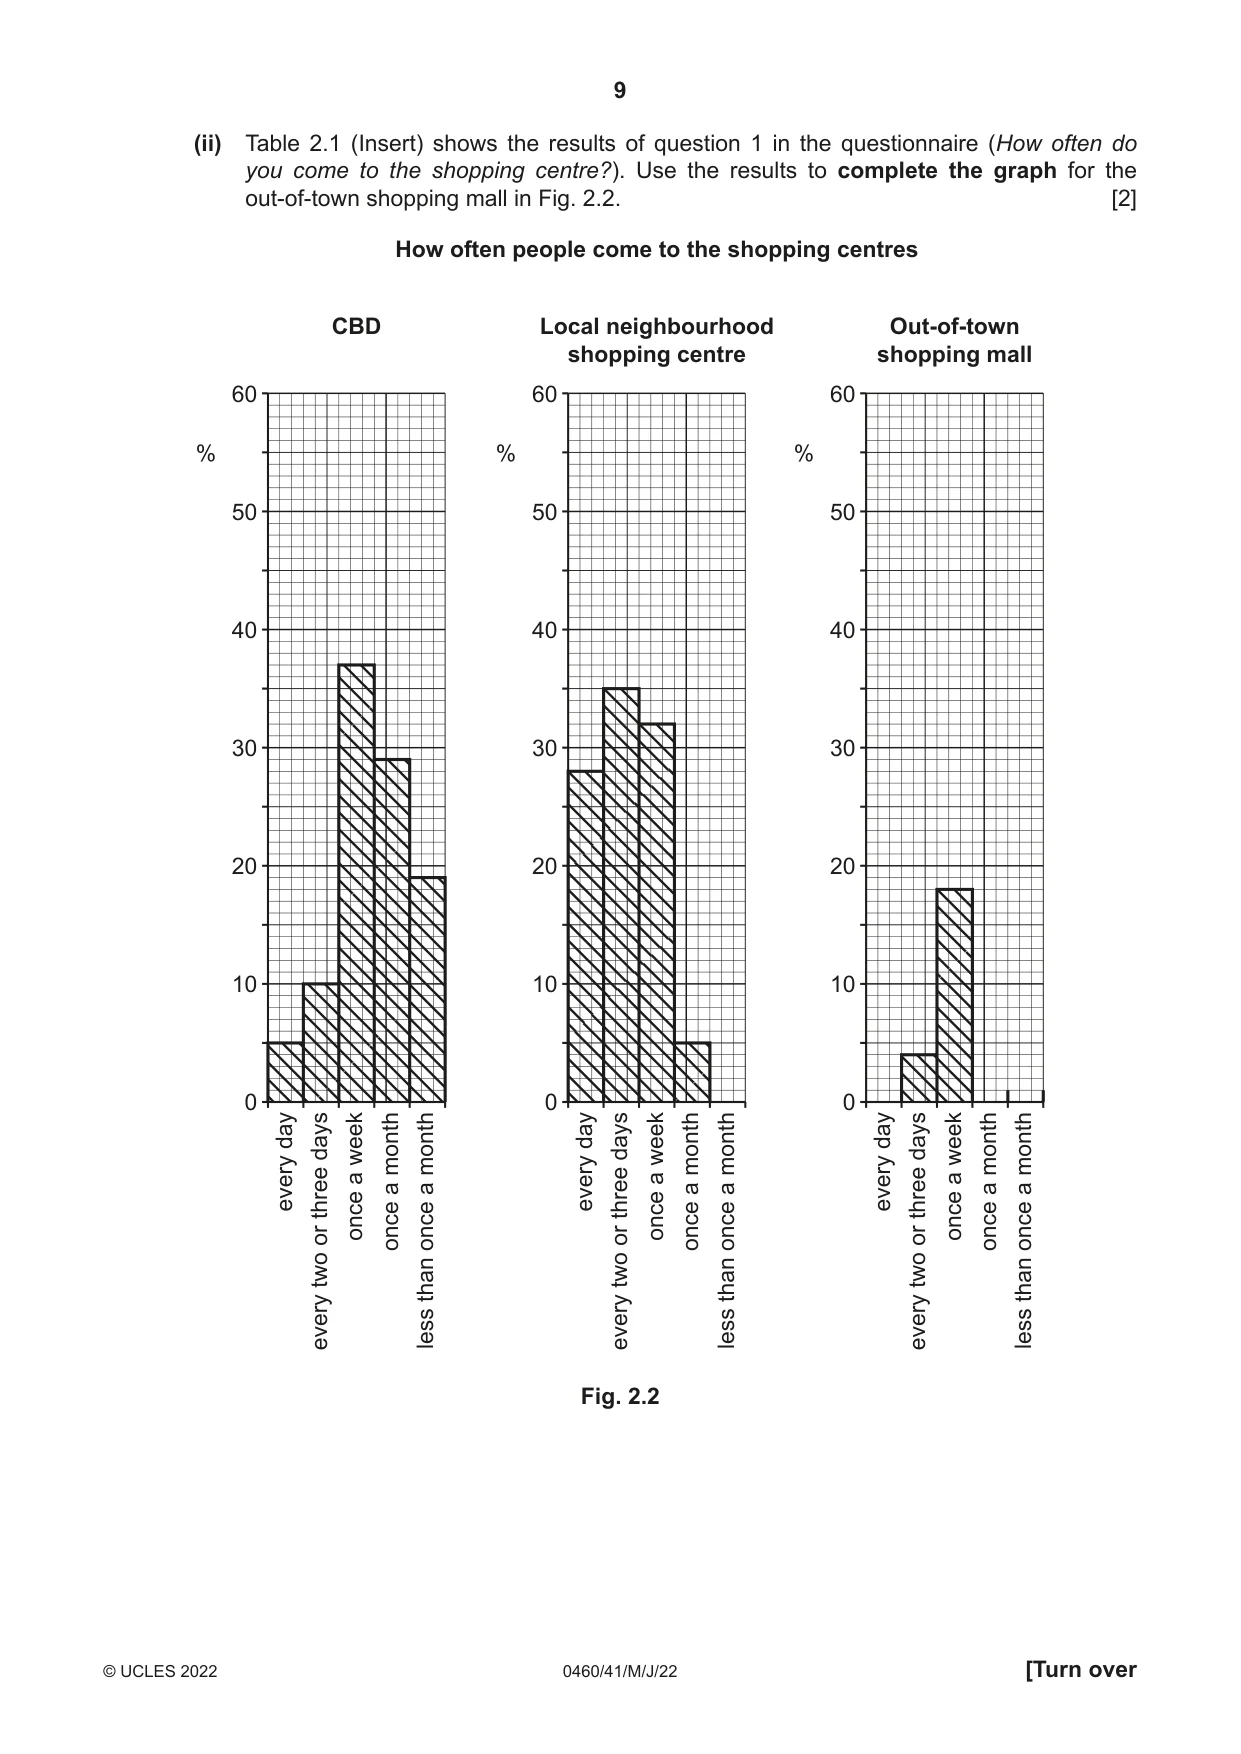
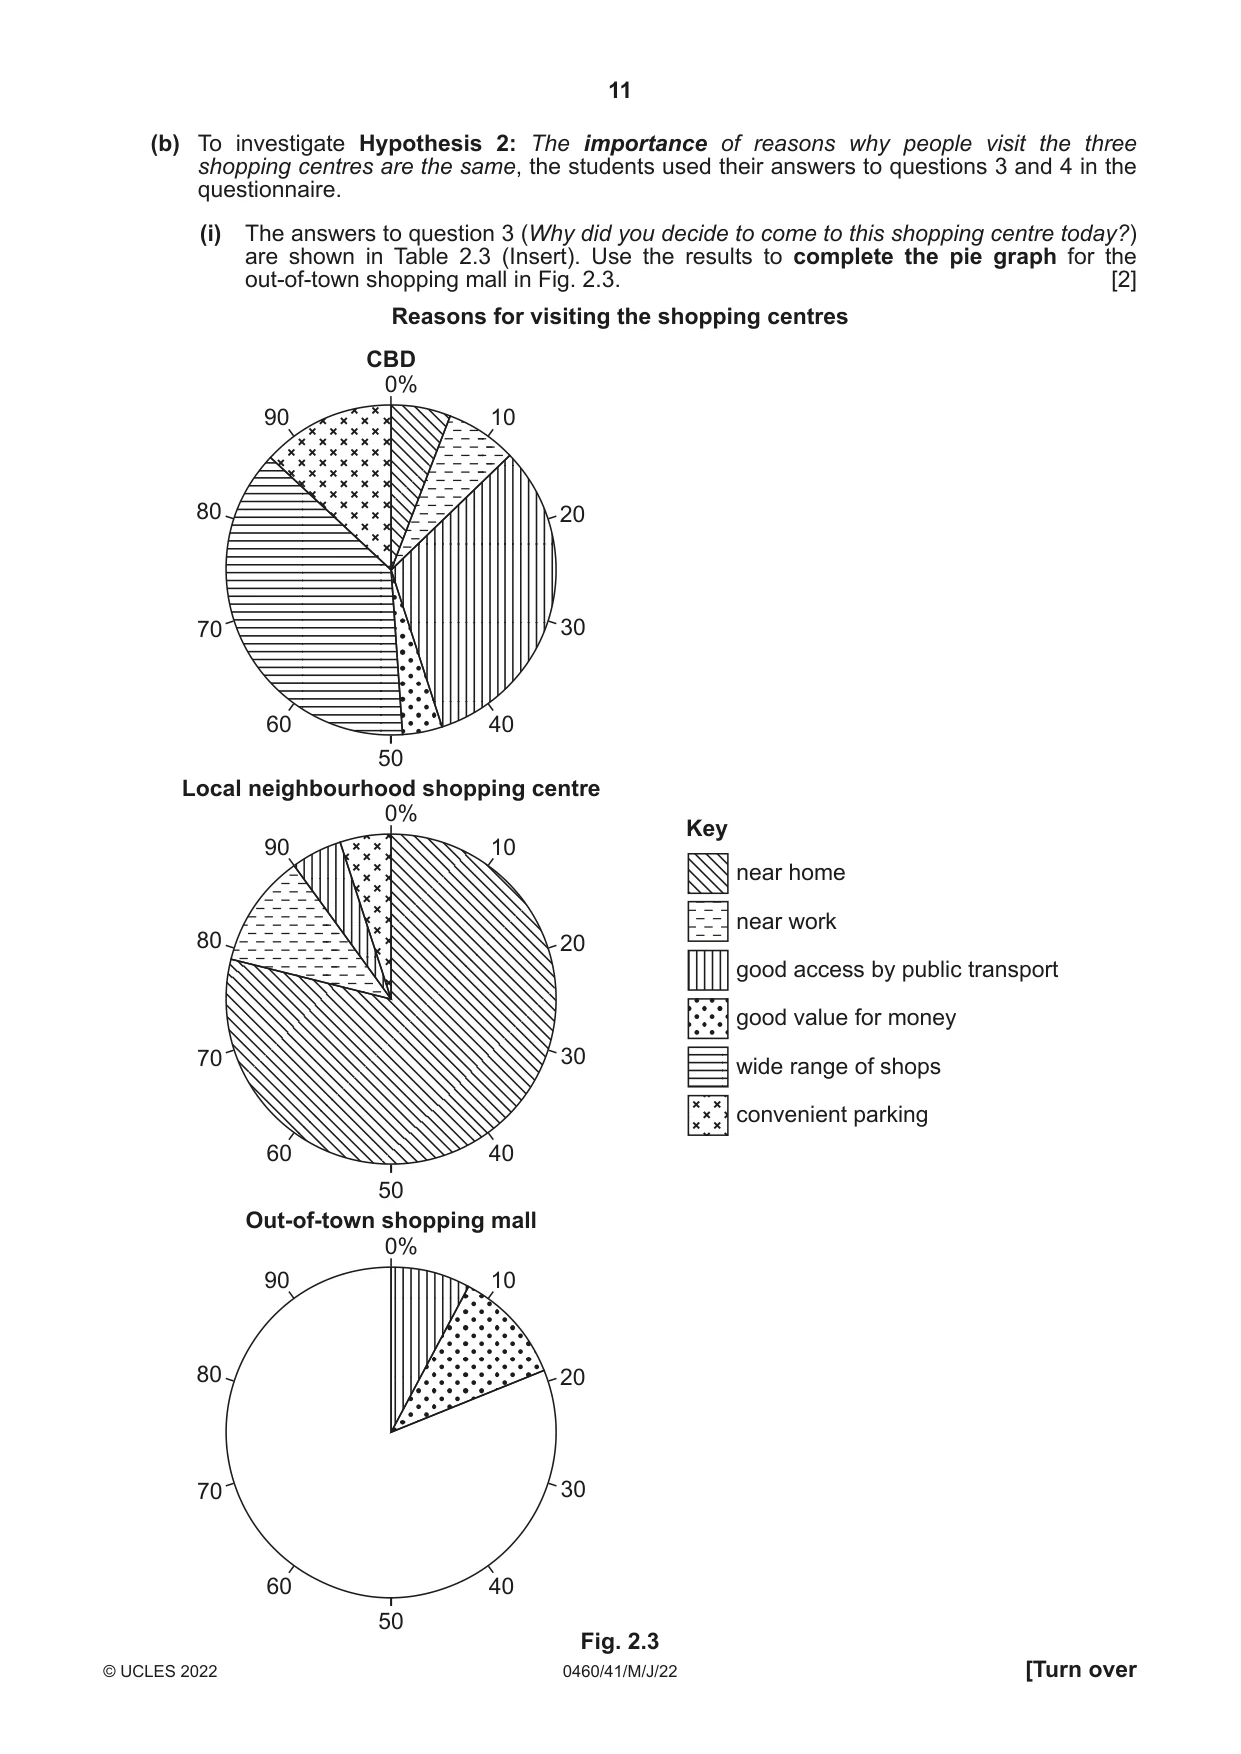
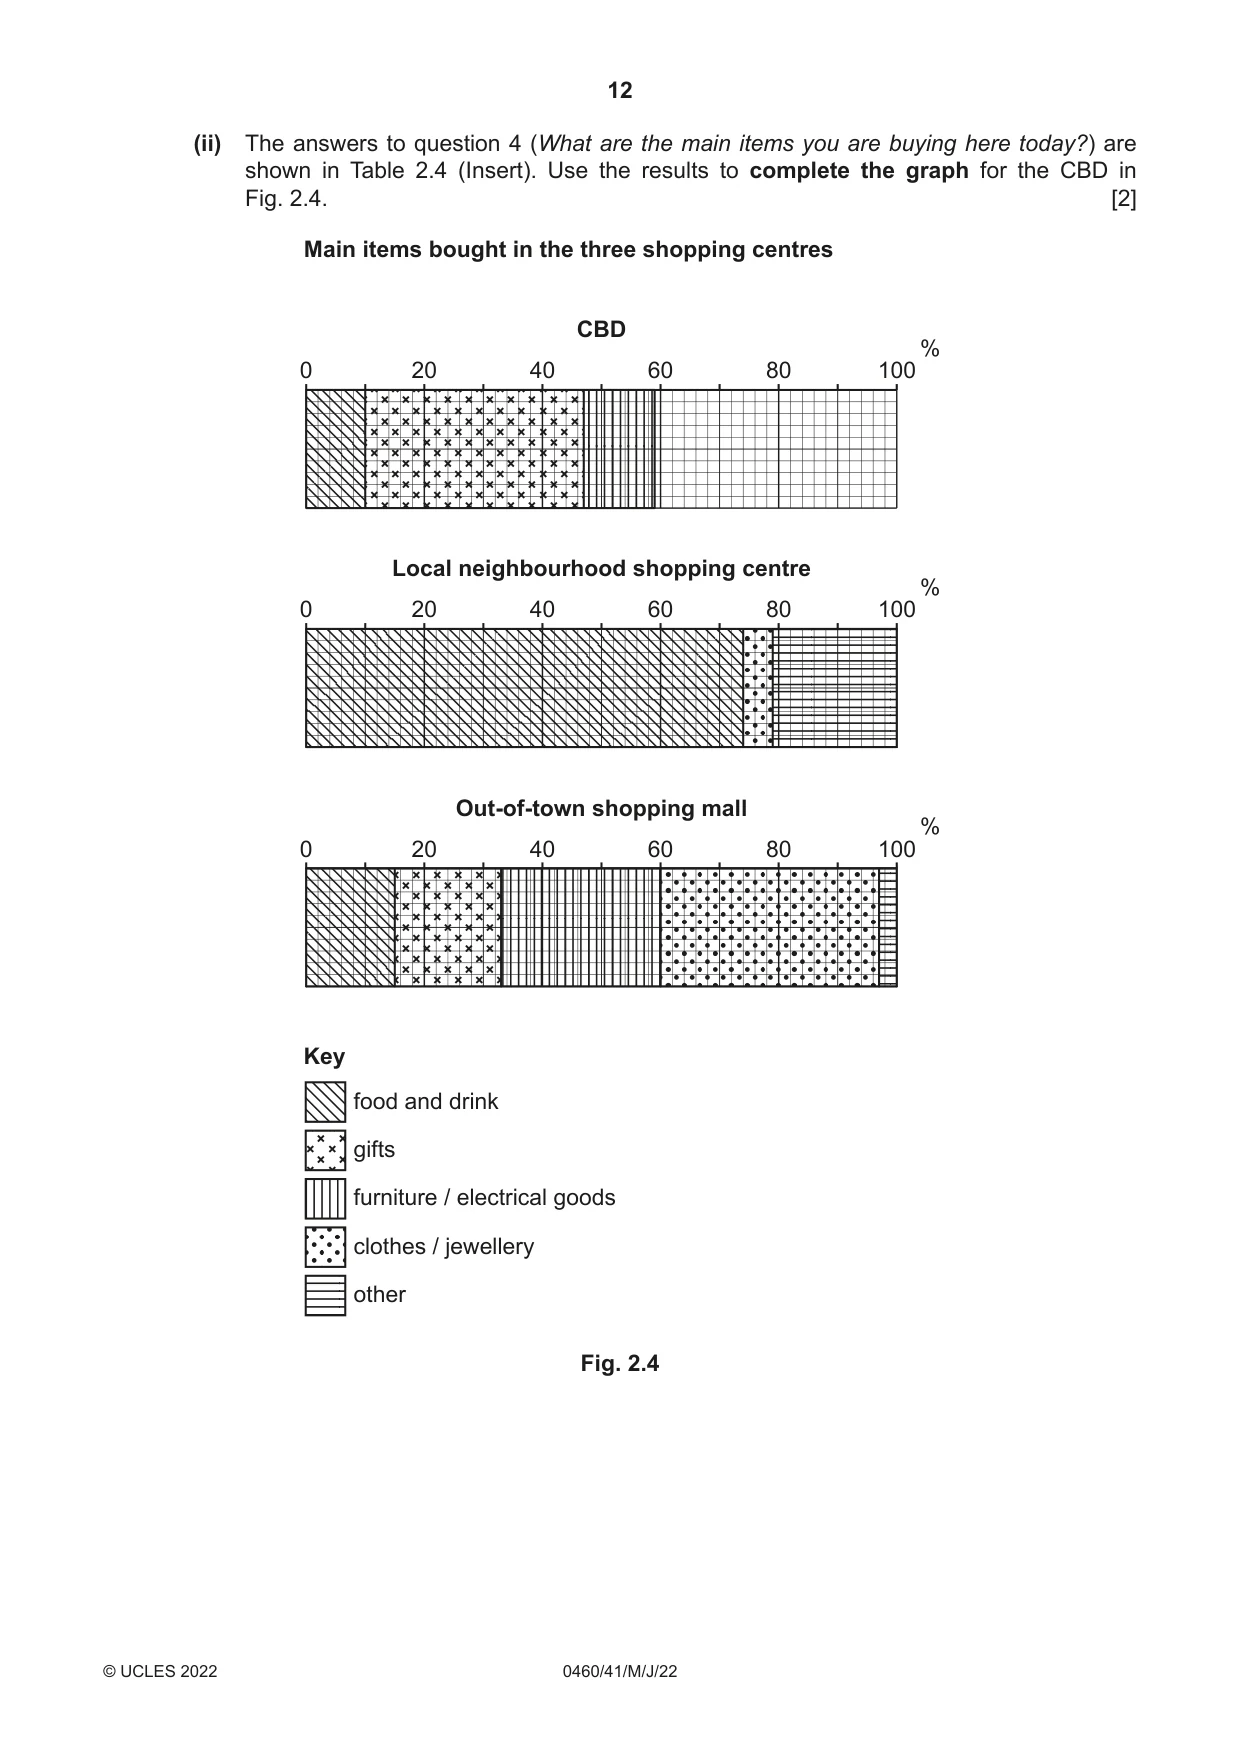
2 Students in Manchester, England were studying shops and service provision. They did fieldwork in three nearby shopping areas: • the Central Business District (CBD) in the centre of the city • a local neighbourhood shopping centre located on a main road into the city centre • an out-of-town shopping mall located in the rural-urban fringe near to a motorway. Some students decided to test the following hypotheses: Hypothesis 1: People go to the local neighbourhood shopping centre more frequently than the CBD or the out-of-town shopping mall. Hypothesis 2: The importance of reasons why people visit the three shopping centres are the same. (a) To test these hypotheses the students used a questionnaire with people in the three shopping centres. The questionnaire is shown in Fig. 2.1 (Insert). (i) When their teacher approved the questionnaire, she advised the students how to use it with people who are shopping. Suggest three pieces of advice which she might give them. 1 ........................................................................................................................................ ........................................................................................................................................... 2 ........................................................................................................................................ ........................................................................................................................................... 3 ........................................................................................................................................ ..................................................................................................................................... [3] (ii) Table 2.1 (Insert) shows the results of question 1 in the questionnaire (How often do you come to the shopping centre?). Use the results to complete the graph for the out-of-town shopping mall in Fig. 2.2. [2] How often people come to the shopping centres CBD Local neighbourhood Out-of-town shopping centre shopping mall 60 60 60 % % % 50 50 50 40 40 40 30 30 30 20 20 20 10 10 10 0 0 0 day days week month month day days week month month day days week month month a a a a a a a a a every every every three three three or once once once or once once once or once once once two than two than two than every less every less every less Fig. 2.2 (iii) Do the results of question 1 agree with Hypothesis 1: People go to the local neighbourhood shopping centre more frequently than the CBD or the out-of-town shopping mall? Support your answer with data from Fig. 2.2 and Table 2.1. ........................................................................................................................................... ........................................................................................................................................... ........................................................................................................................................... ........................................................................................................................................... ........................................................................................................................................... ..................................................................................................................................... [3] (iv) One student used the answers to question 2 in the questionnaire (How did you travel to the shopping centre today?) to make the results table shown in Table 2.2 (Insert). Describe the differences between the methods of travel used to go to the three shopping centres. Include statistics from Table 2.2 in your answer. ........................................................................................................................................... ........................................................................................................................................... ........................................................................................................................................... ........................................................................................................................................... ........................................................................................................................................... ........................................................................................................................................... ........................................................................................................................................... ..................................................................................................................................... [4] (v) Suggest three reasons why people’s method of travel to the shopping centres is different. 1 ........................................................................................................................................ ........................................................................................................................................... 2 ........................................................................................................................................ ........................................................................................................................................... 3 ........................................................................................................................................ ..................................................................................................................................... [3]
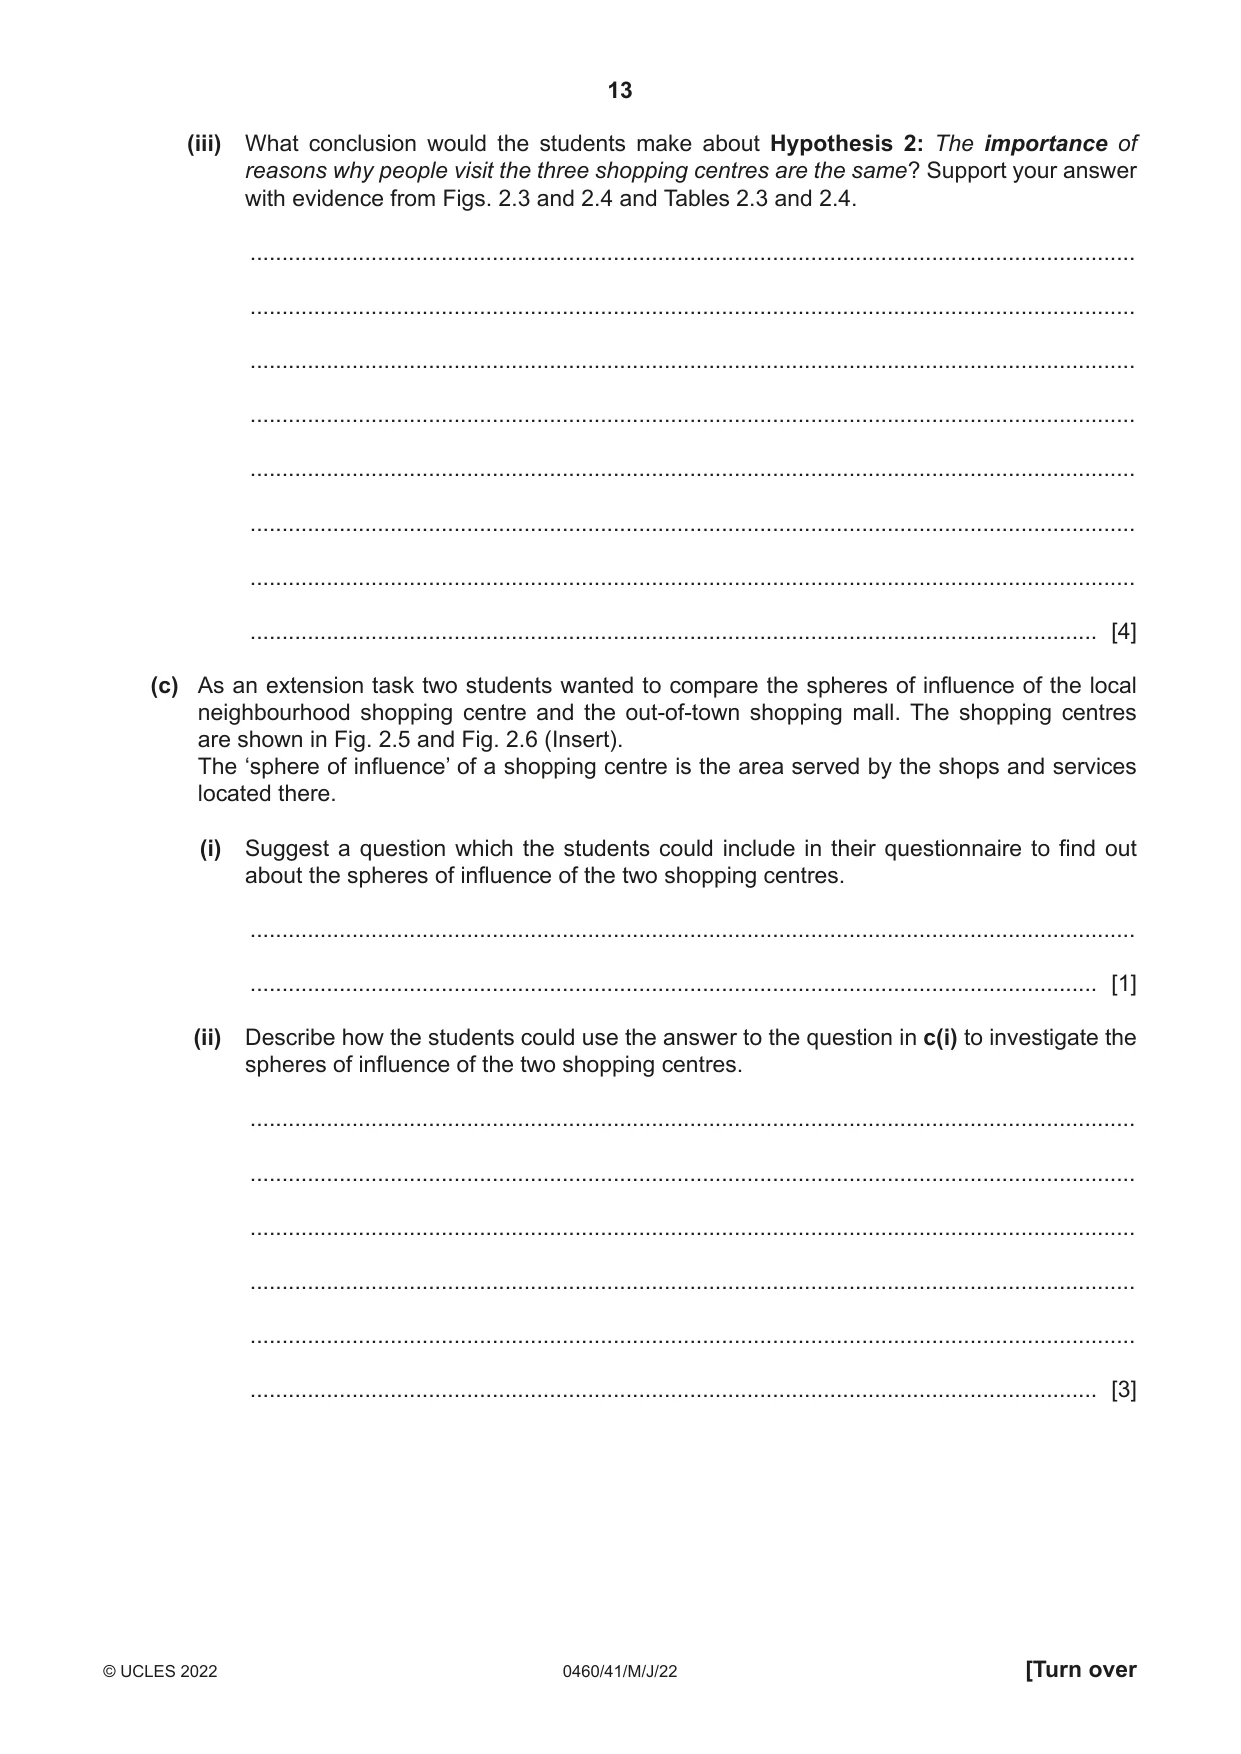
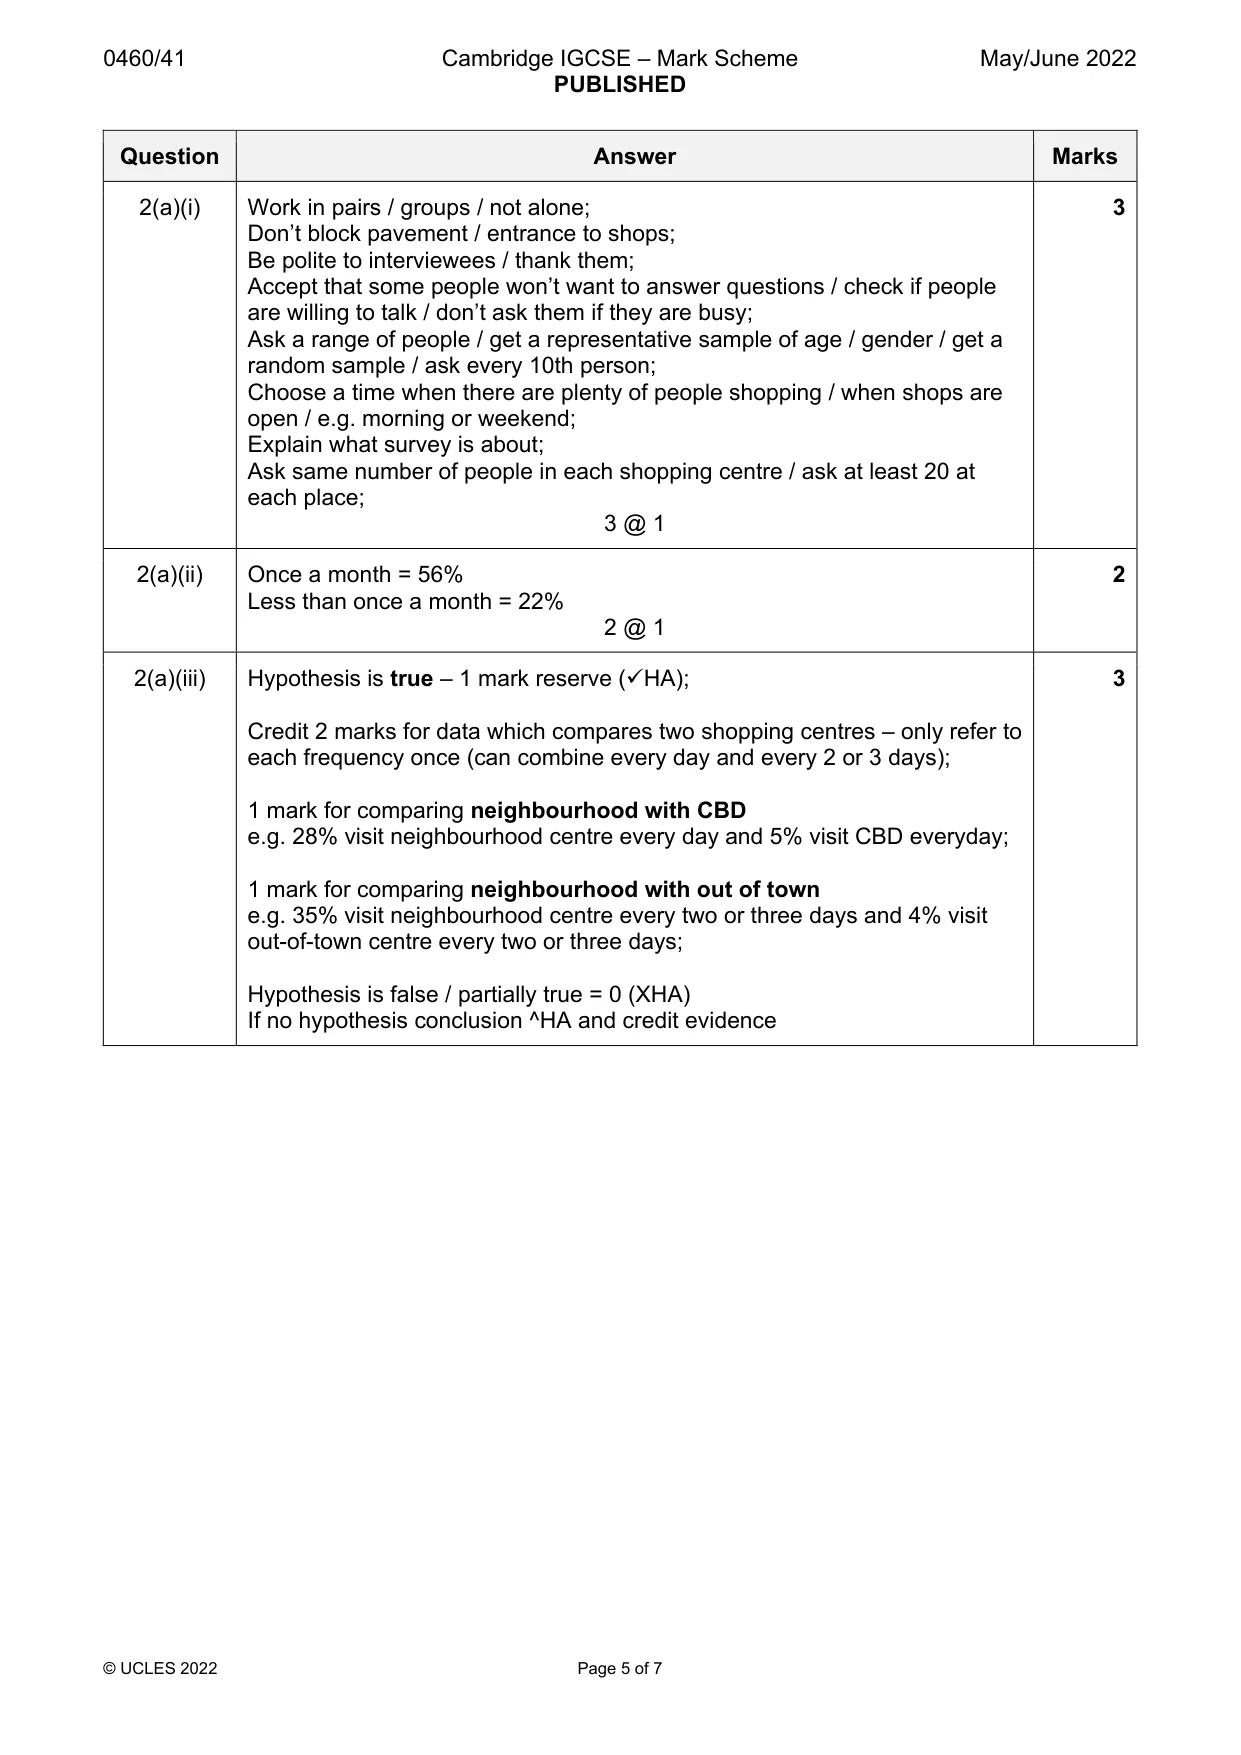
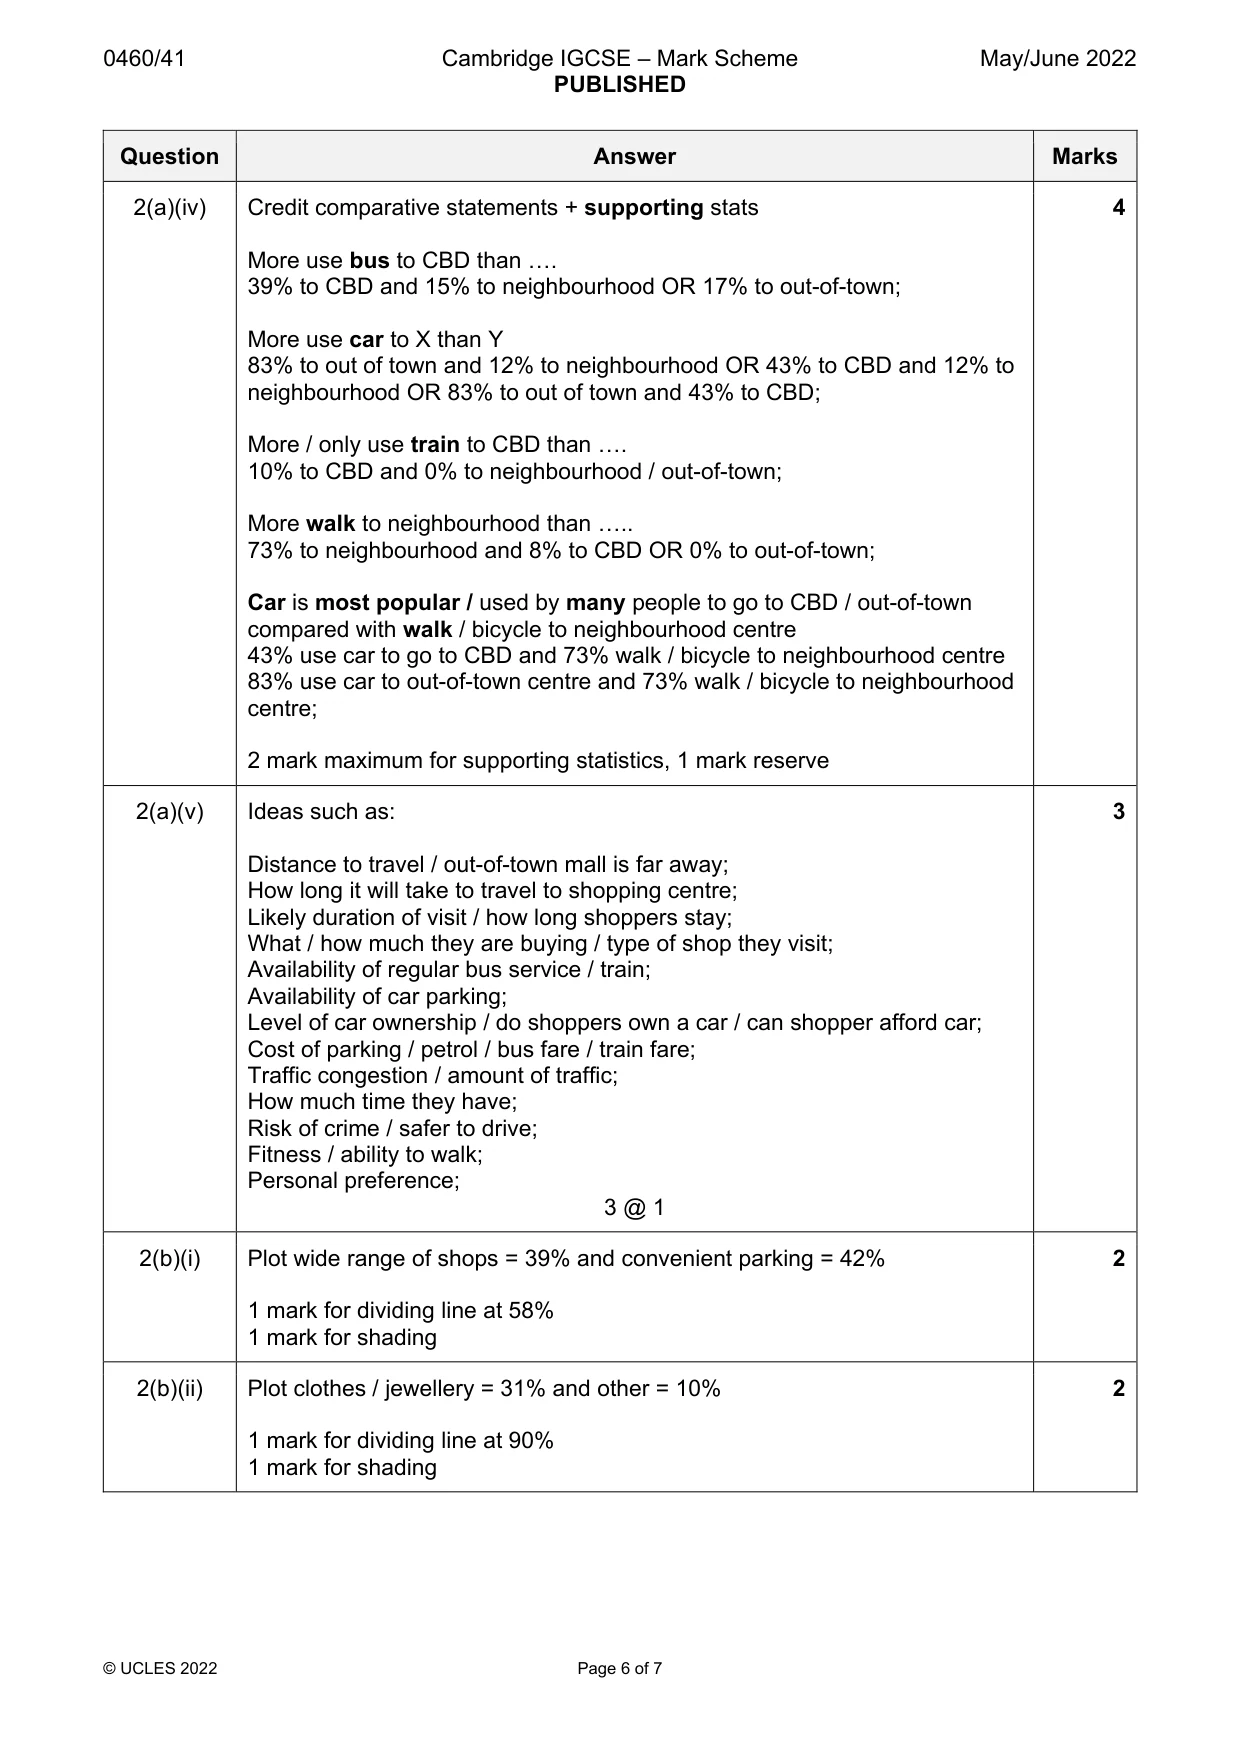
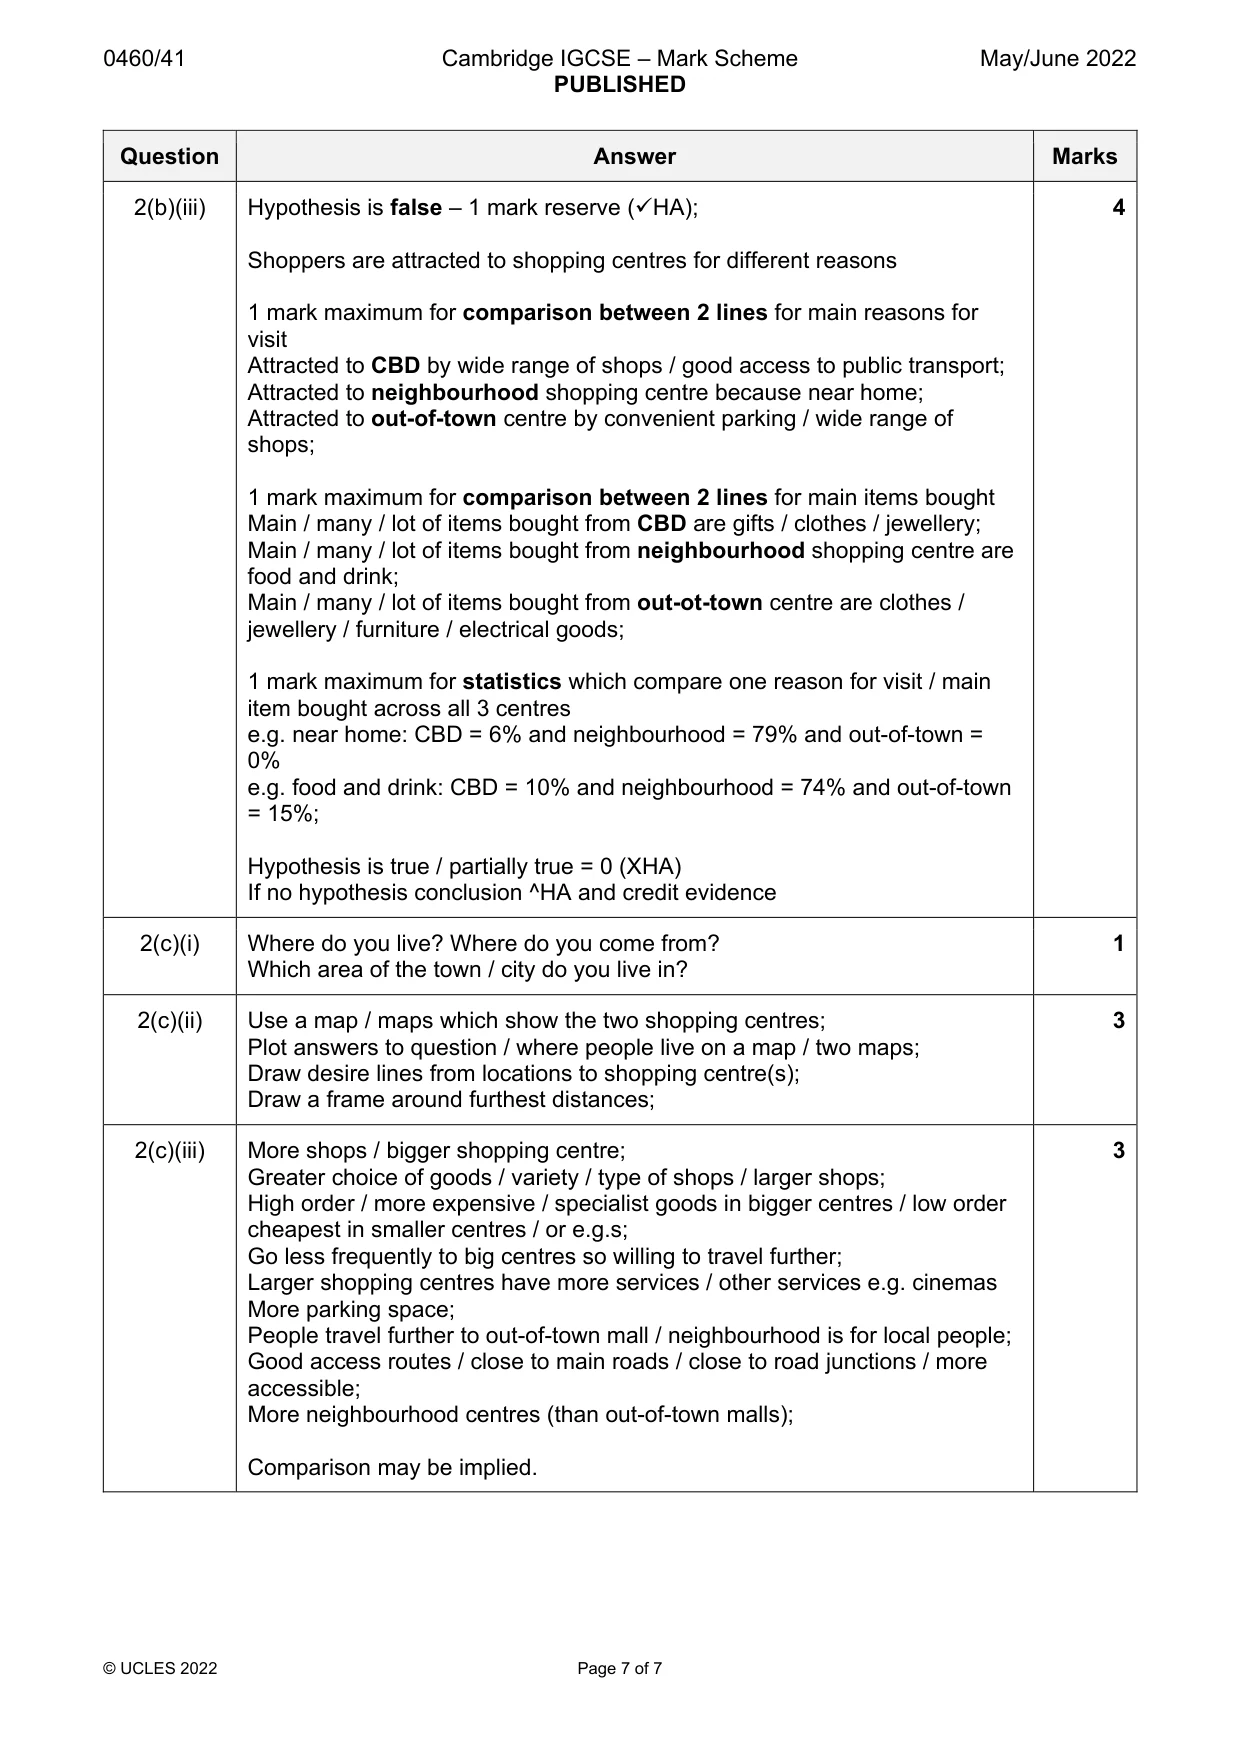
Mark scheme: 2(a)(i) Work in pairs / groups / not alone; 3 Don’t block pavement / entrance to shops; Be polite to interviewees / thank them; Accept that some people won’t want to answer questions / check if people are willing to talk / don’t ask them if they are busy; Ask a range of people / get a representative sample of age / gender / get a random sample / ask every 10th person; Choose a time when there are plenty of people shopping / when shops are open / e.g. morning or weekend; Explain what survey is about; Ask same number of people in each shopping centre / ask at least 20 at each place; 3 @ 1 2(a)(ii) Once a month = 56% 2 Less than once a month = 22% 2 @ 1 2(a)(iii) Hypothesis is true – 1 mark reserve (HA); 3 Credit 2 marks for data which compares two shopping centres – only refer to each frequency once (can combine every day and every 2 or 3 days); 1 mark for comparing neighbourhood with CBD e.g. 28% visit neighbourhood centre every day and 5% visit CBD everyday; 1 mark for comparing neighbourhood with out of town e.g. 35% visit neighbourhood centre every two or three days and 4% visit out-of-town centre every two or three days; Hypothesis is false / partially true = 0 (XHA) If no hypothesis conclusion ^HA and credit evidence 2(a)(iv) Credit comparative statements + supporting stats 4 More use bus to CBD than …. 39% to CBD and 15% to neighbourhood OR 17% to out-of-town; More use car to X than Y 83% to out of town and 12% to neighbourhood OR 43% to CBD and 12% to neighbourhood OR 83% to out of town and 43% to CBD; More / only use train to CBD than …. 10% to CBD and 0% to neighbourhood / out-of-town; More walk to neighbourhood than ….. 73% to neighbourhood and 8% to CBD OR 0% to out-of-town; Car is most popular / used by many people to go to CBD / out-of-town compared with walk / bicycle to neighbourhood centre 43% use car to go to CBD and 73% walk / bicycle to neighbourhood centre 83% use car to out-of-town centre and 73% walk / bicycle to neighbourhood centre; 2 mark maximum for supporting statistics, 1 mark reserve 2(a)(v) Ideas such as: 3 Distance to travel / out-of-town mall is far away; How long it will take to travel to shopping centre; Likely duration of visit / how long shoppers stay; What / how much they are buying / type of shop they visit; Availability of regular bus service / train; Availability of car parking; Level of car ownership / do shoppers own a car / can shopper afford car; Cost of parking / petrol / bus fare / train fare; Traffic congestion / amount of traffic; How much time they have; Risk of crime / safer to drive; Fitness / ability to walk; Personal preference; 3 @ 1 2(b)(i) Plot wide range of shops = 39% and convenient parking = 42% 2 1 mark for dividing line at 58% 1 mark for shading 2(b)(ii) Plot clothes / jewellery = 31% and other = 10% 2 1 mark for dividing line at 90% 1 mark for shading 2(b)(iii) Hypothesis is false – 1 mark reserve (HA); 4 Shoppers are attracted to shopping centres for different reasons 1 mark maximum for comparison between 2 lines for main reasons for visit Attracted to CBD by wide range of shops / good access to public transport; Attracted to neighbourhood shopping centre because near home; Attracted to out-of-town centre by convenient parking / wide range of shops; 1 mark maximum for comparison between 2 lines for main items bought Main / many / lot of items bought from CBD are gifts / clothes / jewellery; Main / many / lot of items bought from neighbourhood shopping centre are food and drink; Main / many / lot of items bought from out-ot-town centre are clothes / jewellery / furniture / electrical goods; 1 mark maximum for statistics which compare one reason for visit / main item bought across all 3 centres e.g. near home: CBD = 6% and neighbourhood = 79% and out-of-town = 0% e.g. food and drink: CBD = 10% and neighbourhood = 74% and out-of-town = 15%; Hypothesis is true / partially true = 0 (XHA) If no hypothesis conclusion ^HA and credit evidence 2(c)(i) Where do you live? Where do you come from? 1 Which area of the town / city do you live in? 2(c)(ii) Use a map / maps which show the two shopping centres; 3 Plot answers to question / where people live on a map / two maps; Draw desire lines from locations to shopping centre(s); Draw a frame around furthest distances; 2(c)(iii) More shops / bigger shopping centre; 3 Greater choice of goods / variety / type of shops / larger shops; High order / more expensive / specialist goods in bigger centres / low order cheapest in smaller centres / or e.g.s; Go less frequently to big centres so willing to travel further; Larger shopping centres have more services / other services e.g. cinemas More parking space; People travel further to out-of-town mall / neighbourhood is for local people; Good access routes / close to main roads / close to road junctions / more accessible; More neighbourhood centres (than out-of-town malls); Comparison may be implied.
More questions on Settlements (rural and urban) and service provision
What was in this paper
The subtopics covered by these 2 questions, and how many questions each got. Open one in a new tab to see every Cambridge question on it.
What you needed in this session
Cambridge’s own grade thresholds for 2022 May/June, Paper 4 · Variant 1. A higher threshold means an easier paper — the bar moves with how the cohort did.