Cambridge IGCSE Geography 0460 — 2025 May/June Paper 4 · Variant 1
0460/41/M/J/25 · 2 questions · 60 marks · 90 min
The question paper and its mark scheme, free to read here and free to download. This is Cambridge’s own paper, exactly as it was sat.
Question paper16 pages





Mark scheme11 pages
Answers below. Sit the paper first if you are practising.

Questions as text
Q1 · Students in Shanghai, China, did fieldwork to compare different areas of the city
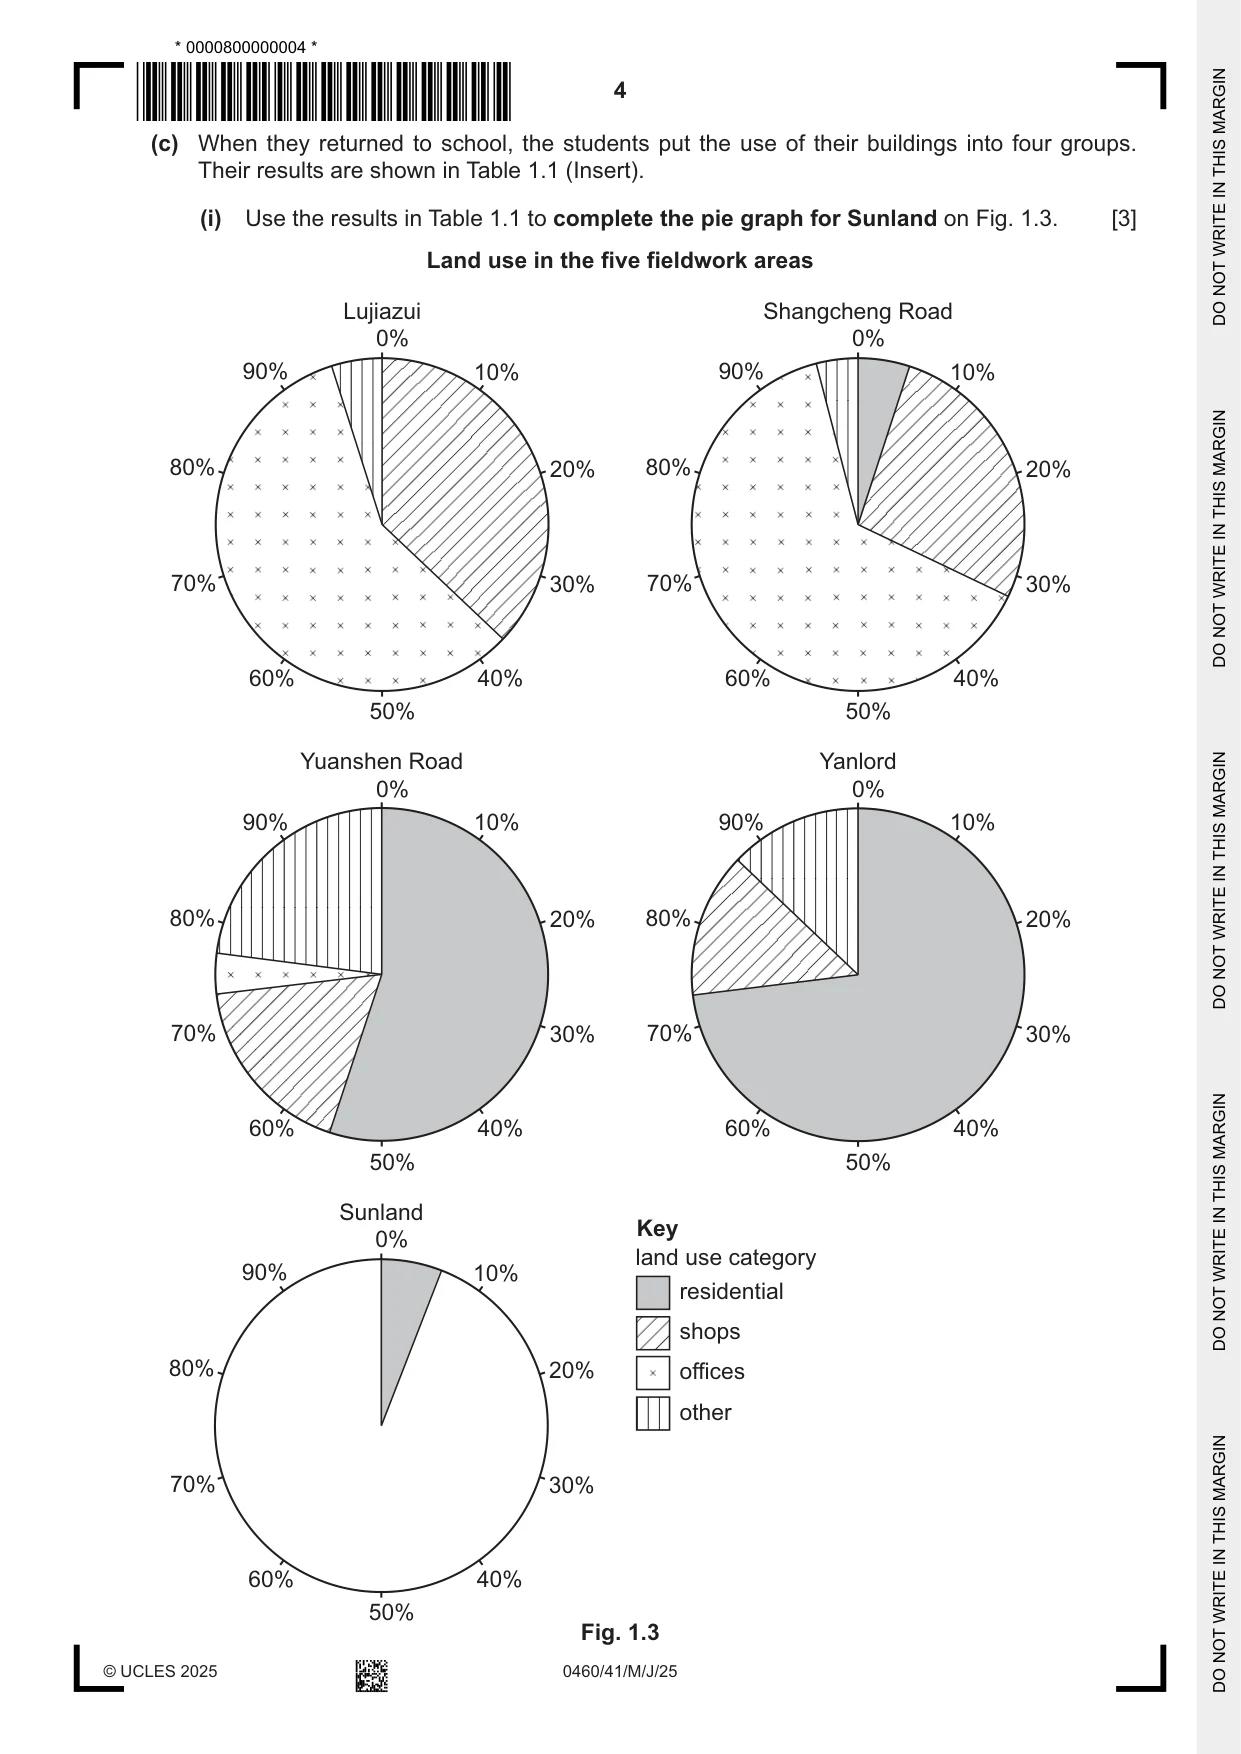
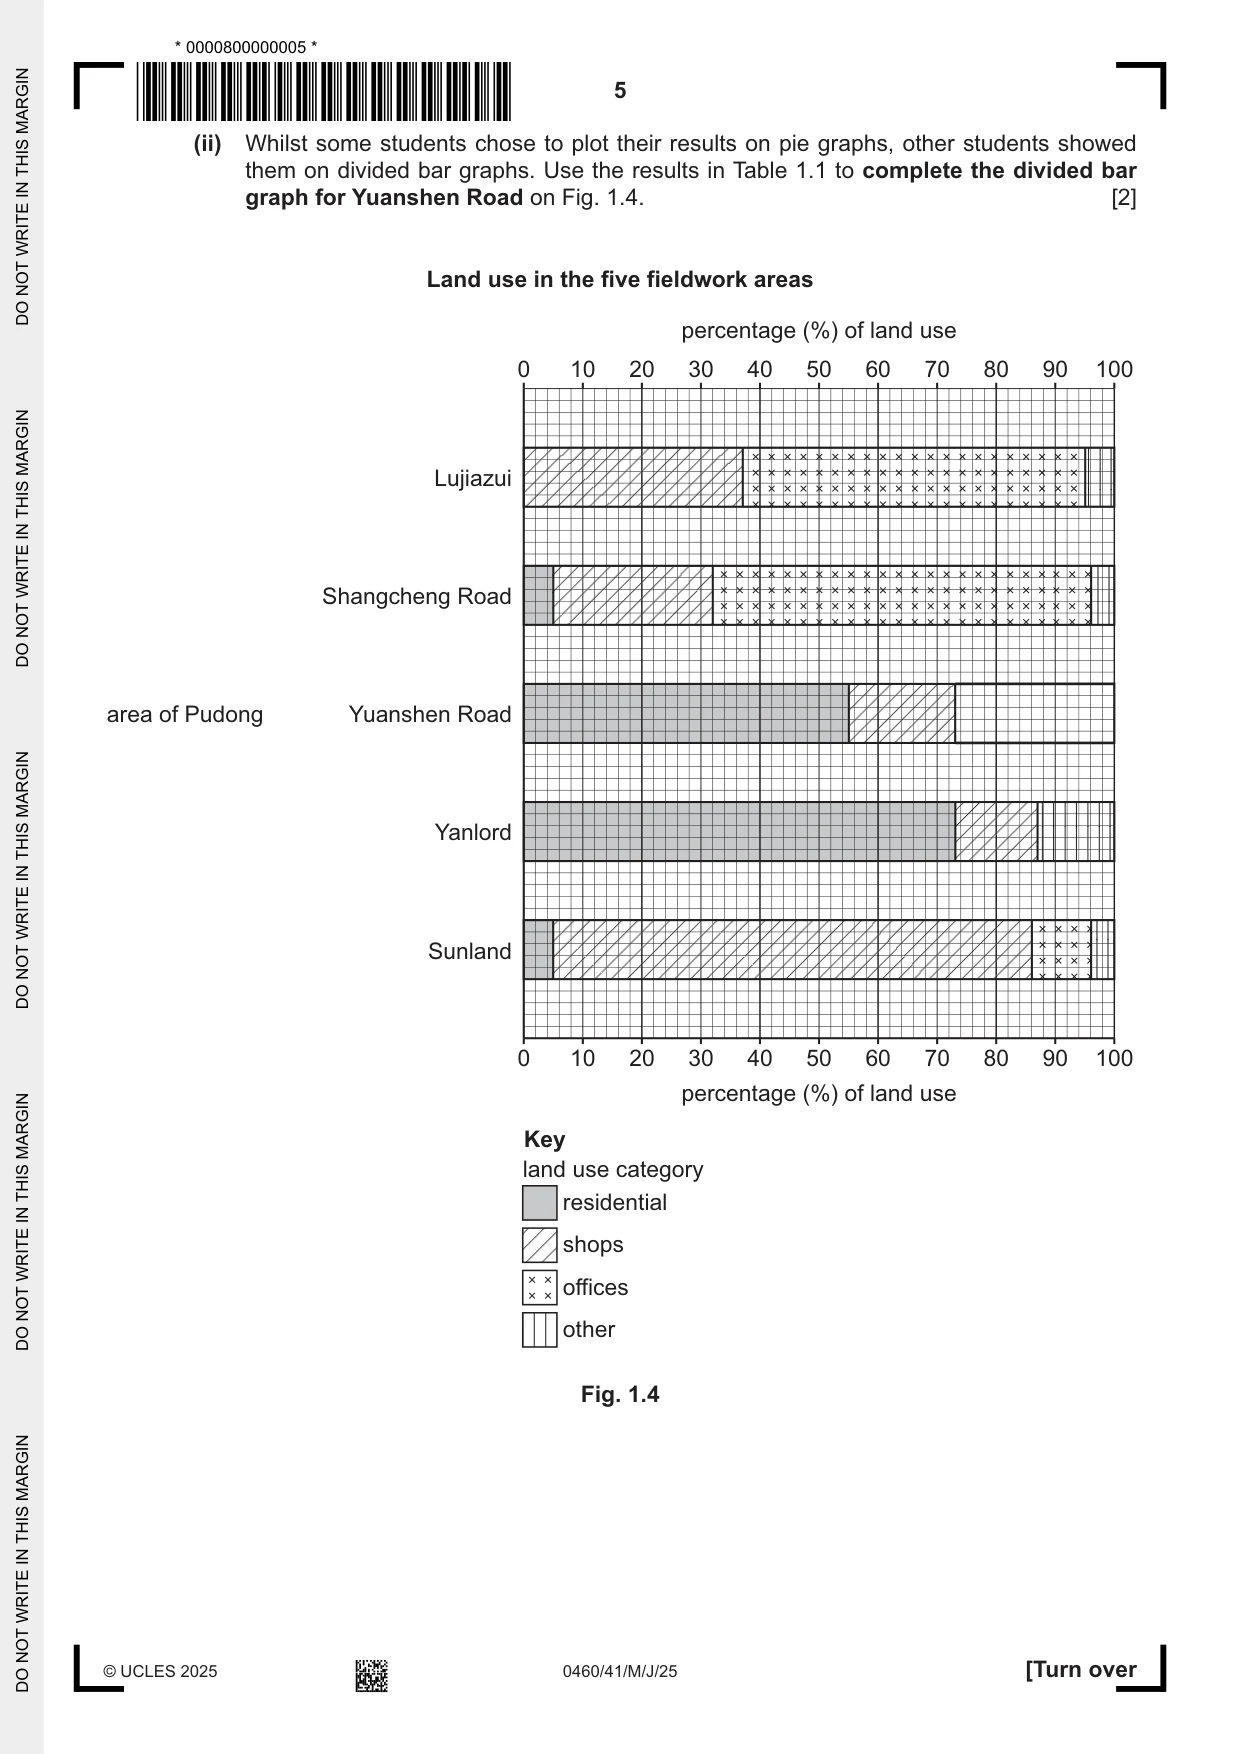
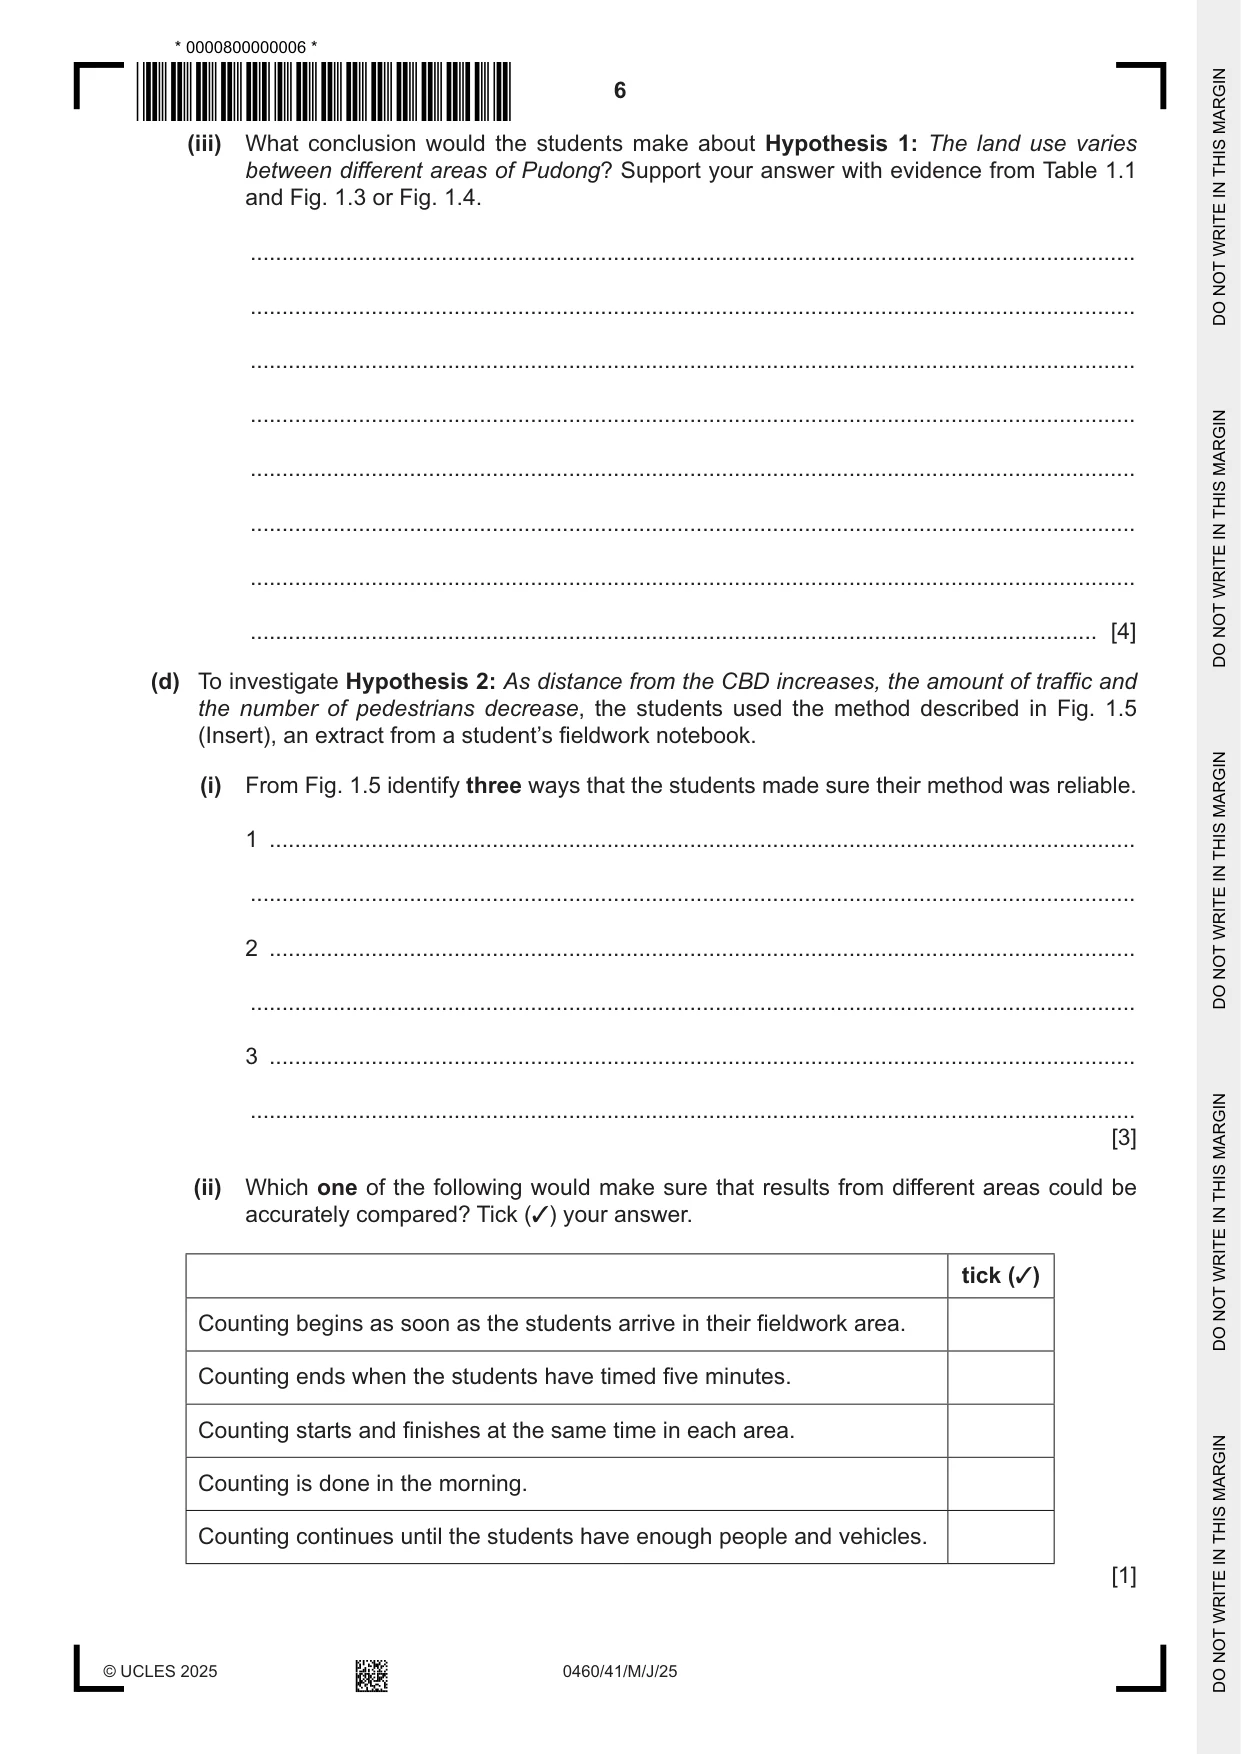
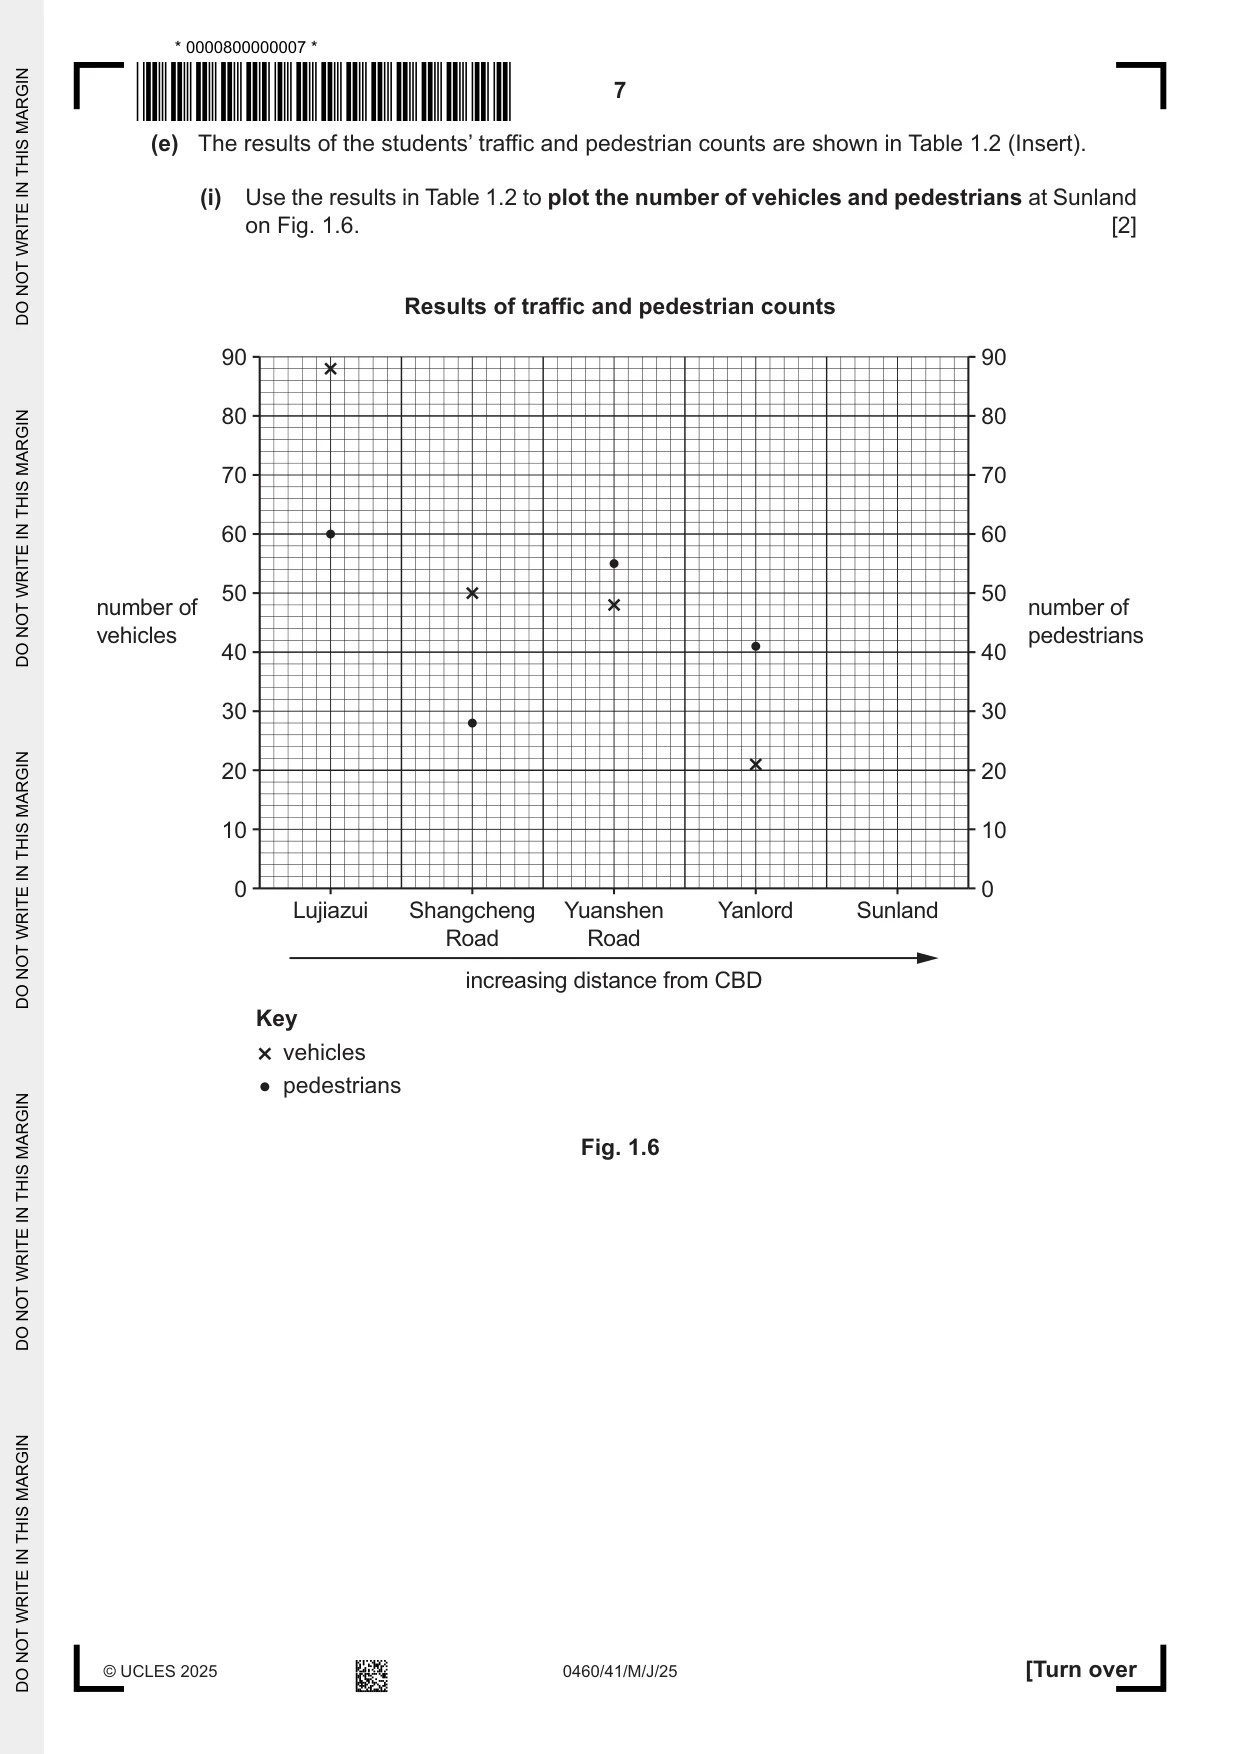
1 Students in Shanghai, China, did fieldwork to compare different areas of the city. The part of Shanghai where they did their fieldwork is Pudong. The Pudong area has changed as it has been re-developed in the twenty-first century. (a) Use Fig. 1.1 (Insert) to describe Pudong in the twenty-first century. ................................................................................................................................................... ................................................................................................................................................... ................................................................................................................................................... ................................................................................................................................................... ................................................................................................................................................... ............................................................................................................................................. [3] To collect data, the students did fieldwork in five areas along a metro railway line which goes from the CBD to the rural-urban fringe. The five fieldwork areas are described in Fig. 1.2 (Insert). One group of students tested the following hypotheses: Hypothesis 1: The land use varies between different areas of Pudong. Hypothesis 2: As distance from the CBD increases, the amount of traffic and the number of pedestrians decrease. (b) To investigate Hypothesis 1, the students recorded the main use of 100 buildings in each area. (i) Describe a suitable method to select 100 buildings for their survey. ........................................................................................................................................... ........................................................................................................................................... ........................................................................................................................................... ..................................................................................................................................... [2] (ii) Give two reasons why the method you described in (i) will give reliable results. 1 ........................................................................................................................................ ........................................................................................................................................... 2 ........................................................................................................................................ ........................................................................................................................................... [2] (c) When they returned to school, the students put the use of their buildings into four groups. Their results are shown in Table 1.1 (Insert). (i) Use the results in Table 1.1 to complete the pie graph for Sunland on Fig. 1.3. [3] Land use in the five fieldwork areas Lujiazui Shangcheng Road 0% 0% 90% 10% 90% 10% 80% 20% 80% 20% 70% 30% 70% 30% 60% 40% 60% 40% 50% 50% Yuanshen Road Yanlord 0% 0% 90% 10% 90% 10% 80% 20% 80% 20% 70% 30% 70% 30% 60% 40% 60% 40% 50% 50% Sunland Key 0% land use category 90% 10% residential shops 80% 20% offices other 70% 30% 60% 40% 50% Fig. 1.3 (ii) Whilst some students chose to plot their results on pie graphs, other students showed them on divided bar graphs. Use the results in Table 1.1 to complete the divided bar graph for Yuanshen Road on Fig. 1.4. [2] Land use in the five fieldwork areas percentage (%) of land use 0 10 20 30 40 50 60 70 80 90 100 Lujiazui Shangcheng Road area of Pudong Yuanshen Road Yanlord Sunland 0 10 20 30 40 50 60 70 80 90 100 percentage (%) of land use Key land use category residential shops offices other Fig. 1.4 (iii) What conclusion would the students make about Hypothesis 1: The land use varies between different areas of Pudong? Support your answer with evidence from Table 1.1 and Fig. 1.3 or Fig. 1.4. ........................................................................................................................................... ........................................................................................................................................... ........................................................................................................................................... ........................................................................................................................................... ........................................................................................................................................... ........................................................................................................................................... ........................................................................................................................................... ..................................................................................................................................... [4] (d) To investigate Hypothesis 2: As distance from the CBD increases, the amount of traffic and the number of pedestrians decrease, the students used the method described in Fig. 1.5 (Insert), an extract from a student’s fieldwork notebook. (i) From Fig. 1.5 identify three ways that the students made sure their method was reliable. 1 ........................................................................................................................................ ........................................................................................................................................... 2 ........................................................................................................................................ ........................................................................................................................................... 3 ........................................................................................................................................ ........................................................................................................................................... [3] (ii) Which one of the following would make sure that results from different areas could be accurately compared? Tick (✓) your answer. tick (✓) Counting begins as soon as the students arrive in their fieldwork area. Counting ends when the students have timed five minutes. Counting starts and finishes at the same time in each area. Counting is done in the morning. Counting continues until the students have enough people and vehicles. [1] (e) The results of the students’ traffic and pedestrian counts are shown in Table 1.2 (Insert). (i) Use the results in Table 1.2 to plot the number of vehicles and pedestrians at Sunland on Fig. 1.6. [2] Results of traffic and pedestrian counts 90 90 80 80 70 70 60 60 50 50 number of number of vehicles pedestrians 40 40 30 30 20 20 10 10 0 0 Lujiazui Shangcheng Yuanshen Yanlord Sunland Road Road increasing distance from CBD Key vehicles pedestrians Fig. 1.6 (ii) Which one of the following conclusions did the students make about Hypothesis 2: As distance from the CBD increases, the amount of traffic and the number of pedestrians decrease? Tick (✓) your decision. tick (✓) The hypothesis is true for both traffic and pedestrians. The hypothesis is true for one and false for one. The hypothesis is false for both traffic and pedestrians. Support your decision with evidence from Fig. 1.6 and Table 1.2. ........................................................................................................................................... ........................................................................................................................................... ........................................................................................................................................... ........................................................................................................................................... ........................................................................................................................................... ..................................................................................................................................... [4] (f) Other students investigated how the quality of the environment varied between the five areas of Pudong. Describe a fieldwork method they could use to do this. ................................................................................................................................................... ................................................................................................................................................... ................................................................................................................................................... ................................................................................................................................................... ................................................................................................................................................... ................................................................................................................................................... ................................................................................................................................................... ............................................................................................................................................. [4] [Total: 30]
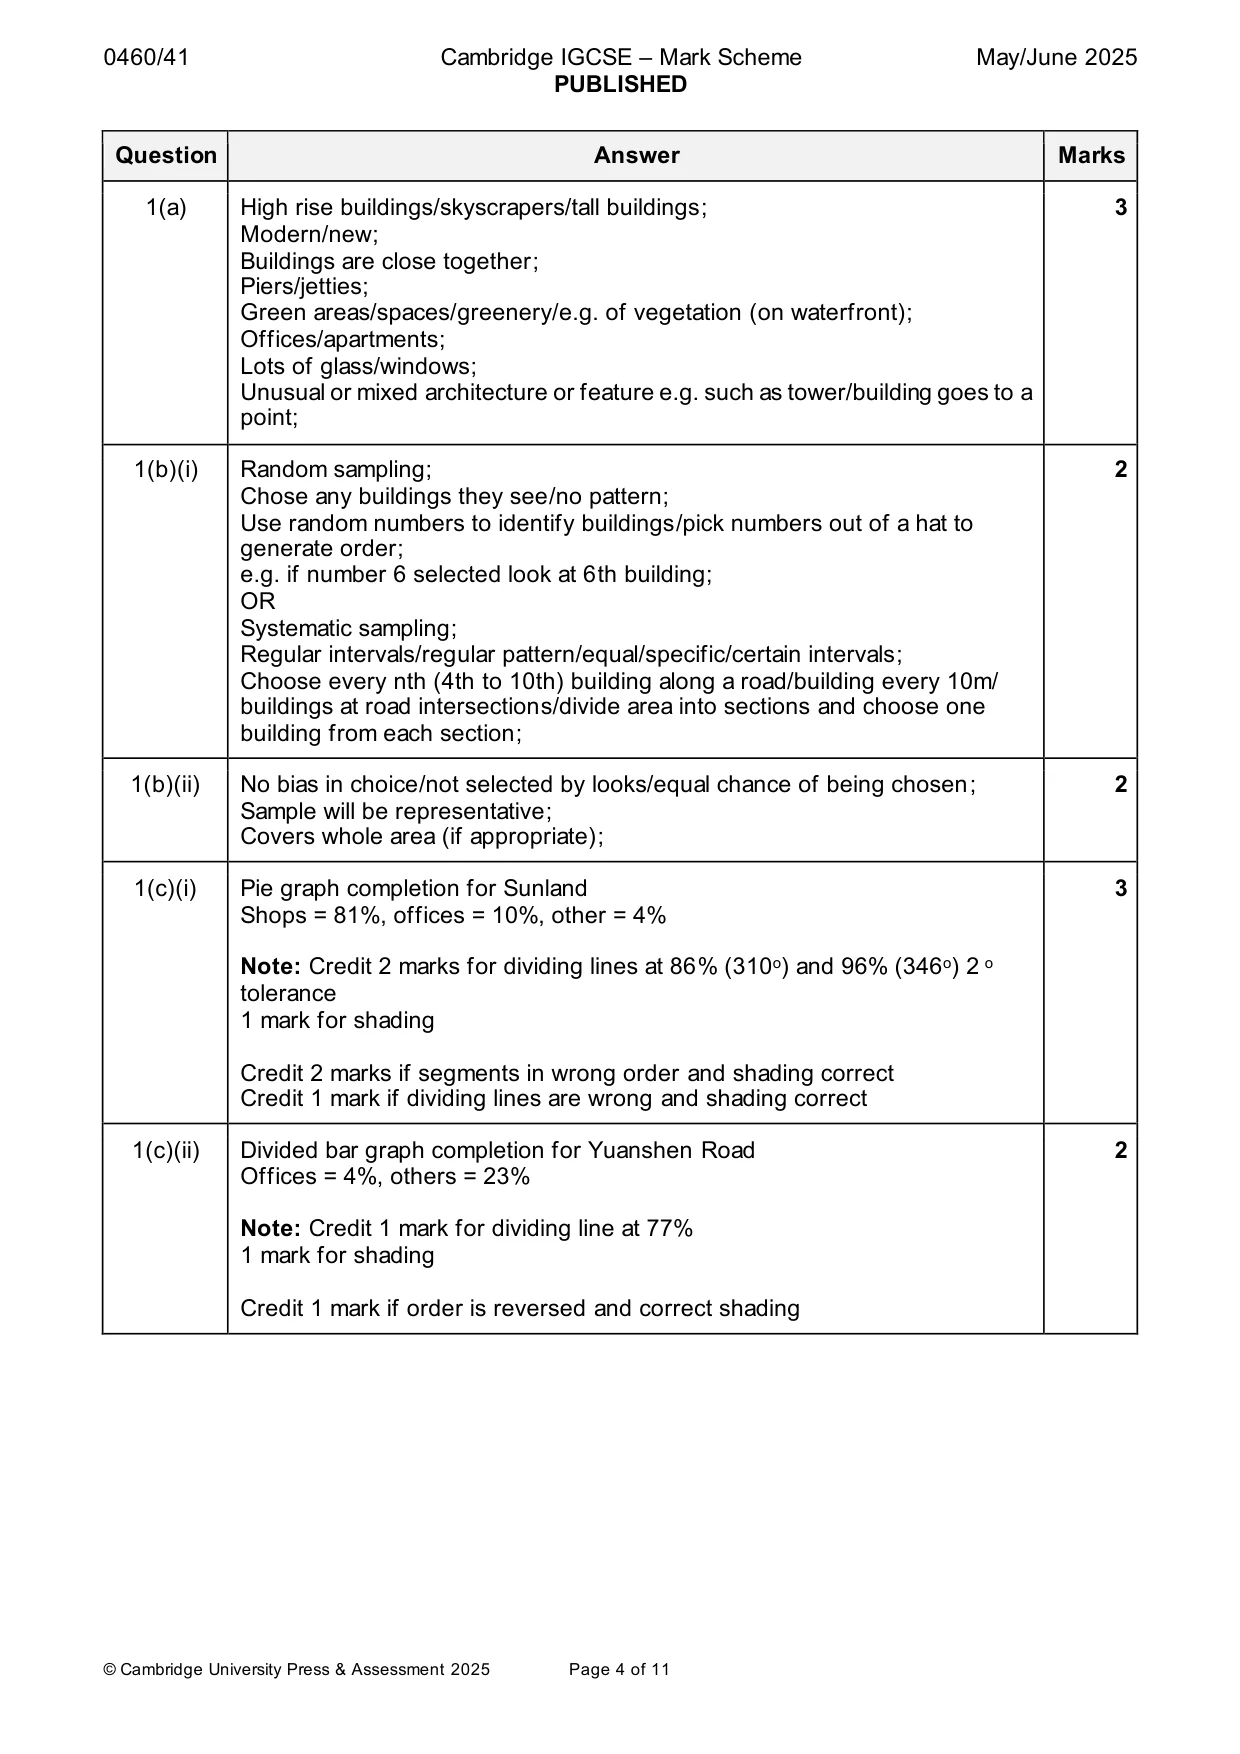
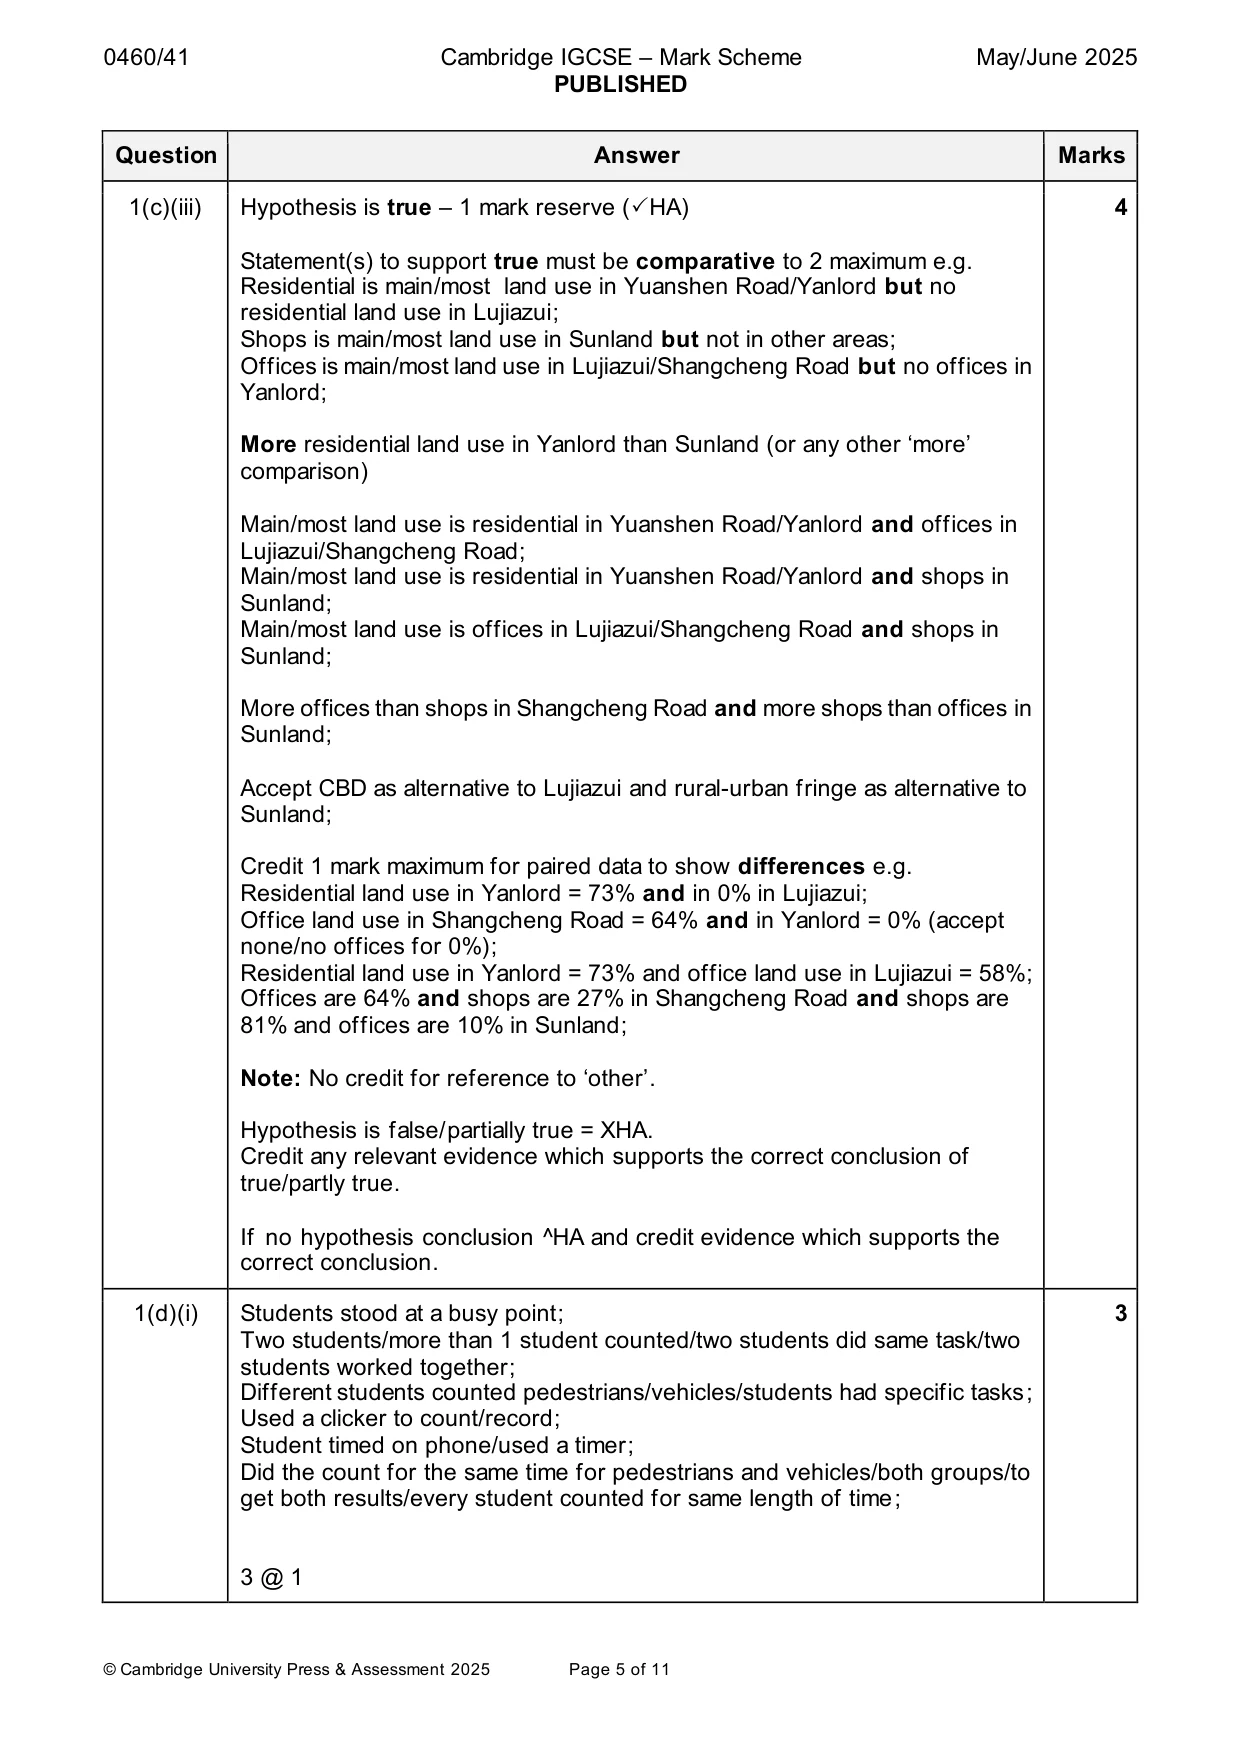
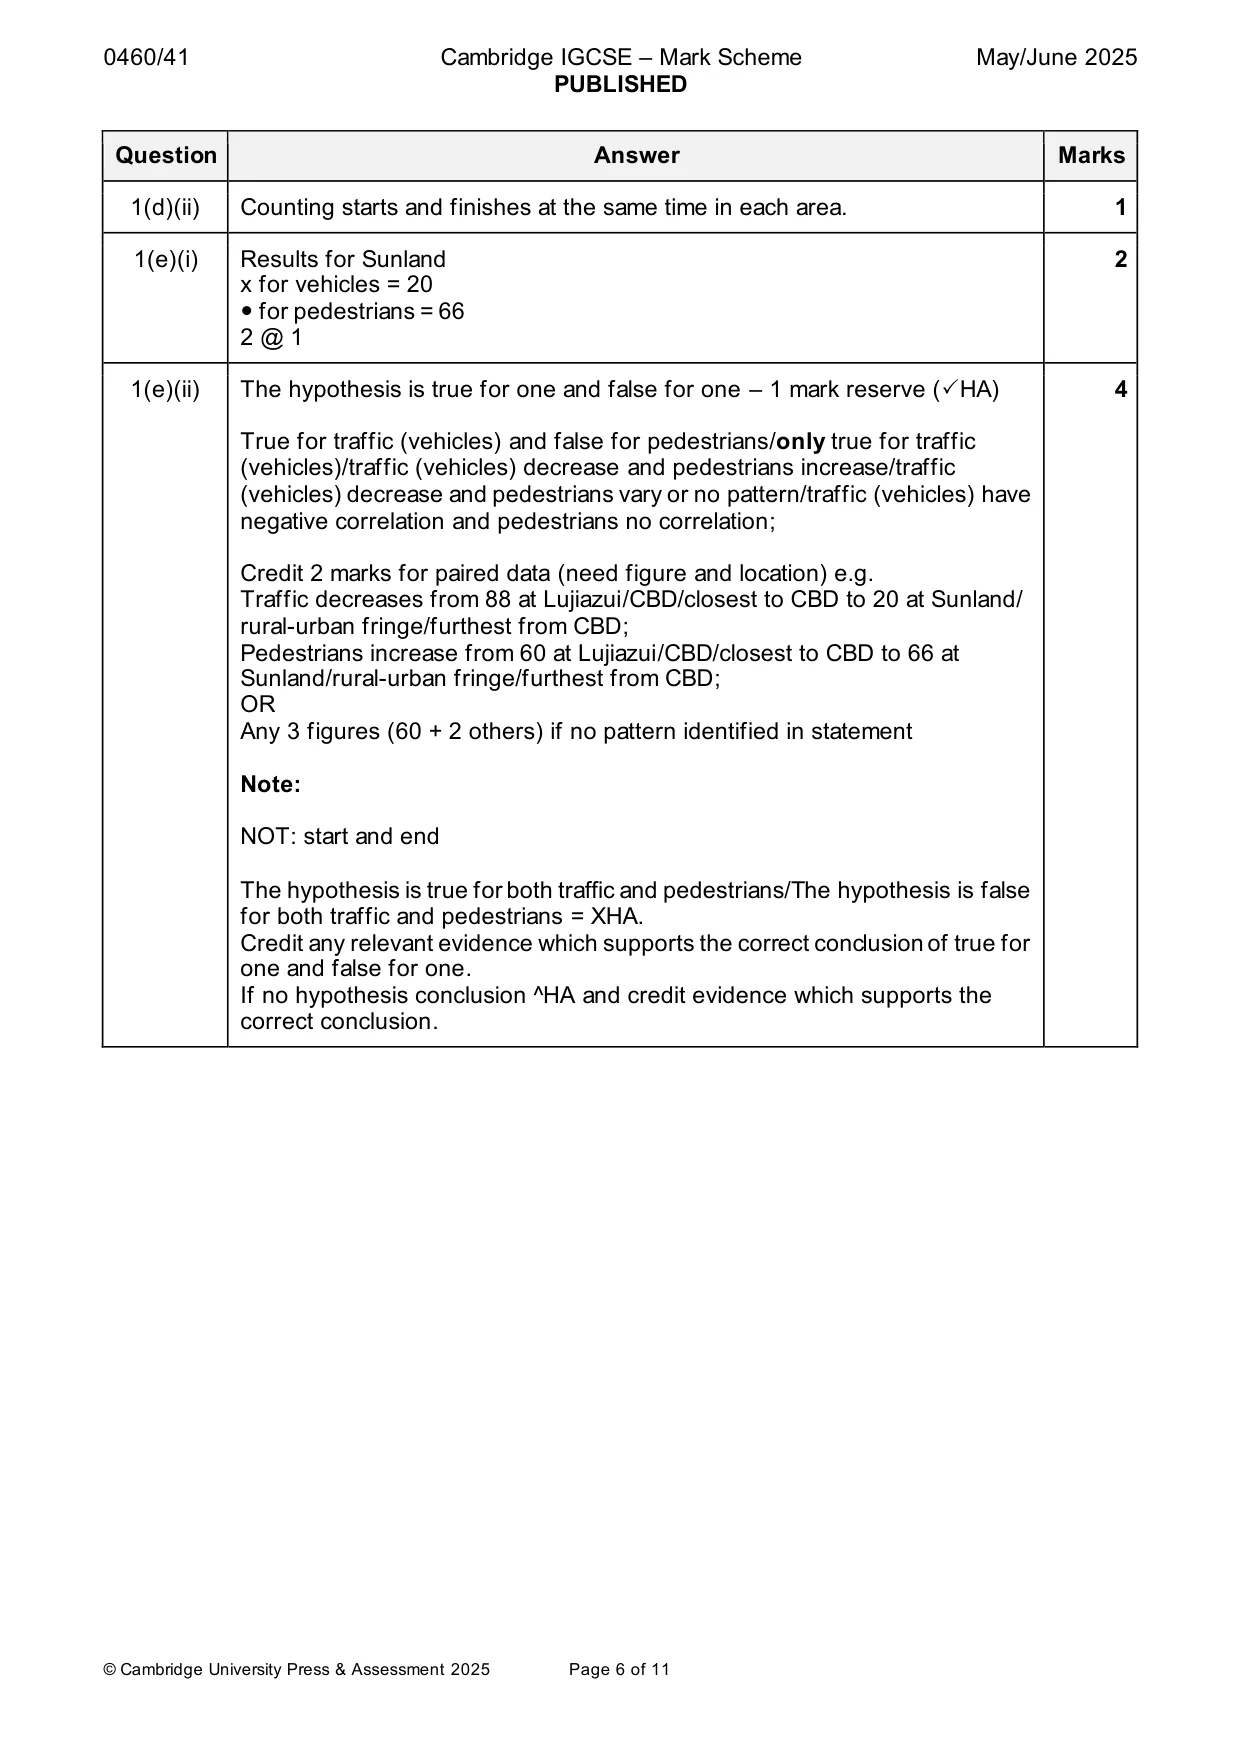
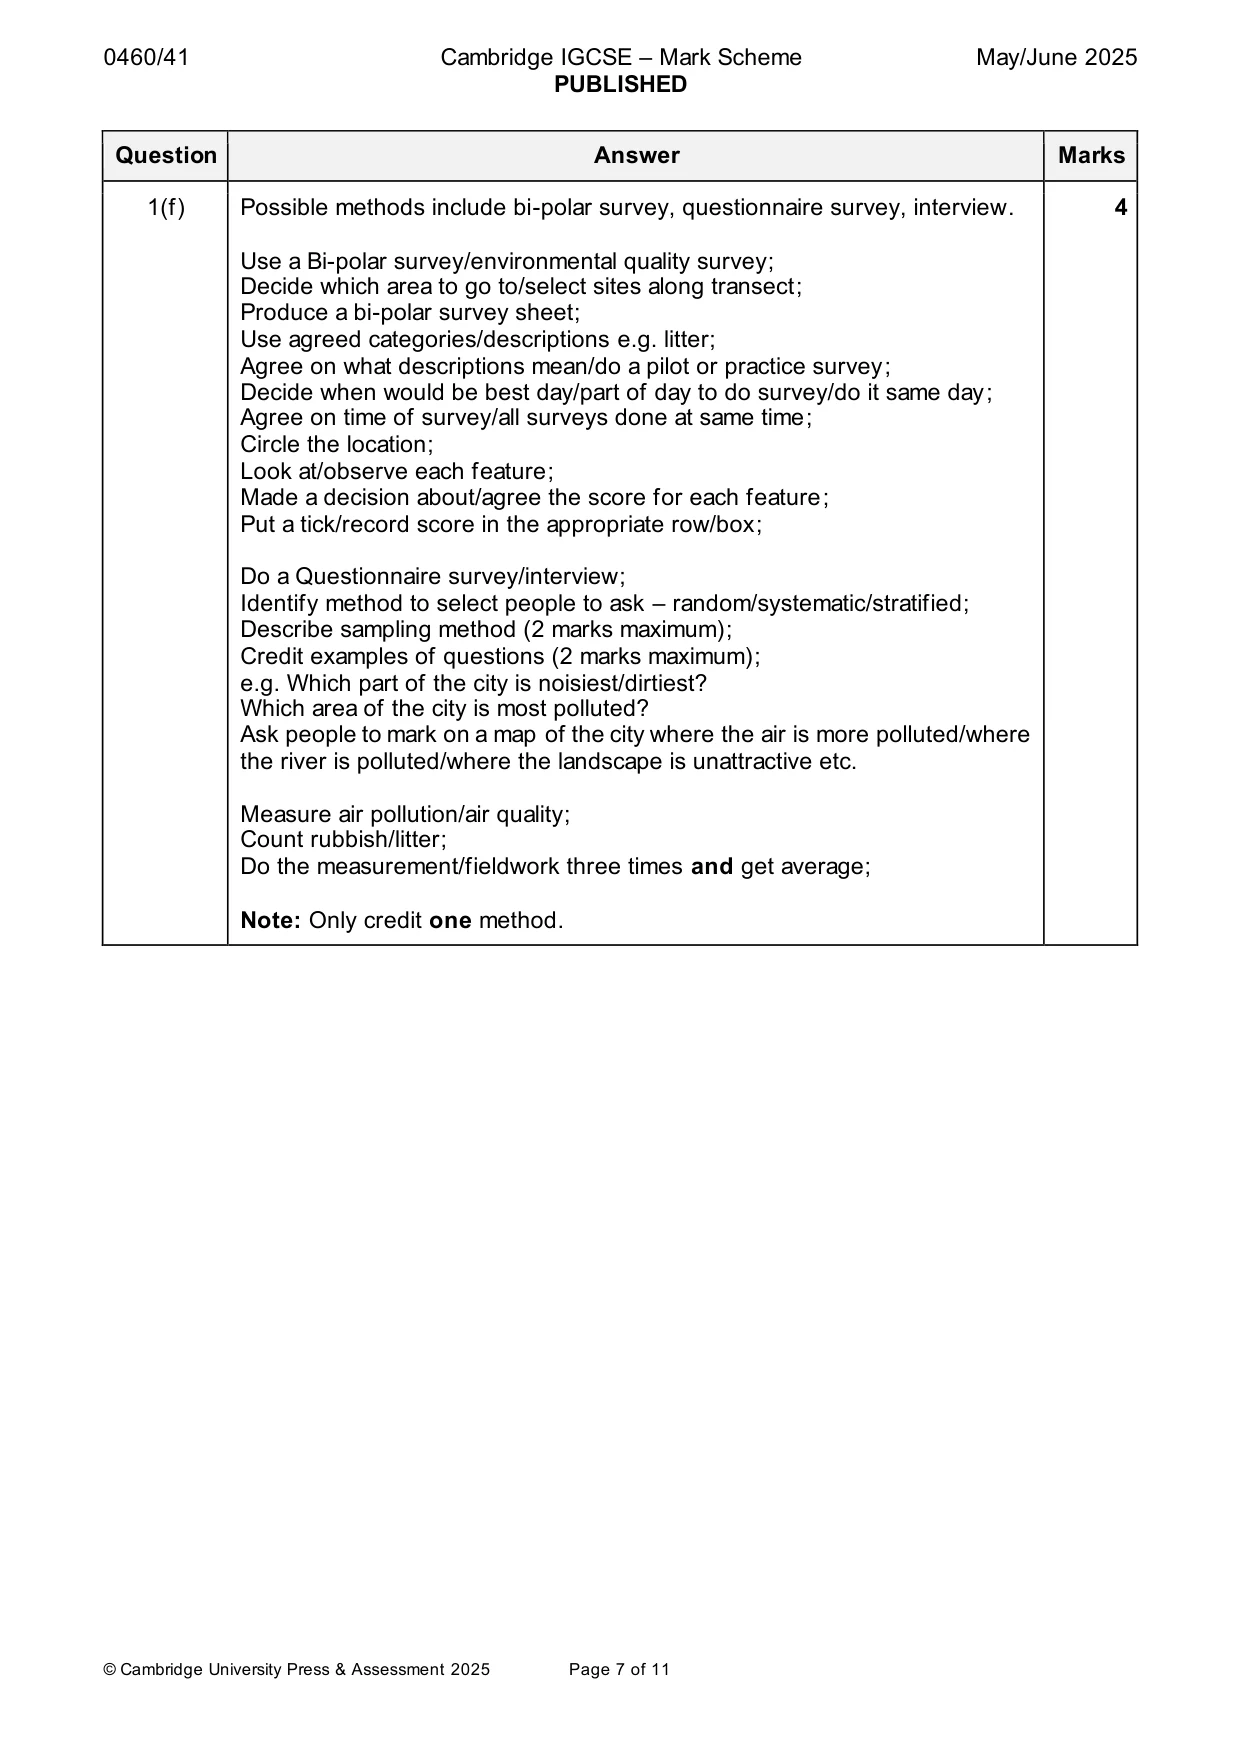
Mark scheme: Question Answer Marks 1(a) High rise buildings/skyscrapers/tall buildings; 3 Modern/new; Buildings are close together; Piers/jetties; Green areas/spaces/greenery/e.g. of vegetation (on waterfront); Offices/apartments; Lots of glass/windows; Unusual or mixed architecture or feature e.g. such as tower/building goes to a point; 1(b)(i) Random sampling; 2 Chose any buildings they see/no pattern; Use random numbers to identify buildings/pick numbers out of a hat to generate order; e.g. if number 6 selected look at 6th building; OR Systematic sampling; Regular intervals/regular pattern/equal/specific/certain intervals; Choose every nth (4th to 10th) building along a road/building every 10m/ buildings at road intersections/divide area into sections and choose one building from each section; 1(b)(ii) No bias in choice/not selected by looks/equal chance of being chosen; 2 Sample will be representative; Covers whole area (if appropriate); 1(c)(i) Pie graph completion for Sunland 3 Shops = 81%, offices = 10%, other = 4% Note: Credit 2 marks for dividing lines at 86% (310o) and 96% (346o) 2 o tolerance 1 mark for shading Credit 2 marks if segments in wrong order and shading correct Credit 1 mark if dividing lines are wrong and shading correct 1(c)(ii) Divided bar graph completion for Yuanshen Road 2 Offices = 4%, others = 23% Note: Credit 1 mark for dividing line at 77% 1 mark for shading Credit 1 mark if order is reversed and correct shading 1(c)(iii) Hypothesis is true – 1 mark reserve (HA) 4 Statement(s) to support true must be comparative to 2 maximum e.g. Residential is main/most land use in Yuanshen Road/Yanlord but no residential land use in Lujiazui; Shops is main/most land use in Sunland but not in other areas; Offices is main/most land use in Lujiazui/Shangcheng Road but no offices in Yanlord; More residential land use in Yanlord than Sunland (or any other ‘more’ comparison) Main/most land use is residential in Yuanshen Road/Yanlord and offices in Lujiazui/Shangcheng Road; Main/most land use is residential in Yuanshen Road/Yanlord and shops in Sunland; Main/most land use is offices in Lujiazui/Shangcheng Road and shops in Sunland; More offices than shops in Shangcheng Road and more shops than offices in Sunland; Accept CBD as alternative to Lujiazui and rural-urban fringe as alternative to Sunland; Credit 1 mark maximum for paired data to show differences e.g. Residential land use in Yanlord = 73% and in 0% in Lujiazui; Office land use in Shangcheng Road = 64% and in Yanlord = 0% (accept none/no offices for 0%); Residential land use in Yanlord = 73% and office land use in Lujiazui = 58%; Offices are 64% and shops are 27% in Shangcheng Road and shops are 81% and offices are 10% in Sunland; Note: No credit for reference to ‘other’. Hypothesis is false/partially true = XHA. Credit any relevant evidence which supports the correct conclusion of true/partly true. If no hypothesis conclusion ^HA and credit evidence which supports the correct conclusion. 1(d)(i) Students stood at a busy point; 3 Two students/more than 1 student counted/two students did same task/two students worked together; Different students counted pedestrians/vehicles/students had specific tasks; Used a clicker to count/record; Student timed on phone/used a timer; Did the count for the same time for pedestrians and vehicles/both groups/to get both results/every student counted for same length of time; 3 @ 1 1(d)(ii) Counting starts and finishes at the same time in each area. 1 1(e)(i) Results for Sunland 2 x for vehicles = 20 for pedestrians = 66 2 @ 1 1(e)(ii) The hypothesis is true for one and false for one – 1 mark reserve (HA) 4 True for traffic (vehicles) and false for pedestrians/only true for traffic (vehicles)/traffic (vehicles) decrease and pedestrians increase/traffic (vehicles) decrease and pedestrians vary or no pattern/traffic (vehicles) have negative correlation and pedestrians no correlation; Credit 2 marks for paired data (need figure and location) e.g. Traffic decreases from 88 at Lujiazui/CBD/closest to CBD to 20 at Sunland/ rural-urban fringe/furthest from CBD; Pedestrians increase from 60 at Lujiazui/CBD/closest to CBD to 66 at Sunland/rural-urban fringe/furthest from CBD; OR Any 3 figures (60 + 2 others) if no pattern identified in statement Note: NOT: start and end The hypothesis is true for both traffic and pedestrians/The hypothesis is false for both traffic and pedestrians = XHA. Credit any relevant evidence which supports the correct conclusion of true for one and false for one. If no hypothesis conclusion ^HA and credit evidence which supports the correct conclusion. 1(f) Possible methods include bi-polar survey, questionnaire survey, interview. 4 Use a Bi-polar survey/environmental quality survey; Decide which area to go to/select sites along transect; Produce a bi-polar survey sheet; Use agreed categories/descriptions e.g. litter; Agree on what descriptions mean/do a pilot or practice survey; Decide when would be best day/part of day to do survey/do it same day; Agree on time of survey/all surveys done at same time; Circle the location; Look at/observe each feature; Made a decision about/agree the score for each feature; Put a tick/record score in the appropriate row/box; Do a Questionnaire survey/interview; Identify method to select people to ask – random/systematic/stratified; Describe sampling method (2 marks maximum); Credit examples of questions (2 marks maximum); e.g. Which part of the city is noisiest/dirtiest? Which area of the city is most polluted? Ask people to mark on a map of the city where the air is more polluted/where the river is polluted/where the landscape is unattractive etc. Measure air pollution/air quality; Count rubbish/litter; Do the measurement/fieldwork three times and get average; Note: Only credit one method.
Q2 · A class of students went on a field visit to some sand dunes on the east coast of England
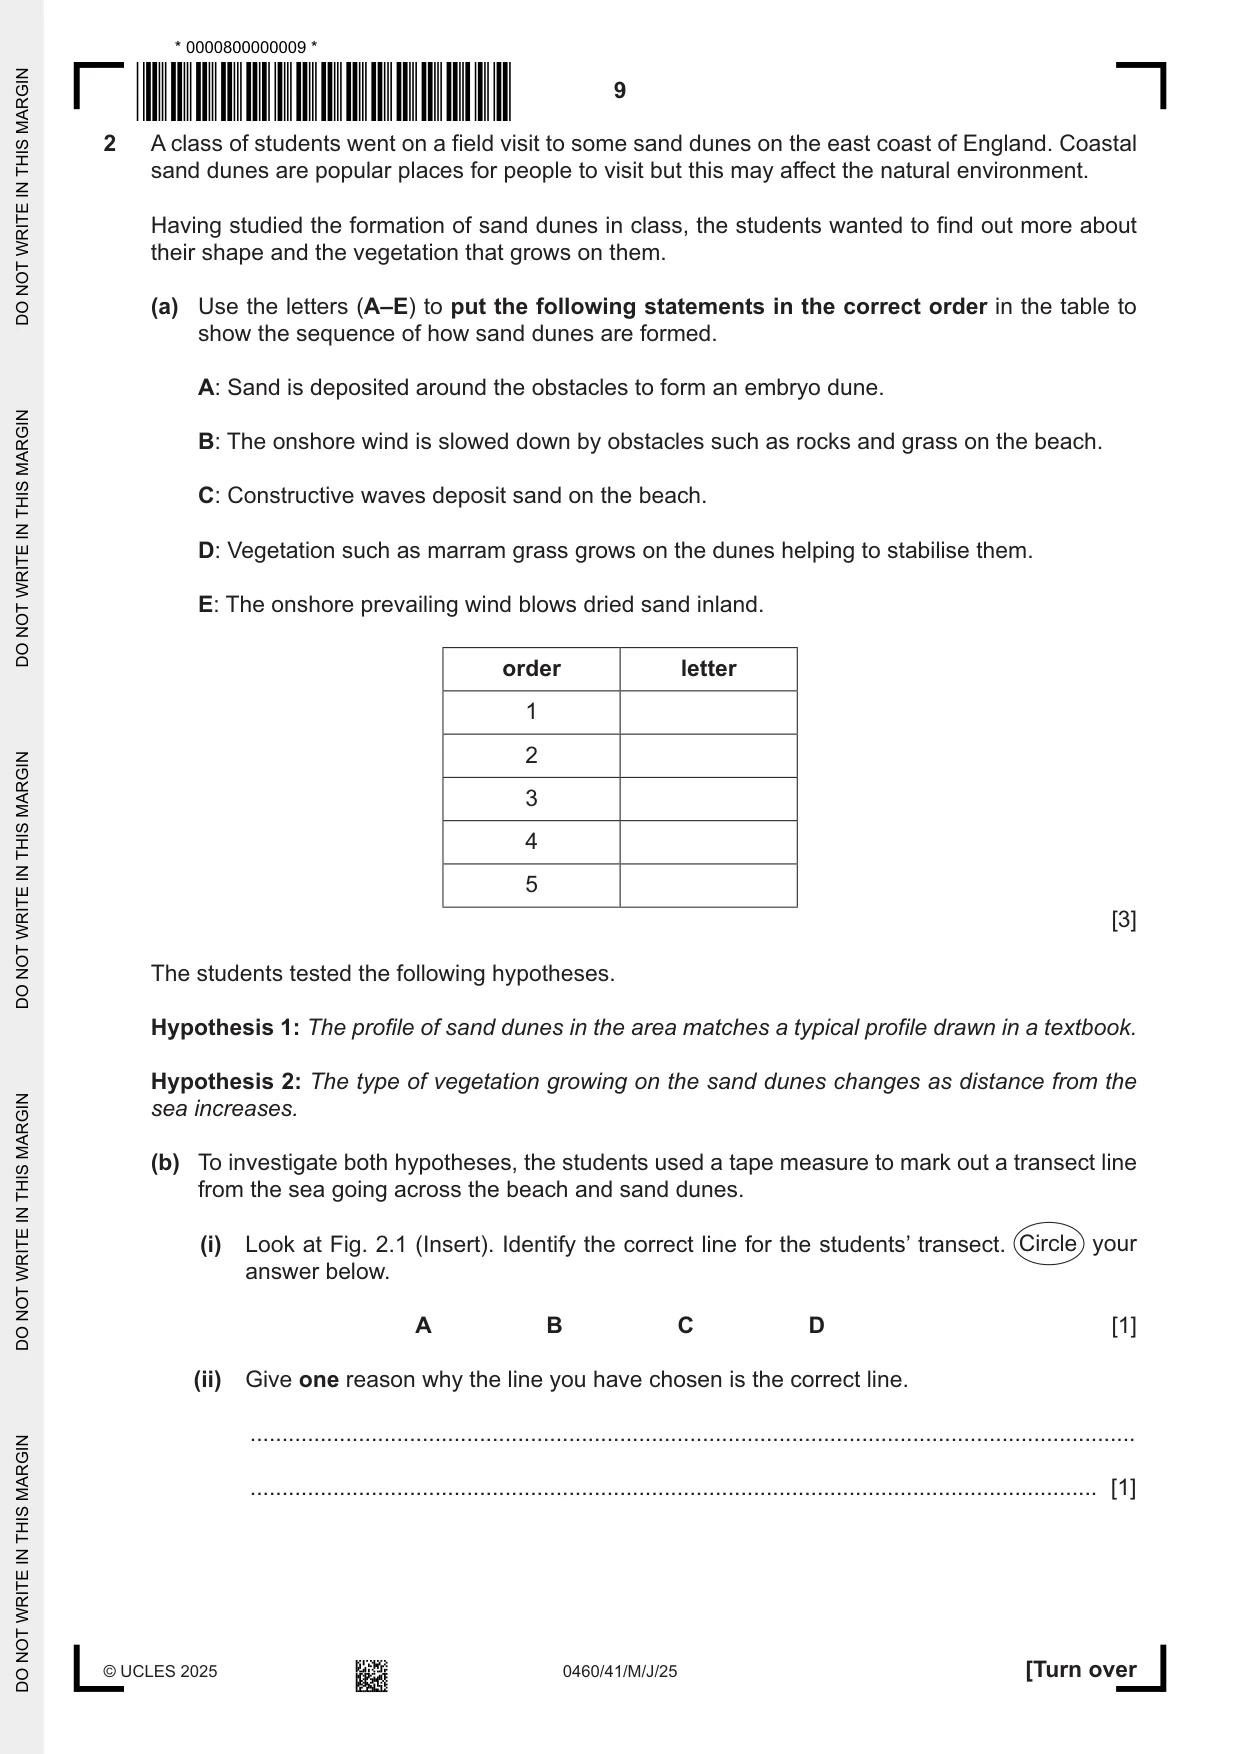
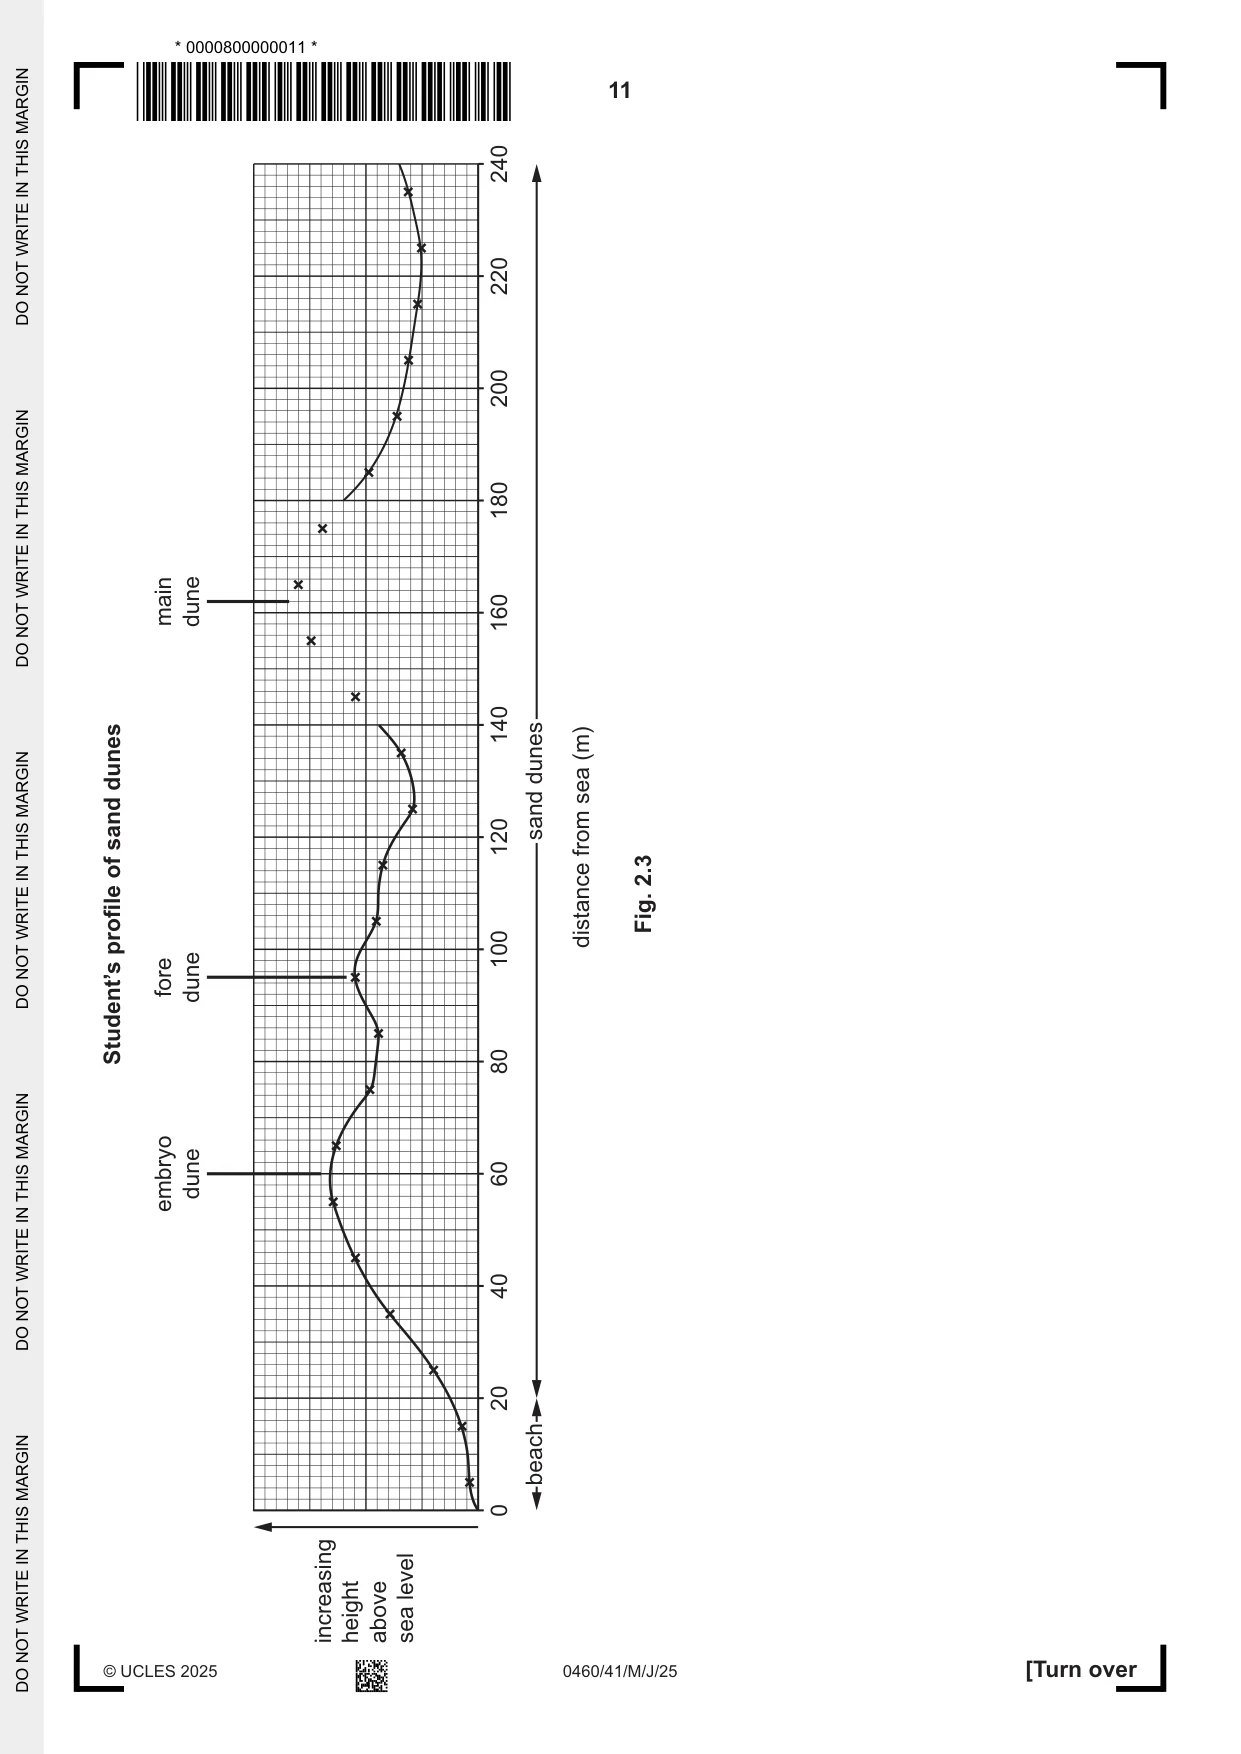
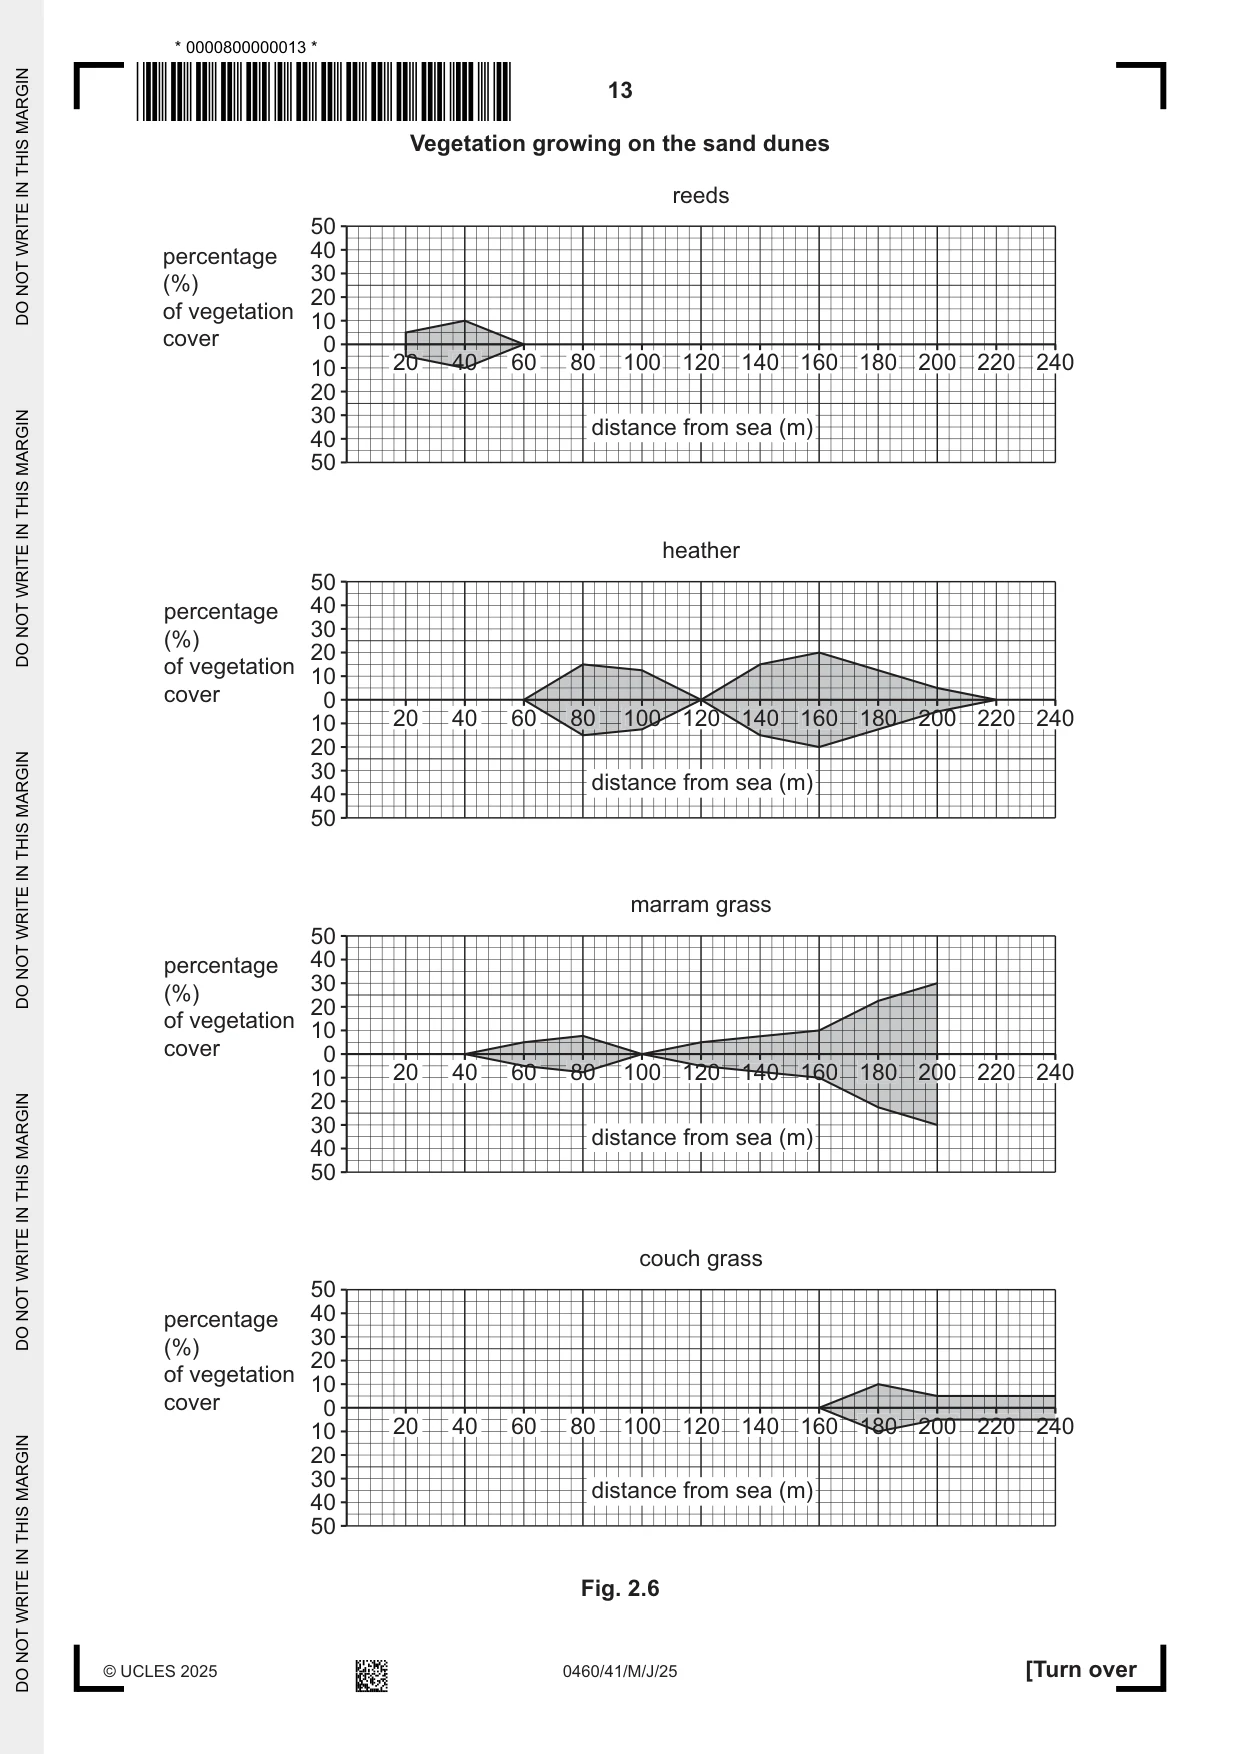
2 A class of students went on a field visit to some sand dunes on the east coast of England. Coastal sand dunes are popular places for people to visit but this may affect the natural environment. Having studied the formation of sand dunes in class, the students wanted to find out more about their shape and the vegetation that grows on them. (a) Use the letters (A–E) to put the following statements in the correct order in the table to show the sequence of how sand dunes are formed. A: Sand is deposited around the obstacles to form an embryo dune. B: The onshore wind is slowed down by obstacles such as rocks and grass on the beach. C: Constructive waves deposit sand on the beach. D: Vegetation such as marram grass grows on the dunes helping to stabilise them. E: The onshore prevailing wind blows dried sand inland. order letter 1 2 3 4 5 [3] The students tested the following hypotheses. Hypothesis 1: The profile of sand dunes in the area matches a typical profile drawn in a textbook. Hypothesis 2: The type of vegetation growing on the sand dunes changes as distance from the sea increases. (b) To investigate both hypotheses, the students used a tape measure to mark out a transect line from the sea going across the beach and sand dunes. (i) Look at Fig. 2.1 (Insert). Identify the correct line for the students’ transect. Circle your answer below. A B C D [1] (ii) Give one reason why the line you have chosen is the correct line. ........................................................................................................................................... ..................................................................................................................................... [1] (c) To investigate Hypothesis 1, the students measured the changing angle of slope every 10 metres across the sand dunes inland from the sea. They used: • a tape measure • two ranging poles • a clinometer app on their phone. This is shown in Fig. 2.2 (Insert). Explain how the students used this equipment to measure the angle of slope. ................................................................................................................................................... ................................................................................................................................................... ................................................................................................................................................... ................................................................................................................................................... ................................................................................................................................................... ................................................................................................................................................... ................................................................................................................................................... ............................................................................................................................................. [4] (d) One student used their results to draw the profile shown in Fig. 2.3. (i) Complete the student’s profile by joining the points between 140 and 180 m from the sea on Fig. 2.3. [1] (ii) Shade in the sand dunes on Fig. 2.3. [1] (iii) The students compared their profile in Fig. 2.3 with a textbook profile shown in Fig. 2.4 (Insert). They decided that Hypothesis 1: The profile of sand dunes in the area matches a typical profile drawn in a textbook was partly true. Support this conclusion by referring to similarities and differences between the student’s profile (Fig. 2.3) and the textbook profile (Fig. 2.4). ........................................................................................................................................... ........................................................................................................................................... ........................................................................................................................................... ........................................................................................................................................... ........................................................................................................................................... ..................................................................................................................................... [3] (m) sea from 2.3 Fig.distance
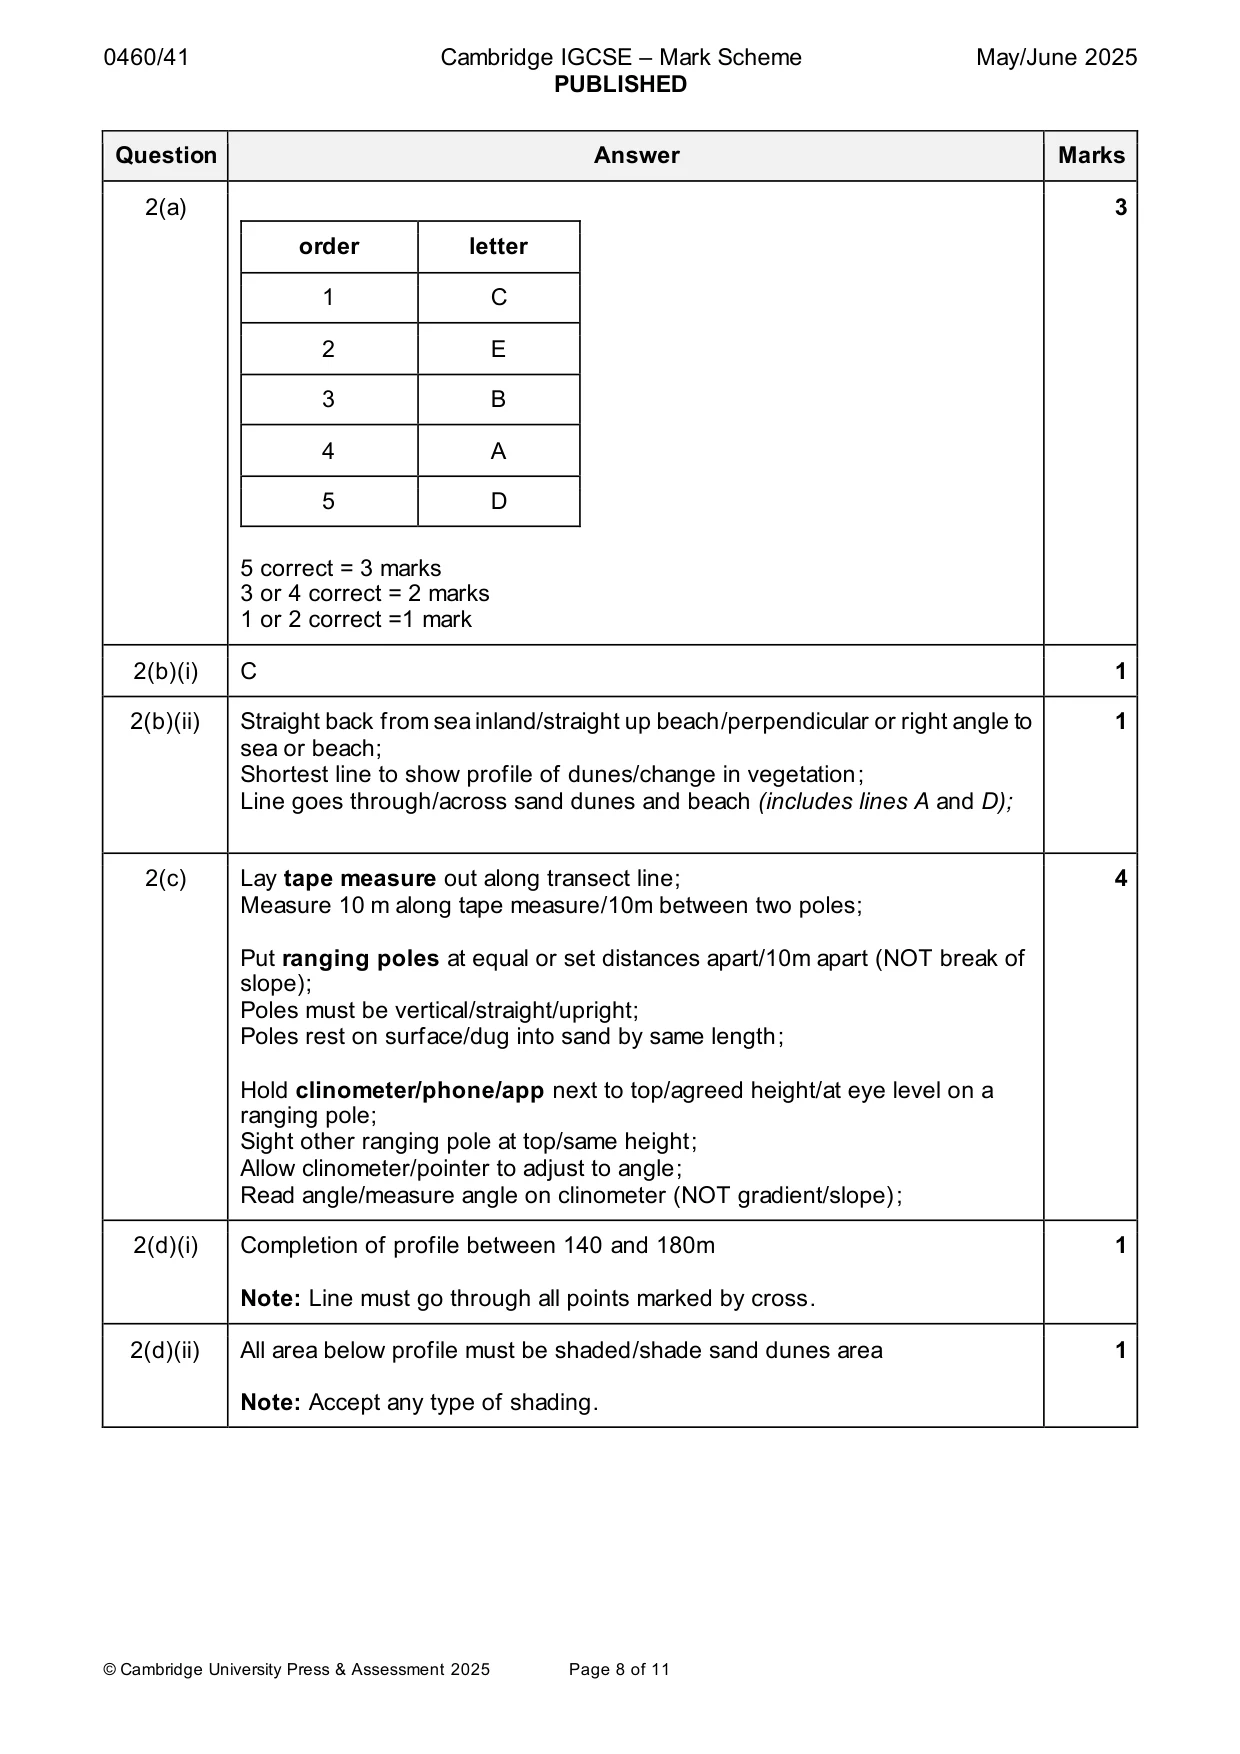
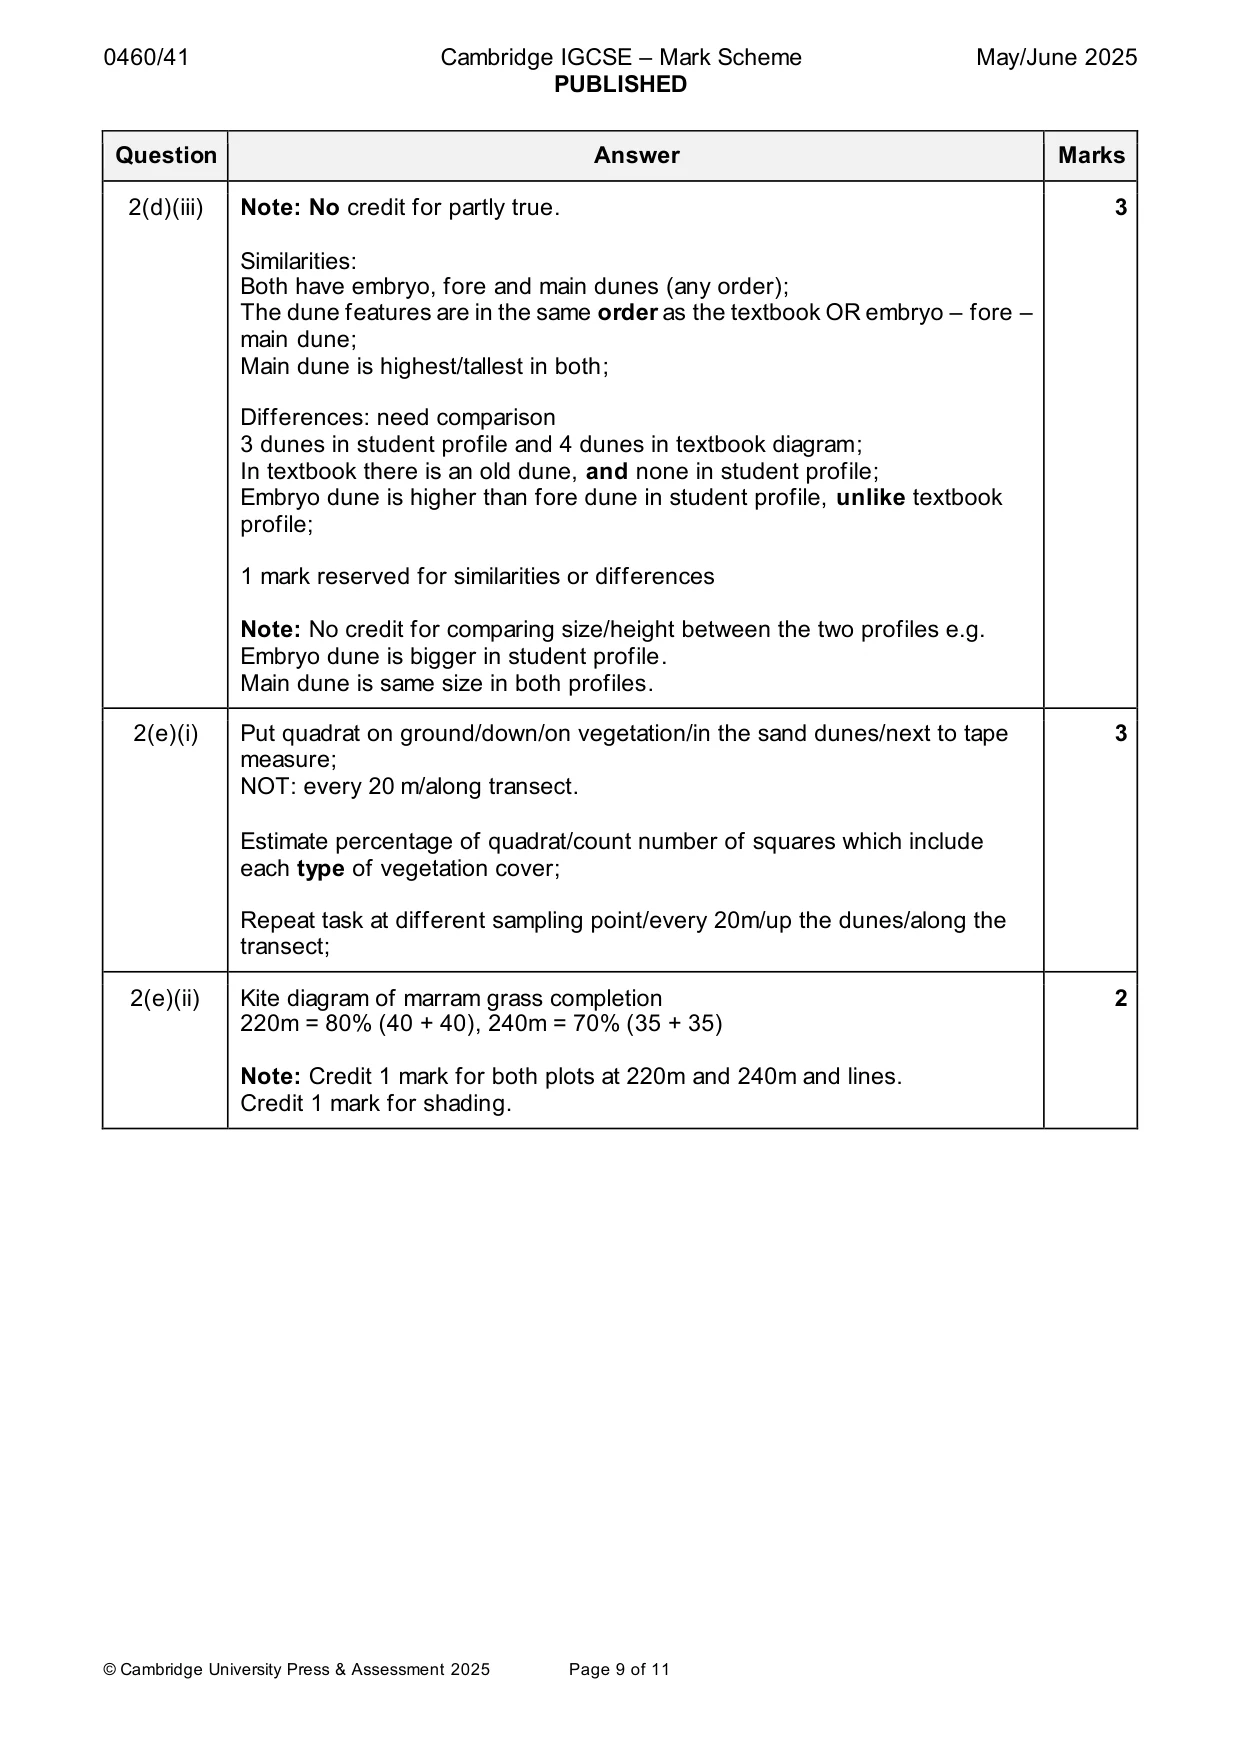
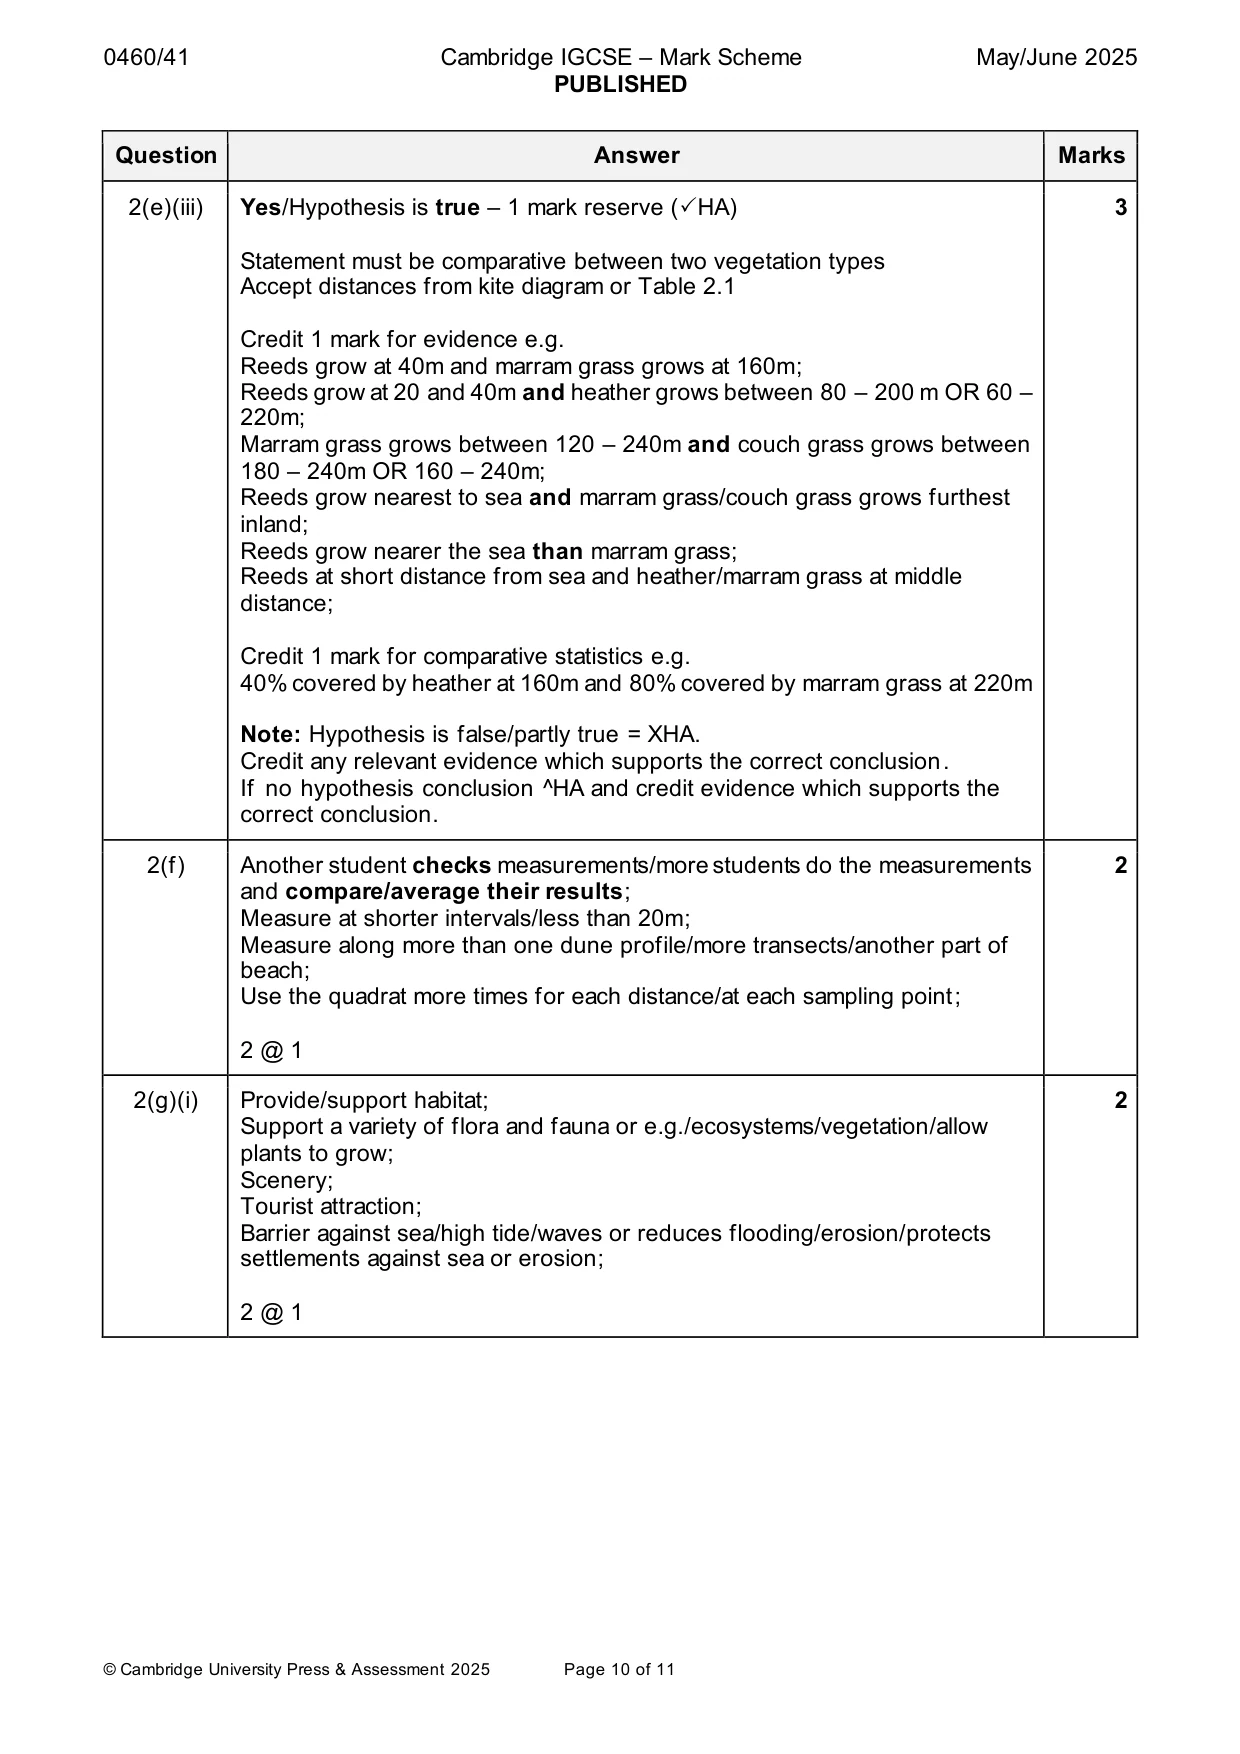
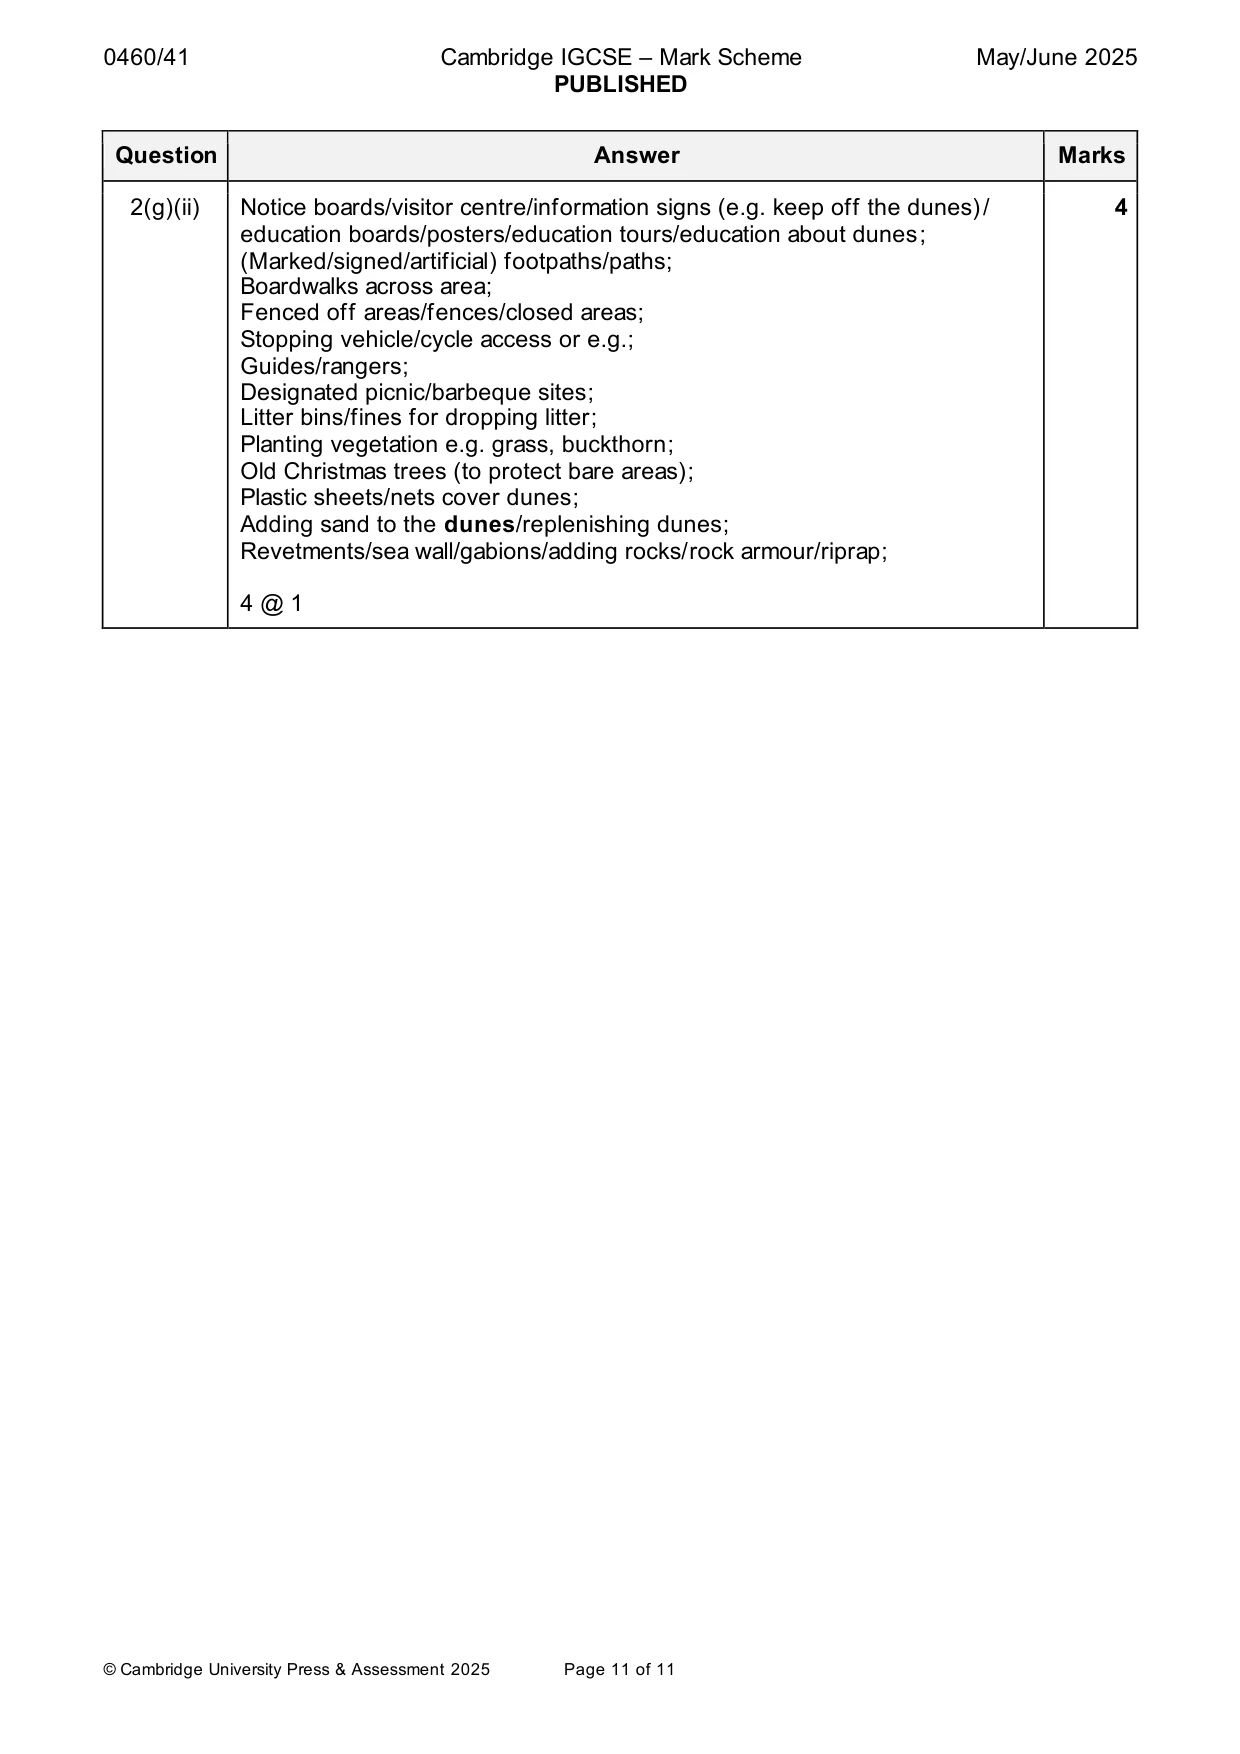
Mark scheme: 2(a) 3 order letter 1 C 2 E 3 B 4 A 5 D 5 correct = 3 marks 3 or 4 correct = 2 marks 1 or 2 correct =1 mark 2(b)(i) C 1 2(b)(ii) Straight back from sea inland/straight up beach/perpendicular or right angle to 1 sea or beach; Shortest line to show profile of dunes/change in vegetation; Line goes through/across sand dunes and beach (includes lines A and D); 2(c) Lay tape measure out along transect line; 4 Measure 10 m along tape measure/10m between two poles; Put ranging poles at equal or set distances apart/10m apart (NOT break of slope); Poles must be vertical/straight/upright; Poles rest on surface/dug into sand by same length; Hold clinometer/phone/app next to top/agreed height/at eye level on a ranging pole; Sight other ranging pole at top/same height; Allow clinometer/pointer to adjust to angle; Read angle/measure angle on clinometer (NOT gradient/slope); 2(d)(i) Completion of profile between 140 and 180m 1 Note: Line must go through all points marked by cross. 2(d)(ii) All area below profile must be shaded/shade sand dunes area 1 Note: Accept any type of shading. 2(d)(iii) Note: No credit for partly true. 3 Similarities: Both have embryo, fore and main dunes (any order); The dune features are in the same order as the textbook OR embryo – fore – main dune; Main dune is highest/tallest in both; Differences: need comparison 3 dunes in student profile and 4 dunes in textbook diagram; In textbook there is an old dune, and none in student profile; Embryo dune is higher than fore dune in student profile, unlike textbook profile; 1 mark reserved for similarities or differences Note: No credit for comparing size/height between the two profiles e.g. Embryo dune is bigger in student profile. Main dune is same size in both profiles. 2(e)(i) Put quadrat on ground/down/on vegetation/in the sand dunes/next to tape 3 measure; NOT: every 20 m/along transect. Estimate percentage of quadrat/count number of squares which include each type of vegetation cover; Repeat task at different sampling point/every 20m/up the dunes/along the transect; 2(e)(ii) Kite diagram of marram grass completion 2 220m = 80% (40 + 40), 240m = 70% (35 + 35) Note: Credit 1 mark for both plots at 220m and 240m and lines. Credit 1 mark for shading. 2(e)(iii) Yes/Hypothesis is true – 1 mark reserve (HA) 3 Statement must be comparative between two vegetation types Accept distances from kite diagram or Table 2.1 Credit 1 mark for evidence e.g. Reeds grow at 40m and marram grass grows at 160m; Reeds grow at 20 and 40m and heather grows between 80 – 200 m OR 60 – 220m; Marram grass grows between 120 – 240m and couch grass grows between 180 – 240m OR 160 – 240m; Reeds grow nearest to sea and marram grass/couch grass grows furthest inland; Reeds grow nearer the sea than marram grass; Reeds at short distance from sea and heather/marram grass at middle distance; Credit 1 mark for comparative statistics e.g. 40% covered by heather at 160m and 80% covered by marram grass at 220m Note: Hypothesis is false/partly true = XHA. Credit any relevant evidence which supports the correct conclusion. If no hypothesis conclusion ^HA and credit evidence which supports the correct conclusion. 2(f) Another student checks measurements/more students do the measurements 2 and compare/average their results; Measure at shorter intervals/less than 20m; Measure along more than one dune profile/more transects/another part of beach; Use the quadrat more times for each distance/at each sampling point; 2 @ 1 2(g)(i) Provide/support habitat; 2 Support a variety of flora and fauna or e.g./ecosystems/vegetation/allow plants to grow; Scenery; Tourist attraction; Barrier against sea/high tide/waves or reduces flooding/erosion/protects settlements against sea or erosion; 2 @ 1 2(g)(ii) Notice boards/visitor centre/information signs (e.g. keep off the dunes)/ 4 education boards/posters/education tours/education about dunes; (Marked/signed/artificial) footpaths/paths; Boardwalks across area; Fenced off areas/fences/closed areas; Stopping vehicle/cycle access or e.g.; Guides/rangers; Designated picnic/barbeque sites; Litter bins/fines for dropping litter; Planting vegetation e.g. grass, buckthorn; Old Christmas trees (to protect bare areas); Plastic sheets/nets cover dunes; Adding sand to the dunes/replenishing dunes; Revetments/sea wall/gabions/adding rocks/rock armour/riprap; 4 @ 1
What was in this paper
The subtopics covered by these 2 questions, and how many questions each got. Open one in a new tab to see every Cambridge question on it.
What you needed in this session
Cambridge’s own grade thresholds for 2025 May/June, Paper 4 · Variant 1. A higher threshold means an easier paper — the bar moves with how the cohort did.