Cambridge IGCSE Geography 0460 — 2025 Oct/Nov Paper 2 · Variant 1
0460/21/O/N/25 · 4 questions · 60 marks · 90 min
The question paper and its mark scheme, free to read here and free to download. This is Cambridge’s own paper, exactly as it was sat.
Question paper20 pages
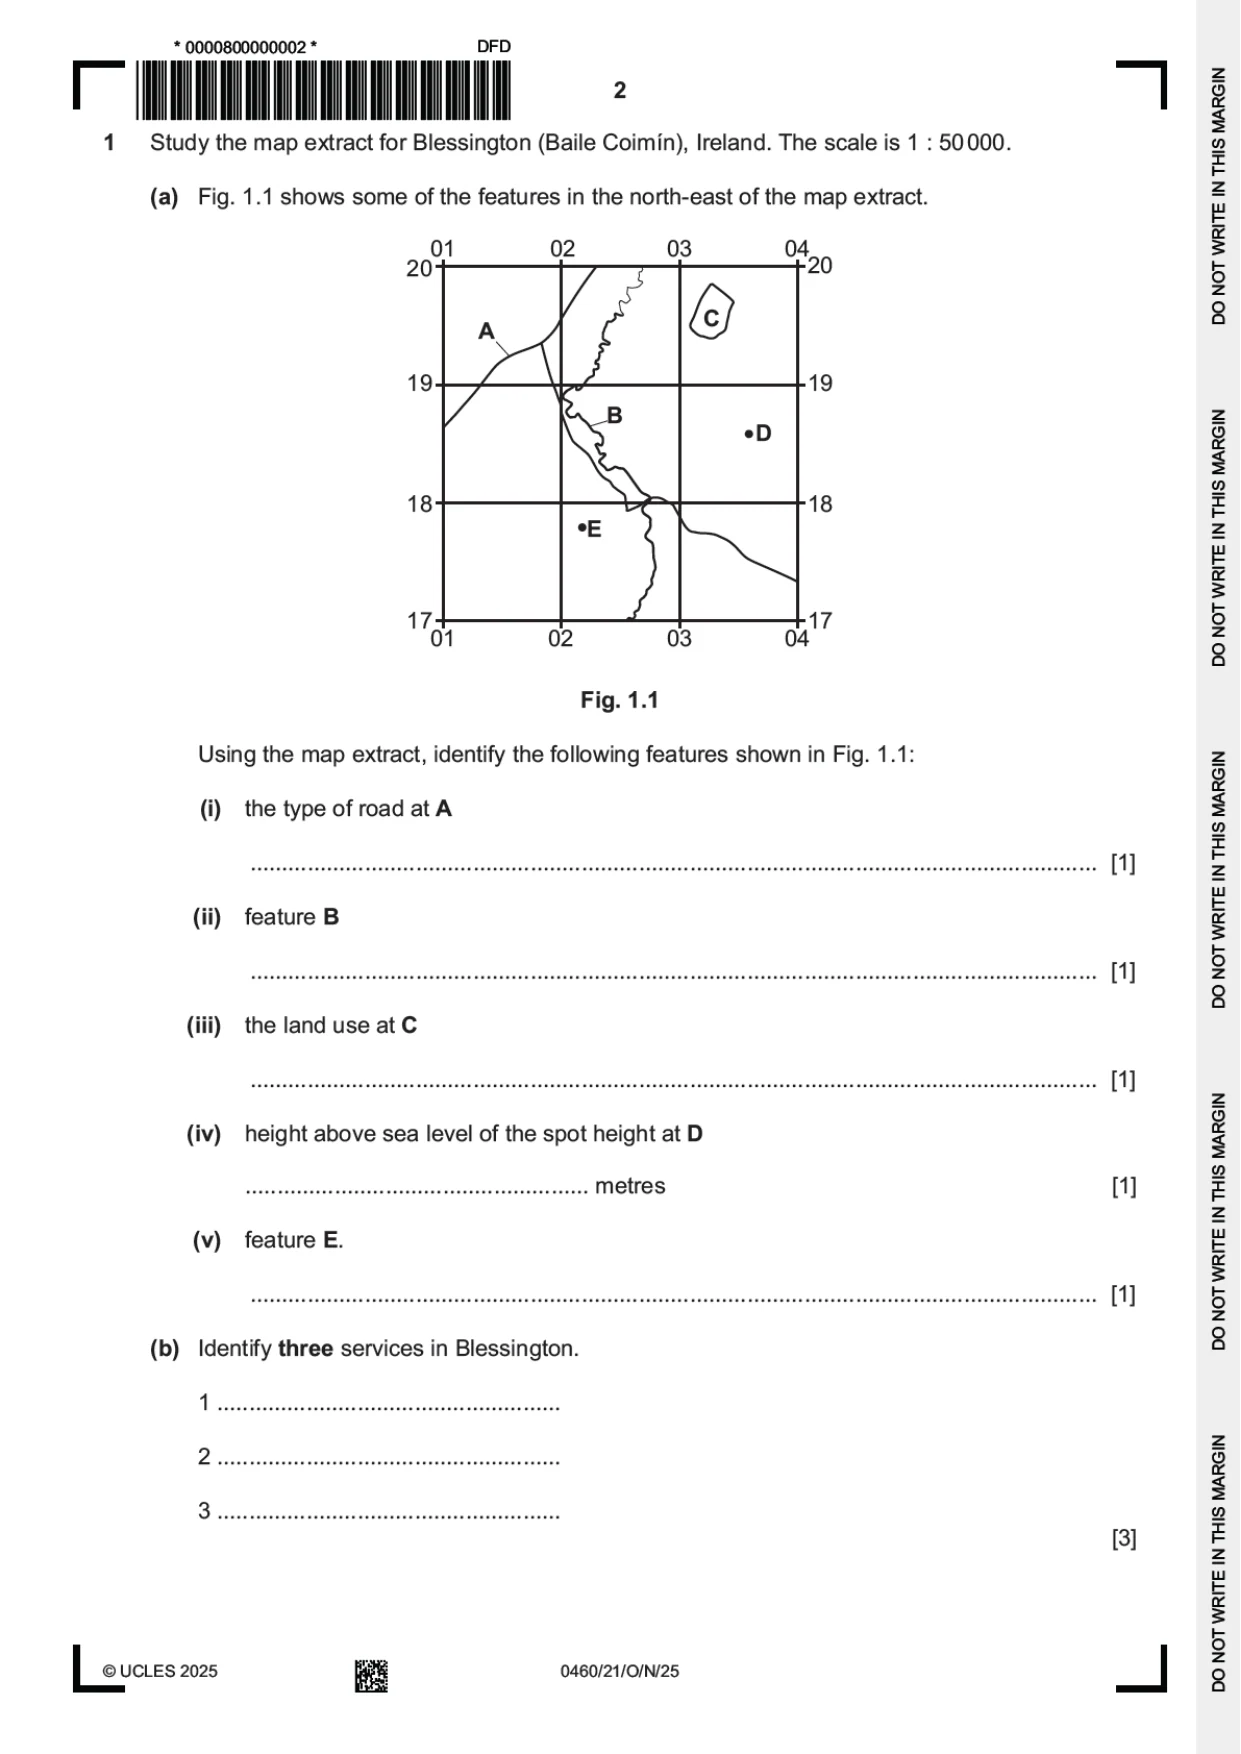
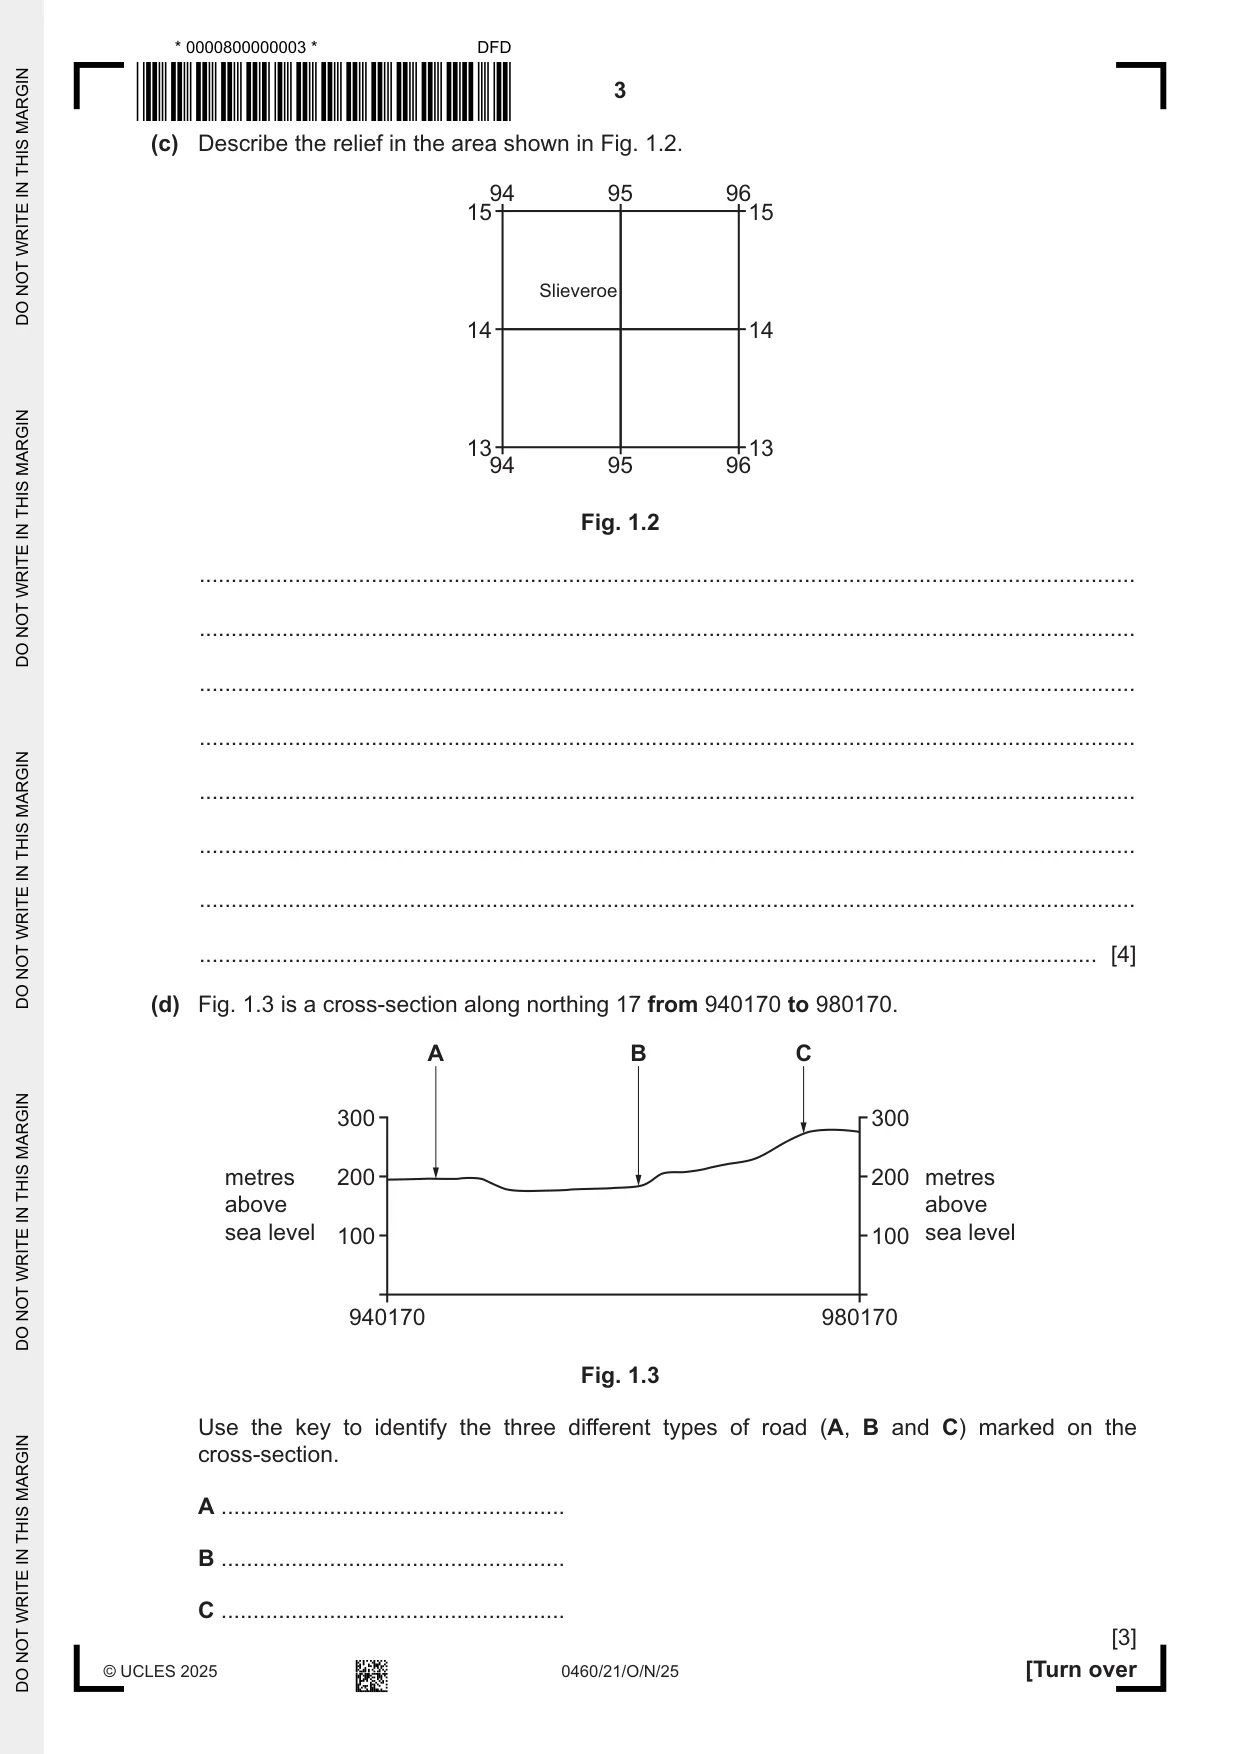
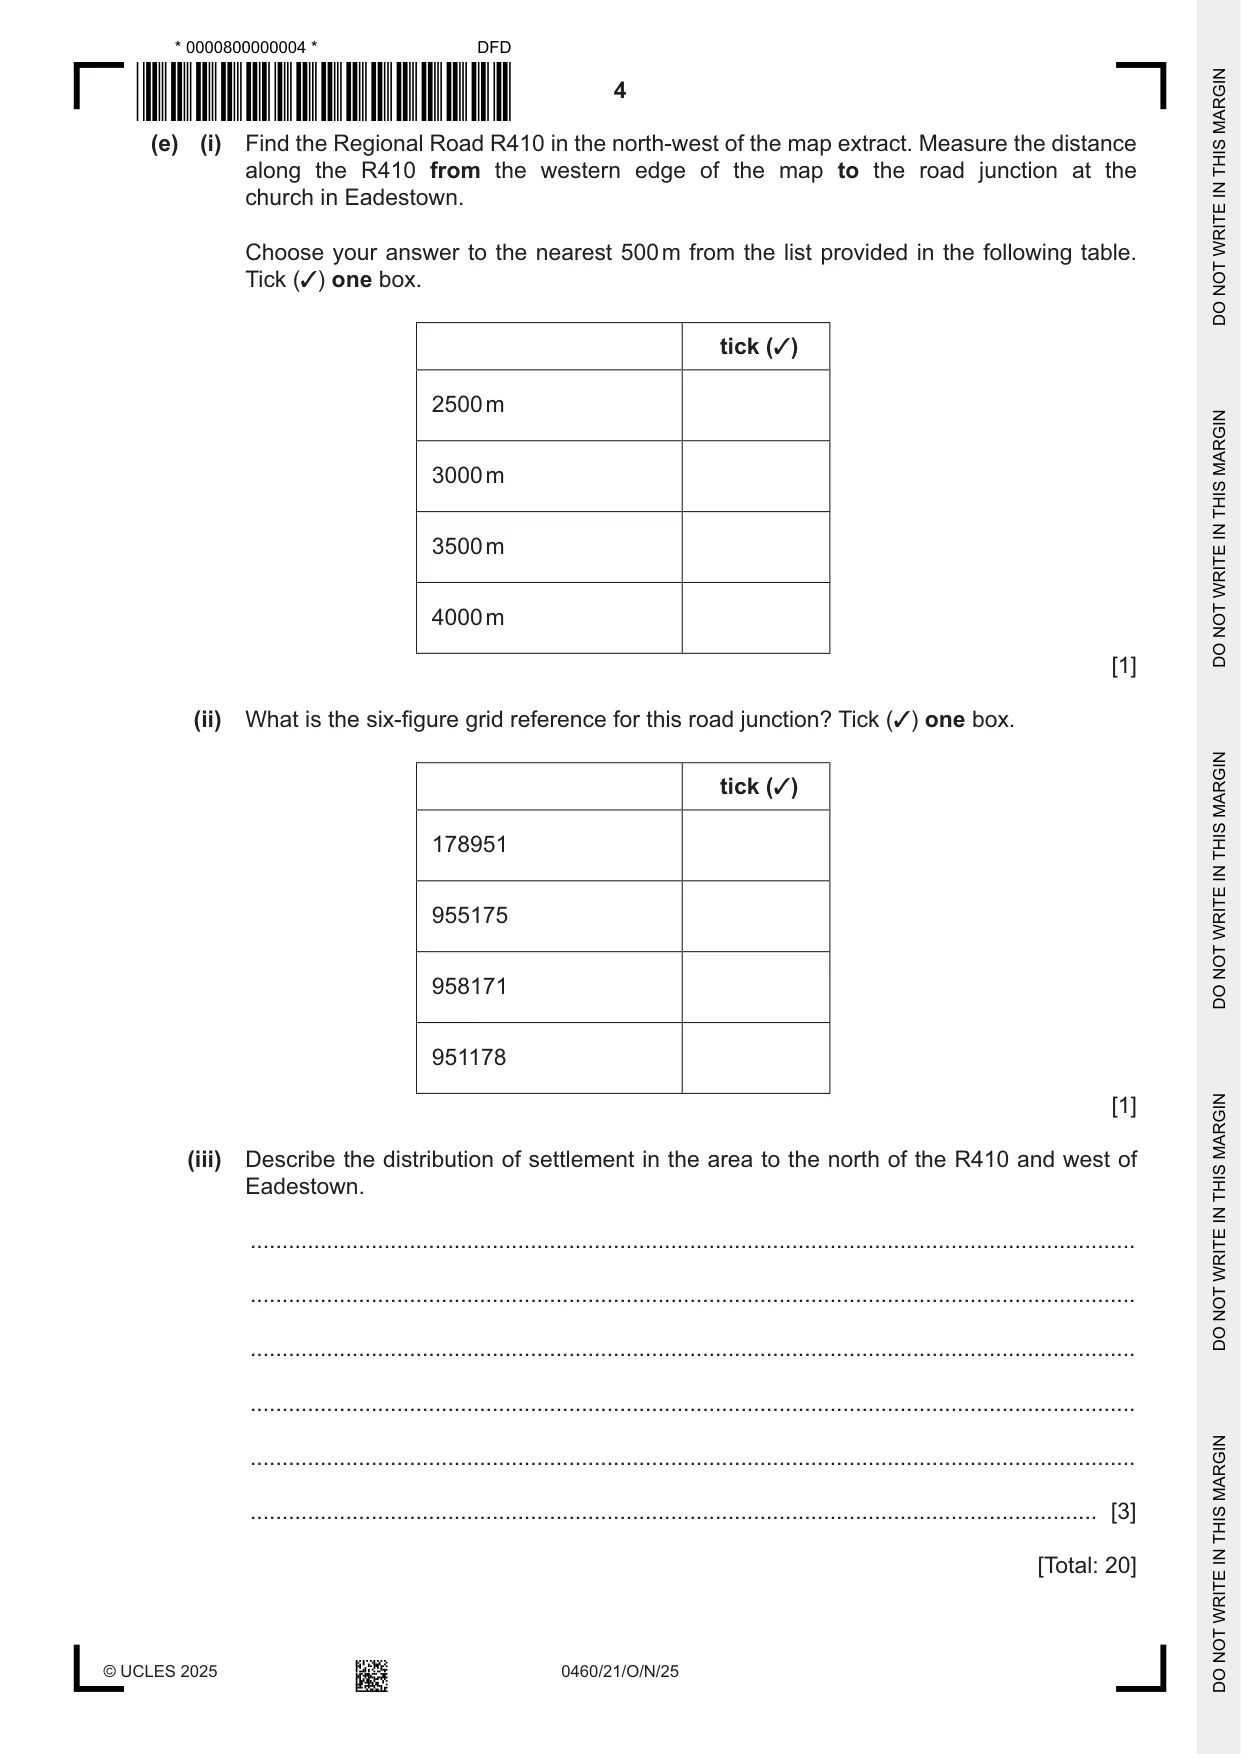





Mark scheme8 pages
Answers below. Sit the paper first if you are practising.
Questions as text
Q2 · The climate of the Atacama hot desert in Chile
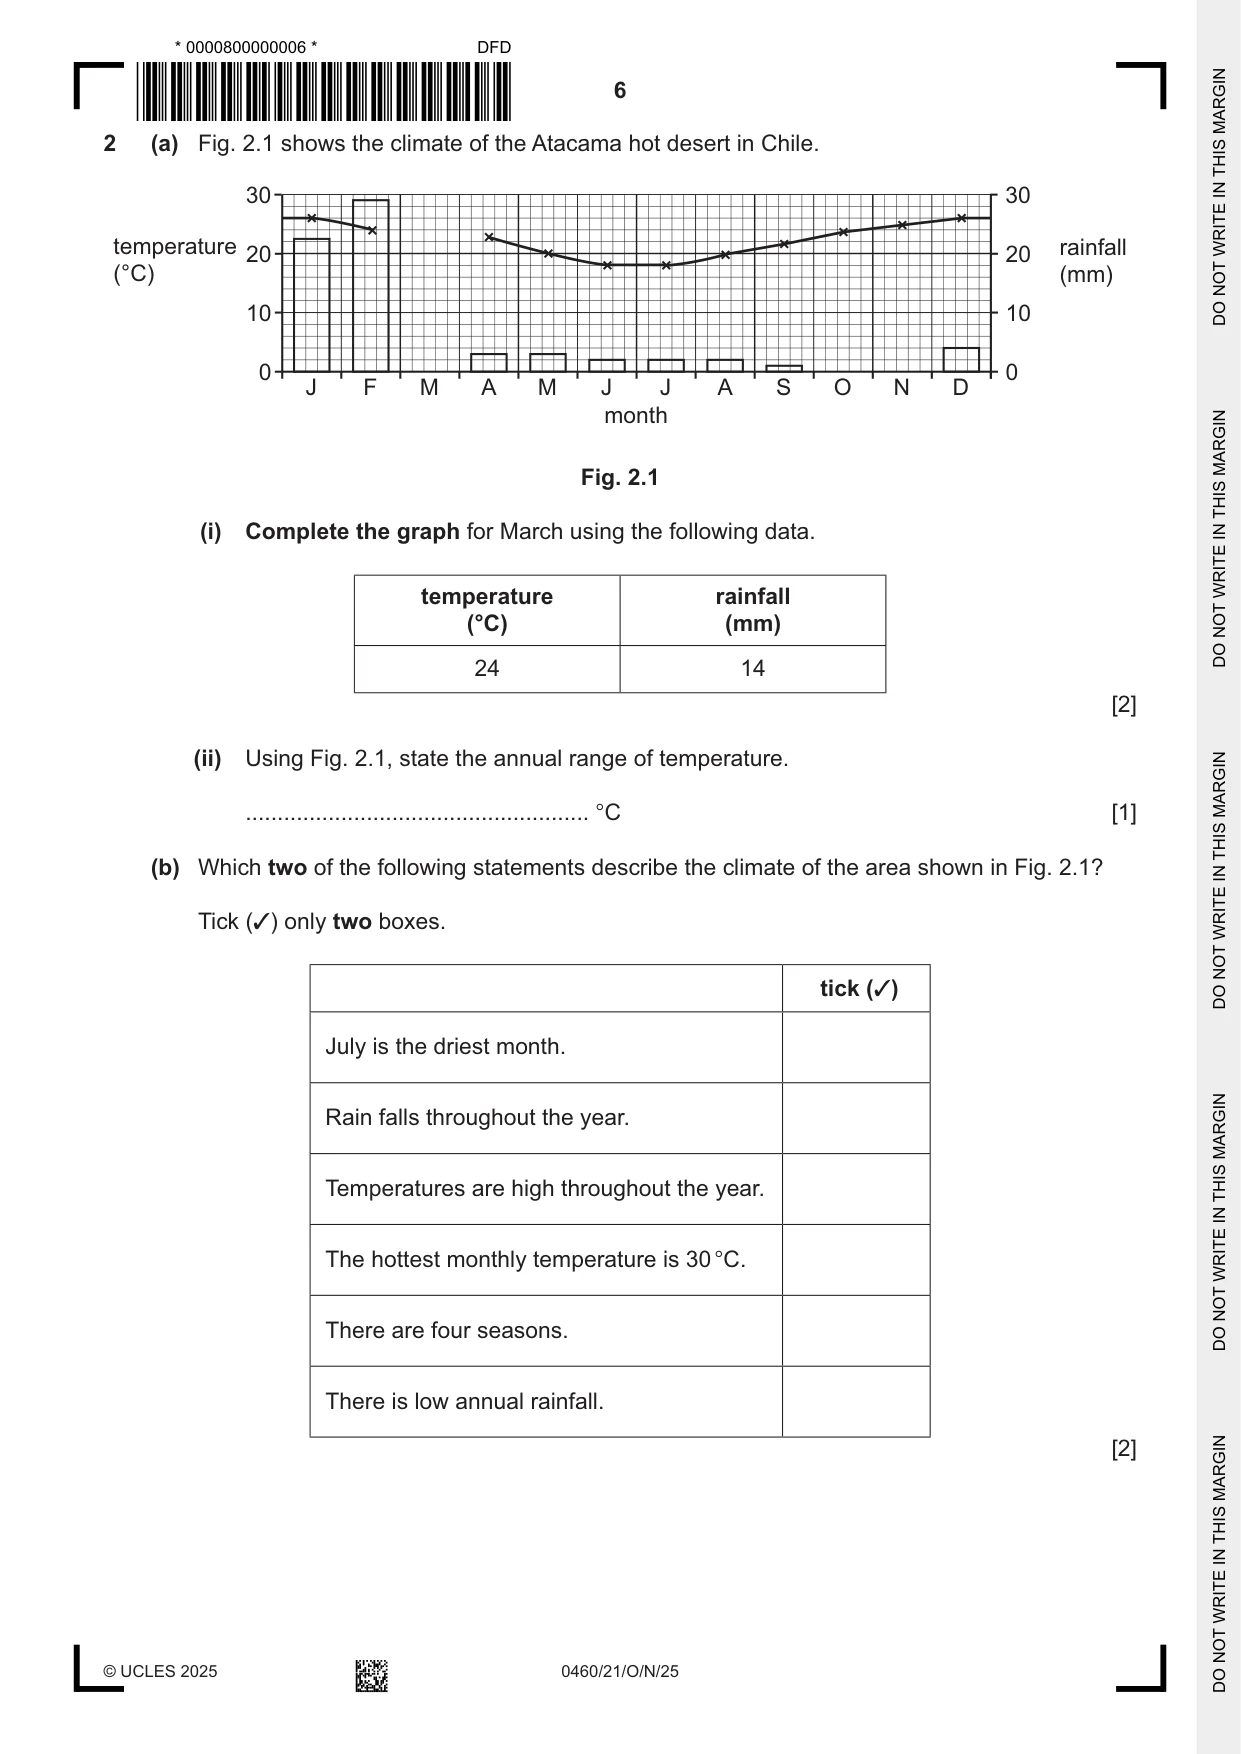
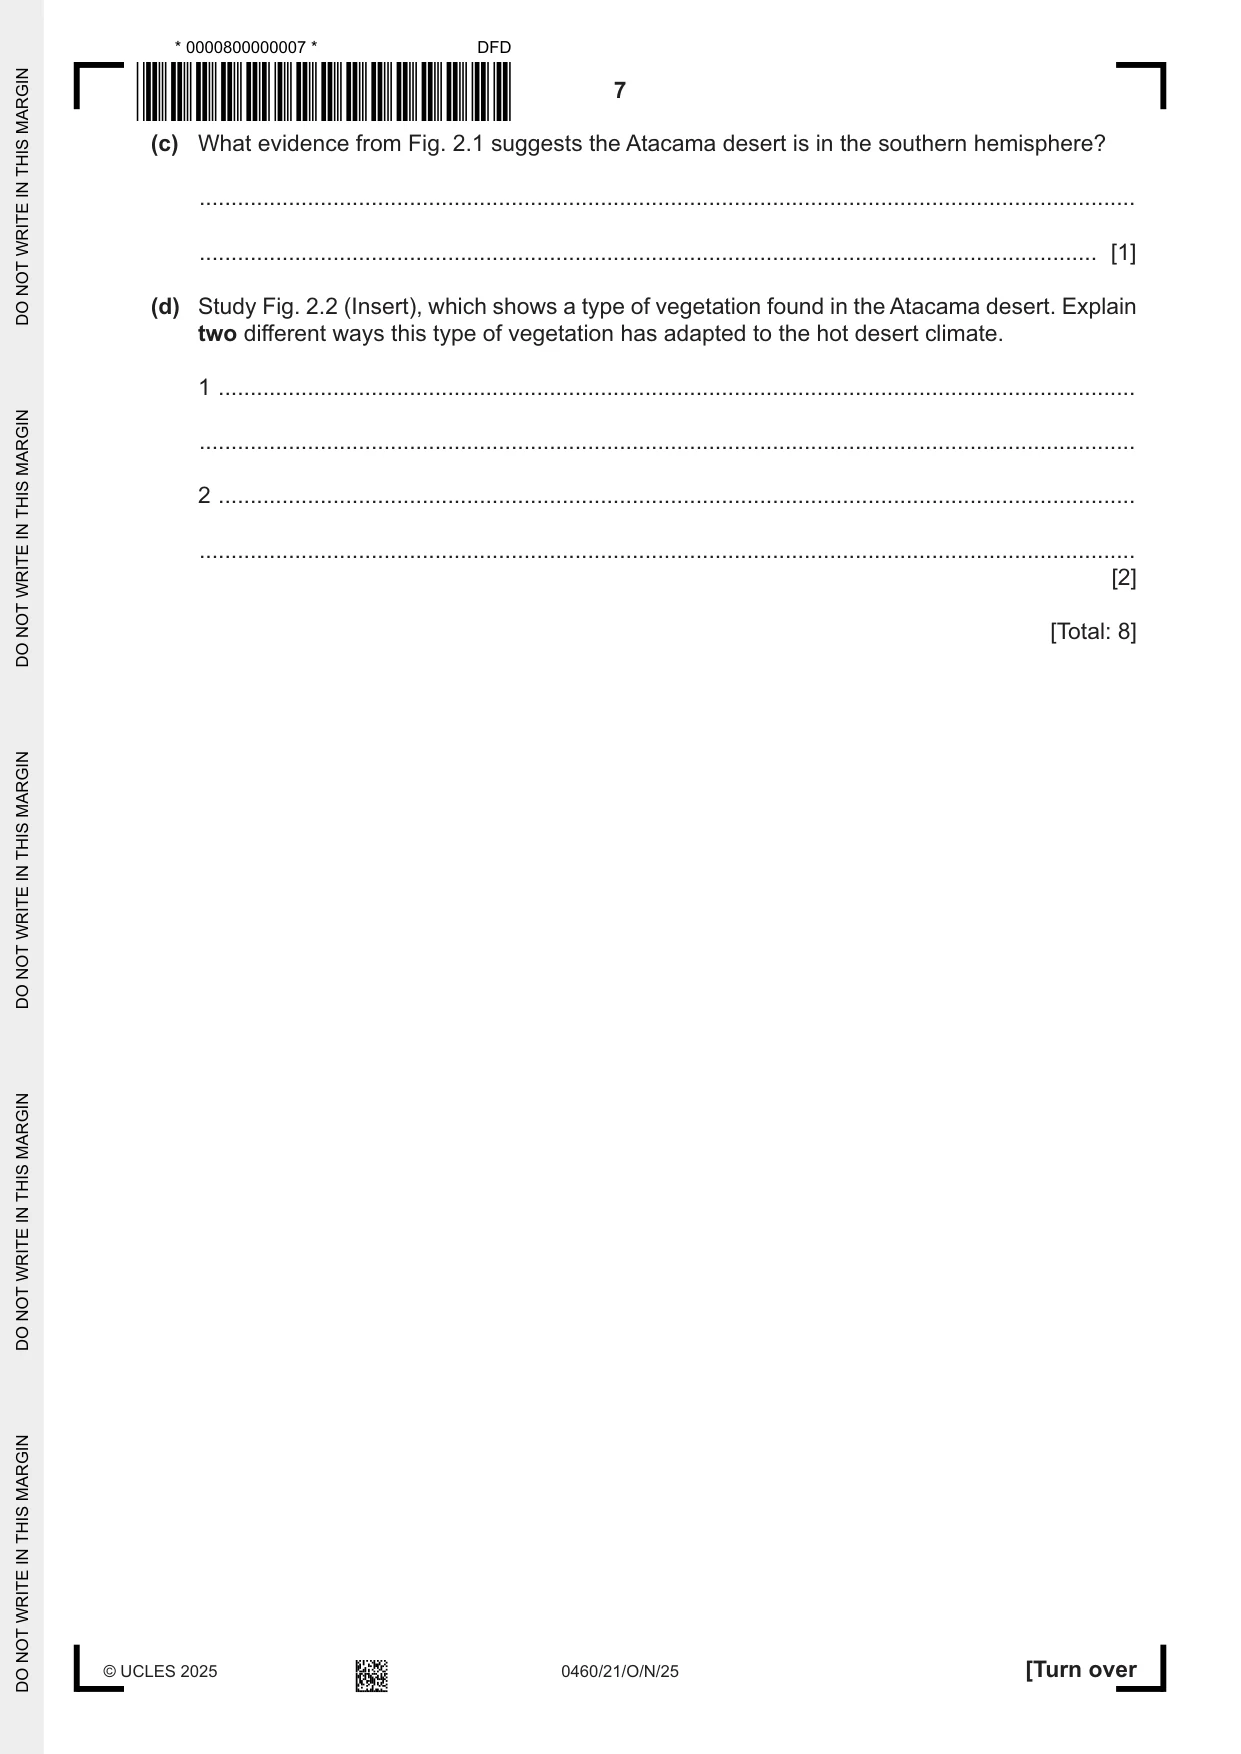
2 (a) Fig. 2.1 shows the climate of the Atacama hot desert in Chile. 30 30 temperature rainfall 20 20 (°C) (mm) 10 10 0 0 J F M A M J J A S O N D month Fig. 2.1 (i) Complete the graph for March using the following data. temperature rainfall (°C) (mm) 24 14 [2] (ii) Using Fig. 2.1, state the annual range of temperature. ...................................................... °C [1] (b) Which two of the following statements describe the climate of the area shown in Fig. 2.1? Tick (✓) only two boxes. tick (✓) July is the driest month. Rain falls throughout the year. Temperatures are high throughout the year. The hottest monthly temperature is 30 °C. There are four seasons. There is low annual rainfall. [2] (c) What evidence from Fig. 2.1 suggests the Atacama desert is in the southern hemisphere? ................................................................................................................................................... ............................................................................................................................................. [1] (d) Study Fig. 2.2 (Insert), which shows a type of vegetation found in the Atacama desert. Explain two different ways this type of vegetation has adapted to the hot desert climate. 1 ................................................................................................................................................ ................................................................................................................................................... 2 ................................................................................................................................................ ................................................................................................................................................... [2] [Total: 8]
Mark scheme: 2(a)(i) temperature dot/cross at 24 °C and line joined 2 rainfall bar to 14 mm 2(a)(ii) 8 °C 1 2(b) Temperatures are high throughout the year. 2 There is low annual rainfall. 2(c) high(er) temperatures at beginning and end of year/October – April/highest 1 December and January low(er) temperatures in middle of year/May - September/lowest June and July Credit any three consecutive months within October – April or within May – September. 2(d) stores water in thick stem/large body/fleshy body 2 spines/spikes/thorns/no leaves reduce evaporation/transpiration widely spaced to reduce competition for water green stems to photosynthesise short/low level to protect from wind
Question 3
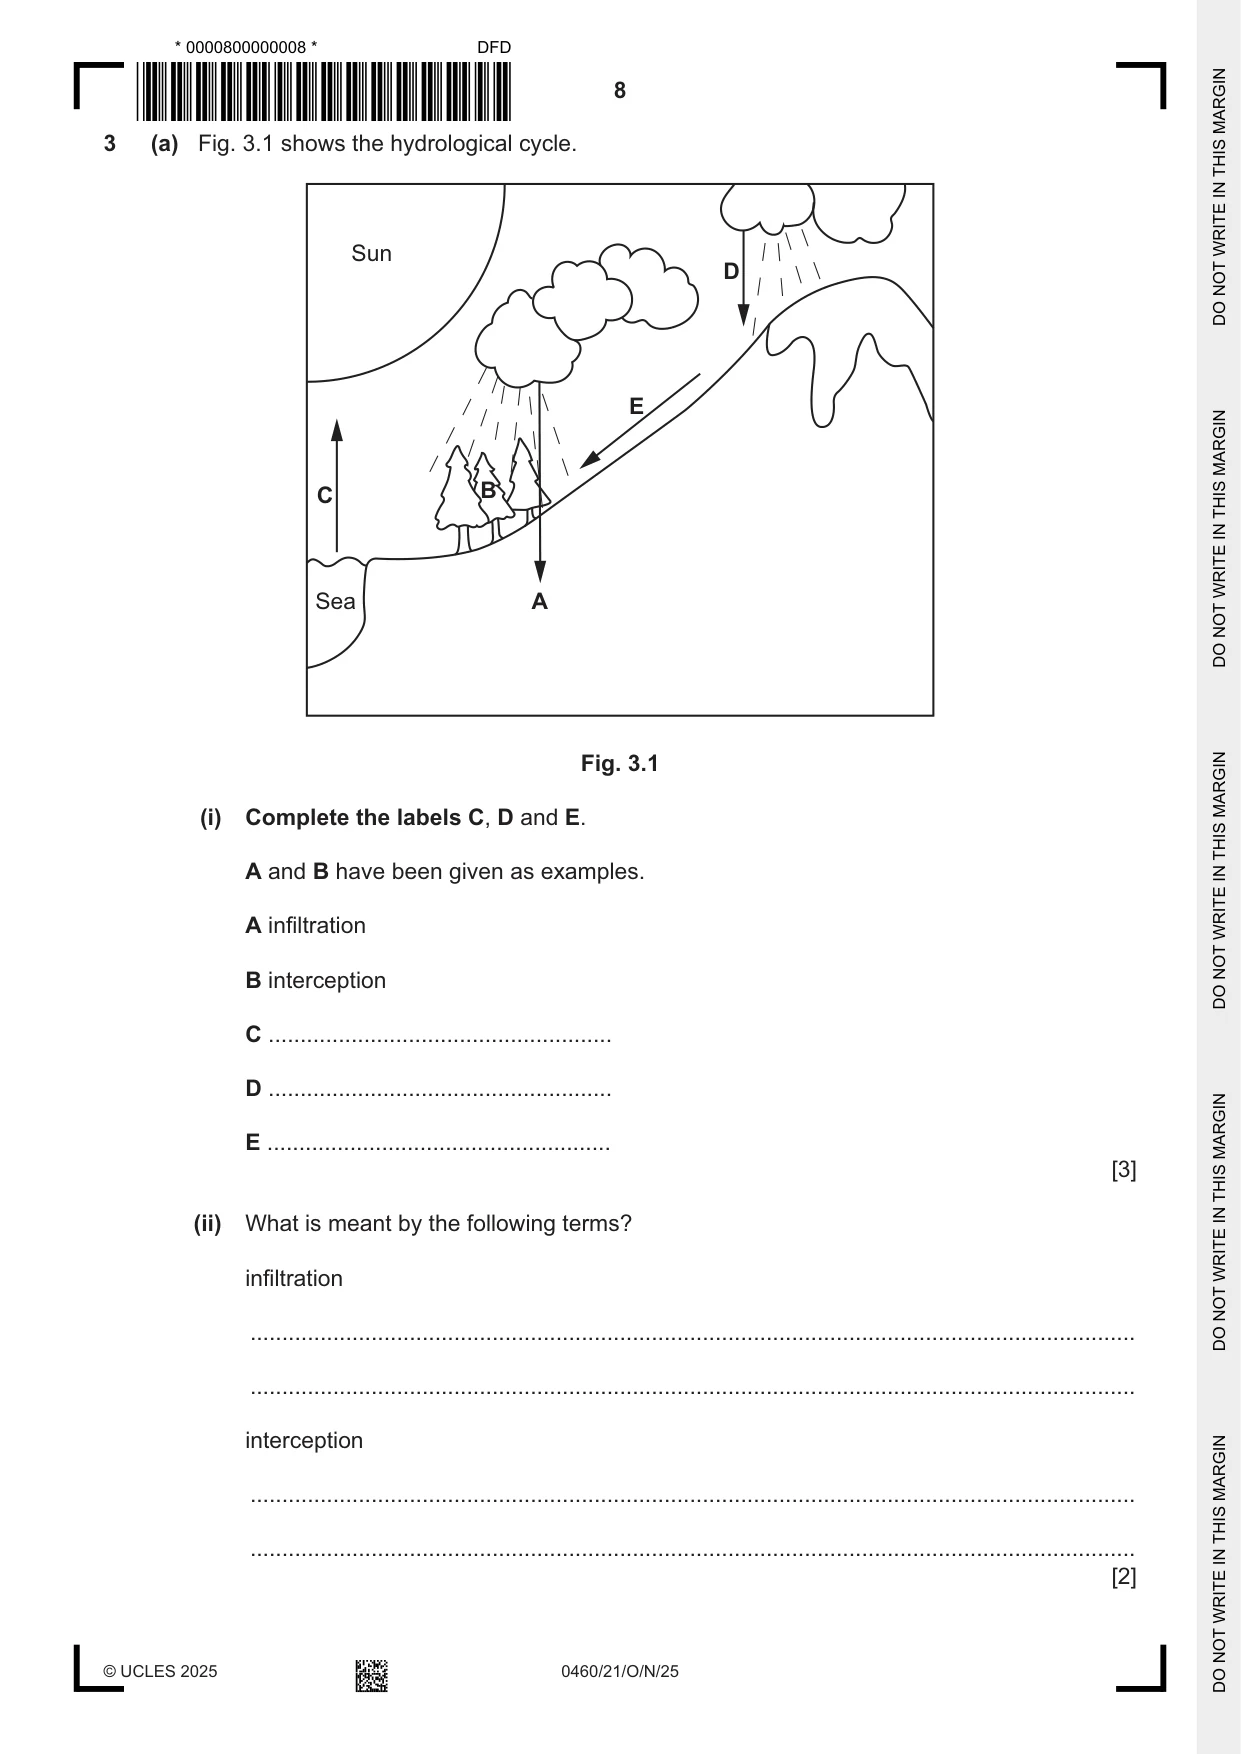
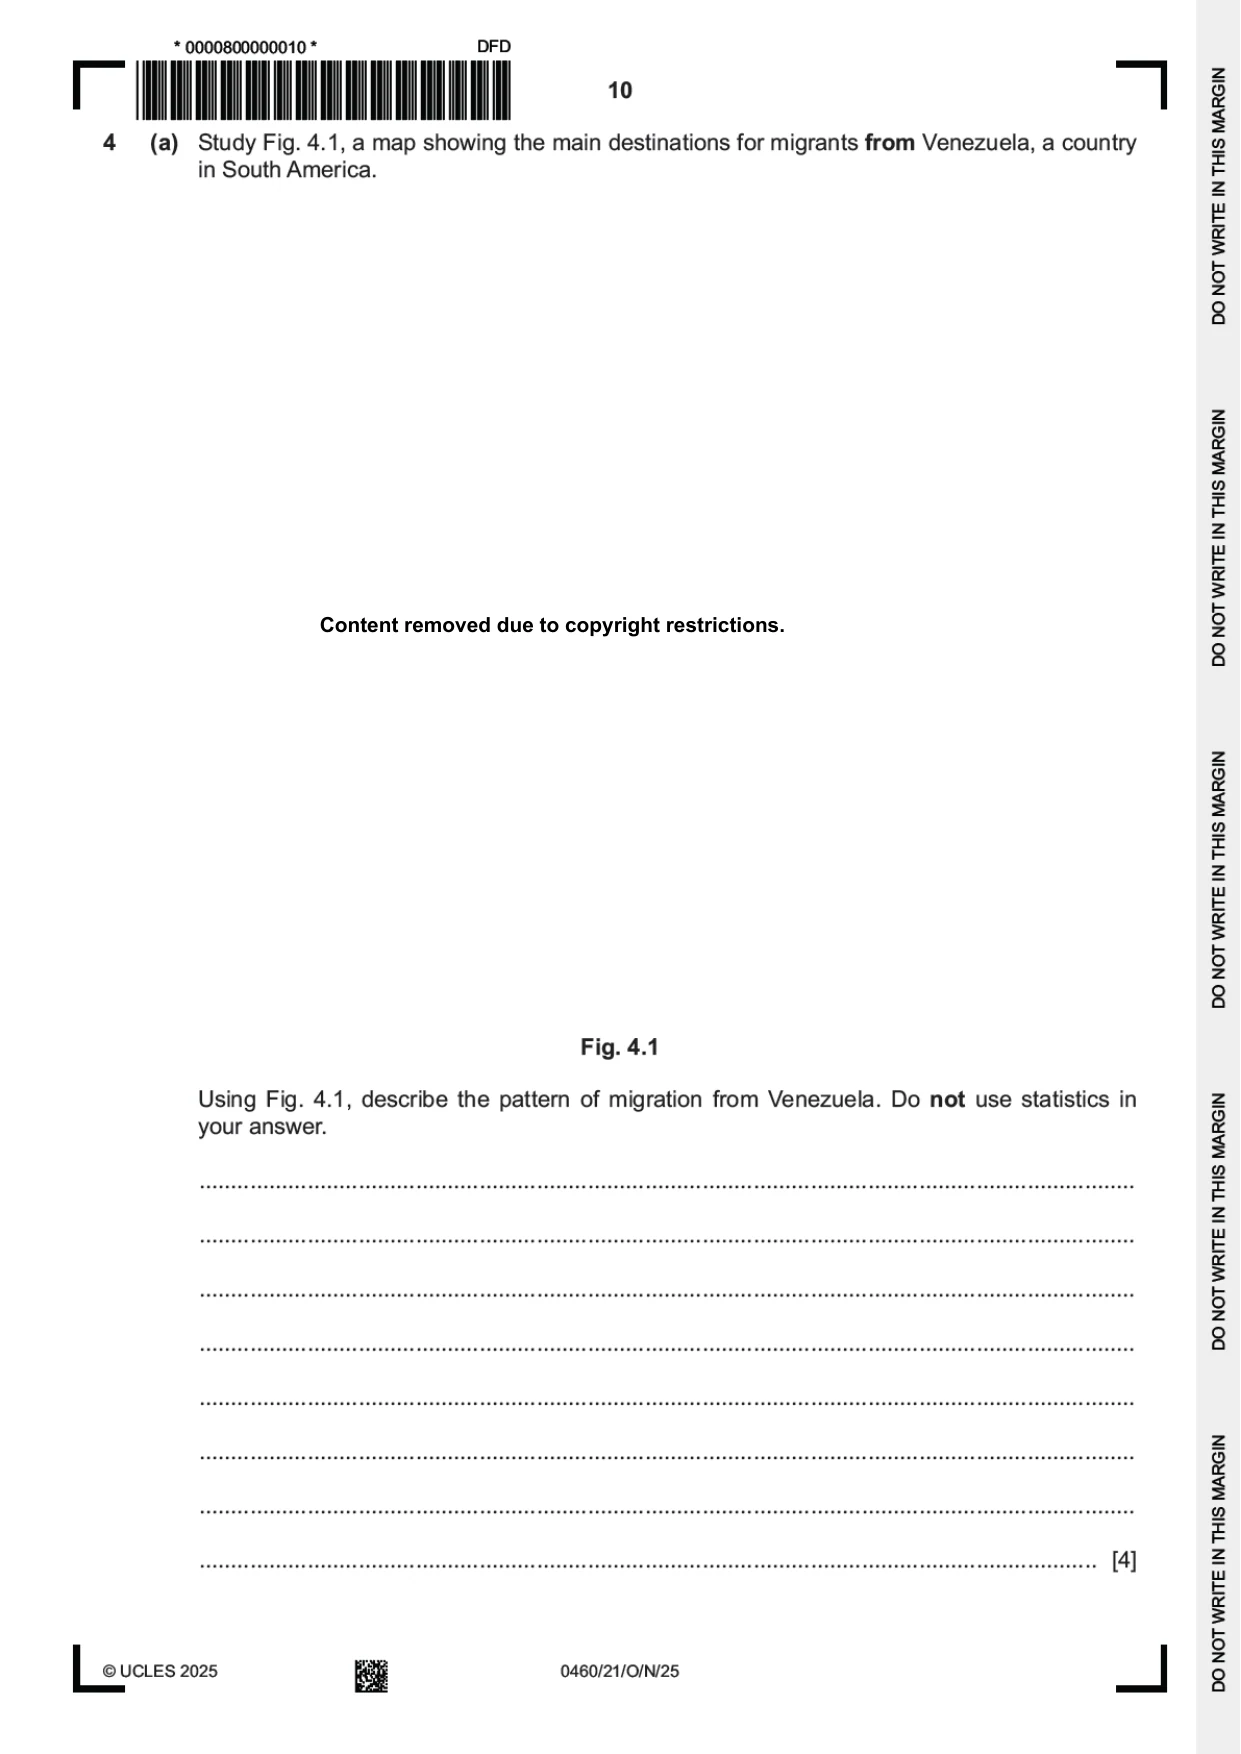
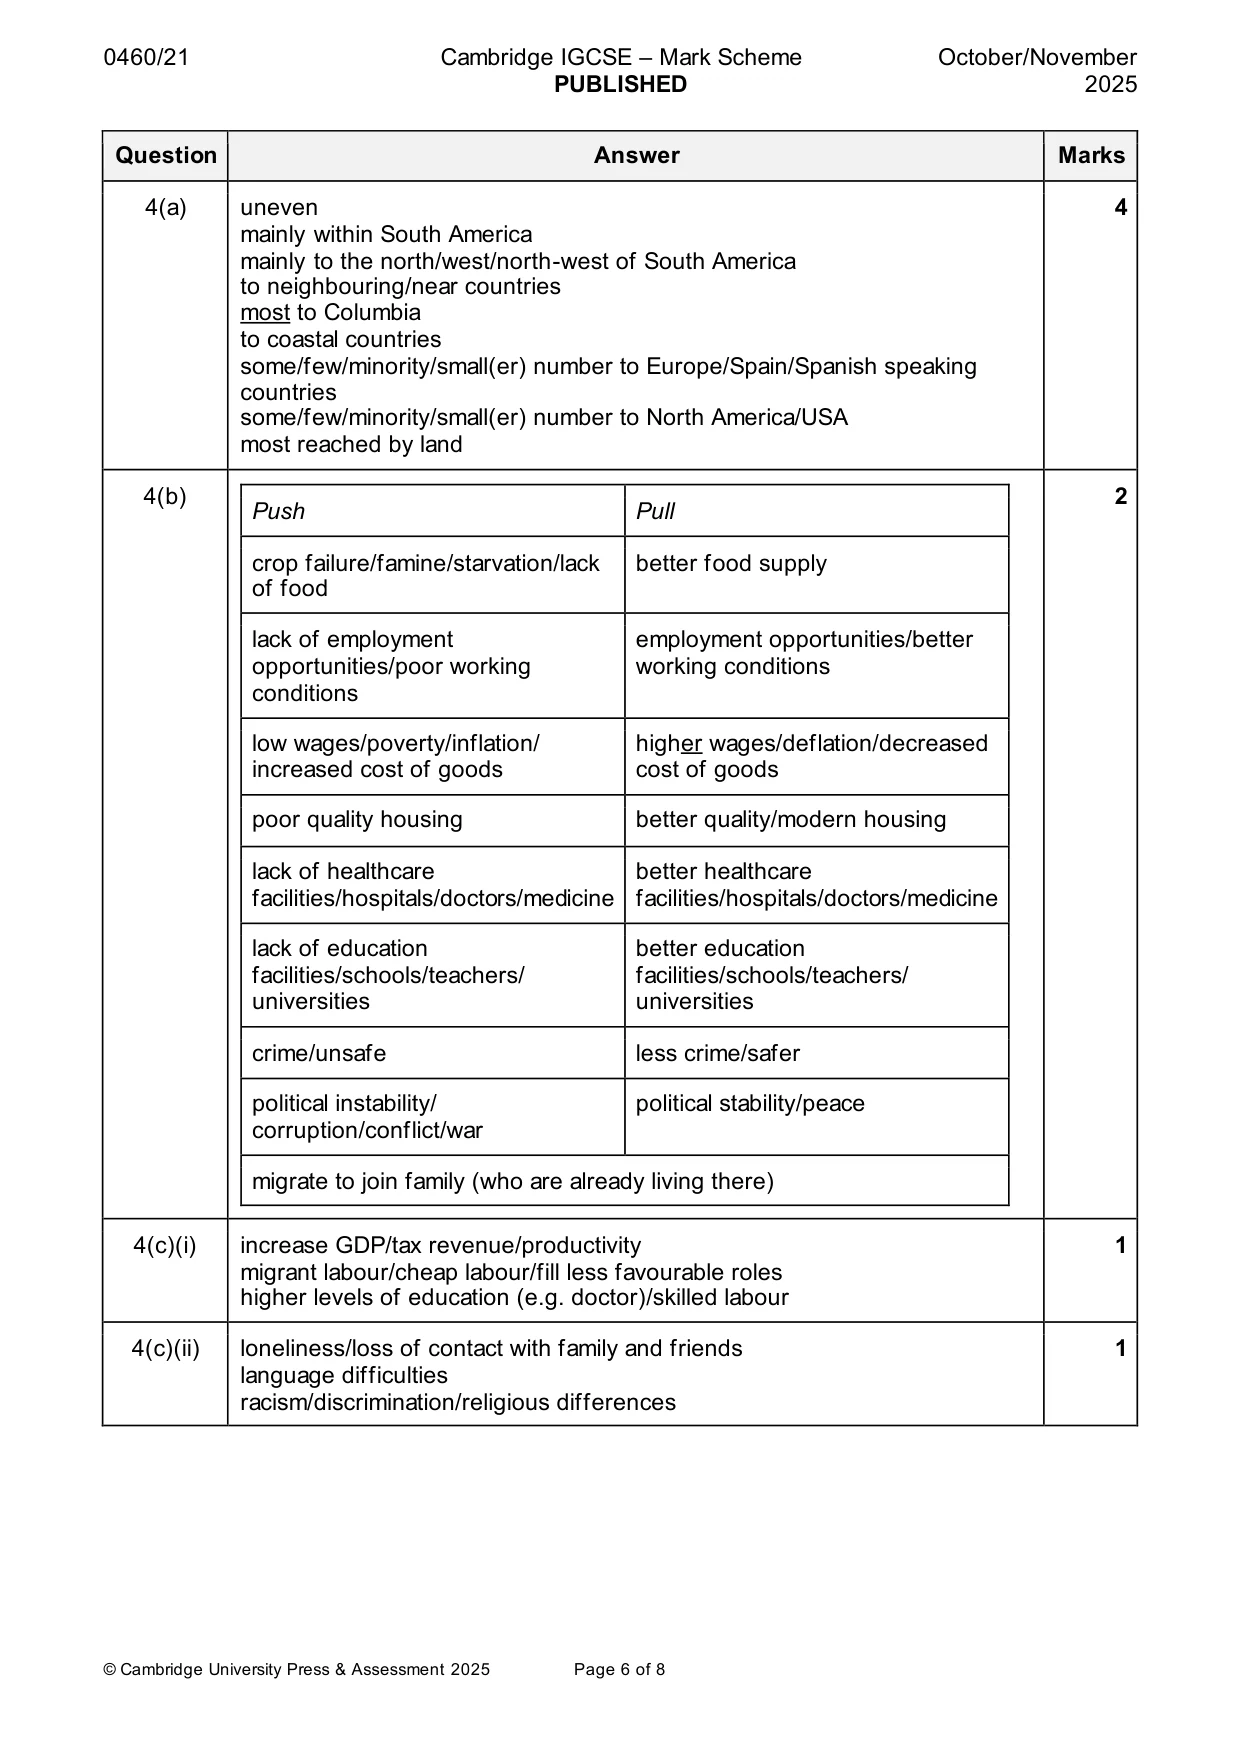
3 (a) Fig. 3.1 shows the hydrological cycle. Sun D E C B Sea A Fig. 3.1 (i) Complete the labels C, D and E. A and B have been given as examples. A infiltration B interception C ...................................................... D ...................................................... E ...................................................... [3] (ii) What is meant by the following terms? infiltration ........................................................................................................................................... ........................................................................................................................................... interception ........................................................................................................................................... ........................................................................................................................................... [2] (b) (i) Explain how deforestation disrupts the hydrological cycle. ........................................................................................................................................... ........................................................................................................................................... ........................................................................................................................................... ..................................................................................................................................... [2] (ii) Suggest another way that people can disrupt the hydrological cycle. ........................................................................................................................................... ..................................................................................................................................... [1] [Total: 8] Content removed due to copyright restrictions. (b) Suggest two reasons why people such as those from Venezuela may migrate. 1 ................................................................................................................................................ ................................................................................................................................................... 2 ................................................................................................................................................ ................................................................................................................................................... [2] (c) (i) Suggest one economic opportunity that migrants can bring to the country they have moved to. ........................................................................................................................................... ..................................................................................................................................... [1] (ii) Suggest one social problem that migrants may experience in the country they have moved to. ........................................................................................................................................... ..................................................................................................................................... [1] [Total: 8]
Mark scheme: 3(a)(i) C – evaporation 3 D – precipitation/rain(fall) E – overland flow/(surface) run-off 3(a)(ii) Infiltration 2 water enters/absorbed into the soil/rock/ground. Interception water collected/trapped by vegetation 3(b)(i) less interception/transpiration/evapotranspiration 2 more overland flow/(surface) run-off/infiltration/saturated soil increased risk of flooding/inundation less water stored in biosphere less precipitation/rain(fall) (due to less transpiration/evapotranspiration) 3(b)(ii) hydroelectricity/dams 1 agriculture/irrigation urbanisation/industrialisation/building named infrastructure e.g. roads climate change/global warming
Question 5
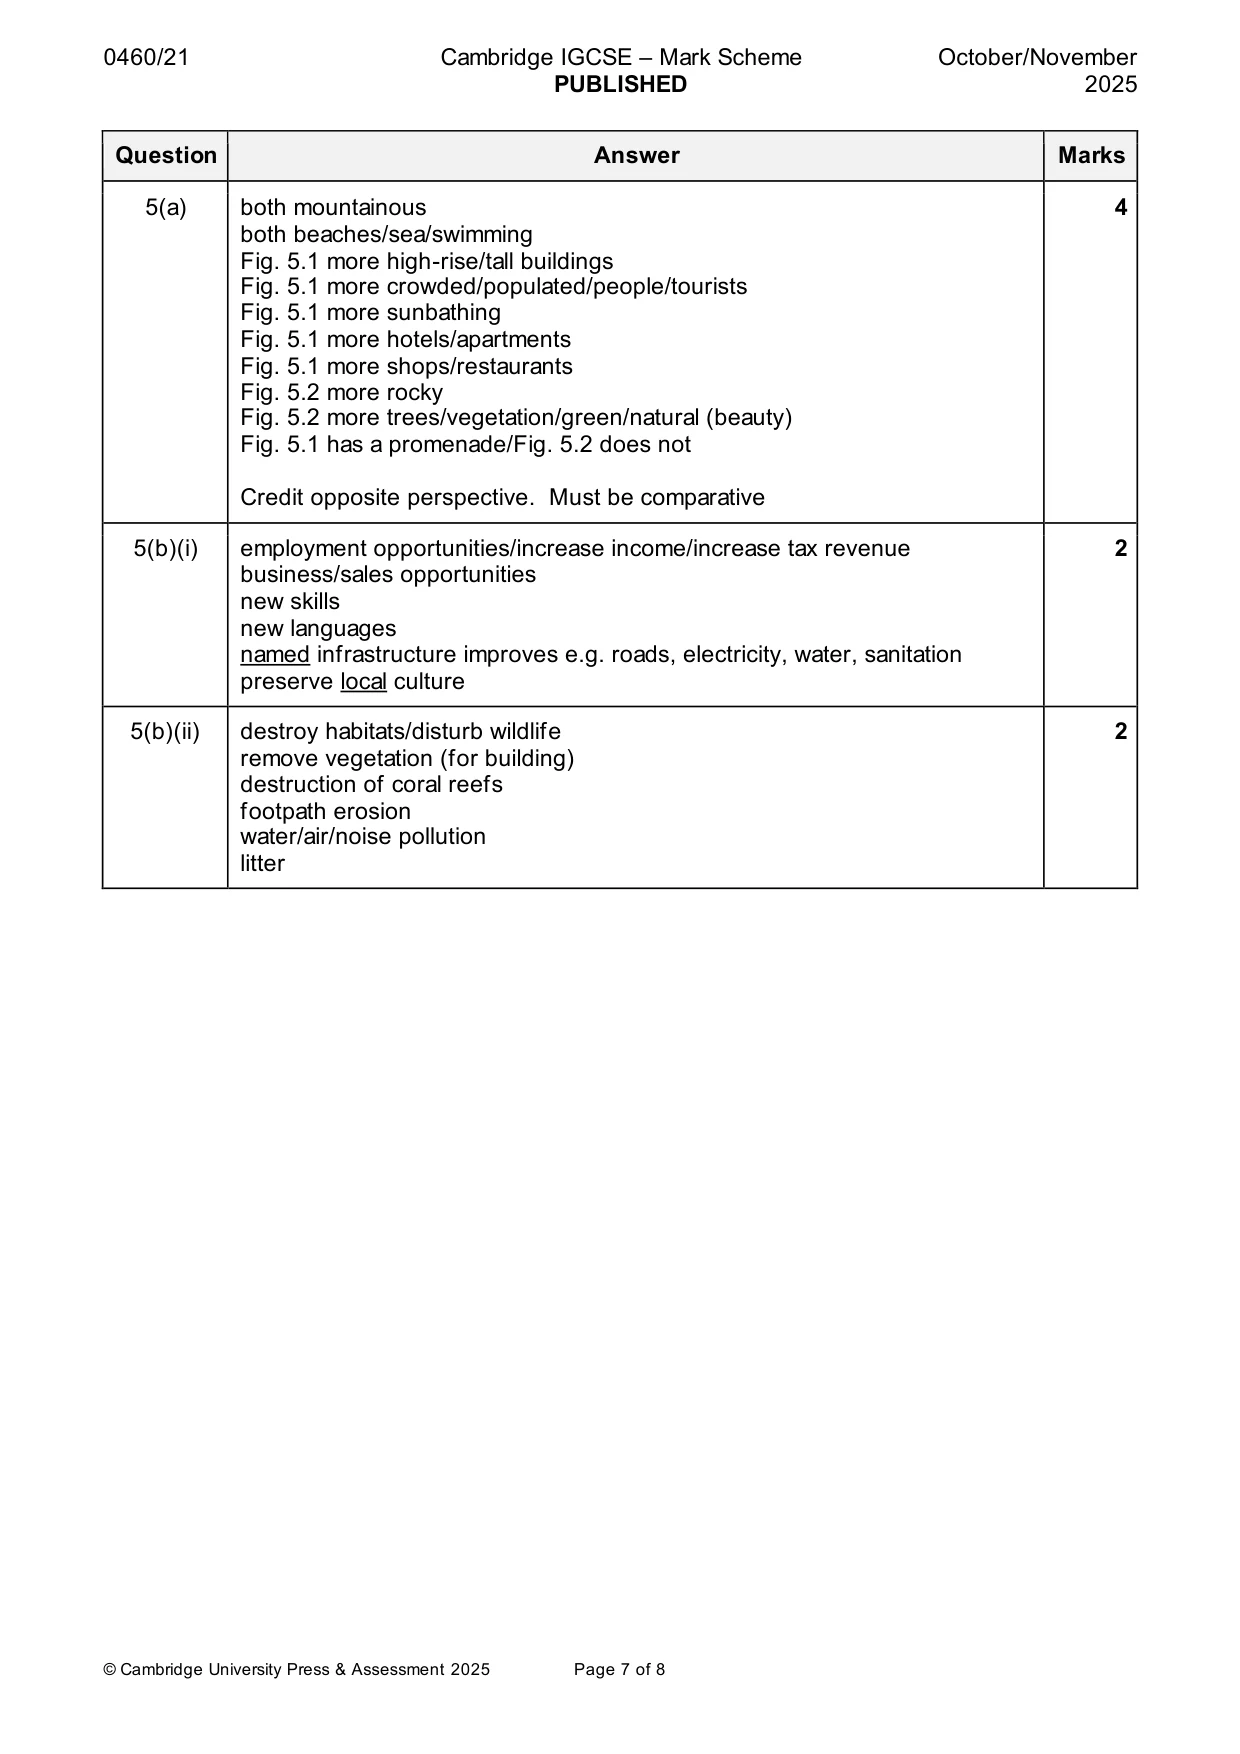
5 (a) Study Figs. 5.1 and 5.2 (Insert), which show two different tourist locations in Spain, a country in Europe. Compare the two tourist locations. ................................................................................................................................................... ................................................................................................................................................... ................................................................................................................................................... ................................................................................................................................................... ................................................................................................................................................... ................................................................................................................................................... ................................................................................................................................................... ............................................................................................................................................. [4] (b) (i) Suggest two reasons why the local population would welcome tourists to the area shown in Fig. 5.1. 1 ........................................................................................................................................ ........................................................................................................................................... 2 ........................................................................................................................................ ........................................................................................................................................... [2] (ii) Suggest two ways that tourists could damage the natural environment in the area shown in Fig. 5.2. 1 ........................................................................................................................................ ........................................................................................................................................... 2 ........................................................................................................................................ ........................................................................................................................................... [2] [Total: 8]
Mark scheme: 5(a) both mountainous 4 both beaches/sea/swimming Fig. 5.1 more high-rise/tall buildings Fig. 5.1 more crowded/populated/people/tourists Fig. 5.1 more sunbathing Fig. 5.1 more hotels/apartments Fig. 5.1 more shops/restaurants Fig. 5.2 more rocky Fig. 5.2 more trees/vegetation/green/natural (beauty) Fig. 5.1 has a promenade/Fig. 5.2 does not Credit opposite perspective. Must be comparative 5(b)(i) employment opportunities/increase income/increase tax revenue 2 business/sales opportunities new skills new languages named infrastructure improves e.g. roads, electricity, water, sanitation preserve local culture 5(b)(ii) destroy habitats/disturb wildlife 2 remove vegetation (for building) destruction of coral reefs footpath erosion water/air/noise pollution litter
Q6 · Study Table 6.1, which shows development indicators for seven countries in 2021
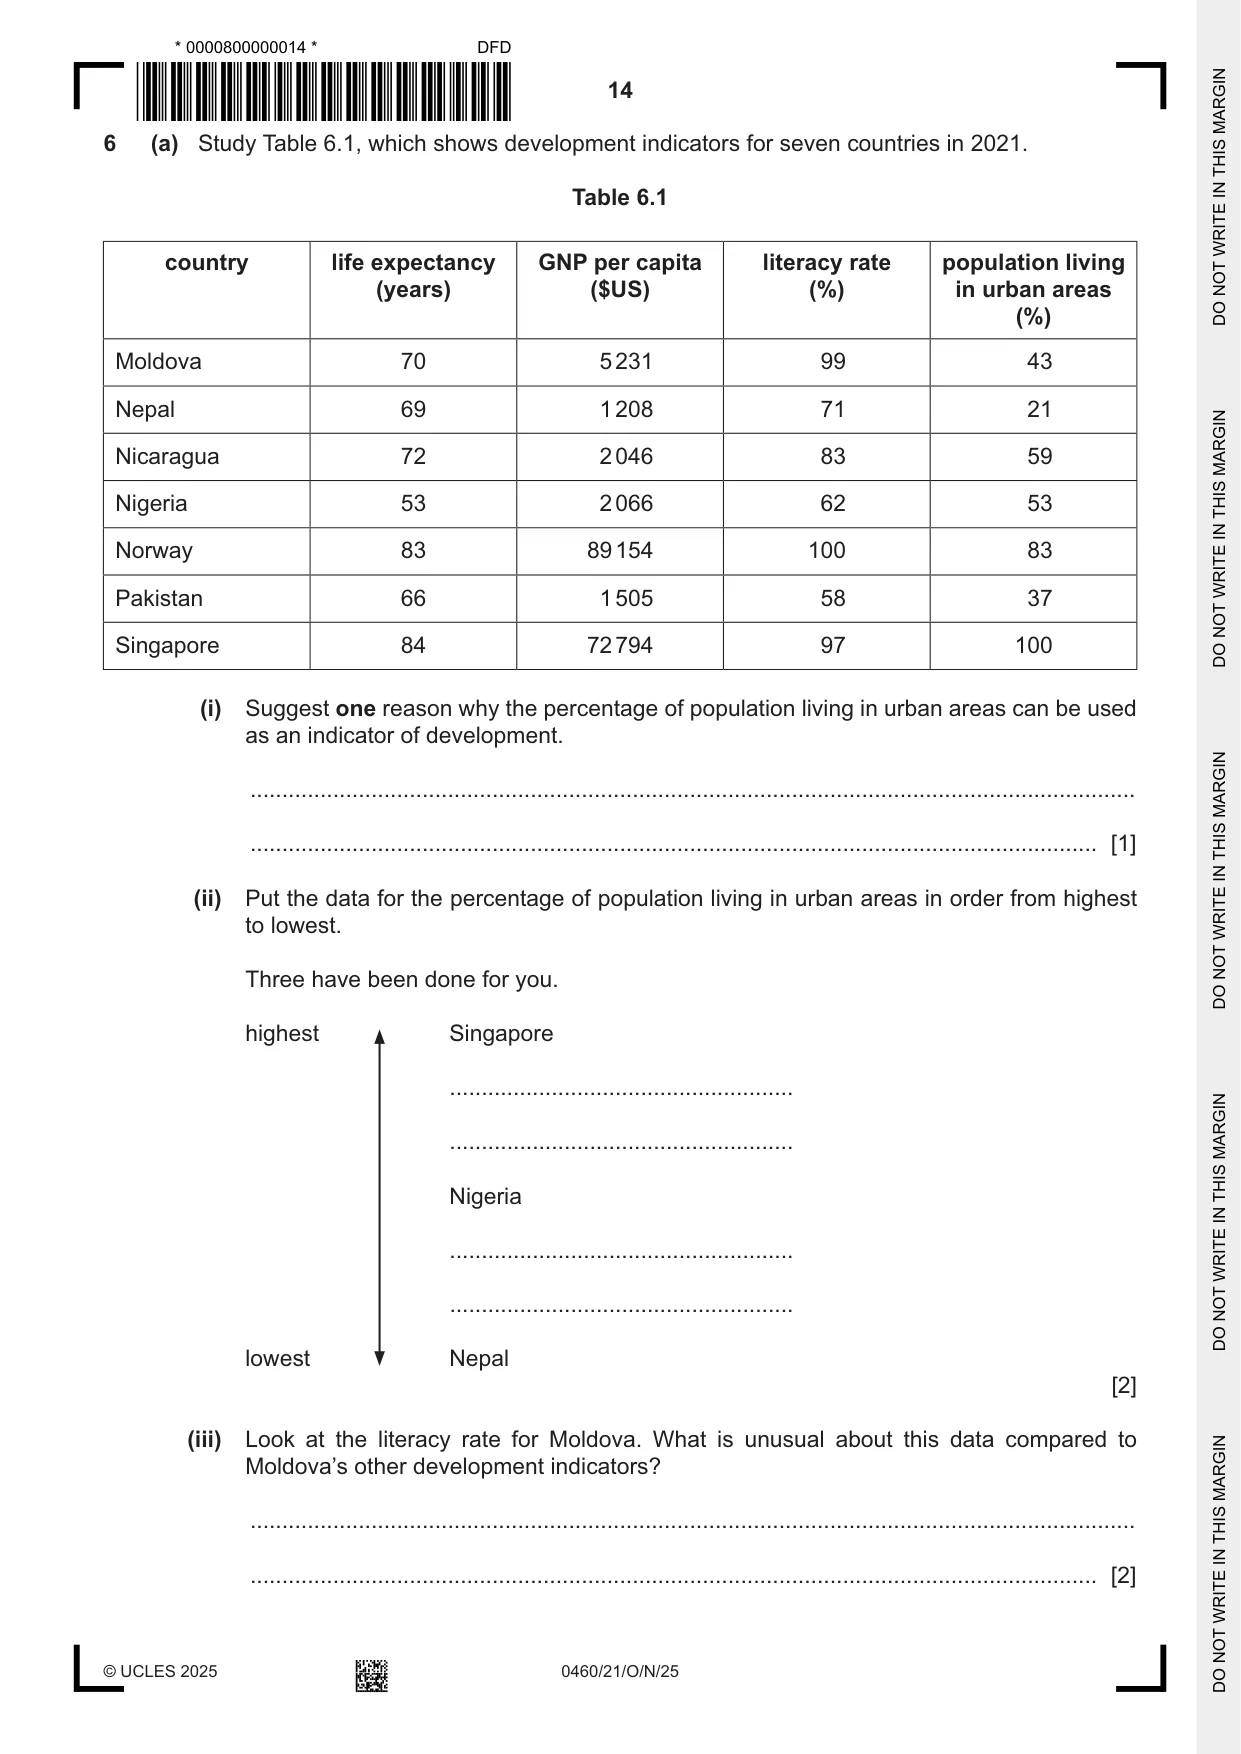
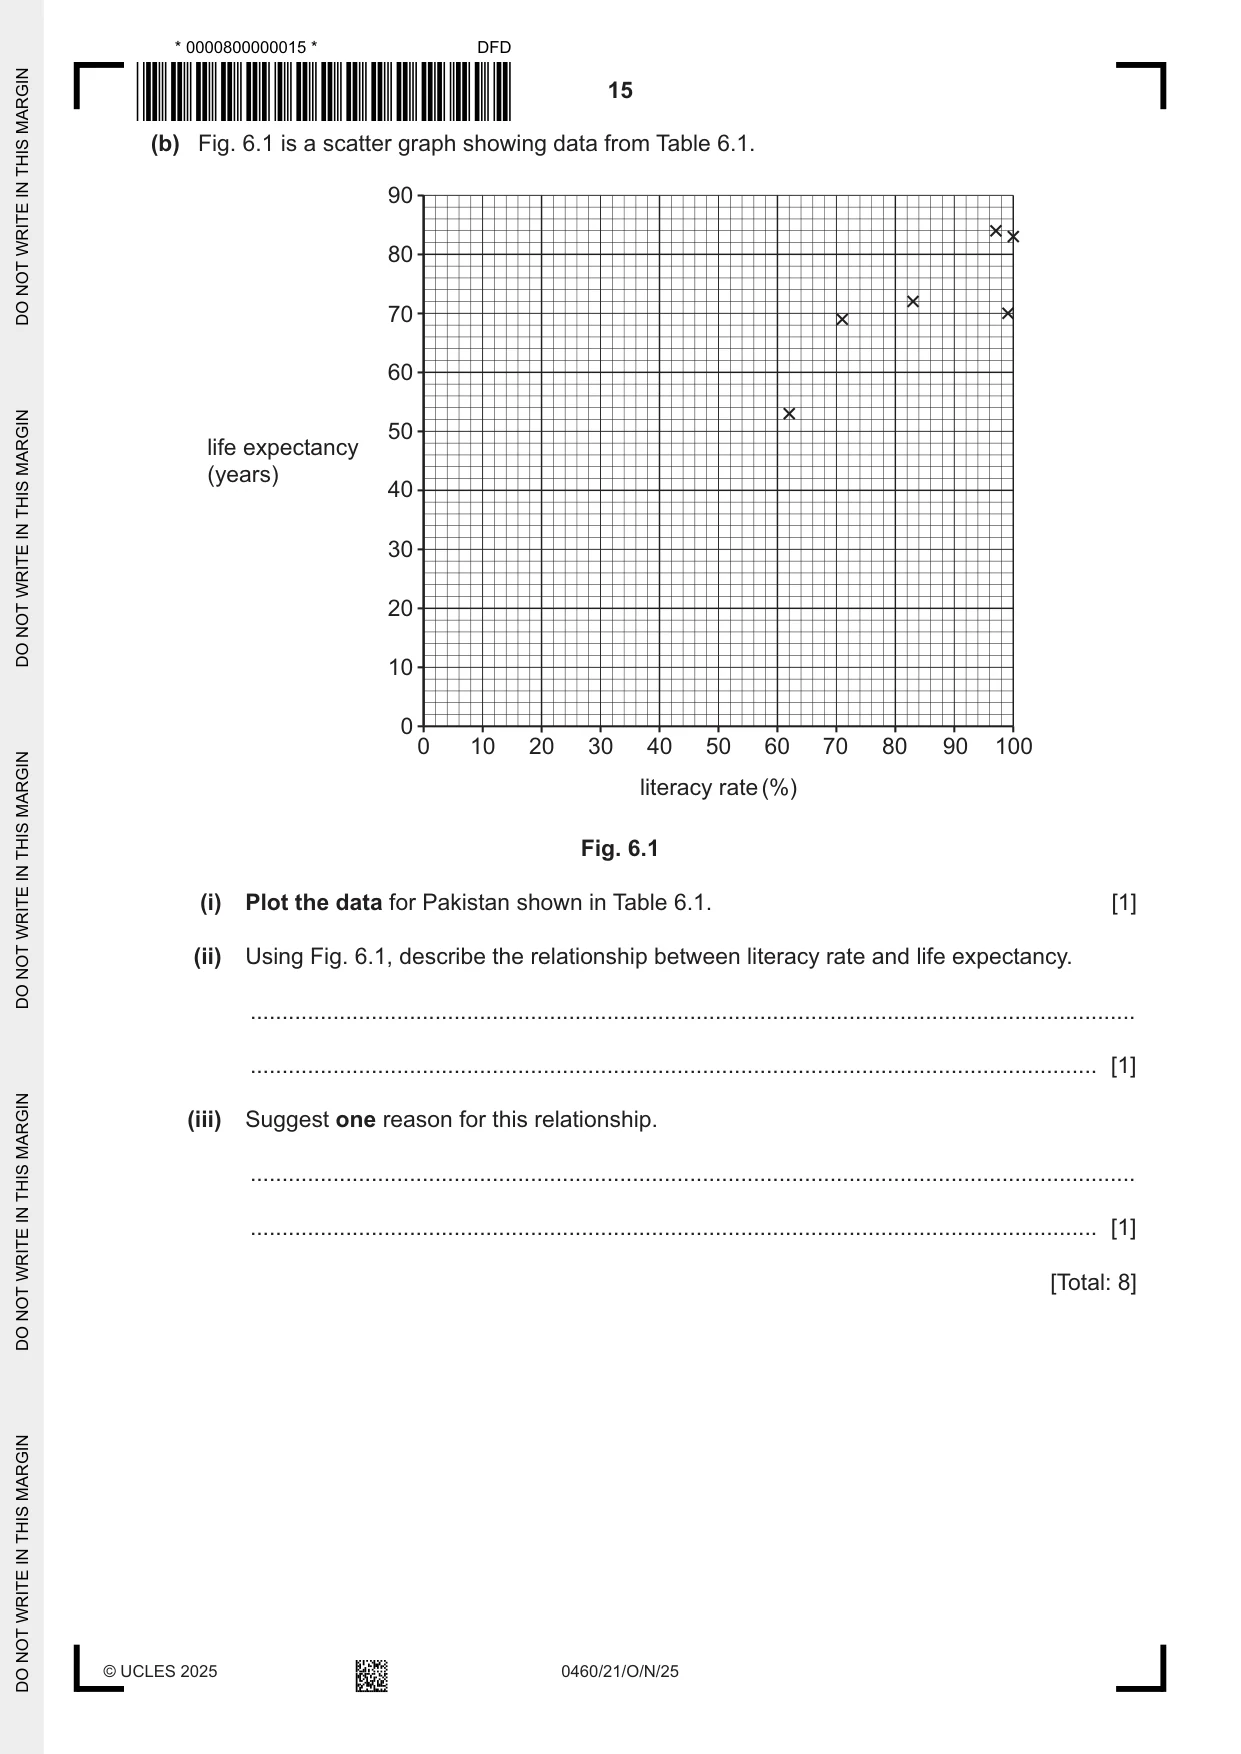
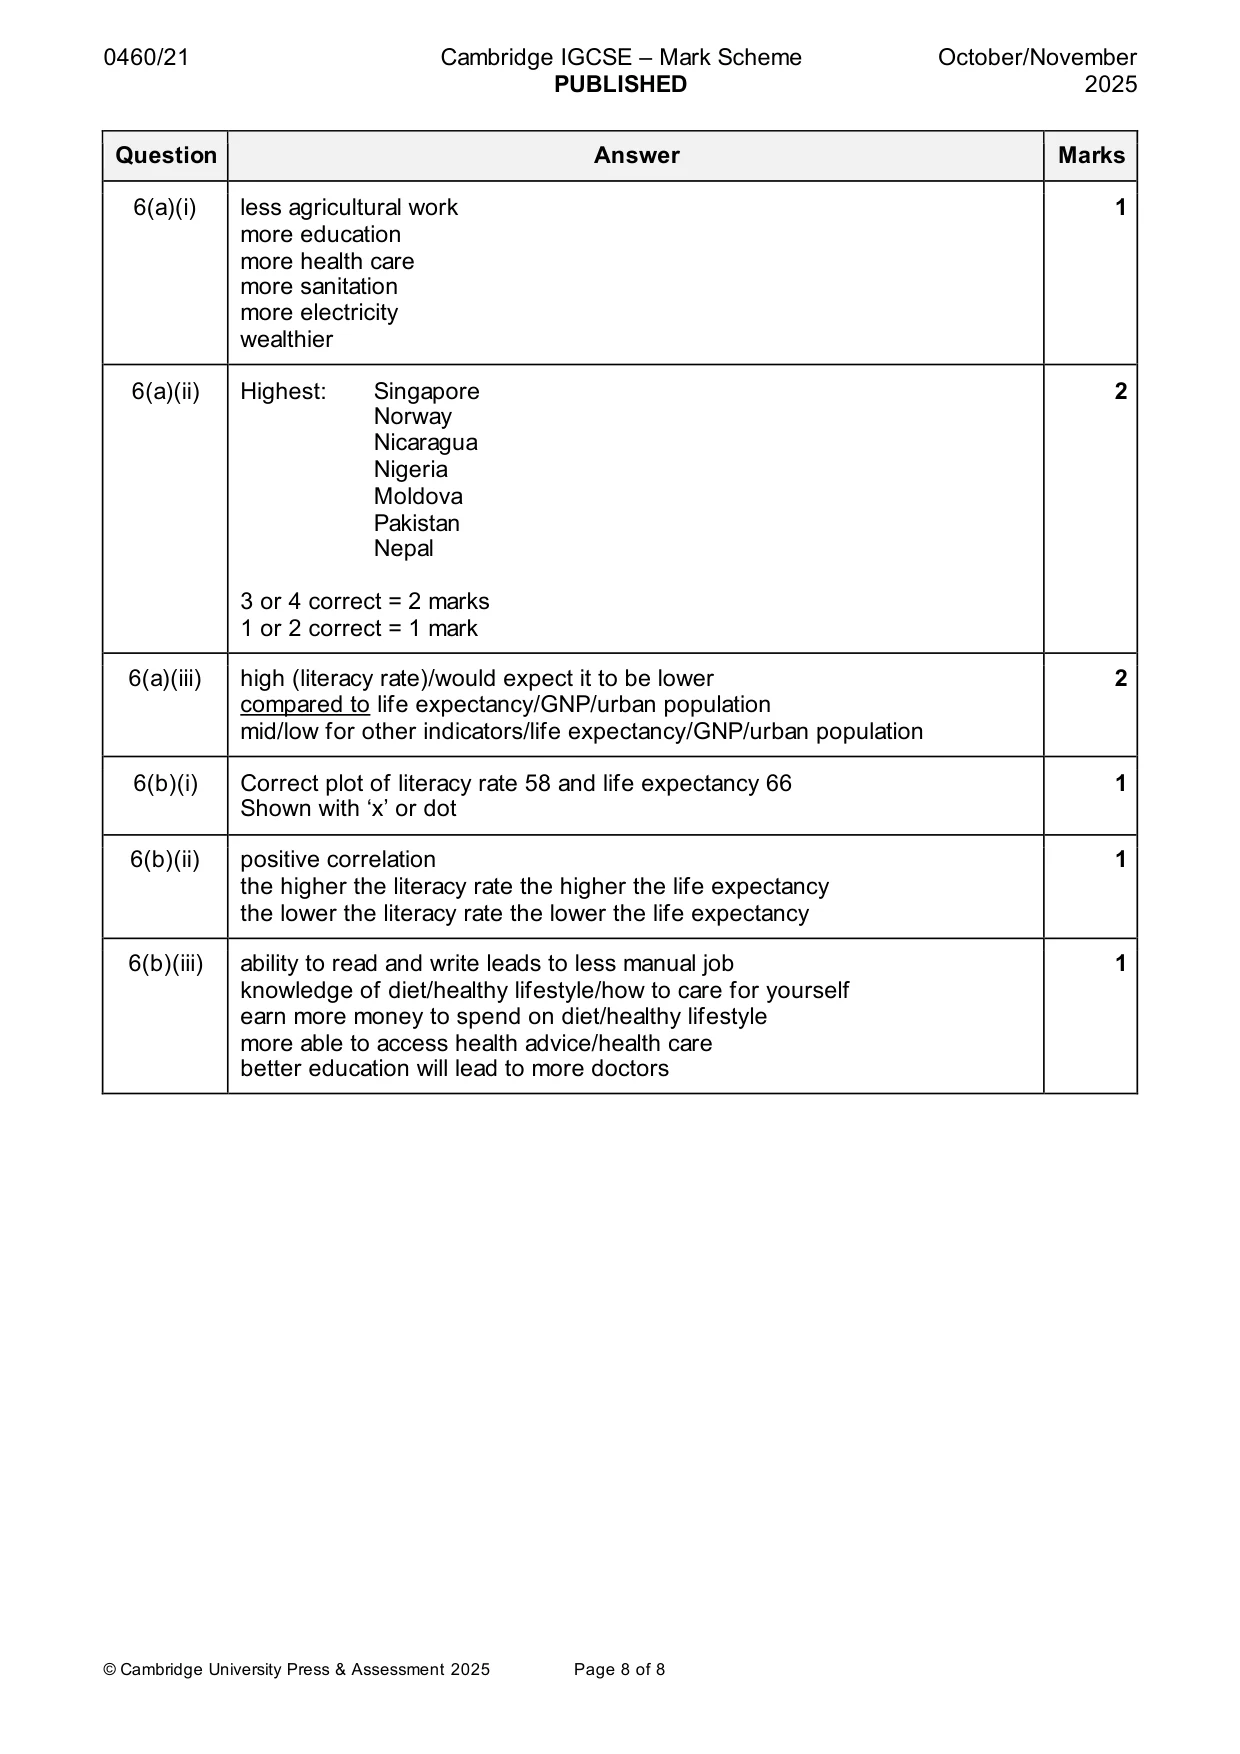
6 (a) Study Table 6.1, which shows development indicators for seven countries in 2021. Table 6.1 country life expectancy GNP per capita literacy rate population living (years) ($US) (%) in urban areas (%) Moldova 70 5 231 99 43 Nepal 69 1 208 71 21 Nicaragua 72 2 046 83 59 Nigeria 53 2 066 62 53 Norway 83 89 154 100 83 Pakistan 66 1 505 58 37 Singapore 84 72 794 97 100 (i) Suggest one reason why the percentage of population living in urban areas can be used as an indicator of development. ........................................................................................................................................... ..................................................................................................................................... [1] (ii) Put the data for the percentage of population living in urban areas in order from highest to lowest. Three have been done for you. highest Singapore ...................................................... ...................................................... Nigeria ...................................................... ...................................................... lowest Nepal [2] (iii) Look at the literacy rate for Moldova. What is unusual about this data compared to Moldova’s other development indicators? ........................................................................................................................................... ..................................................................................................................................... [2] (b) Fig. 6.1 is a scatter graph showing data from Table 6.1. 90 80 70 60 50 life expectancy (years) 40 30 20 10 0 0 10 20 30 40 50 60 70 80 90 100 literacy rate (%) Fig. 6.1 (i) Plot the data for Pakistan shown in Table 6.1. [1] (ii) Using Fig. 6.1, describe the relationship between literacy rate and life expectancy. ........................................................................................................................................... ..................................................................................................................................... [1] (iii) Suggest one reason for this relationship. ........................................................................................................................................... ..................................................................................................................................... [1] [Total: 8] Additional page If you use the following page to complete the answer to any question, the question number must be clearly shown. .................................................................................................................................................................. .................................................................................................................................................................. .................................................................................................................................................................. .................................................................................................................................................................. .................................................................................................................................................................. .................................................................................................................................................................. .................................................................................................................................................................. .................................................................................................................................................................. .................................................................................................................................................................. .................................................................................................................................................................. .................................................................................................................................................................. .................................................................................................................................................................. .................................................................................................................................................................. .................................................................................................................................................................. .................................................................................................................................................................. .................................................................................................................................................................. .................................................................................................................................................................. .................................................................................................................................................................. .................................................................................................................................................................. .................................................................................................................................................................. .................................................................................................................................................................. .................................................................................................................................................................. .................................................................................................................................................................. .................................................................................................................................................................. .................................................................................................................................................................. .................................................................................................................................................................. © UCLES 2025 0460/21/O/N/25
Mark scheme: 6(a)(i) less agricultural work 1 more education more health care more sanitation more electricity wealthier 6(a)(ii) Highest: Singapore 2 Norway Nicaragua Nigeria Moldova Pakistan Nepal 3 or 4 correct = 2 marks 1 or 2 correct = 1 mark 6(a)(iii) high (literacy rate)/would expect it to be lower 2 compared to life expectancy/GNP/urban population mid/low for other indicators/life expectancy/GNP/urban population 6(b)(i) Correct plot of literacy rate 58 and life expectancy 66 1 Shown with ‘x’ or dot 6(b)(ii) positive correlation 1 the higher the literacy rate the higher the life expectancy the lower the literacy rate the lower the life expectancy 6(b)(iii) ability to read and write leads to less manual job 1 knowledge of diet/healthy lifestyle/how to care for yourself earn more money to spend on diet/healthy lifestyle more able to access health advice/health care better education will lead to more doctors
What was in this paper
The subtopics covered by these 4 questions, and how many questions each got. Open one in a new tab to see every Cambridge question on it.
What you needed in this session
Cambridge’s own grade thresholds for 2025 Oct/Nov, Paper 2 · Variant 1. A higher threshold means an easier paper — the bar moves with how the cohort did.