Cambridge IGCSE Geography 0460 — 2024 Oct/Nov Paper 4 · Variant 2
0460/42/O/N/24 · 2 questions · 60 marks · ≈68 min
The question paper and its mark scheme, free to read here and free to download. This is Cambridge’s own paper, exactly as it was sat.
Question paper16 pages





Mark scheme9 pages
Answers below. Sit the paper first if you are practising.



Questions as text
Q1 · Students in Hanoi, Vietnam, investigated air pollution in the city
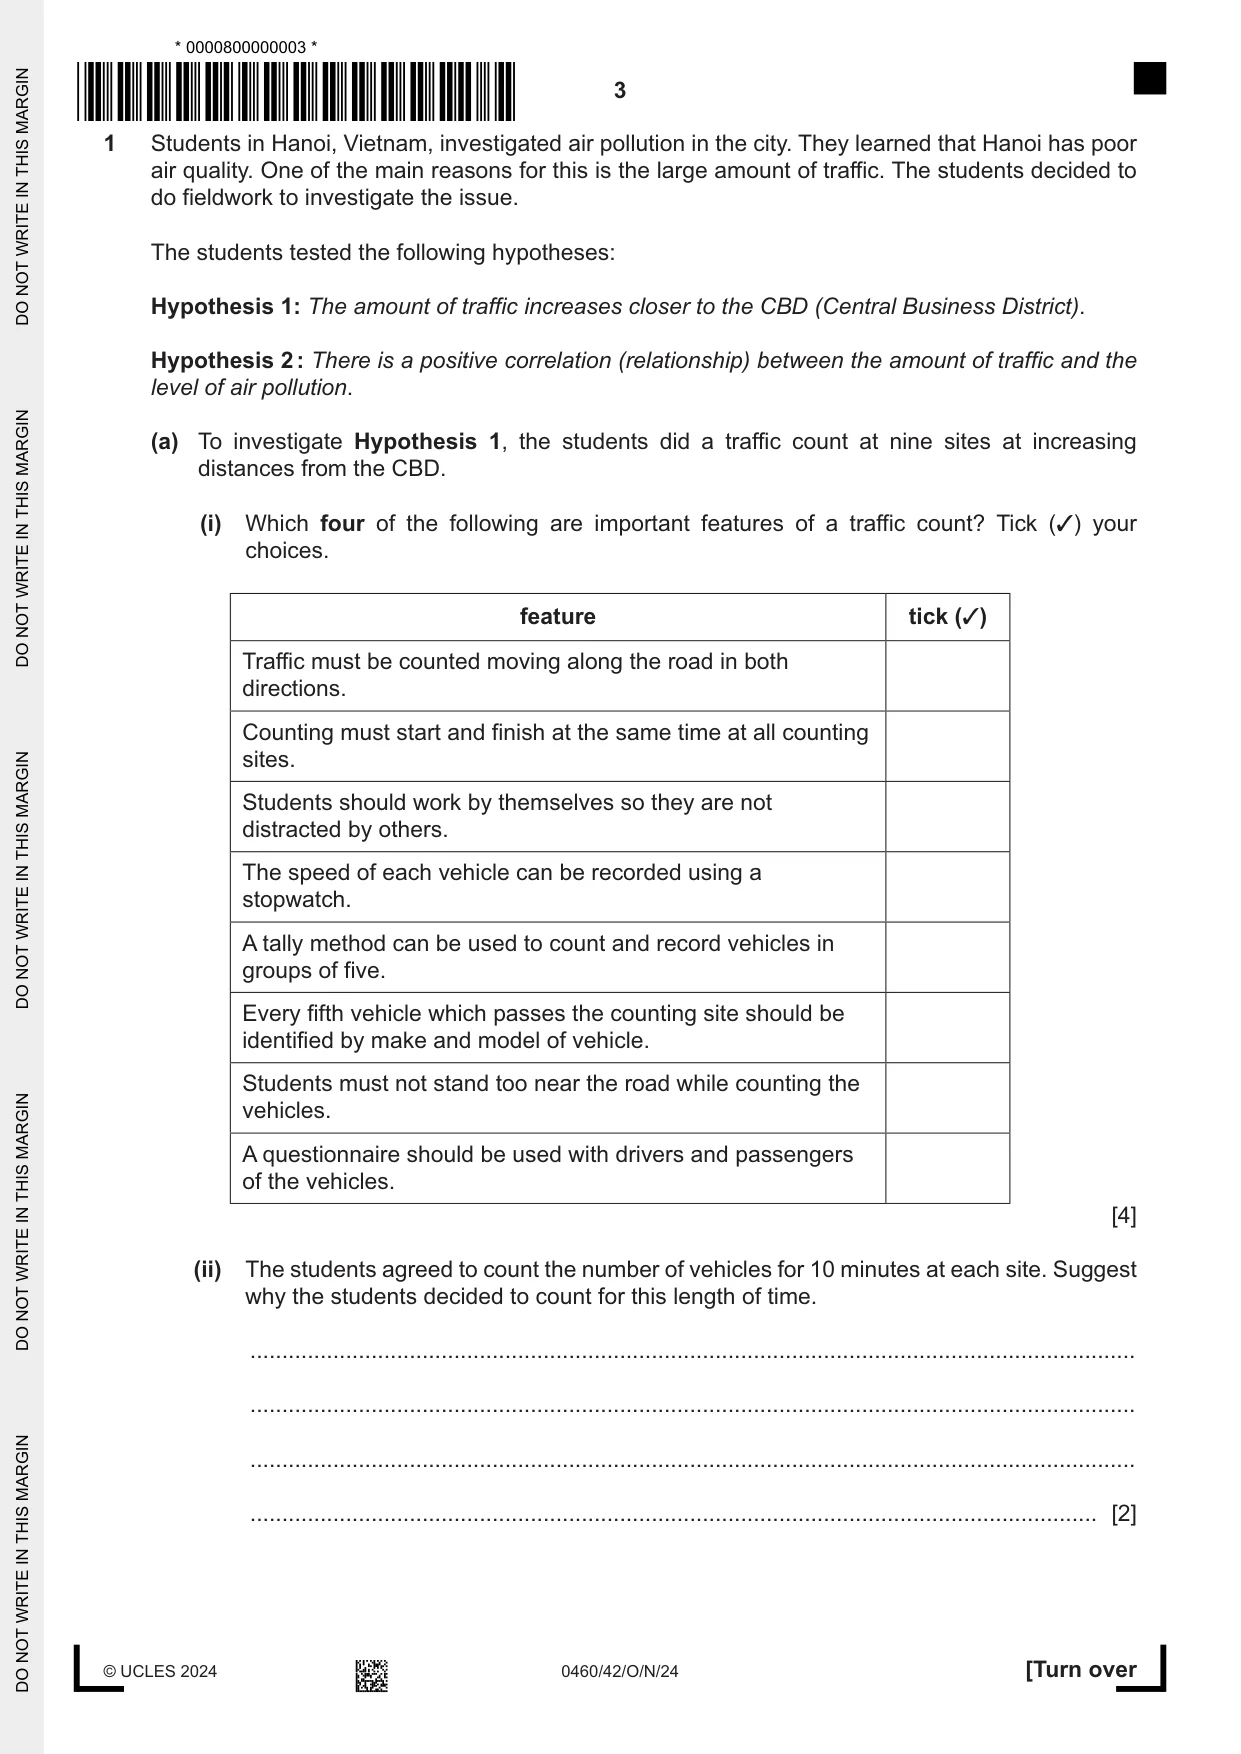
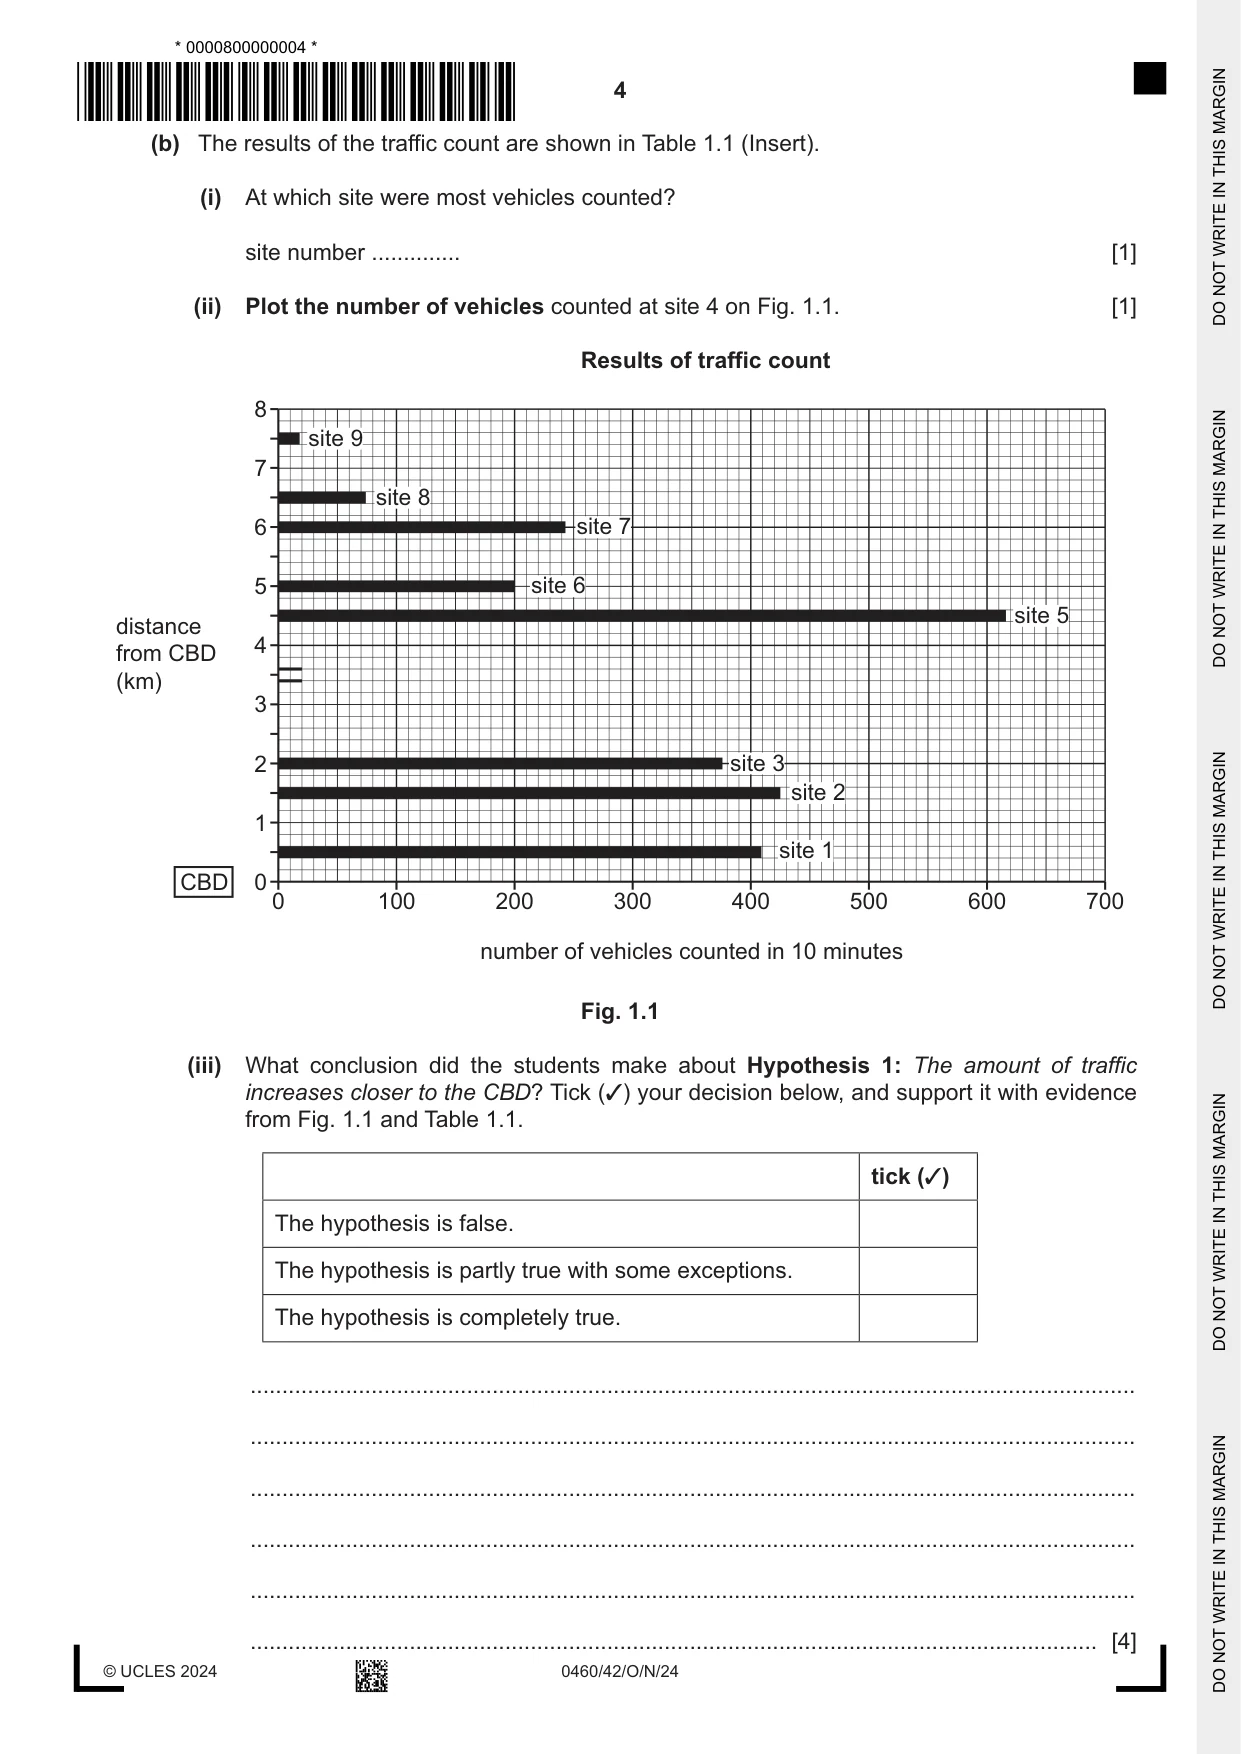
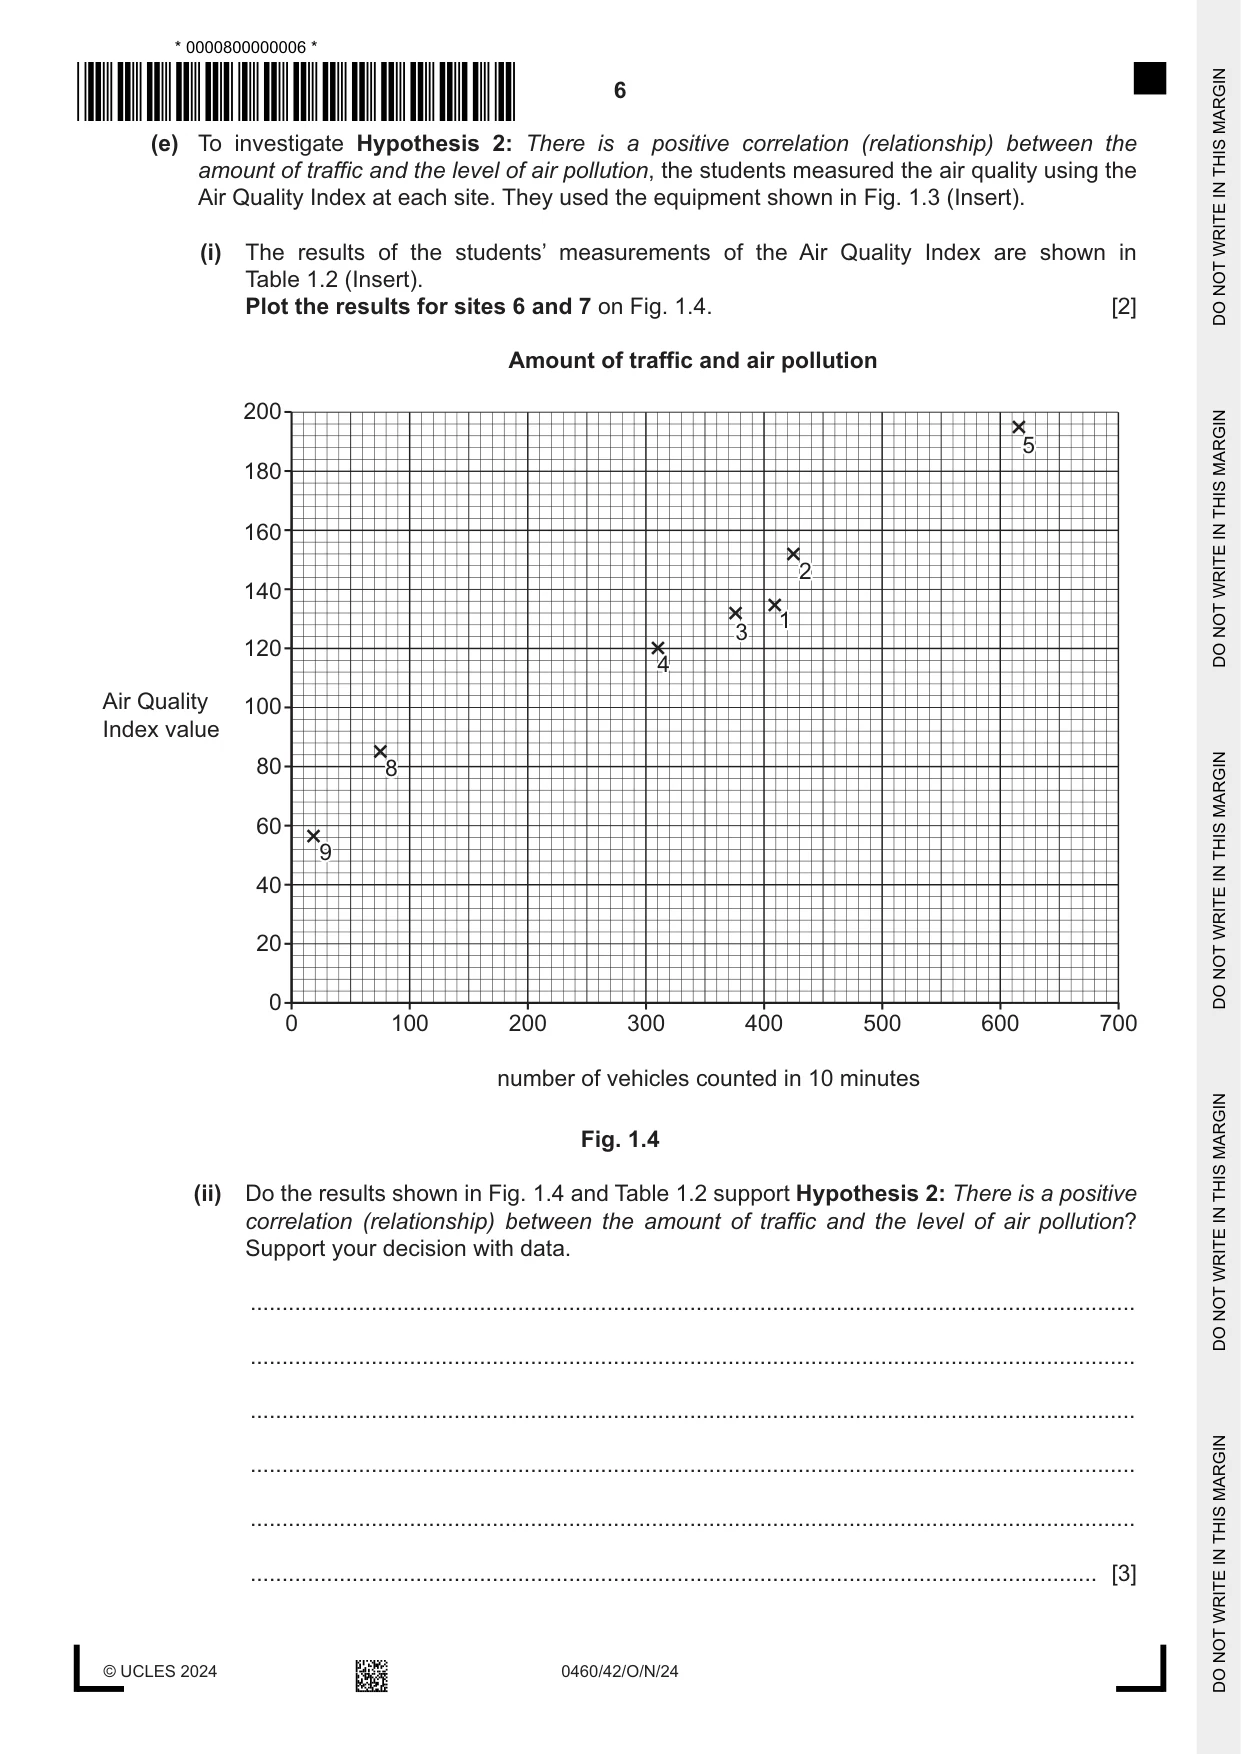
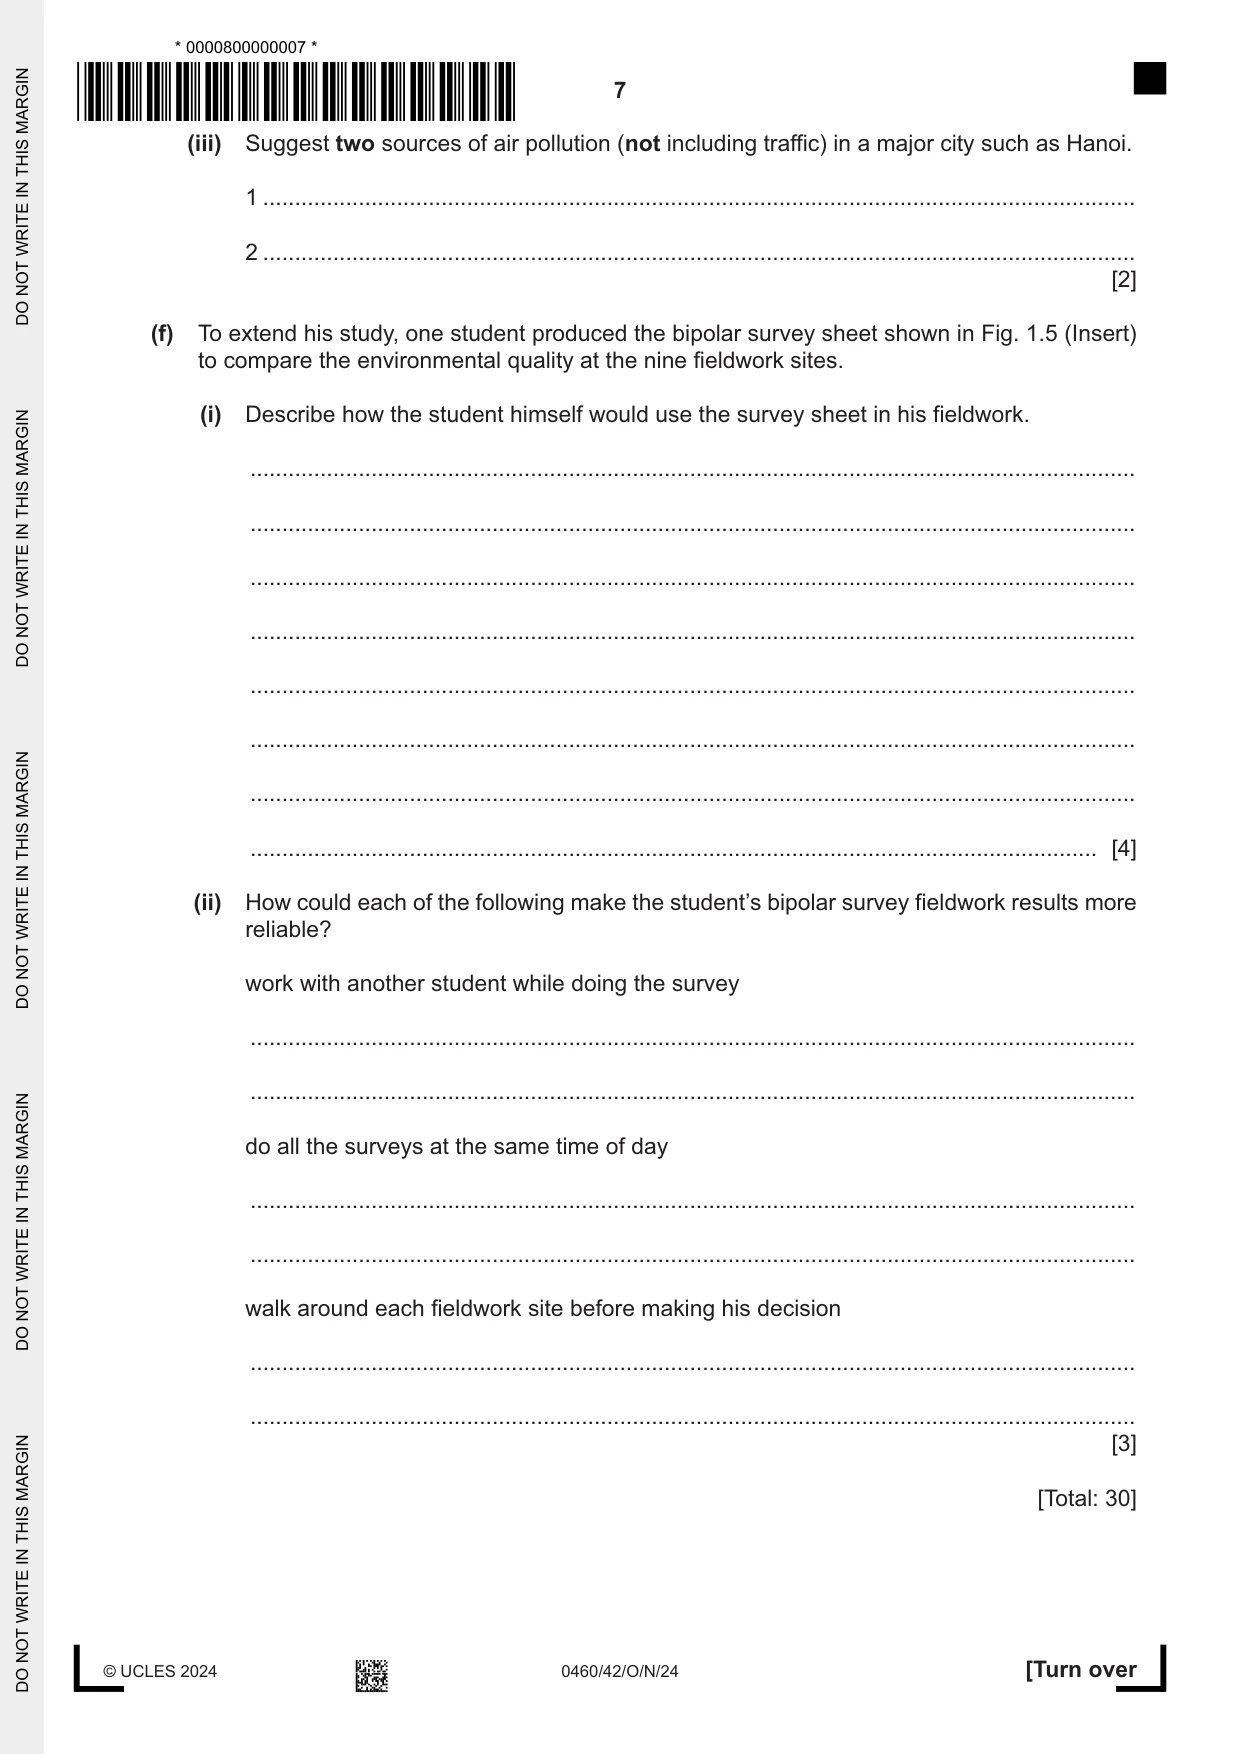
1 Students in Hanoi, Vietnam, investigated air pollution in the city. They learned that Hanoi has poor air quality. One of the main reasons for this is the large amount of traffic. The students decided to do fieldwork to investigate the issue. The students tested the following hypotheses: Hypothesis 1: The amount of traffic increases closer to the CBD (Central Business District). Hypothesis 2 : There is a positive correlation (relationship) between the amount of traffic and the level of air pollution. (a) To investigate Hypothesis 1, the students did a traffic count at nine sites at increasing distances from the CBD. (i) Which four of the following are important features of a traffic count? Tick (✓) your choices. feature tick (✓) Traffic must be counted moving along the road in both directions. Counting must start and finish at the same time at all counting sites. Students should work by themselves so they are not distracted by others. The speed of each vehicle can be recorded using a stopwatch. A tally method can be used to count and record vehicles in groups of five. Every fifth vehicle which passes the counting site should be identified by make and model of vehicle. Students must not stand too near the road while counting the vehicles. A questionnaire should be used with drivers and passengers of the vehicles. [4] (ii) The students agreed to count the number of vehicles for 10 minutes at each site. Suggest why the students decided to count for this length of time. ........................................................................................................................................... ........................................................................................................................................... ........................................................................................................................................... ..................................................................................................................................... [2] (b) The results of the traffic count are shown in Table 1.1 (Insert). (i) At which site were most vehicles counted? site number .............. [1] (ii) Plot the number of vehicles counted at site 4 on Fig. 1.1. [1] Results of traffic count 8 site 9 7 site 8 6 site 7 5 site 6 site 5distance 4from CBD (km) 3 2 site 3 site 2 1 site 1 CBD 0 0 100 200 300 400 500 600 700 number of vehicles counted in 10 minutes Fig. 1.1 (iii) What conclusion did the students make about Hypothesis 1: The amount of traffic increases closer to the CBD? Tick (✓) your decision below, and support it with evidence from Fig. 1.1 and Table 1.1. tick (✓) The hypothesis is false. The hypothesis is partly true with some exceptions. The hypothesis is completely true. ........................................................................................................................................... ........................................................................................................................................... ........................................................................................................................................... ........................................................................................................................................... ........................................................................................................................................... ..................................................................................................................................... [4] (c) Before they investigated their second hypothesis, the students did some research using secondary sources about how to measure air pollution. Explain what is meant by ‘secondary sources’. Give an example of a secondary source. ................................................................................................................................................... ................................................................................................................................................... ................................................................................................................................................... ............................................................................................................................................. [2] (d) The students decided to use a measurement called the Air Quality Index to measure the level of air pollution. This index is shown in Fig. 1.2 (Insert). (i) Which level of health concern is shown by an Air Quality Index measurement of 235? name of level ............................................................................................................... [1] (ii) What colour on the Air Quality Index advises that children should reduce prolonged outdoor exercise? colour of level .............................................................................................................. [1] (e) To investigate Hypothesis 2: There is a positive correlation (relationship) between the amount of traffic and the level of air pollution, the students measured the air quality using the Air Quality Index at each site. They used the equipment shown in Fig. 1.3 (Insert). (i) The results of the students’ measurements of the Air Quality Index are shown in Table 1.2 (Insert). Plot the results for sites 6 and 7 on Fig. 1.4. [2] Amount of traffic and air pollution 200 55 180 160 22 140 11 33 120 44 Air Quality 100 Index value 80 88 60 99 40 20 0 0 100 200 300 400 500 600 700 number of vehicles counted in 10 minutes Fig. 1.4 (ii) Do the results shown in Fig. 1.4 and Table 1.2 support Hypothesis 2: There is a positive correlation (relationship) between the amount of traffic and the level of air pollution? Support your decision with data. ........................................................................................................................................... ........................................................................................................................................... ........................................................................................................................................... ........................................................................................................................................... ........................................................................................................................................... ..................................................................................................................................... [3] (iii) Suggest two sources of air pollution (not including traffic) in a major city such as Hanoi. 1 ......................................................................................................................................... 2 ......................................................................................................................................... [2] (f) To extend his study, one student produced the bipolar survey sheet shown in Fig. 1.5 (Insert) to compare the environmental quality at the nine fieldwork sites. (i) Describe how the student himself would use the survey sheet in his fieldwork. ........................................................................................................................................... ........................................................................................................................................... ........................................................................................................................................... ........................................................................................................................................... ........................................................................................................................................... ........................................................................................................................................... ........................................................................................................................................... ..................................................................................................................................... [4] (ii) How could each of the following make the student’s bipolar survey fieldwork results more reliable? work with another student while doing the survey ........................................................................................................................................... ........................................................................................................................................... do all the surveys at the same time of day ........................................................................................................................................... ........................................................................................................................................... walk around each fieldwork site before making his decision ........................................................................................................................................... ........................................................................................................................................... [3] [Total: 30]
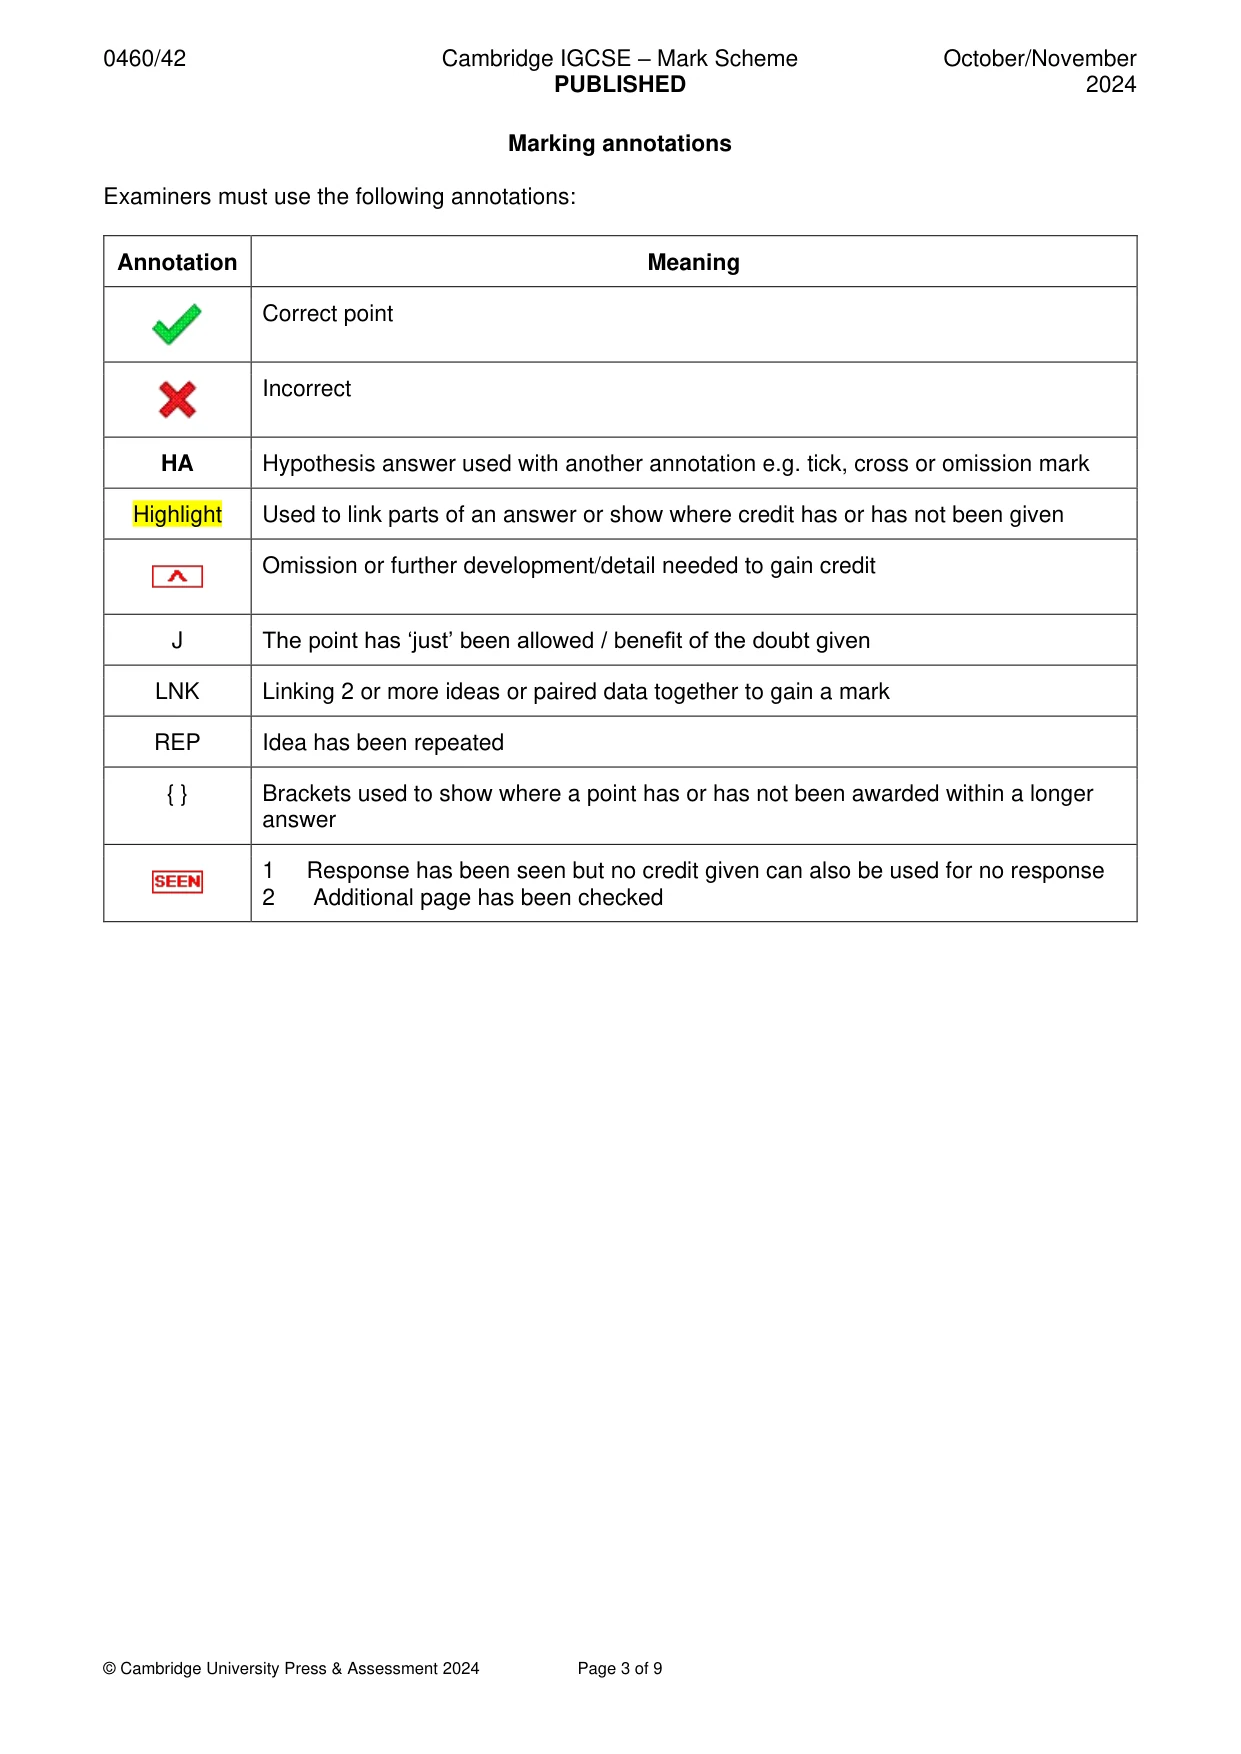
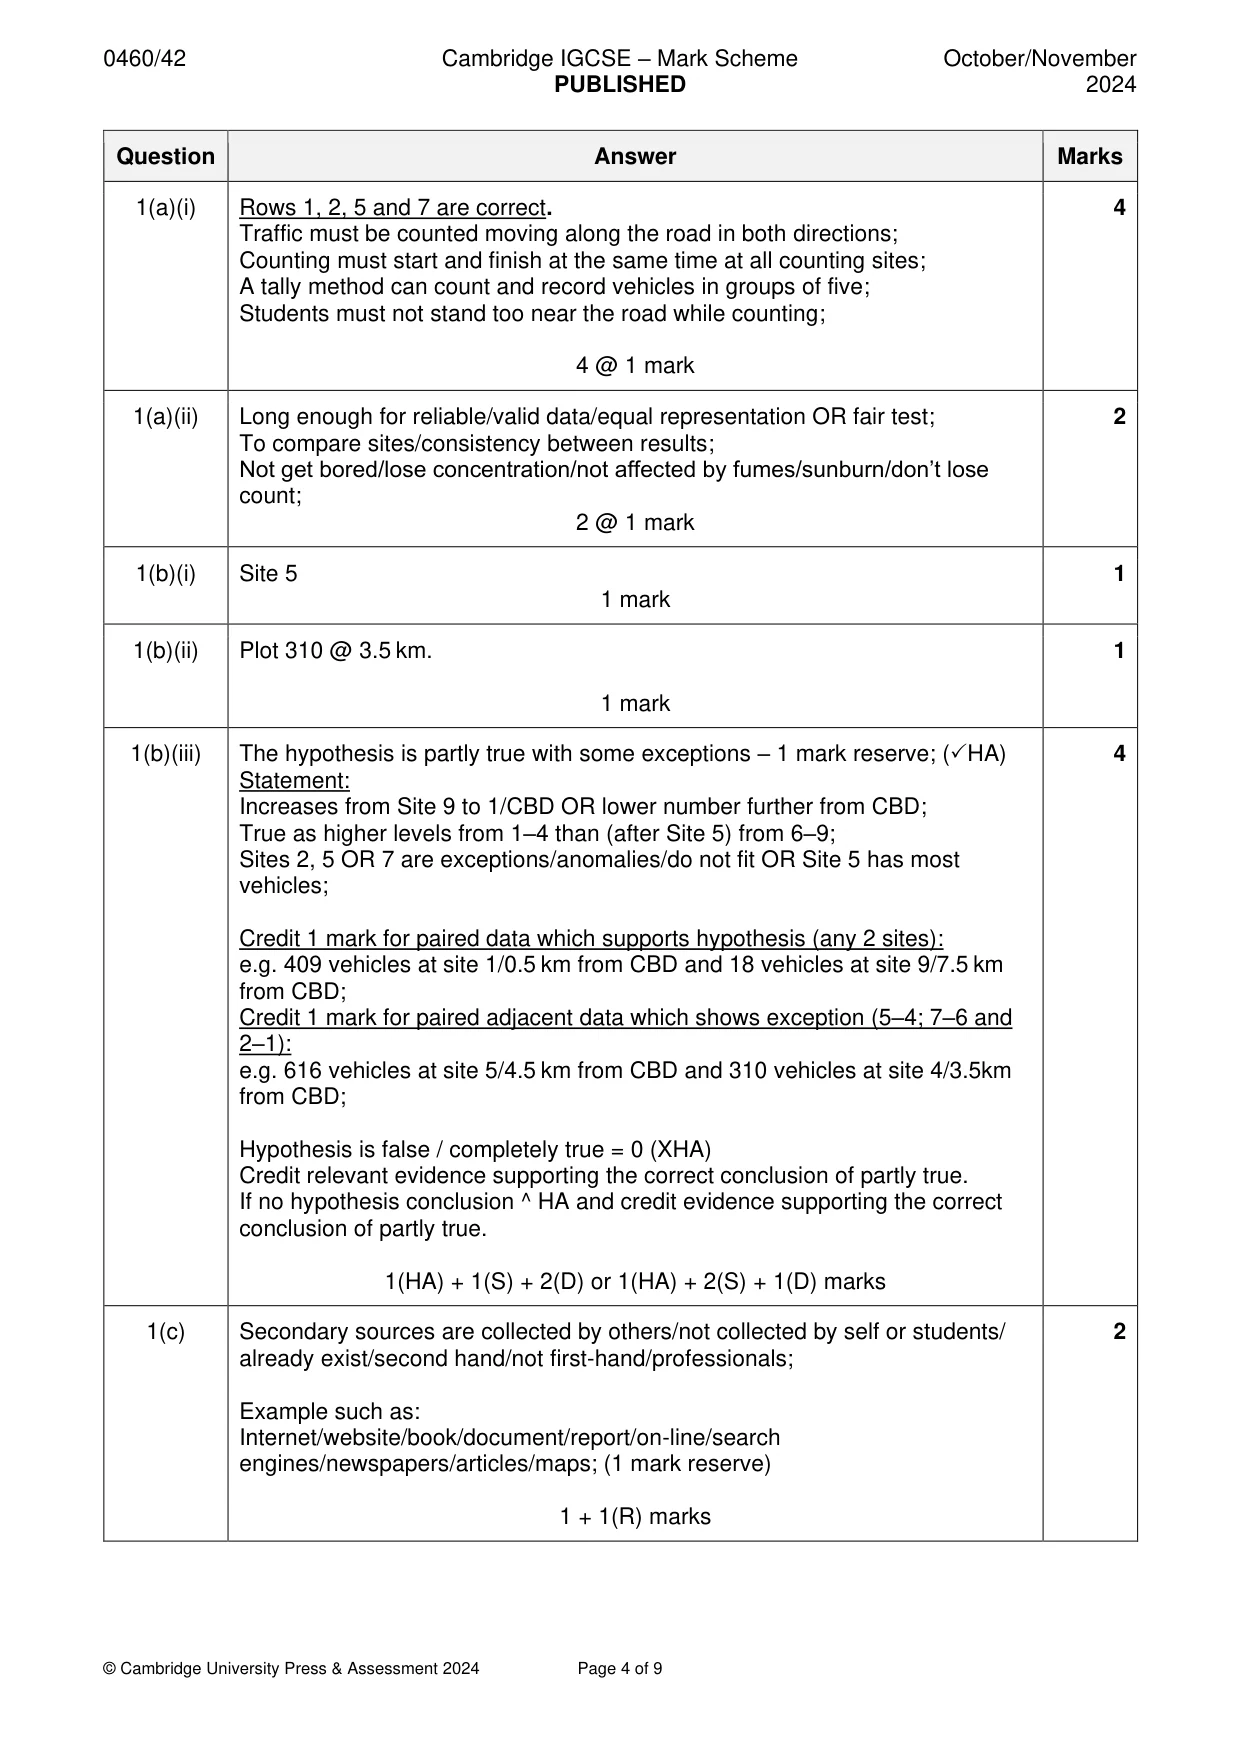
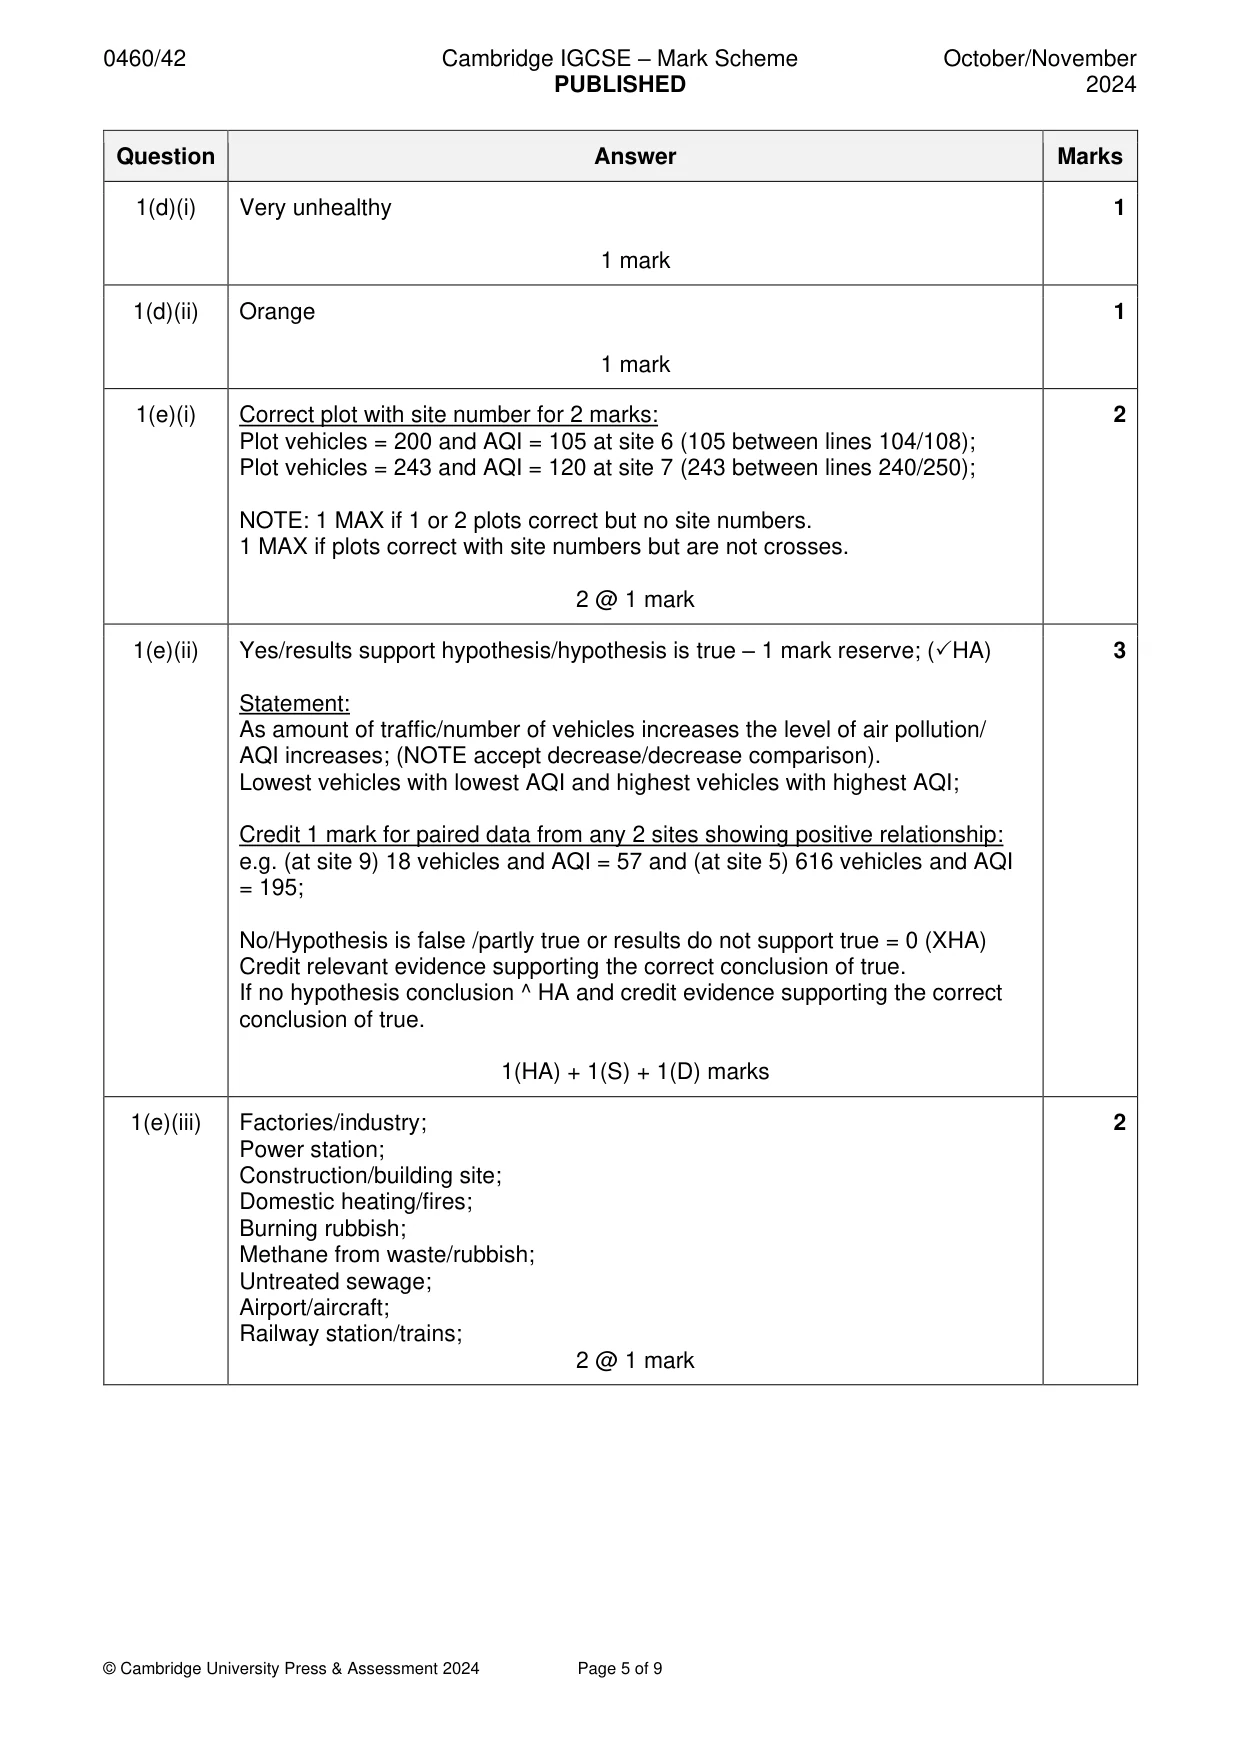
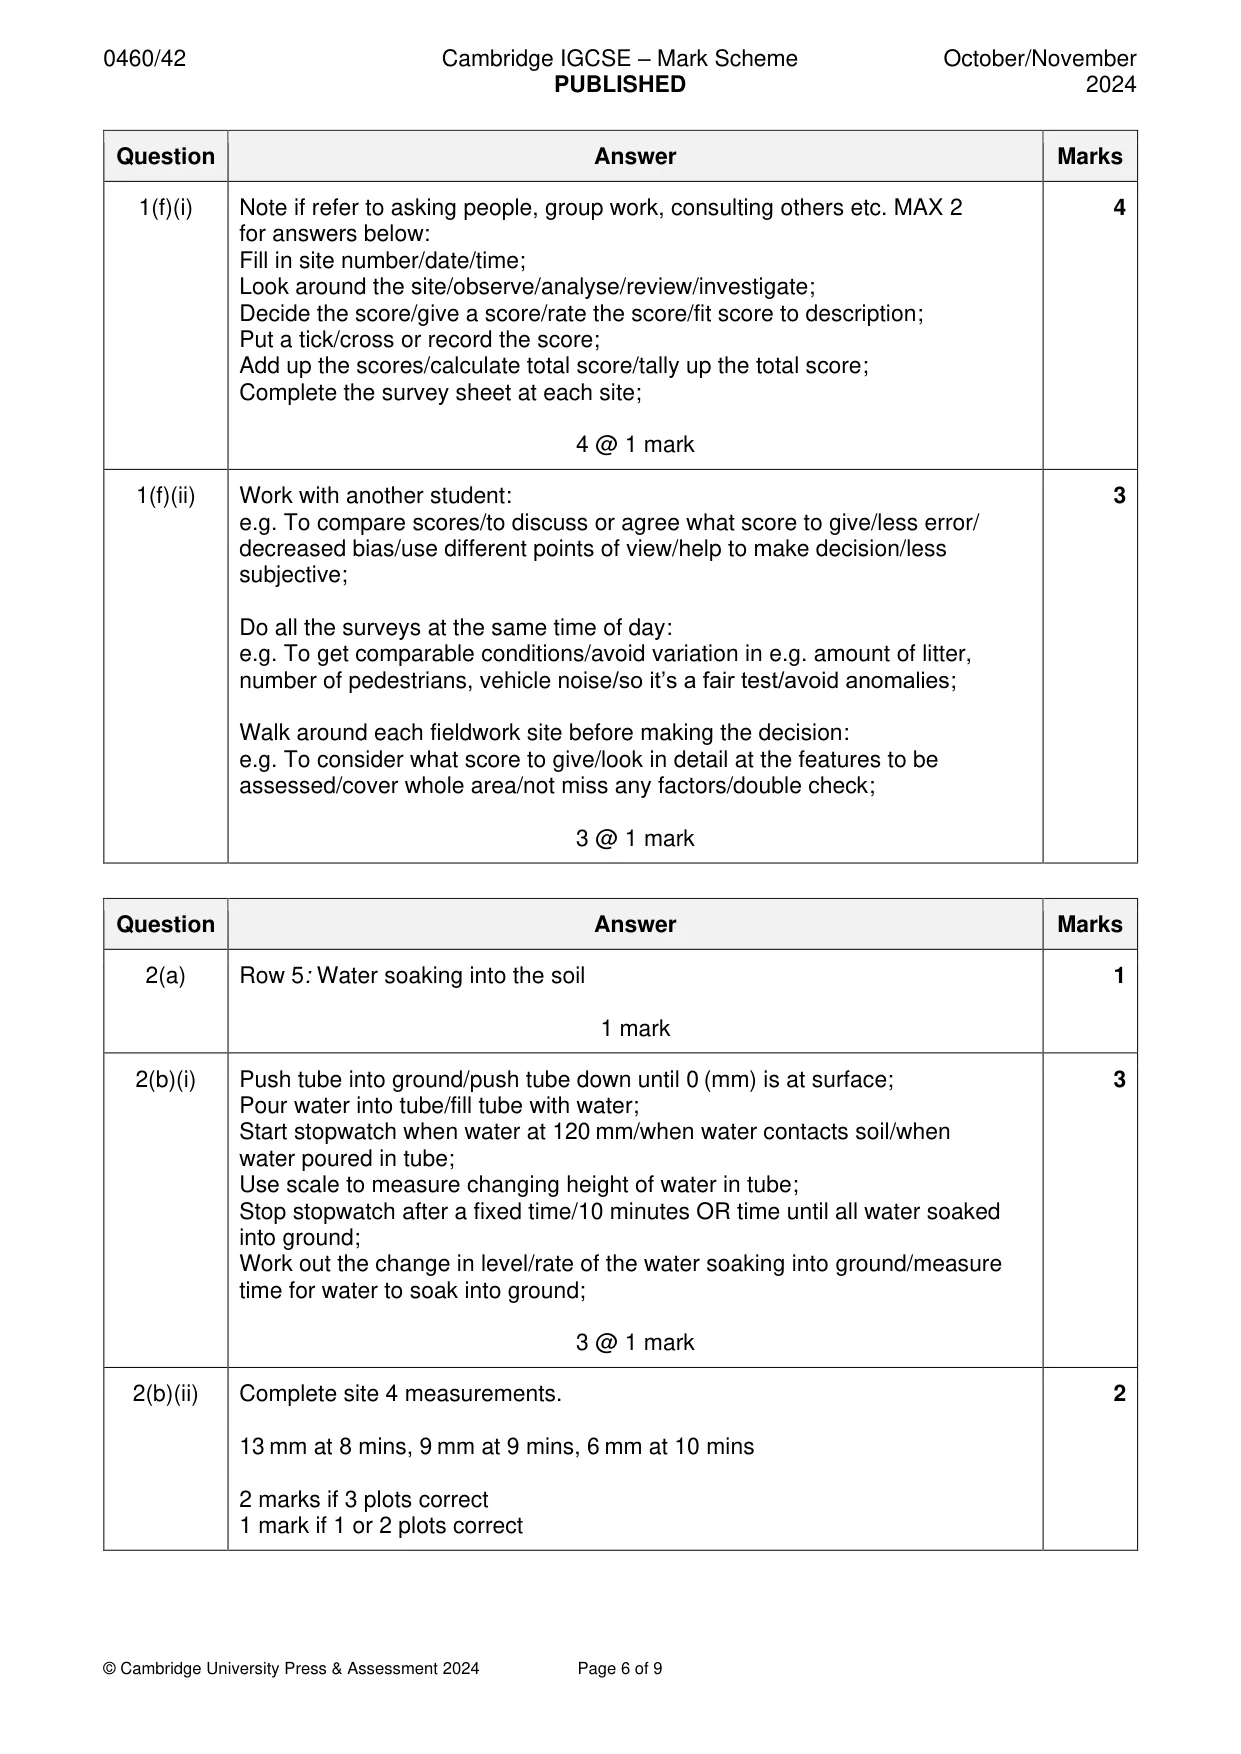
Mark scheme: Question Answer Marks 1(a)(i) Rows 1, 2, 5 and 7 are correct. 4 Traffic must be counted moving along the road in both directions; Counting must start and finish at the same time at all counting sites; A tally method can count and record vehicles in groups of five; Students must not stand too near the road while counting; 4 @ 1 mark 1(a)(ii) Long enough for reliable/valid data/equal representation OR fair test; 2 To compare sites/consistency between results; Not get bored/lose concentration/not affected by fumes/sunburn/don’t lose count; 2 @ 1 mark 1(b)(i) Site 5 1 1 mark 1(b)(ii) Plot 310 @ 3.5 km. 1 1 mark 1(b)(iii) The hypothesis is partly true with some exceptions – 1 mark reserve; (HA) 4 Statement: Increases from Site 9 to 1/CBD OR lower number further from CBD; True as higher levels from 1–4 than (after Site 5) from 6–9; Sites 2, 5 OR 7 are exceptions/anomalies/do not fit OR Site 5 has most vehicles; Credit 1 mark for paired data which supports hypothesis (any 2 sites): e.g. 409 vehicles at site 1/0.5 km from CBD and 18 vehicles at site 9/7.5 km from CBD; Credit 1 mark for paired adjacent data which shows exception (5–4; 7–6 and 2–1): e.g. 616 vehicles at site 5/4.5 km from CBD and 310 vehicles at site 4/3.5km from CBD; Hypothesis is false / completely true = 0 (XHA) Credit relevant evidence supporting the correct conclusion of partly true. If no hypothesis conclusion ^ HA and credit evidence supporting the correct conclusion of partly true. 1(HA) + 1(S) + 2(D) or 1(HA) + 2(S) + 1(D) marks 1(c) Secondary sources are collected by others/not collected by self or students/ 2 already exist/second hand/not first-hand/professionals; Example such as: Internet/website/book/document/report/on-line/search engines/newspapers/articles/maps; (1 mark reserve) 1 + 1(R) marks 1(d)(i) Very unhealthy 1 1 mark 1(d)(ii) Orange 1 1 mark 1(e)(i) Correct plot with site number for 2 marks: 2 Plot vehicles = 200 and AQI = 105 at site 6 (105 between lines 104/108); Plot vehicles = 243 and AQI = 120 at site 7 (243 between lines 240/250); NOTE: 1 MAX if 1 or 2 plots correct but no site numbers. 1 MAX if plots correct with site numbers but are not crosses. 2 @ 1 mark 1(e)(ii) Yes/results support hypothesis/hypothesis is true – 1 mark reserve; (HA) 3 Statement: As amount of traffic/number of vehicles increases the level of air pollution/ AQI increases; (NOTE accept decrease/decrease comparison). Lowest vehicles with lowest AQI and highest vehicles with highest AQI; Credit 1 mark for paired data from any 2 sites showing positive relationship: e.g. (at site 9) 18 vehicles and AQI = 57 and (at site 5) 616 vehicles and AQI = 195; No/Hypothesis is false /partly true or results do not support true = 0 (XHA) Credit relevant evidence supporting the correct conclusion of true. If no hypothesis conclusion ^ HA and credit evidence supporting the correct conclusion of true. 1(HA) + 1(S) + 1(D) marks 1(e)(iii) Factories/industry; 2 Power station; Construction/building site; Domestic heating/fires; Burning rubbish; Methane from waste/rubbish; Untreated sewage; Airport/aircraft; Railway station/trains; 2 @ 1 mark 1(f)(i) Note if refer to asking people, group work, consulting others etc. MAX 2 4 for answers below: Fill in site number/date/time; Look around the site/observe/analyse/review/investigate; Decide the score/give a score/rate the score/fit score to description; Put a tick/cross or record the score; Add up the scores/calculate total score/tally up the total score; Complete the survey sheet at each site; 4 @ 1 mark 1(f)(ii) Work with another student: 3 e.g. To compare scores/to discuss or agree what score to give/less error/ decreased bias/use different points of view/help to make decision/less subjective; Do all the surveys at the same time of day: e.g. To get comparable conditions/avoid variation in e.g. amount of litter, number of pedestrians, vehicle noise/so it’s a fair test/avoid anomalies; Walk around each fieldwork site before making the decision: e.g. To consider what score to give/look in detail at the features to be assessed/cover whole area/not miss any factors/double check; 3 @ 1 mark
Q2 · Students were studying the processes in a drainage basin
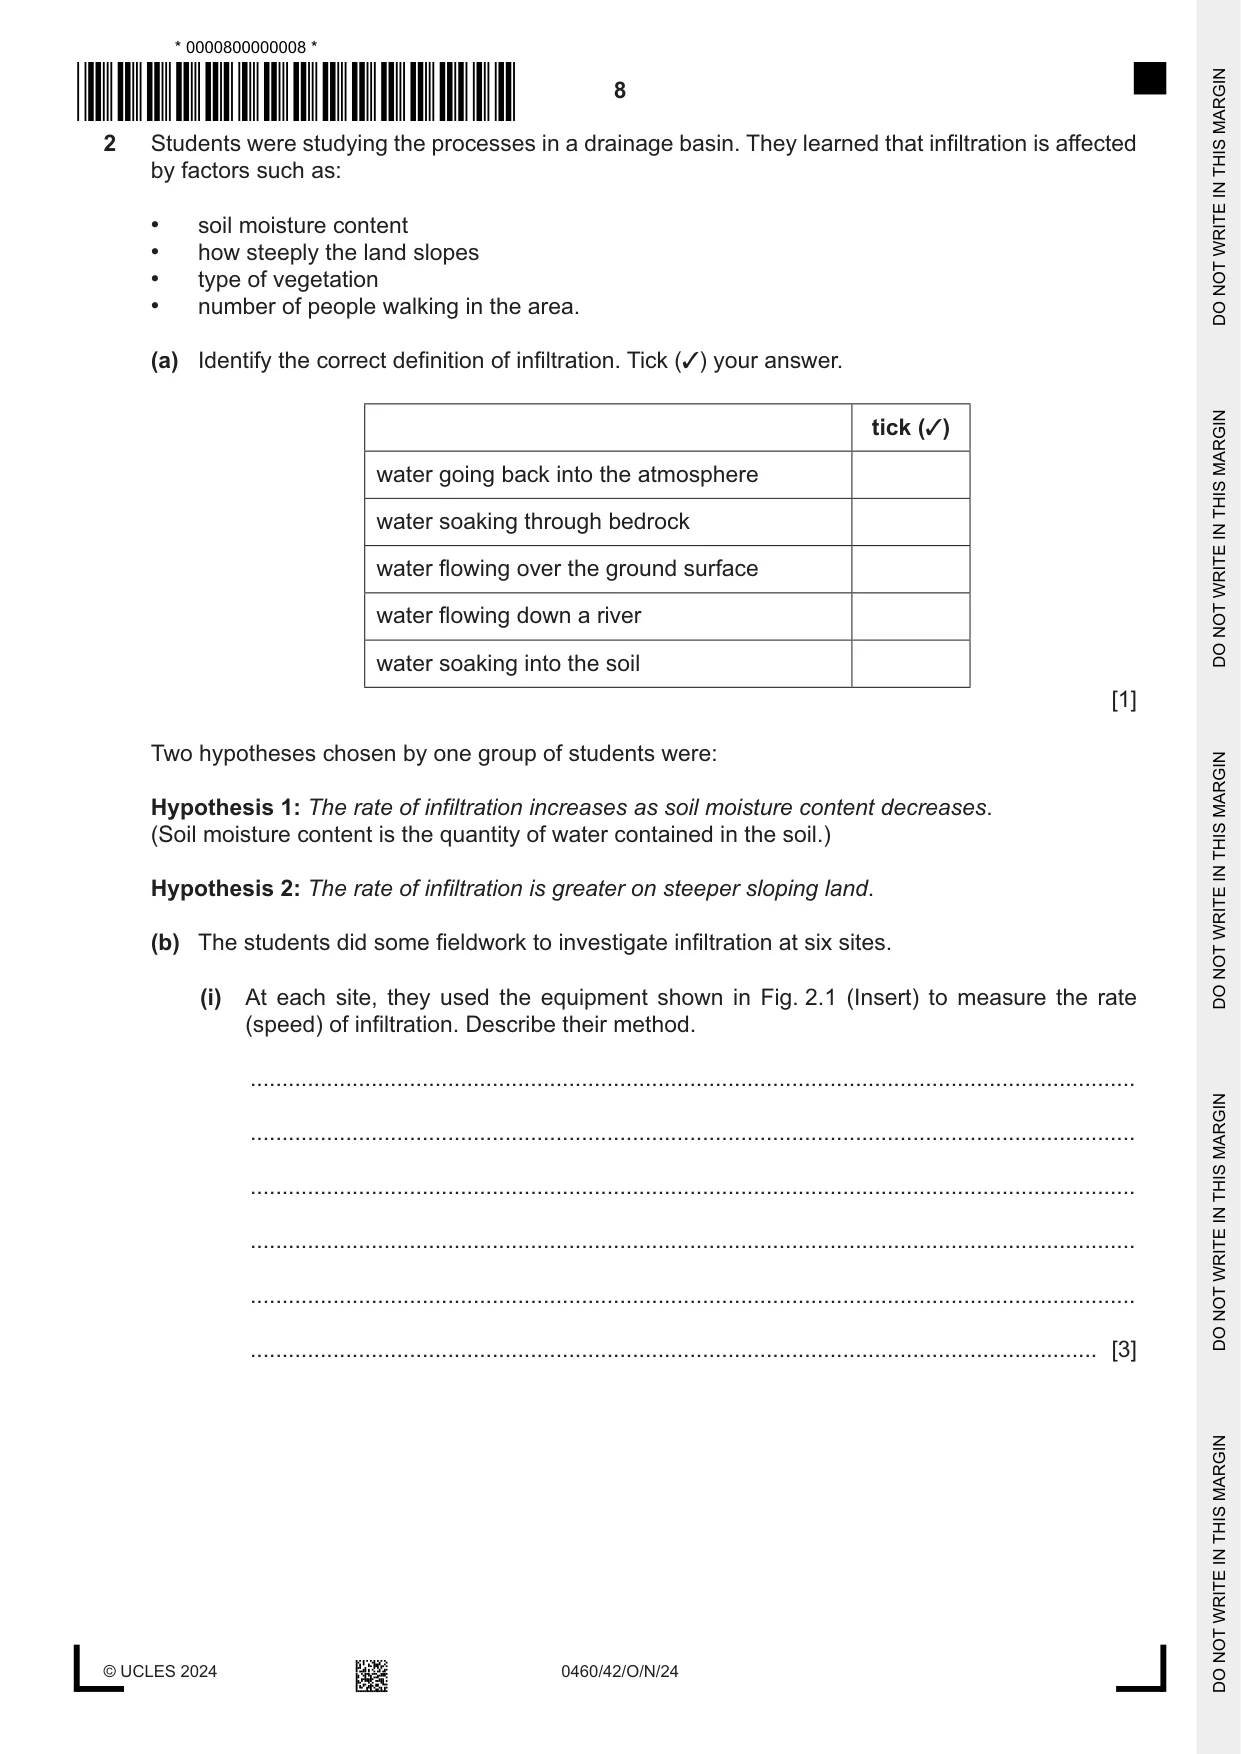
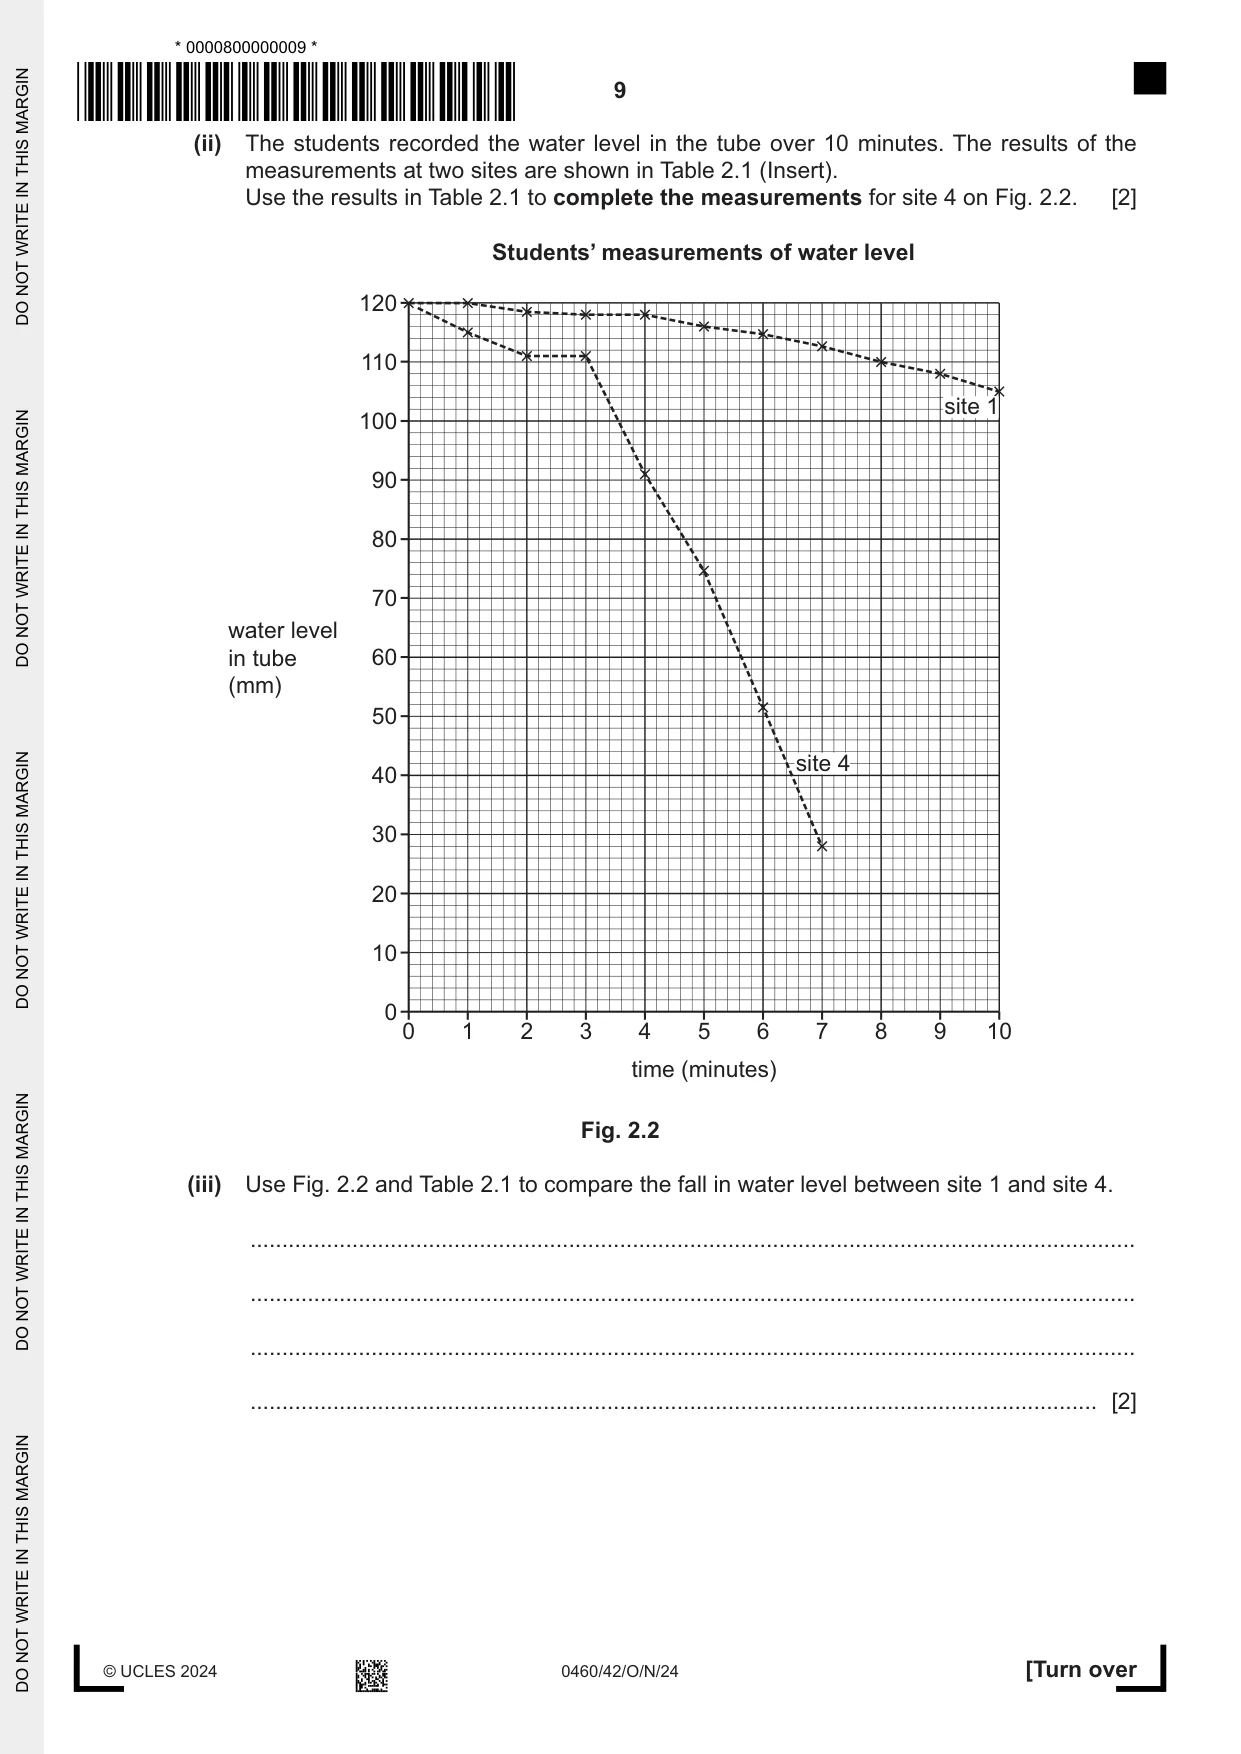
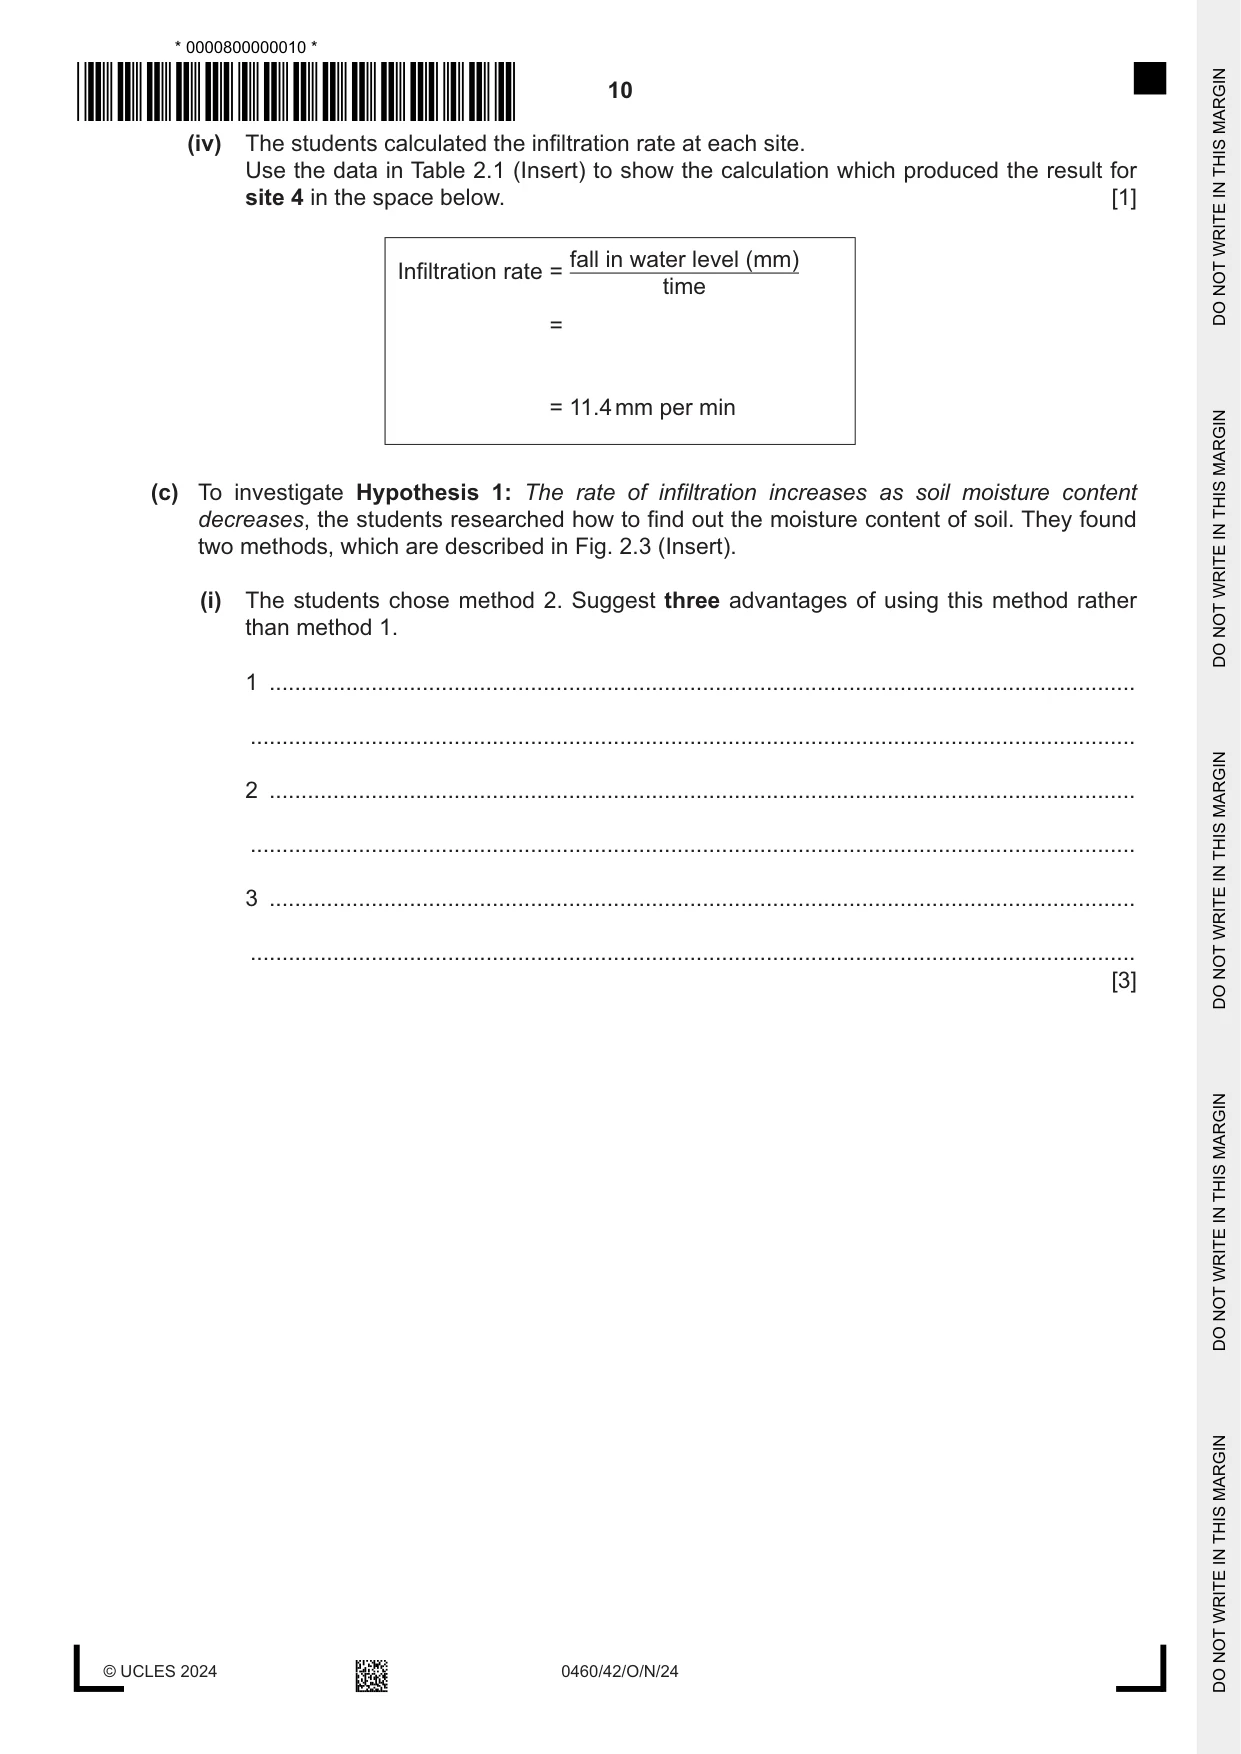
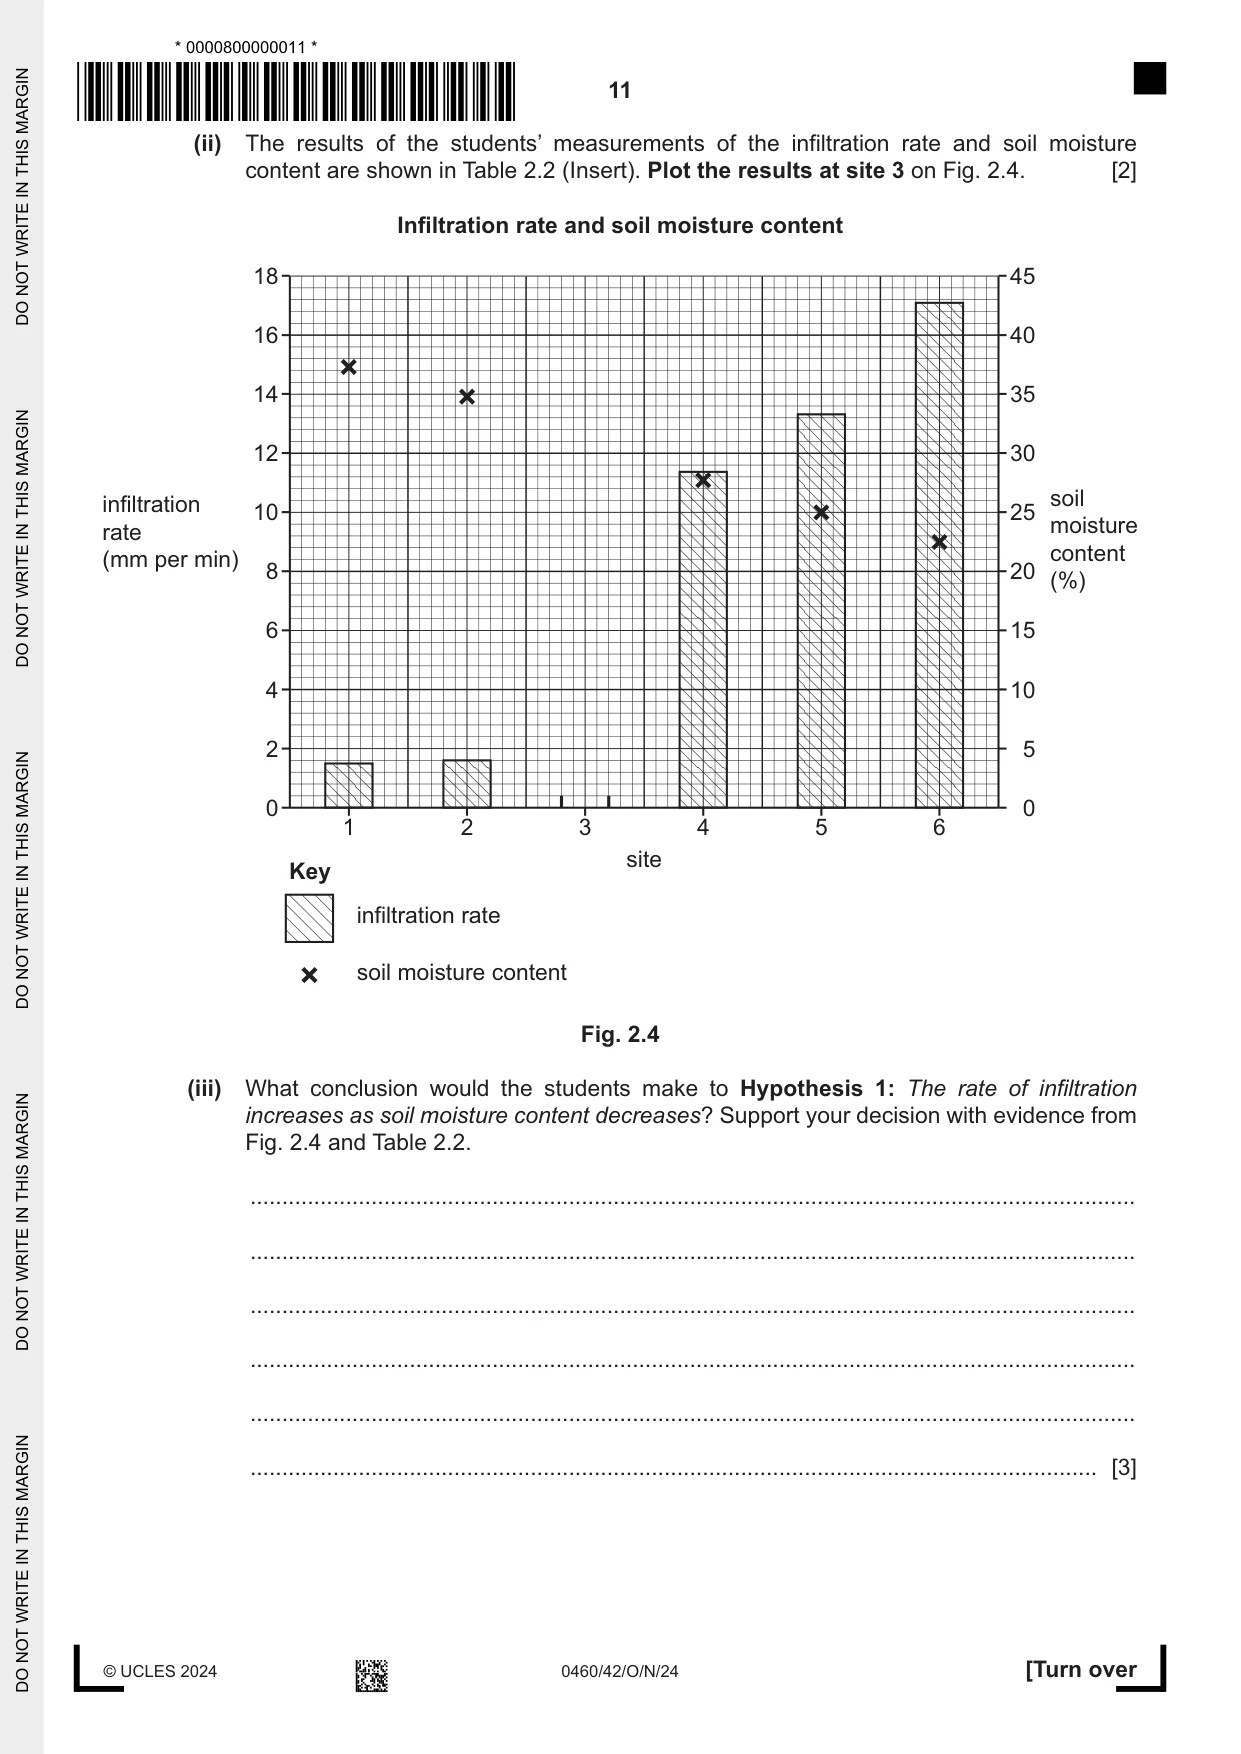
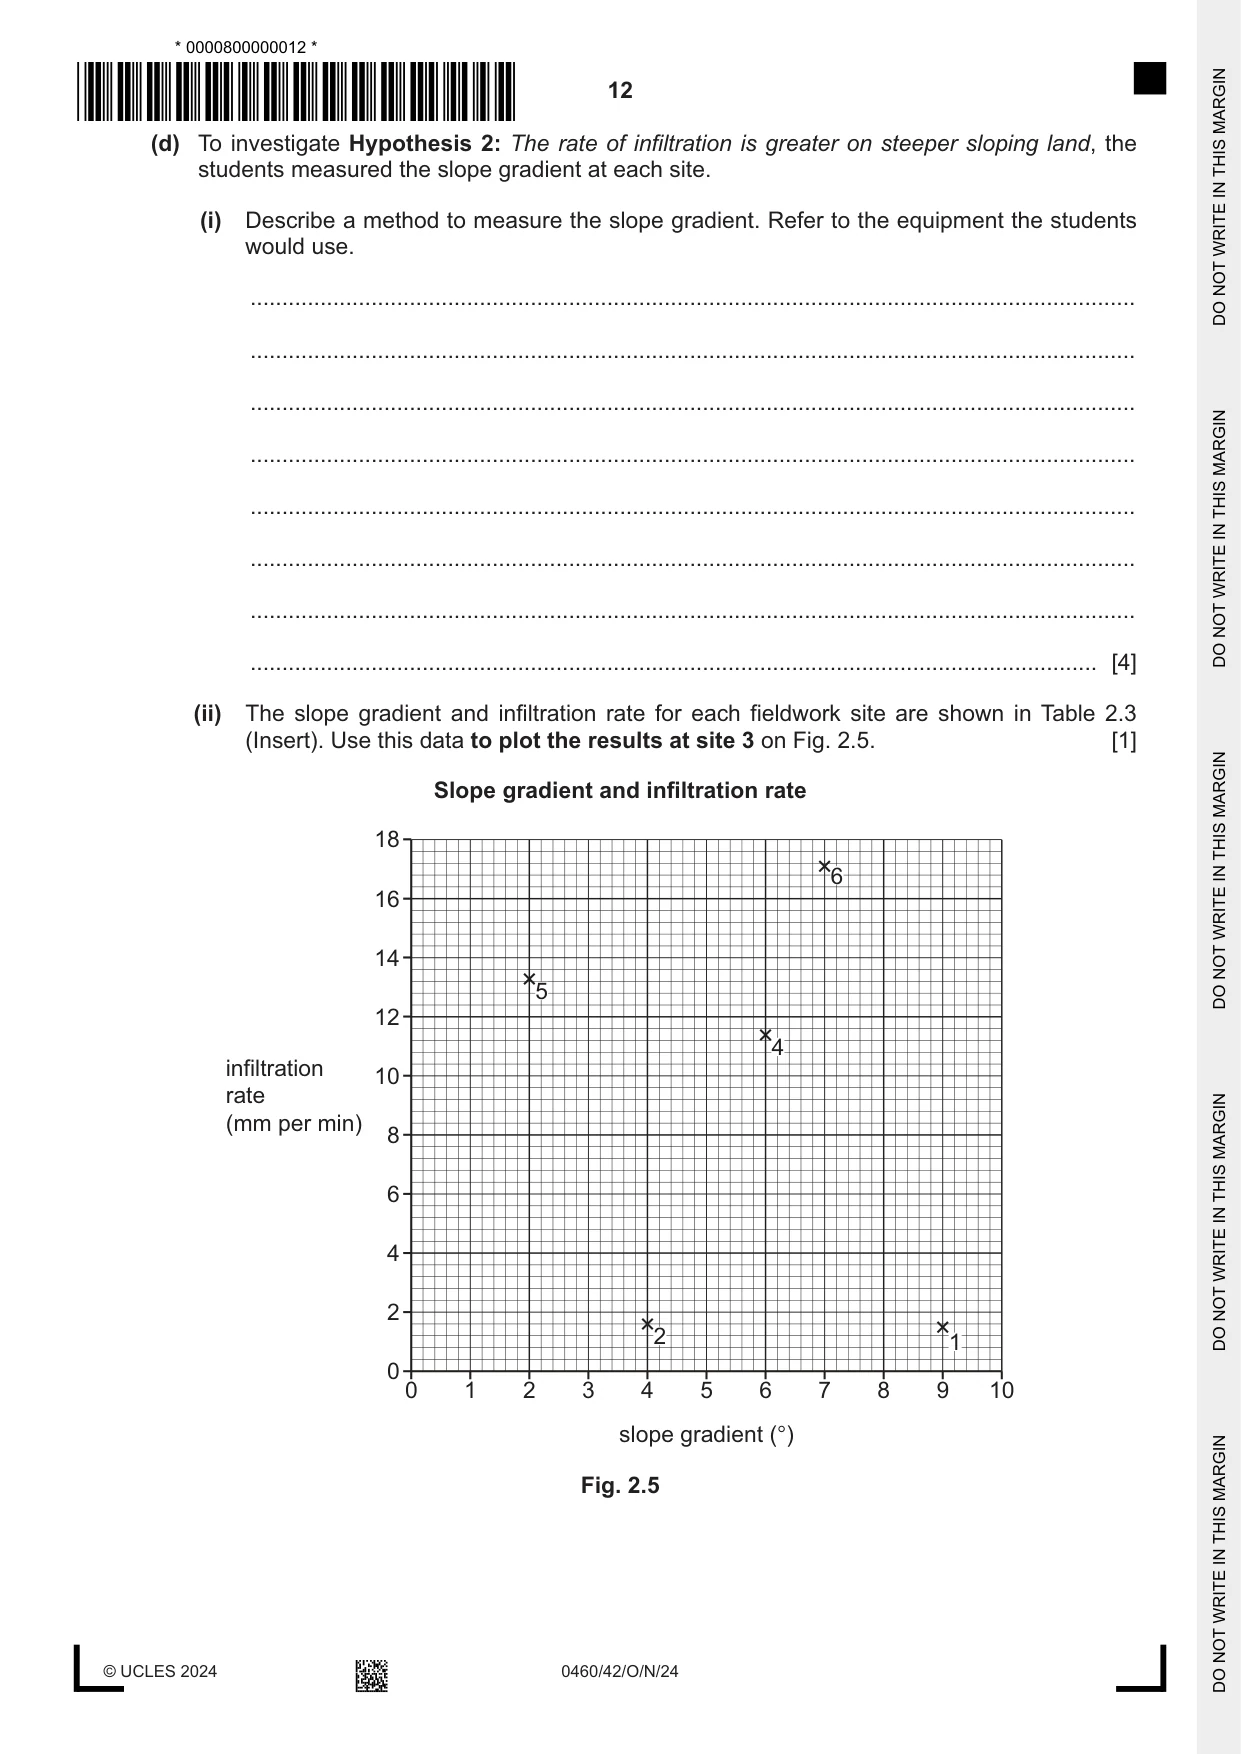
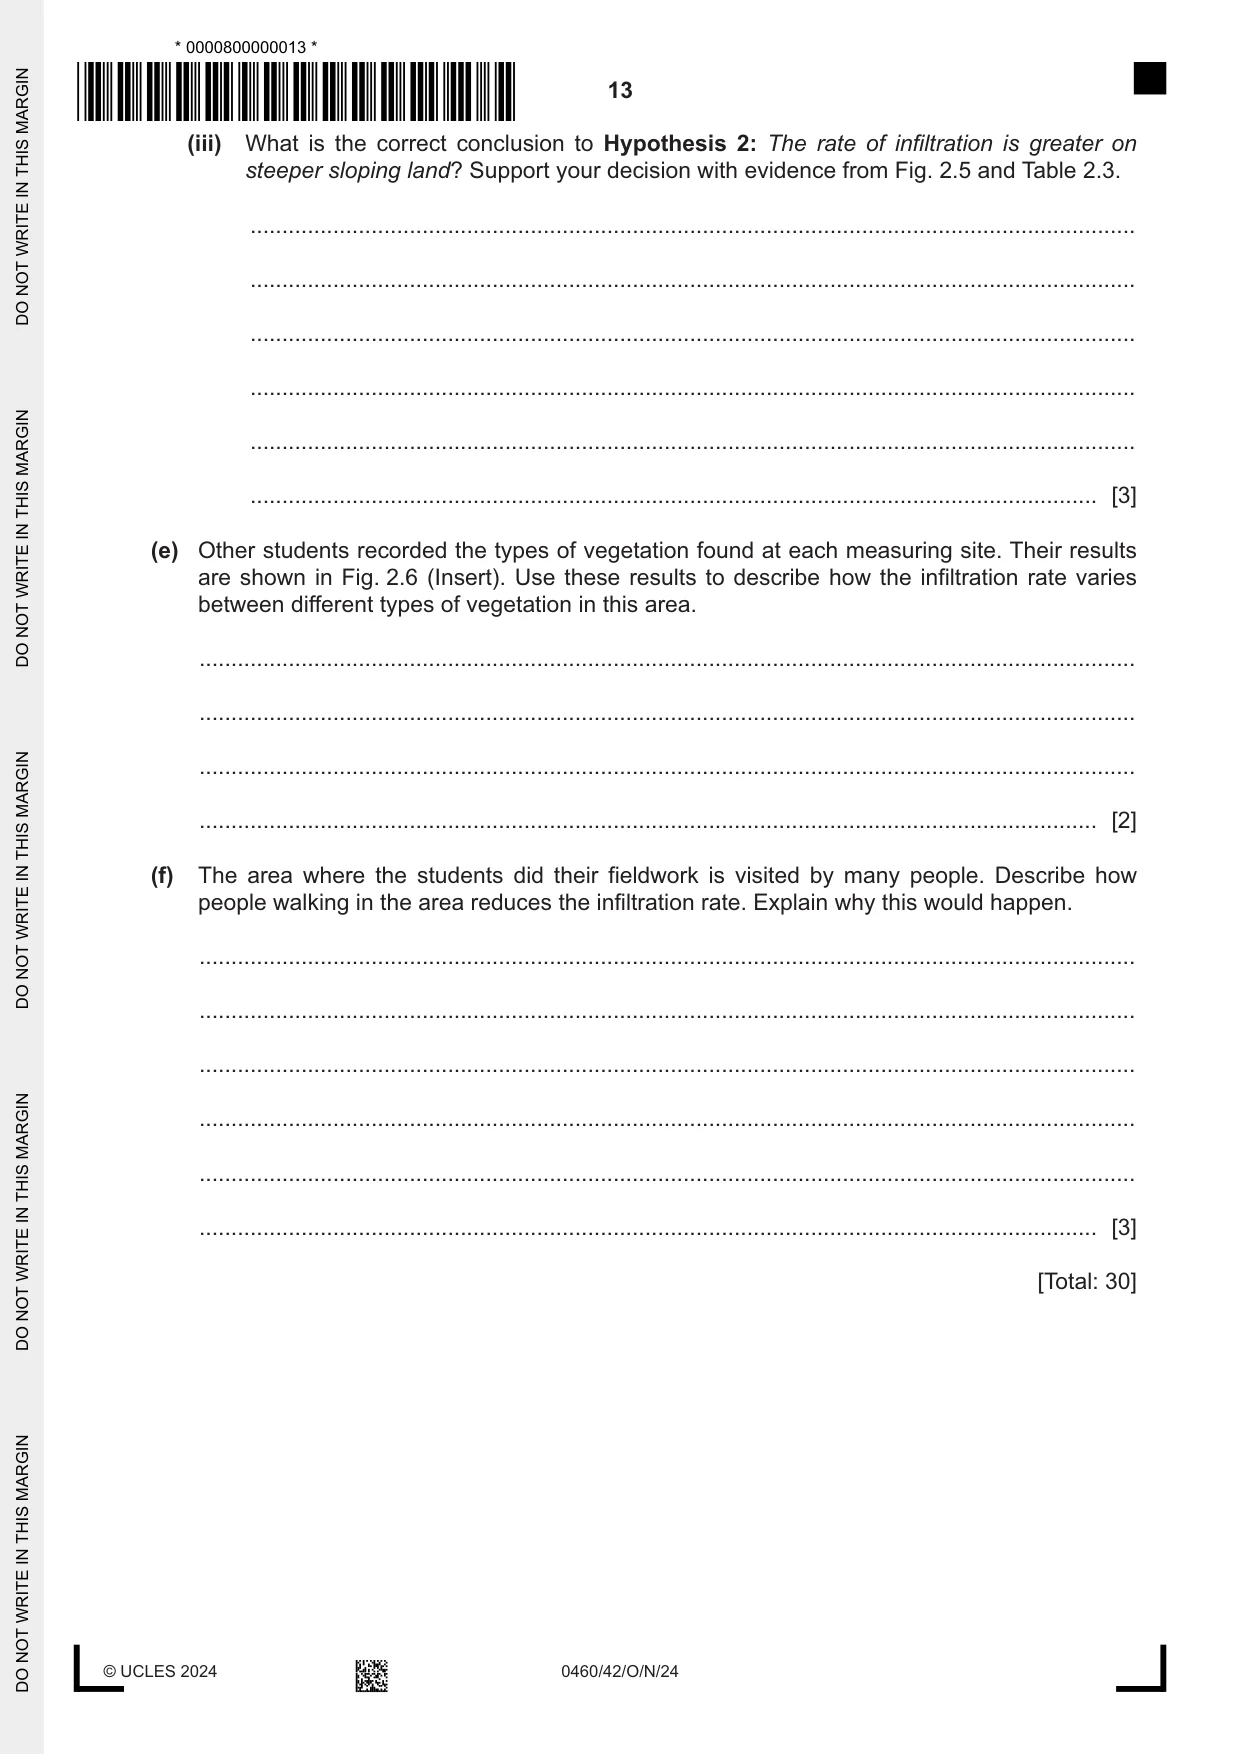
2 Students were studying the processes in a drainage basin. They learned that infiltration is affected by factors such as: • soil moisture content • how steeply the land slopes • type of vegetation • number of people walking in the area. (a) Identify the correct definition of infiltration. Tick (✓) your answer. tick (✓) water going back into the atmosphere water soaking through bedrock water flowing over the ground surface water flowing down a river water soaking into the soil [1] Two hypotheses chosen by one group of students were: Hypothesis 1: The rate of infiltration increases as soil moisture content decreases. (Soil moisture content is the quantity of water contained in the soil.) Hypothesis 2: The rate of infiltration is greater on steeper sloping land. (b) The students did some fieldwork to investigate infiltration at six sites. (i) At each site, they used the equipment shown in Fig. 2.1 (Insert) to measure the rate (speed) of infiltration. Describe their method. ........................................................................................................................................... ........................................................................................................................................... ........................................................................................................................................... ........................................................................................................................................... ........................................................................................................................................... ..................................................................................................................................... [3] (ii) The students recorded the water level in the tube over 10 minutes. The results of the measurements at two sites are shown in Table 2.1 (Insert). Use the results in Table 2.1 to complete the measurements for site 4 on Fig. 2.2. [2] Students’ measurements of water level 120 110 site 1 100 90 80 70 water level in tube 60 (mm) 50 site 4 40 30 20 10 0 0 1 2 3 4 5 6 7 8 9 10 time (minutes) Fig. 2.2 (iii) Use Fig. 2.2 and Table 2.1 to compare the fall in water level between site 1 and site 4. ........................................................................................................................................... ........................................................................................................................................... ........................................................................................................................................... ..................................................................................................................................... [2] (iv) The students calculated the infiltration rate at each site. Use the data in Table 2.1 (Insert) to show the calculation which produced the result for site 4 in the space below. [1] fall in water level (mm) Infiltration rate = time = = 11.4 mm per min (c) To investigate Hypothesis 1: The rate of infiltration increases as soil moisture content decreases, the students researched how to find out the moisture content of soil. They found two methods, which are described in Fig. 2.3 (Insert). (i) The students chose method 2. Suggest three advantages of using this method rather than method 1. 1 ........................................................................................................................................ ........................................................................................................................................... 2 ........................................................................................................................................ ........................................................................................................................................... 3 ........................................................................................................................................ ........................................................................................................................................... [3]
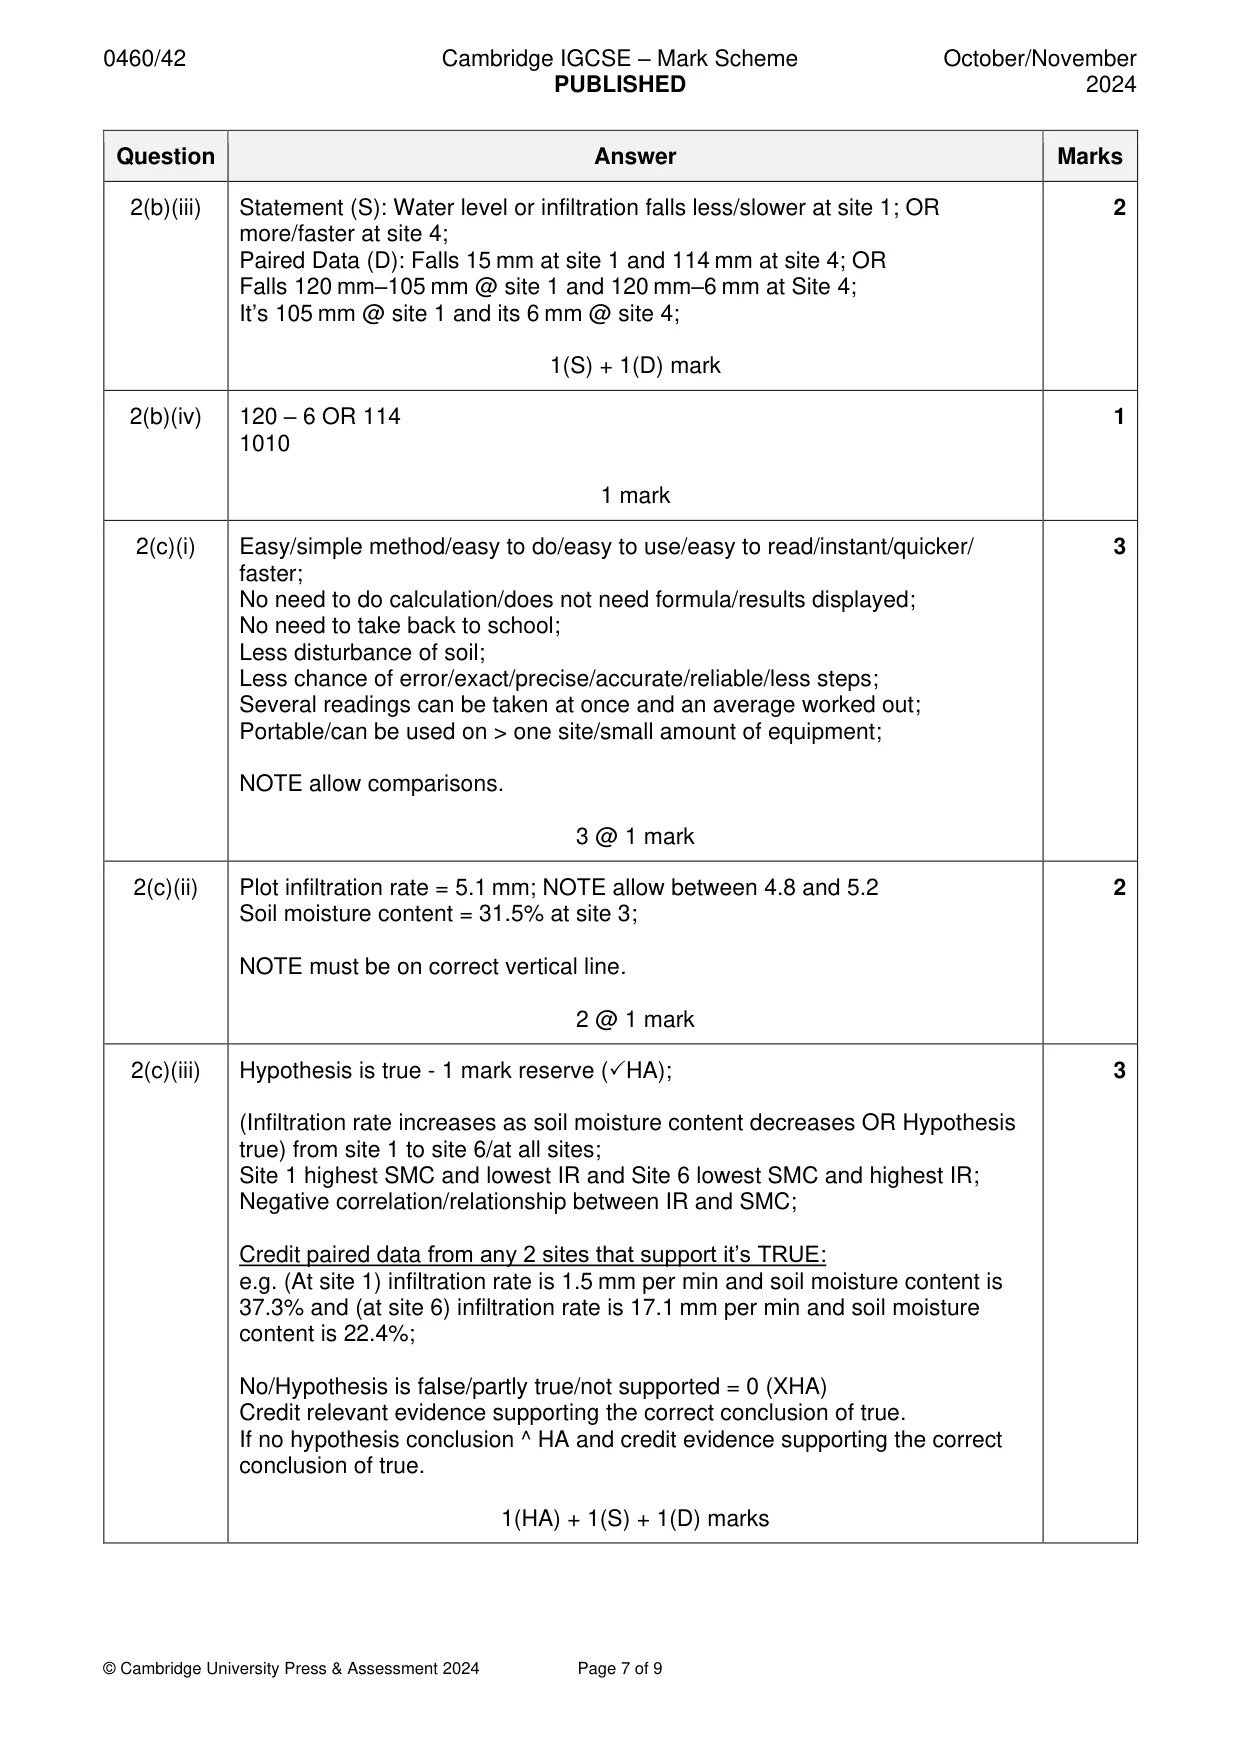
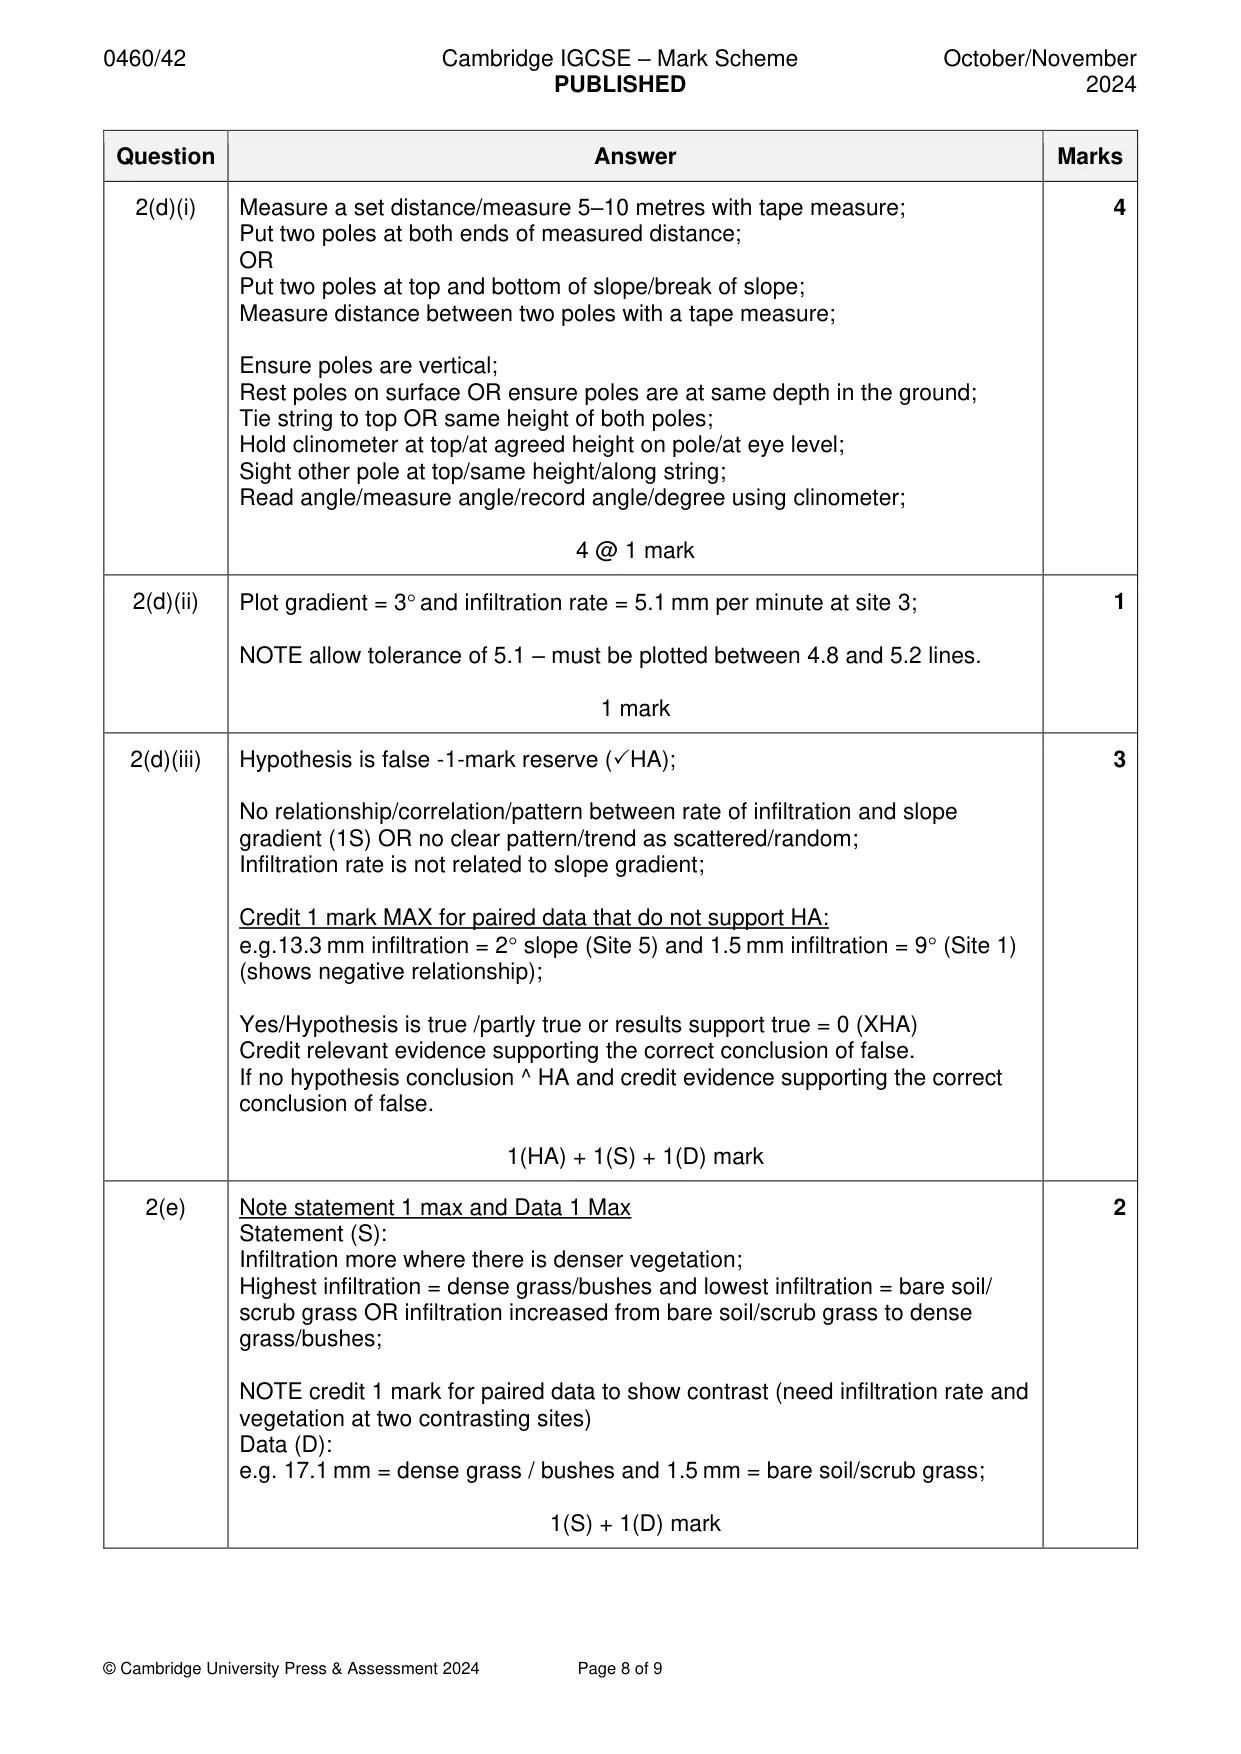
Mark scheme: 2(a) Row 5: Water soaking into the soil 1 1 mark 2(b)(i) Push tube into ground/push tube down until 0 (mm) is at surface; 3 Pour water into tube/fill tube with water; Start stopwatch when water at 120 mm/when water contacts soil/when water poured in tube; Use scale to measure changing height of water in tube; Stop stopwatch after a fixed time/10 minutes OR time until all water soaked into ground; Work out the change in level/rate of the water soaking into ground/measure time for water to soak into ground; 3 @ 1 mark 2(b)(ii) Complete site 4 measurements. 2 13 mm at 8 mins, 9 mm at 9 mins, 6 mm at 10 mins 2 marks if 3 plots correct 1 mark if 1 or 2 plots correct 2(b)(iii) Statement (S): Water level or infiltration falls less/slower at site 1; OR 2 more/faster at site 4; Paired Data (D): Falls 15 mm at site 1 and 114 mm at site 4; OR Falls 120 mm–105 mm @ site 1 and 120 mm–6 mm at Site 4; It’s 105 mm @ site 1 and its 6 mm @ site 4; 1(S) + 1(D) mark 2(b)(iv) 120 – 6 OR 114 1 1010 1 mark 2(c)(i) Easy/simple method/easy to do/easy to use/easy to read/instant/quicker/ 3 faster; No need to do calculation/does not need formula/results displayed; No need to take back to school; Less disturbance of soil; Less chance of error/exact/precise/accurate/reliable/less steps; Several readings can be taken at once and an average worked out; Portable/can be used on > one site/small amount of equipment; NOTE allow comparisons. 3 @ 1 mark 2(c)(ii) Plot infiltration rate = 5.1 mm; NOTE allow between 4.8 and 5.2 2 Soil moisture content = 31.5% at site 3; NOTE must be on correct vertical line. 2 @ 1 mark 2(c)(iii) Hypothesis is true - 1 mark reserve (HA); 3 (Infiltration rate increases as soil moisture content decreases OR Hypothesis true) from site 1 to site 6/at all sites; Site 1 highest SMC and lowest IR and Site 6 lowest SMC and highest IR; Negative correlation/relationship between IR and SMC; Credit paired data from any 2 sites that support it’s TRUE: e.g. (At site 1) infiltration rate is 1.5 mm per min and soil moisture content is 37.3% and (at site 6) infiltration rate is 17.1 mm per min and soil moisture content is 22.4%; No/Hypothesis is false/partly true/not supported = 0 (XHA) Credit relevant evidence supporting the correct conclusion of true. If no hypothesis conclusion ^ HA and credit evidence supporting the correct conclusion of true. 1(HA) + 1(S) + 1(D) marks 2(d)(i) Measure a set distance/measure 5–10 metres with tape measure; 4 Put two poles at both ends of measured distance; OR Put two poles at top and bottom of slope/break of slope; Measure distance between two poles with a tape measure; Ensure poles are vertical; Rest poles on surface OR ensure poles are at same depth in the ground; Tie string to top OR same height of both poles; Hold clinometer at top/at agreed height on pole/at eye level; Sight other pole at top/same height/along string; Read angle/measure angle/record angle/degree using clinometer; 4 @ 1 mark 2(d)(ii) Plot gradient = 3 and infiltration rate = 5.1 mm per minute at site 3; 1 NOTE allow tolerance of 5.1 – must be plotted between 4.8 and 5.2 lines. 1 mark 2(d)(iii) Hypothesis is false -1-mark reserve (HA); 3 No relationship/correlation/pattern between rate of infiltration and slope gradient (1S) OR no clear pattern/trend as scattered/random; Infiltration rate is not related to slope gradient; Credit 1 mark MAX for paired data that do not support HA: e.g.13.3 mm infiltration = 2 slope (Site 5) and 1.5 mm infiltration = 9 (Site 1) (shows negative relationship); Yes/Hypothesis is true /partly true or results support true = 0 (XHA) Credit relevant evidence supporting the correct conclusion of false. If no hypothesis conclusion ^ HA and credit evidence supporting the correct conclusion of false. 1(HA) + 1(S) + 1(D) mark 2(e) Note statement 1 max and Data 1 Max 2 Statement (S): Infiltration more where there is denser vegetation; Highest infiltration = dense grass/bushes and lowest infiltration = bare soil/ scrub grass OR infiltration increased from bare soil/scrub grass to dense grass/bushes; NOTE credit 1 mark for paired data to show contrast (need infiltration rate and vegetation at two contrasting sites) Data (D): e.g. 17.1 mm = dense grass / bushes and 1.5 mm = bare soil/scrub grass; 1(S) + 1(D) mark 2(f) Description: People (walking) compress/compact the ground/ground hardens; 3 People (walking) wear away/damage/disturb/kills the vegetation; Explanation: Less gaps in soil; Water cannot soak into the ground as quickly/reduces porosity; Less vegetation to extract water; 2(D) + 1(E) OR 1(D) + 2(E) marks
What was in this paper
The subtopics covered by these 2 questions, and how many questions each got. Open one in a new tab to see every Cambridge question on it.
What you needed in this session
Cambridge’s own grade thresholds for 2024 Oct/Nov, Paper 4 · Variant 2. A higher threshold means an easier paper — the bar moves with how the cohort did.