Cambridge IGCSE Geography 0460 — 2024 Oct/Nov Paper 2 · Variant 2
0460/22/O/N/24 · 6 questions · 60 marks · ≈68 min
The question paper and its mark scheme, free to read here and free to download. This is Cambridge’s own paper, exactly as it was sat.
Question paper20 pages
Mark scheme9 pages
Answers below. Sit the paper first if you are practising.

Questions as text
Q1 · Study the map extract for Olang Valdaora, Italy
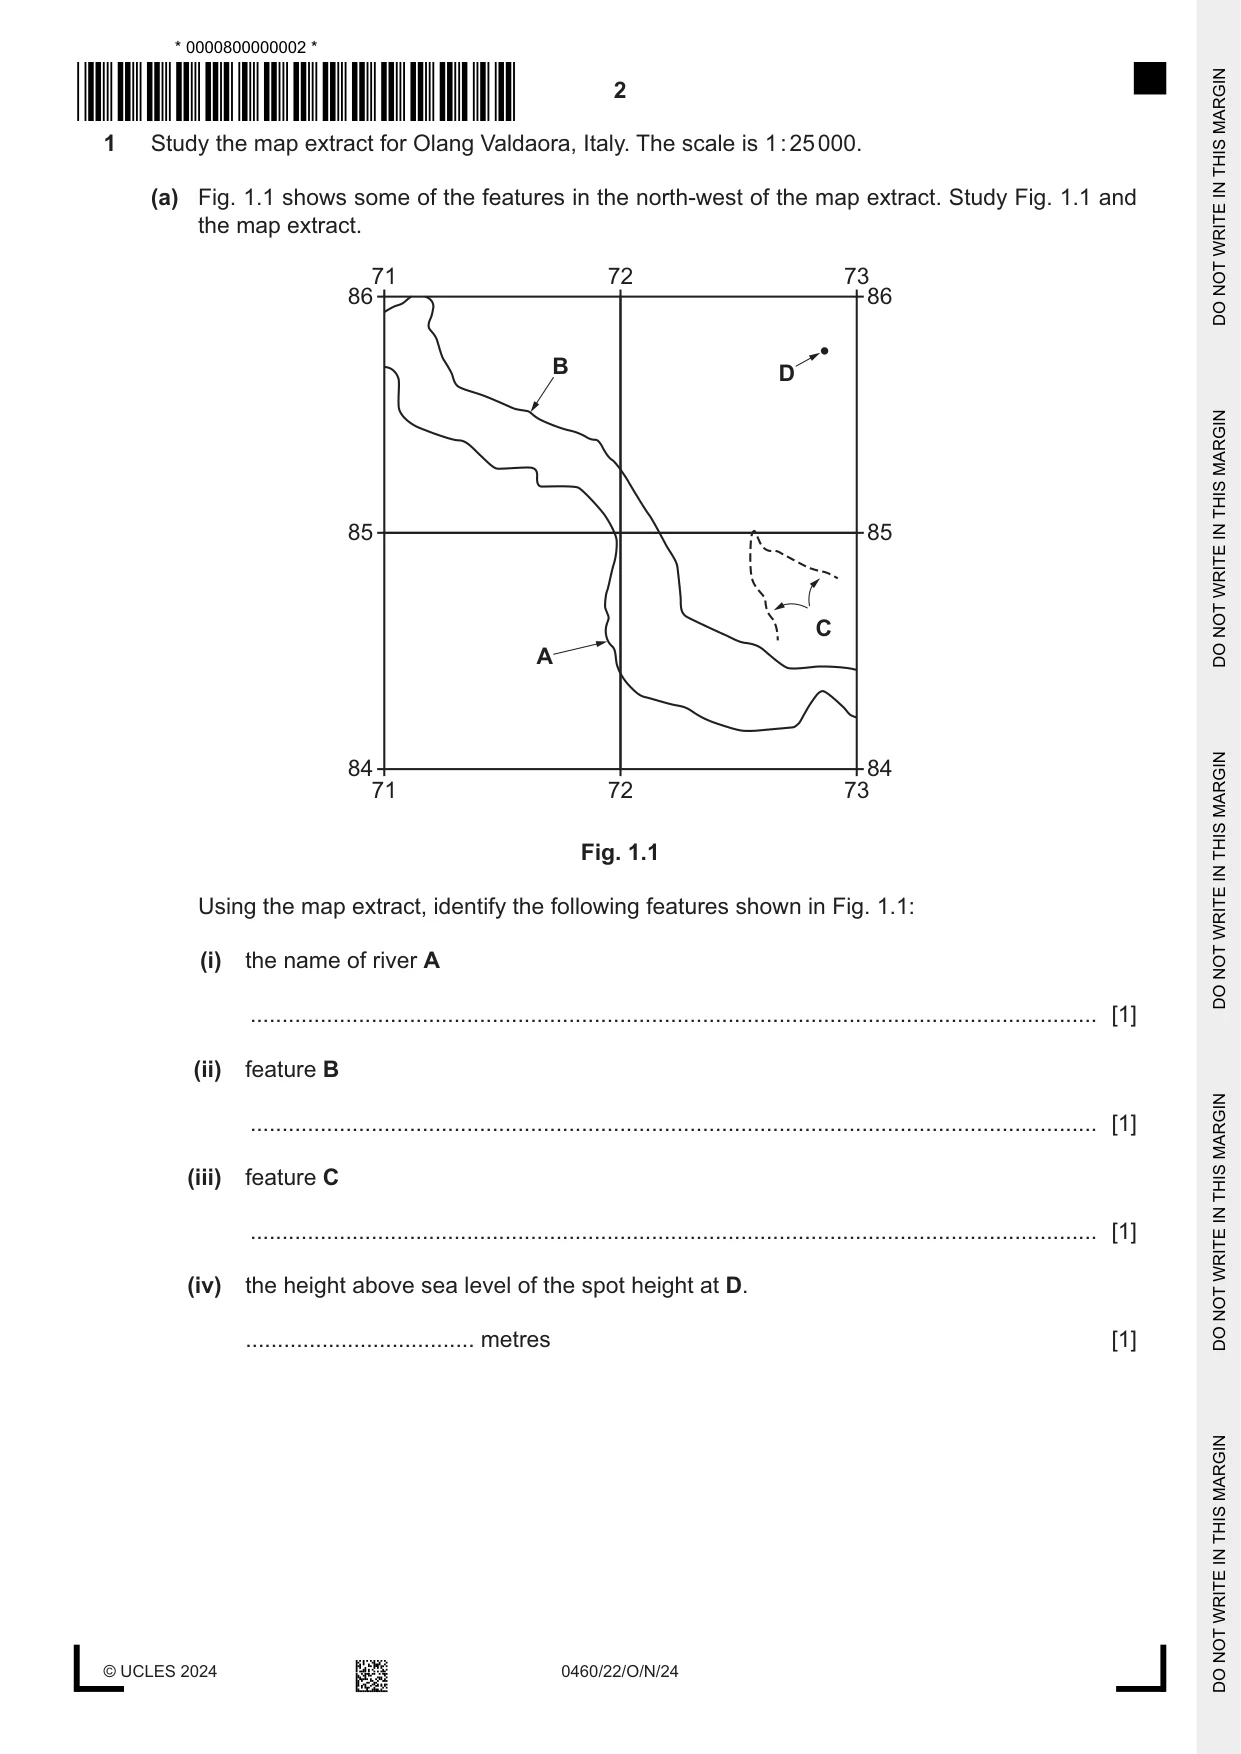
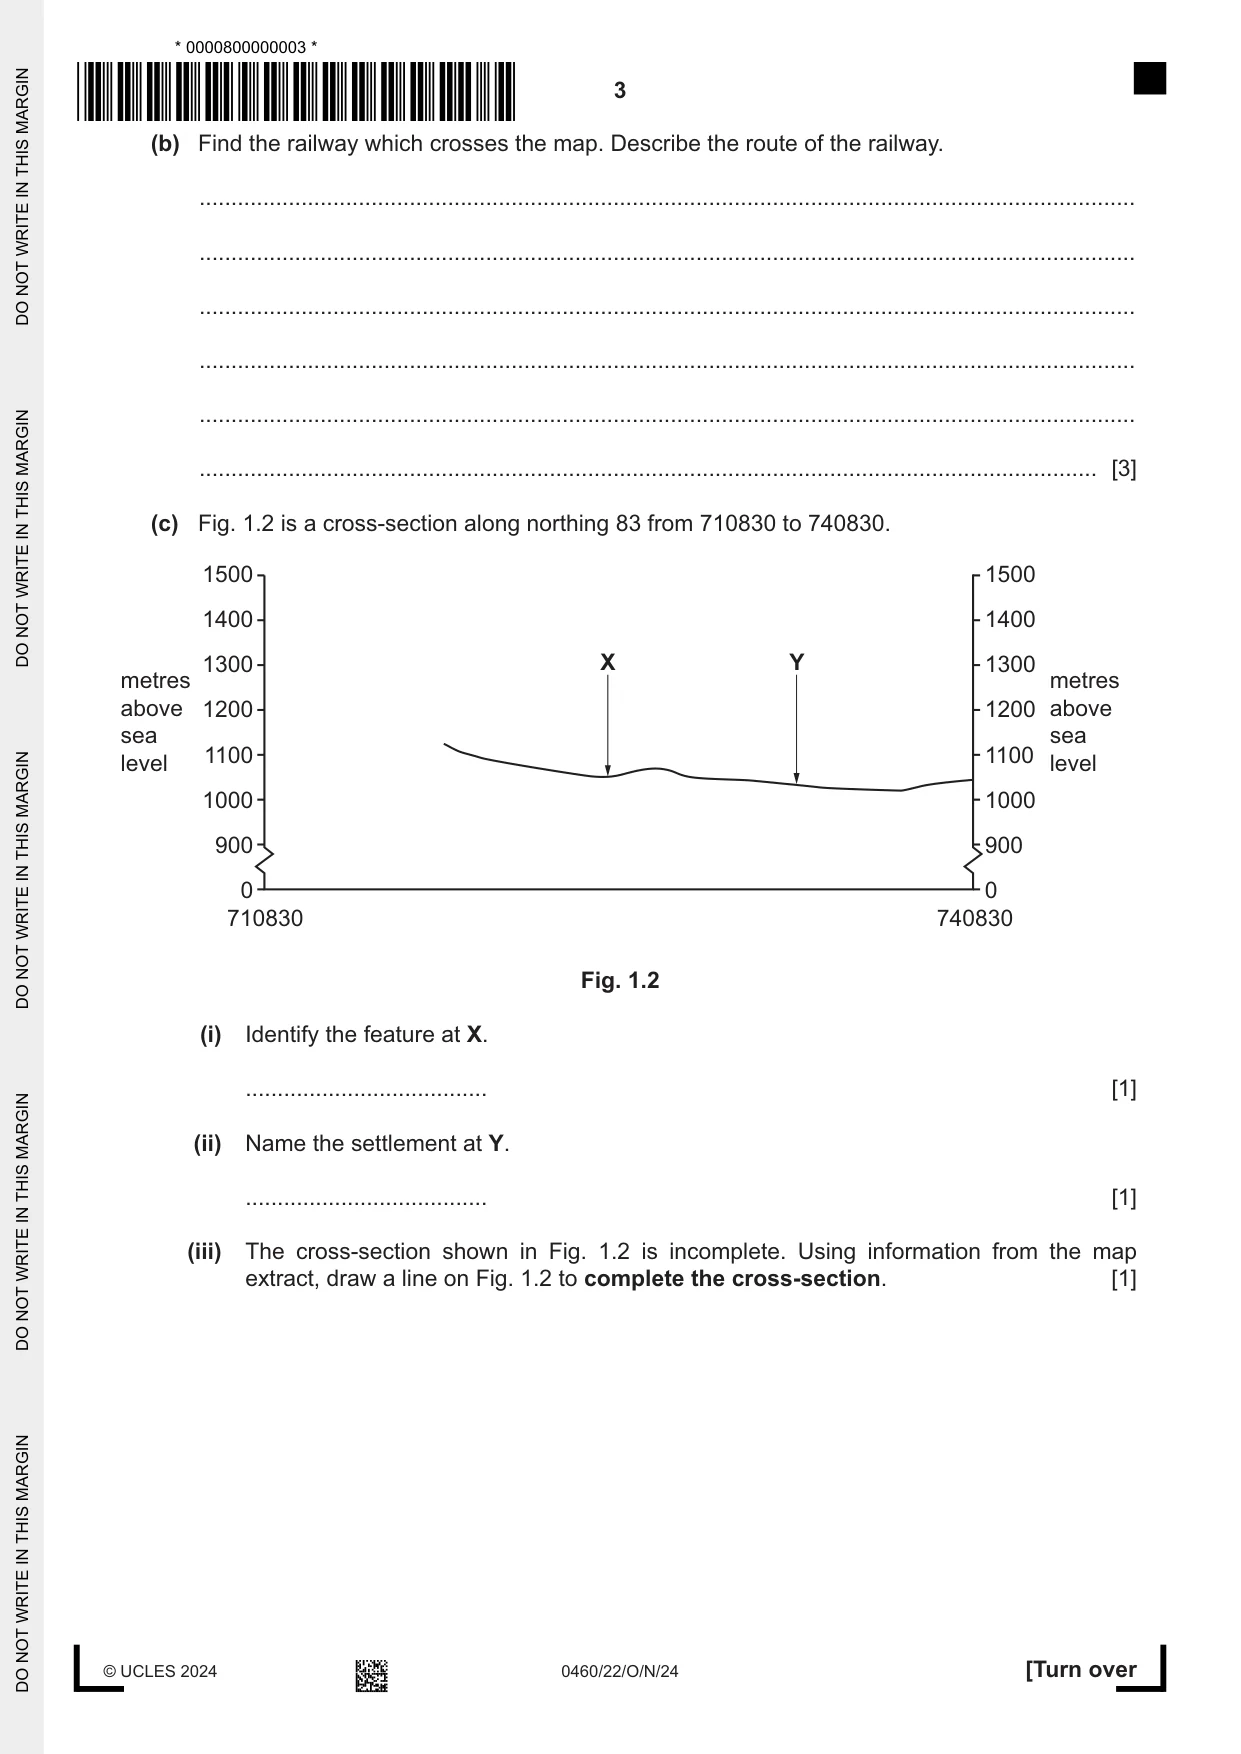
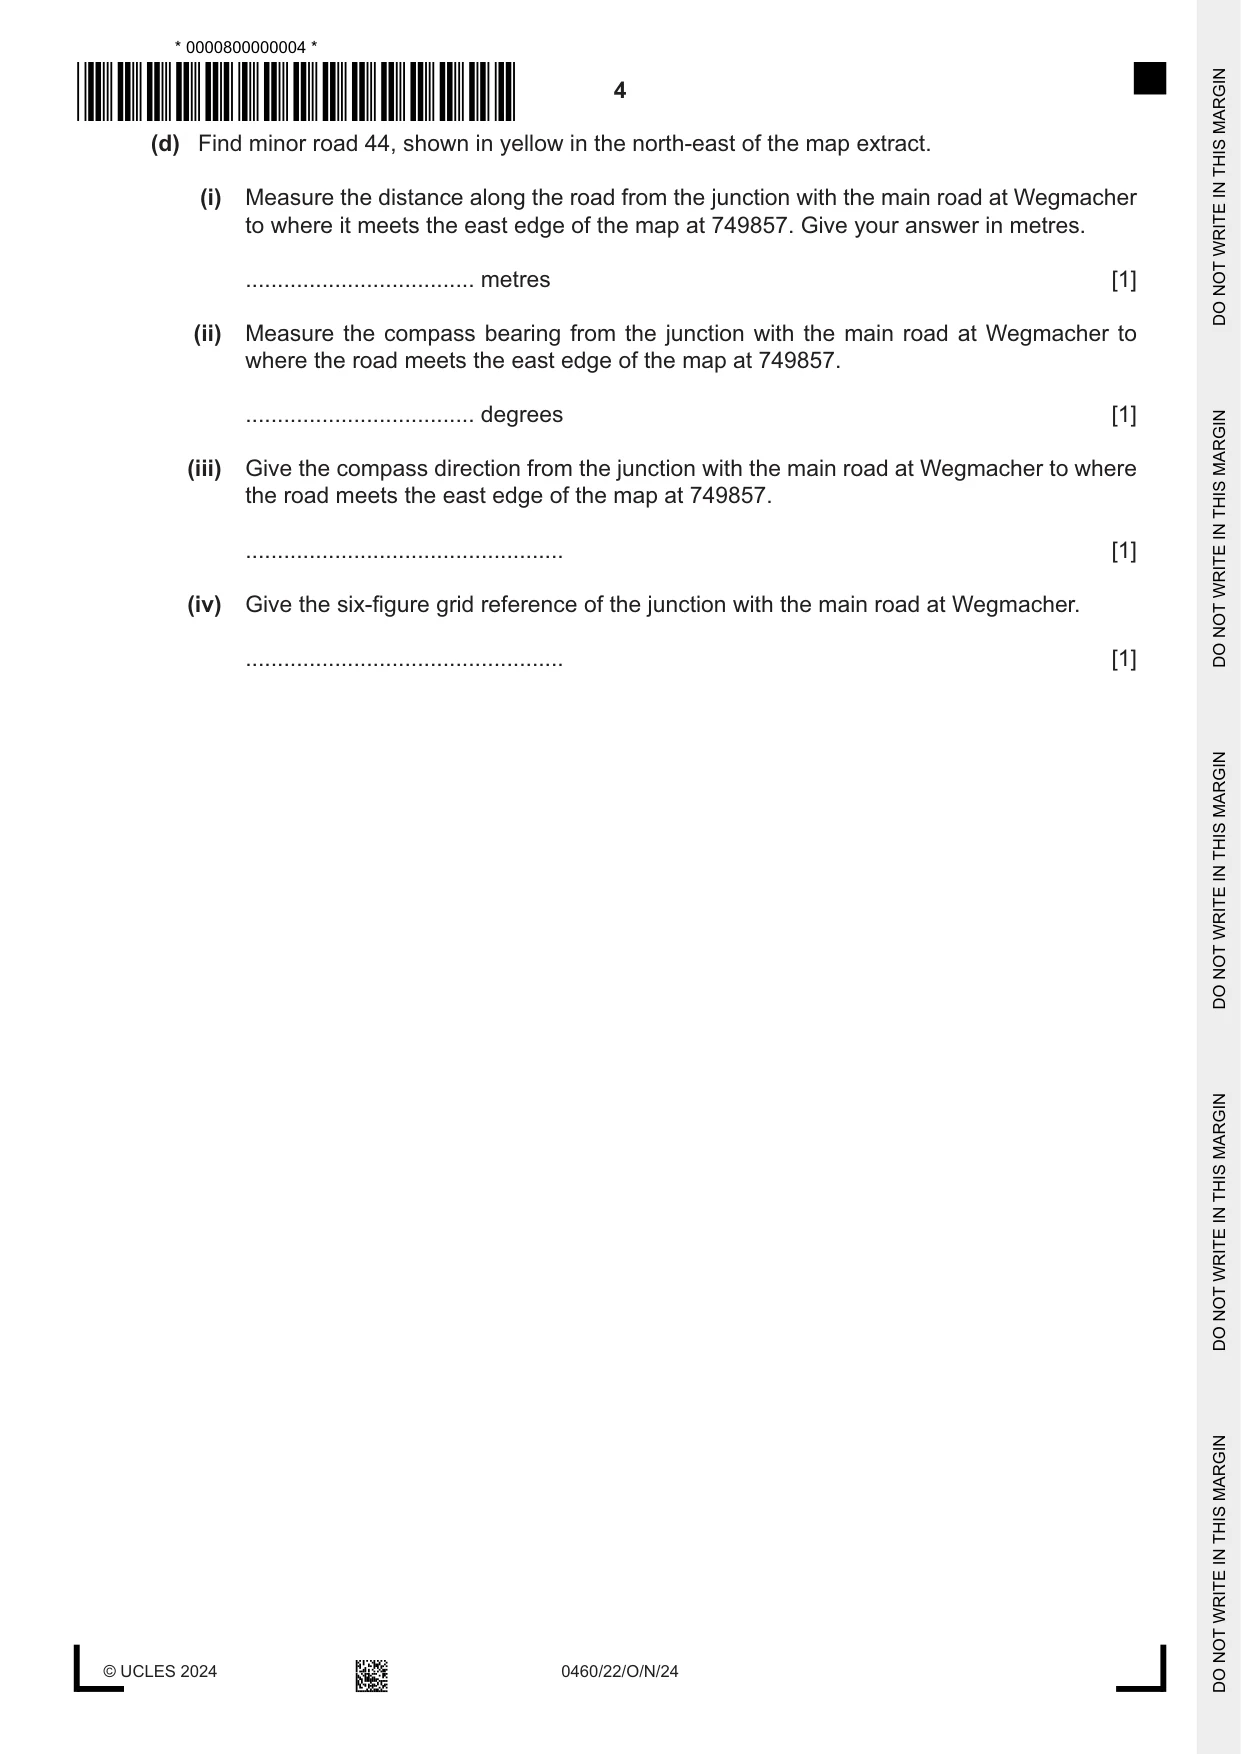
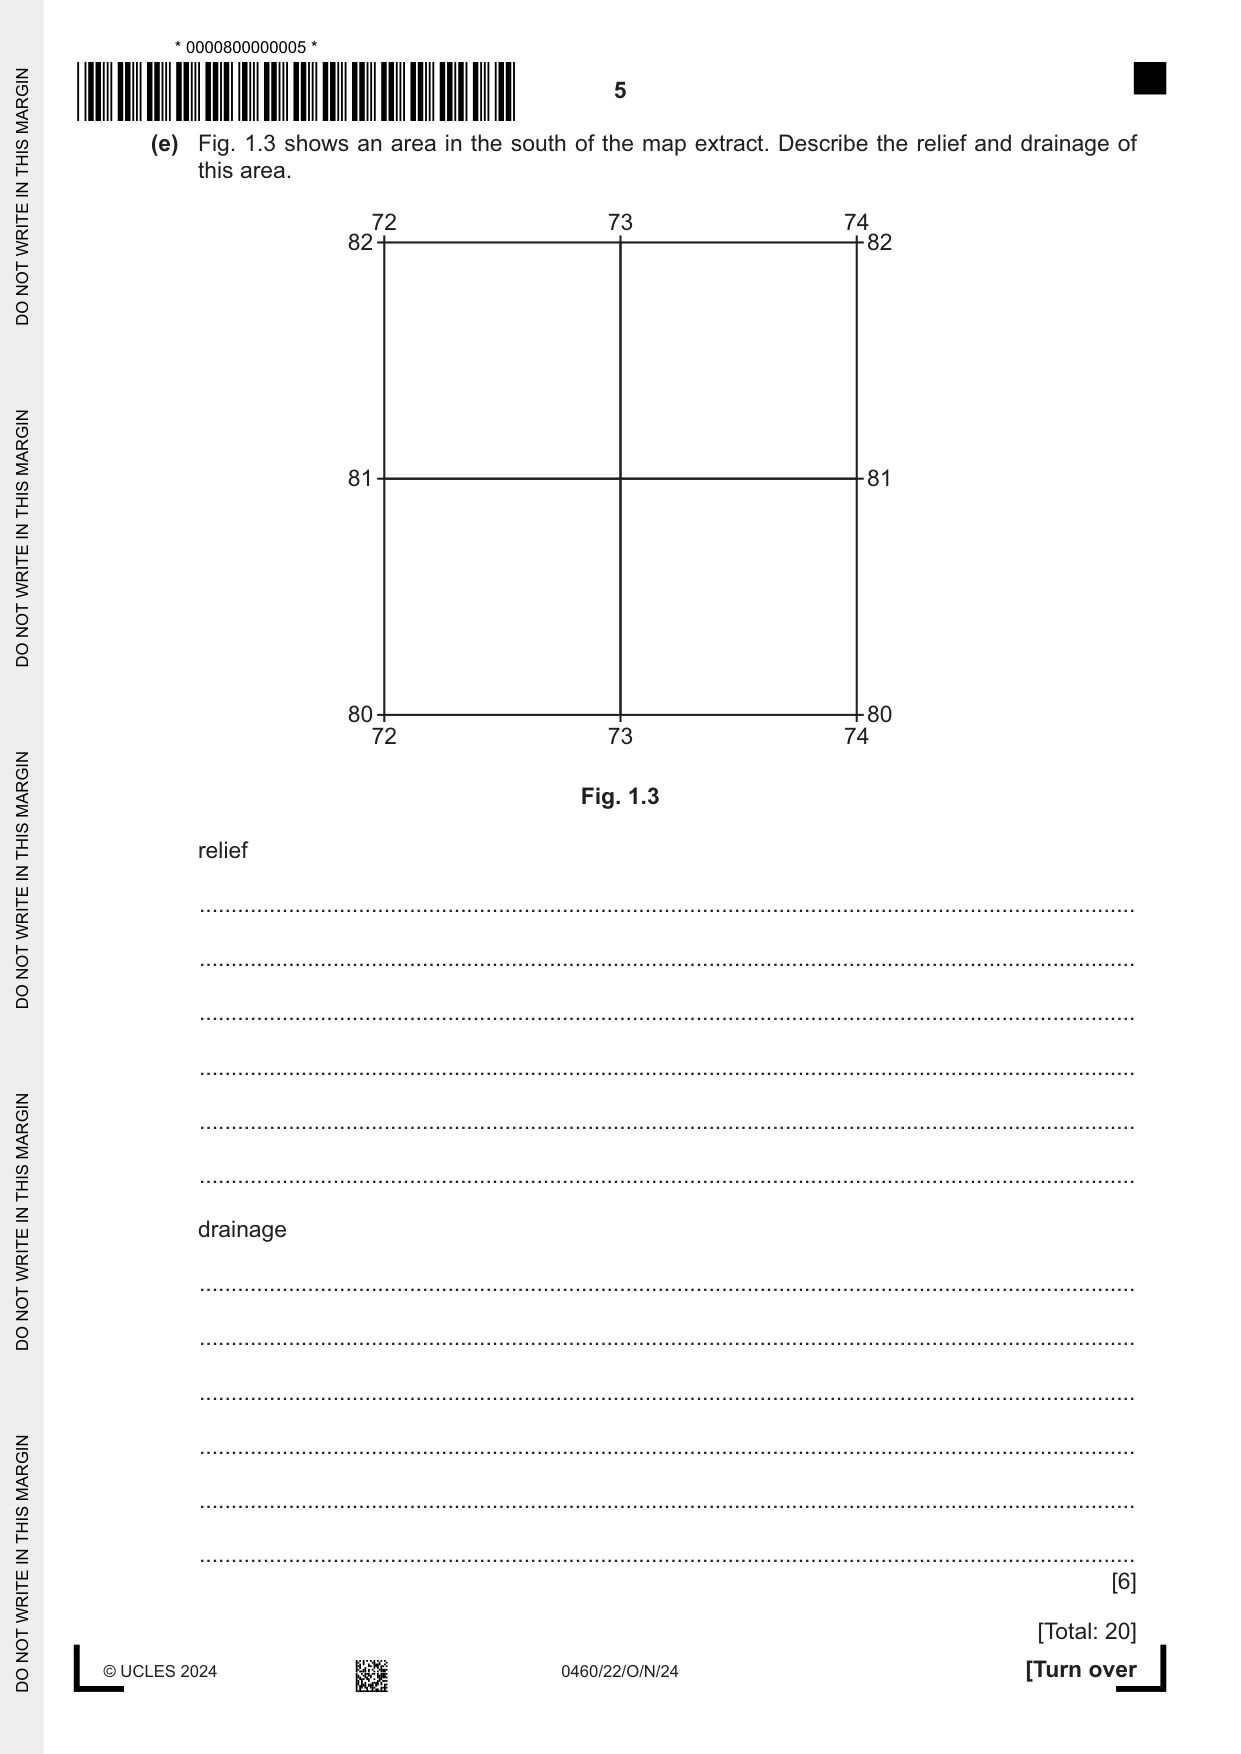
1 Study the map extract for Olang Valdaora, Italy. The scale is 1 : 25 000. (a) Fig. 1.1 shows some of the features in the north-west of the map extract. Study Fig. 1.1 and the map extract. 71 72 73 86 86 B D 85 85 C A 84 84 71 72 73 Fig. 1.1 Using the map extract, identify the following features shown in Fig. 1.1: (i) the name of river A ..................................................................................................................................... [1] (ii) feature B ..................................................................................................................................... [1] (iii) feature C ..................................................................................................................................... [1] (iv) the height above sea level of the spot height at D. .................................... metres [1] (b) Find the railway which crosses the map. Describe the route of the railway. ................................................................................................................................................... ................................................................................................................................................... ................................................................................................................................................... ................................................................................................................................................... ................................................................................................................................................... ............................................................................................................................................. [3] (c) Fig. 1.2 is a cross-section along northing 83 from 710830 to 740830. 1500 1500 1400 1400 1300 X Y 1300 metres metres above 1200 1200 above sea sea 1100 1100level level 1000 1000 900 900 0 0 710830 740830 Fig. 1.2 (i) Identify the feature at X. ...................................... [1] (ii) Name the settlement at Y. ...................................... [1] (iii) The cross-section shown in Fig. 1.2 is incomplete. Using information from the map extract, draw a line on Fig. 1.2 to complete the cross-section. [1] (d) Find minor road 44, shown in yellow in the north-east of the map extract. (i) Measure the distance along the road from the junction with the main road at Wegmacher to where it meets the east edge of the map at 749857. Give your answer in metres. .................................... metres [1] (ii) Measure the compass bearing from the junction with the main road at Wegmacher to where the road meets the east edge of the map at 749857. .................................... degrees [1] (iii) Give the compass direction from the junction with the main road at Wegmacher to where the road meets the east edge of the map at 749857. .................................................. [1] (iv) Give the six-figure grid reference of the junction with the main road at Wegmacher. .................................................. [1] (e) Fig. 1.3 shows an area in the south of the map extract. Describe the relief and drainage of this area. 72 73 74 82 82 81 81 80 80 72 73 74 Fig. 1.3 relief ................................................................................................................................................... ................................................................................................................................................... ................................................................................................................................................... ................................................................................................................................................... ................................................................................................................................................... ................................................................................................................................................... drainage ................................................................................................................................................... ................................................................................................................................................... ................................................................................................................................................... ................................................................................................................................................... ................................................................................................................................................... ................................................................................................................................................... [6] [Total: 20]
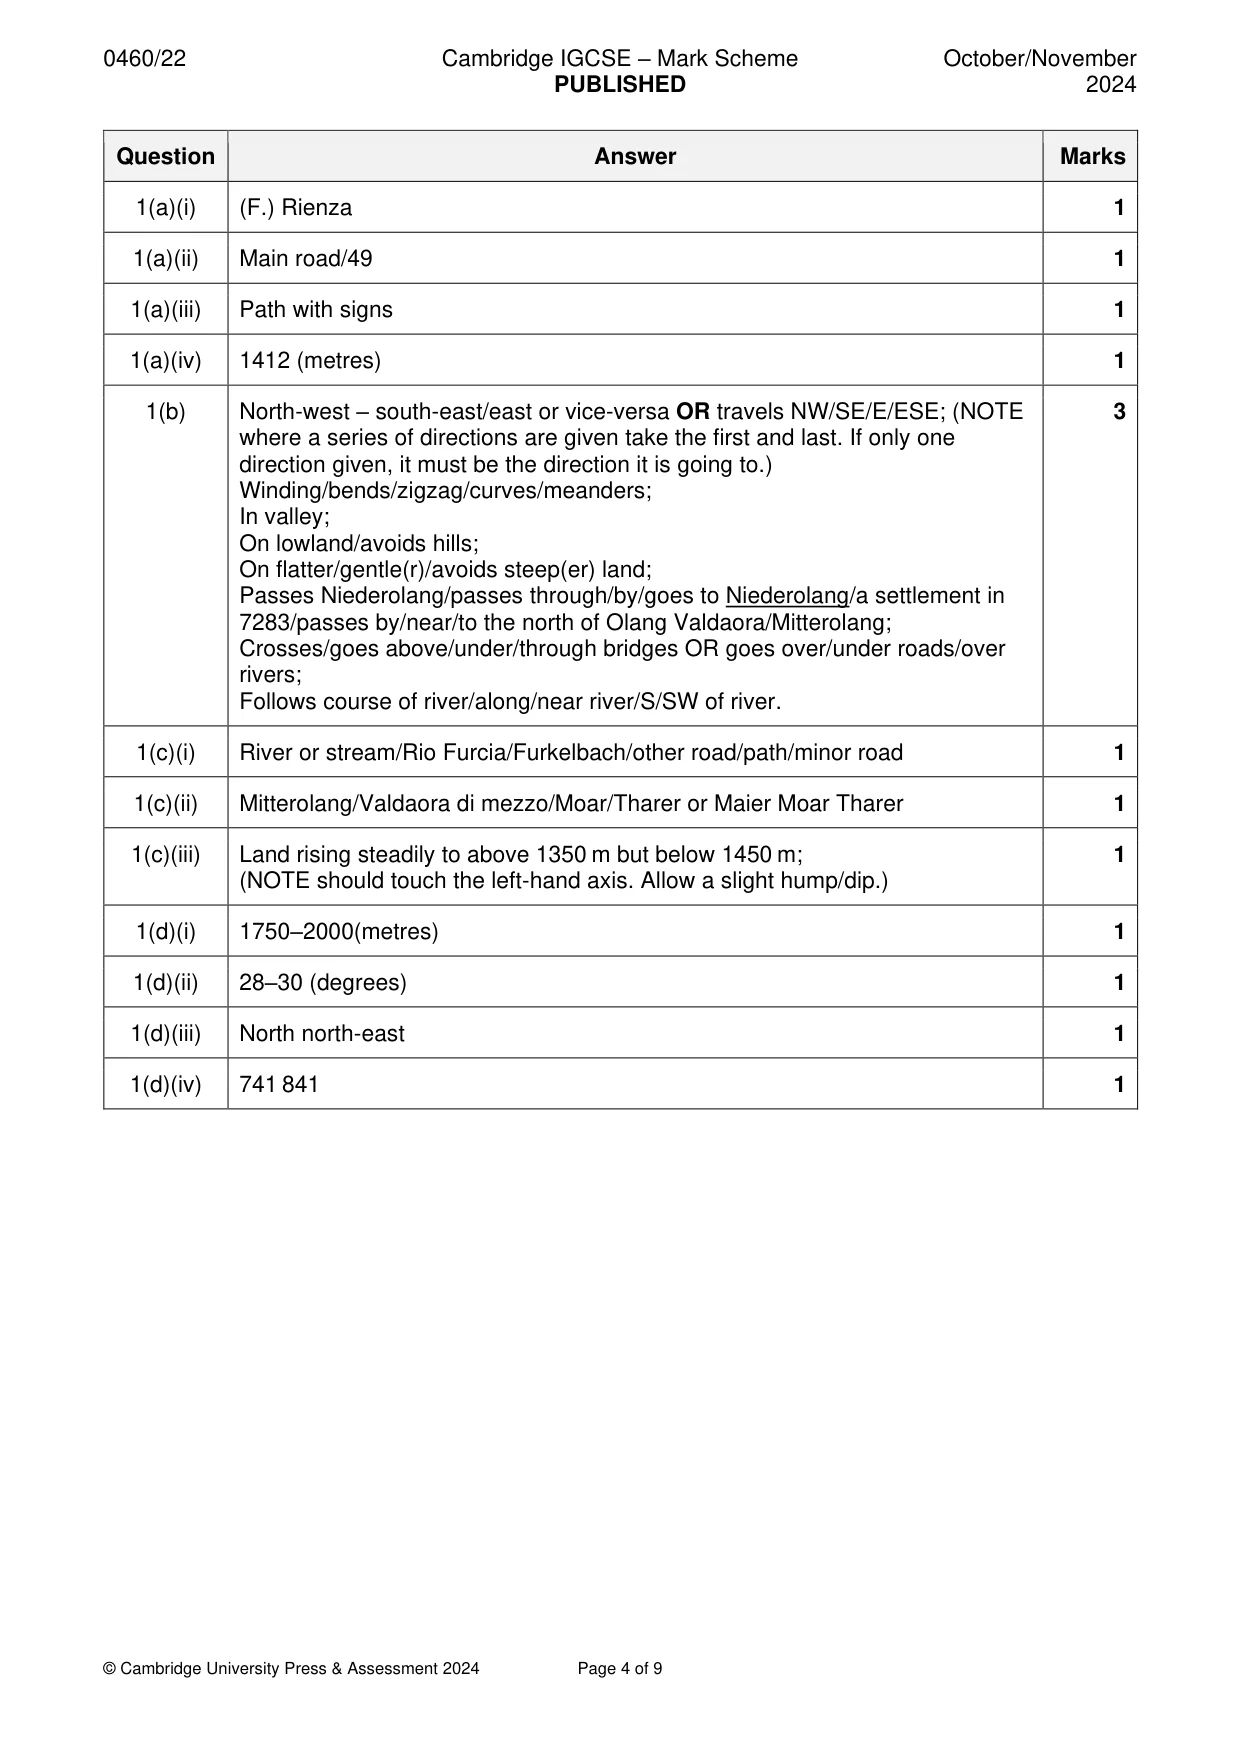
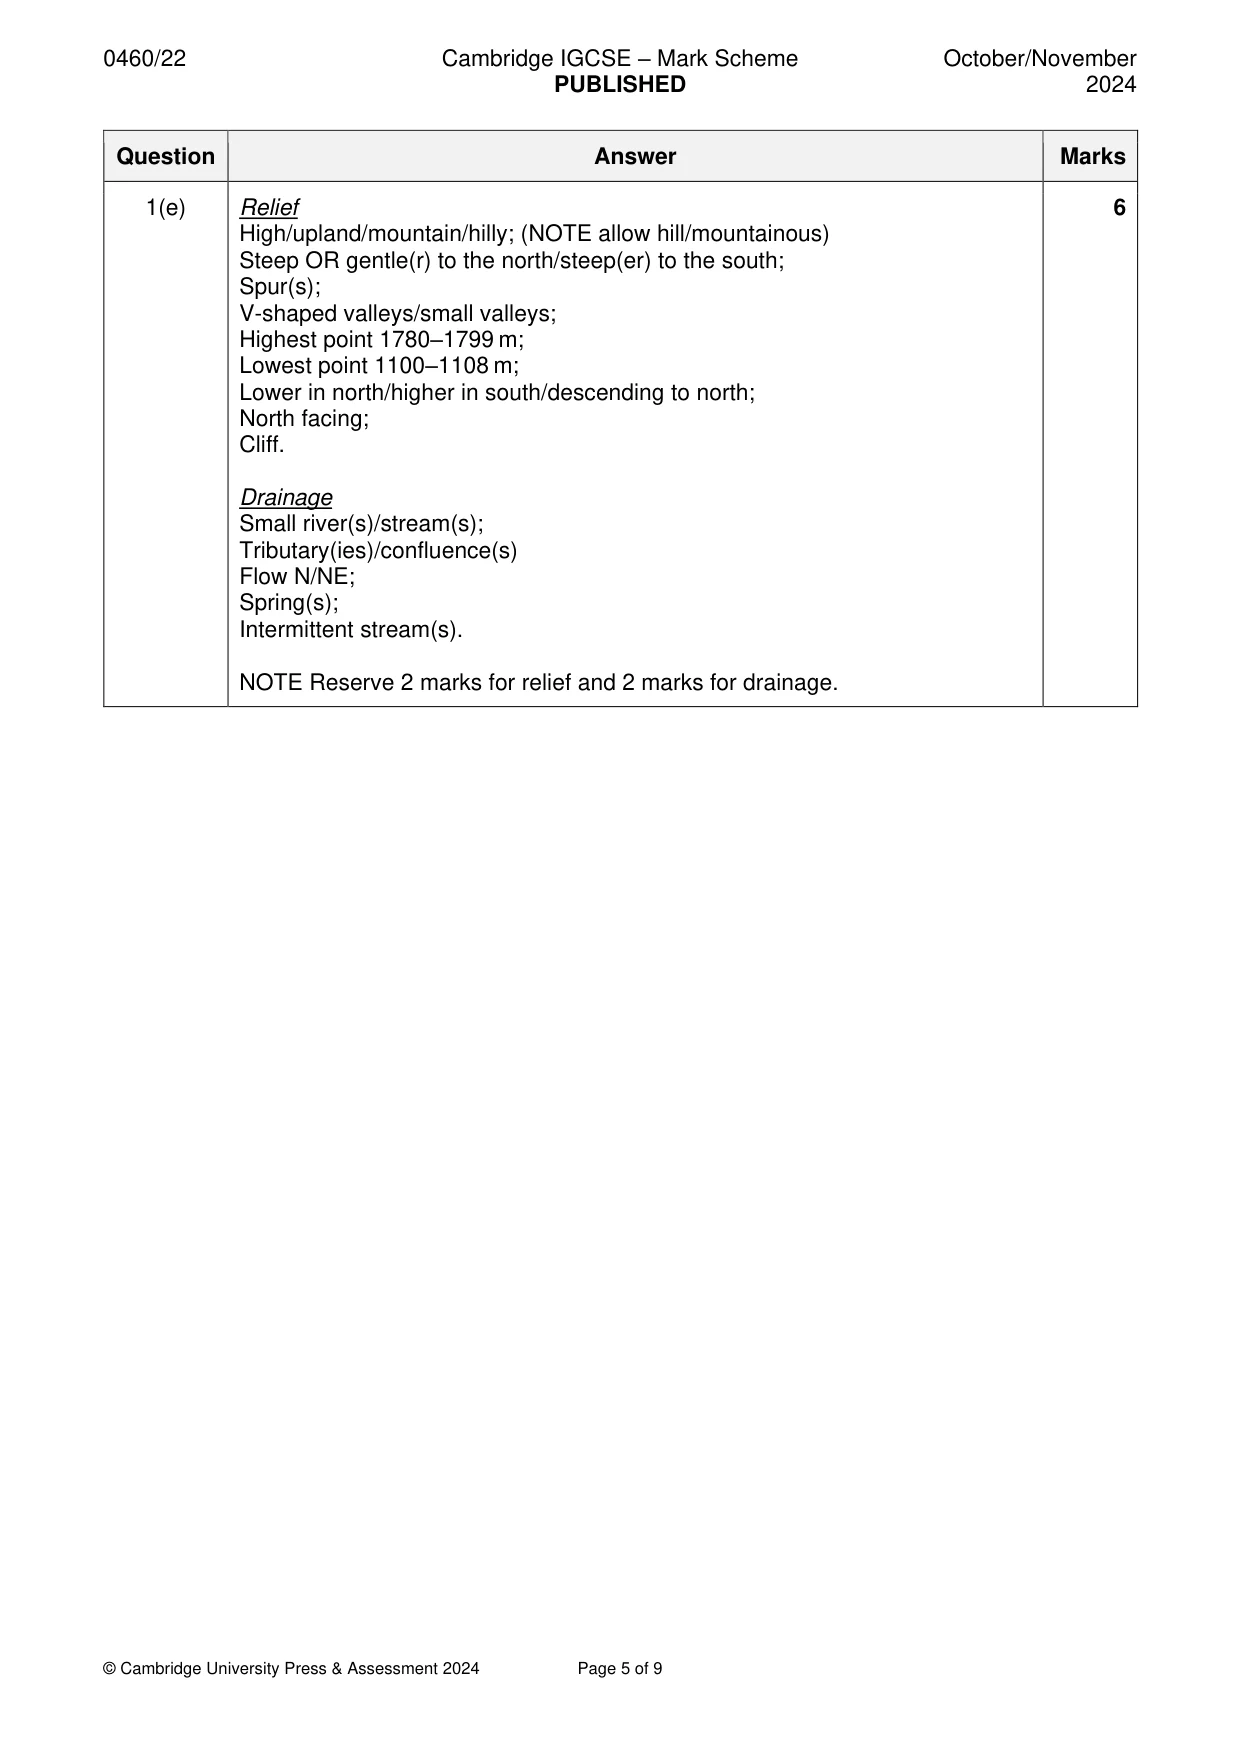
Mark scheme: Question Answer Marks 1(a)(i) (F.) Rienza 1 1(a)(ii) Main road/49 1 1(a)(iii) Path with signs 1 1(a)(iv) 1412 (metres) 1 1(b) North-west – south-east/east or vice-versa OR travels NW/SE/E/ESE; (NOTE 3 where a series of directions are given take the first and last. If only one direction given, it must be the direction it is going to.) Winding/bends/zigzag/curves/meanders; In valley; On lowland/avoids hills; On flatter/gentle(r)/avoids steep(er) land; Passes Niederolang/passes through/by/goes to Niederolang/a settlement in 7283/passes by/near/to the north of Olang Valdaora/Mitterolang; Crosses/goes above/under/through bridges OR goes over/under roads/over rivers; Follows course of river/along/near river/S/SW of river. 1(c)(i) River or stream/Rio Furcia/Furkelbach/other road/path/minor road 1 1(c)(ii) Mitterolang/Valdaora di mezzo/Moar/Tharer or Maier Moar Tharer 1 1(c)(iii) Land rising steadily to above 1350 m but below 1450 m; 1 (NOTE should touch the left-hand axis. Allow a slight hump/dip.) 1(d)(i) 1750–2000(metres) 1 1(d)(ii) 28–30 (degrees) 1 1(d)(iii) North north-east 1 1(d)(iv) 741 841 1 1(e) Relief 6 High/upland/mountain/hilly; (NOTE allow hill/mountainous) Steep OR gentle(r) to the north/steep(er) to the south; Spur(s); V-shaped valleys/small valleys; Highest point 1780–1799 m; Lowest point 1100–1108 m; Lower in north/higher in south/descending to north; North facing; Cliff. Drainage Small river(s)/stream(s); Tributary(ies)/confluence(s) Flow N/NE; Spring(s); Intermittent stream(s). NOTE Reserve 2 marks for relief and 2 marks for drainage.
Question 2
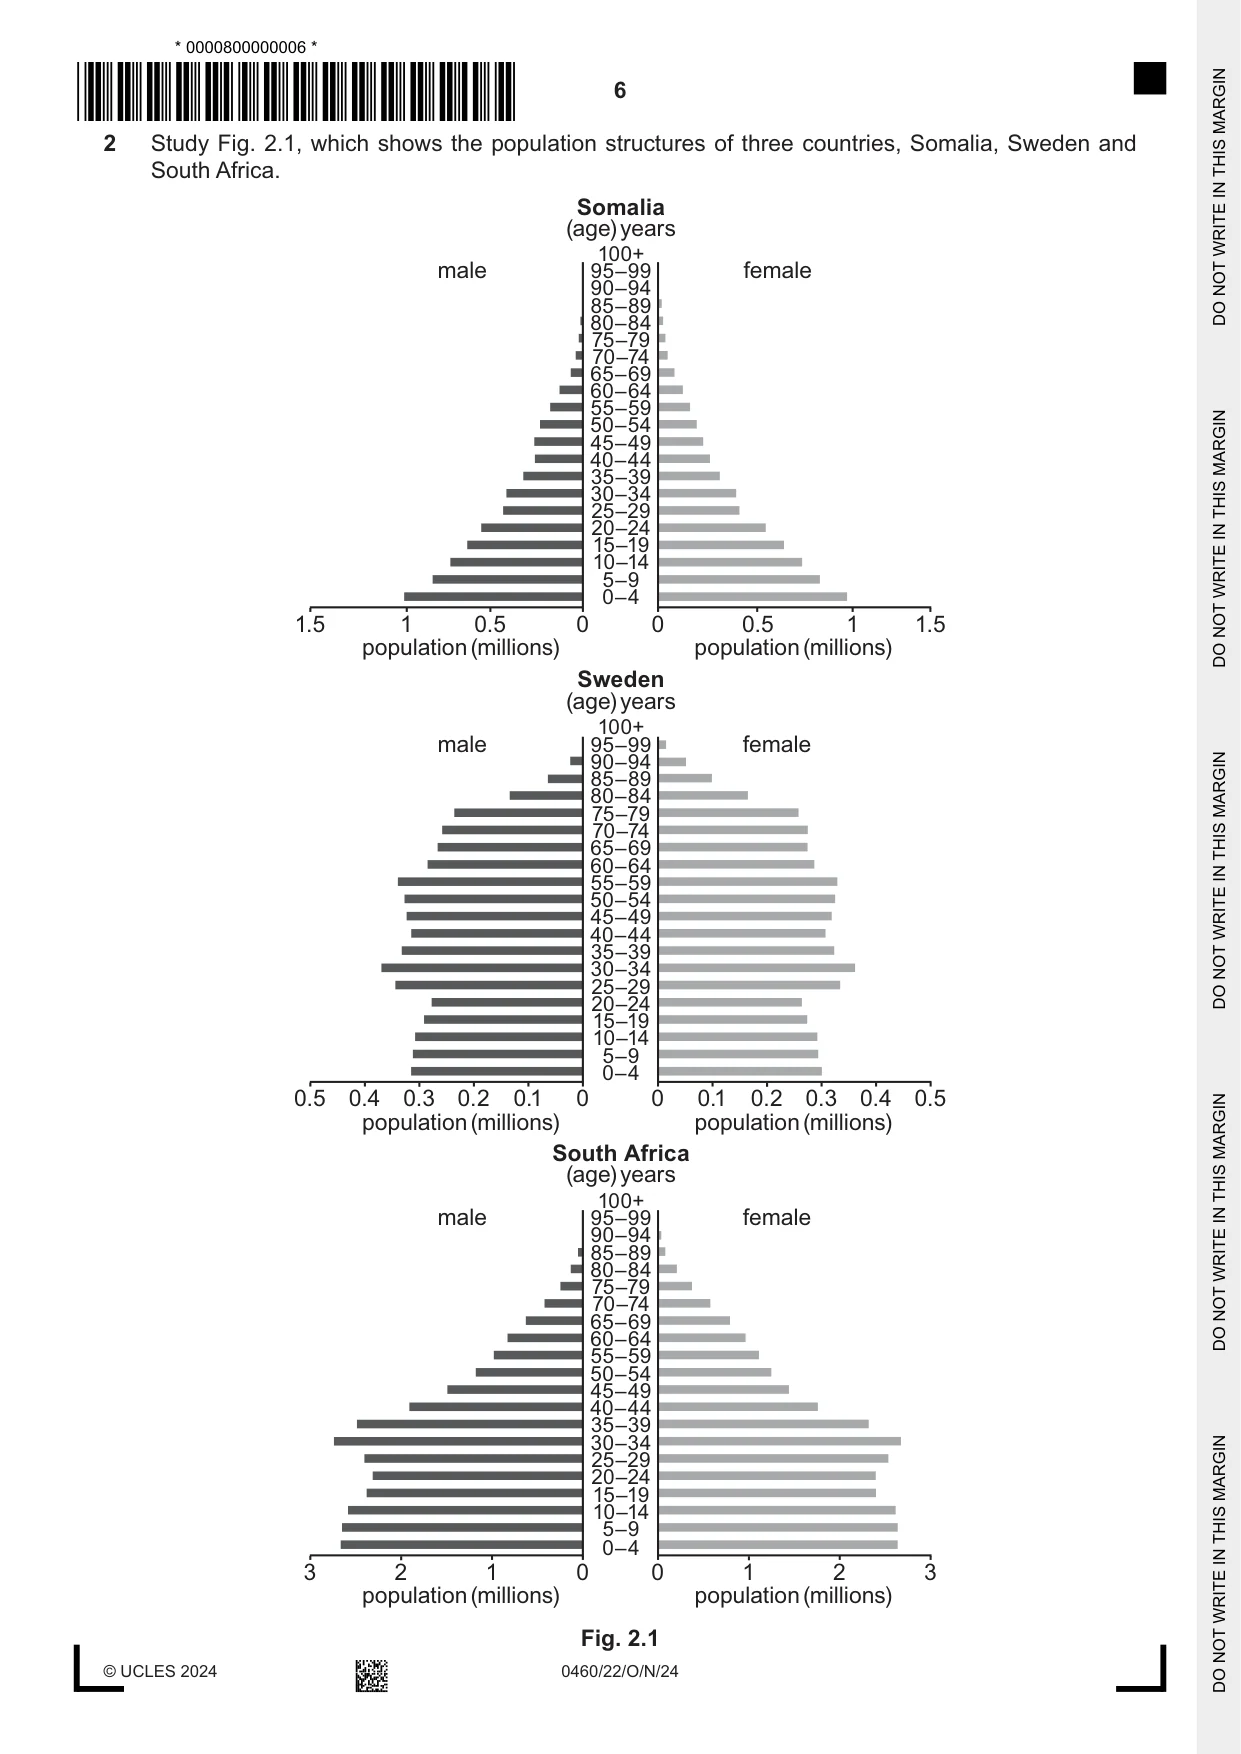
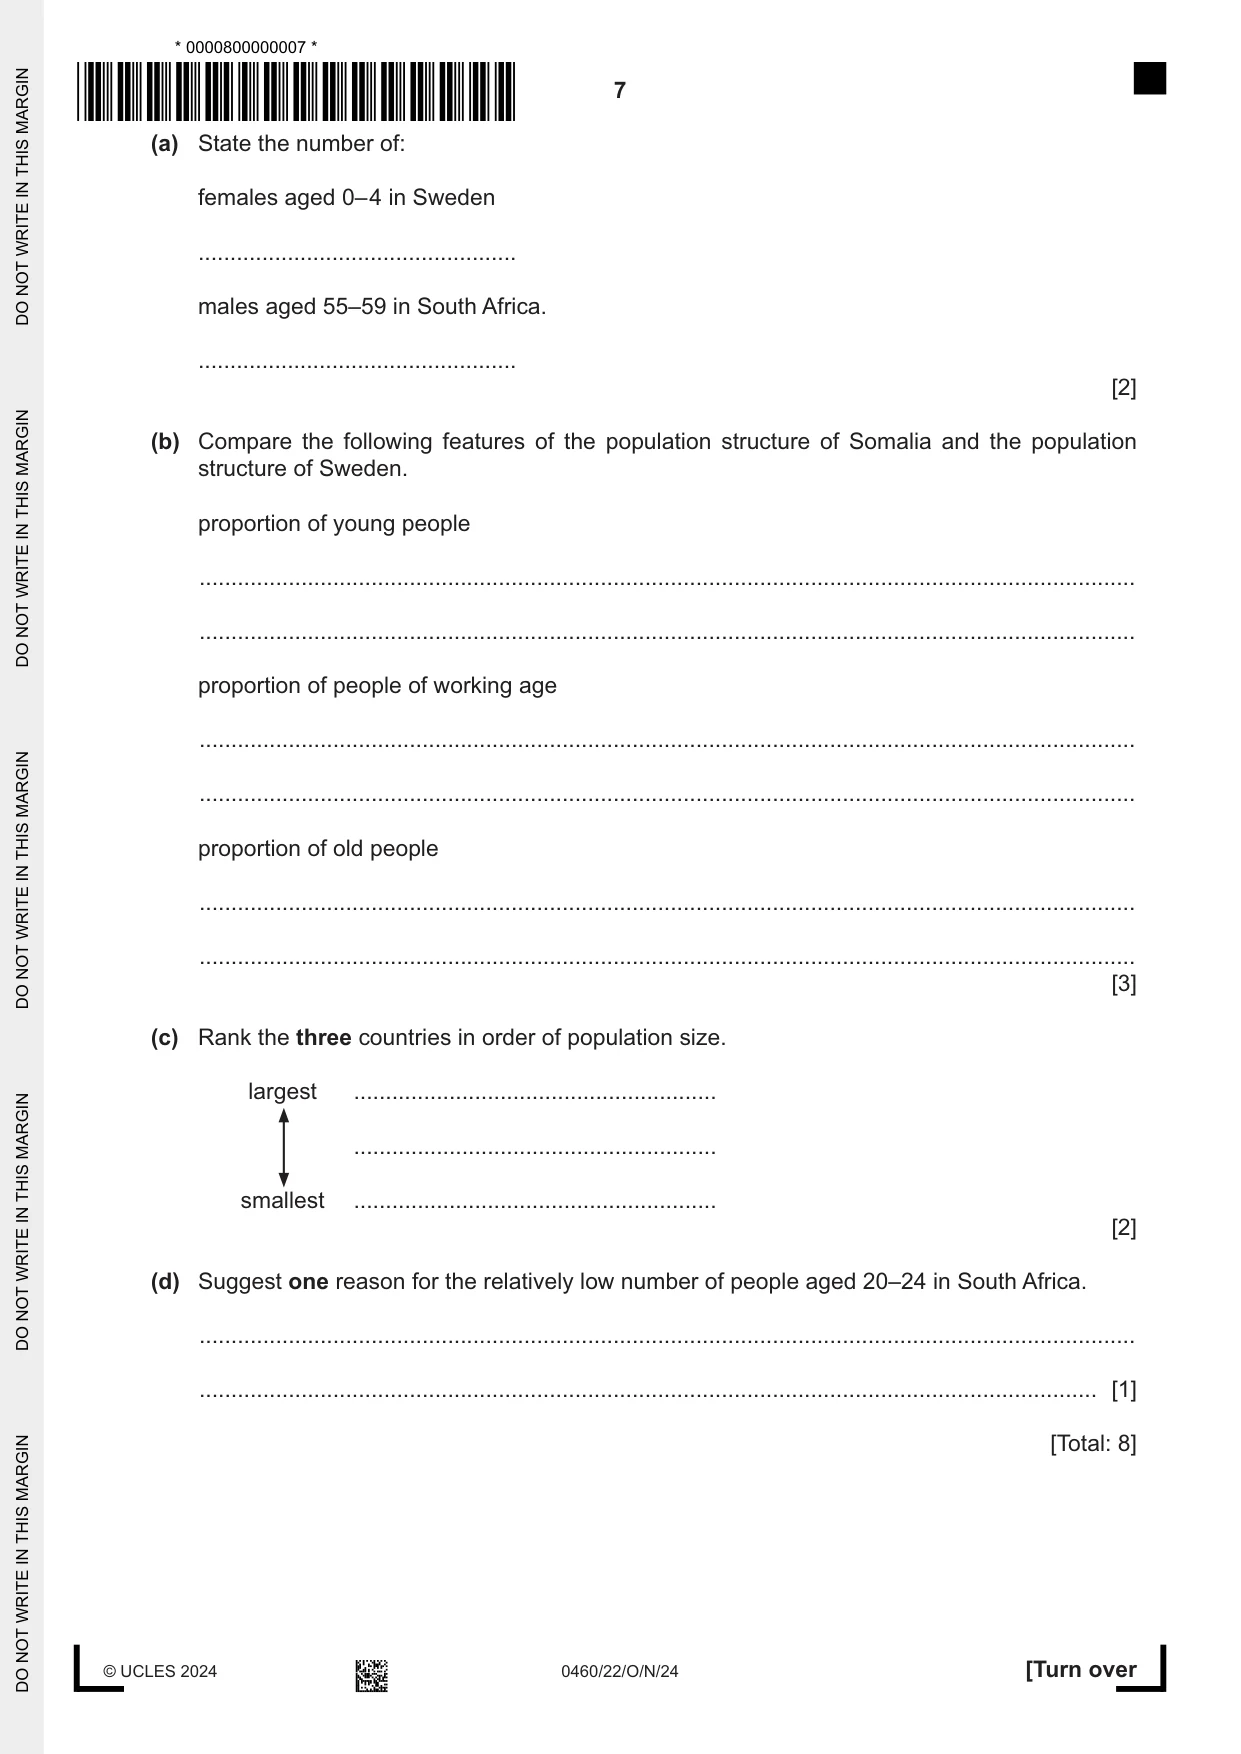
2 Study Fig. 2.1, which shows the population structures of three countries, Somalia, Sweden and South Africa. Somalia (age) years 100+ male 95–99 female 90–94 85–89 80–84 75–79 70–74 65–69 60–64 55–59 50–54 45–49 40–44 35–39 30–34 25–29 20–24 15–19 10–14 5–9 0–4 1.5 1 0.5 0 0 0.5 1 1.5 population (millions) population (millions) Sweden (age) years 100+ male 95–99 female 90–94 85–89 80–84 75–79 70–74 65–69 60–64 55–59 50–54 45–49 40–44 35–39 30–34 25–29 20–24 15–19 10–14 5–9 0–4 0.5 0.4 0.3 0.2 0.1 0 0 0.1 0.2 0.3 0.4 0.5 population (millions) population (millions) South Africa (age) years 100+ male 95–99 female 90–94 85–89 80–84 75–79 70–74 65–69 60–64 55–59 50–54 45–49 40–44 35–39 30–34 25–29 20–24 15–19 10–14 5–9 0–4 3 2 1 0 0 1 2 3 population (millions) population (millions) Fig. 2.1 (a) State the number of: females aged 0– 4 in Sweden .................................................. males aged 55–59 in South Africa. .................................................. [2] (b) Compare the following features of the population structure of Somalia and the population structure of Sweden. proportion of young people ................................................................................................................................................... ................................................................................................................................................... proportion of people of working age ................................................................................................................................................... ................................................................................................................................................... proportion of old people ................................................................................................................................................... ................................................................................................................................................... [3] (c) Rank the three countries in order of population size. largest ......................................................... ......................................................... smallest ......................................................... [2] (d) Suggest one reason for the relatively low number of people aged 20–24 in South Africa. ................................................................................................................................................... ............................................................................................................................................. [1] [Total: 8]
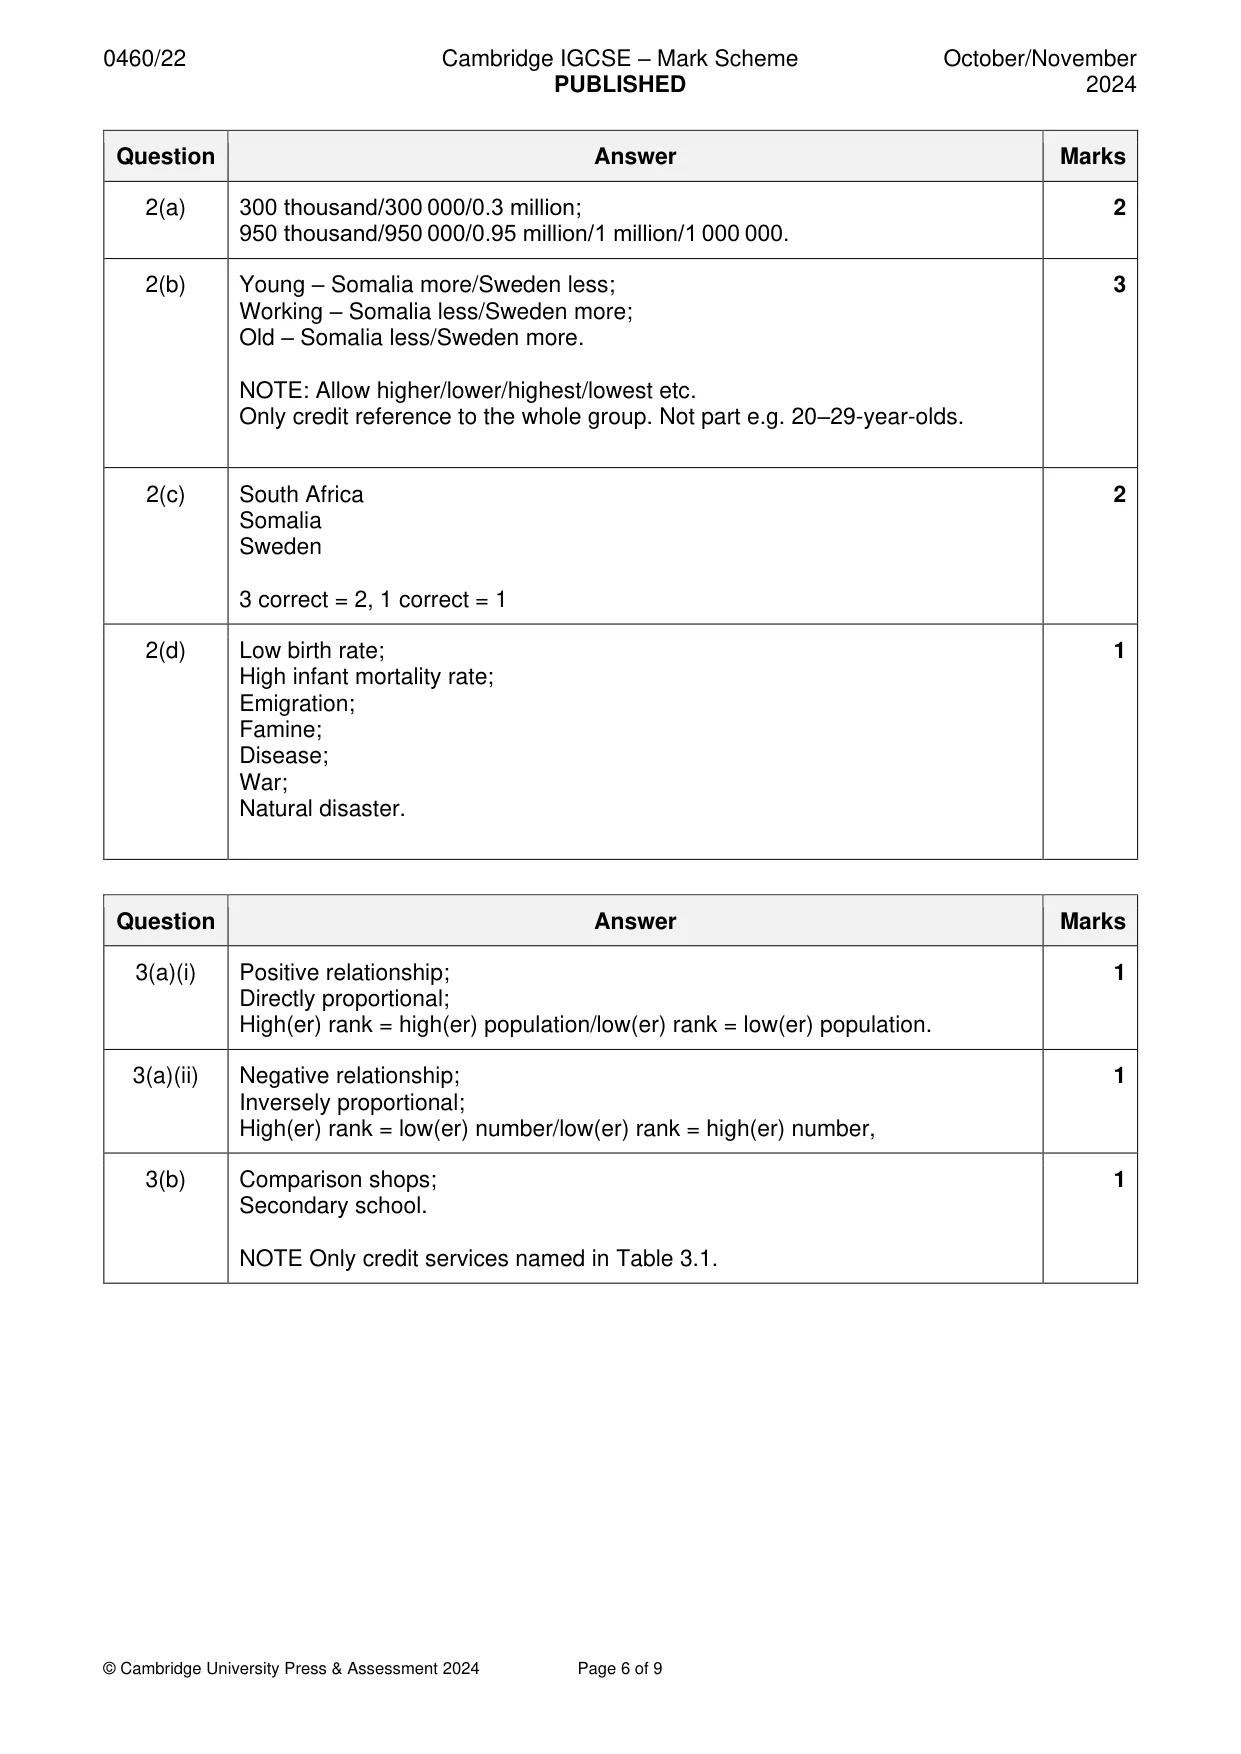
Mark scheme: 2(a) 300 thousand/300 000/0.3 million; 2 950 thousand/950 000/0.95 million/1 million/1 000 000. 2(b) Young – Somalia more/Sweden less; 3 Working – Somalia less/Sweden more; Old – Somalia less/Sweden more. NOTE: Allow higher/lower/highest/lowest etc. Only credit reference to the whole group. Not part e.g. 20–29-year-olds. 2(c) South Africa 2 Somalia Sweden 3 correct = 2, 1 correct = 1 2(d) Low birth rate; 1 High infant mortality rate; Emigration; Famine; Disease; War; Natural disaster.
Q3 · The settlement hierarchy of Copeland District in northern England
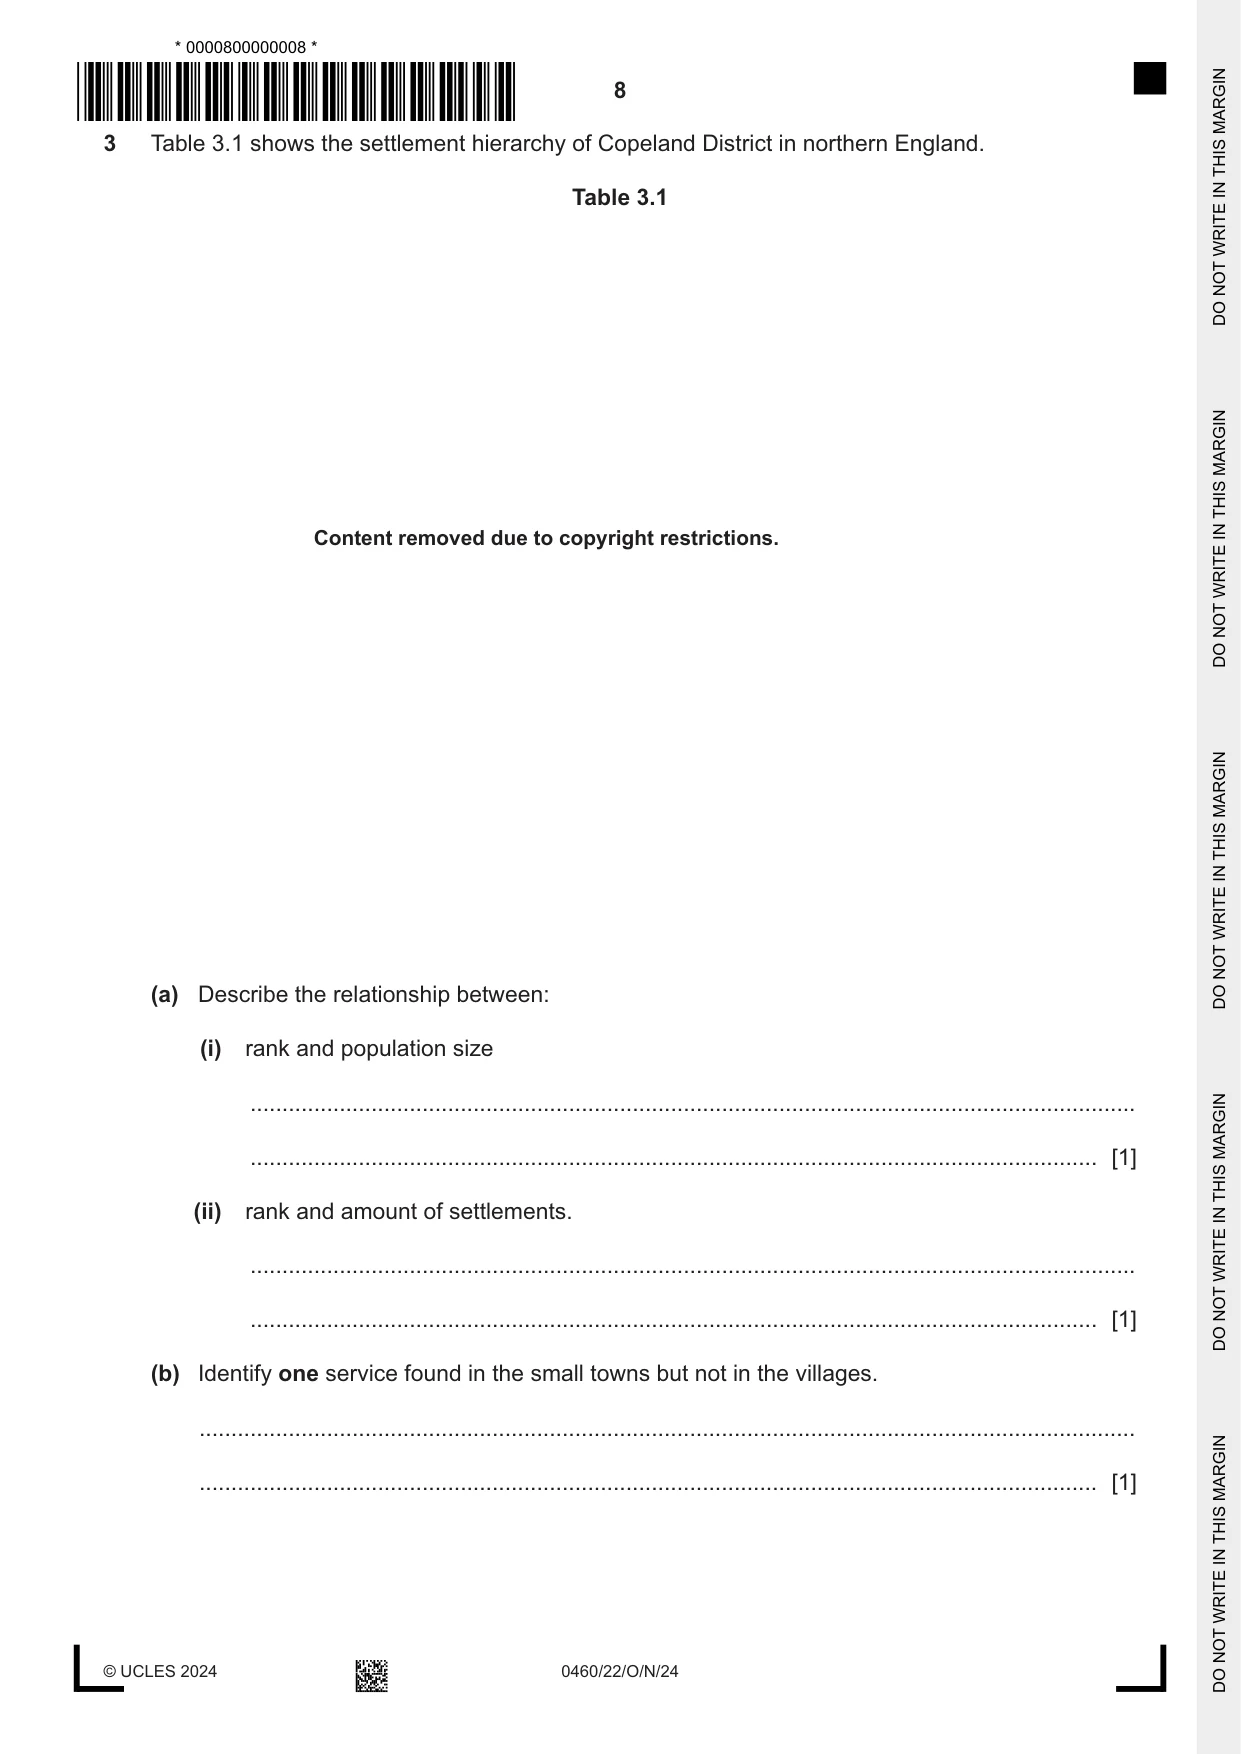
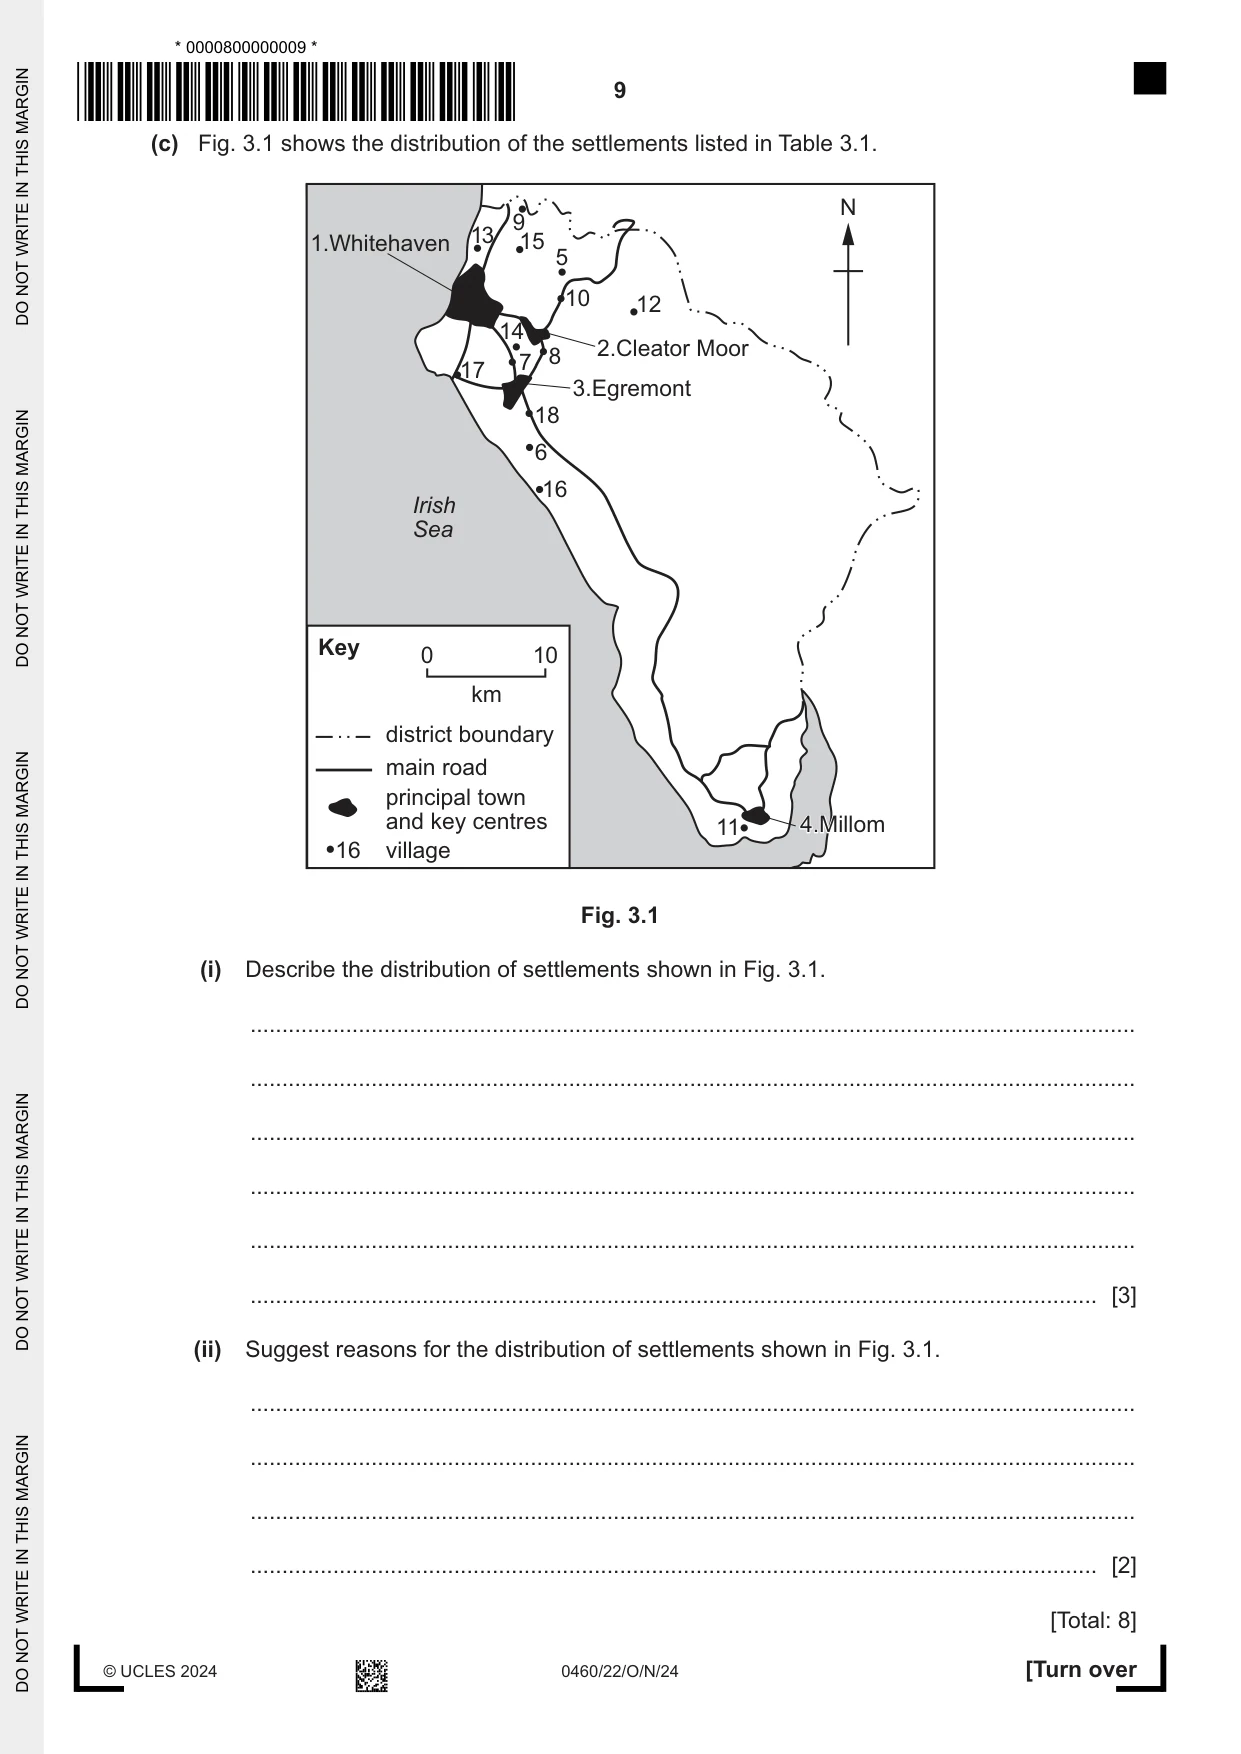
3 Table 3.1 shows the settlement hierarchy of Copeland District in northern England. Table 3.1 Content removed due to copyright restrictions. (a) Describe the relationship between: (i) rank and population size ........................................................................................................................................... ..................................................................................................................................... [1] (ii) rank and amount of settlements. ........................................................................................................................................... ..................................................................................................................................... [1] (b) Identify one service found in the small towns but not in the villages. ................................................................................................................................................... ............................................................................................................................................. [1] (c) Fig. 3.1 shows the distribution of the settlements listed in Table 3.1. N 9 13 1.Whitehaven 15 5 10 12 14 2.Cleator Moor 7 8 17 3.Egremont 18 6 16 Irish Sea Key 0 10 km district boundary main road principal town and key centres 11 4.Millom4.Millom 16 village Fig. 3.1 (i) Describe the distribution of settlements shown in Fig. 3.1. ........................................................................................................................................... ........................................................................................................................................... ........................................................................................................................................... ........................................................................................................................................... ........................................................................................................................................... ..................................................................................................................................... [3] (ii) Suggest reasons for the distribution of settlements shown in Fig. 3.1. ........................................................................................................................................... ........................................................................................................................................... ........................................................................................................................................... ..................................................................................................................................... [2] [Total: 8]
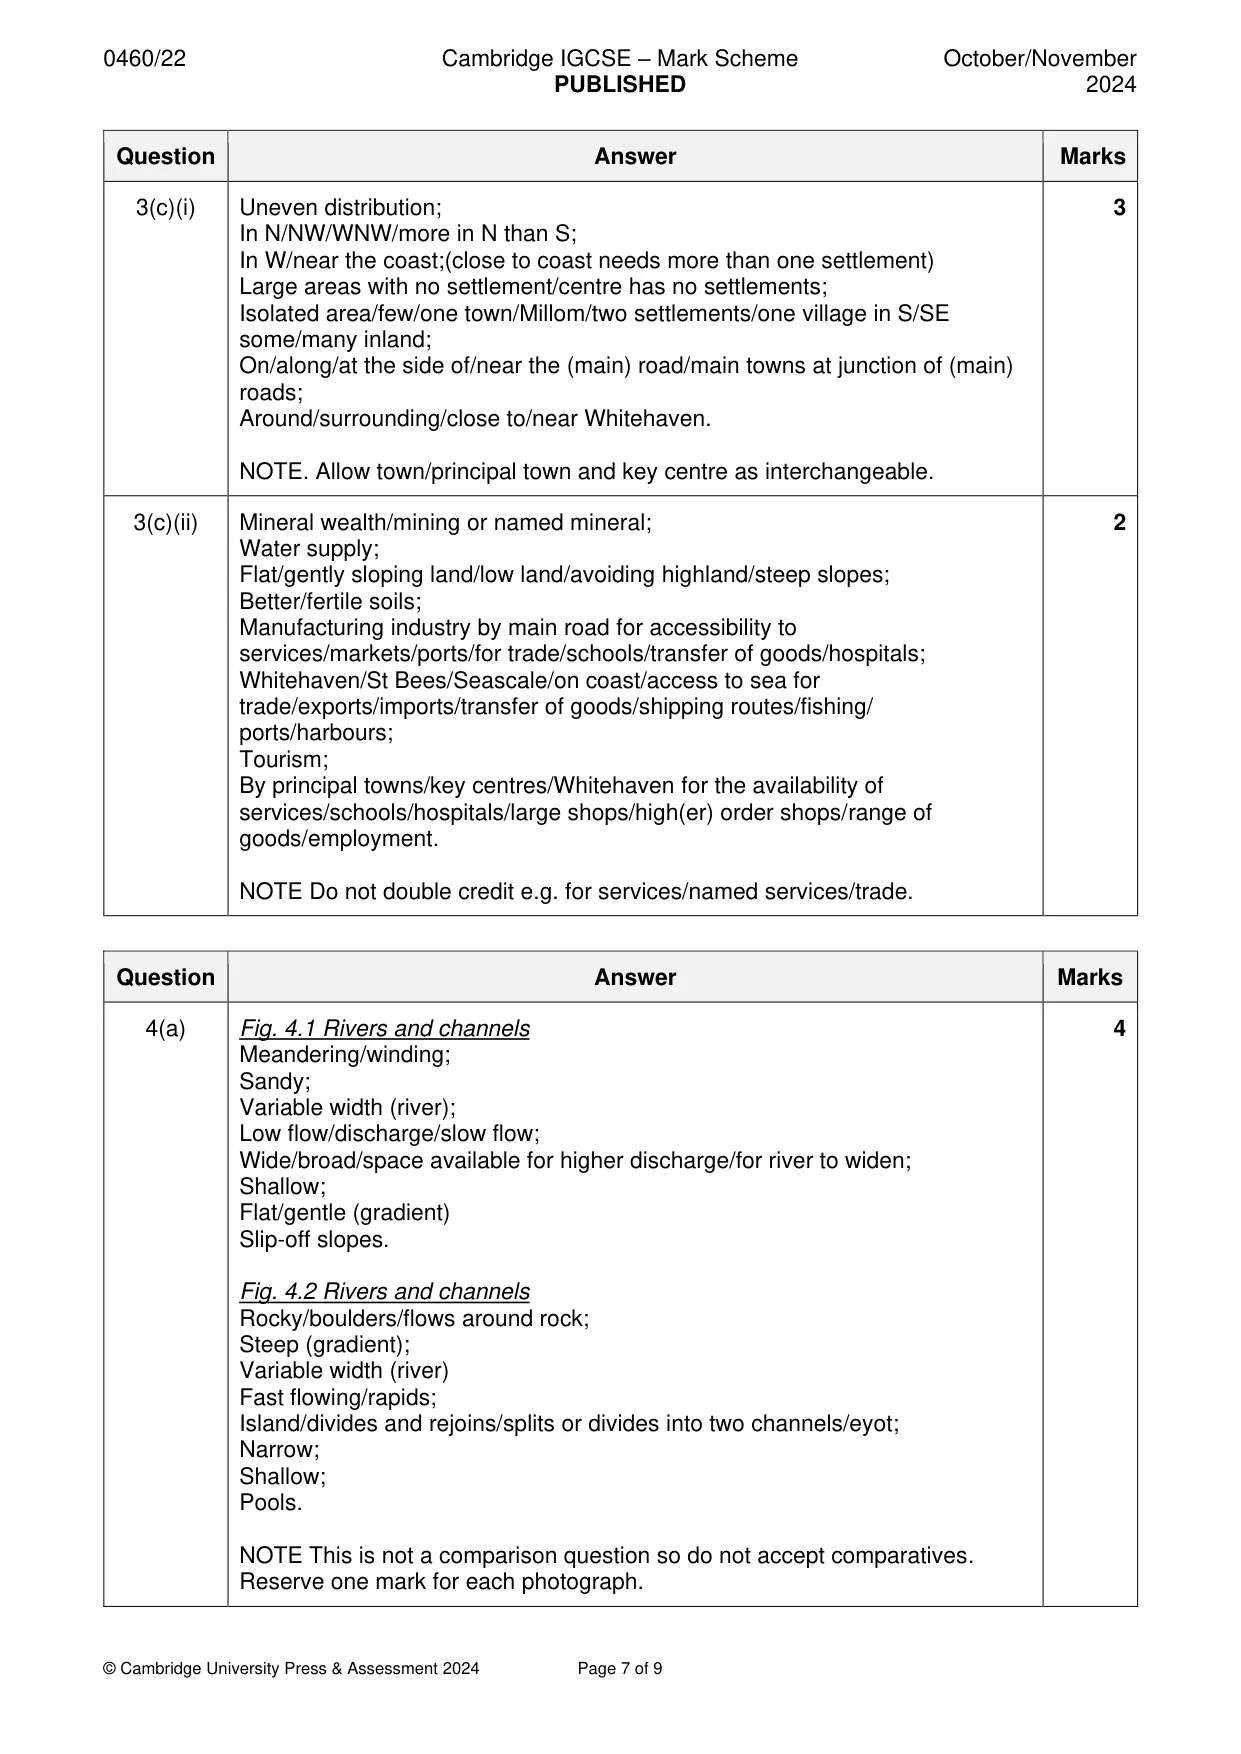
Mark scheme: 3(a)(i) Positive relationship; 1 Directly proportional; High(er) rank = high(er) population/low(er) rank = low(er) population. 3(a)(ii) Negative relationship; 1 Inversely proportional; High(er) rank = low(er) number/low(er) rank = high(er) number, 3(b) Comparison shops; 1 Secondary school. NOTE Only credit services named in Table 3.1. 3(c)(i) Uneven distribution; 3 In N/NW/WNW/more in N than S; In W/near the coast;(close to coast needs more than one settlement) Large areas with no settlement/centre has no settlements; Isolated area/few/one town/Millom/two settlements/one village in S/SE some/many inland; On/along/at the side of/near the (main) road/main towns at junction of (main) roads; Around/surrounding/close to/near Whitehaven. NOTE. Allow town/principal town and key centre as interchangeable. 3(c)(ii) Mineral wealth/mining or named mineral; 2 Water supply; Flat/gently sloping land/low land/avoiding highland/steep slopes; Better/fertile soils; Manufacturing industry by main road for accessibility to services/markets/ports/for trade/schools/transfer of goods/hospitals; Whitehaven/St Bees/Seascale/on coast/access to sea for trade/exports/imports/transfer of goods/shipping routes/fishing/ ports/harbours; Tourism; By principal towns/key centres/Whitehaven for the availability of services/schools/hospitals/large shops/high(er) order shops/range of goods/employment. NOTE Do not double credit e.g. for services/named services/trade.
Question 4
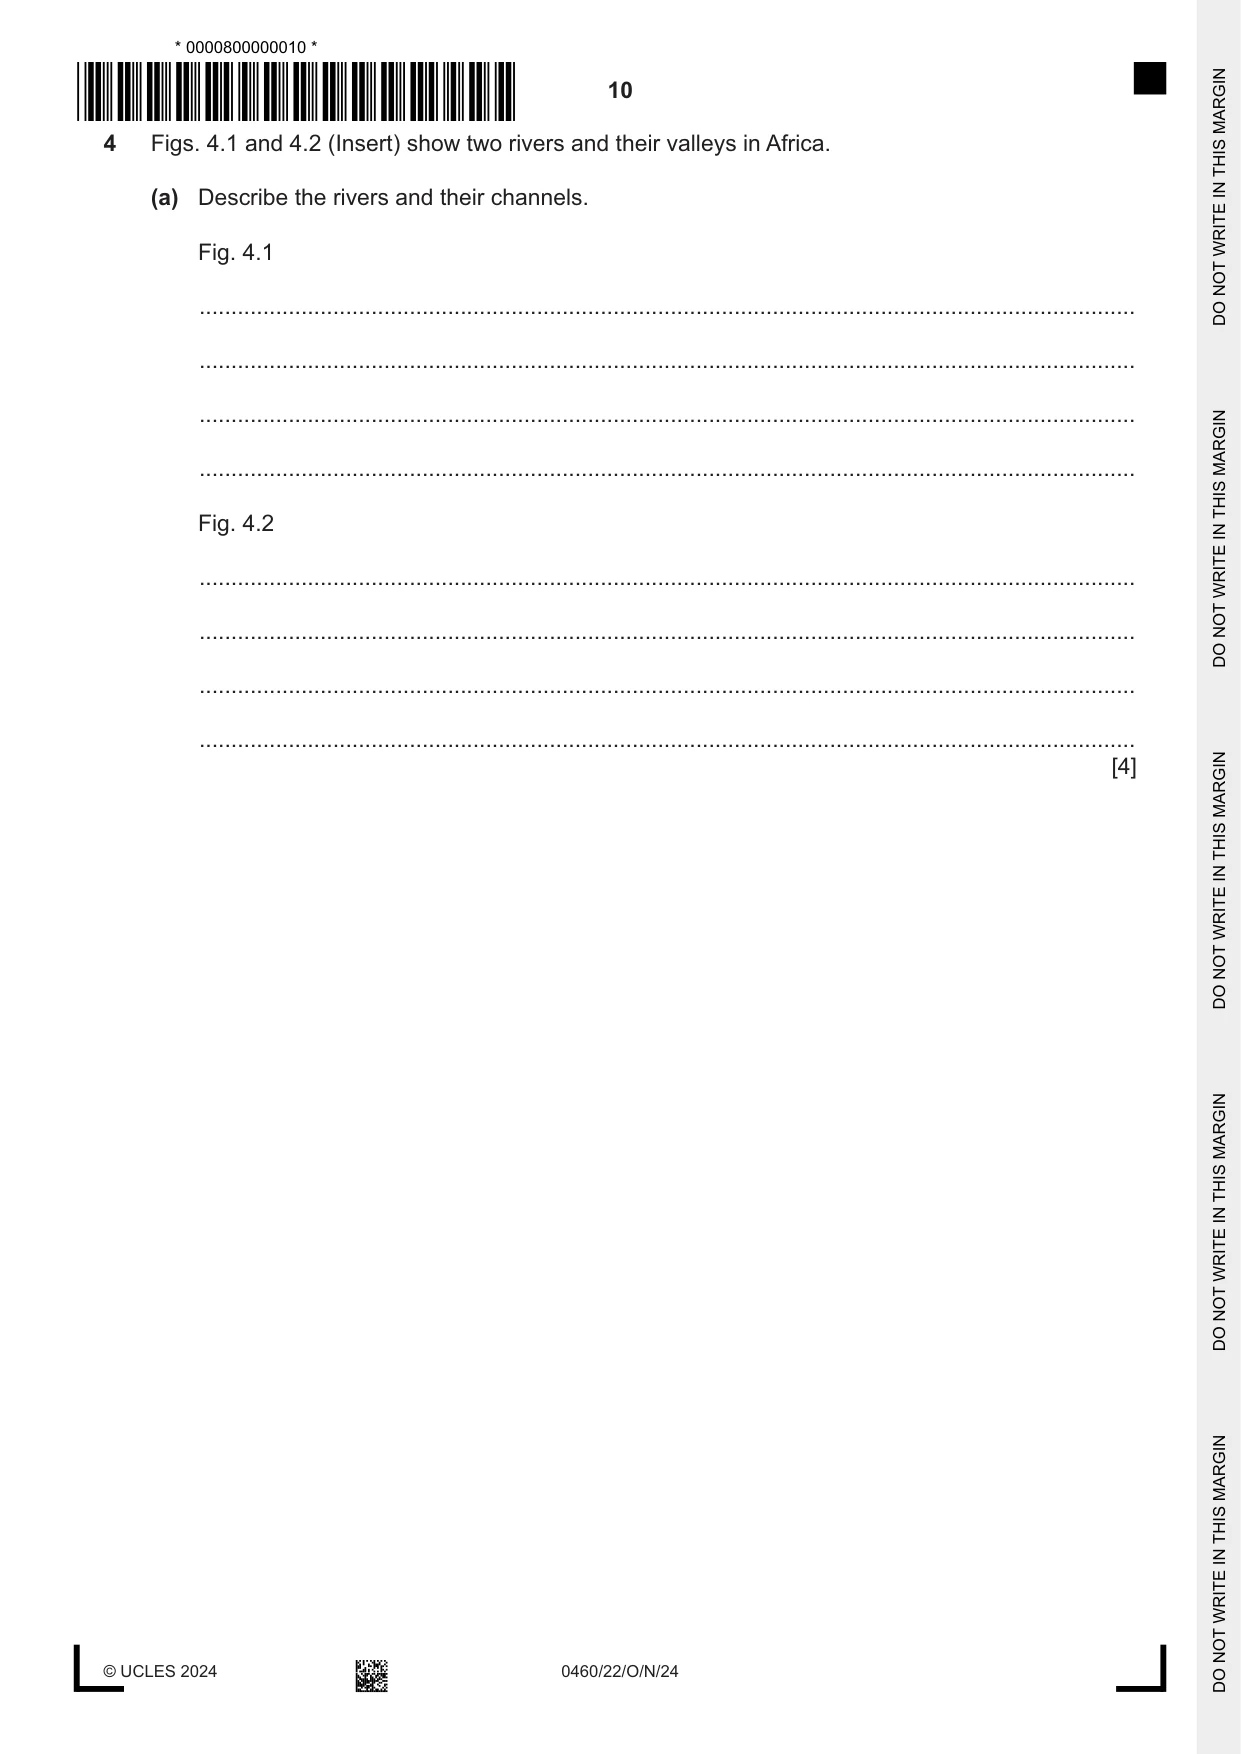
4 Figs. 4.1 and 4.2 (Insert) show two rivers and their valleys in Africa. (a) Describe the rivers and their channels. Fig. 4.1 ................................................................................................................................................... ................................................................................................................................................... ................................................................................................................................................... ................................................................................................................................................... Fig. 4.2 ................................................................................................................................................... ................................................................................................................................................... ................................................................................................................................................... ................................................................................................................................................... [4] (b) Describe the valleys. Fig. 4.1 ................................................................................................................................................... ................................................................................................................................................... ................................................................................................................................................... ................................................................................................................................................... Fig. 4.2 ................................................................................................................................................... ................................................................................................................................................... ................................................................................................................................................... ................................................................................................................................................... [4] [Total: 8]
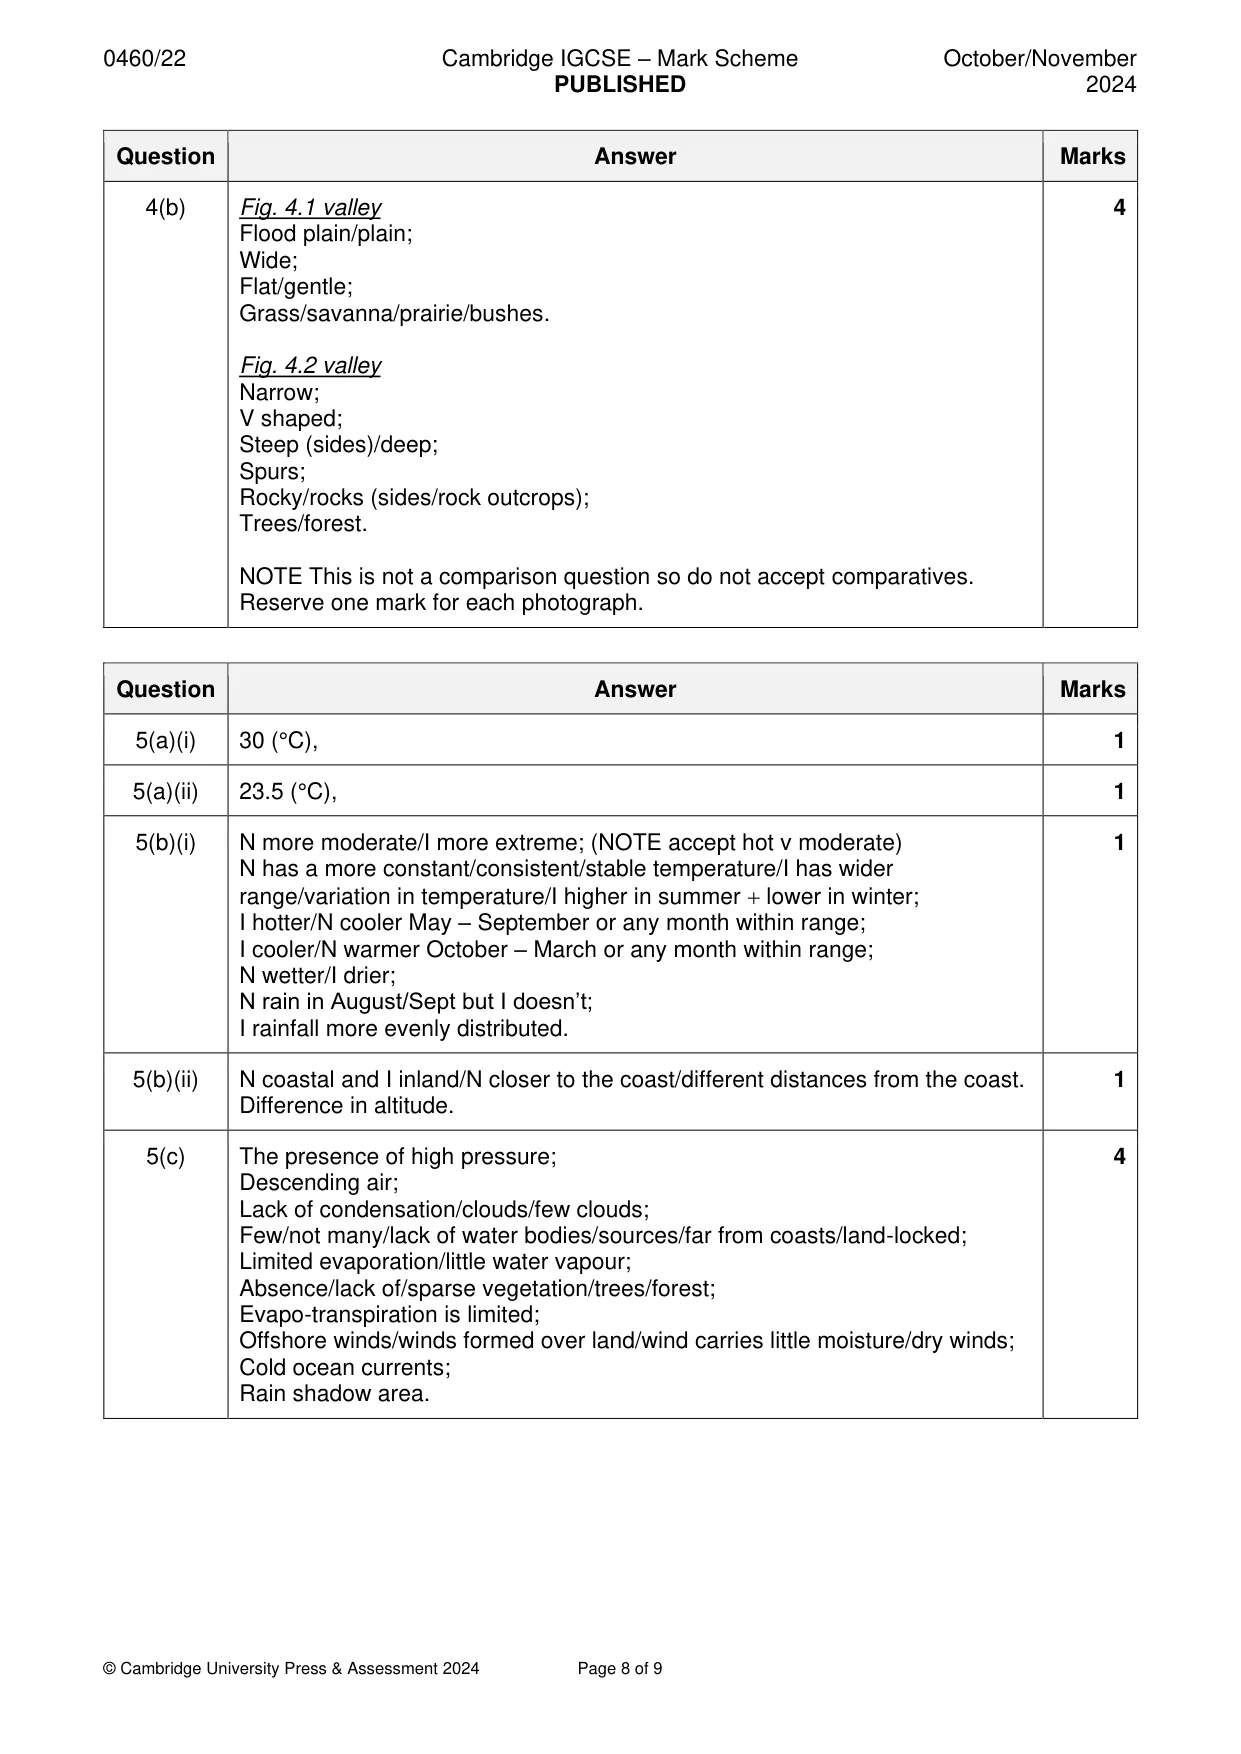
Mark scheme: 4(a) Fig. 4.1 Rivers and channels 4 Meandering/winding; Sandy; Variable width (river); Low flow/discharge/slow flow; Wide/broad/space available for higher discharge/for river to widen; Shallow; Flat/gentle (gradient) Slip-off slopes. Fig. 4.2 Rivers and channels Rocky/boulders/flows around rock; Steep (gradient); Variable width (river) Fast flowing/rapids; Island/divides and rejoins/splits or divides into two channels/eyot; Narrow; Shallow; Pools. NOTE This is not a comparison question so do not accept comparatives. Reserve one mark for each photograph. 4(b) Fig. 4.1 valley 4 Flood plain/plain; Wide; Flat/gentle; Grass/savanna/prairie/bushes. Fig. 4.2 valley Narrow; V shaped; Steep (sides)/deep; Spurs; Rocky/rocks (sides/rock outcrops); Trees/forest. NOTE This is not a comparison question so do not accept comparatives. Reserve one mark for each photograph.
Question 5
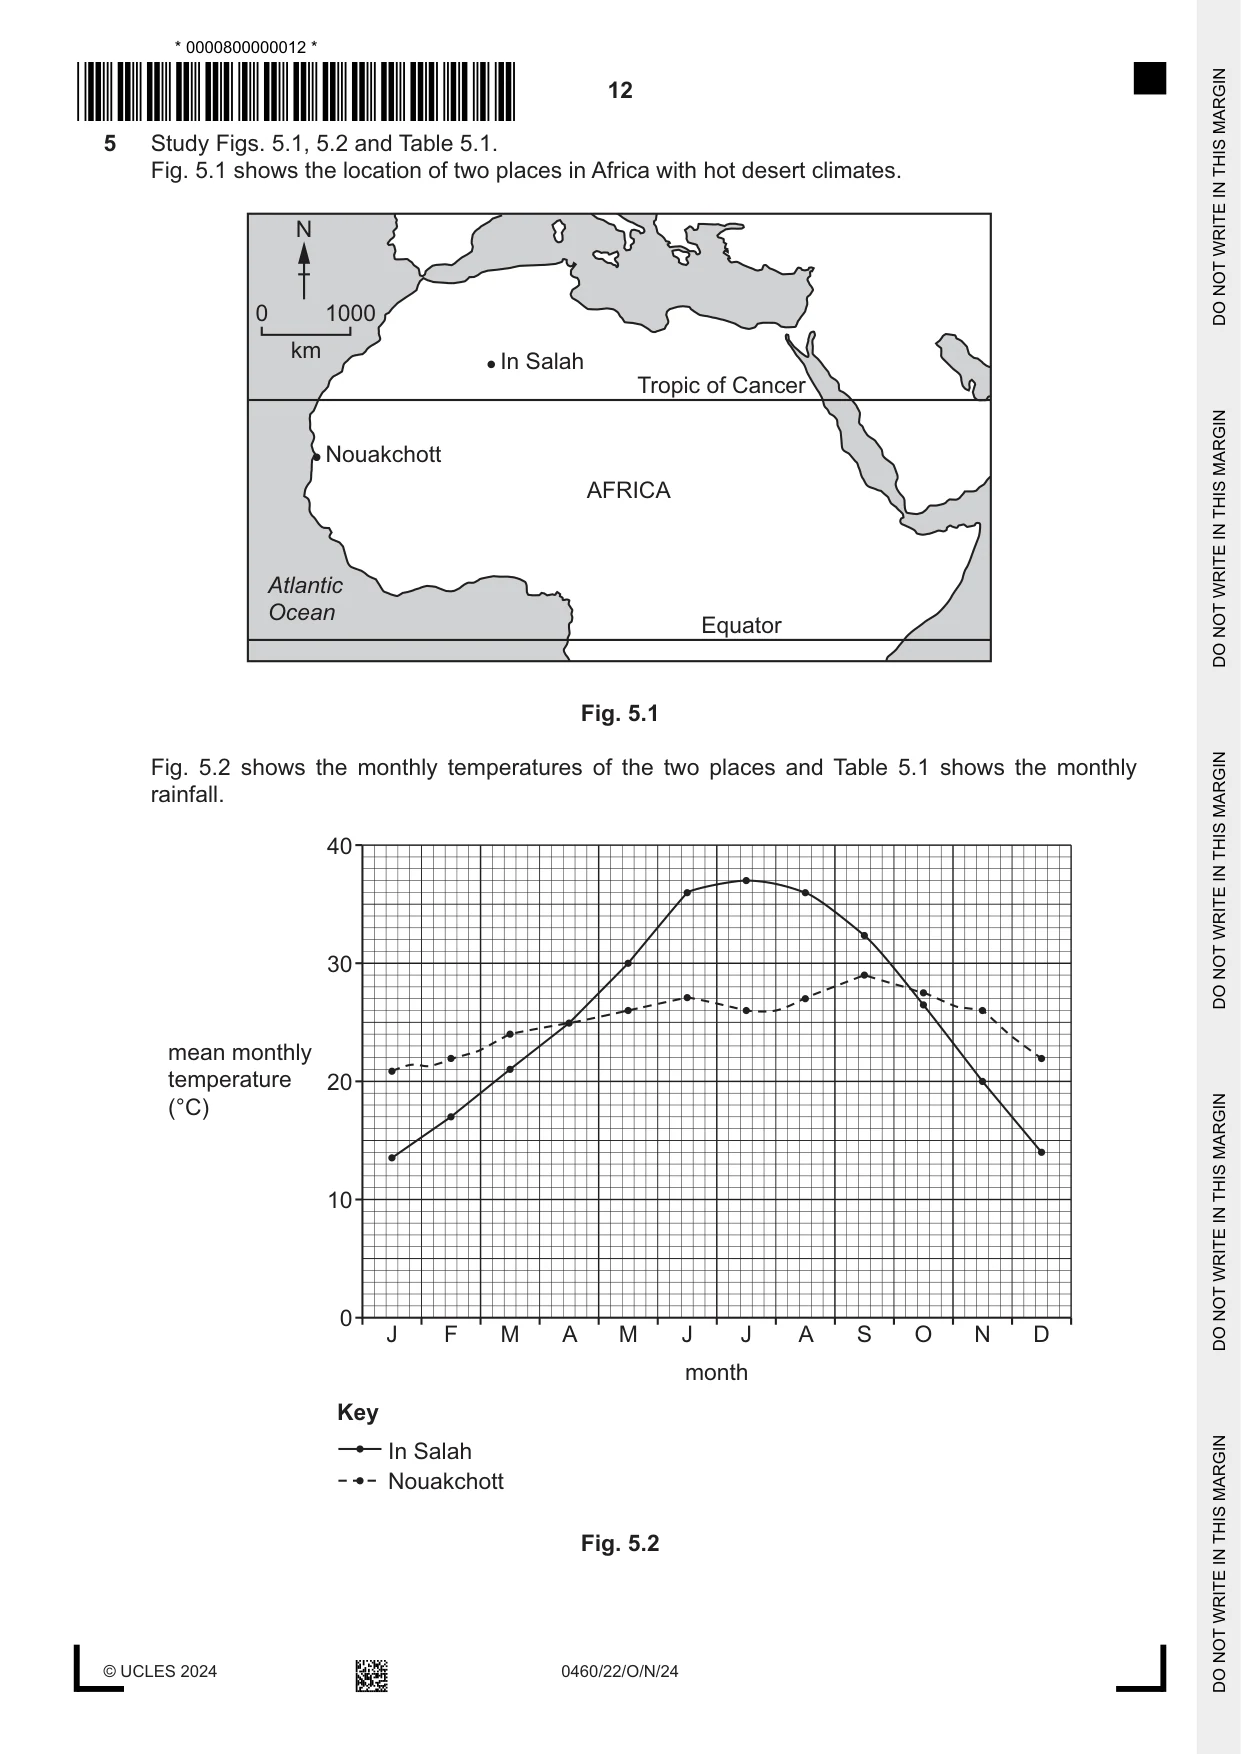
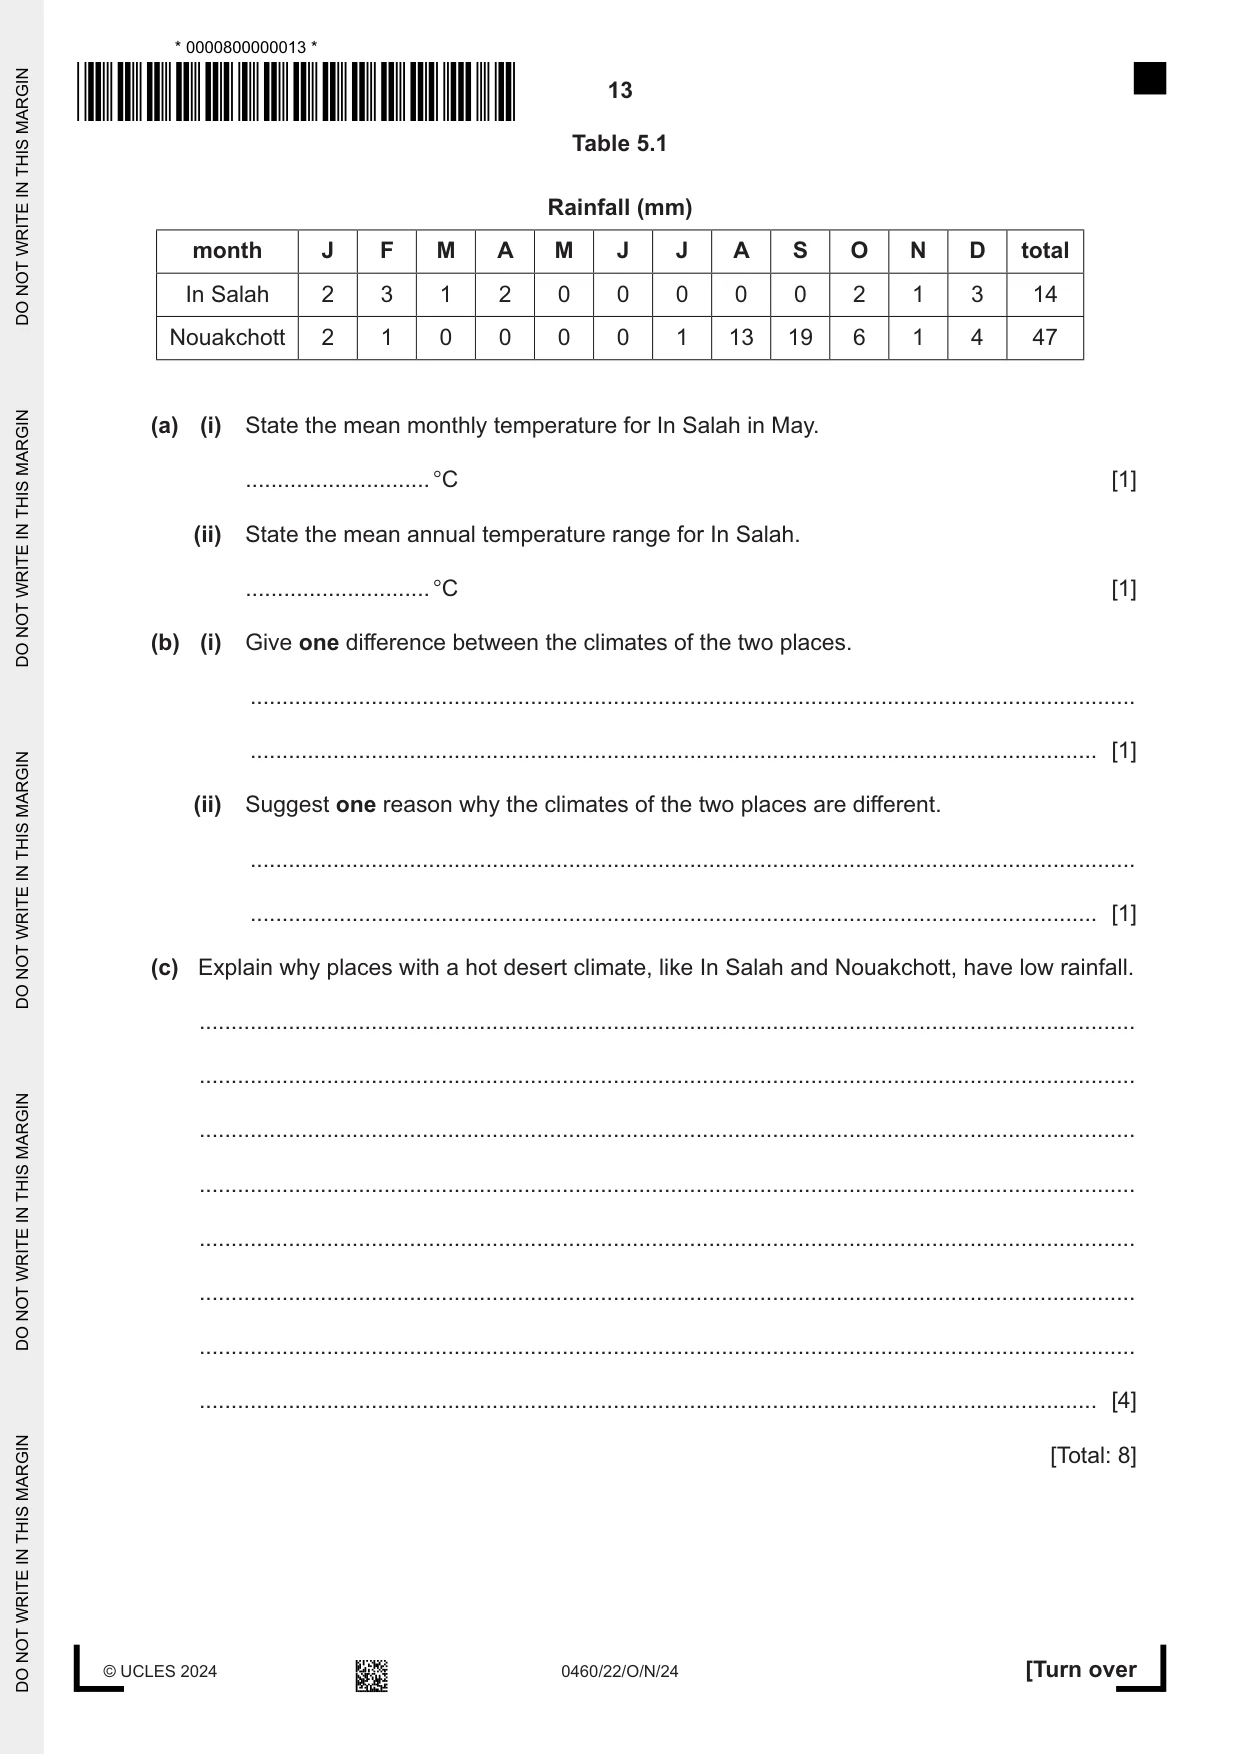
5 Study Figs. 5.1, 5.2 and Table 5.1. Fig. 5.1 shows the location of two places in Africa with hot desert climates. N 0 1000 km In Salah Tropic of Cancer Nouakchott AFRICA Atlantic Ocean Equator Fig. 5.1 Fig. 5.2 shows the monthly temperatures of the two places and Table 5.1 shows the monthly rainfall. 40 30 mean monthly temperature 20 (°C) 10 0 J F M A M J J A S O N D month Key In Salah Nouakchott Fig. 5.2 Table 5.1 Rainfall (mm) month J F M A M J J A S O N D total In Salah 2 3 1 2 0 0 0 0 0 2 1 3 14 Nouakchott 2 1 0 0 0 0 1 13 19 6 1 4 47 (a) (i) State the mean monthly temperature for In Salah in May. ............................. °C [1] (ii) State the mean annual temperature range for In Salah. ............................. °C [1] (b) (i) Give one difference between the climates of the two places. ........................................................................................................................................... ..................................................................................................................................... [1] (ii) Suggest one reason why the climates of the two places are different. ........................................................................................................................................... ..................................................................................................................................... [1] (c) Explain why places with a hot desert climate, like In Salah and Nouakchott, have low rainfall. ................................................................................................................................................... ................................................................................................................................................... ................................................................................................................................................... ................................................................................................................................................... ................................................................................................................................................... ................................................................................................................................................... ................................................................................................................................................... ............................................................................................................................................. [4] [Total: 8]
Mark scheme: 5(a)(i) 30 (°C), 1 5(a)(ii) 23.5 (°C), 1 5(b)(i) N more moderate/I more extreme; (NOTE accept hot v moderate) 1 N has a more constant/consistent/stable temperature/I has wider range/variation in temperature/I higher in summer + lower in winter; I hotter/N cooler May – September or any month within range; I cooler/N warmer October – March or any month within range; N wetter/I drier; N rain in August/Sept but I doesn’t; I rainfall more evenly distributed. 5(b)(ii) N coastal and I inland/N closer to the coast/different distances from the coast. 1 Difference in altitude. 5(c) The presence of high pressure; 4 Descending air; Lack of condensation/clouds/few clouds; Few/not many/lack of water bodies/sources/far from coasts/land-locked; Limited evaporation/little water vapour; Absence/lack of/sparse vegetation/trees/forest; Evapo-transpiration is limited; Offshore winds/winds formed over land/wind carries little moisture/dry winds; Cold ocean currents; Rain shadow area.
Q6 · Information about the production of bread
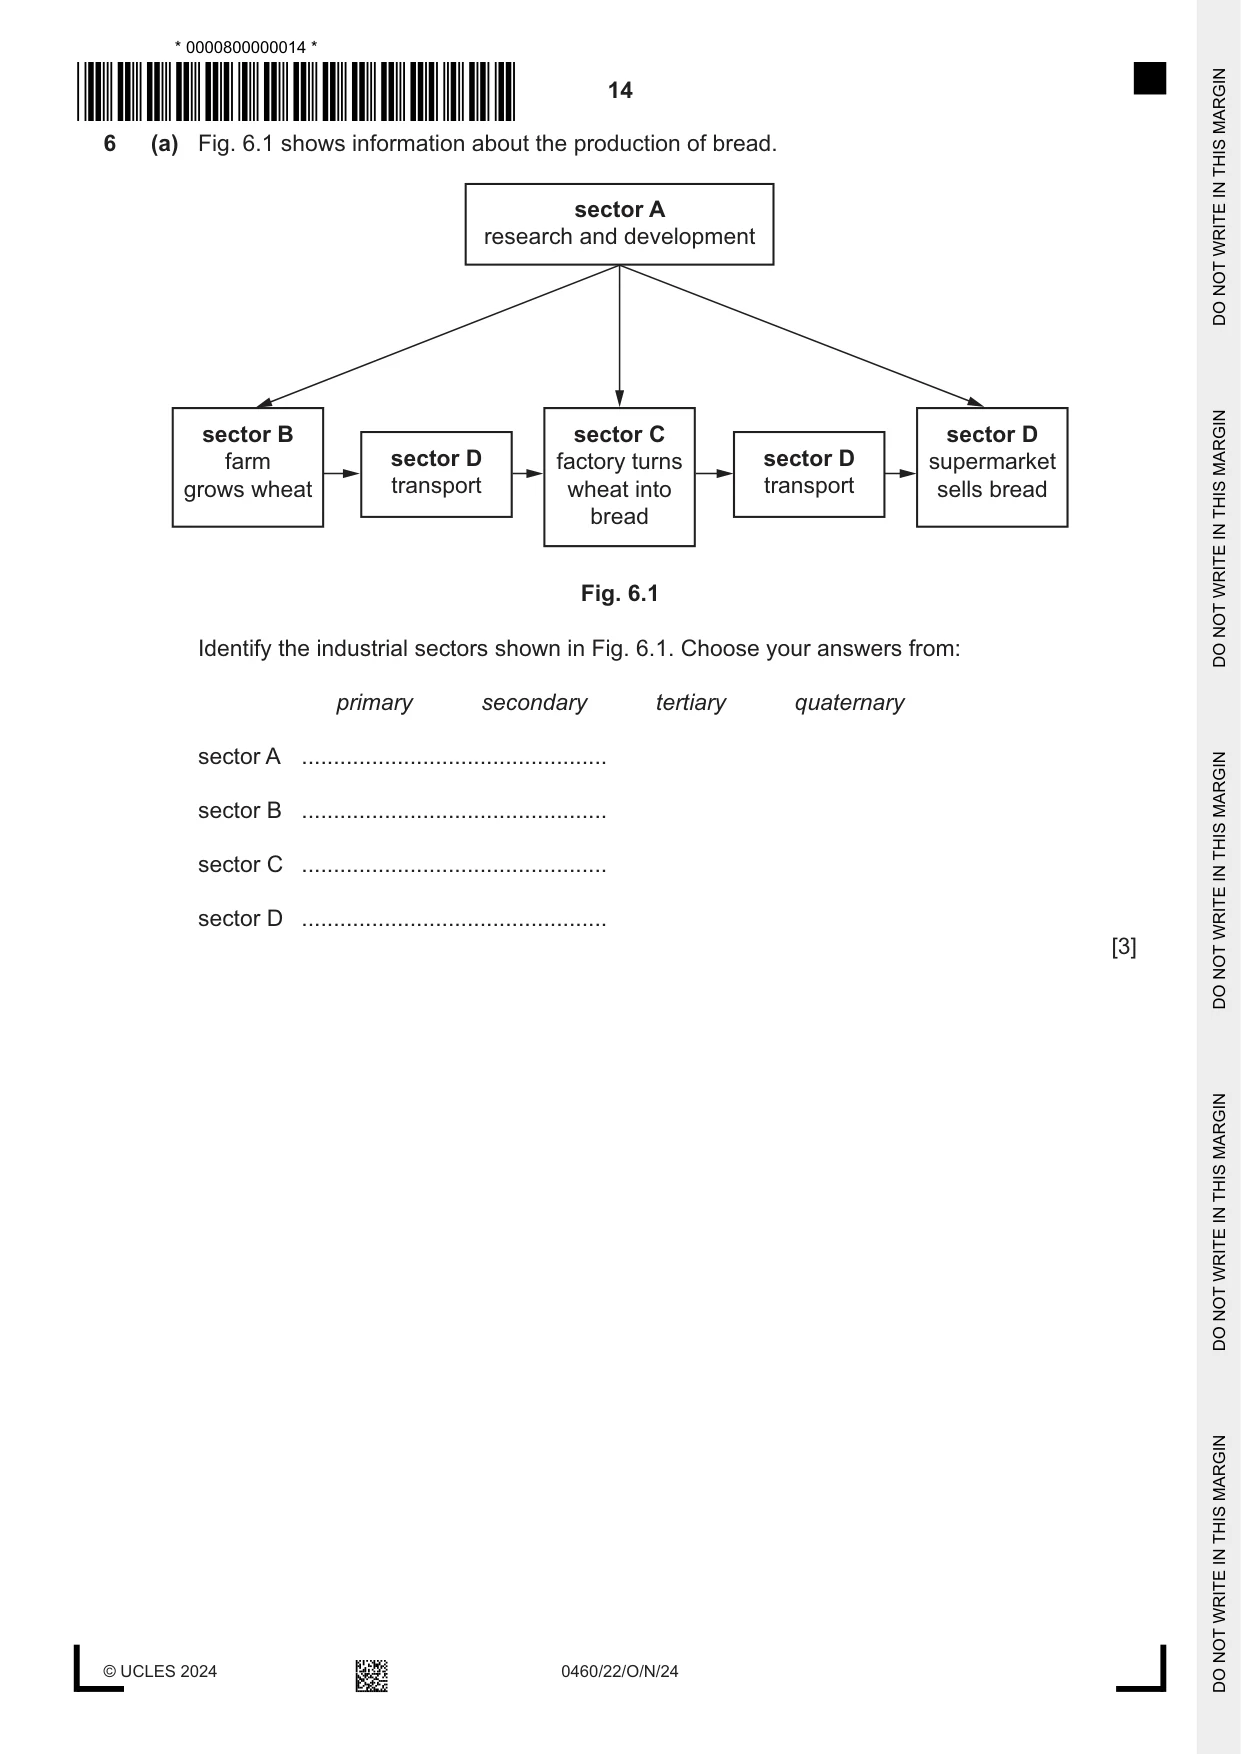
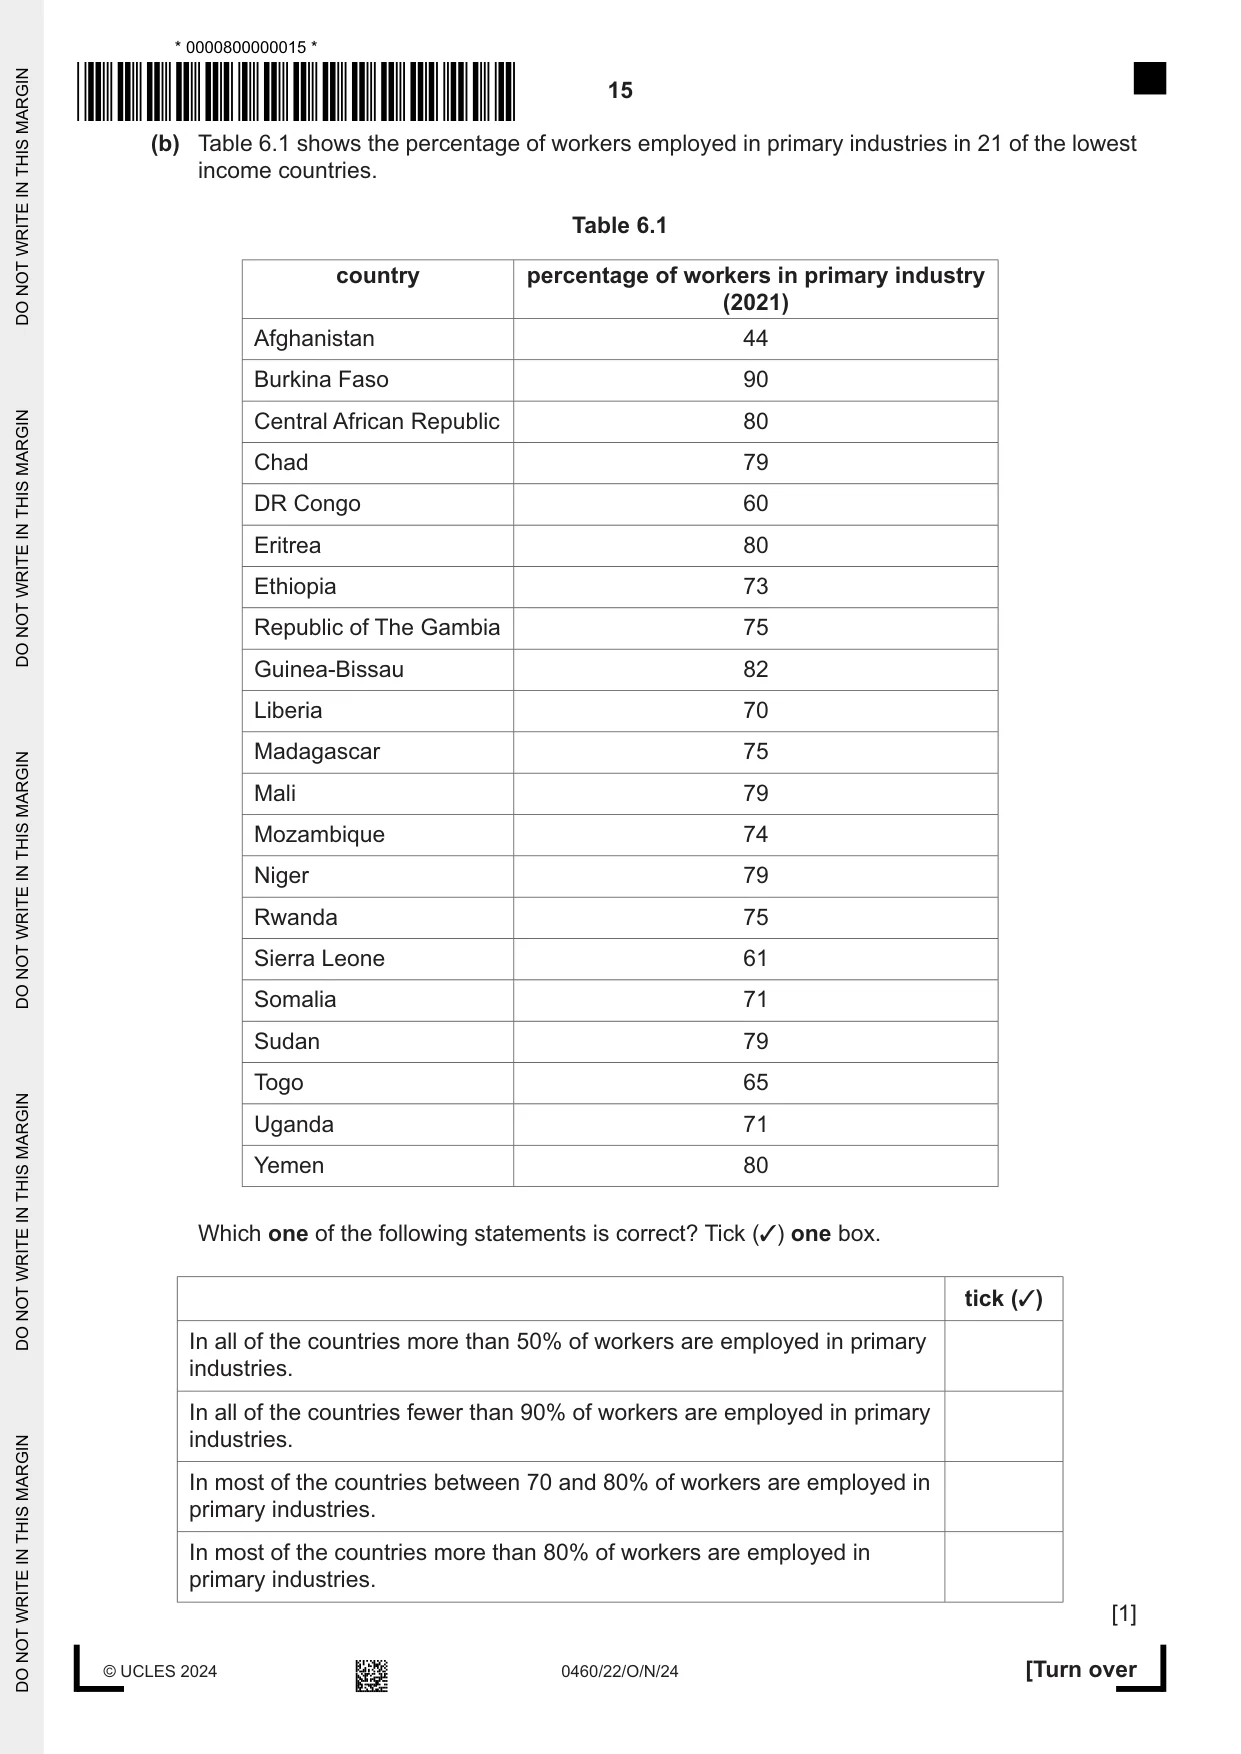
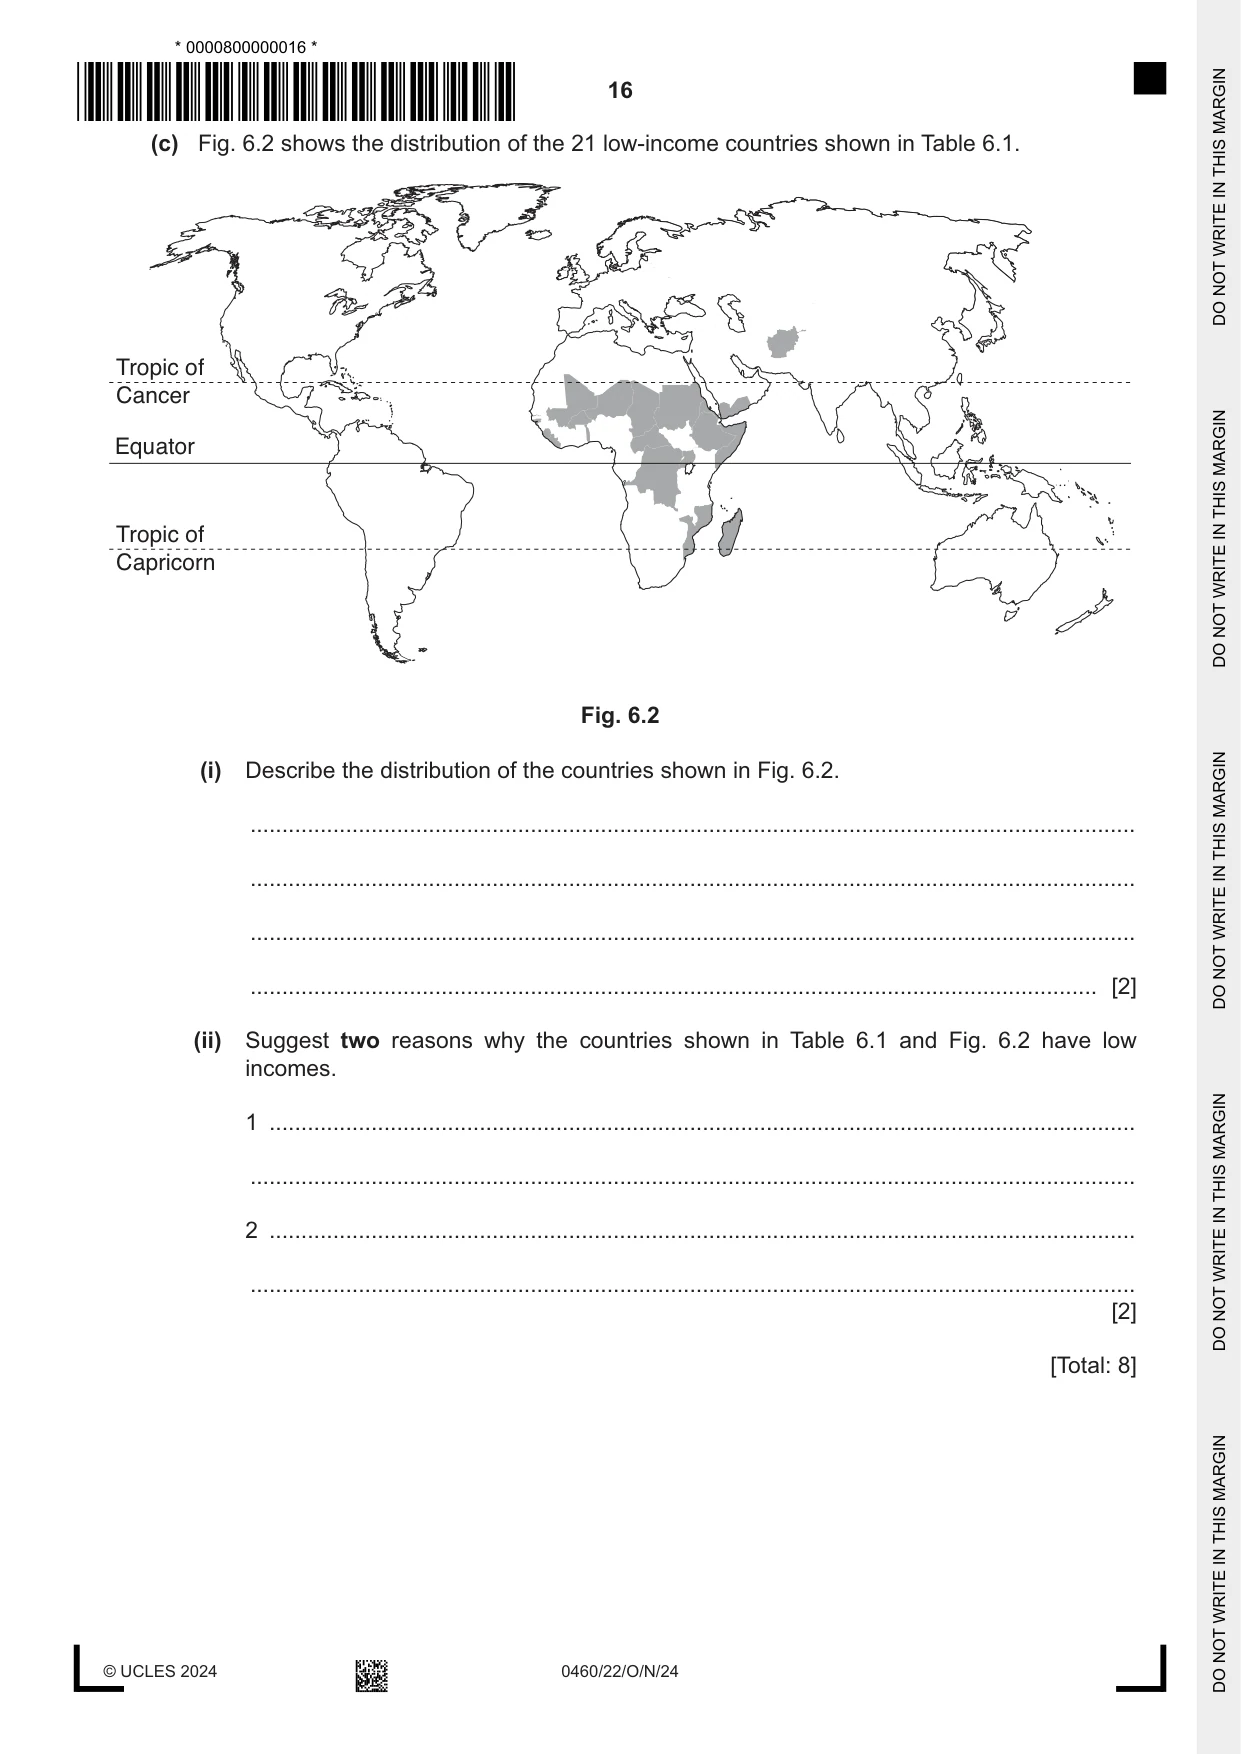
6 (a) Fig. 6.1 shows information about the production of bread. sector A research and development sector B sector C sector D farm sector D factory turns sector D supermarket grows wheat transport wheat into transport sells bread bread Fig. 6.1 Identify the industrial sectors shown in Fig. 6.1. Choose your answers from: primary secondary tertiary quaternary sector A ................................................ sector B ................................................ sector C ................................................ sector D ................................................ [3] (b) Table 6.1 shows the percentage of workers employed in primary industries in 21 of the lowest income countries. Table 6.1 country percentage of workers in primary industry (2021) Afghanistan 44 Burkina Faso 90 Central African Republic 80 Chad 79 DR Congo 60 Eritrea 80 Ethiopia 73 Republic of The Gambia 75 Guinea-Bissau 82 Liberia 70 Madagascar 75 Mali 79 Mozambique 74 Niger 79 Rwanda 75 Sierra Leone 61 Somalia 71 Sudan 79 Togo 65 Uganda 71 Yemen 80 Which one of the following statements is correct? Tick (✓) one box. tick (✓) In all of the countries more than 50% of workers are employed in primary industries. In all of the countries fewer than 90% of workers are employed in primary industries. In most of the countries between 70 and 80% of workers are employed in primary industries. In most of the countries more than 80% of workers are employed in primary industries. [1] (c) Fig. 6.2 shows the distribution of the 21 low-income countries shown in Table 6.1. Tropic of Cancer Equator Tropic of Capricorn Fig. 6.2 (i) Describe the distribution of the countries shown in Fig. 6.2. ........................................................................................................................................... ........................................................................................................................................... ........................................................................................................................................... ..................................................................................................................................... [2] (ii) Suggest two reasons why the countries shown in Table 6.1 and Fig. 6.2 have low incomes. 1 ........................................................................................................................................ ........................................................................................................................................... 2 ........................................................................................................................................ ........................................................................................................................................... [2] [Total: 8] © UCLES 2024 0460/22/O/N/24
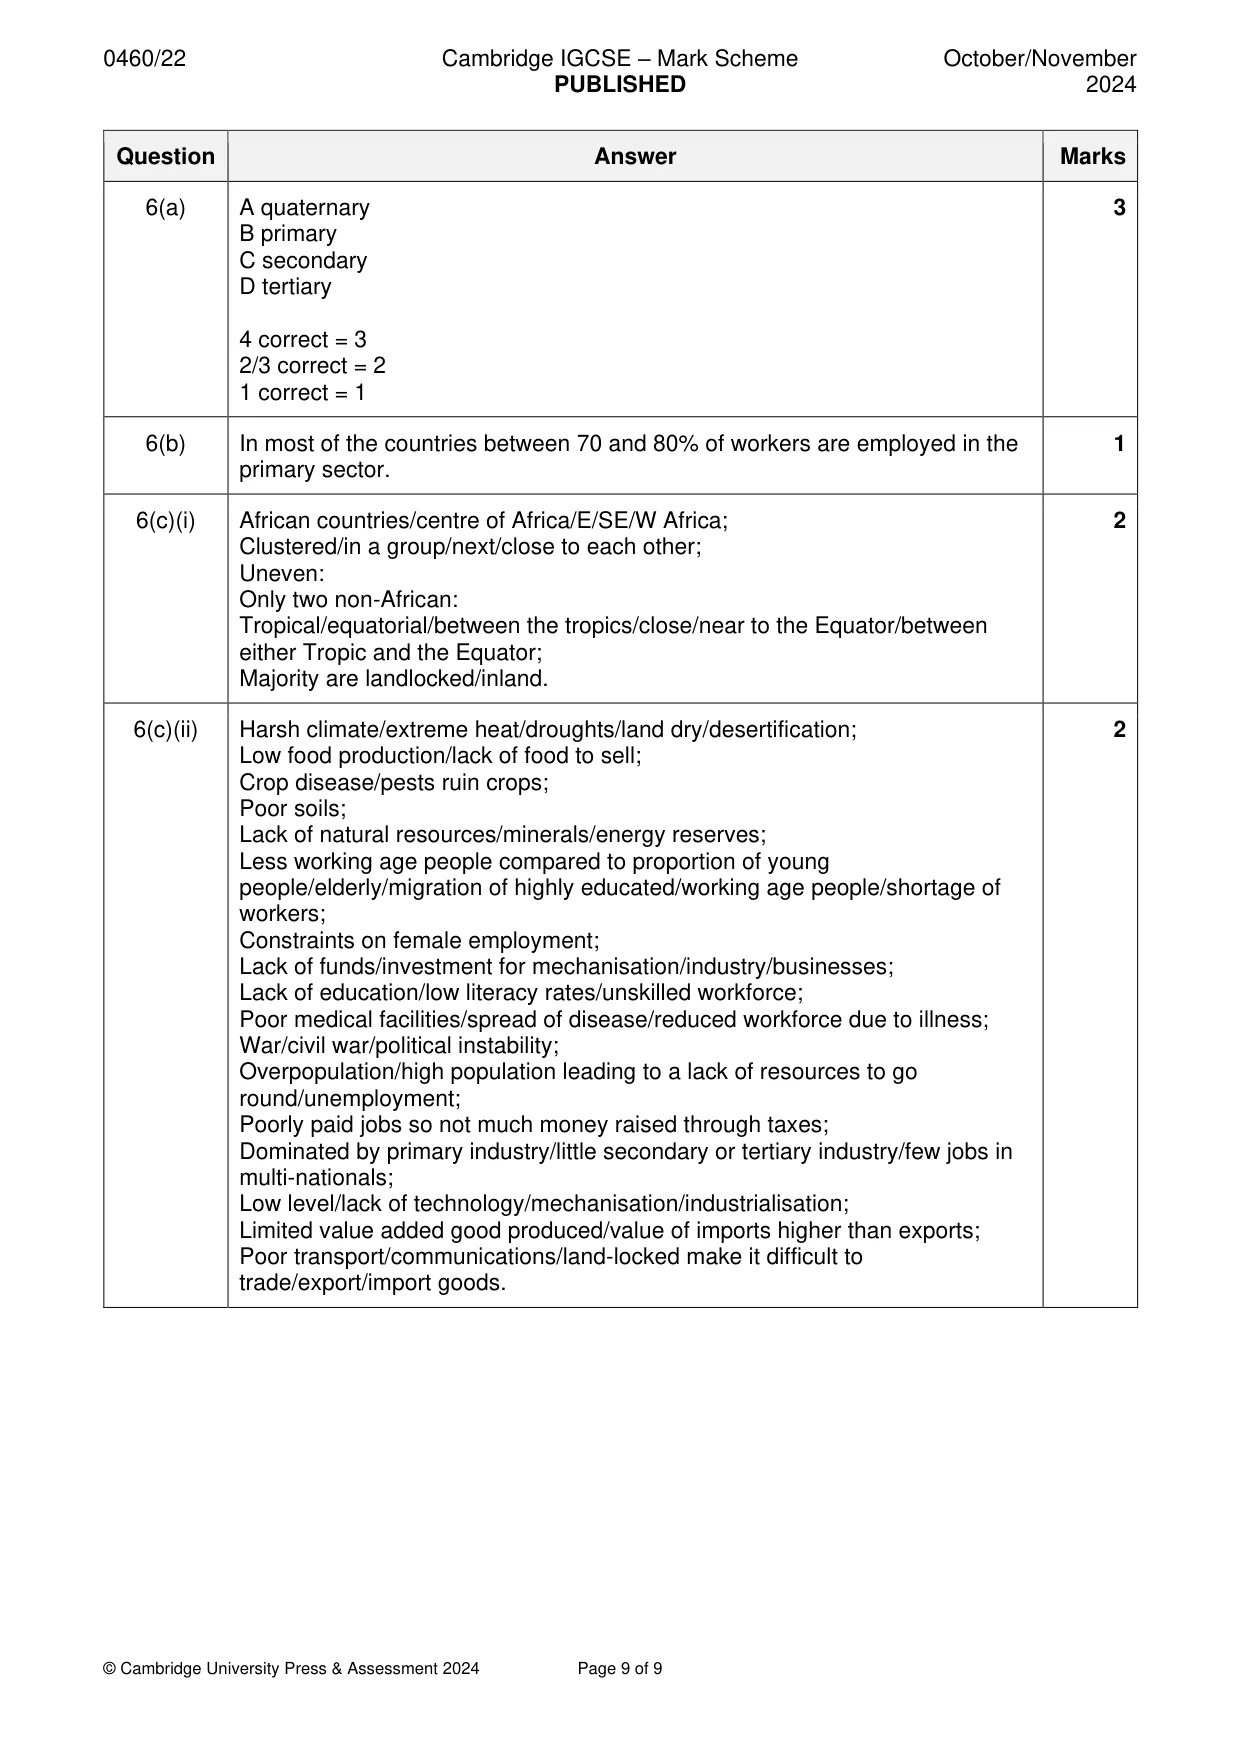
Mark scheme: 6(a) A quaternary 3 B primary C secondary D tertiary 4 correct = 3 2/3 correct = 2 1 correct = 1 6(b) In most of the countries between 70 and 80% of workers are employed in the 1 primary sector. 6(c)(i) African countries/centre of Africa/E/SE/W Africa; 2 Clustered/in a group/next/close to each other; Uneven: Only two non-African: Tropical/equatorial/between the tropics/close/near to the Equator/between either Tropic and the Equator; Majority are landlocked/inland. 6(c)(ii) Harsh climate/extreme heat/droughts/land dry/desertification; 2 Low food production/lack of food to sell; Crop disease/pests ruin crops; Poor soils; Lack of natural resources/minerals/energy reserves; Less working age people compared to proportion of young people/elderly/migration of highly educated/working age people/shortage of workers; Constraints on female employment; Lack of funds/investment for mechanisation/industry/businesses; Lack of education/low literacy rates/unskilled workforce; Poor medical facilities/spread of disease/reduced workforce due to illness; War/civil war/political instability; Overpopulation/high population leading to a lack of resources to go round/unemployment; Poorly paid jobs so not much money raised through taxes; Dominated by primary industry/little secondary or tertiary industry/few jobs in multi-nationals; Low level/lack of technology/mechanisation/industrialisation; Limited value added good produced/value of imports higher than exports; Poor transport/communications/land-locked make it difficult to trade/export/import goods.
What was in this paper
The subtopics covered by these 6 questions, and how many questions each got. Open one in a new tab to see every Cambridge question on it.
What you needed in this session
Cambridge’s own grade thresholds for 2024 Oct/Nov, Paper 2 · Variant 2. A higher threshold means an easier paper — the bar moves with how the cohort did.