Cambridge IGCSE Geography 0460 — 2024 May/June Paper 4 · Variant 2
0460/42/M/J/24 · 2 questions · 60 marks · ≈68 min
The question paper and its mark scheme, free to read here and free to download. This is Cambridge’s own paper, exactly as it was sat.
Question paper20 pages





Mark scheme8 pages
Answers below. Sit the paper first if you are practising.
Questions as text
Q1 · Students from Ecuador who live near the Cotopaxi volcano did some fieldwork to study…
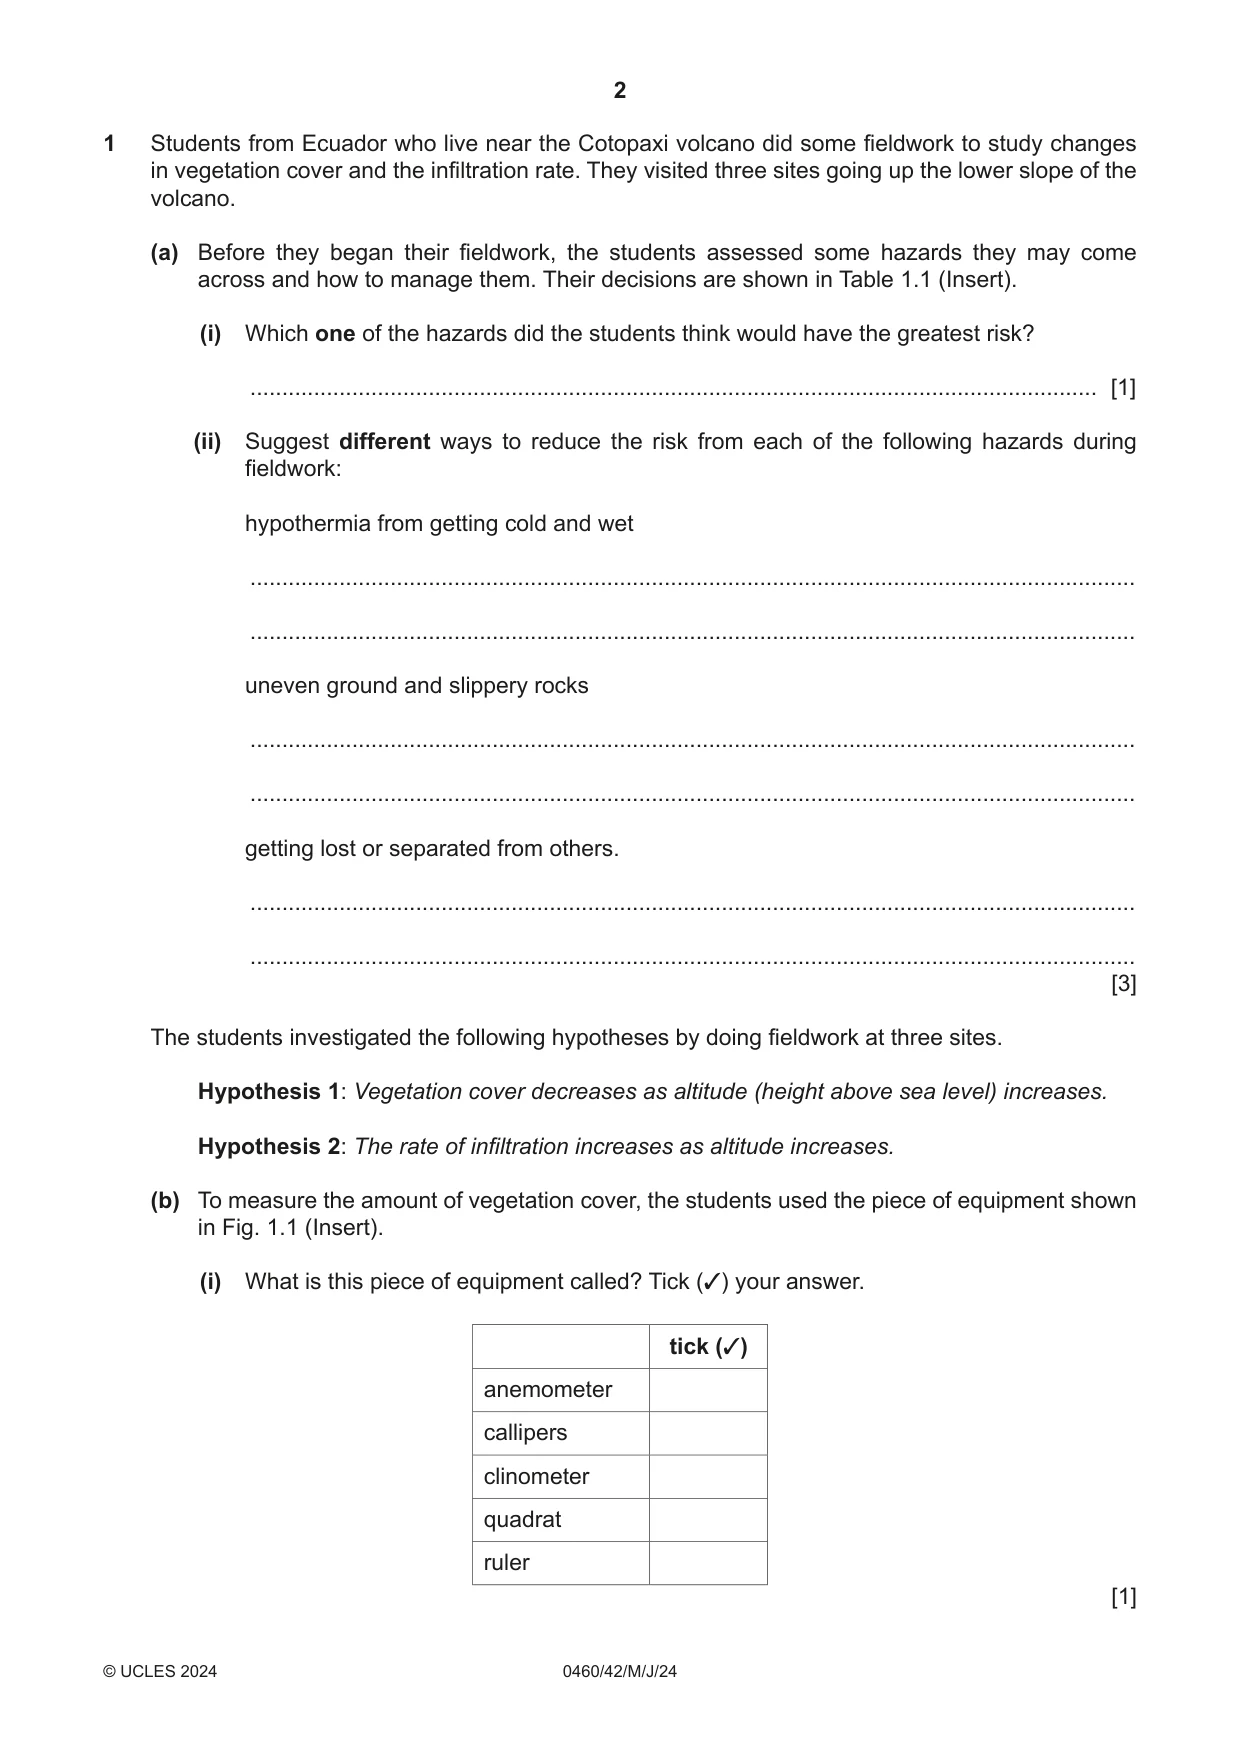
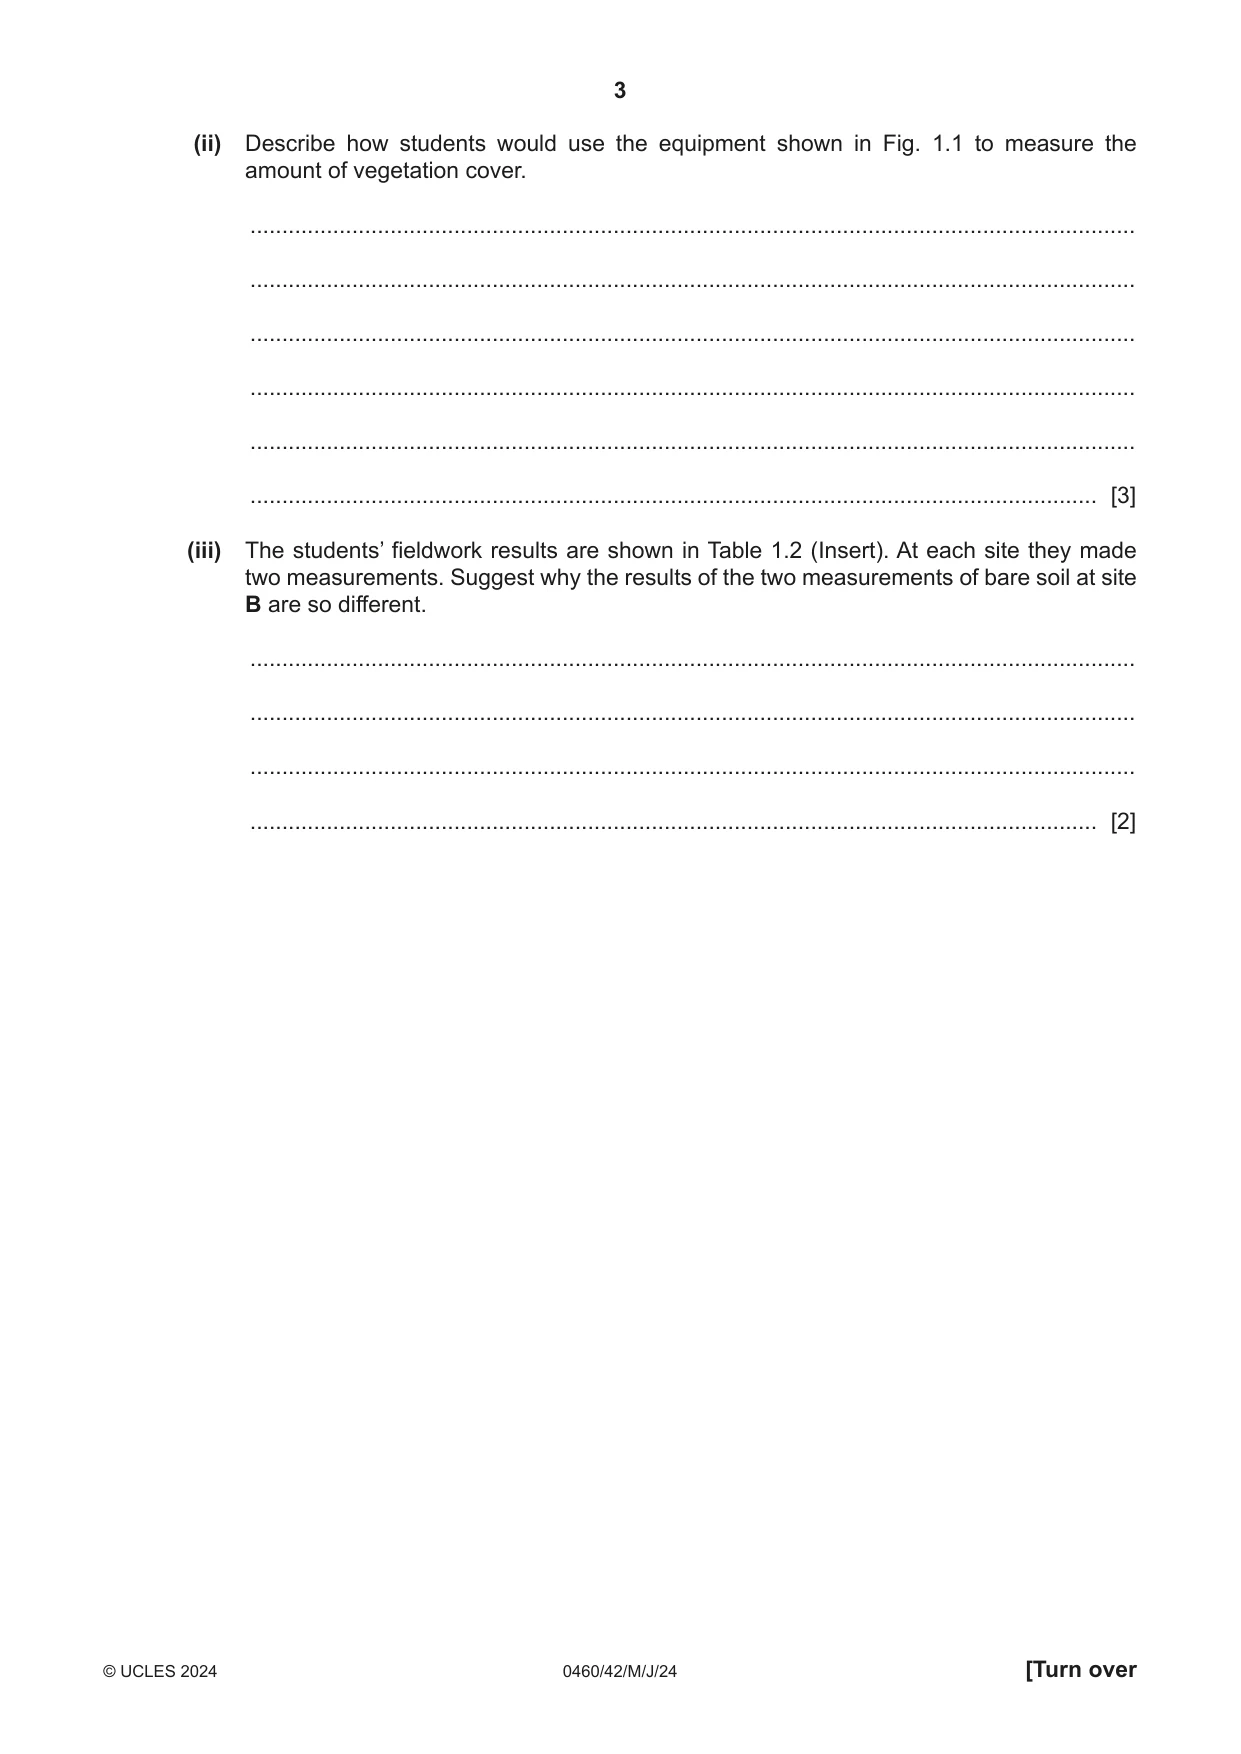
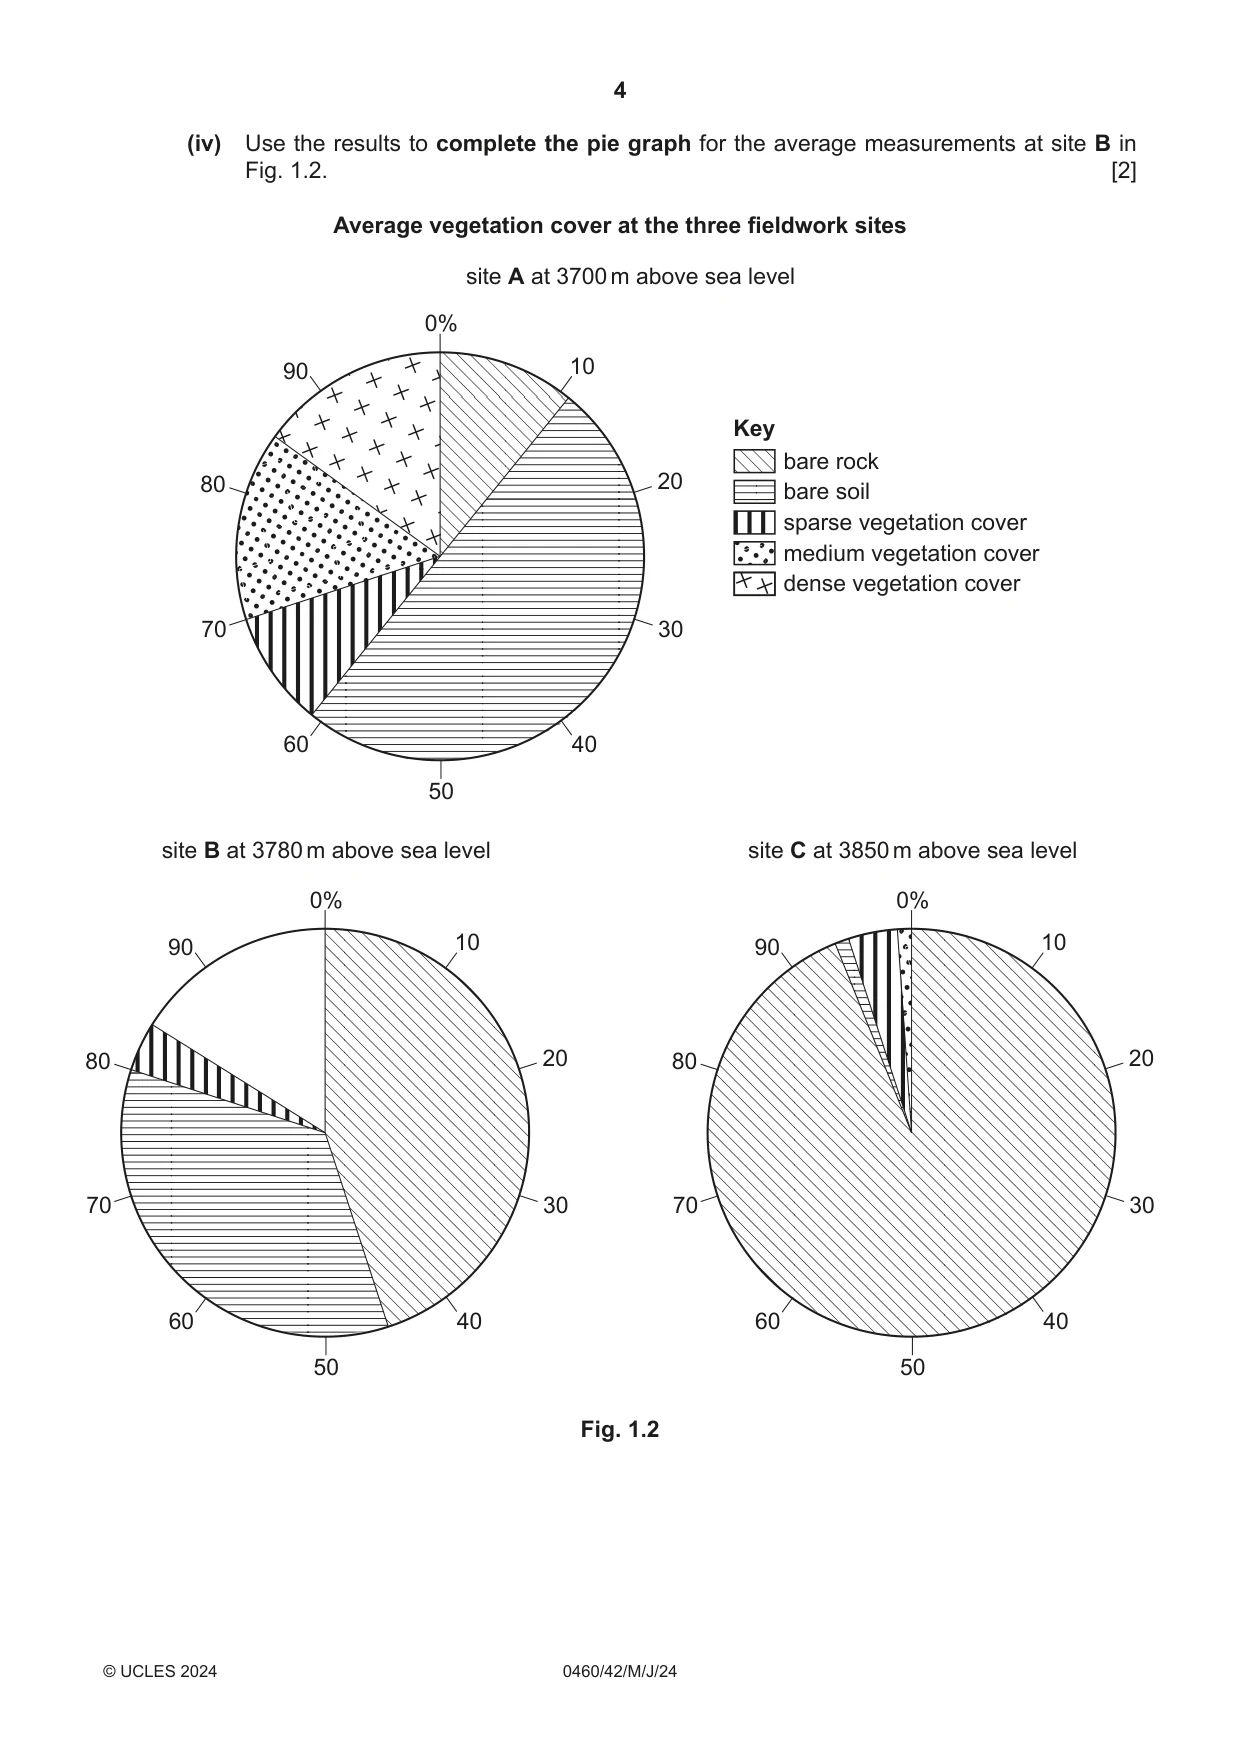
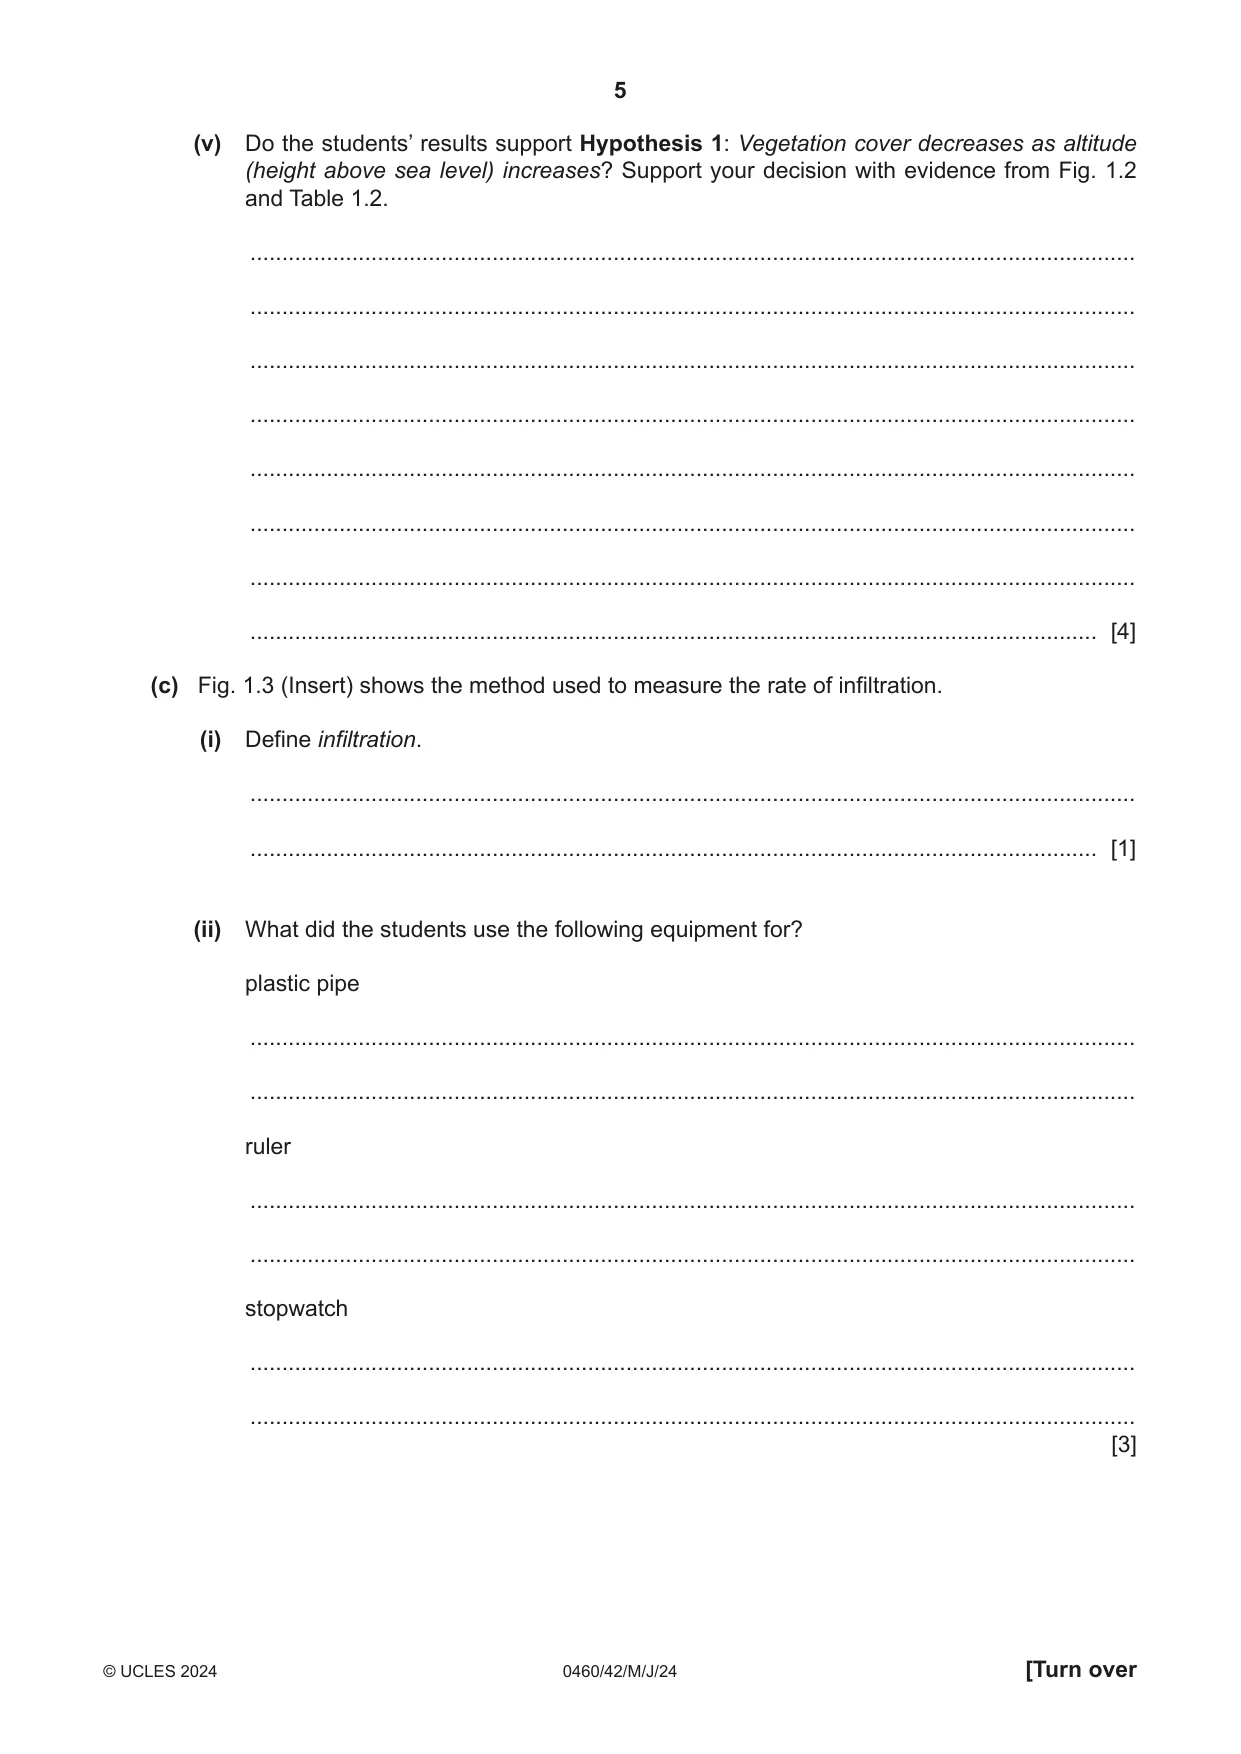
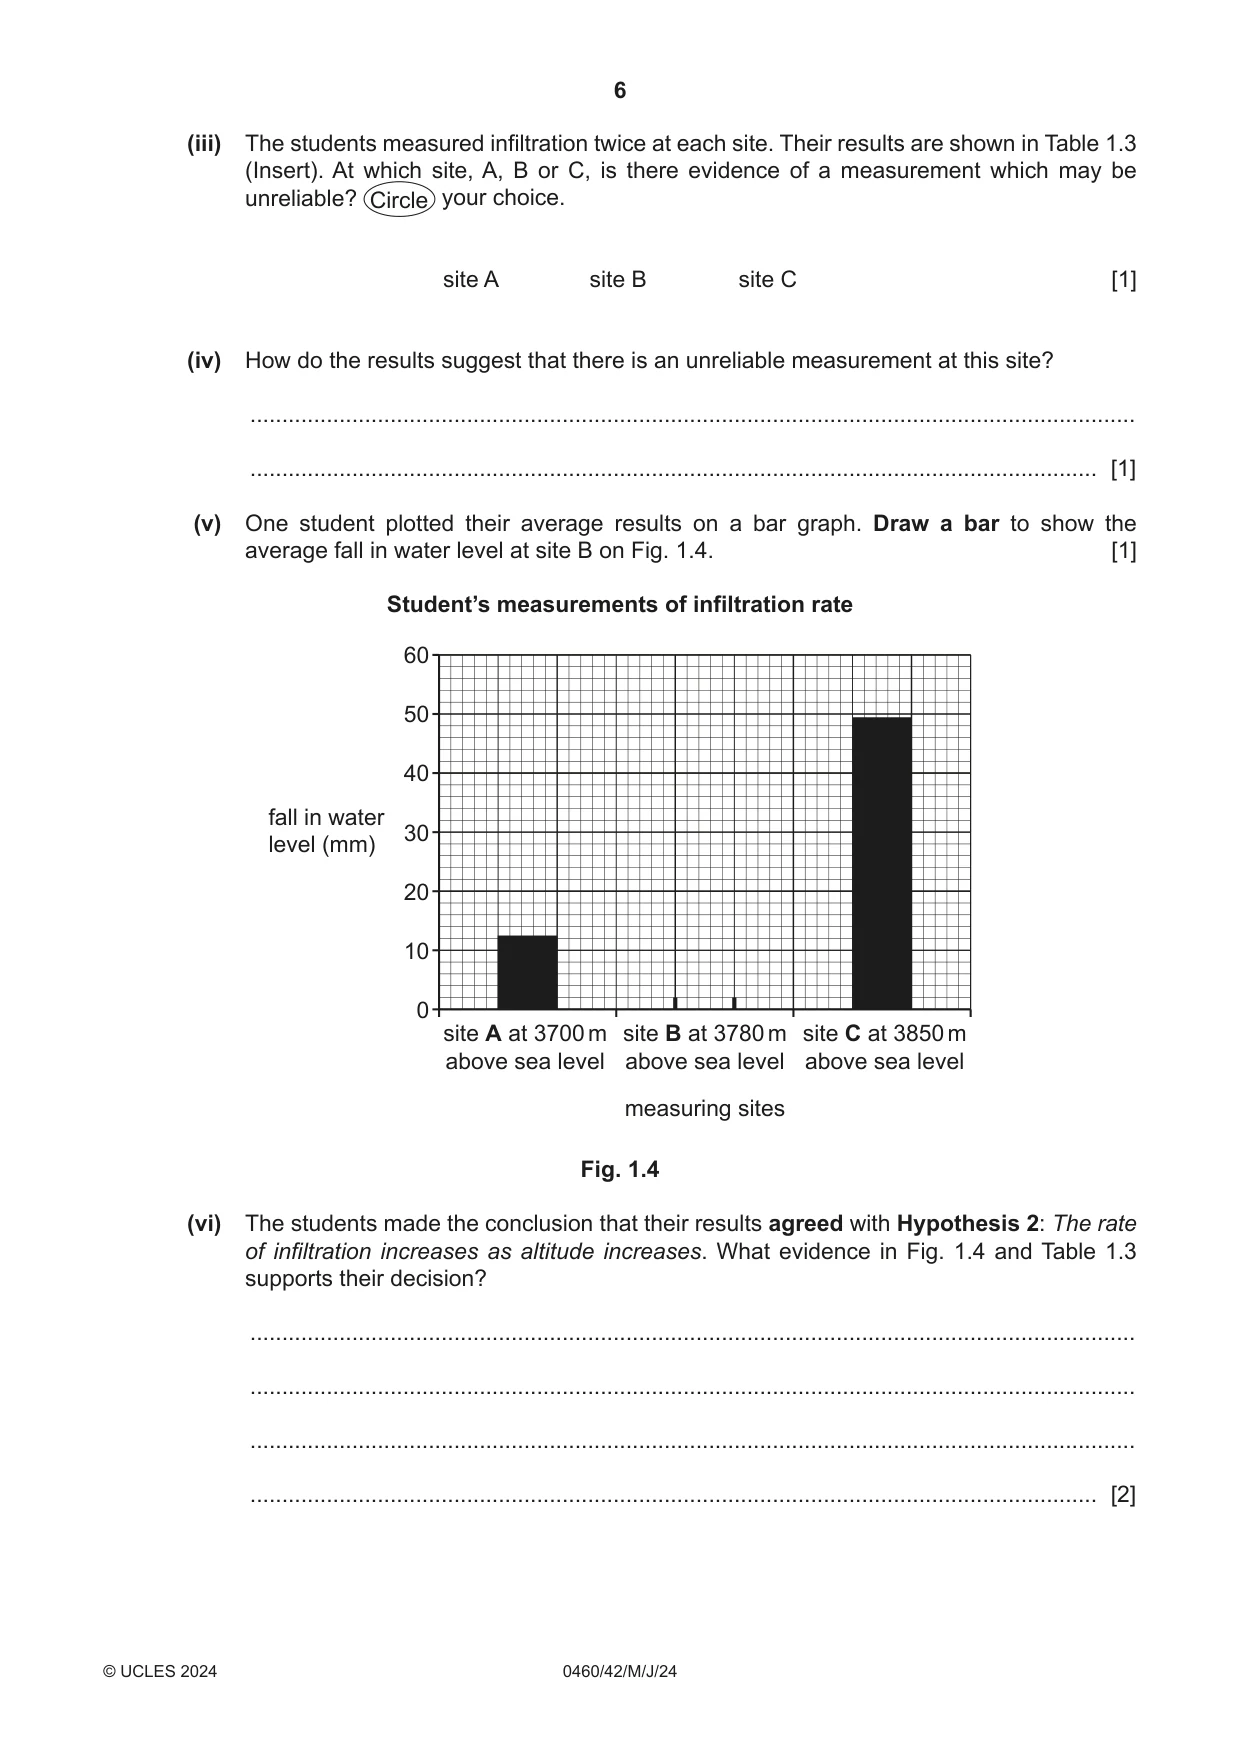
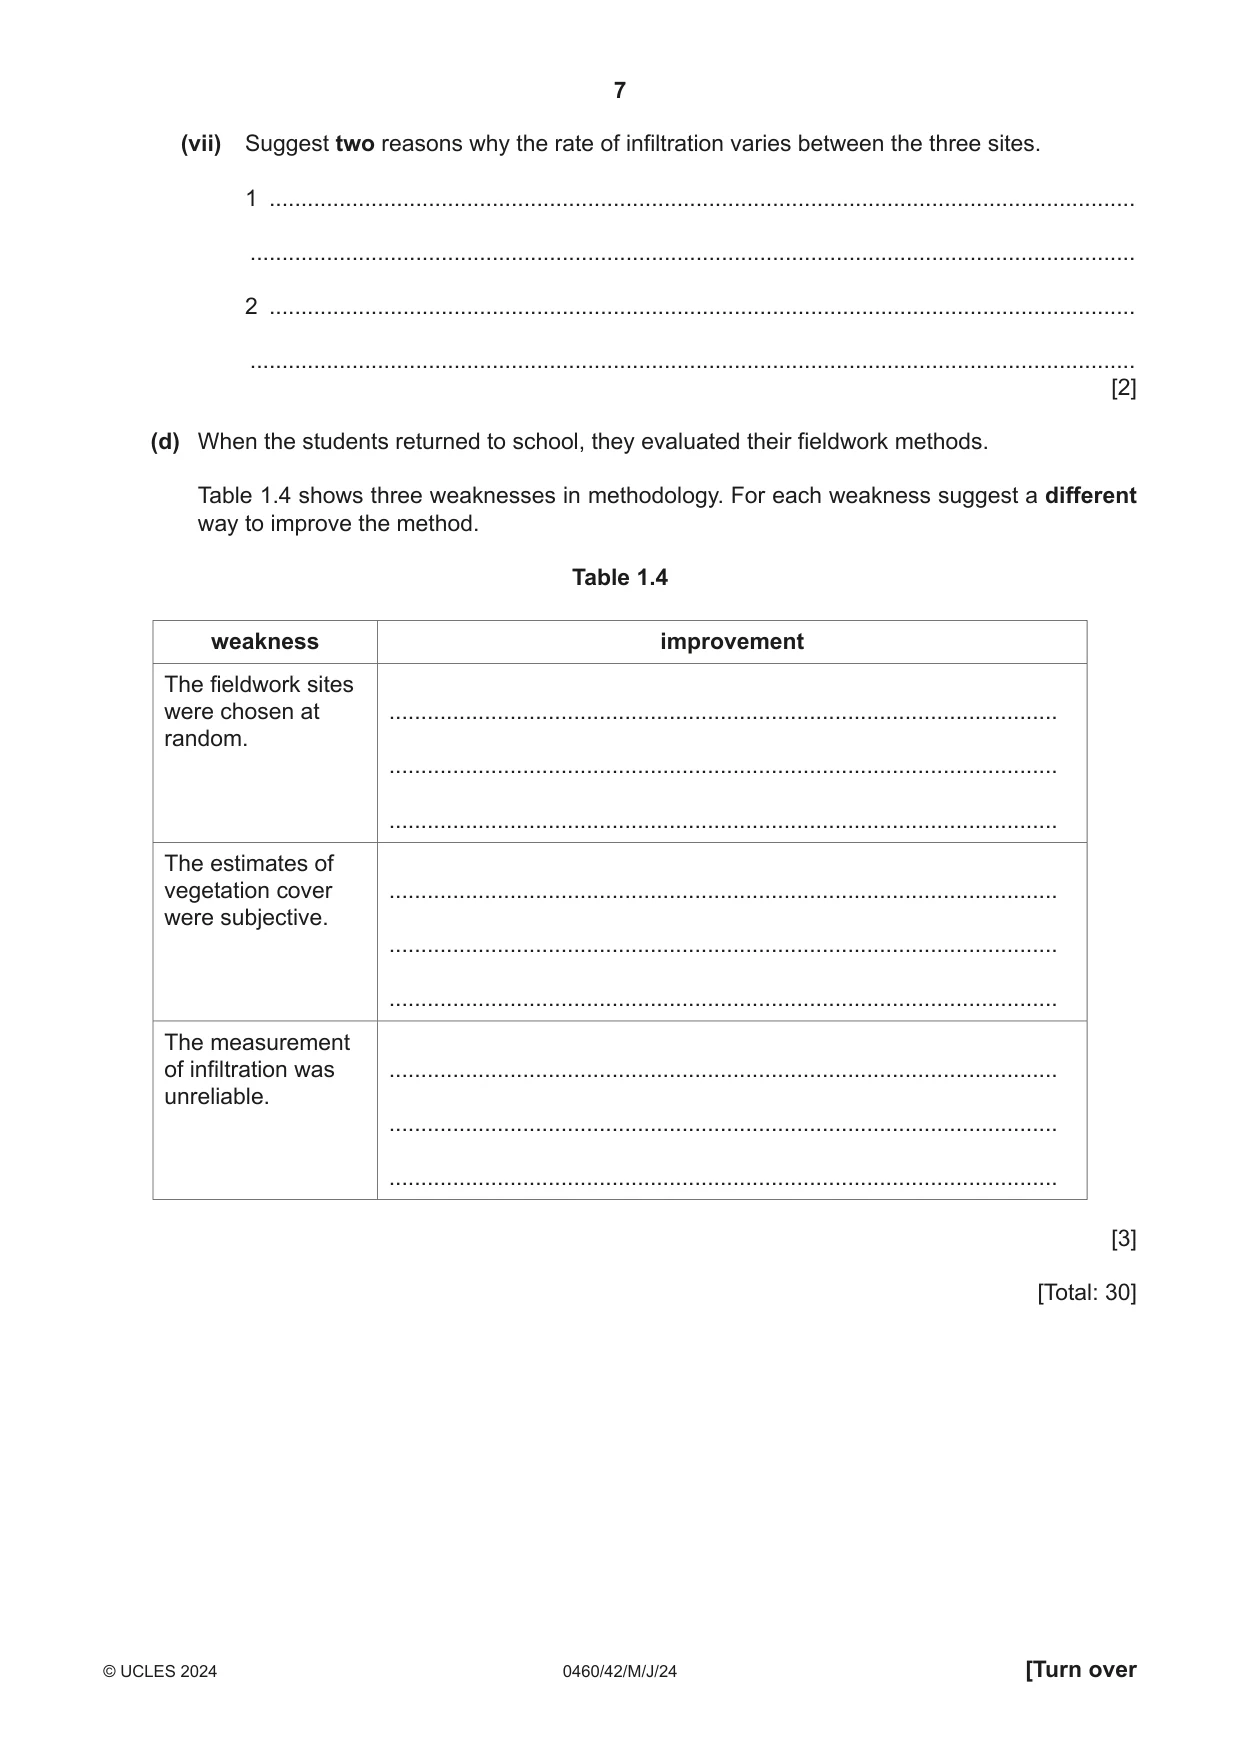
1 Students from Ecuador who live near the Cotopaxi volcano did some fieldwork to study changes in vegetation cover and the infiltration rate. They visited three sites going up the lower slope of the volcano. (a) Before they began their fieldwork, the students assessed some hazards they may come across and how to manage them. Their decisions are shown in Table 1.1 (Insert). (i) Which one of the hazards did the students think would have the greatest risk? ..................................................................................................................................... [1] (ii) Suggest different ways to reduce the risk from each of the following hazards during fieldwork: hypothermia from getting cold and wet ........................................................................................................................................... ........................................................................................................................................... uneven ground and slippery rocks ........................................................................................................................................... ........................................................................................................................................... getting lost or separated from others. ........................................................................................................................................... ........................................................................................................................................... [3] The students investigated the following hypotheses by doing fieldwork at three sites. Hypothesis 1: Vegetation cover decreases as altitude (height above sea level) increases. Hypothesis 2: The rate of infiltration increases as altitude increases. (b) To measure the amount of vegetation cover, the students used the piece of equipment shown in Fig. 1.1 (Insert). (i) What is this piece of equipment called? Tick (3) your answer. tick (3) anemometer callipers clinometer quadrat ruler [1] (ii) Describe how students would use the equipment shown in Fig. 1.1 to measure the amount of vegetation cover. ........................................................................................................................................... ........................................................................................................................................... ........................................................................................................................................... ........................................................................................................................................... ........................................................................................................................................... ..................................................................................................................................... [3] (iii) The students’ fieldwork results are shown in Table 1.2 (Insert). At each site they made two measurements. Suggest why the results of the two measurements of bare soil at site B are so different. ........................................................................................................................................... ........................................................................................................................................... ........................................................................................................................................... ..................................................................................................................................... [2] (iv) Use the results to complete the pie graph for the average measurements at site B in Fig. 1.2. [2] Average vegetation cover at the three fieldwork sites site A at 3700 m above sea level 0% 90 10 Key bare rock 80 20 bare soil sparse vegetation cover medium vegetation cover dense vegetation cover 70 30 60 40 50 site B at 3780 m above sea level site C at 3850 m above sea level 0% 0% 90 10 90 10 80 20 80 20 70 30 70 30 60 40 60 40 50 50 Fig. 1.2 (v) Do the students’ results support Hypothesis 1: Vegetation cover decreases as altitude (height above sea level) increases? Support your decision with evidence from Fig. 1.2 and Table 1.2. ........................................................................................................................................... ........................................................................................................................................... ........................................................................................................................................... ........................................................................................................................................... ........................................................................................................................................... ........................................................................................................................................... ........................................................................................................................................... ..................................................................................................................................... [4] (c) Fig. 1.3 (Insert) shows the method used to measure the rate of infiltration. (i) Define infiltration. ........................................................................................................................................... ..................................................................................................................................... [1] (ii) What did the students use the following equipment for? plastic pipe ........................................................................................................................................... ........................................................................................................................................... ruler ........................................................................................................................................... ........................................................................................................................................... stopwatch ........................................................................................................................................... ........................................................................................................................................... [3] (iii) The students measured infiltration twice at each site. Their results are shown in Table 1.3 (Insert). At which site, A, B or C, is there evidence of a measurement which may be unreliable? Circle your choice. site A site B site C [1] (iv) How do the results suggest that there is an unreliable measurement at this site? ........................................................................................................................................... ..................................................................................................................................... [1] (v) One student plotted their average results on a bar graph. Draw a bar to show the average fall in water level at site B on Fig. 1.4. [1] Student’s measurements of infiltration rate 60 50 40 fall in water 30 level (mm) 20 10 0 site A at 3700 m site B at 3780 m site C at 3850 m above sea level above sea level above sea level measuring sites Fig. 1.4 (vi) The students made the conclusion that their results agreed with Hypothesis 2: The rate of infiltration increases as altitude increases. What evidence in Fig. 1.4 and Table 1.3 supports their decision? ........................................................................................................................................... ........................................................................................................................................... ........................................................................................................................................... ..................................................................................................................................... [2] (vii) Suggest two reasons why the rate of infiltration varies between the three sites. 1 ........................................................................................................................................ ........................................................................................................................................... 2 ........................................................................................................................................ ........................................................................................................................................... [2] (d) When the students returned to school, they evaluated their fieldwork methods. Table 1.4 shows three weaknesses in methodology. For each weakness suggest a different way to improve the method. Table 1.4 weakness improvement The fieldwork sites were chosen at ......................................................................................................... random. ......................................................................................................... ......................................................................................................... The estimates of vegetation cover ......................................................................................................... were subjective. ......................................................................................................... ......................................................................................................... The measurement of infiltration was ......................................................................................................... unreliable. ......................................................................................................... ......................................................................................................... [3] [Total: 30]
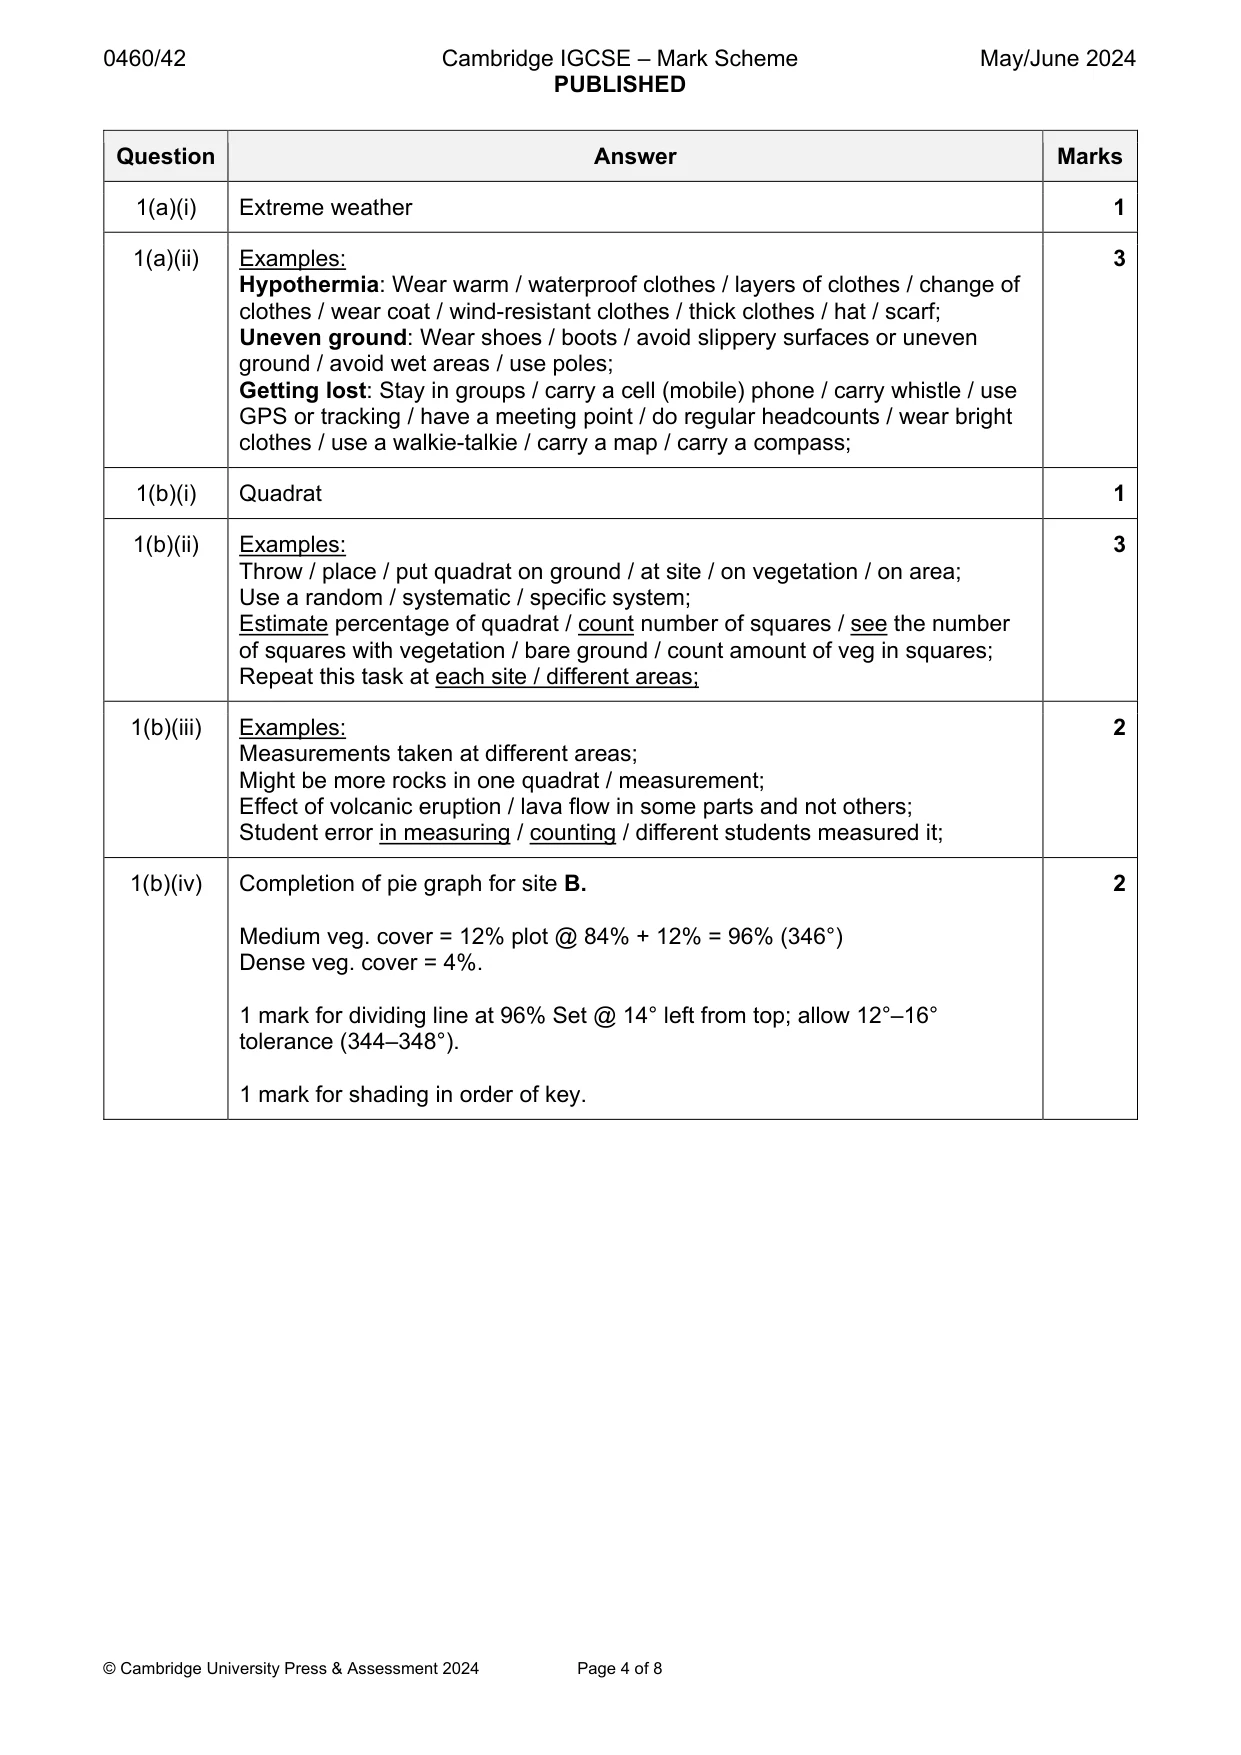
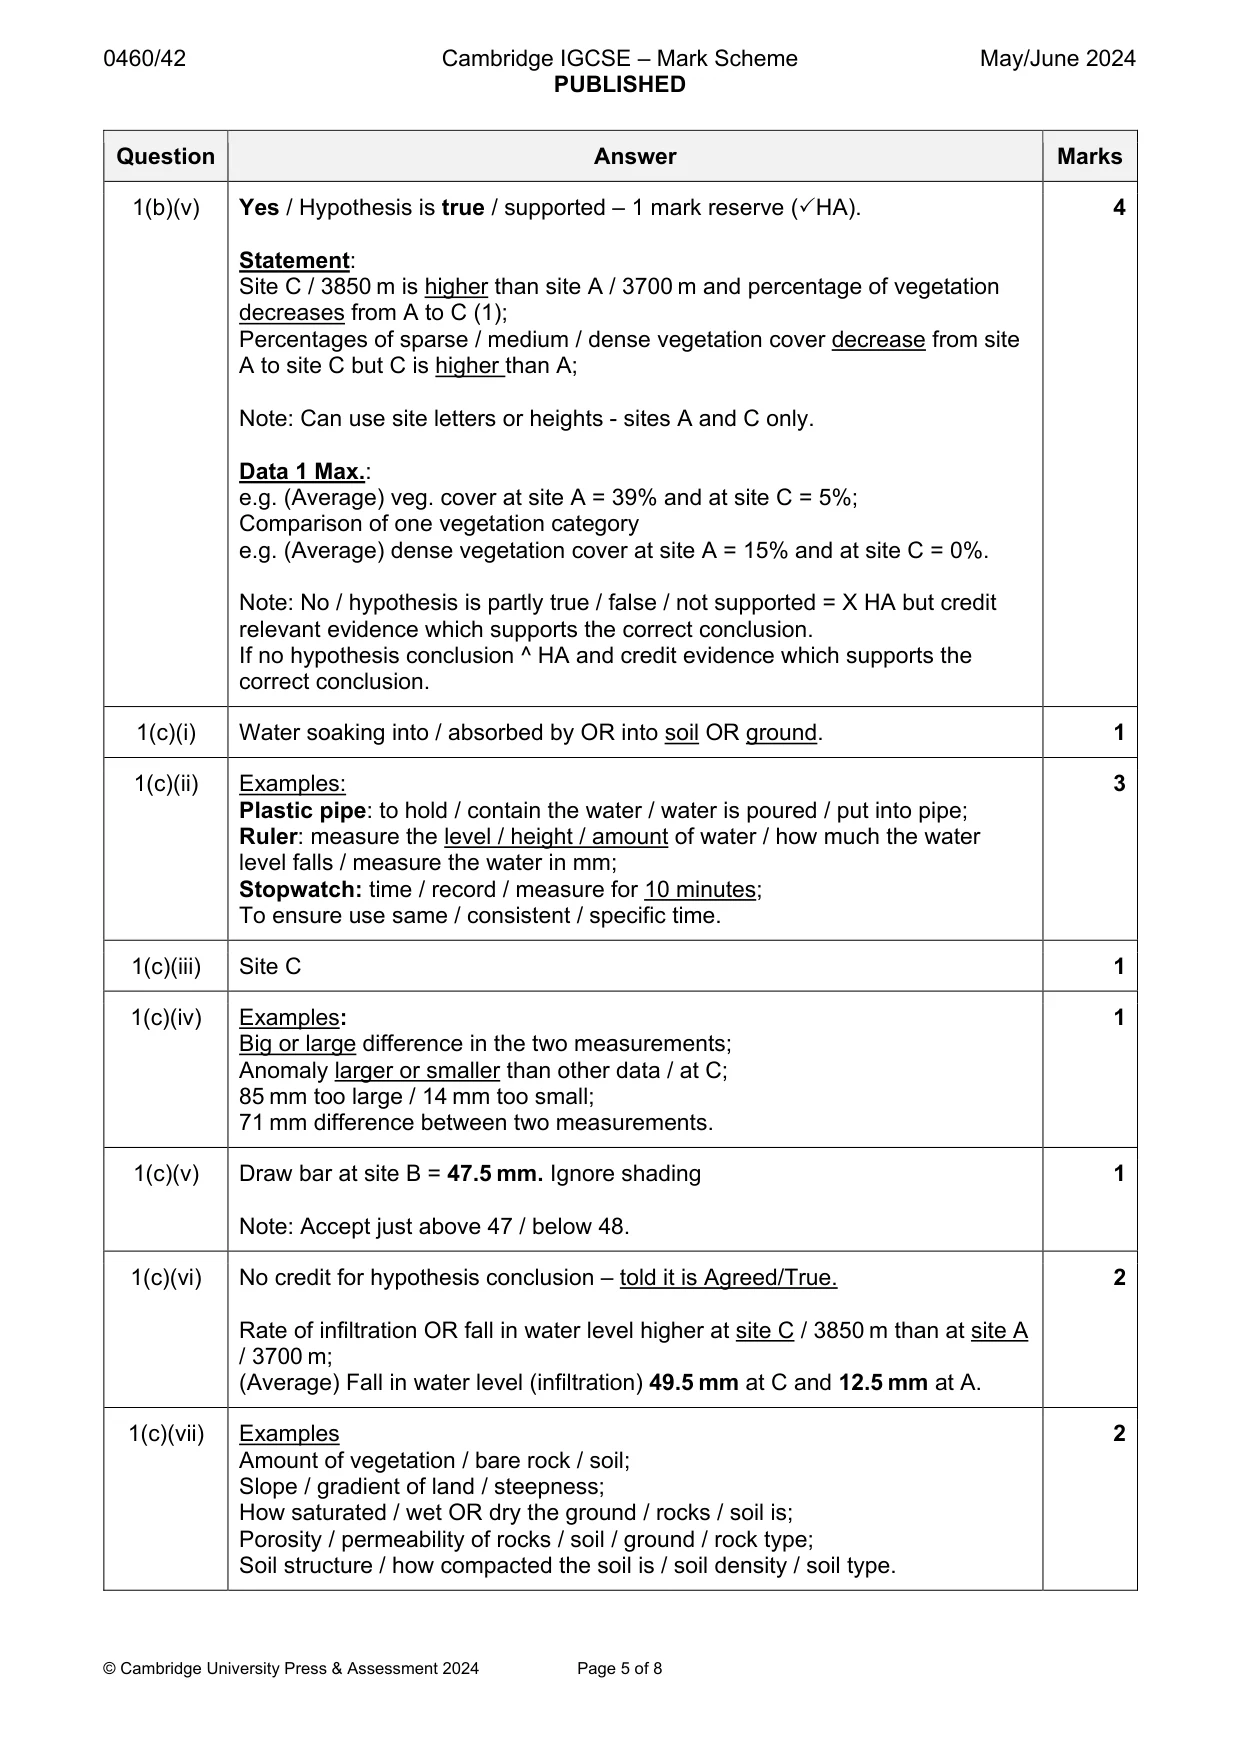
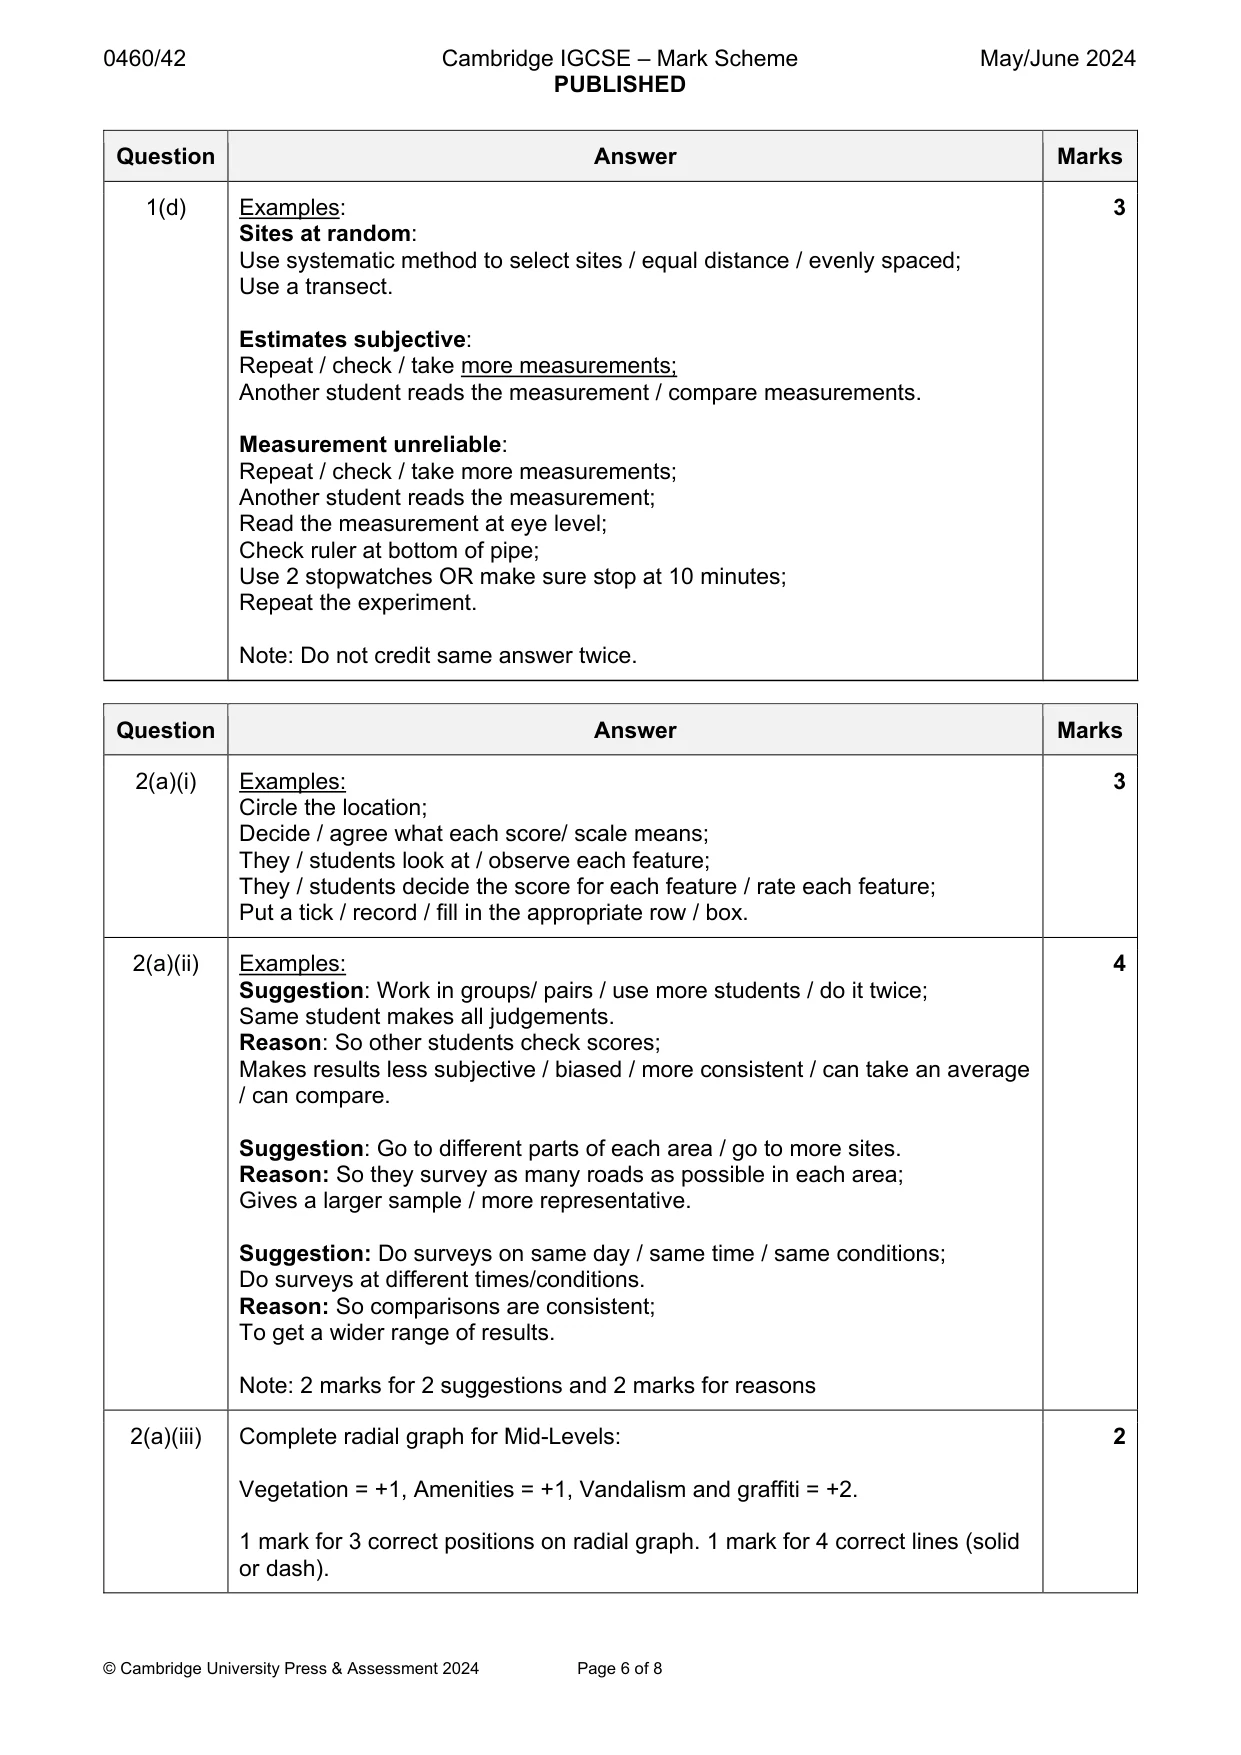
Mark scheme: Question Answer Marks 1(a)(i) Extreme weather 1 1(a)(ii) Examples: 3 Hypothermia: Wear warm / waterproof clothes / layers of clothes / change of clothes / wear coat / wind-resistant clothes / thick clothes / hat / scarf; Uneven ground: Wear shoes / boots / avoid slippery surfaces or uneven ground / avoid wet areas / use poles; Getting lost: Stay in groups / carry a cell (mobile) phone / carry whistle / use GPS or tracking / have a meeting point / do regular headcounts / wear bright clothes / use a walkie-talkie / carry a map / carry a compass; 1(b)(i) Quadrat 1 1(b)(ii) Examples: 3 Throw / place / put quadrat on ground / at site / on vegetation / on area; Use a random / systematic / specific system; Estimate percentage of quadrat / count number of squares / see the number of squares with vegetation / bare ground / count amount of veg in squares; Repeat this task at each site / different areas; 1(b)(iii) Examples: 2 Measurements taken at different areas; Might be more rocks in one quadrat / measurement; Effect of volcanic eruption / lava flow in some parts and not others; Student error in measuring / counting / different students measured it; 1(b)(iv) Completion of pie graph for site B. 2 Medium veg. cover = 12% plot @ 84% + 12% = 96% (346°) Dense veg. cover = 4%. 1 mark for dividing line at 96% Set @ 14° left from top; allow 12°–16° tolerance (344–348°). 1 mark for shading in order of key. 1(b)(v) Yes / Hypothesis is true / supported – 1 mark reserve (HA). 4 Statement: Site C / 3850 m is higher than site A / 3700 m and percentage of vegetation decreases from A to C (1); Percentages of sparse / medium / dense vegetation cover decrease from site A to site C but C is higher than A; Note: Can use site letters or heights - sites A and C only. Data 1 Max.: e.g. (Average) veg. cover at site A = 39% and at site C = 5%; Comparison of one vegetation category e.g. (Average) dense vegetation cover at site A = 15% and at site C = 0%. Note: No / hypothesis is partly true / false / not supported = X HA but credit relevant evidence which supports the correct conclusion. If no hypothesis conclusion ^ HA and credit evidence which supports the correct conclusion. 1(c)(i) Water soaking into / absorbed by OR into soil OR ground. 1 1(c)(ii) Examples: 3 Plastic pipe: to hold / contain the water / water is poured / put into pipe; Ruler: measure the level / height / amount of water / how much the water level falls / measure the water in mm; Stopwatch: time / record / measure for 10 minutes; To ensure use same / consistent / specific time. 1(c)(iii) Site C 1 1(c)(iv) Examples: 1 Big or large difference in the two measurements; Anomaly larger or smaller than other data / at C; 85 mm too large / 14 mm too small; 71 mm difference between two measurements. 1(c)(v) Draw bar at site B = 47.5 mm. Ignore shading 1 Note: Accept just above 47 / below 48. 1(c)(vi) No credit for hypothesis conclusion – told it is Agreed/True. 2 Rate of infiltration OR fall in water level higher at site C / 3850 m than at site A / 3700 m; (Average) Fall in water level (infiltration) 49.5 mm at C and 12.5 mm at A. 1(c)(vii) Examples 2 Amount of vegetation / bare rock / soil; Slope / gradient of land / steepness; How saturated / wet OR dry the ground / rocks / soil is; Porosity / permeability of rocks / soil / ground / rock type; Soil structure / how compacted the soil is / soil density / soil type. 1(d) Examples: 3 Sites at random: Use systematic method to select sites / equal distance / evenly spaced; Use a transect. Estimates subjective: Repeat / check / take more measurements; Another student reads the measurement / compare measurements. Measurement unreliable: Repeat / check / take more measurements; Another student reads the measurement; Read the measurement at eye level; Check ruler at bottom of pipe; Use 2 stopwatches OR make sure stop at 10 minutes; Repeat the experiment. Note: Do not credit same answer twice.
Q2 · Students in the city of Hong Kong did fieldwork to compare different residential areas
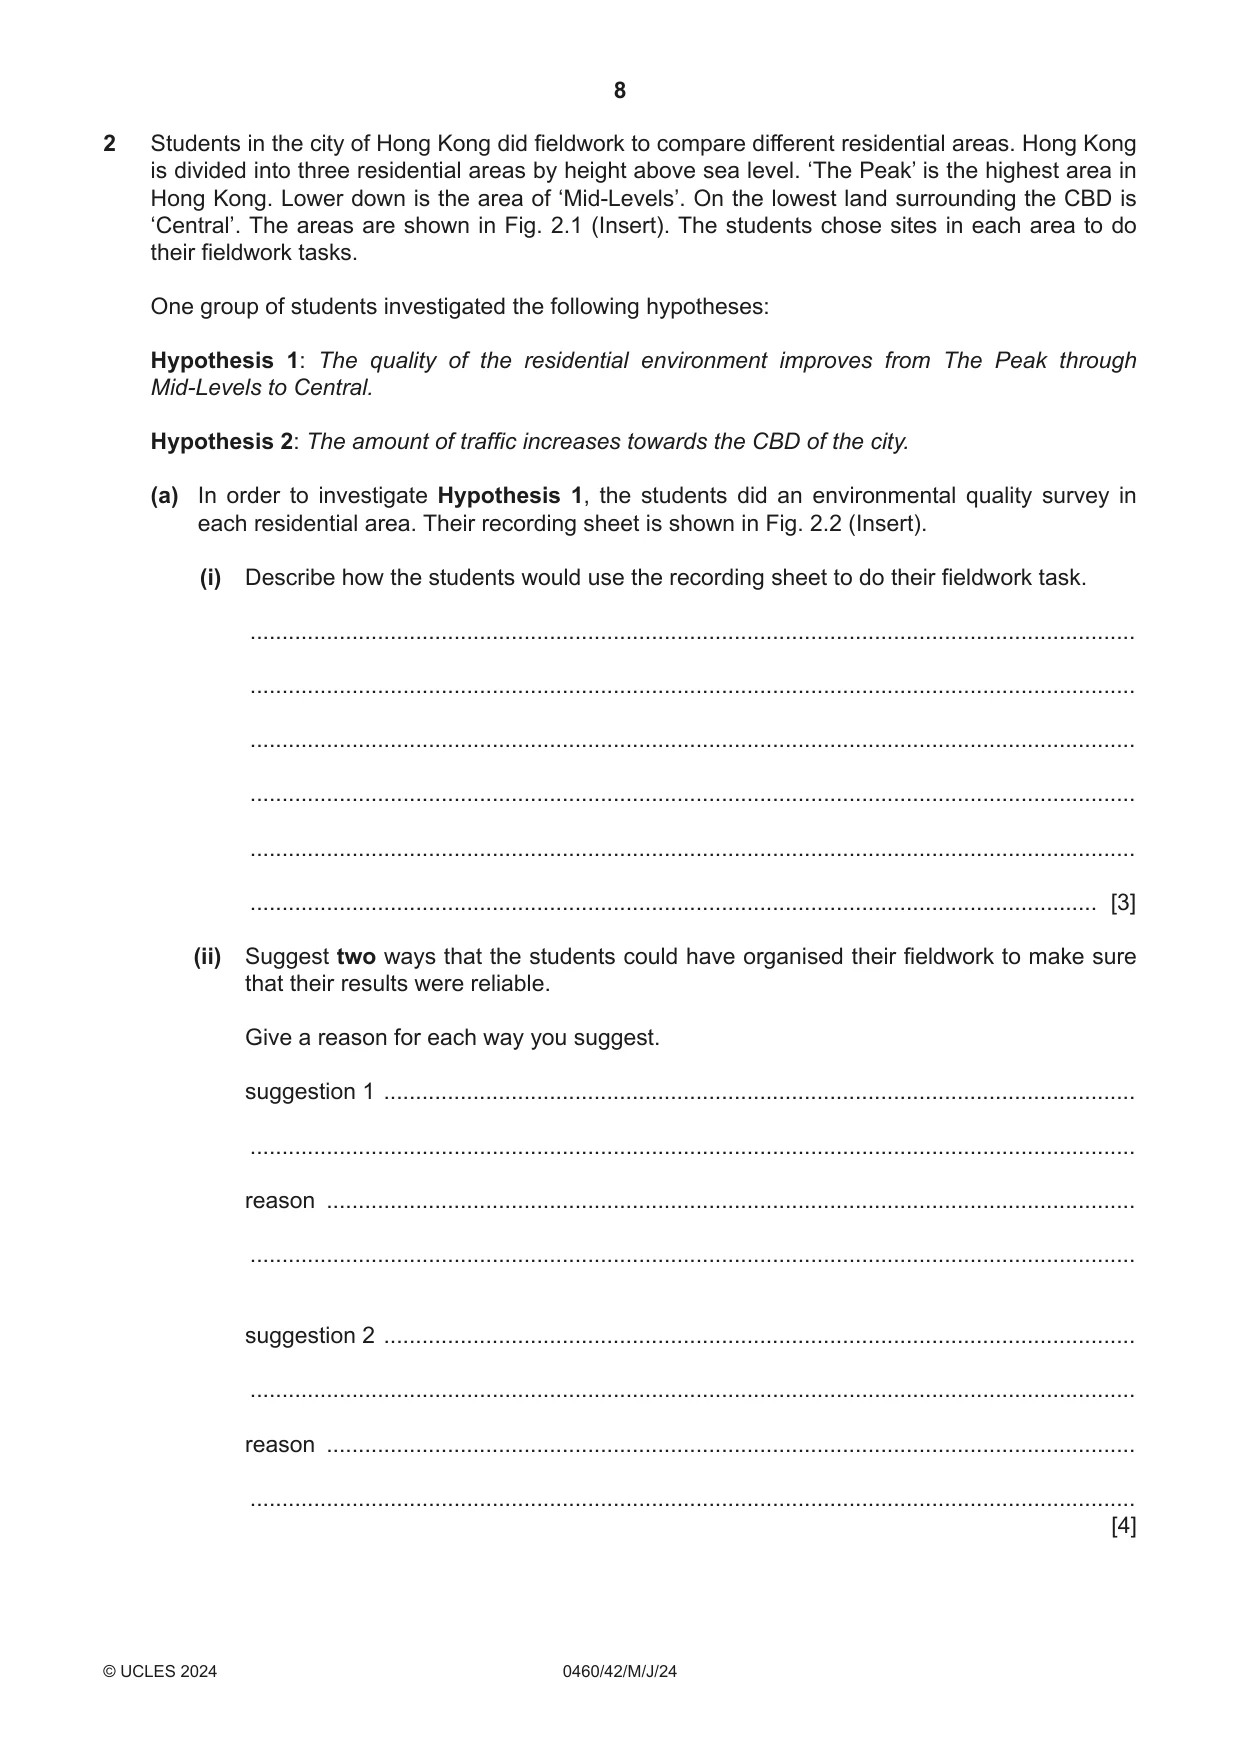
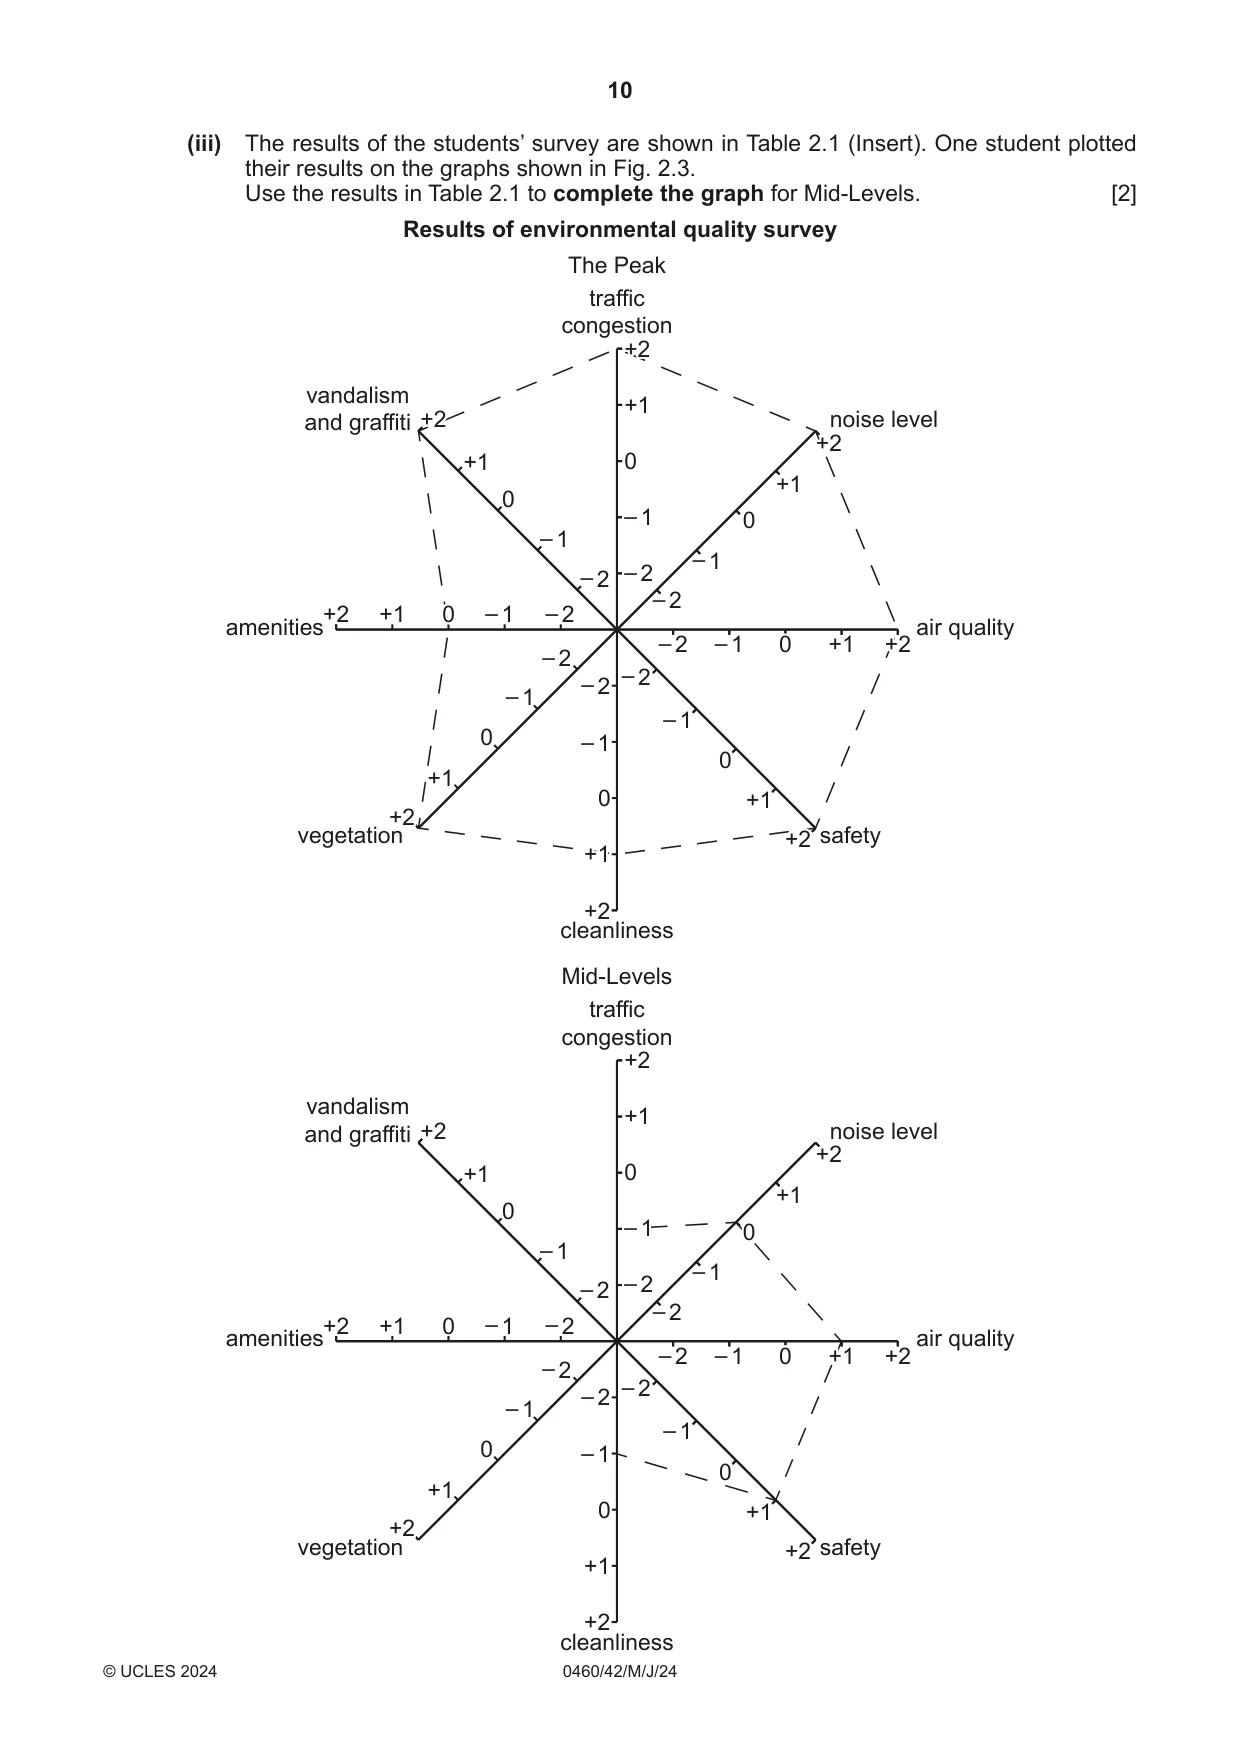
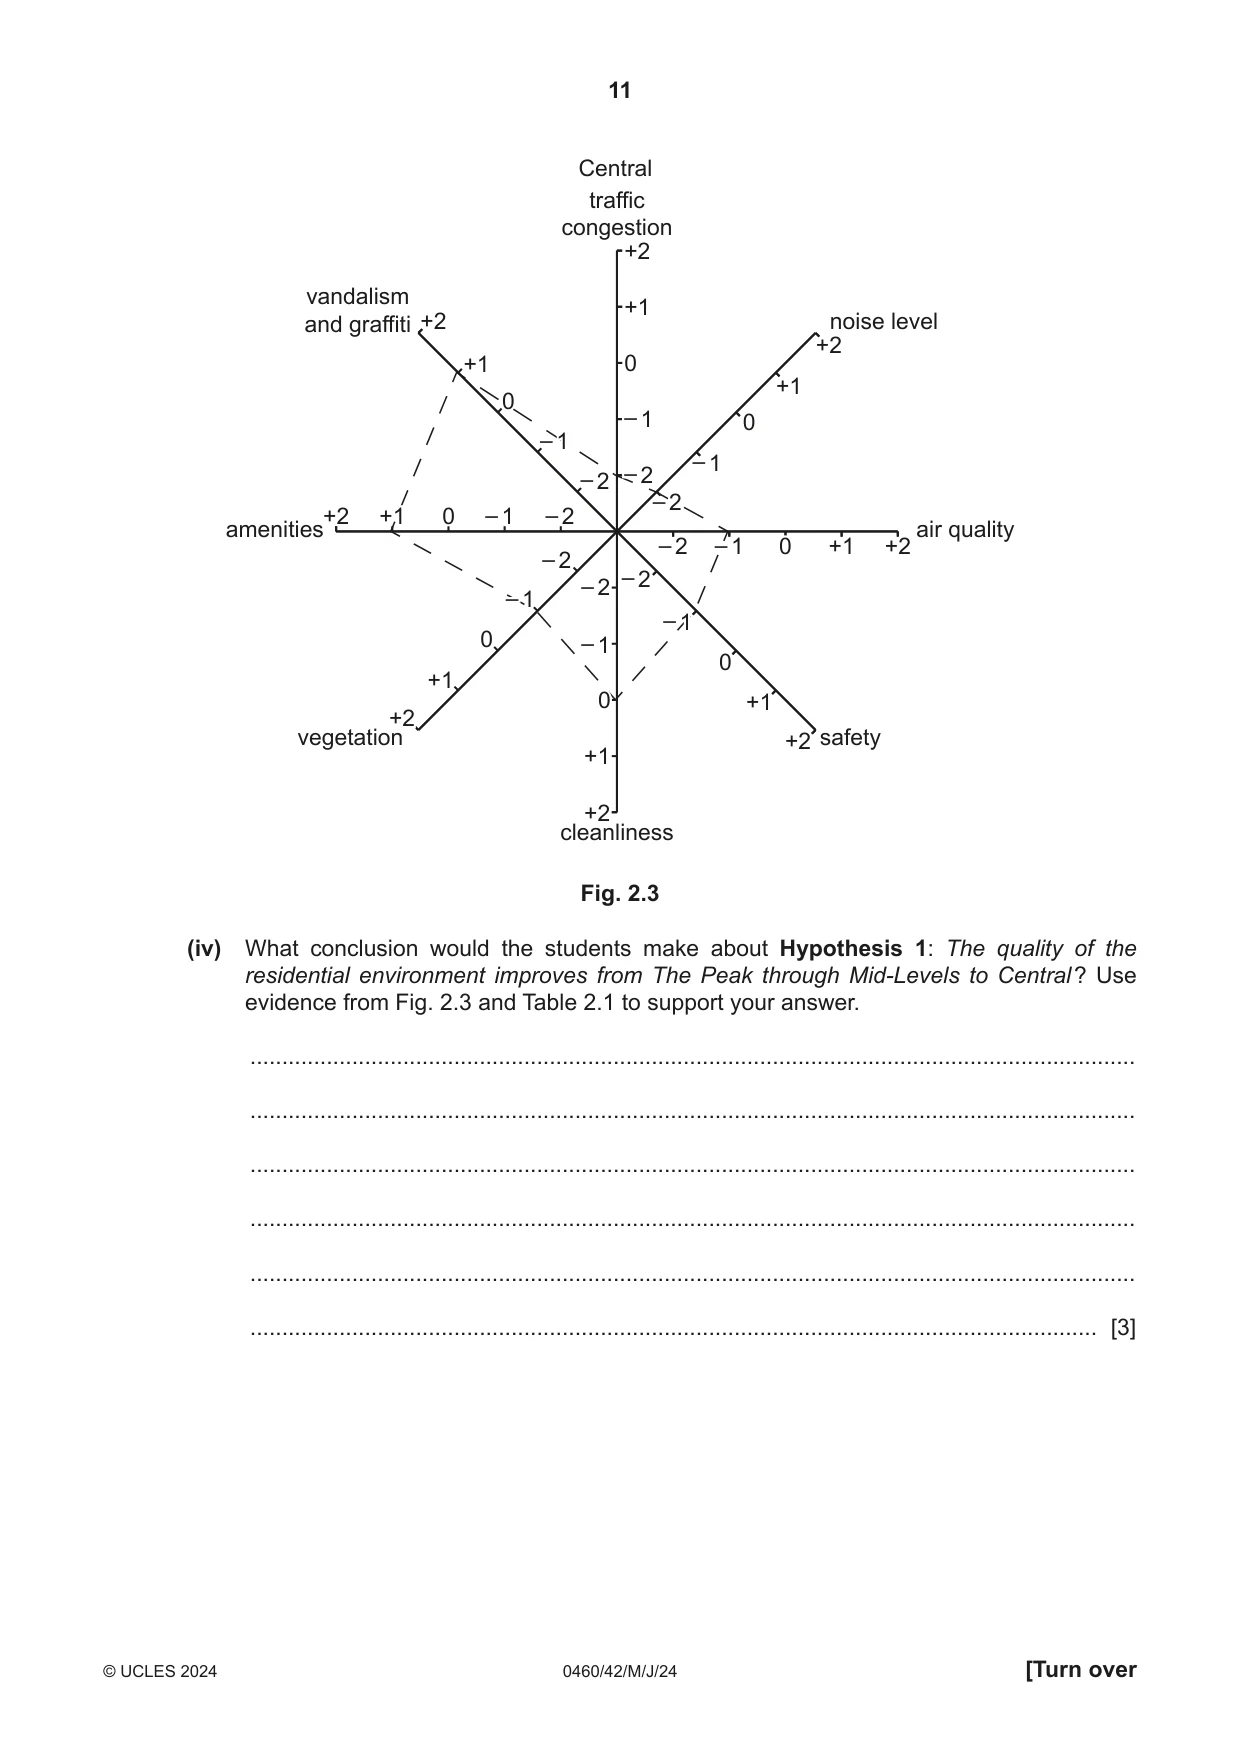
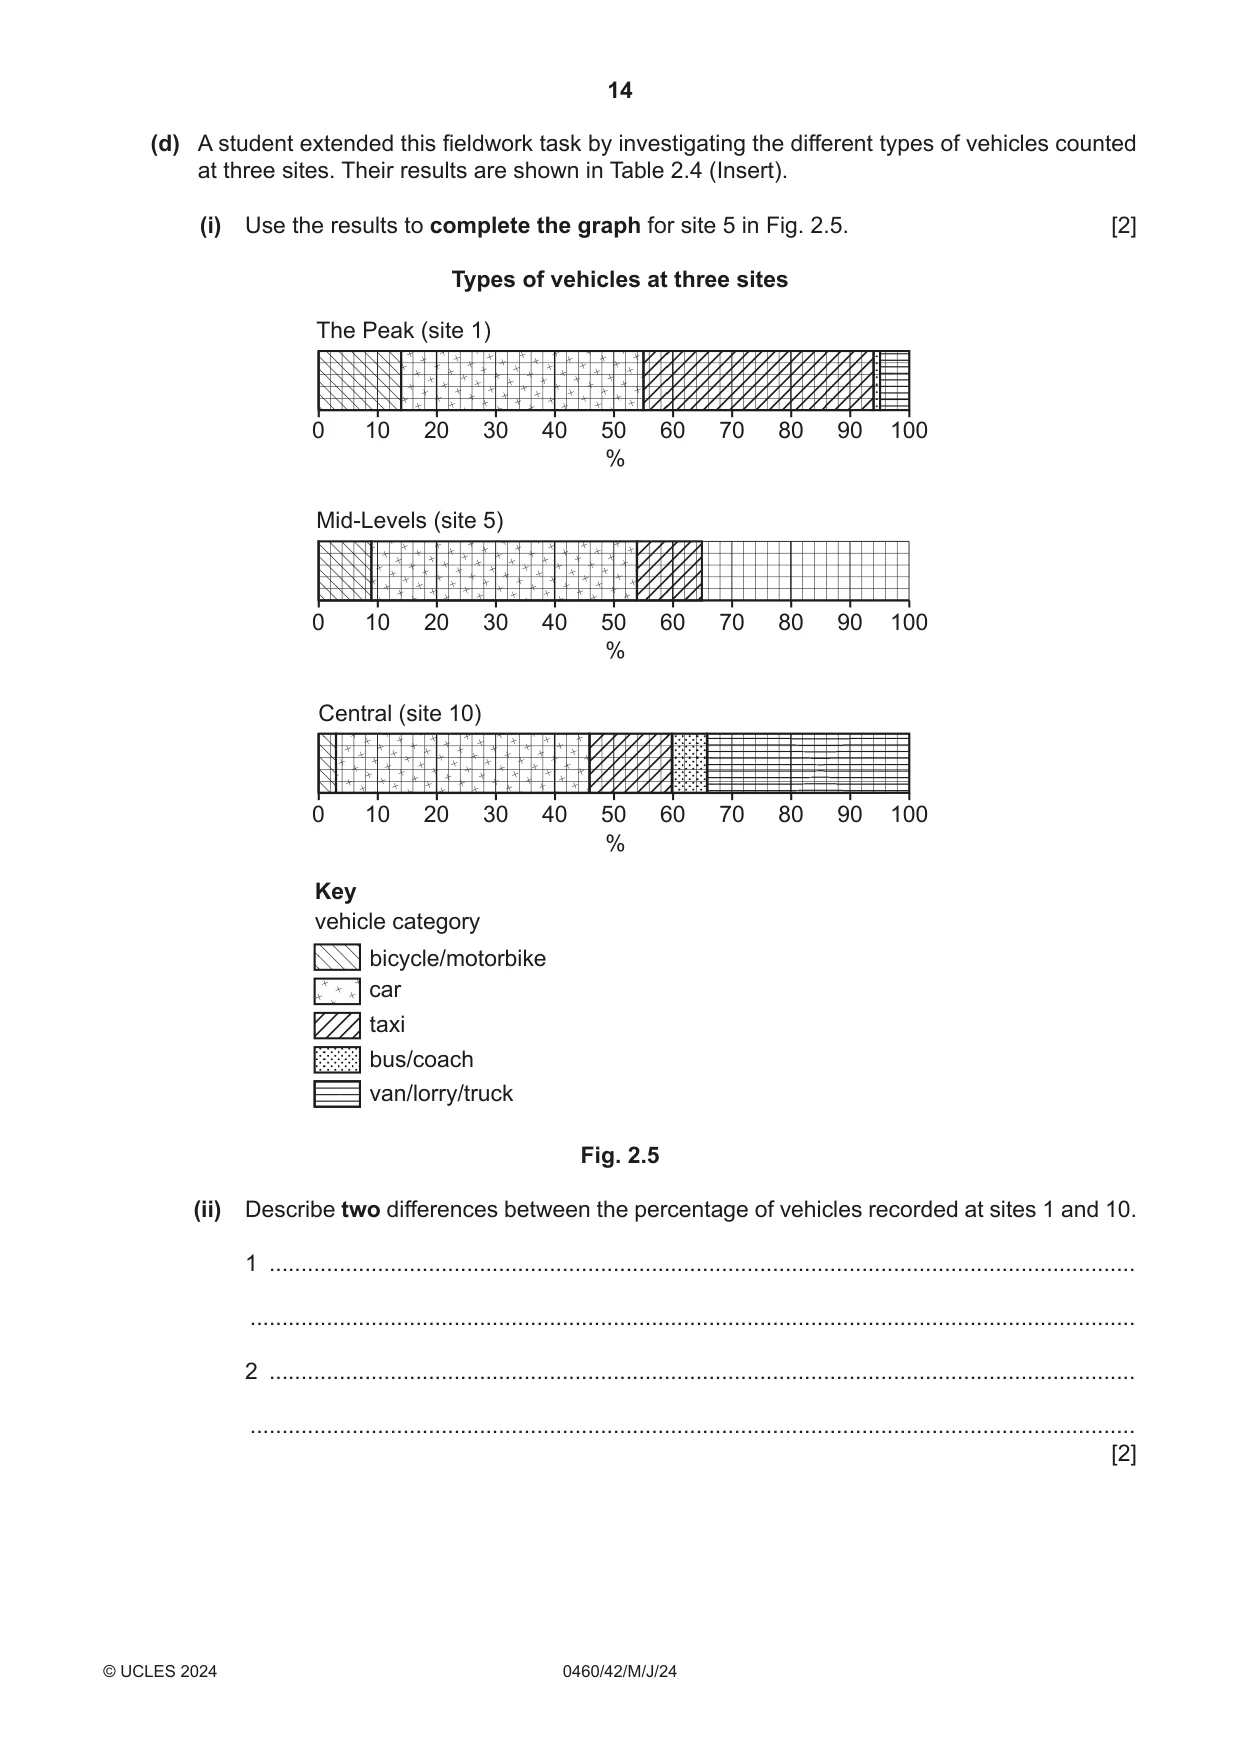
2 Students in the city of Hong Kong did fieldwork to compare different residential areas. Hong Kong is divided into three residential areas by height above sea level. ‘The Peak’ is the highest area in Hong Kong. Lower down is the area of ‘Mid-Levels’. On the lowest land surrounding the CBD is ‘Central’. The areas are shown in Fig. 2.1 (Insert). The students chose sites in each area to do their fieldwork tasks. One group of students investigated the following hypotheses: Hypothesis 1: The quality of the residential environment improves from The Peak through Mid-Levels to Central. Hypothesis 2: The amount of traffic increases towards the CBD of the city. (a) In order to investigate Hypothesis 1, the students did an environmental quality survey in each residential area. Their recording sheet is shown in Fig. 2.2 (Insert). (i) Describe how the students would use the recording sheet to do their fieldwork task. ........................................................................................................................................... ........................................................................................................................................... ........................................................................................................................................... ........................................................................................................................................... ........................................................................................................................................... ..................................................................................................................................... [3] (ii) Suggest two ways that the students could have organised their fieldwork to make sure that their results were reliable. Give a reason for each way you suggest. suggestion 1 ...................................................................................................................... ........................................................................................................................................... reason ............................................................................................................................... ........................................................................................................................................... suggestion 2 ...................................................................................................................... ........................................................................................................................................... reason ............................................................................................................................... ........................................................................................................................................... [4] (iii) The results of the students’ survey are shown in Table 2.1 (Insert). One student plotted their results on the graphs shown in Fig. 2.3. Use the results in Table 2.1 to complete the graph for Mid-Levels. [2] Results of environmental quality survey The Peak traffic congestion +2+2 vandalism +1+1 and graffiti +2+2 noise level +2+2 +1+1 0 +1+1 0 –– 11 0 –– 11 –– 11 –– 22 –– 22 –– 22 +2+2 +1+1 0 –– 11 –– 22 amenities air quality –– 22 –– 11 0 +1+1 +2+2 –– 22 –– 22 –– 22 –– 11 –– 11 0 –– 11 0 +1+1 0 +1+1 +2+2 vegetation +2+2 safety +1+1 +2+2 cleanliness Mid-Levels traffic congestion +2+2 vandalism +1+1 and graffiti +2+2 noise level +2+2 +1+1 0 +1+1 0 –– 11 0 –– 11 –– 11 –– 22 –– 22 –– 22 +2+2 +1+1 0 –– 11 –– 22 amenities air quality –– 22 –– 11 0 +1+1 +2+2 –– 22 –– 22 –– 22 –– 11 –– 11 0 –– 11 0 +1+1 0 +1+1 +2+2 vegetation +2+2 safety +1+1 +2+2 cleanliness
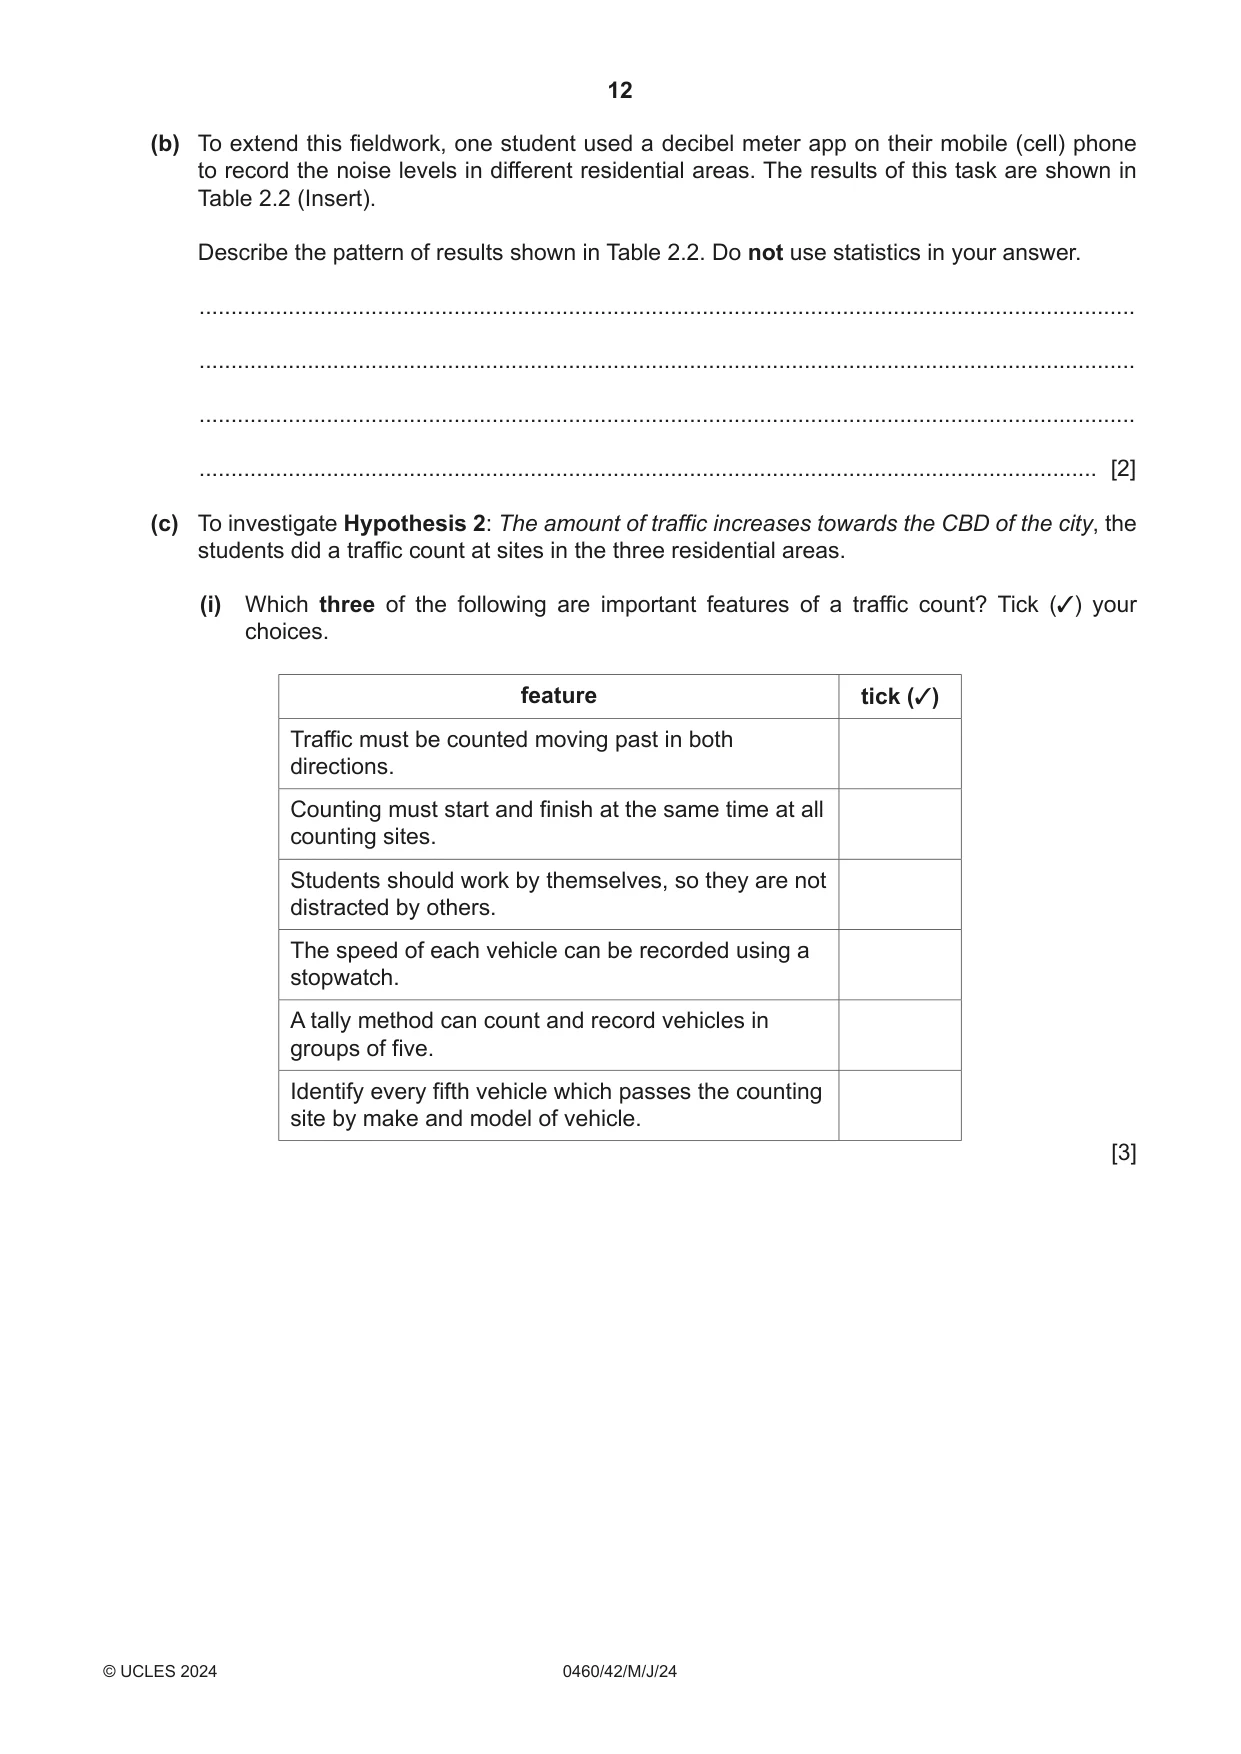
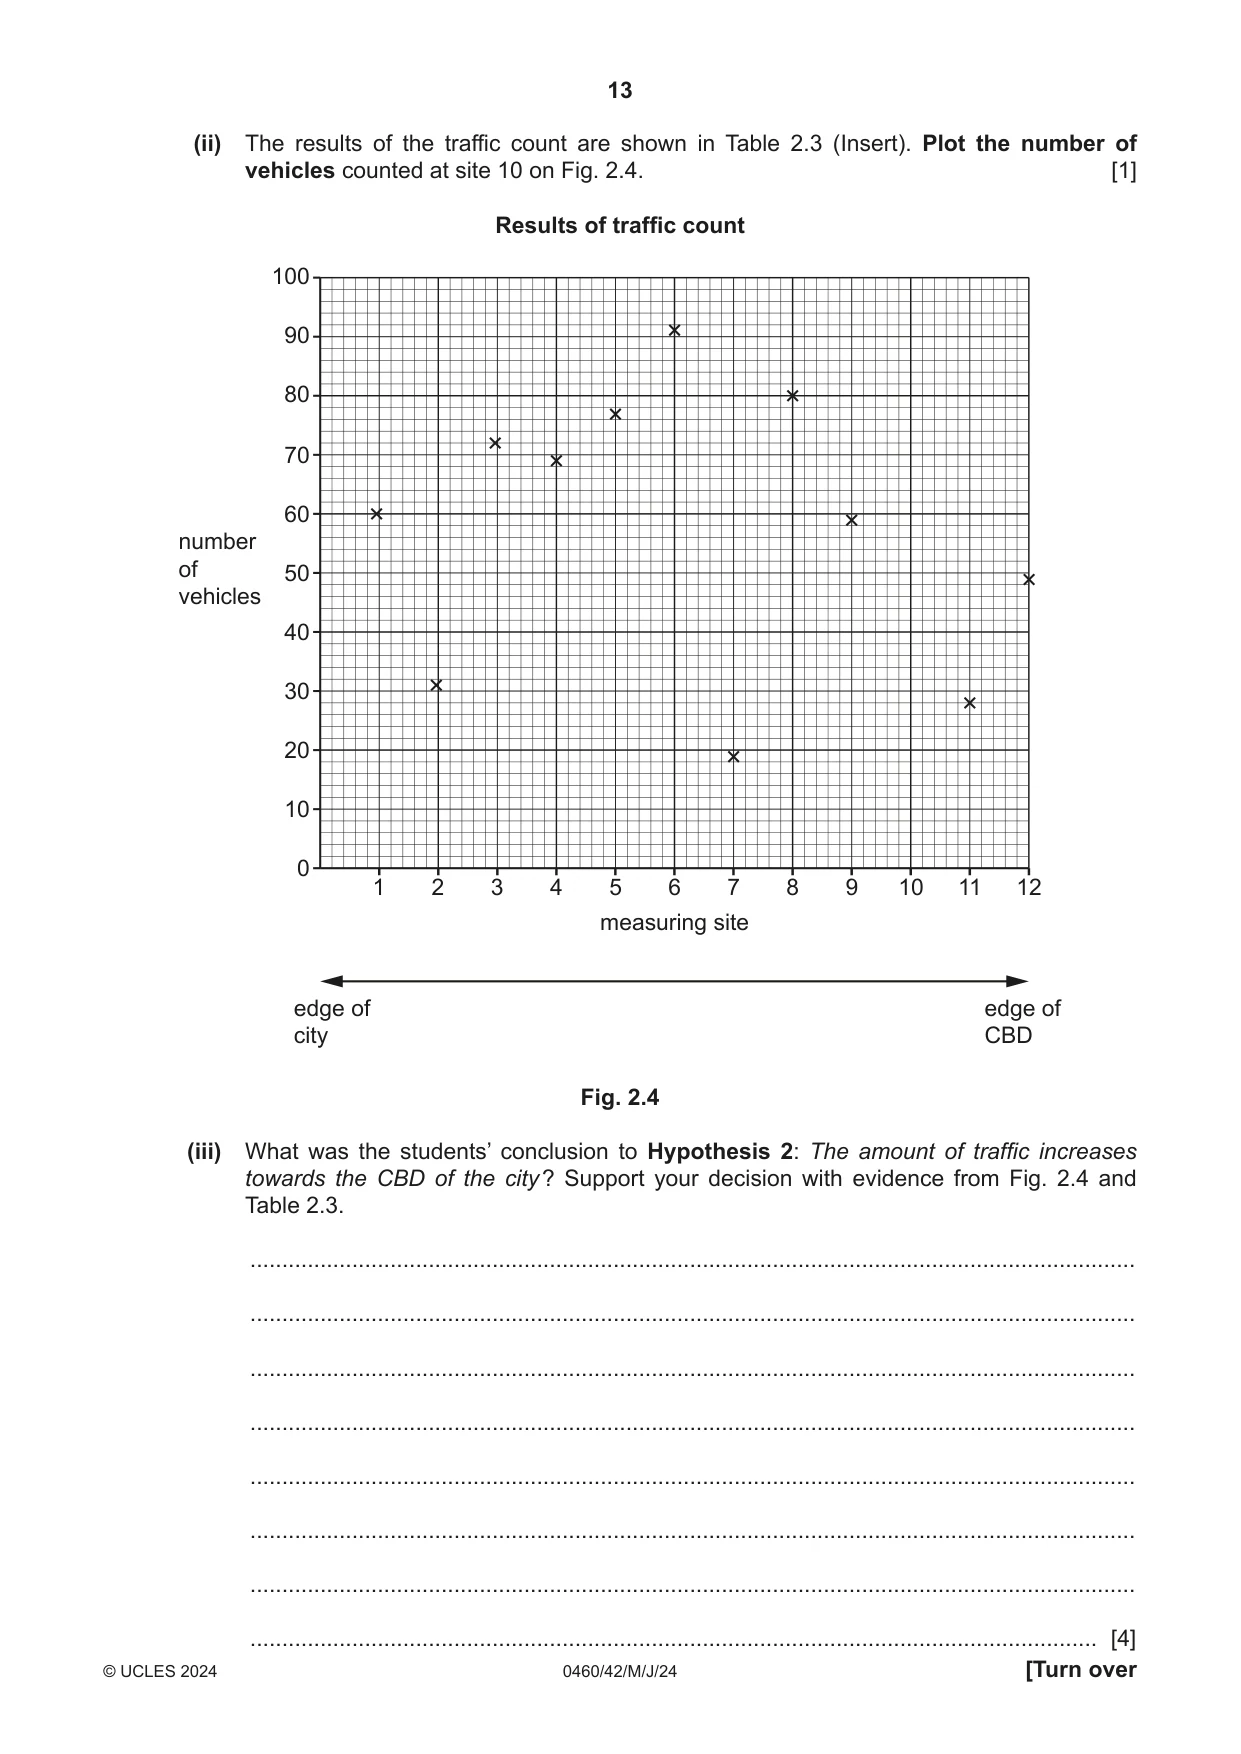
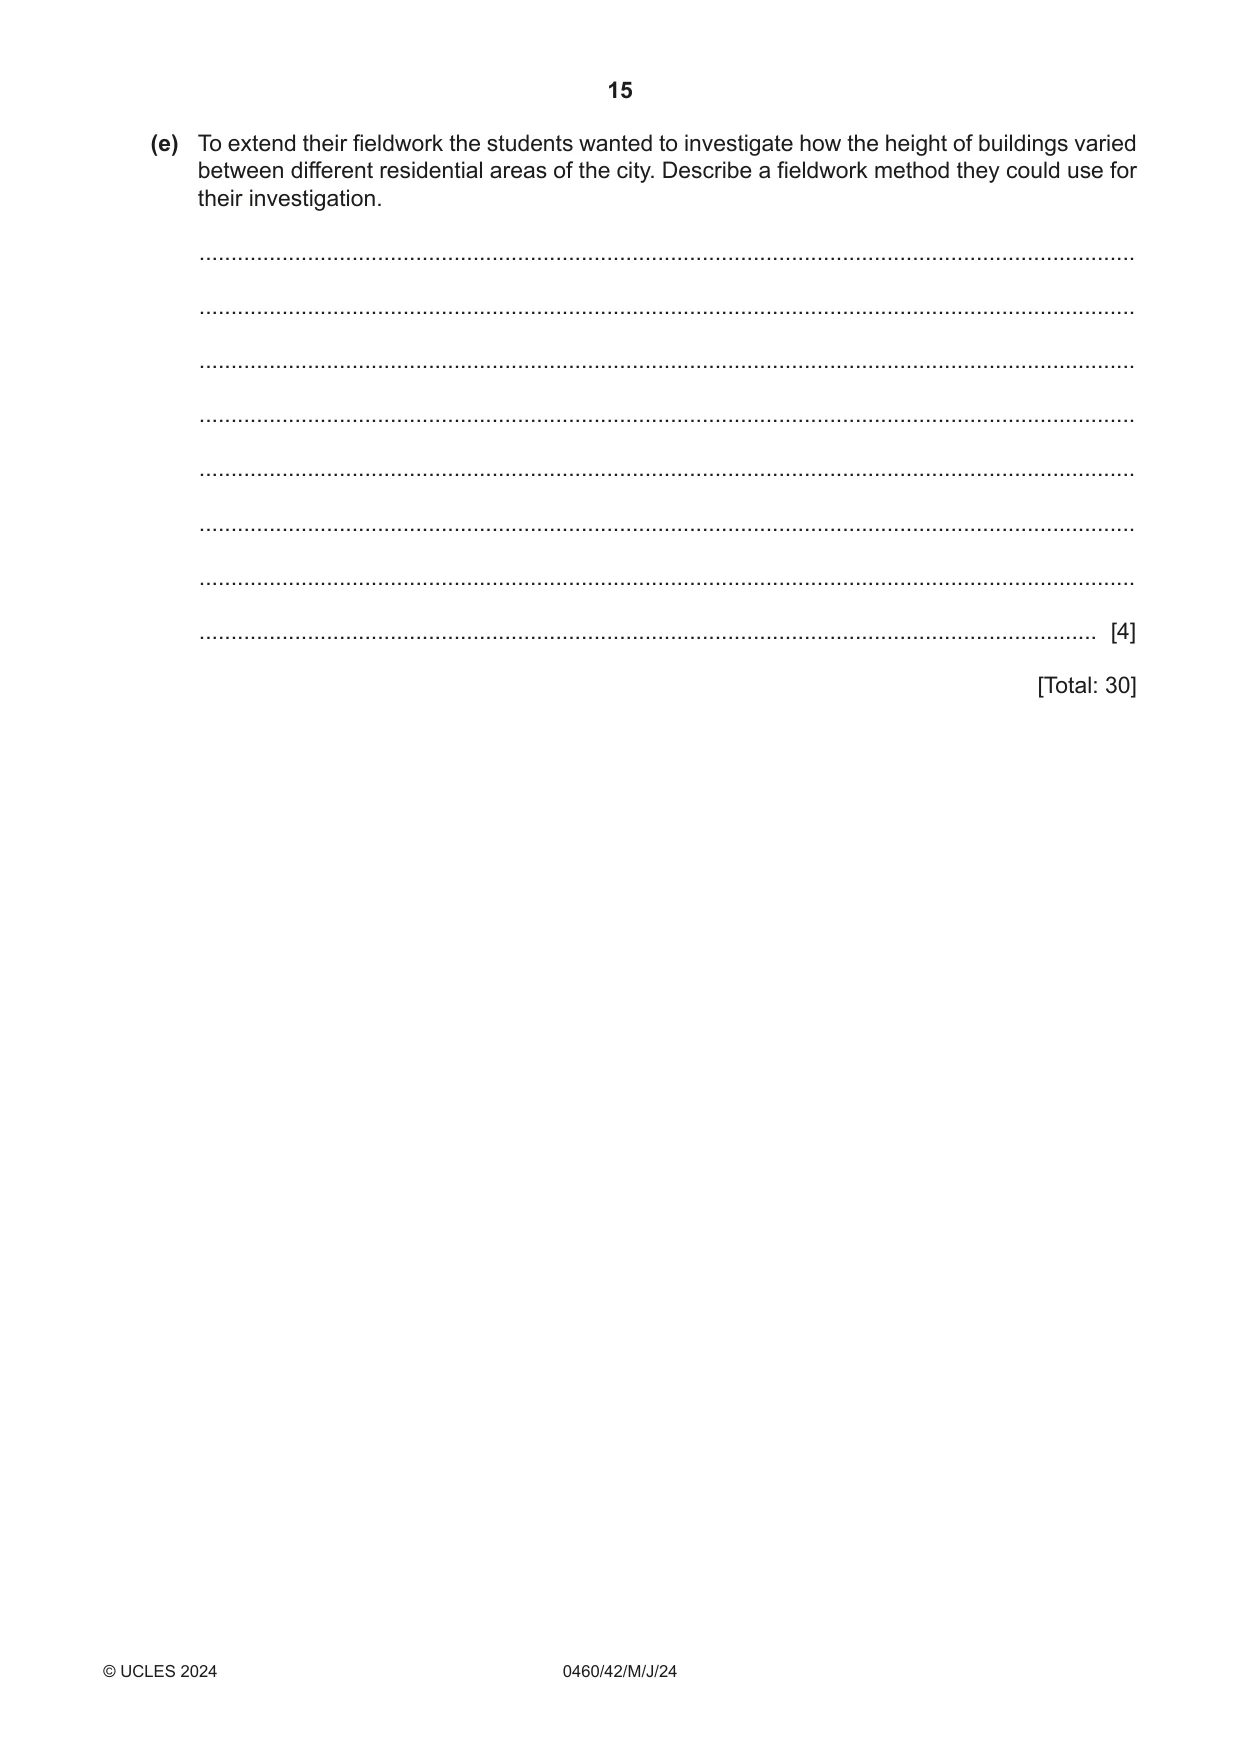
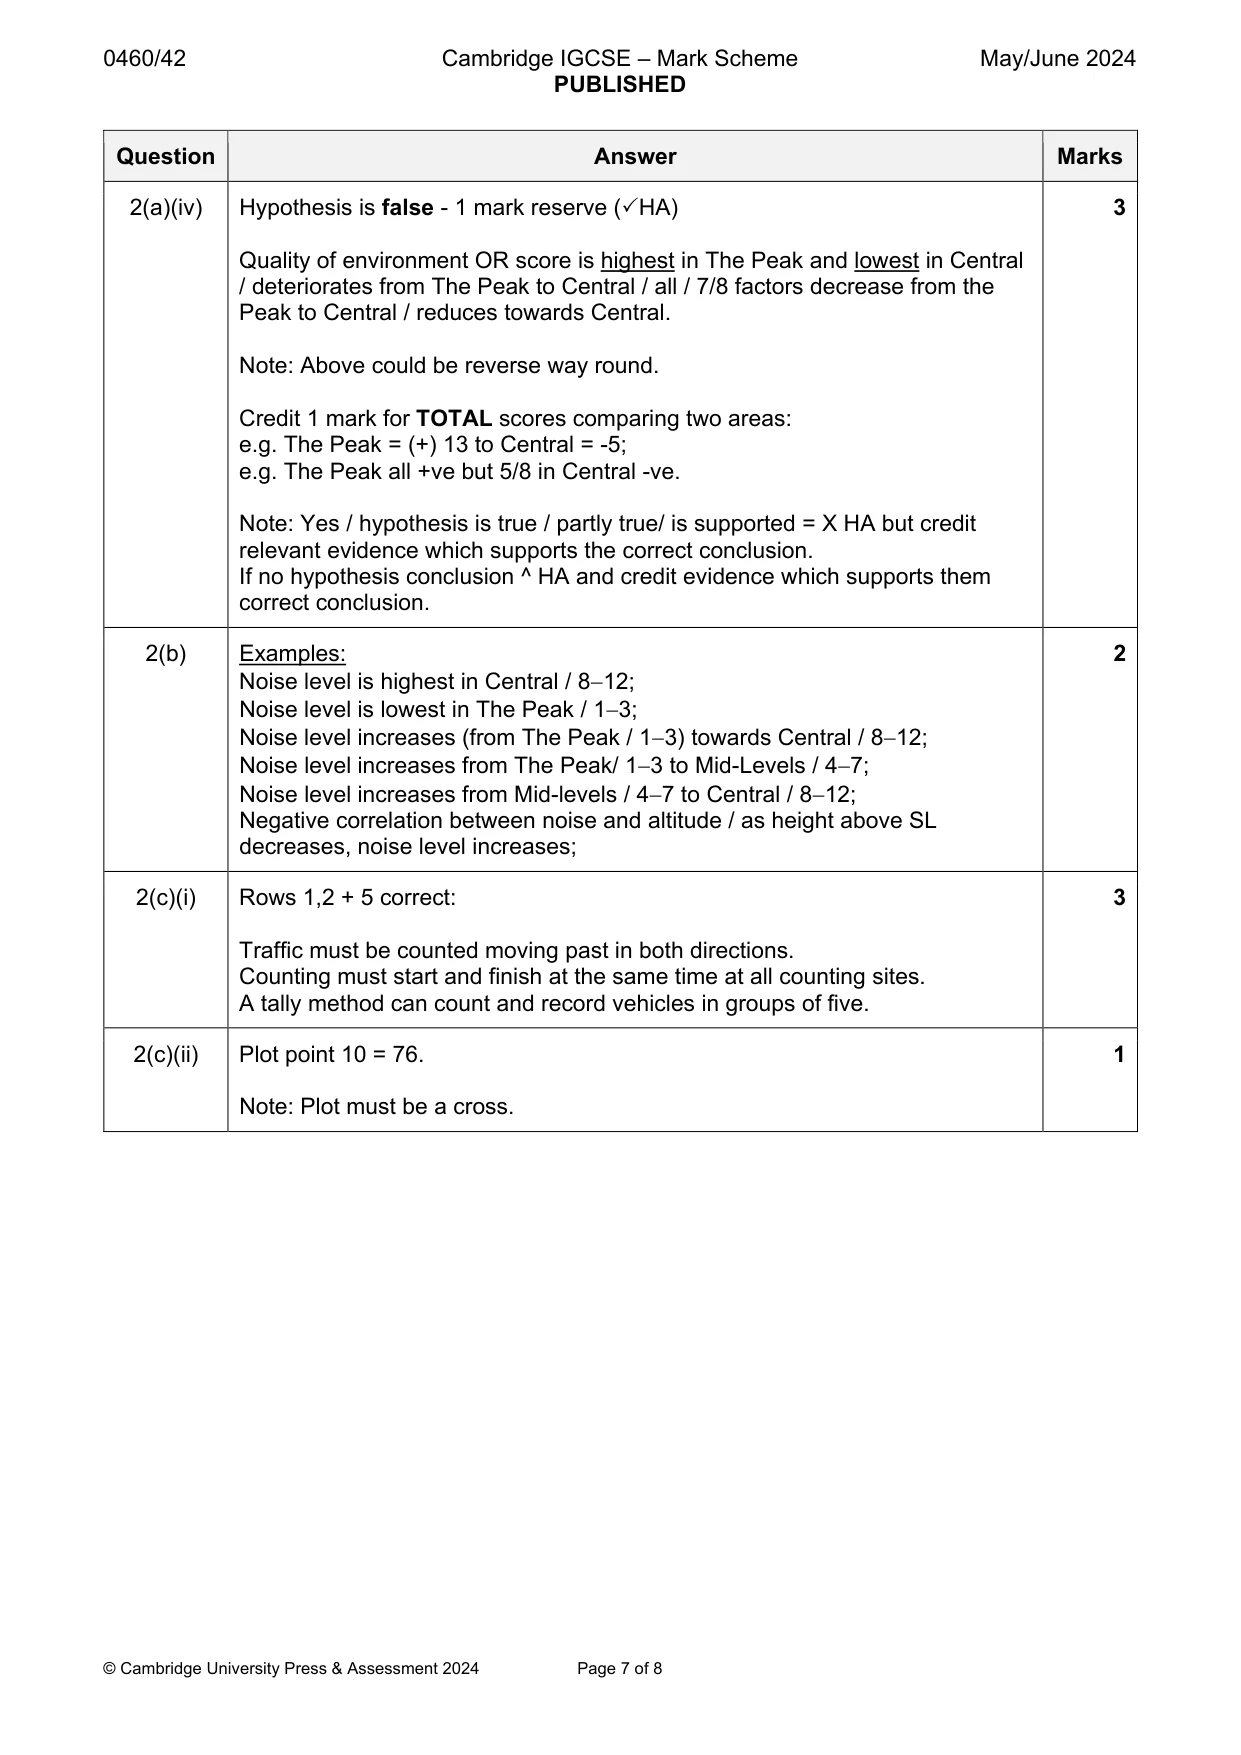
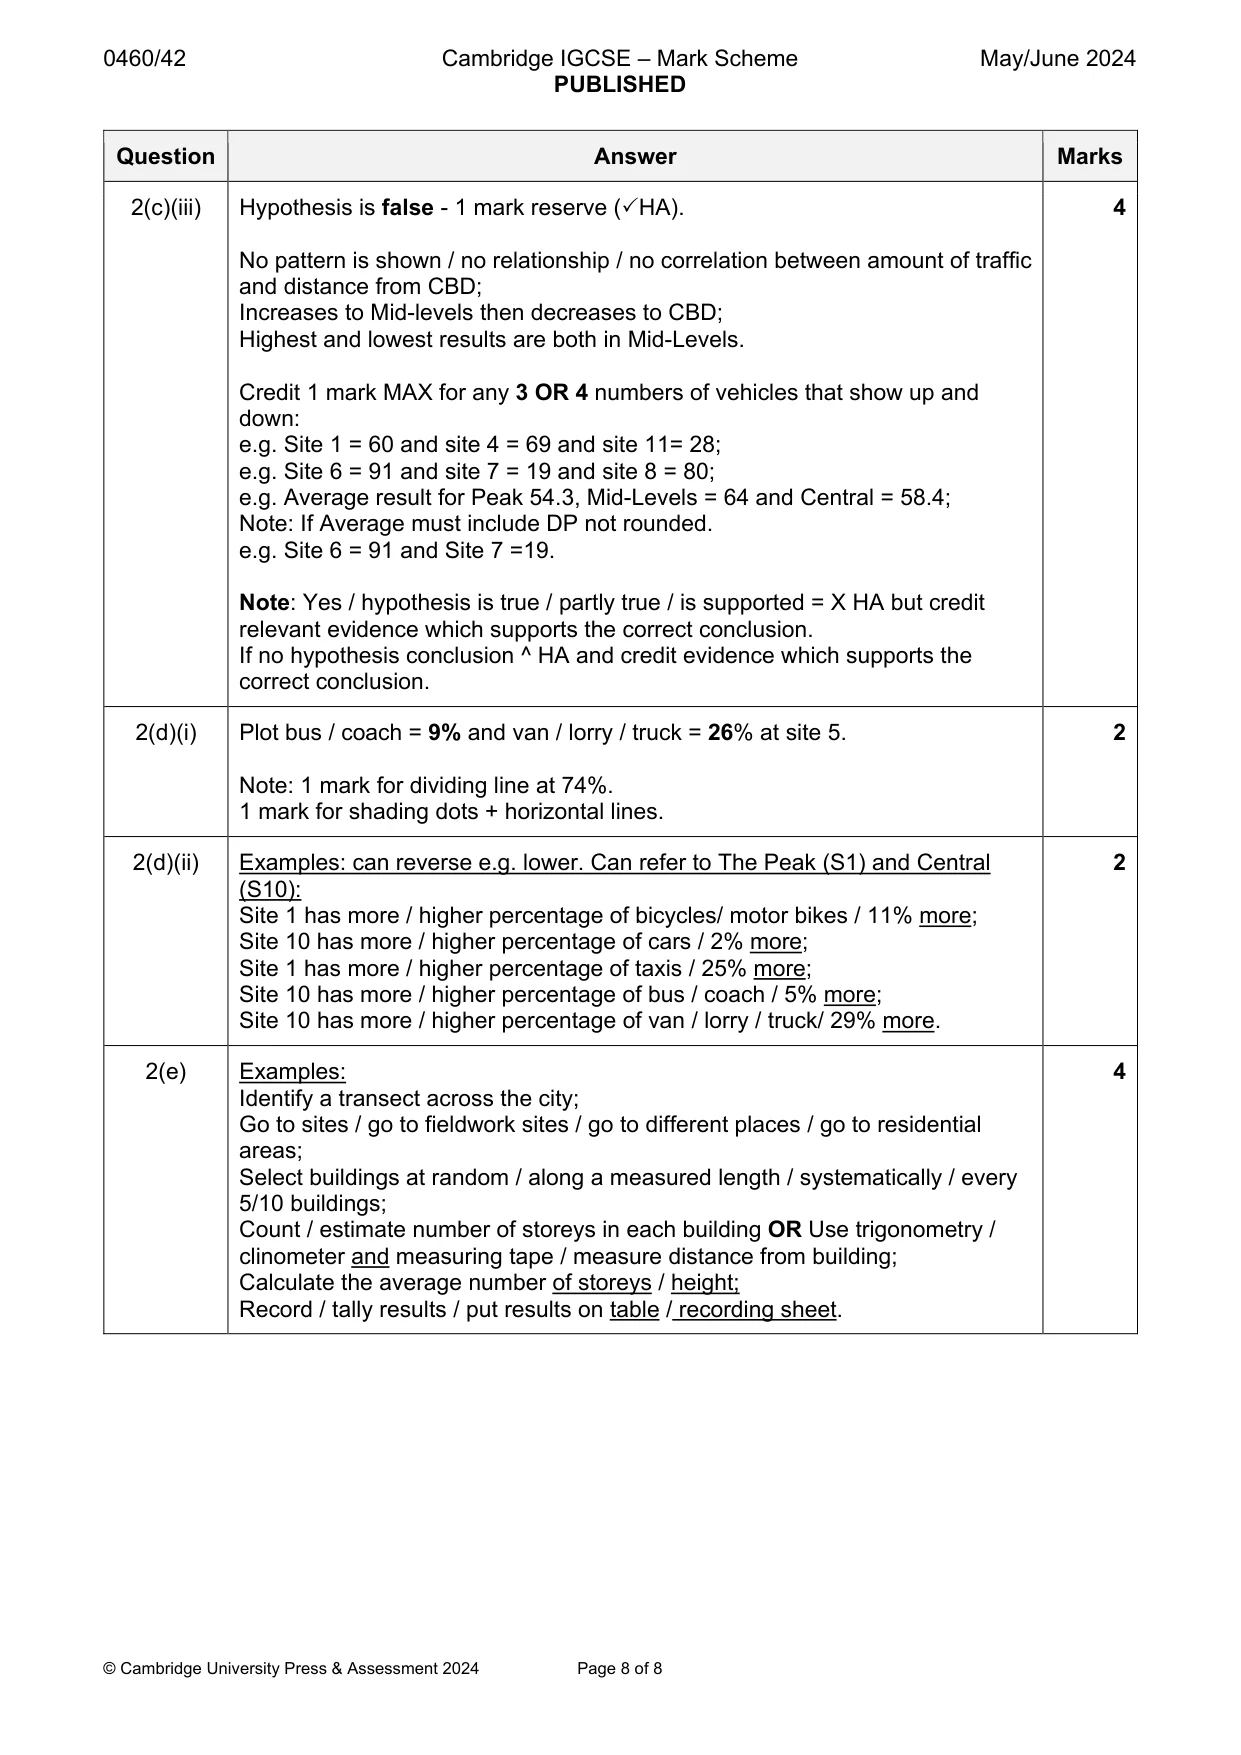
Mark scheme: 2(a)(i) Examples: 3 Circle the location; Decide / agree what each score/ scale means; They / students look at / observe each feature; They / students decide the score for each feature / rate each feature; Put a tick / record / fill in the appropriate row / box. 2(a)(ii) Examples: 4 Suggestion: Work in groups/ pairs / use more students / do it twice; Same student makes all judgements. Reason: So other students check scores; Makes results less subjective / biased / more consistent / can take an average / can compare. Suggestion: Go to different parts of each area / go to more sites. Reason: So they survey as many roads as possible in each area; Gives a larger sample / more representative. Suggestion: Do surveys on same day / same time / same conditions; Do surveys at different times/conditions. Reason: So comparisons are consistent; To get a wider range of results. Note: 2 marks for 2 suggestions and 2 marks for reasons 2(a)(iii) Complete radial graph for Mid-Levels: 2 Vegetation = +1, Amenities = +1, Vandalism and graffiti = +2. 1 mark for 3 correct positions on radial graph. 1 mark for 4 correct lines (solid or dash). 2(a)(iv) Hypothesis is false - 1 mark reserve (HA) 3 Quality of environment OR score is highest in The Peak and lowest in Central / deteriorates from The Peak to Central / all / 7/8 factors decrease from the Peak to Central / reduces towards Central. Note: Above could be reverse way round. Credit 1 mark for TOTAL scores comparing two areas: e.g. The Peak = (+) 13 to Central = -5; e.g. The Peak all +ve but 5/8 in Central -ve. Note: Yes / hypothesis is true / partly true/ is supported = X HA but credit relevant evidence which supports the correct conclusion. If no hypothesis conclusion ^ HA and credit evidence which supports them correct conclusion. 2(b) Examples: 2 Noise level is highest in Central / 812; Noise level is lowest in The Peak / 13; Noise level increases (from The Peak / 13) towards Central / 812; Noise level increases from The Peak/ 13 to Mid-Levels / 47; Noise level increases from Mid-levels / 47 to Central / 812; Negative correlation between noise and altitude / as height above SL decreases, noise level increases; 2(c)(i) Rows 1,2 + 5 correct: 3 Traffic must be counted moving past in both directions. Counting must start and finish at the same time at all counting sites. A tally method can count and record vehicles in groups of five. 2(c)(ii) Plot point 10 = 76. 1 Note: Plot must be a cross. 2(c)(iii) Hypothesis is false - 1 mark reserve (HA). 4 No pattern is shown / no relationship / no correlation between amount of traffic and distance from CBD; Increases to Mid-levels then decreases to CBD; Highest and lowest results are both in Mid-Levels. Credit 1 mark MAX for any 3 OR 4 numbers of vehicles that show up and down: e.g. Site 1 = 60 and site 4 = 69 and site 11= 28; e.g. Site 6 = 91 and site 7 = 19 and site 8 = 80; e.g. Average result for Peak 54.3, Mid-Levels = 64 and Central = 58.4; Note: If Average must include DP not rounded. e.g. Site 6 = 91 and Site 7 =19. Note: Yes / hypothesis is true / partly true / is supported = X HA but credit relevant evidence which supports the correct conclusion. If no hypothesis conclusion ^ HA and credit evidence which supports the correct conclusion. 2(d)(i) Plot bus / coach = 9% and van / lorry / truck = 26% at site 5. 2 Note: 1 mark for dividing line at 74%. 1 mark for shading dots + horizontal lines. 2(d)(ii) Examples: can reverse e.g. lower. Can refer to The Peak (S1) and Central 2 (S10): Site 1 has more / higher percentage of bicycles/ motor bikes / 11% more; Site 10 has more / higher percentage of cars / 2% more; Site 1 has more / higher percentage of taxis / 25% more; Site 10 has more / higher percentage of bus / coach / 5% more; Site 10 has more / higher percentage of van / lorry / truck/ 29% more. 2(e) Examples: 4 Identify a transect across the city; Go to sites / go to fieldwork sites / go to different places / go to residential areas; Select buildings at random / along a measured length / systematically / every 5/10 buildings; Count / estimate number of storeys in each building OR Use trigonometry / clinometer and measuring tape / measure distance from building; Calculate the average number of storeys / height; Record / tally results / put results on table / recording sheet.
What was in this paper
The subtopics covered by these 2 questions, and how many questions each got. Open one in a new tab to see every Cambridge question on it.
What you needed in this session
Cambridge’s own grade thresholds for 2024 May/June, Paper 4 · Variant 2. A higher threshold means an easier paper — the bar moves with how the cohort did.