Cambridge IGCSE Geography 0460 — 2022 May/June Paper 4 · Variant 2
0460/42/M/J/22 · 60 marks · ≈68 min
The question paper and its mark scheme, free to read here and free to download. This is Cambridge’s own paper, exactly as it was sat.
Question paper20 pages




Mark scheme8 pages
Answers below. Sit the paper first if you are practising.
Paper as text
Question paper, page 1
[Turn over Cambridge IGCSE™ This document has 20 pages. Any blank pages are indicated. DC (PQ/JG) 304175/4 © UCLES 2022 * 6 6 3 6 3 9 3 5 7 4 * GEOGRAPHY 0460/42 Paper 4 Alternative to Coursework May/June 2022 1 hour 30 minutes You must answer on the question paper. You will need: Insert (enclosed) Ruler Calculator INSTRUCTIONS ● Answer all questions. ● Use a black or dark blue pen. You may use an HB pencil for any diagrams or graphs. ● Write your name, centre number and candidate number in the boxes at the top of the page. ● Write your answer to each question in the space provided. ● Do not use an erasable pen or correction fluid. ● Do not write on any bar codes. ● If additional space is needed, you should use the lined pages at the end of this booklet; the question number or numbers must be clearly shown. INFORMATION ● The total mark for this paper is 60. ● The number of marks for each question or part question is shown in brackets [ ]. ● The insert contains additional resources referred to in the questions.
Question paper, page 2
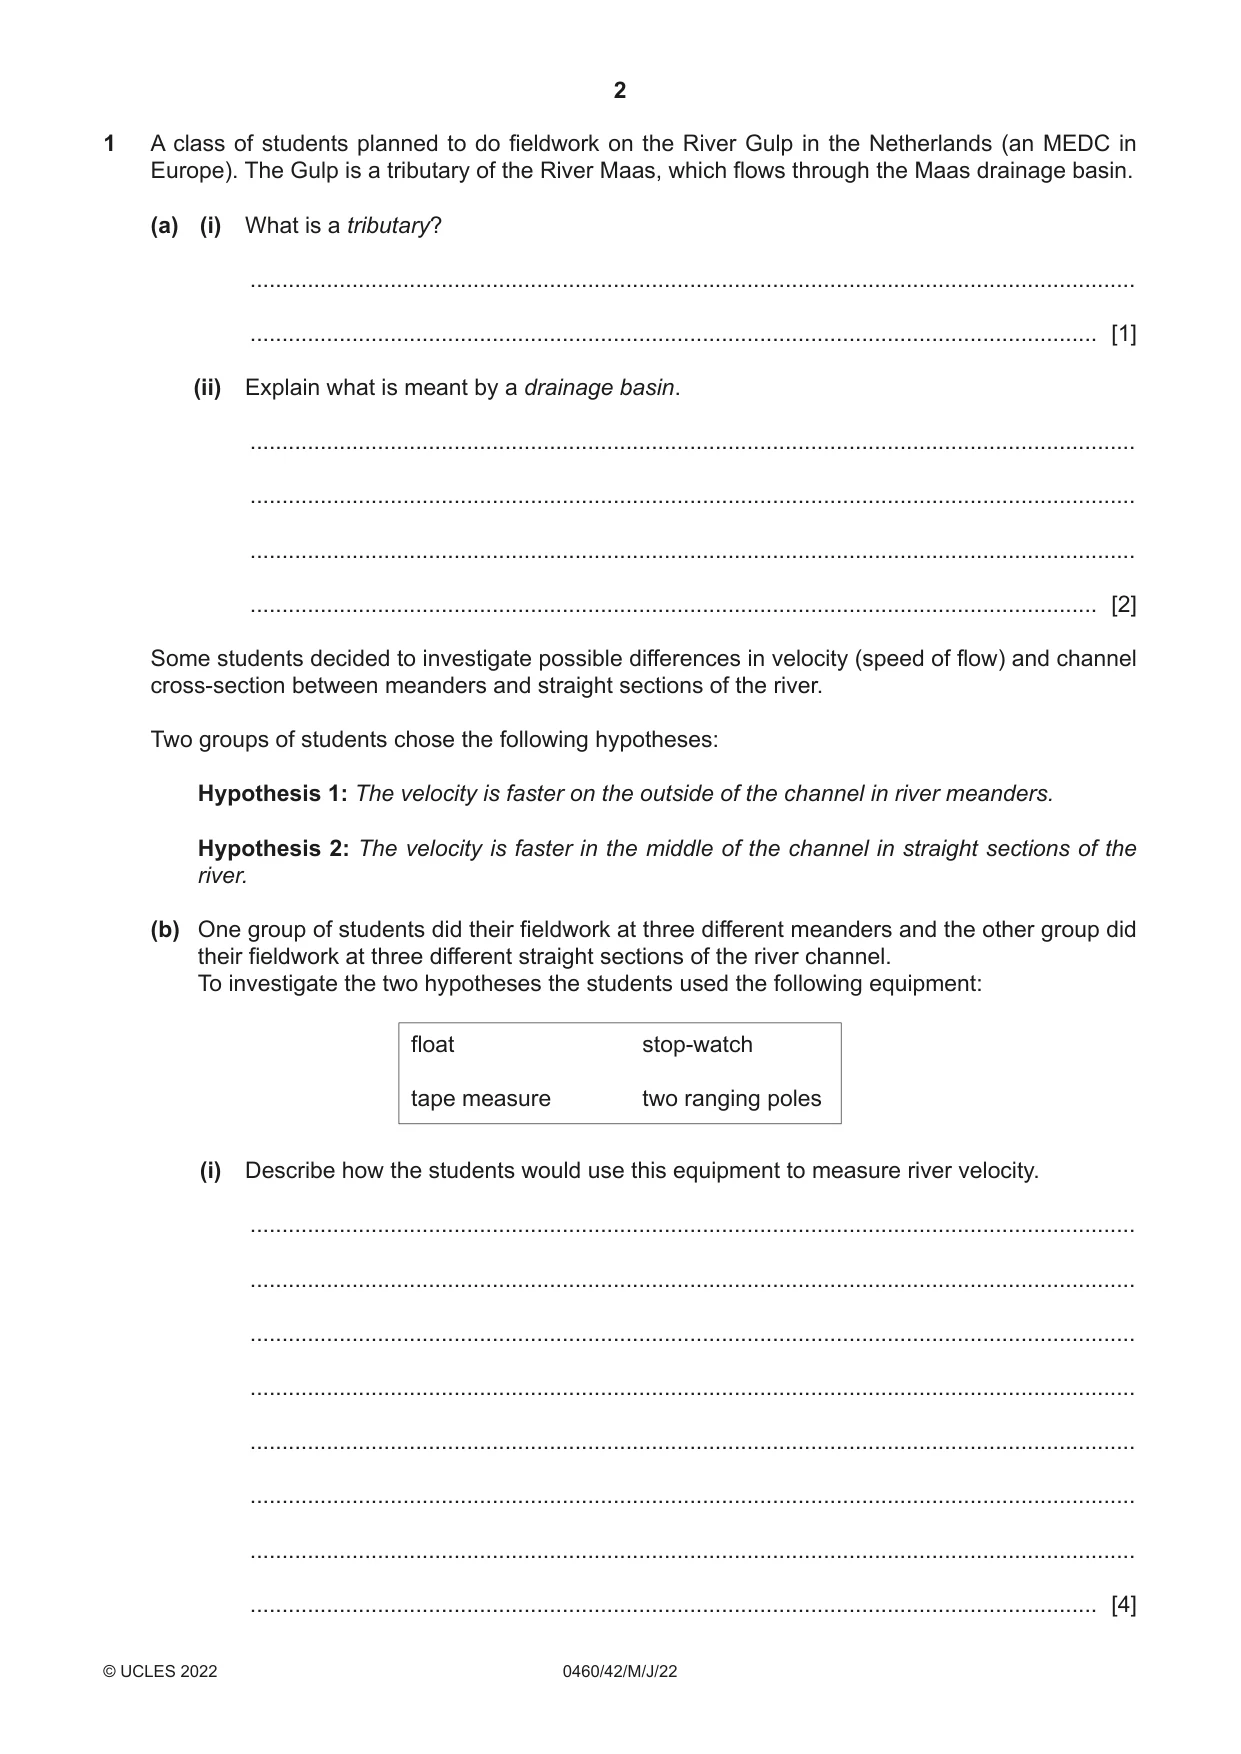
2 0460/42/M/J/22 © UCLES 2022 1 A class of students planned to do fieldwork on the River Gulp in the Netherlands (an MEDC in Europe). The Gulp is a tributary of the River Maas, which flows through the Maas drainage basin. (a) (i) What is a tributary? … … [1] (ii) Explain what is meant by a drainage basin. … … … … [2] Some students decided to investigate possible differences in velocity (speed of flow) and channel cross-section between meanders and straight sections of the river. Two groups of students chose the following hypotheses: Hypothesis 1: The velocity is faster on the outside of the channel in river meanders. Hypothesis 2: The velocity is faster in the middle of the channel in straight sections of the river. (b) One group of students did their fieldwork at three different meanders and the other group did their fieldwork at three different straight sections of the river channel. To investigate the two hypotheses the students used the following equipment: float stop-watch tape measure two ranging poles (i) Describe how the students would use this equipment to measure river velocity. … … … … … … … … [4]
Question paper, page 3
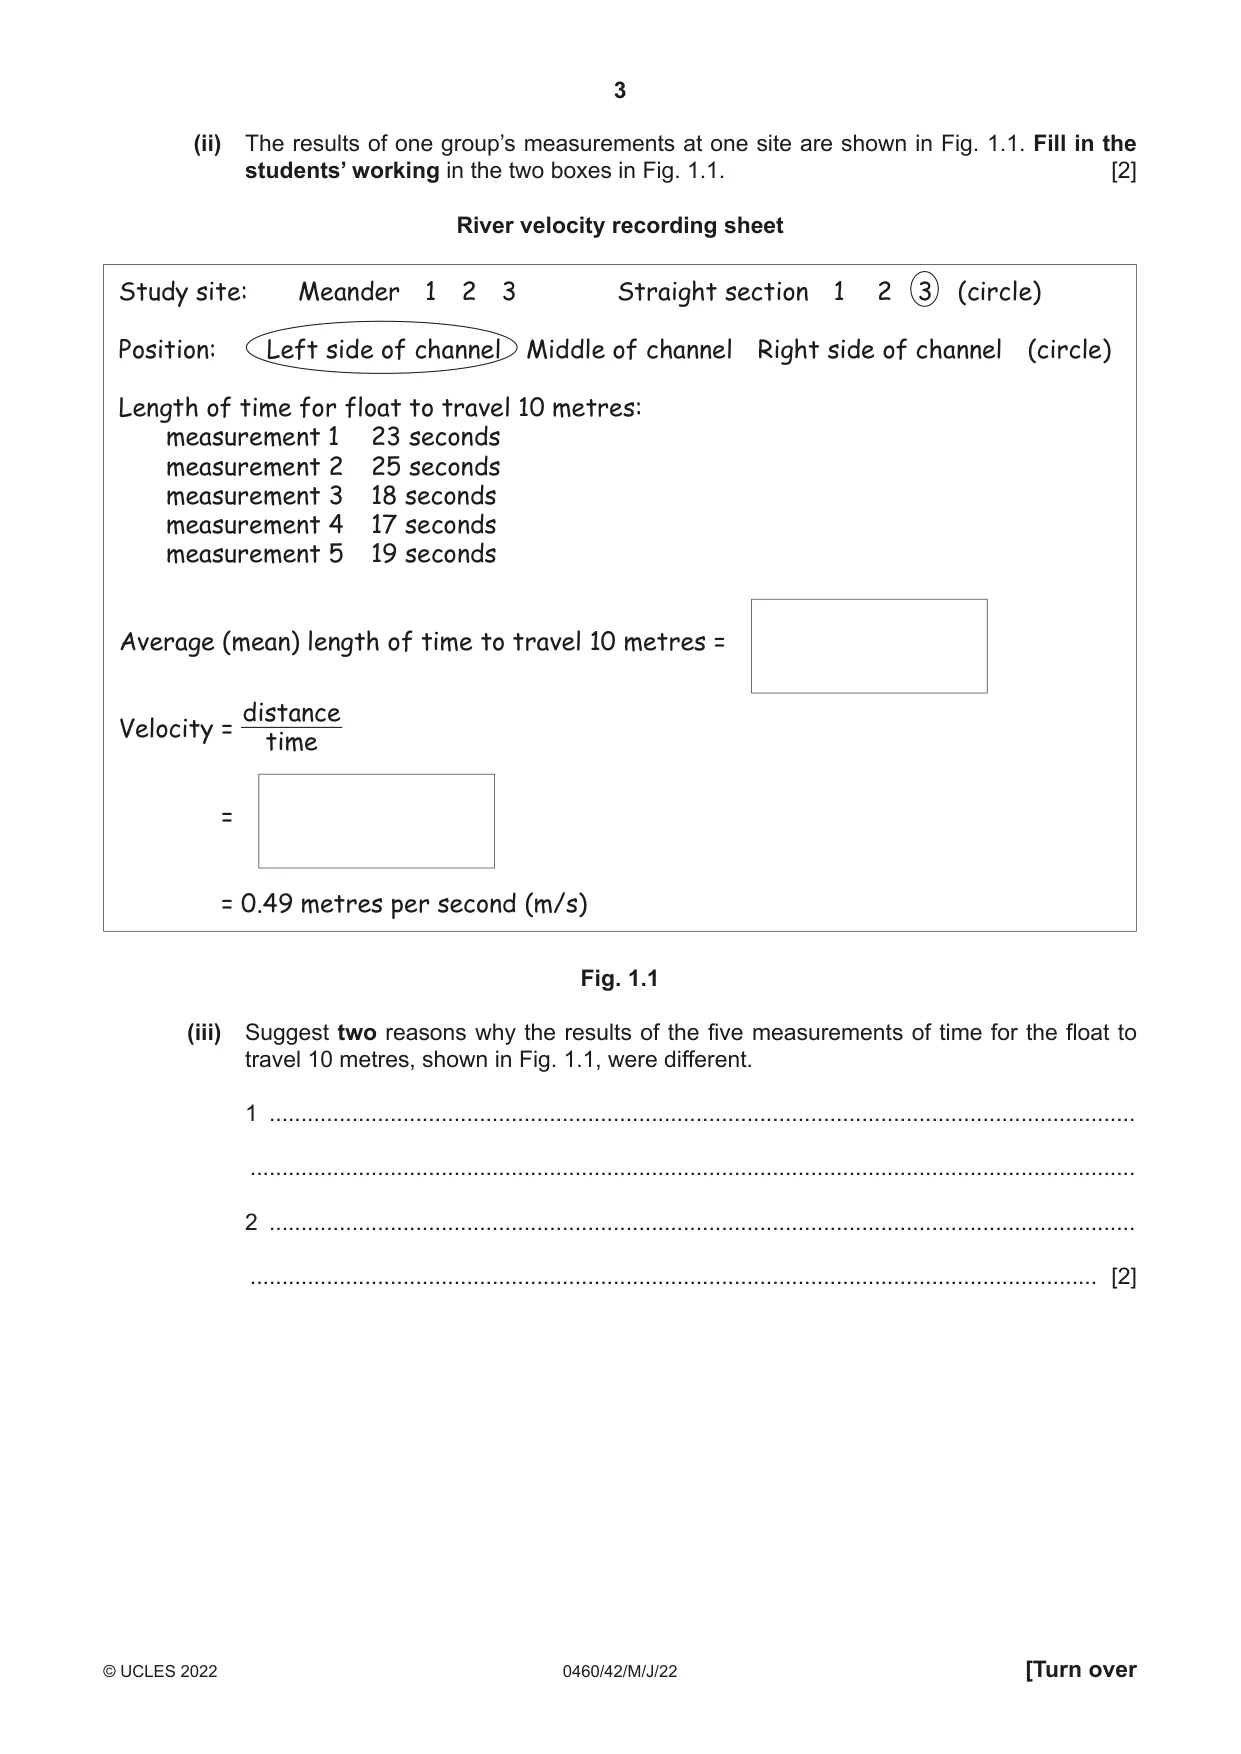
3 0460/42/M/J/22 © UCLES 2022 [Turn over (ii) The results of one group’s measurements at one site are shown in Fig. 1.1. Fill in the students’ working in the two boxes in Fig. 1.1. [2] River velocity recording sheet Study site: Meander 1 2 3 Straight section 1 2 3 (circle) Position: Left side of channel Middle of channel Right side of channel (circle) Length of time for float to travel 10 metres: measurement 1 23 seconds measurement 2 25 seconds measurement 3 18 seconds measurement 4 17 seconds measurement 5 19 seconds Average (mean) length of time to travel 10 metres = Velocity = distance time = = 0.49 metres per second (m/s) Fig. 1.1 (iii) Suggest two reasons why the results of the five measurements of time for the float to travel 10 metres, shown in Fig. 1.1, were different. 1 … … 2 … … [2]
Question paper, page 4
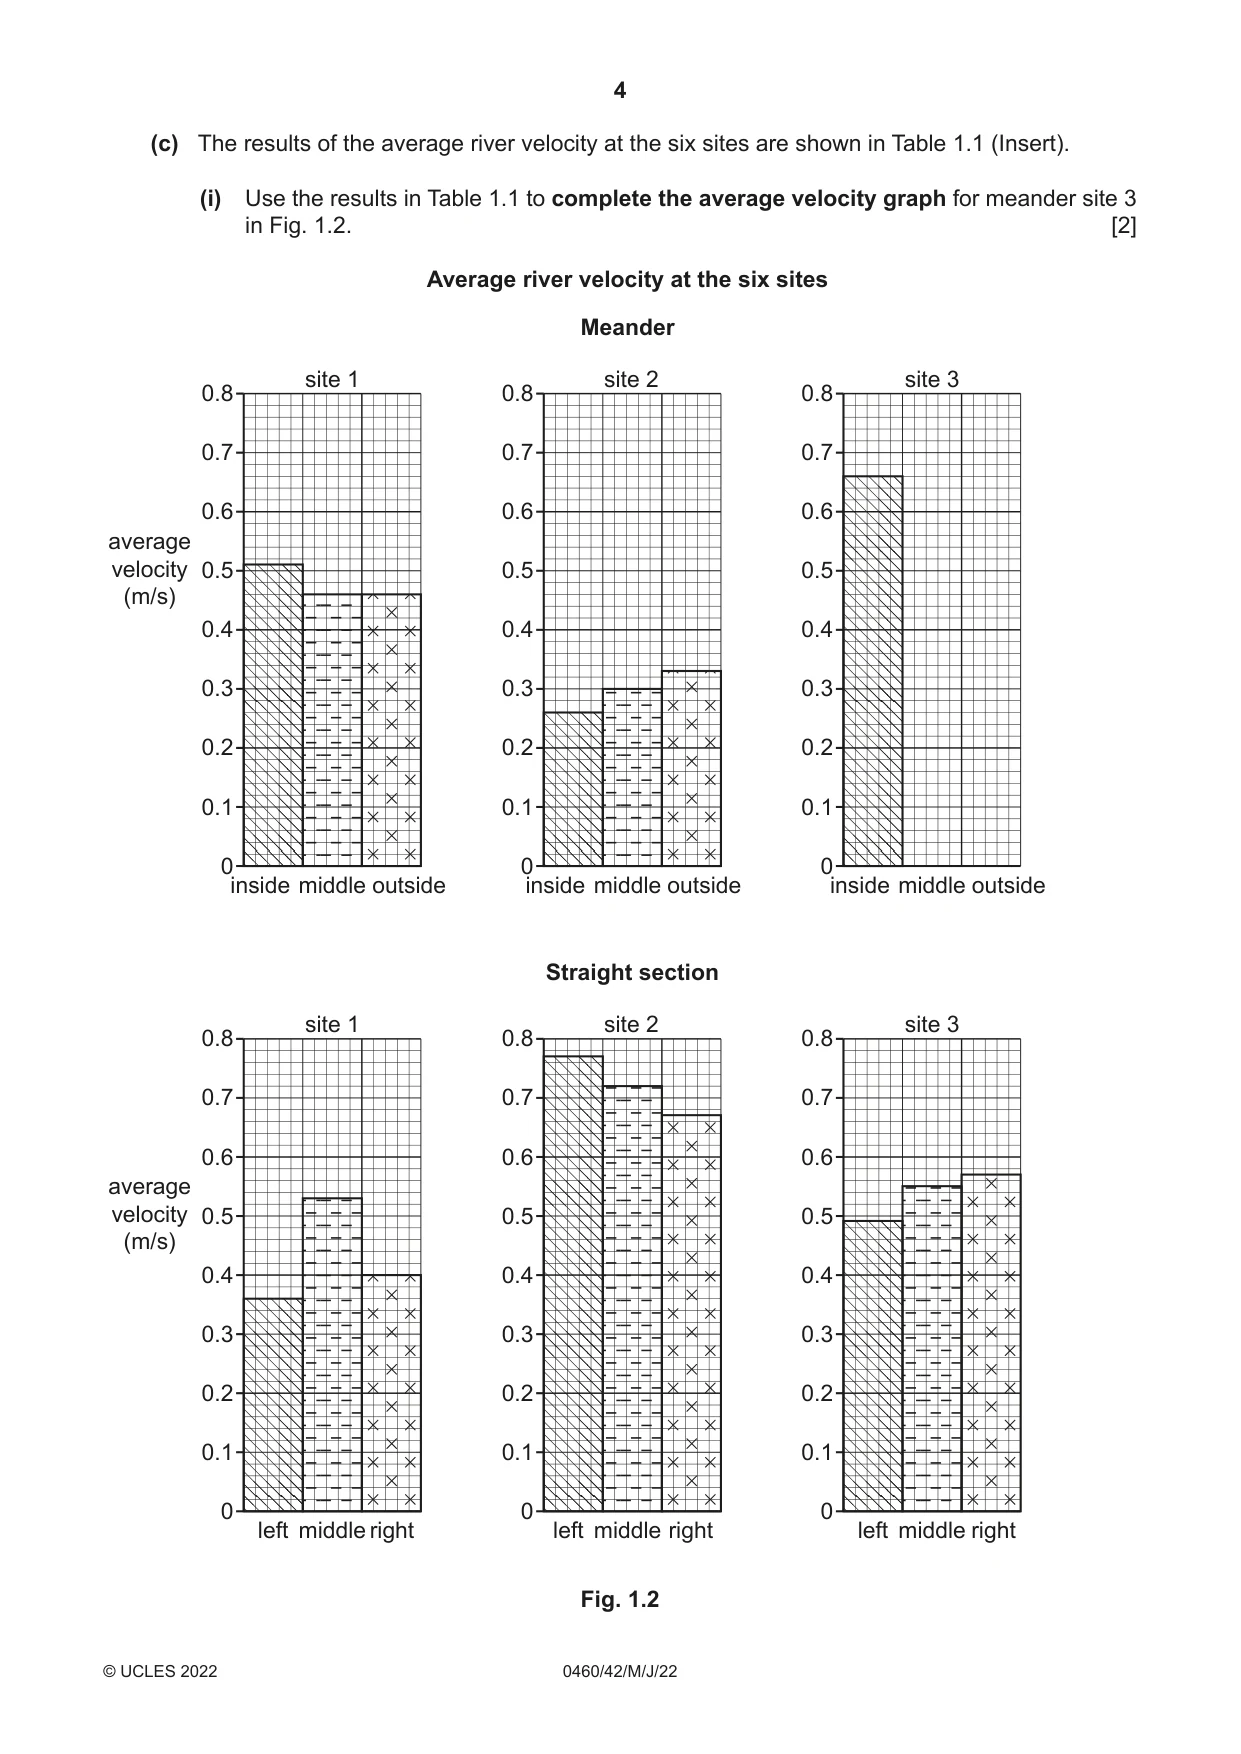
4 0460/42/M/J/22 © UCLES 2022 (c) The results of the average river velocity at the six sites are shown in Table 1.1 (Insert). (i) Use the results in Table 1.1 to complete the average velocity graph for meander site 3 in Fig. 1.2. [2] 0 0.1 0.2 0.3 0.4 0.5 0.6 0.7 0.8 0 0.1 0.2 0.3 0.4 0.5 0.6 0.7 0.8 0 0.1 0.2 0.3 0.4 0.5 0.6 0.7 0.8 average velocity (m/s) inside middle outside inside middle Average river velocity at the six sites outside inside middle outside 0 0.1 0.2 0.3 0.4 0.5 0.6 0.7 0.8 0 0.1 0.2 0.3 0.4 0.5 0.6 0.7 0.8 0 0.1 0.2 0.3 0.4 0.5 0.6 0.7 0.8 average velocity (m/s) left middle right left middle right left middle right Meander Straight section site 1 site 2 site 3 site 1 site 2 site 3 Fig. 1.2
Question paper, page 5
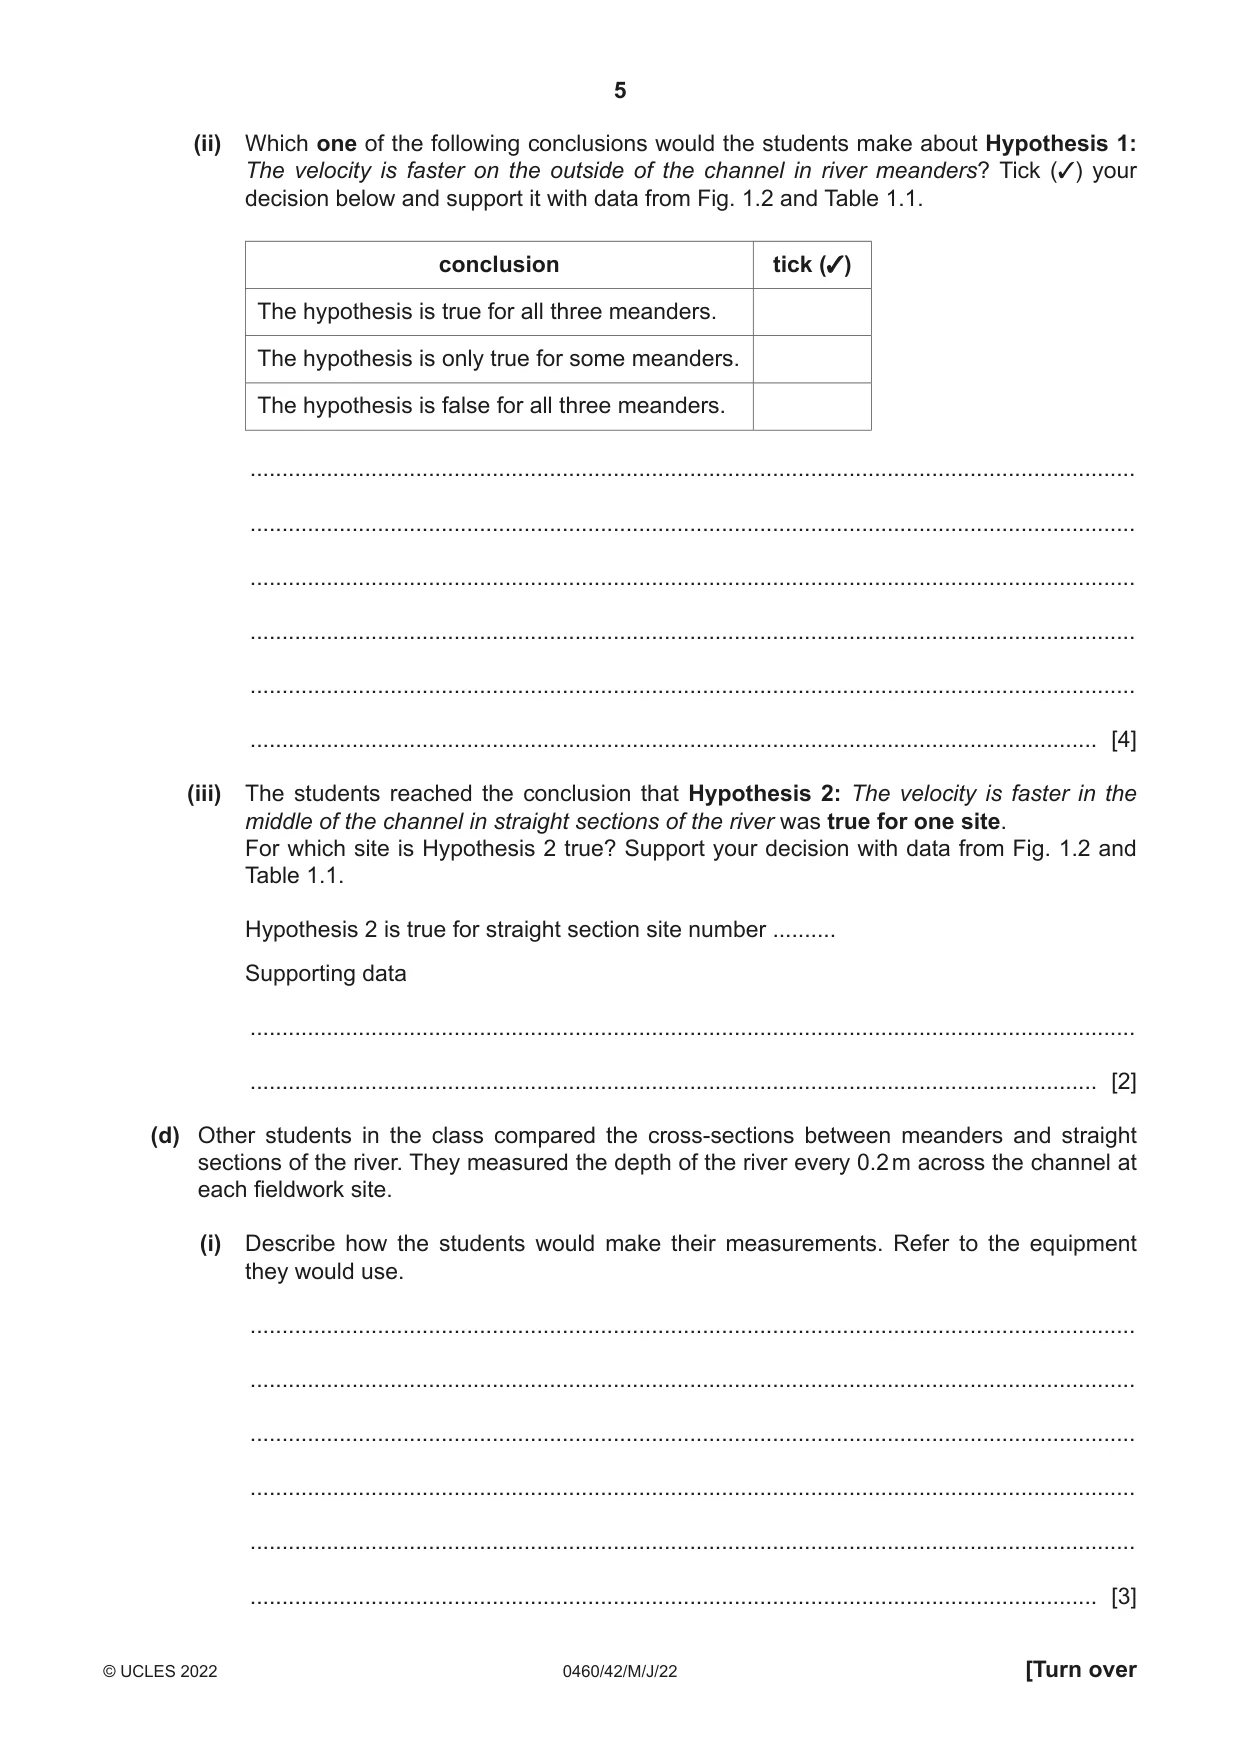
5 0460/42/M/J/22 © UCLES 2022 [Turn over (ii) Which one of the following conclusions would the students make about Hypothesis 1: The velocity is faster on the outside of the channel in river meanders? Tick (3) your decision below and support it with data from Fig. 1.2 and Table 1.1. conclusion tick (3) The hypothesis is true for all three meanders. The hypothesis is only true for some meanders. The hypothesis is false for all three meanders. … … … … … … [4] (iii) The students reached the conclusion that Hypothesis 2: The velocity is faster in the middle of the channel in straight sections of the river was true for one site. For which site is Hypothesis 2 true? Support your decision with data from Fig. 1.2 and Table 1.1. Hypothesis 2 is true for straight section site number … Supporting data … … [2] (d) Other students in the class compared the cross-sections between meanders and straight sections of the river. They measured the depth of the river every 0.2 m across the channel at each fieldwork site. (i) Describe how the students would make their measurements. Refer to the equipment they would use. … … … … … … [3]
Question paper, page 6
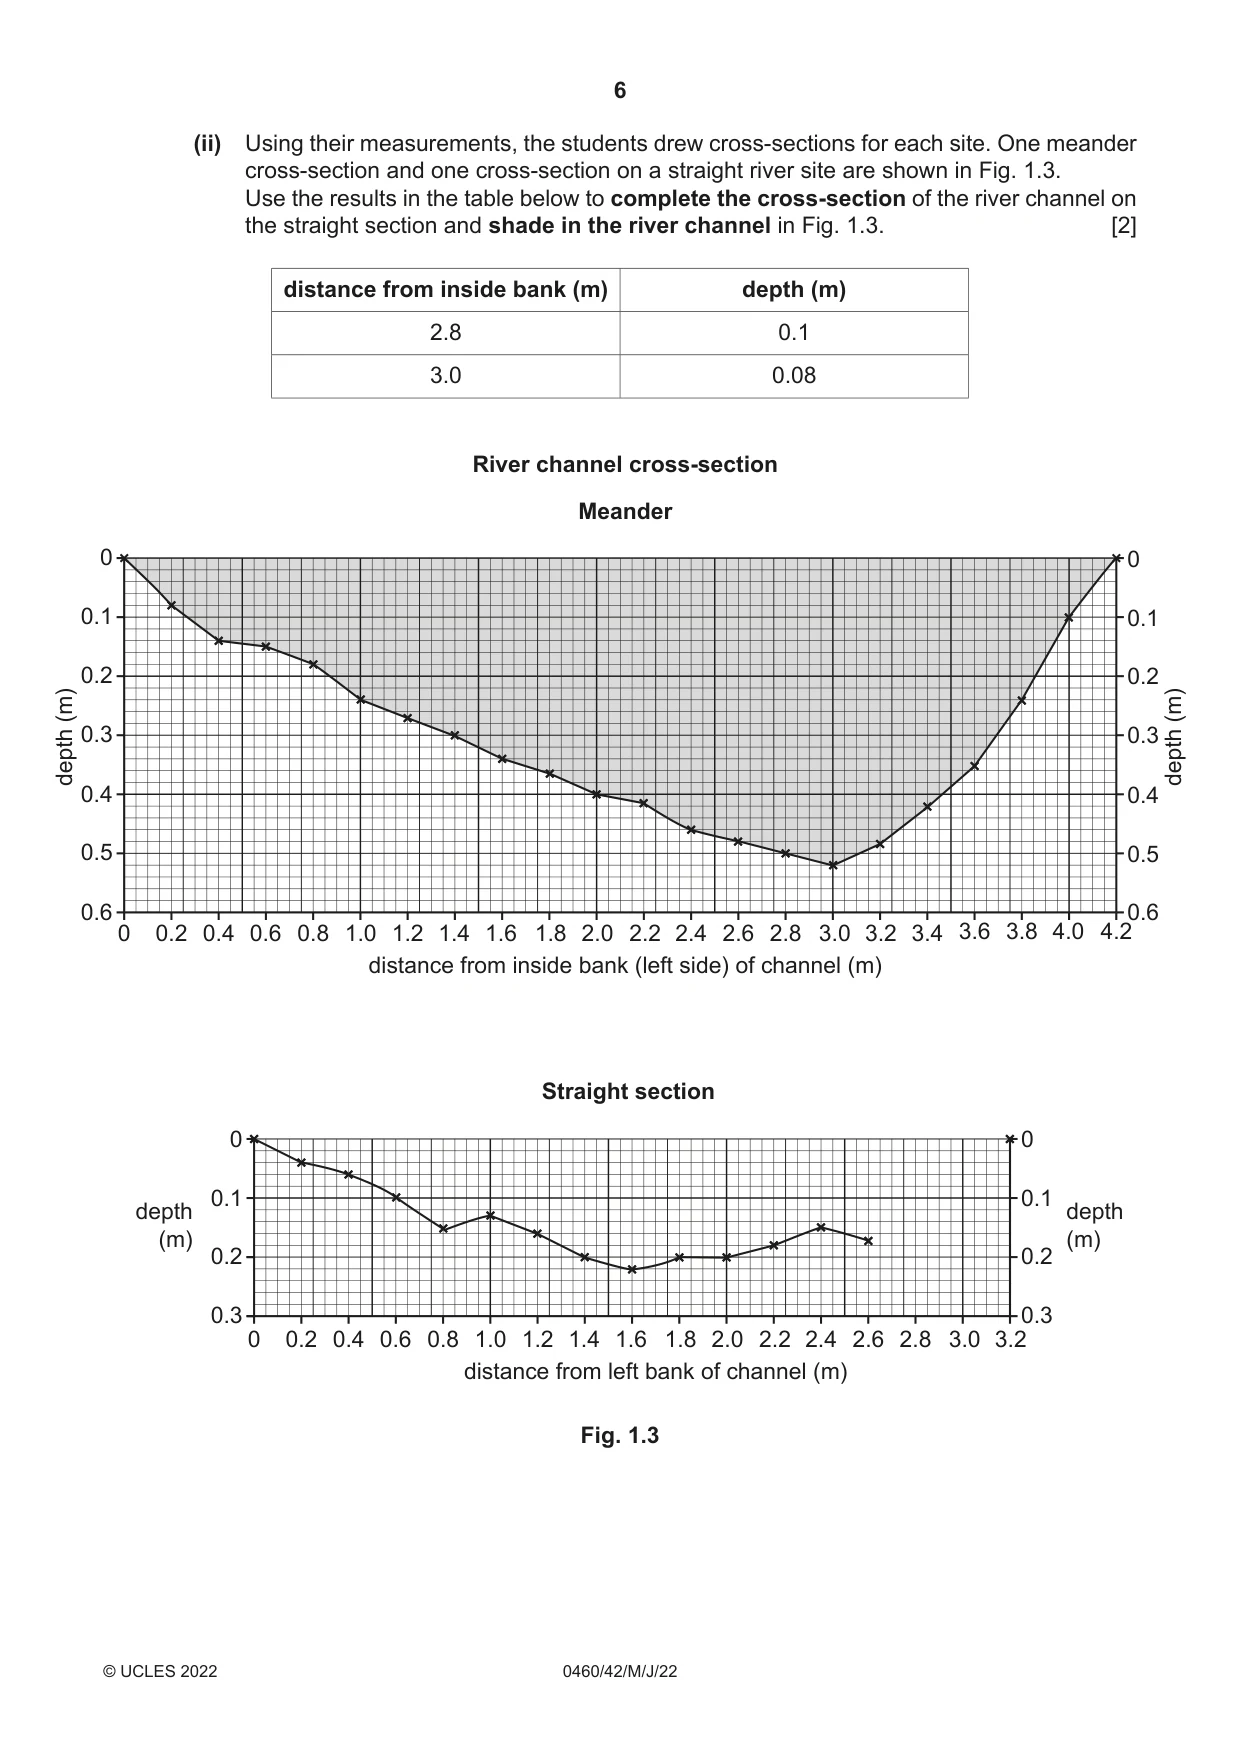
6 0460/42/M/J/22 © UCLES 2022 (ii) Using their measurements, the students drew cross-sections for each site. One meander cross-section and one cross-section on a straight river site are shown in Fig. 1.3. Use the results in the table below to complete the cross-section of the river channel on the straight section and shade in the river channel in Fig. 1.3. [2] distance from inside bank (m) depth (m) 2.8 0.1 3.0 0.08 0.6 0 0.2 0.4 0.6 0.8 1.0 1.2 1.4 1.6 1.8 2.0 2.2 2.4 2.6 2.8 3.0 3.2 3.4 3.6 3.8 4.0 4.2 0.5 0.4 0.3 0.2 0.1 0 0.3 0.2 0.1 0 0.3 0.2 0.1 0 Meander depth (m) depth (m) depth (m) depth (m) Straight section 0.6 0.5 0.4 0.3 0.2 0.1 0 distance from inside bank (left side) of channel (m) River channel cross-section 0 0.2 0.4 0.6 0.8 1.0 1.2 1.4 1.6 1.8 2.0 2.2 2.4 2.6 2.8 3.0 3.2 distance from left bank of channel (m) Fig. 1.3
Question paper, page 7
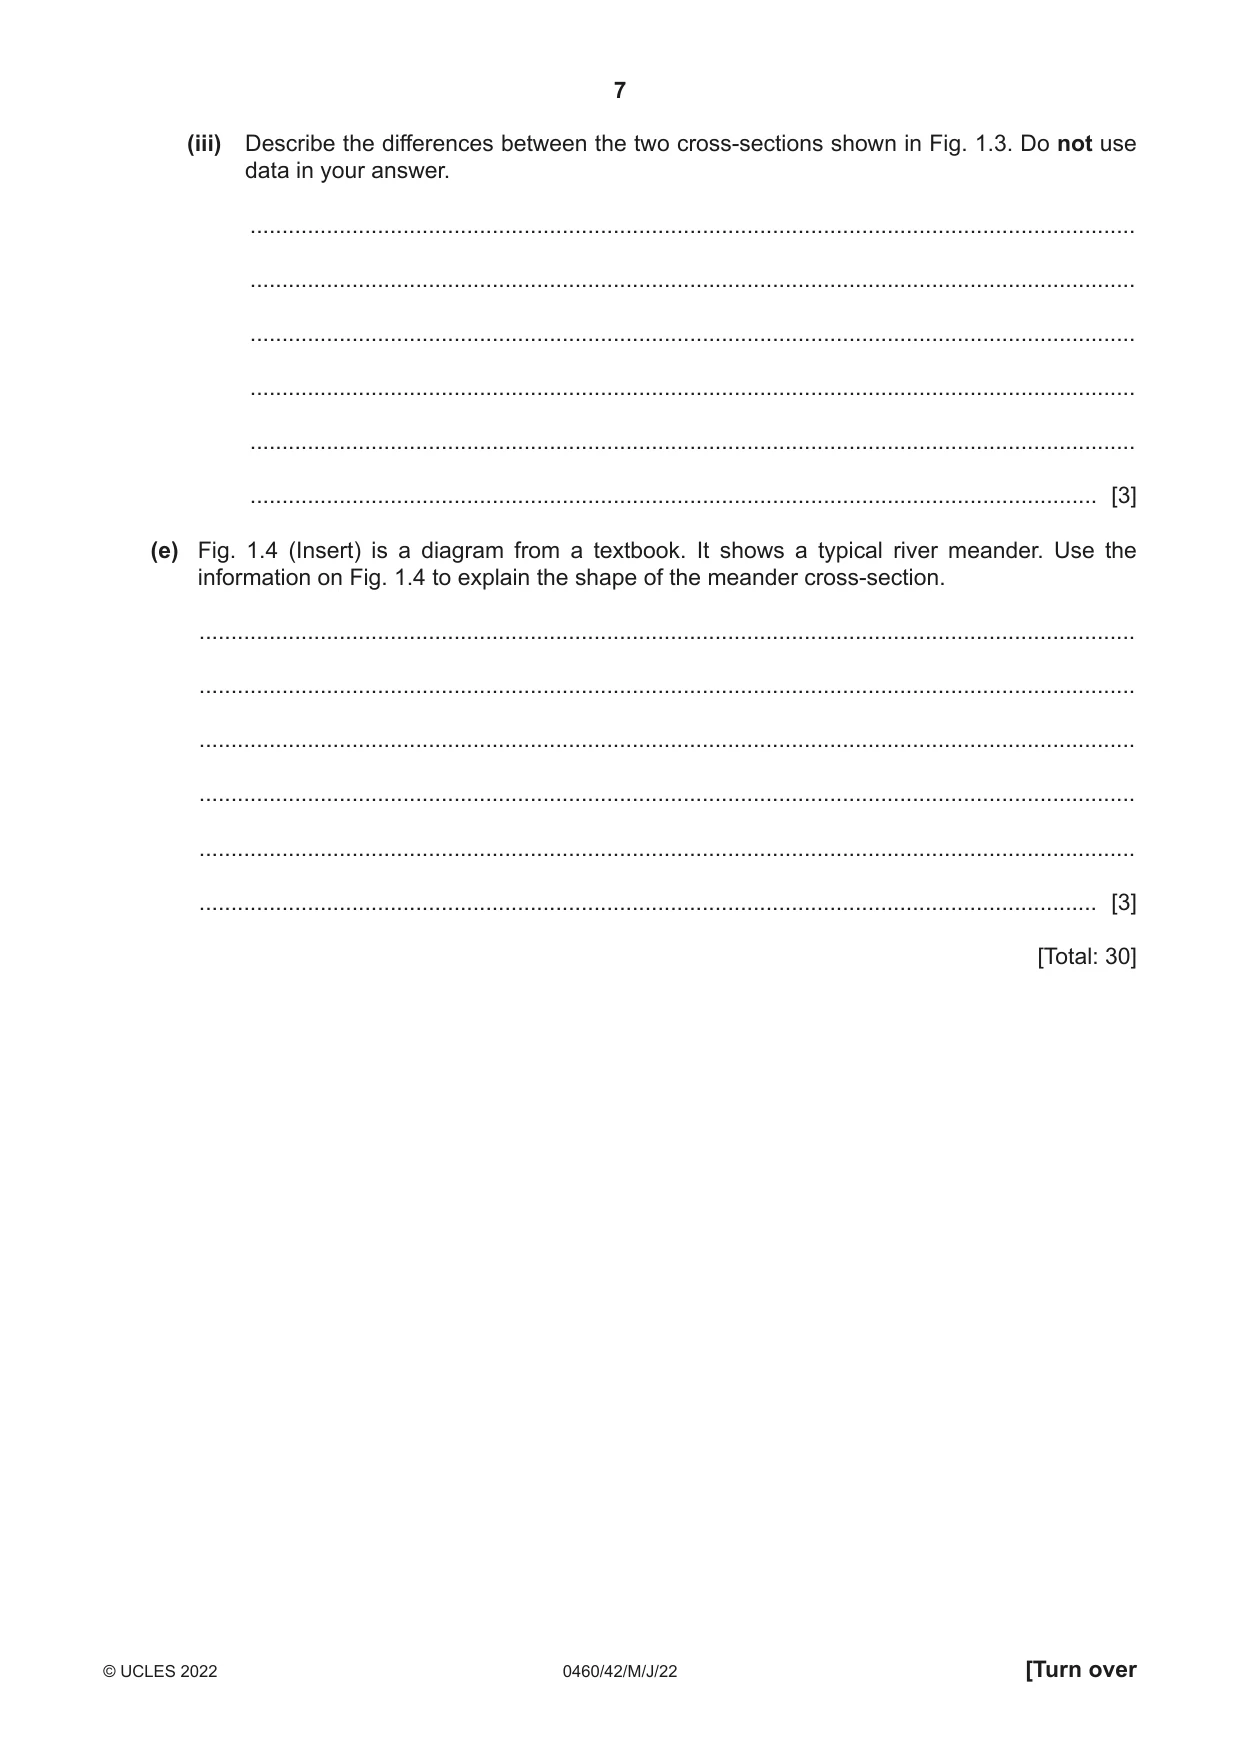
7 0460/42/M/J/22 © UCLES 2022 [Turn over (iii) Describe the differences between the two cross-sections shown in Fig. 1.3. Do not use data in your answer. … … … … … … [3] (e) Fig. 1.4 (Insert) is a diagram from a textbook. It shows a typical river meander. Use the information on Fig. 1.4 to explain the shape of the meander cross-section. … … … … … … [3] [Total: 30]
Question paper, page 8
8 0460/42/M/J/22 © UCLES 2022 BLANK PAGE
Question paper, page 9
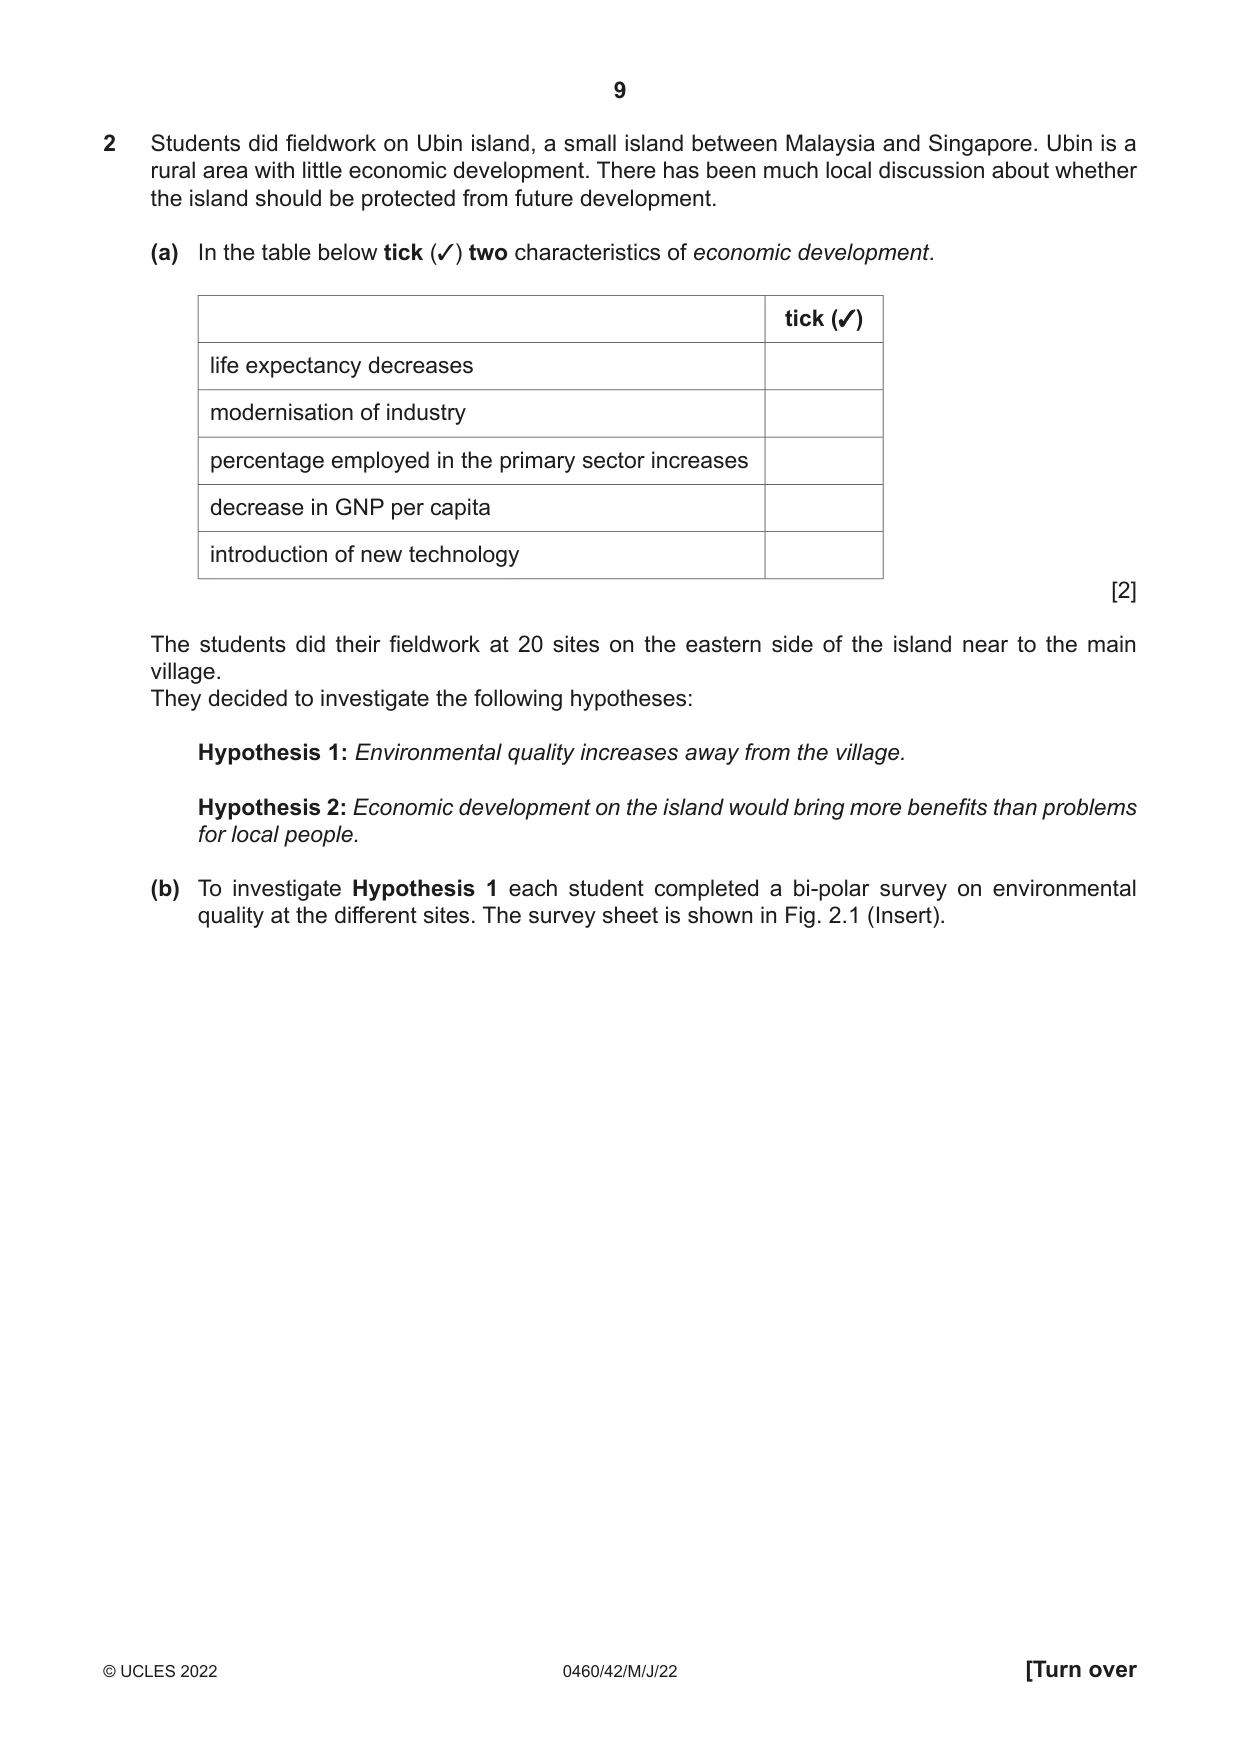
9 0460/42/M/J/22 © UCLES 2022 [Turn over 2 Students did fieldwork on Ubin island, a small island between Malaysia and Singapore. Ubin is a rural area with little economic development. There has been much local discussion about whether the island should be protected from future development. (a) In the table below tick (3) two characteristics of economic development. tick (3) life expectancy decreases modernisation of industry percentage employed in the primary sector increases decrease in GNP per capita introduction of new technology [2] The students did their fieldwork at 20 sites on the eastern side of the island near to the main village. They decided to investigate the following hypotheses: Hypothesis 1: Environmental quality increases away from the village. Hypothesis 2: Economic development on the island would bring more benefits than problems for local people. (b) To investigate Hypothesis 1 each student completed a bi-polar survey on environmental quality at the different sites. The survey sheet is shown in Fig. 2.1 (Insert).
Question paper, page 10
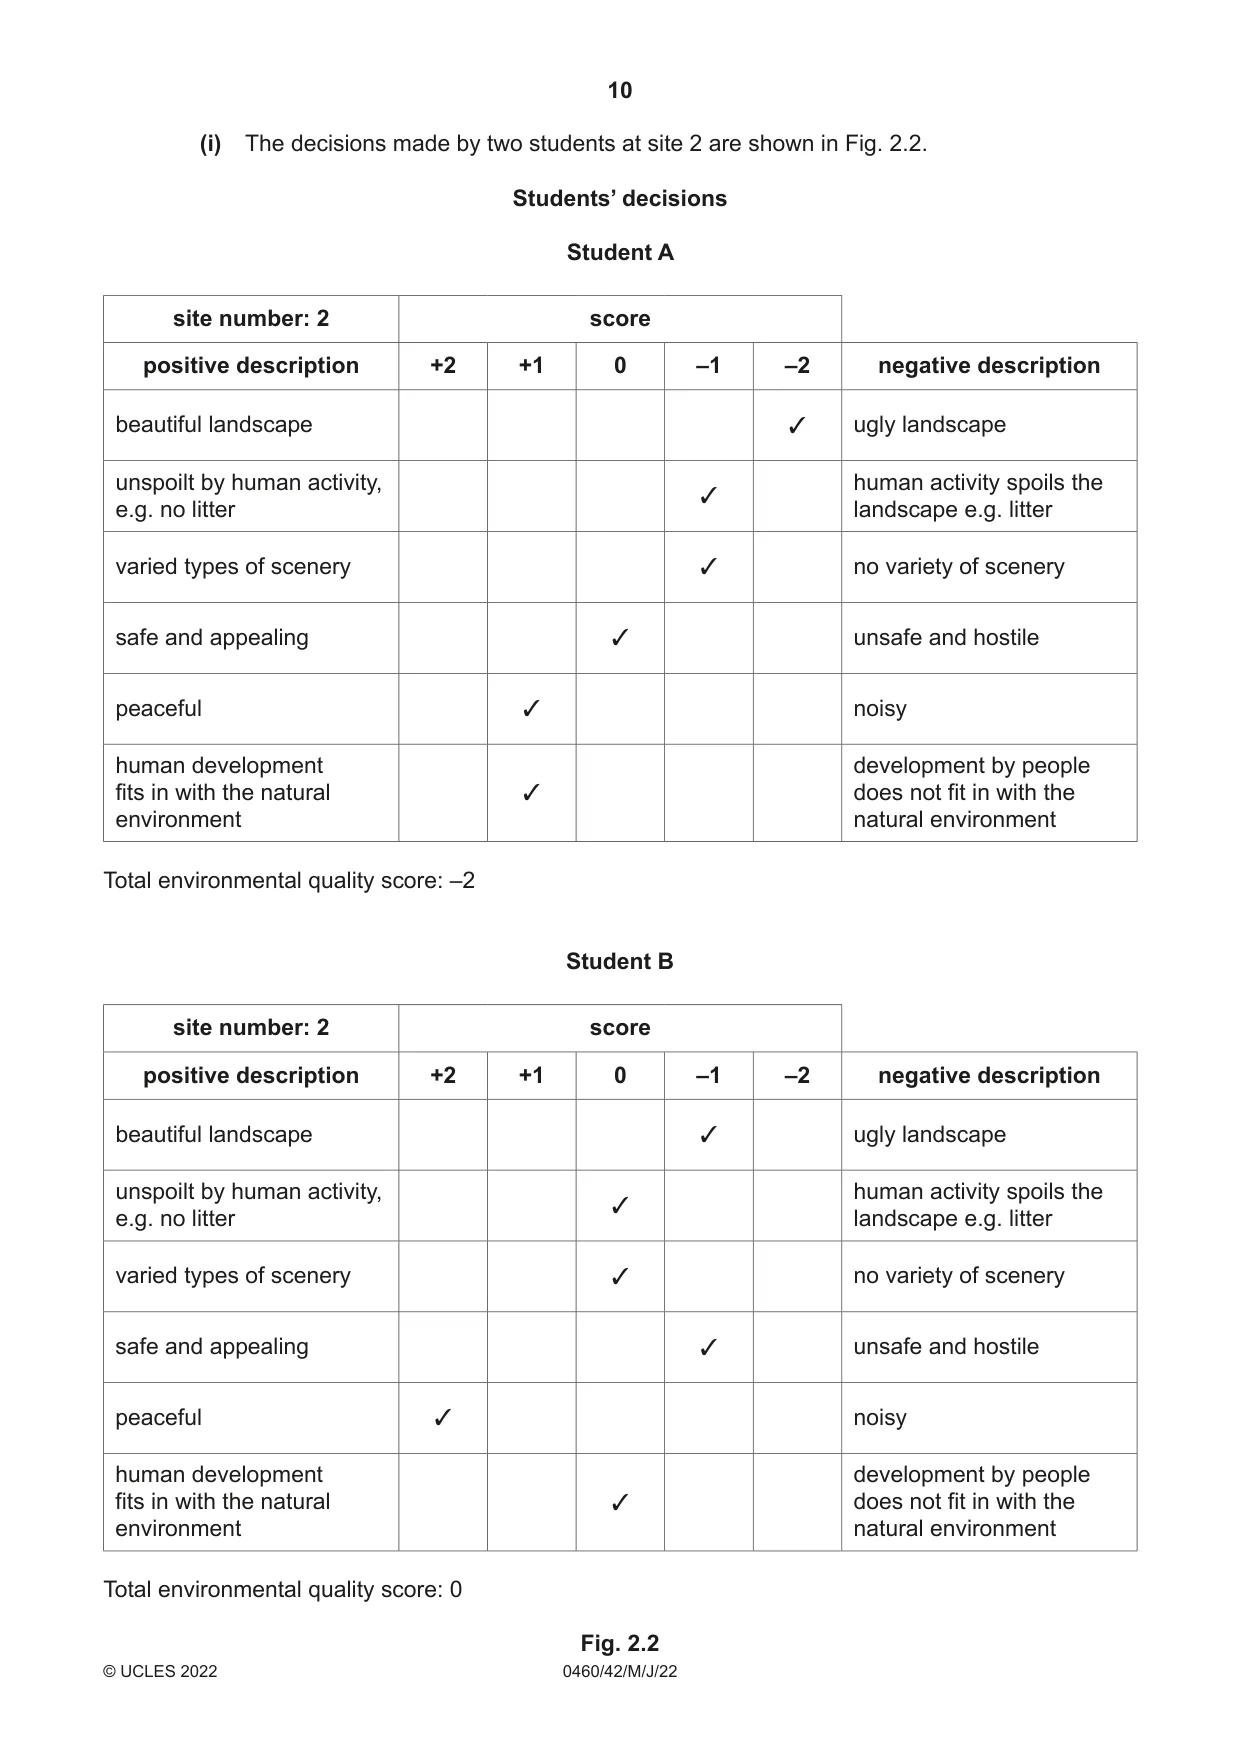
10 0460/42/M/J/22 © UCLES 2022 (i) The decisions made by two students at site 2 are shown in Fig. 2.2. Students’ decisions Student A site number: 2 score positive description +2 +1 0 –1 –2 negative description beautiful landscape 3 ugly landscape unspoilt by human activity, e.g. no litter 3 human activity spoils the landscape e.g. litter varied types of scenery 3 no variety of scenery safe and appealing 3 unsafe and hostile peaceful 3 noisy human development fits in with the natural environment 3 development by people does not fit in with the natural environment Total environmental quality score: –2 Student B site number: 2 score positive description +2 +1 0 –1 –2 negative description beautiful landscape 3 ugly landscape unspoilt by human activity, e.g. no litter 3 human activity spoils the landscape e.g. litter varied types of scenery 3 no variety of scenery safe and appealing 3 unsafe and hostile peaceful 3 noisy human development fits in with the natural environment 3 development by people does not fit in with the natural environment Total environmental quality score: 0 Fig. 2.2
Question paper, page 11
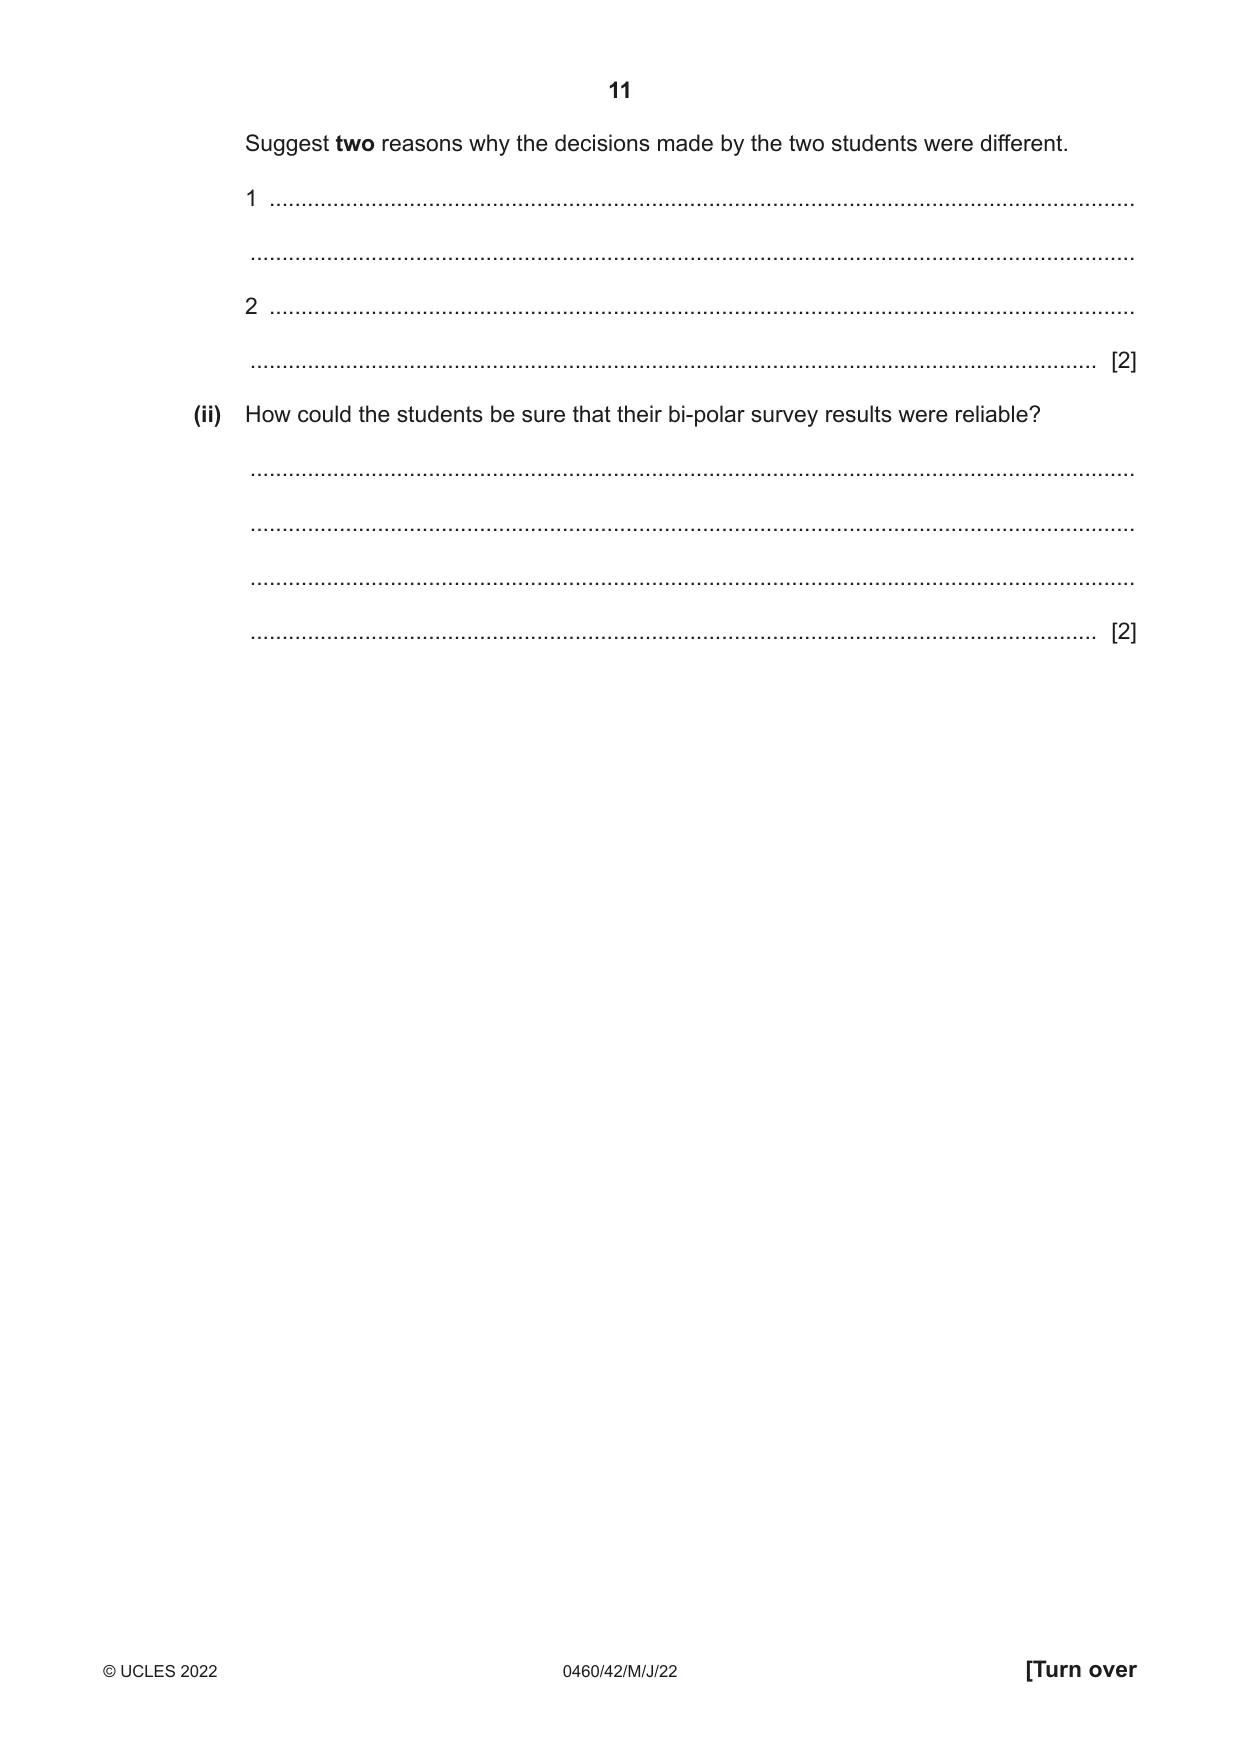
11 0460/42/M/J/22 © UCLES 2022 [Turn over Suggest two reasons why the decisions made by the two students were different. 1 … … 2 … … [2] (ii) How could the students be sure that their bi-polar survey results were reliable? … … … … [2]
Question paper, page 12
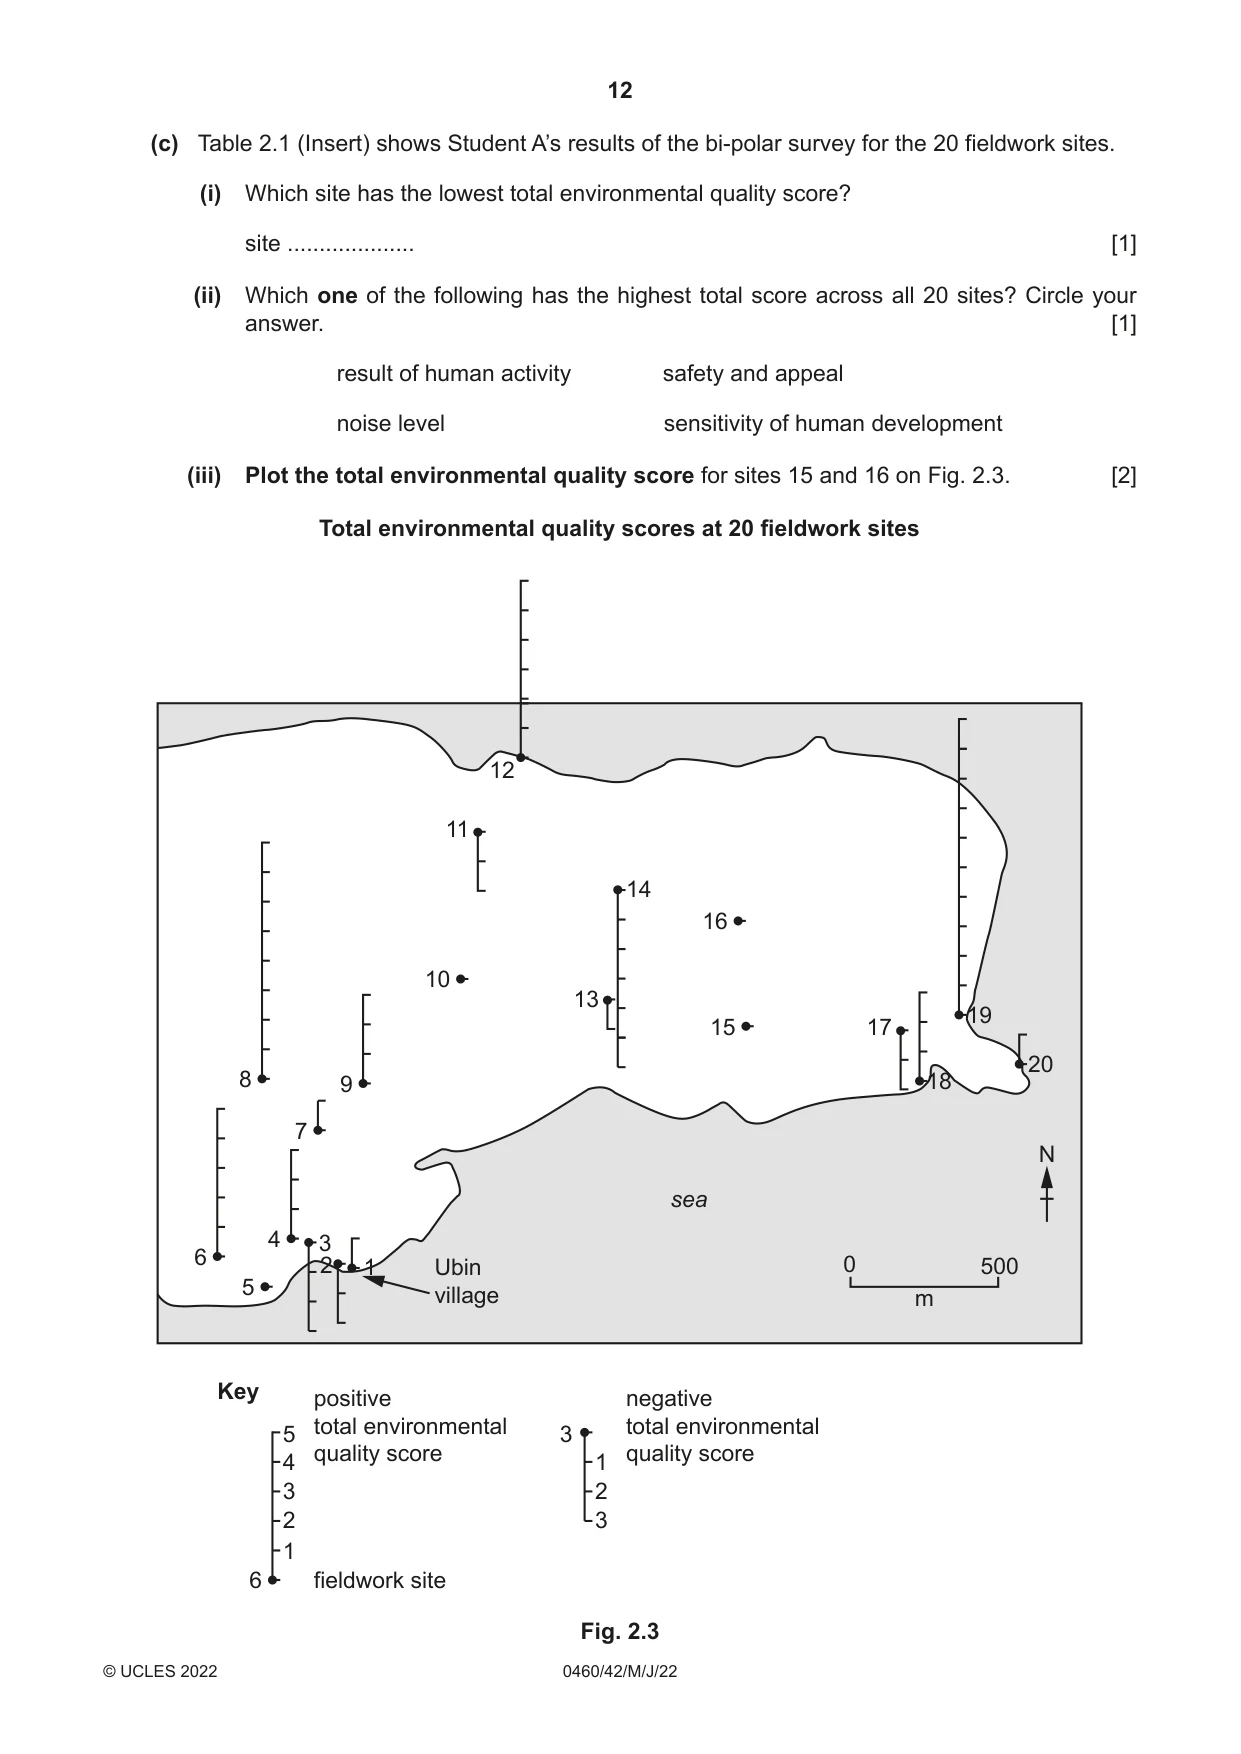
12 0460/42/M/J/22 © UCLES 2022 (c) Table 2.1 (Insert) shows Student A’s results of the bi-polar survey for the 20 fieldwork sites. (i) Which site has the lowest total environmental quality score? site … [1] (ii) Which one of the following has the highest total score across all 20 sites? Circle your answer. [1] result of human activity safety and appeal noise level sensitivity of human development (iii) Plot the total environmental quality score for sites 15 and 16 on Fig. 2.3. [2] 1 6 2 3 4 5 6 5 4 3 2 1 7 16 10 15 9 18 14 11 17 12 8 19 Key positive total environmental quality score 3 500 2 1 3 negative total environmental quality score fieldwork site Ubin village 20 13 N m 0 Total environmental quality scores at 20 fieldwork sites sea Fig. 2.3
Question paper, page 13
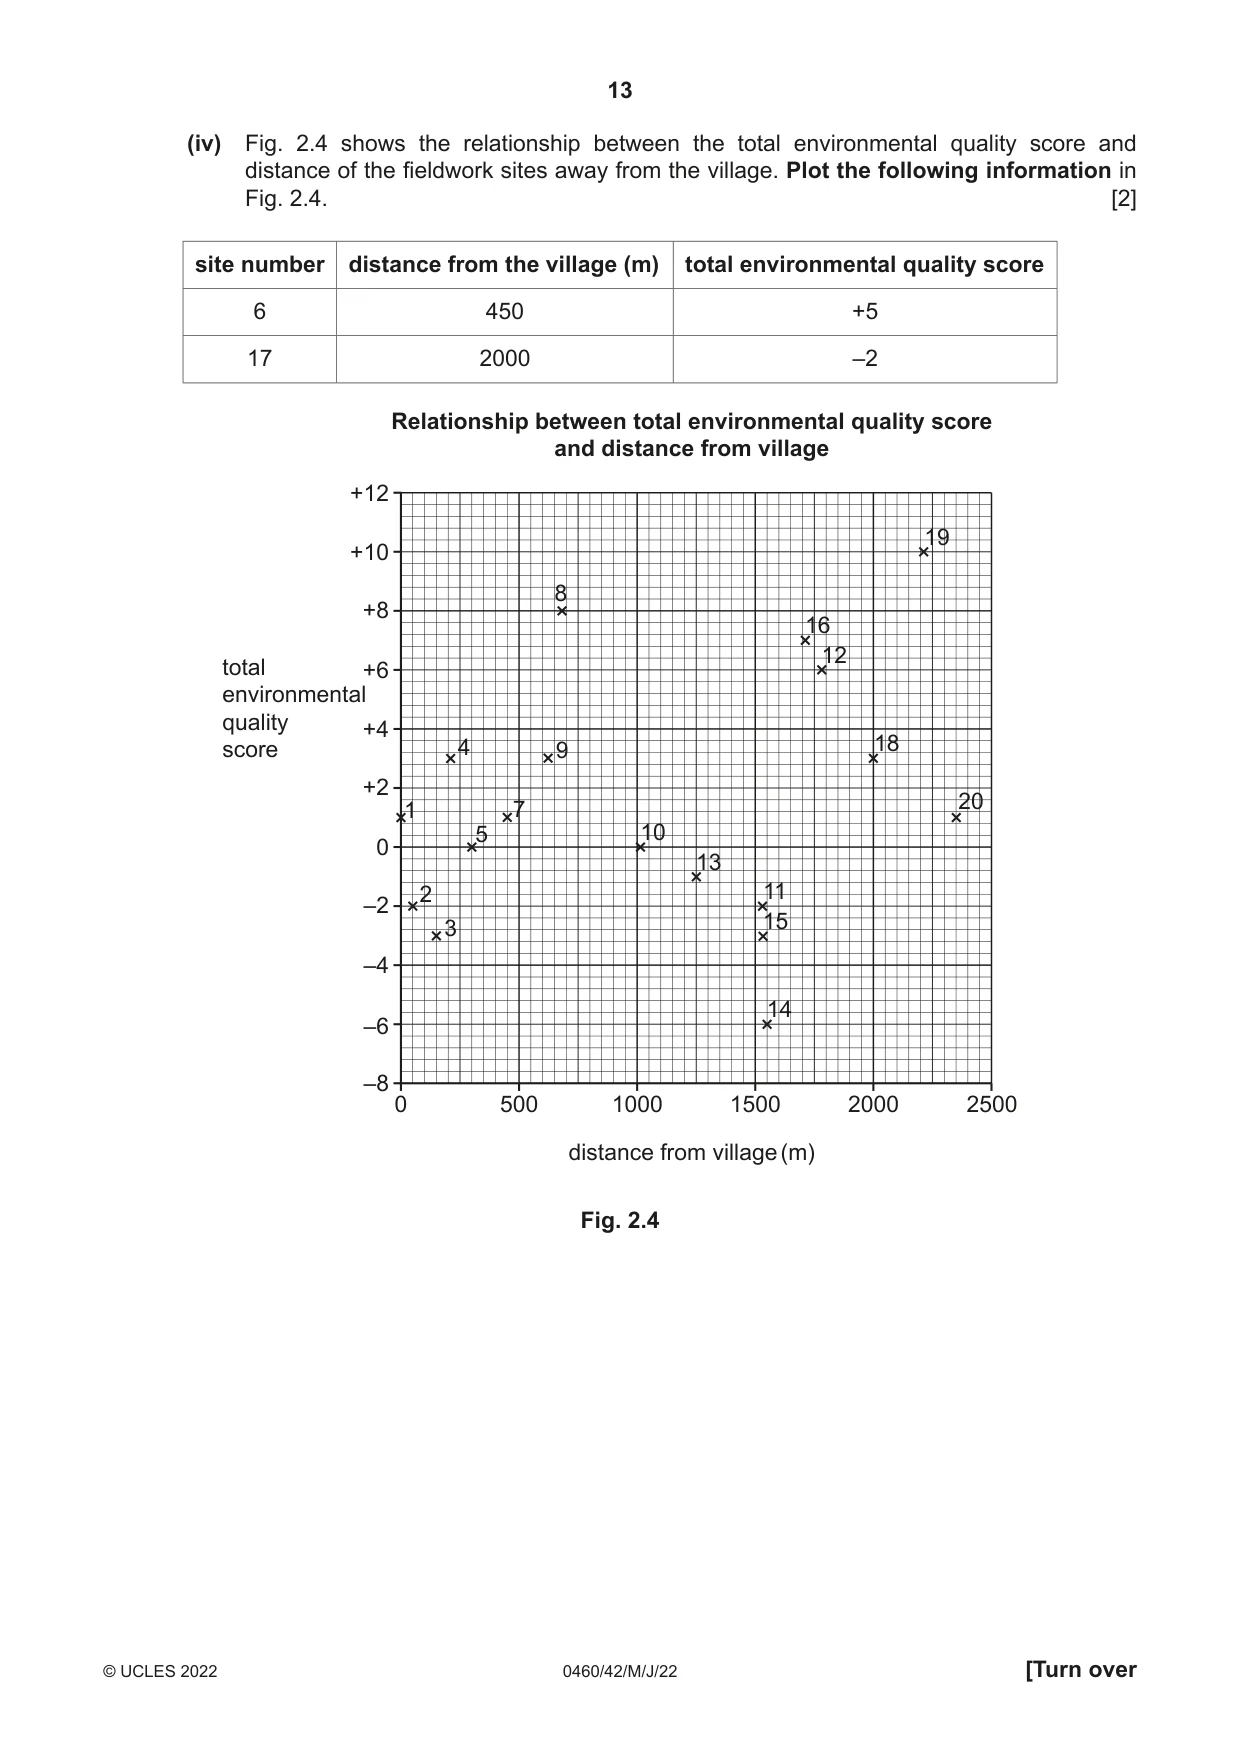
13 0460/42/M/J/22 © UCLES 2022 [Turn over (iv) Fig. 2.4 shows the relationship between the total environmental quality score and distance of the fieldwork sites away from the village. Plot the following information in Fig. 2.4. [2] site number distance from the village (m) total environmental quality score 6 450 +5 17 2000 –2 0 500 1000 1500 2000 2500 –8 –6 –4 –2 0 +2 +4 +6 +8 +10 +12 distance from village (m) Relationship between total environmental quality score and distance from village total environmental quality score 1 2 3 4 5 10 12 13 14 15 16 18 19 20 11 7 9 8 Fig. 2.4
Question paper, page 14
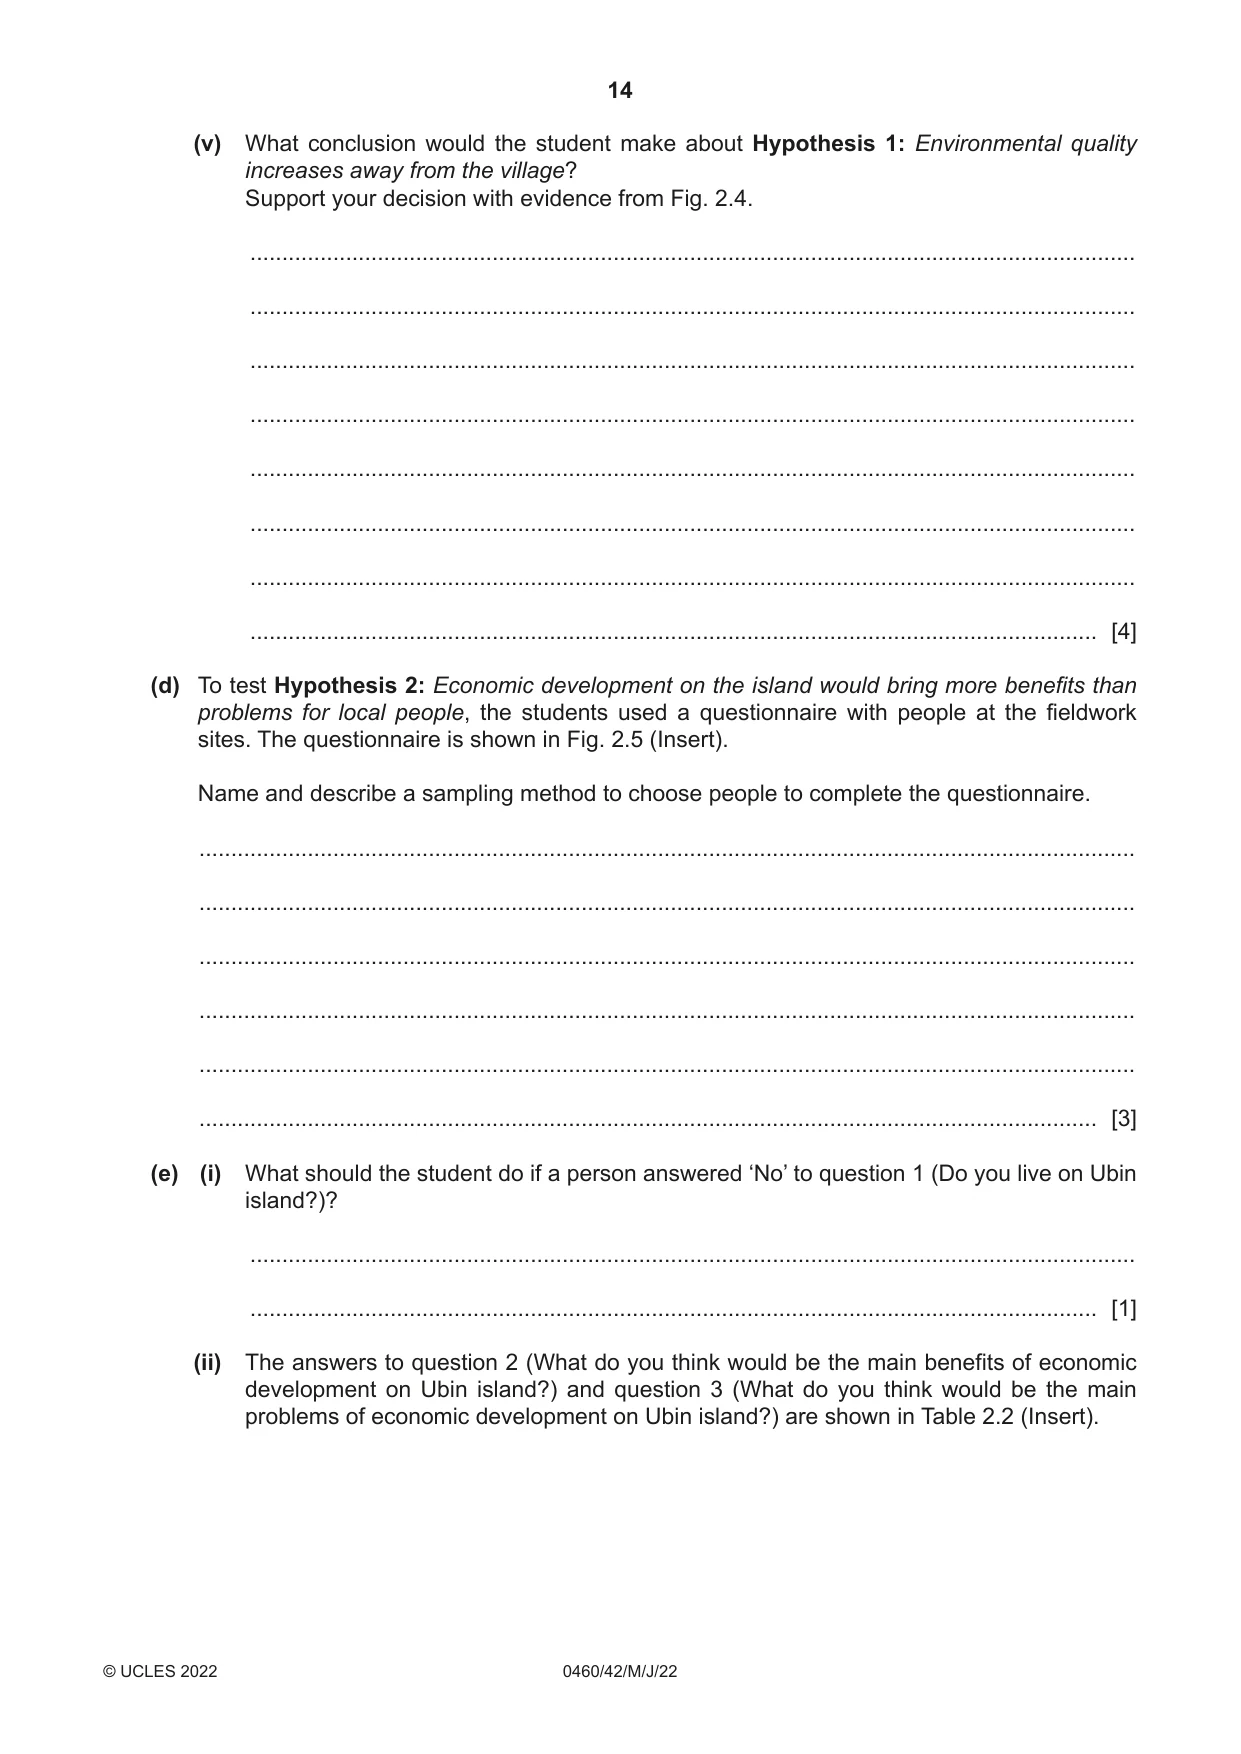
14 0460/42/M/J/22 © UCLES 2022 (v) What conclusion would the student make about Hypothesis 1: Environmental quality increases away from the village? Support your decision with evidence from Fig. 2.4. … … … … … … … … [4] (d) To test Hypothesis 2: Economic development on the island would bring more benefits than problems for local people, the students used a questionnaire with people at the fieldwork sites. The questionnaire is shown in Fig. 2.5 (Insert). Name and describe a sampling method to choose people to complete the questionnaire. … … … … … … [3] (e) (i) What should the student do if a person answered ‘No’ to question 1 (Do you live on Ubin island?)? … … [1] (ii) The answers to question 2 (What do you think would be the main benefits of economic development on Ubin island?) and question 3 (What do you think would be the main problems of economic development on Ubin island?) are shown in Table 2.2 (Insert).
Question paper, page 15
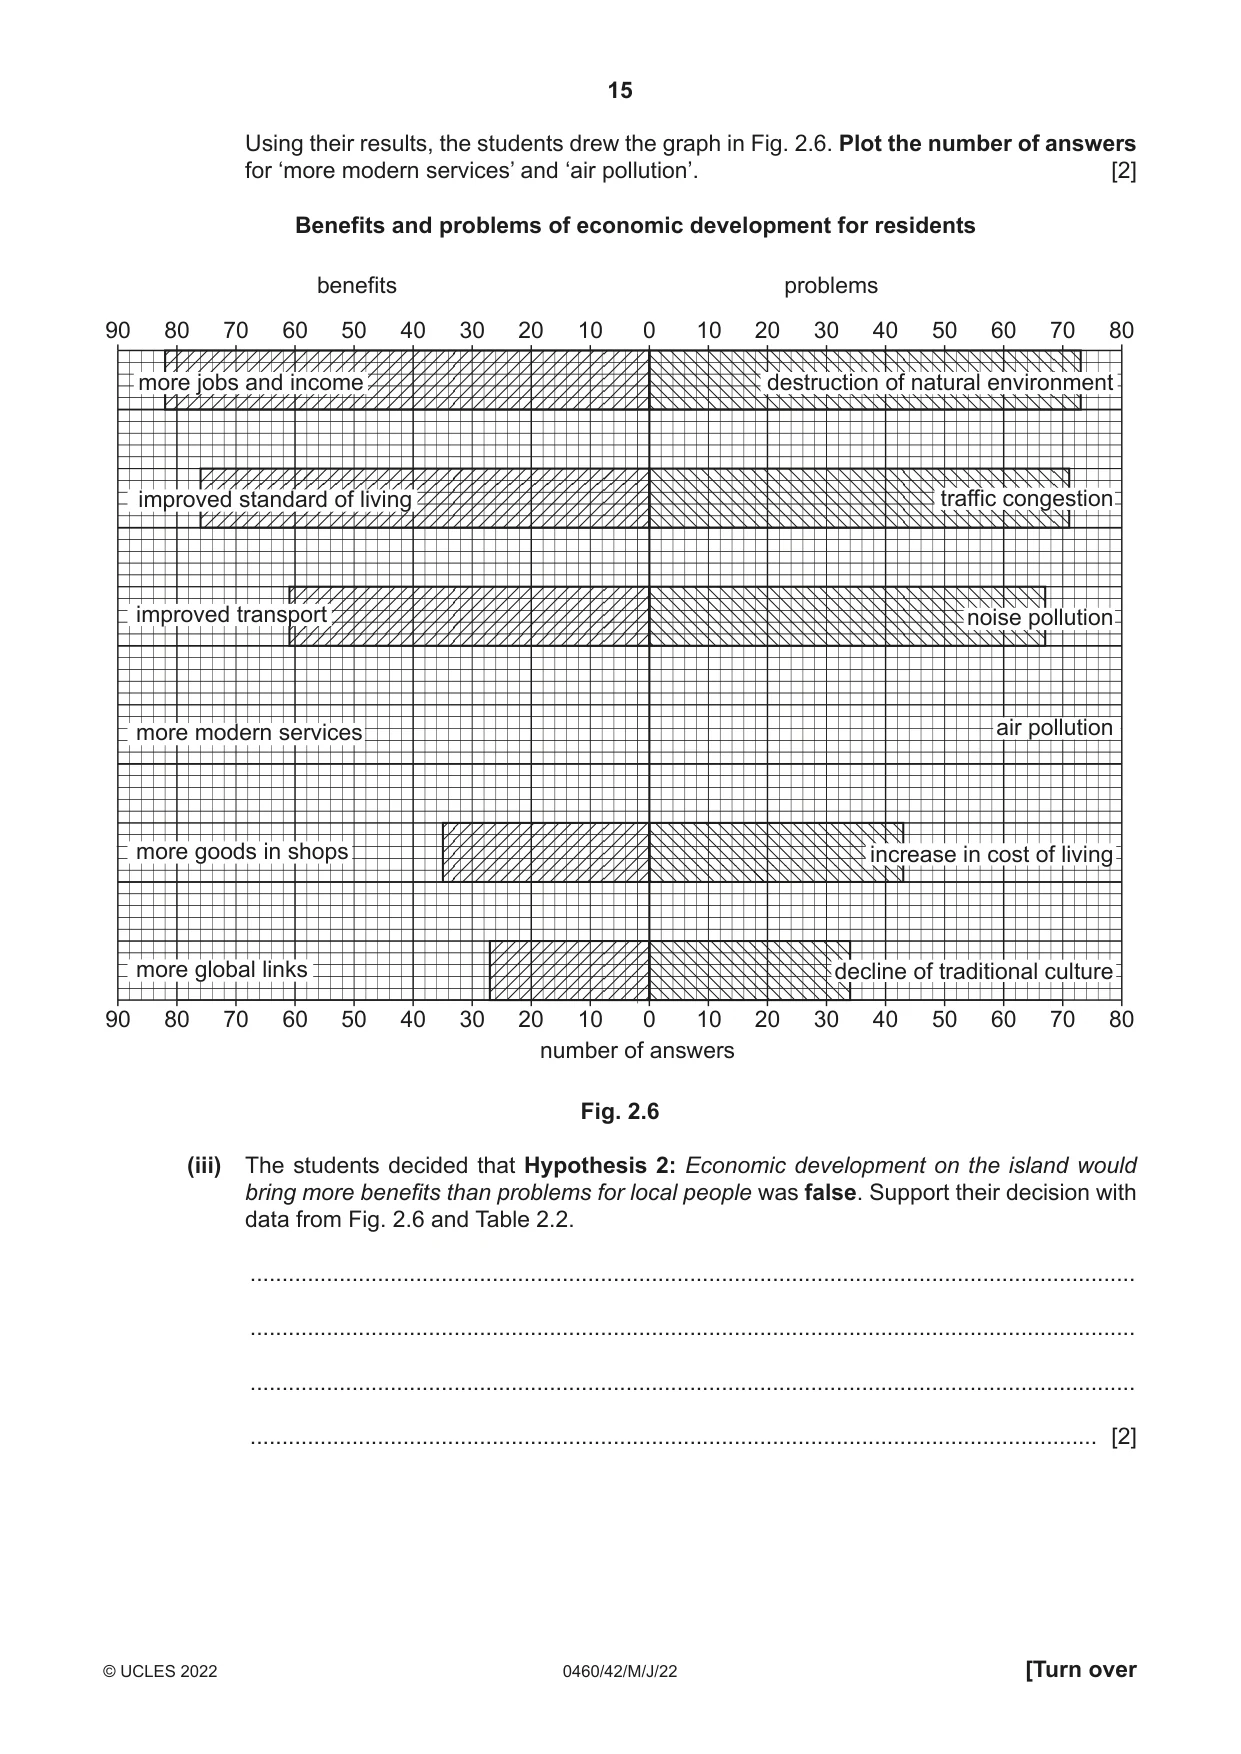
15 0460/42/M/J/22 © UCLES 2022 [Turn over Using their results, the students drew the graph in Fig. 2.6. Plot the number of answers for ‘more modern services’ and ‘air pollution’. [2] 90 80 70 60 50 40 30 20 10 0 10 20 30 40 50 60 70 80 number of answers 90 80 70 60 50 40 30 20 10 0 Benefits and problems of economic development for residents 10 20 30 40 50 60 70 80 benefits problems more jobs and income improved standard of living improved transport more modern services more goods in shops more global links destruction of natural environment increase in cost of living decline of traditional culture traffic congestion noise pollution air pollution Fig. 2.6 (iii) The students decided that Hypothesis 2: Economic development on the island would bring more benefits than problems for local people was false. Support their decision with data from Fig. 2.6 and Table 2.2. … … … … [2]
Question paper, page 16
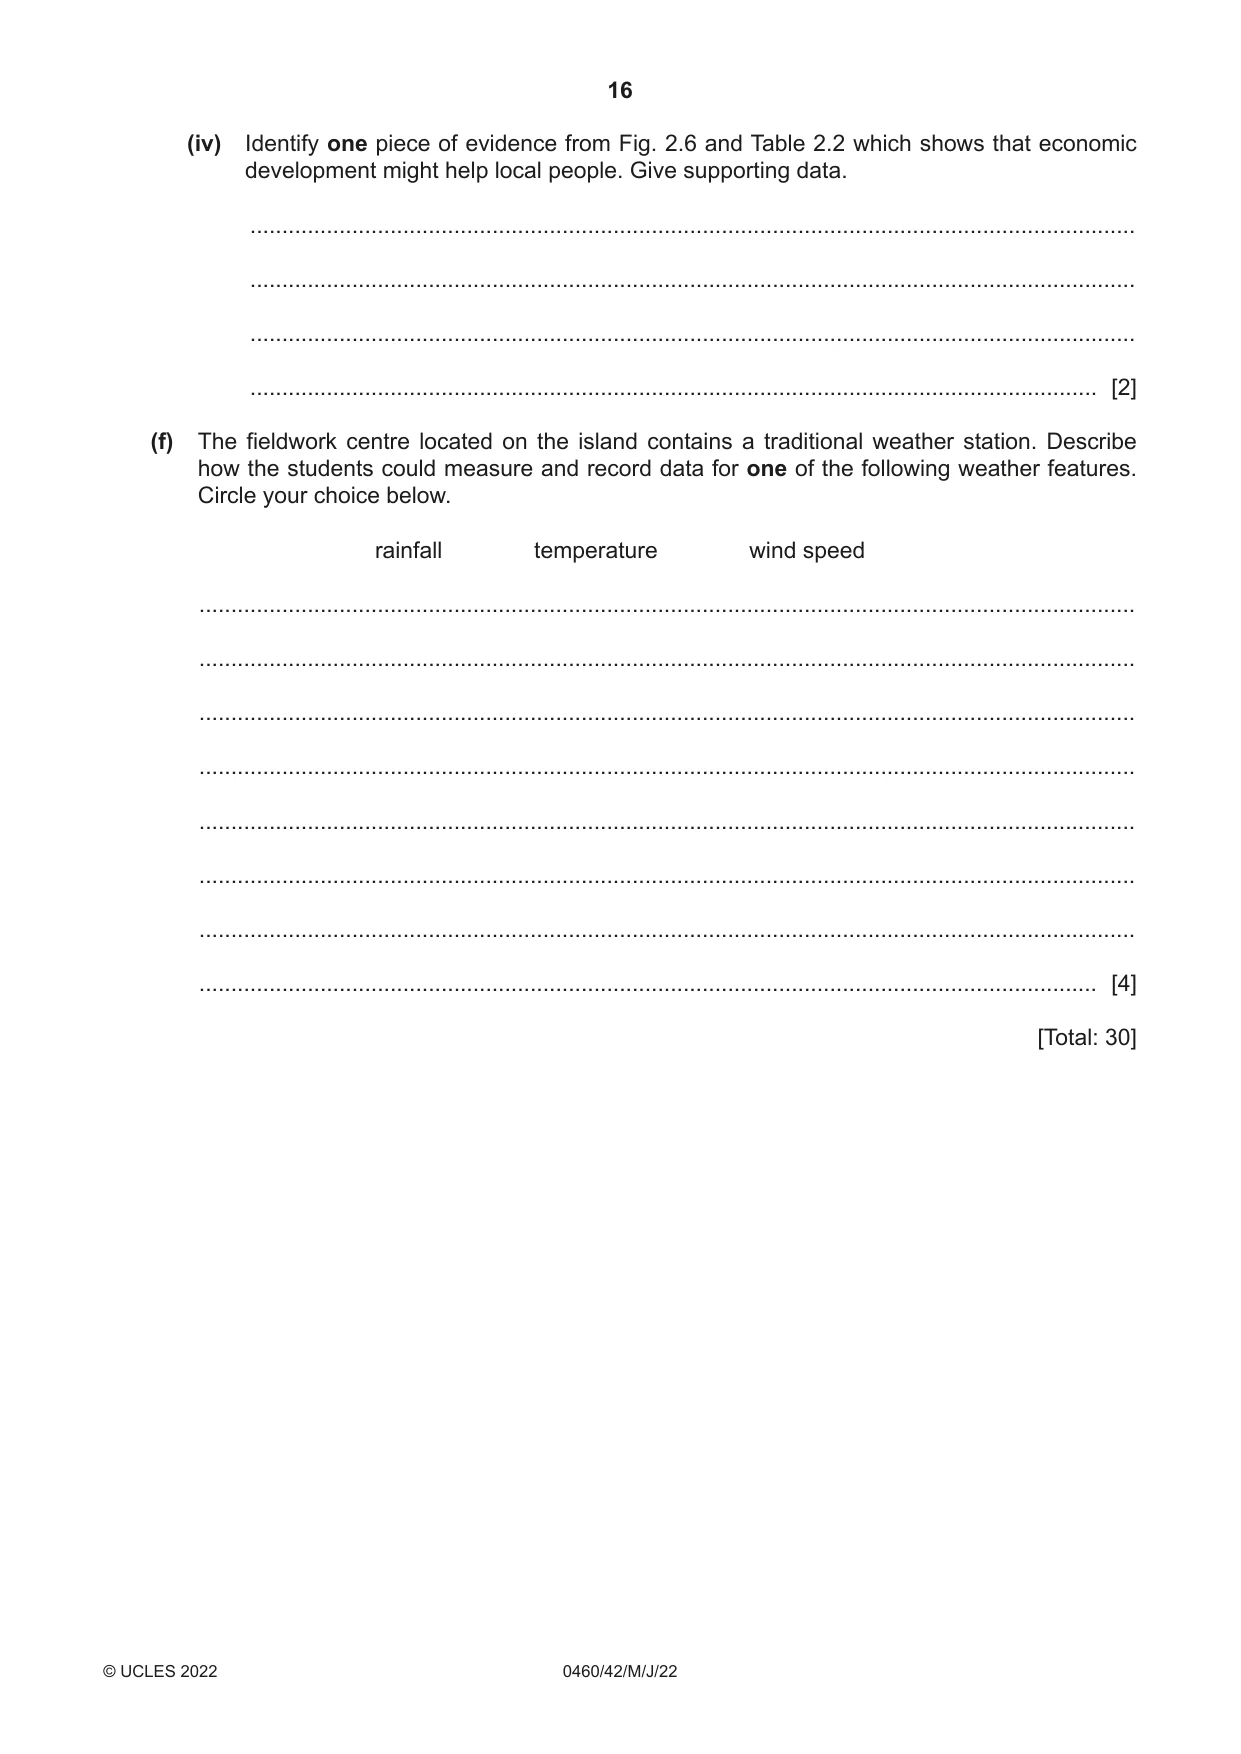
16 0460/42/M/J/22 © UCLES 2022 (iv) Identify one piece of evidence from Fig. 2.6 and Table 2.2 which shows that economic development might help local people. Give supporting data. … … … … [2] (f) The fieldwork centre located on the island contains a traditional weather station. Describe how the students could measure and record data for one of the following weather features. Circle your choice below. rainfall temperature wind speed … … … … … … … … [4] [Total: 30]
Question paper, page 17
17 0460/42/M/J/22 © UCLES 2022 Additional pages If you use the following pages to complete the answer to any question, the question number must be clearly shown. … … … … … … … … … … … … … … … … … … … … … … … … … …
Question paper, page 18
18 0460/42/M/J/22 © UCLES 2022 … … … … … … … … … … … … … … … … … … … … … … … … … … … …
Question paper, page 19
19 0460/42/M/J/22 © UCLES 2022 BLANK PAGE
Question paper, page 20
20 0460/42/M/J/22 © UCLES 2022 The boundaries and names shown, the designations used and the presentation of material on any maps contained in this question paper/insert do not imply official endorsement or acceptance by Cambridge Assessment International Education concerning the legal status of any country, territory, or area or any of its authorities, or of the delimitation of its frontiers or boundaries. Permission to reproduce items where third-party owned material protected by copyright is included has been sought and cleared where possible. Every reasonable effort has been made by the publisher (UCLES) to trace copyright holders, but if any items requiring clearance have unwittingly been included, the publisher will be pleased to make amends at the earliest possible opportunity. To avoid the issue of disclosure of answer-related information to candidates, all copyright acknowledgements are reproduced online in the Cambridge Assessment International Education Copyright Acknowledgements Booklet. This is produced for each series of examinations and is freely available to download at www.cambridgeinternational.org after the live examination series. Cambridge Assessment International Education is part of Cambridge Assessment. Cambridge Assessment is the brand name of the University of Cambridge Local Examinations Syndicate (UCLES), which is a department of the University of Cambridge. BLANK PAGE
Mark scheme, page 1
This document consists of 8 printed pages. © UCLES 2022 [Turn over Cambridge IGCSE™ GEOGRAPHY 0460/42 Paper 4 Alternative to Coursework May/June 2022 MARK SCHEME Maximum Mark: 60 Published This mark scheme is published as an aid to teachers and candidates, to indicate the requirements of the examination. It shows the basis on which Examiners were instructed to award marks. It does not indicate the details of the discussions that took place at an Examiners’ meeting before marking began, which would have considered the acceptability of alternative answers. Mark schemes should be read in conjunction with the question paper and the Principal Examiner Report for Teachers. Cambridge International will not enter into discussions about these mark schemes. Cambridge International is publishing the mark schemes for the May/June 2022 series for most Cambridge IGCSE, Cambridge International A and AS Level and Cambridge Pre-U components, and some Cambridge O Level components.
Mark scheme, page 2
0460/42 Cambridge IGCSE – Mark Scheme PUBLISHED May/June 2022 © UCLES 2022 Page 2 of 8 Generic Marking Principles These general marking principles must be applied by all examiners when marking candidate answers. They should be applied alongside the specific content of the mark scheme or generic level descriptors for a question. Each question paper and mark scheme will also comply with these marking principles. GENERIC MARKING PRINCIPLE 1: Marks must be awarded in line with: the specific content of the mark scheme or the generic level descriptors for the question the specific skills defined in the mark scheme or in the generic level descriptors for the question the standard of response required by a candidate as exemplified by the standardisation scripts. GENERIC MARKING PRINCIPLE 2: Marks awarded are always whole marks (not half marks, or other fractions). GENERIC MARKING PRINCIPLE 3: Marks must be awarded positively: marks are awarded for correct/valid answers, as defined in the mark scheme. However, credit is given for valid answers which go beyond the scope of the syllabus and mark scheme, referring to your Team Leader as appropriate marks are awarded when candidates clearly demonstrate what they know and can do marks are not deducted for errors marks are not deducted for omissions answers should only be judged on the quality of spelling, punctuation and grammar when these features are specifically assessed by the question as indicated by the mark scheme. The meaning, however, should be unambiguous. GENERIC MARKING PRINCIPLE 4: Rules must be applied consistently, e.g. in situations where candidates have not followed instructions or in the application of generic level descriptors. GENERIC MARKING PRINCIPLE 5: Marks should be awarded using the full range of marks defined in the mark scheme for the question (however; the use of the full mark range may be limited according to the quality of the candidate responses seen). GENERIC MARKING PRINCIPLE 6: Marks awarded are based solely on the requirements as defined in the mark scheme. Marks should not be awarded with grade thresholds or grade descriptors in mind.
Mark scheme, page 3
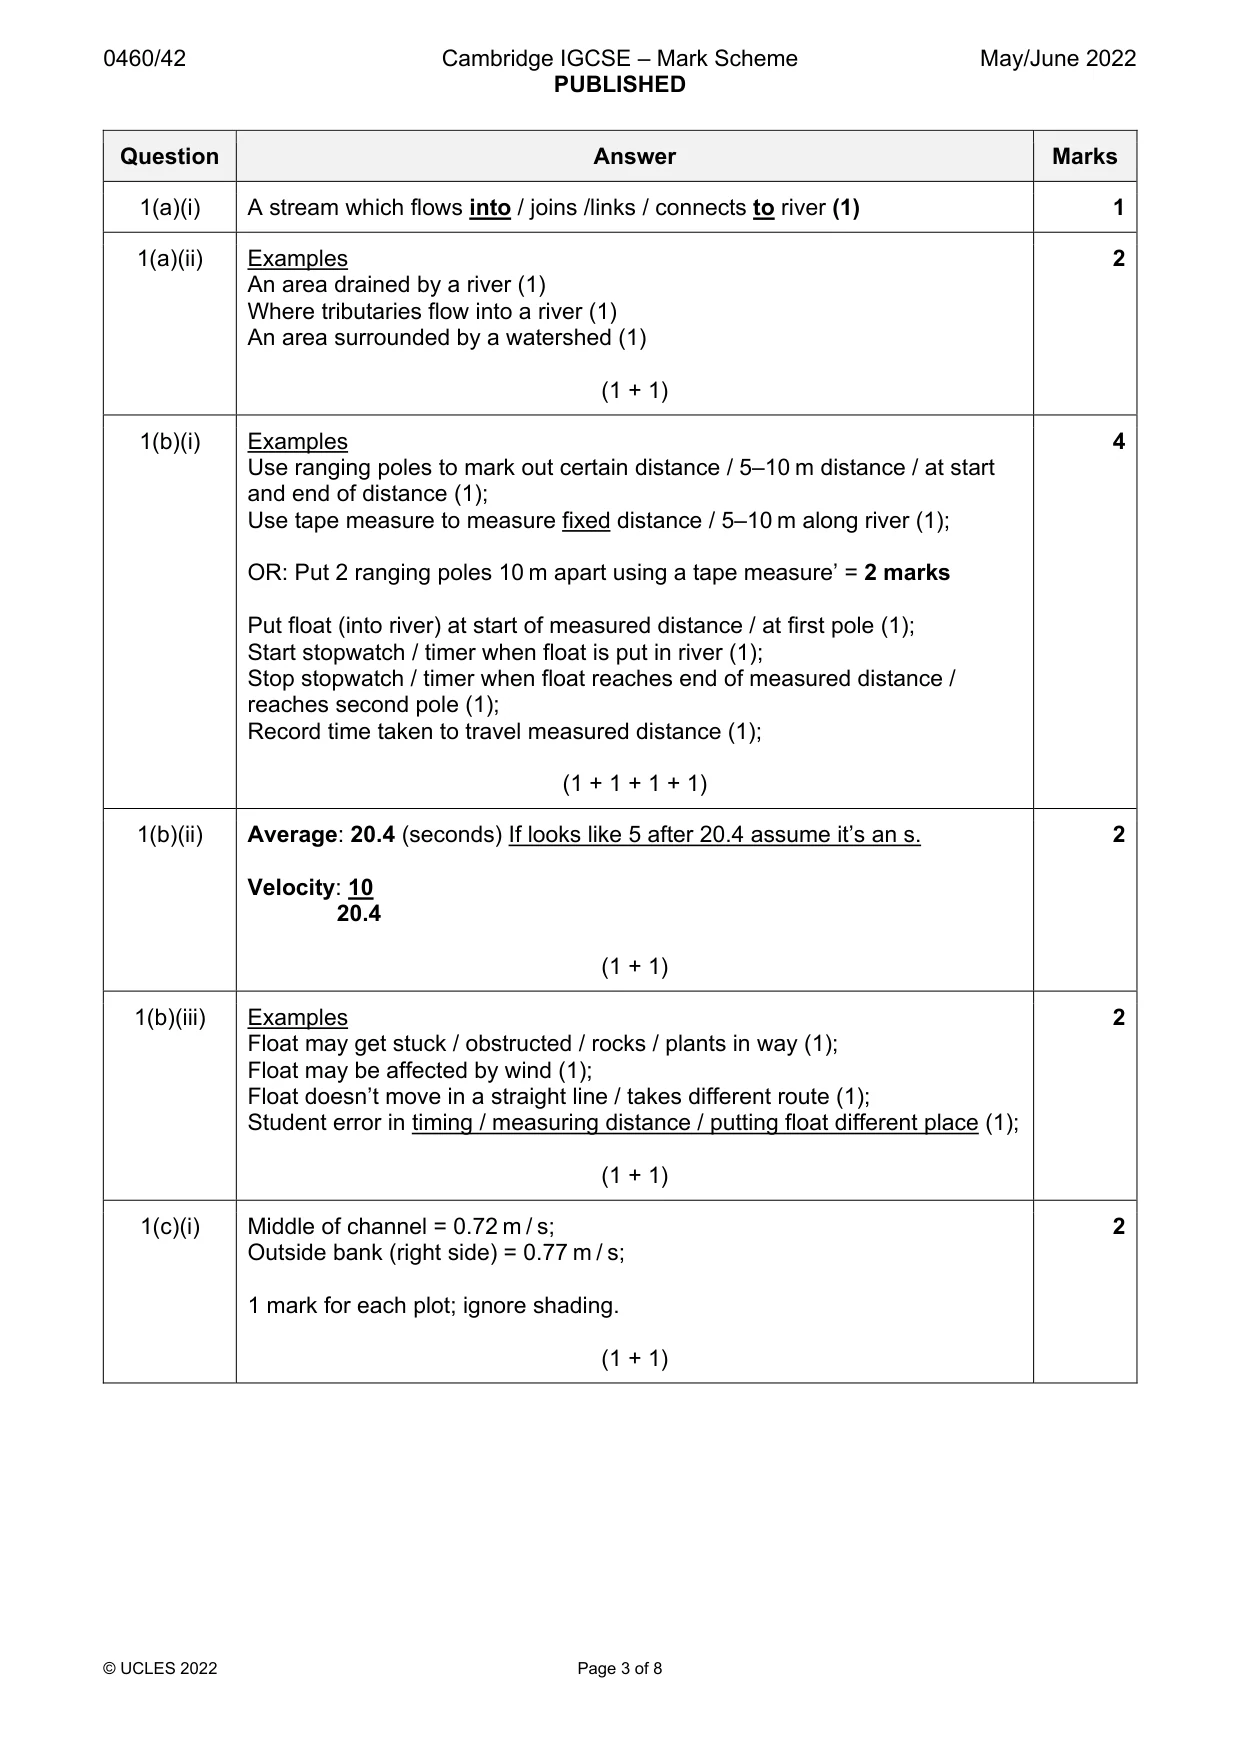
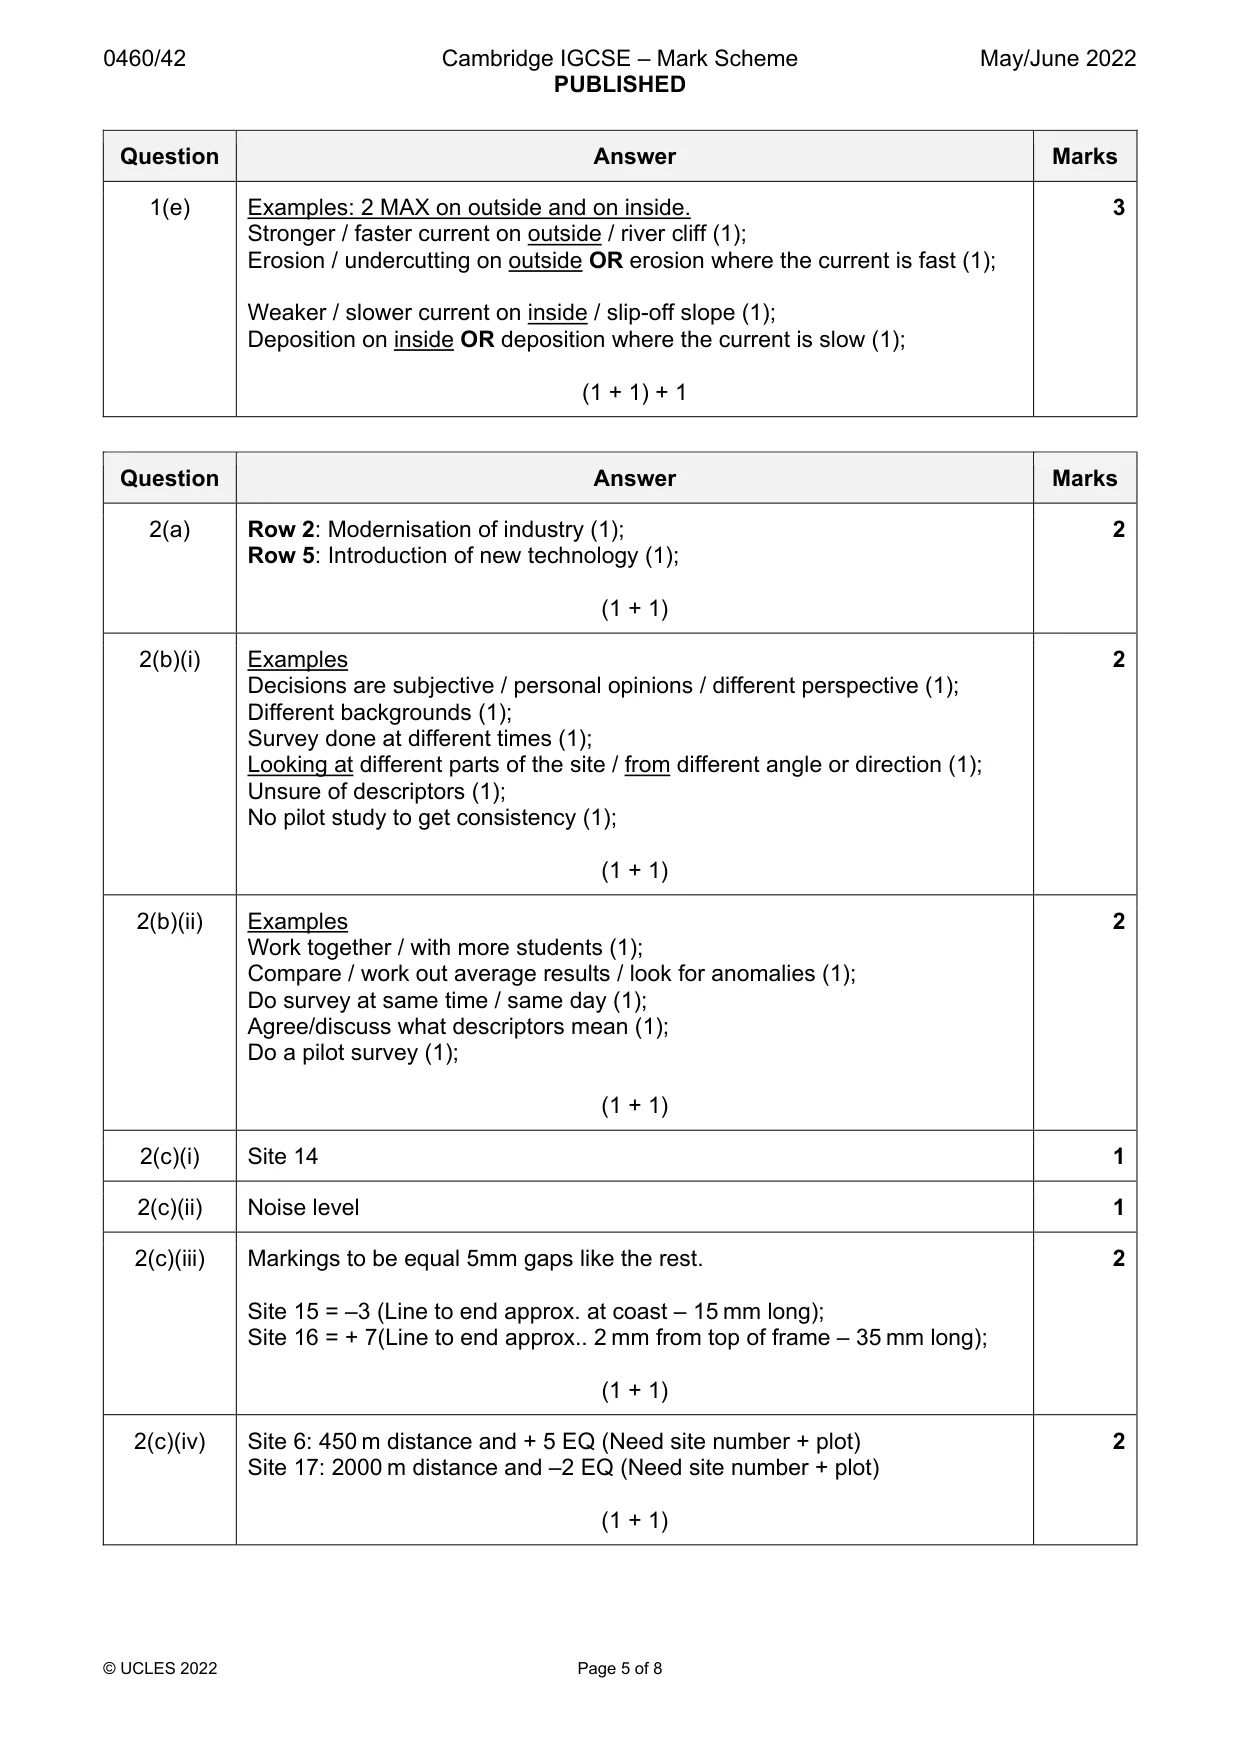
0460/42 Cambridge IGCSE – Mark Scheme PUBLISHED May/June 2022 © UCLES 2022 Page 3 of 8 Question Answer Marks 1(a)(i) A stream which flows into / joins /links / connects to river (1) 1 1(a)(ii) Examples An area drained by a river (1) Where tributaries flow into a river (1) An area surrounded by a watershed (1) (1 + 1) 2 1(b)(i) Examples Use ranging poles to mark out certain distance / 5–10 m distance / at start and end of distance (1); Use tape measure to measure fixed distance / 5–10 m along river (1); OR: Put 2 ranging poles 10 m apart using a tape measure’ = 2 marks Put float (into river) at start of measured distance / at first pole (1); Start stopwatch / timer when float is put in river (1); Stop stopwatch / timer when float reaches end of measured distance / reaches second pole (1); Record time taken to travel measured distance (1); (1 + 1 + 1 + 1) 4 1(b)(ii) Average: 20.4 (seconds) If looks like 5 after 20.4 assume it’s an s. Velocity: 10 20.4 (1 + 1) 2 1(b)(iii) Examples Float may get stuck / obstructed / rocks / plants in way (1); Float may be affected by wind (1); Float doesn’t move in a straight line / takes different route (1); Student error in timing / measuring distance / putting float different place (1); (1 + 1) 2 1(c)(i) Middle of channel = 0.72 m / s; Outside bank (right side) = 0.77 m / s; 1 mark for each plot; ignore shading. (1 + 1) 2
Mark scheme, page 4
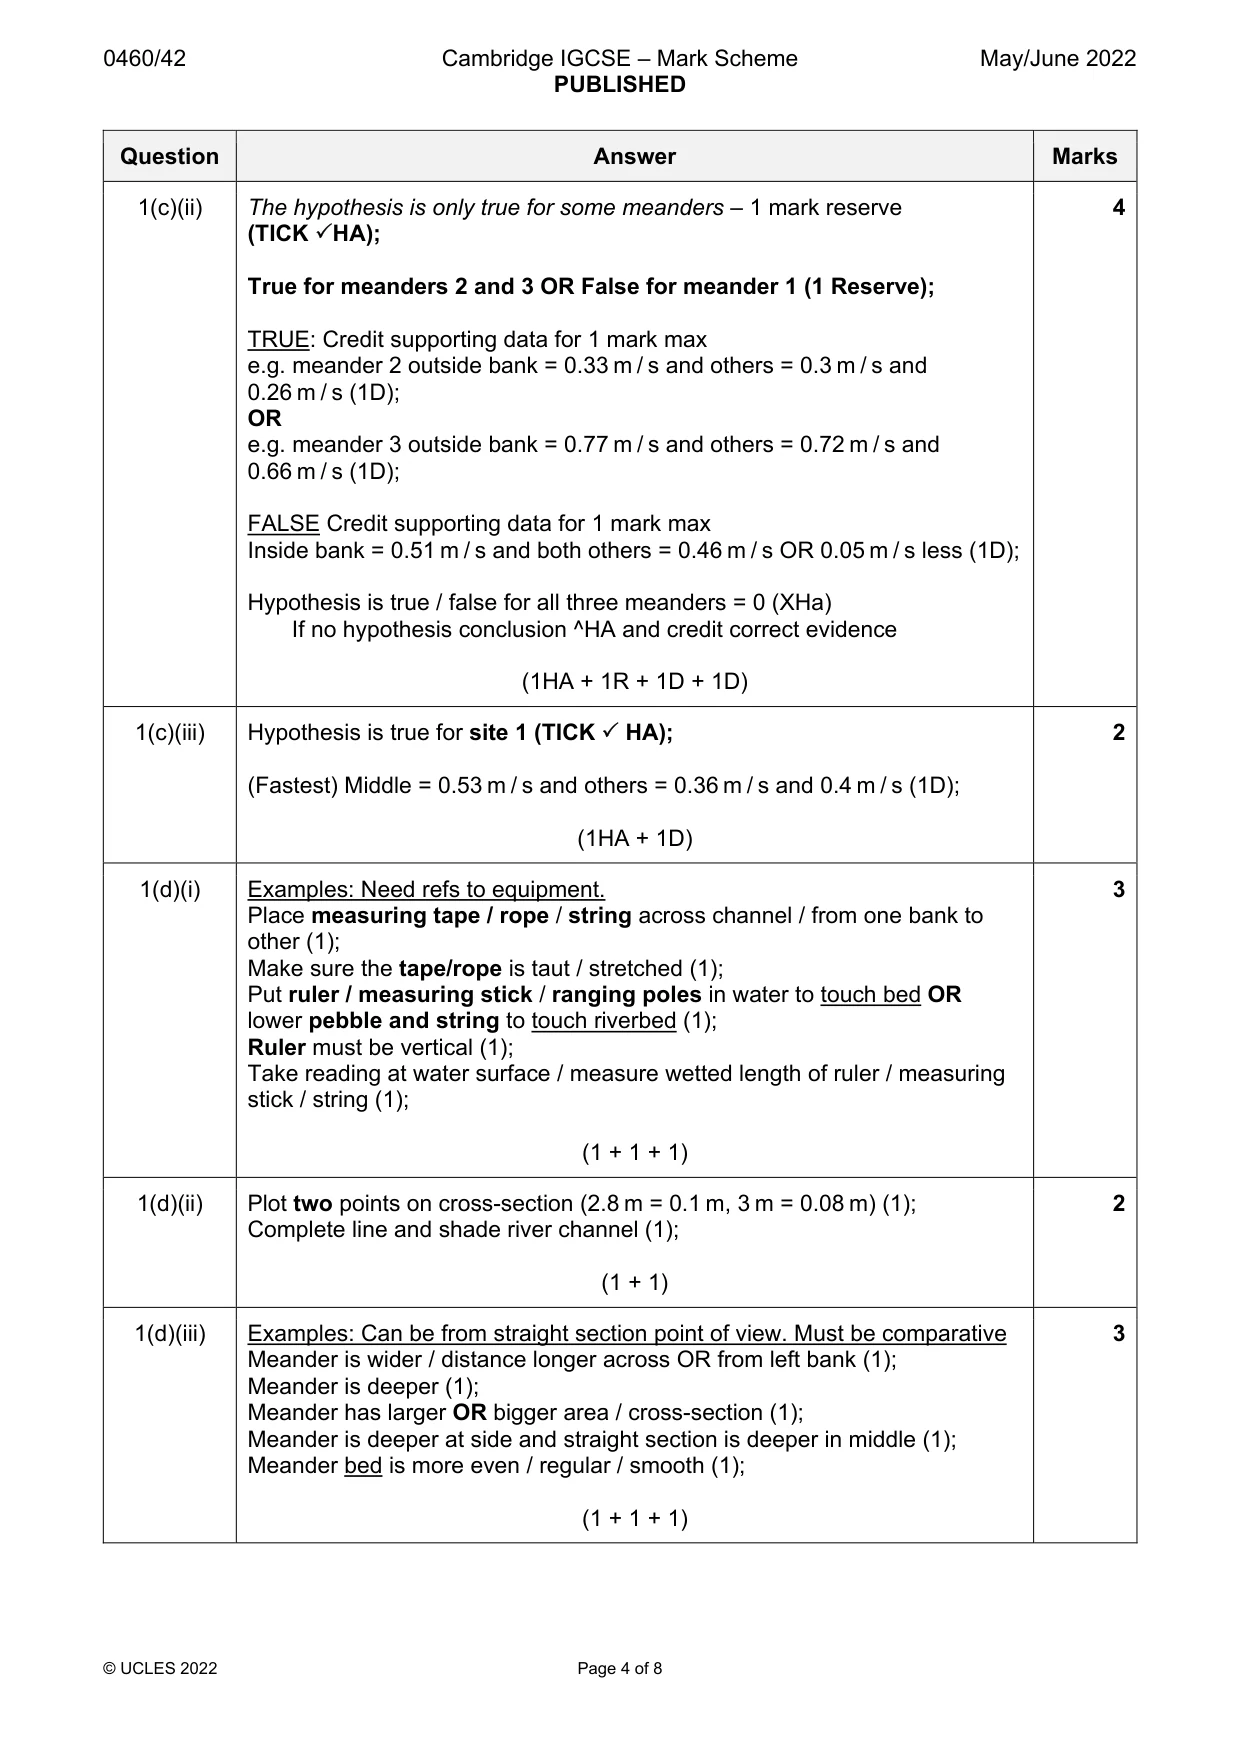
0460/42 Cambridge IGCSE – Mark Scheme PUBLISHED May/June 2022 © UCLES 2022 Page 4 of 8 Question Answer Marks 1(c)(ii) The hypothesis is only true for some meanders – 1 mark reserve (TICK HA); True for meanders 2 and 3 OR False for meander 1 (1 Reserve); TRUE: Credit supporting data for 1 mark max e.g. meander 2 outside bank = 0.33 m / s and others = 0.3 m / s and 0.26 m / s (1D); OR e.g. meander 3 outside bank = 0.77 m / s and others = 0.72 m / s and 0.66 m / s (1D); FALSE Credit supporting data for 1 mark max Inside bank = 0.51 m / s and both others = 0.46 m / s OR 0.05 m / s less (1D); Hypothesis is true / false for all three meanders = 0 (XHa) If no hypothesis conclusion ^HA and credit correct evidence (1HA + 1R + 1D + 1D) 4 1(c)(iii) Hypothesis is true for site 1 (TICK HA); (Fastest) Middle = 0.53 m / s and others = 0.36 m / s and 0.4 m / s (1D); (1HA + 1D) 2 1(d)(i) Examples: Need refs to equipment. Place measuring tape / rope / string across channel / from one bank to other (1); Make sure the tape/rope is taut / stretched (1); Put ruler / measuring stick / ranging poles in water to touch bed OR lower pebble and string to touch riverbed (1); Ruler must be vertical (1); Take reading at water surface / measure wetted length of ruler / measuring stick / string (1); (1 + 1 + 1) 3 1(d)(ii) Plot two points on cross-section (2.8 m = 0.1 m, 3 m = 0.08 m) (1); Complete line and shade river channel (1); (1 + 1) 2 1(d)(iii) Examples: Can be from straight section point of view. Must be comparative Meander is wider / distance longer across OR from left bank (1); Meander is deeper (1); Meander has larger OR bigger area / cross-section (1); Meander is deeper at side and straight section is deeper in middle (1); Meander bed is more even / regular / smooth (1); (1 + 1 + 1) 3
Mark scheme, page 5
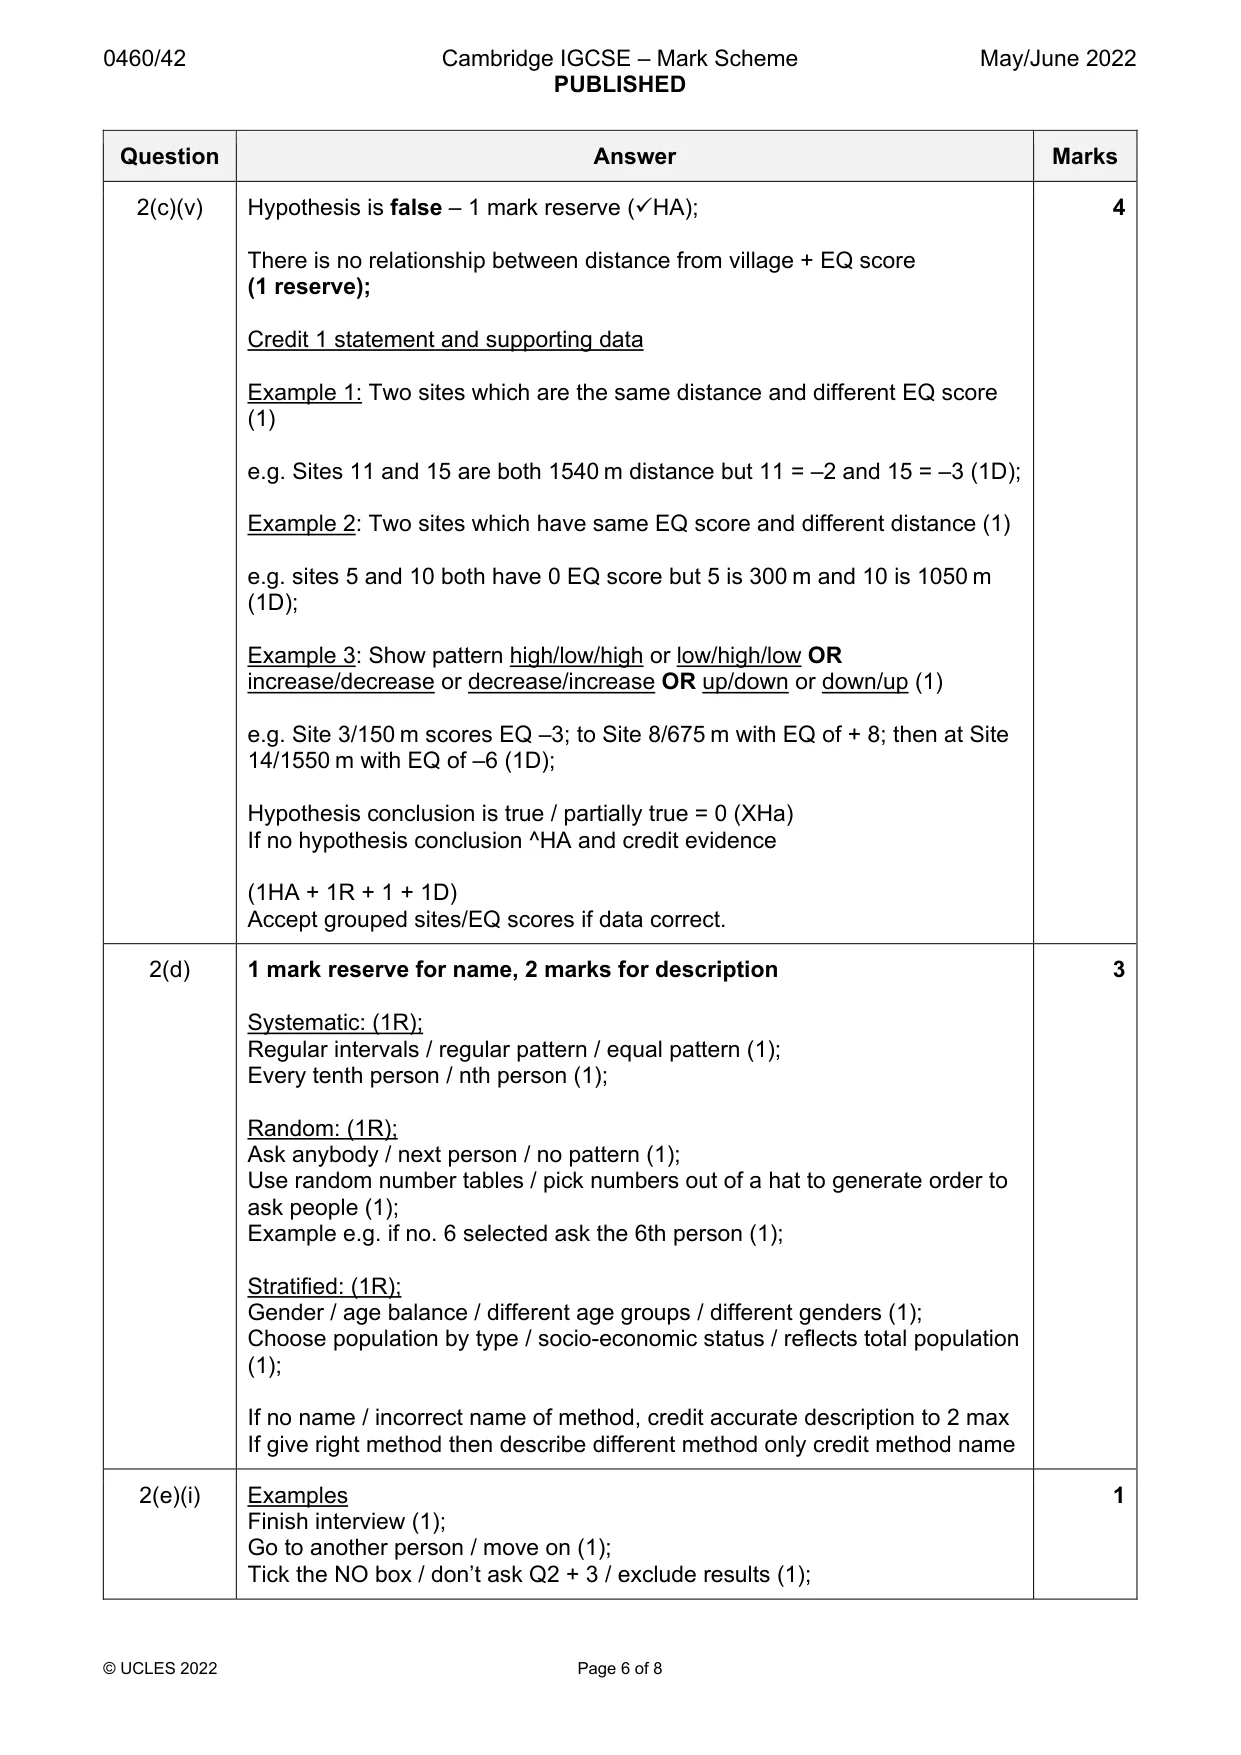
0460/42 Cambridge IGCSE – Mark Scheme PUBLISHED May/June 2022 © UCLES 2022 Page 5 of 8 Question Answer Marks 1(e) Examples: 2 MAX on outside and on inside. Stronger / faster current on outside / river cliff (1); Erosion / undercutting on outside OR erosion where the current is fast (1); Weaker / slower current on inside / slip-off slope (1); Deposition on inside OR deposition where the current is slow (1); (1 + 1) + 1 3 Question Answer Marks 2(a) Row 2: Modernisation of industry (1); Row 5: Introduction of new technology (1); (1 + 1) 2 2(b)(i) Examples Decisions are subjective / personal opinions / different perspective (1); Different backgrounds (1); Survey done at different times (1); Looking at different parts of the site / from different angle or direction (1); Unsure of descriptors (1); No pilot study to get consistency (1); (1 + 1) 2 2(b)(ii) Examples Work together / with more students (1); Compare / work out average results / look for anomalies (1); Do survey at same time / same day (1); Agree/discuss what descriptors mean (1); Do a pilot survey (1); (1 + 1) 2 2(c)(i) Site 14 1 2(c)(ii) Noise level 1 2(c)(iii) Markings to be equal 5mm gaps like the rest. Site 15 = –3 (Line to end approx. at coast – 15 mm long); Site 16 = + 7(Line to end approx.. 2 mm from top of frame – 35 mm long); (1 + 1) 2 2(c)(iv) Site 6: 450 m distance and + 5 EQ (Need site number + plot) Site 17: 2000 m distance and –2 EQ (Need site number + plot) (1 + 1) 2
Mark scheme, page 6
0460/42 Cambridge IGCSE – Mark Scheme PUBLISHED May/June 2022 © UCLES 2022 Page 6 of 8 Question Answer Marks 2(c)(v) Hypothesis is false – 1 mark reserve (HA); There is no relationship between distance from village + EQ score (1 reserve); Credit 1 statement and supporting data Example 1: Two sites which are the same distance and different EQ score (1) e.g. Sites 11 and 15 are both 1540 m distance but 11 = –2 and 15 = –3 (1D); Example 2: Two sites which have same EQ score and different distance (1) e.g. sites 5 and 10 both have 0 EQ score but 5 is 300 m and 10 is 1050 m (1D); Example 3: Show pattern high/low/high or low/high/low OR increase/decrease or decrease/increase OR up/down or down/up (1) e.g. Site 3/150 m scores EQ –3; to Site 8/675 m with EQ of + 8; then at Site 14/1550 m with EQ of –6 (1D); Hypothesis conclusion is true / partially true = 0 (XHa) If no hypothesis conclusion ^HA and credit evidence (1HA + 1R + 1 + 1D) Accept grouped sites/EQ scores if data correct. 4 2(d) 1 mark reserve for name, 2 marks for description Systematic: (1R); Regular intervals / regular pattern / equal pattern (1); Every tenth person / nth person (1); Random: (1R); Ask anybody / next person / no pattern (1); Use random number tables / pick numbers out of a hat to generate order to ask people (1); Example e.g. if no. 6 selected ask the 6th person (1); Stratified: (1R); Gender / age balance / different age groups / different genders (1); Choose population by type / socio-economic status / reflects total population (1); If no name / incorrect name of method, credit accurate description to 2 max If give right method then describe different method only credit method name 3 2(e)(i) Examples Finish interview (1); Go to another person / move on (1); Tick the NO box / don’t ask Q2 + 3 / exclude results (1); 1
Mark scheme, page 7
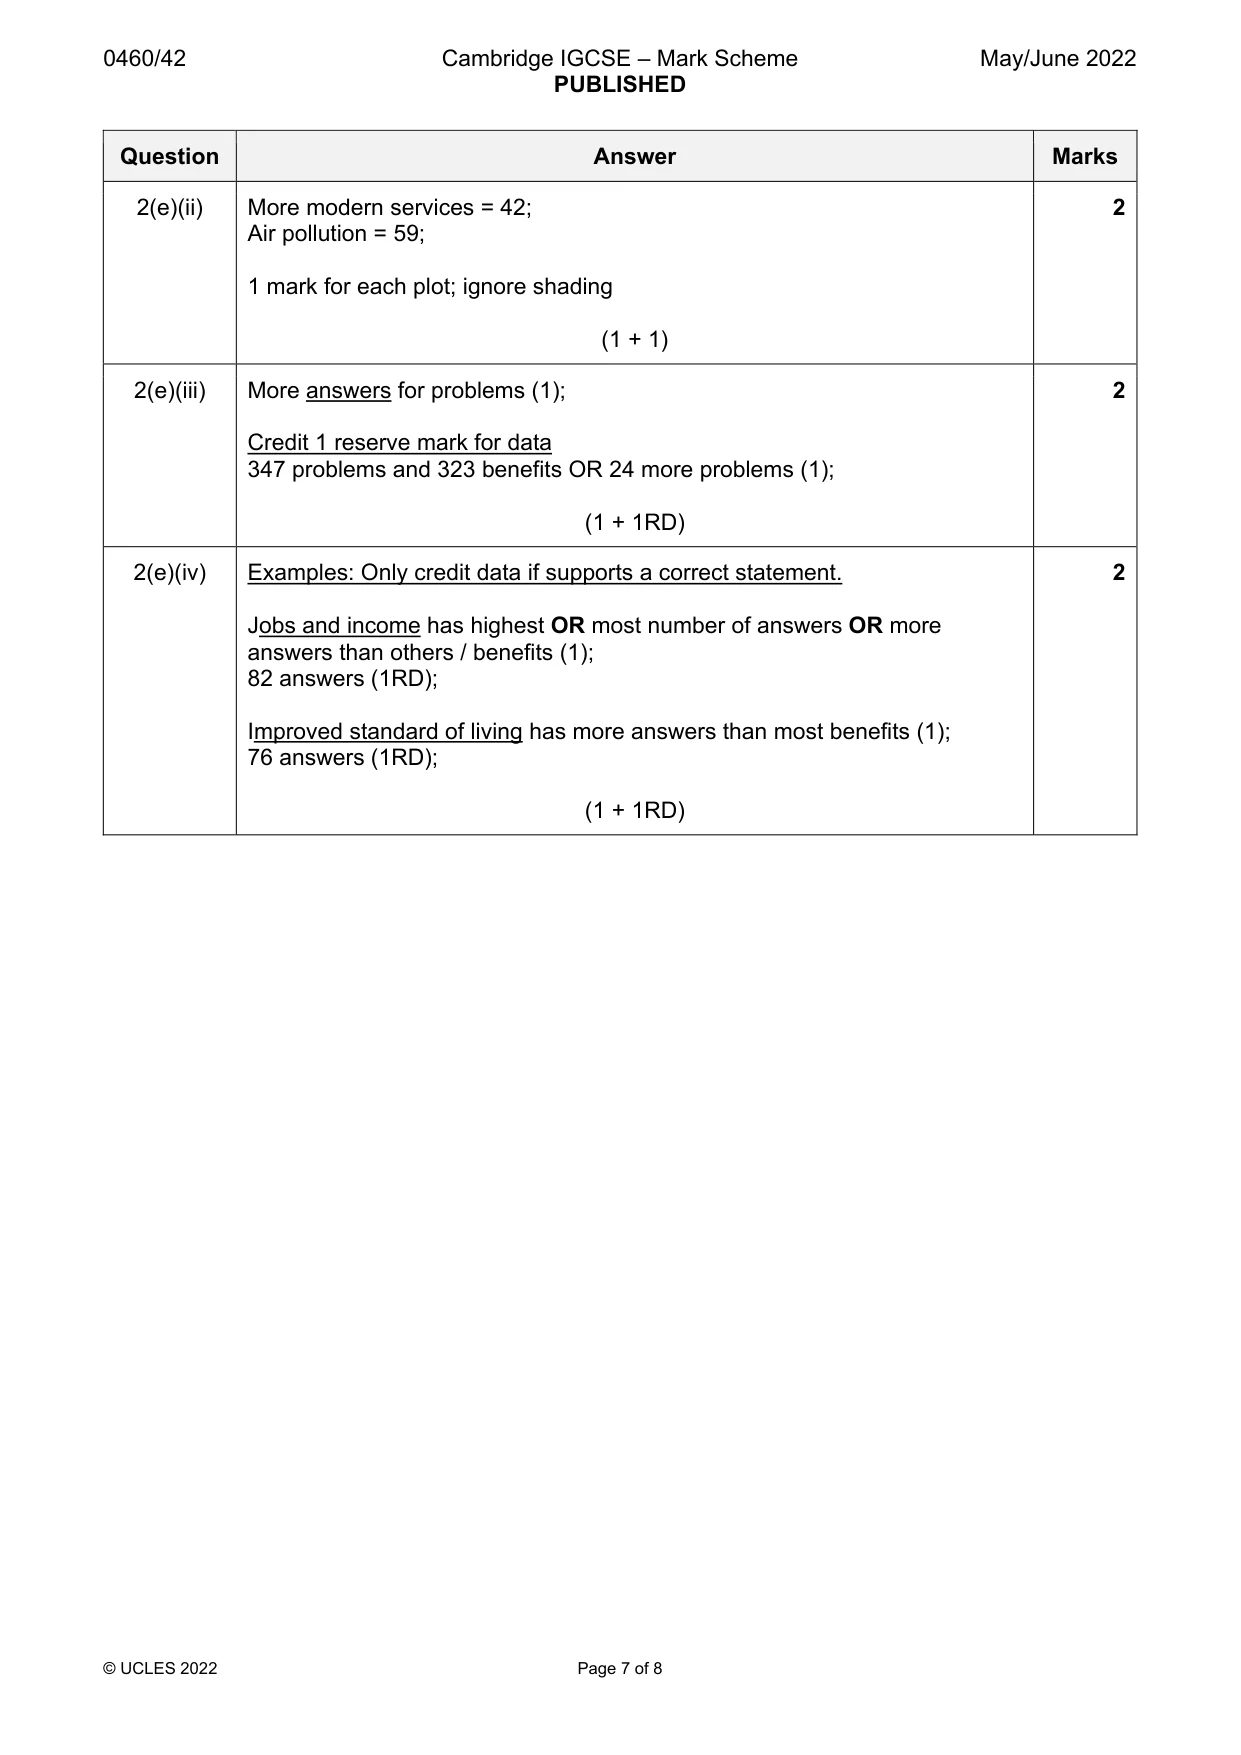
0460/42 Cambridge IGCSE – Mark Scheme PUBLISHED May/June 2022 © UCLES 2022 Page 7 of 8 Question Answer Marks 2(e)(ii) More modern services = 42; Air pollution = 59; 1 mark for each plot; ignore shading (1 + 1) 2 2(e)(iii) More answers for problems (1); Credit 1 reserve mark for data 347 problems and 323 benefits OR 24 more problems (1); (1 + 1RD) 2 2(e)(iv) Examples: Only credit data if supports a correct statement. Jobs and income has highest OR most number of answers OR more answers than others / benefits (1); 82 answers (1RD); Improved standard of living has more answers than most benefits (1); 76 answers (1RD); (1 + 1RD) 2
Mark scheme, page 8
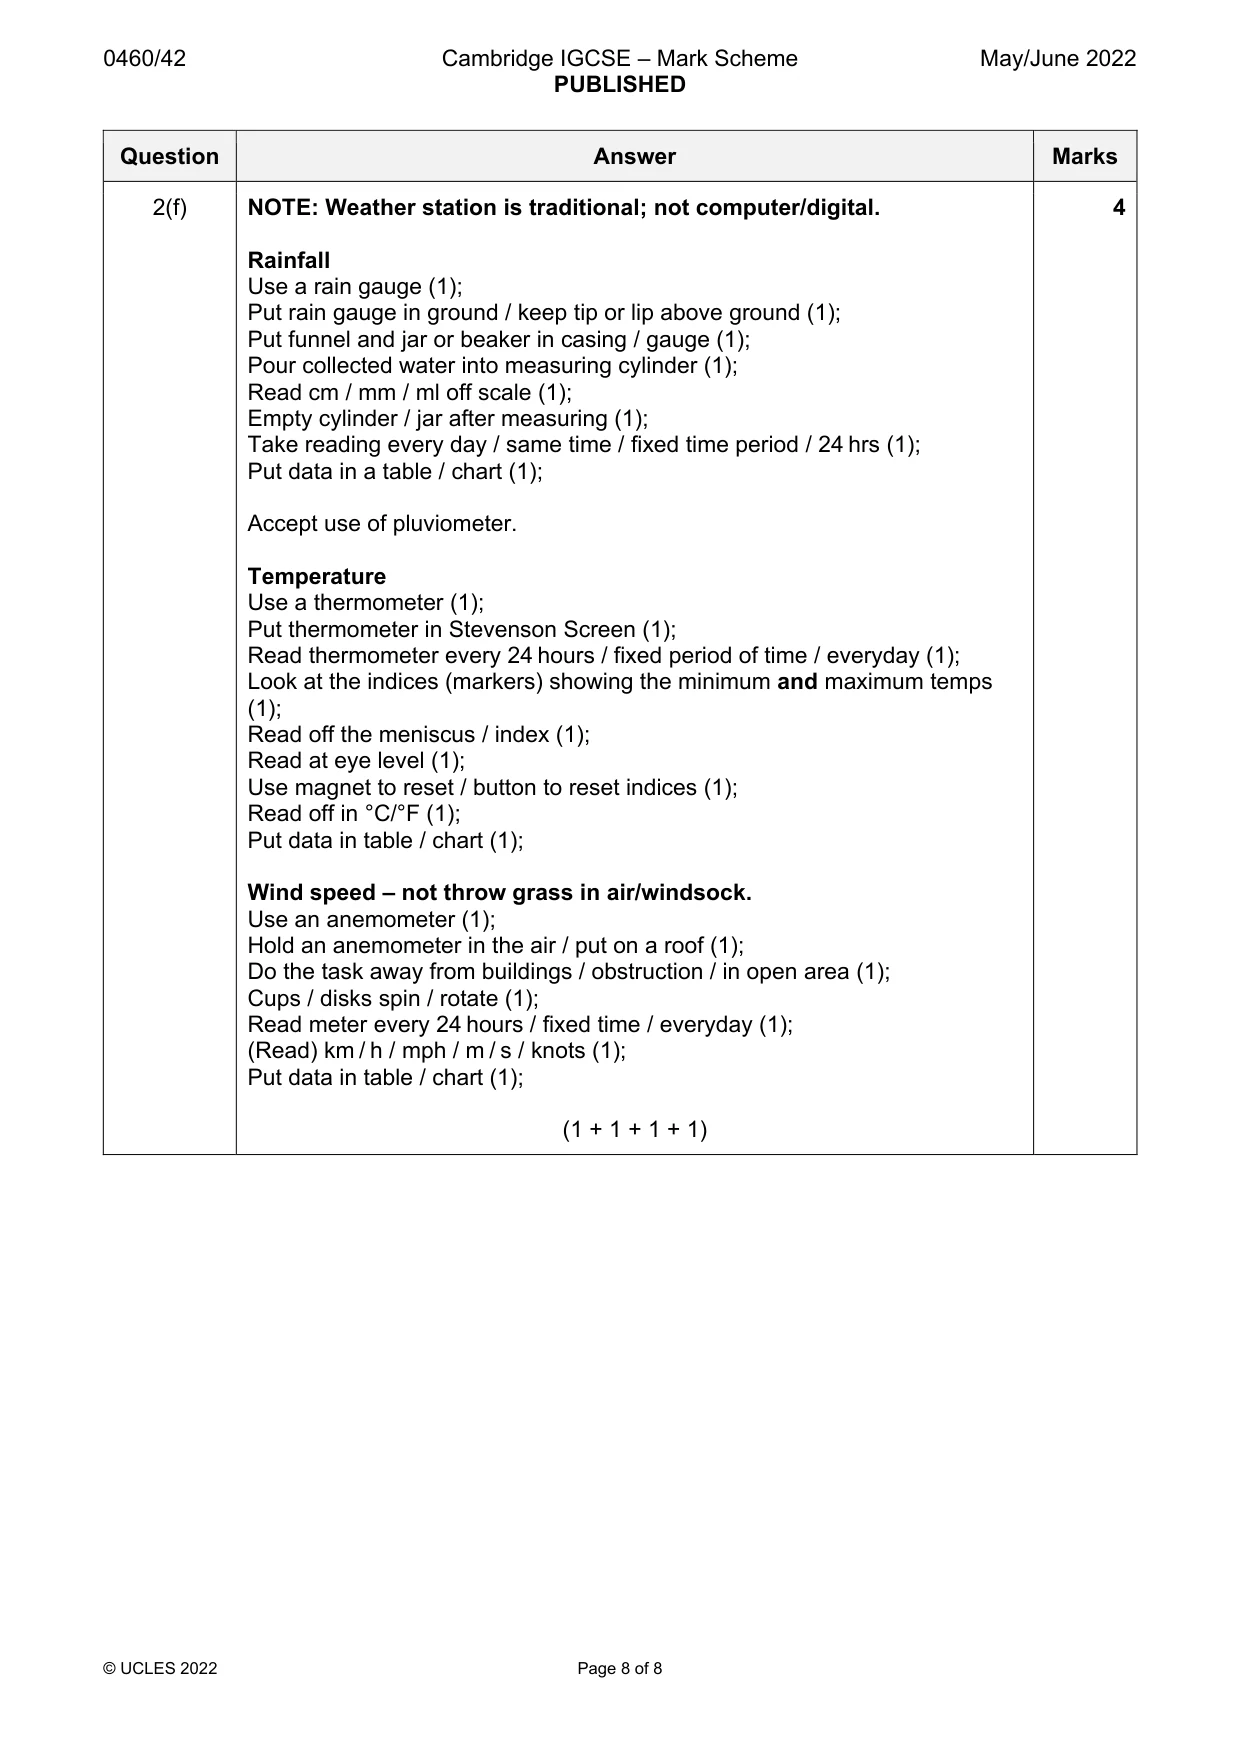
0460/42 Cambridge IGCSE – Mark Scheme PUBLISHED May/June 2022 © UCLES 2022 Page 8 of 8 Question Answer Marks 2(f) NOTE: Weather station is traditional; not computer/digital. Rainfall Use a rain gauge (1); Put rain gauge in ground / keep tip or lip above ground (1); Put funnel and jar or beaker in casing / gauge (1); Pour collected water into measuring cylinder (1); Read cm / mm / ml off scale (1); Empty cylinder / jar after measuring (1); Take reading every day / same time / fixed time period / 24 hrs (1); Put data in a table / chart (1); Accept use of pluviometer. Temperature Use a thermometer (1); Put thermometer in Stevenson Screen (1); Read thermometer every 24 hours / fixed period of time / everyday (1); Look at the indices (markers) showing the minimum and maximum temps (1); Read off the meniscus / index (1); Read at eye level (1); Use magnet to reset / button to reset indices (1); Read off in °C/°F (1); Put data in table / chart (1); Wind speed – not throw grass in air/windsock. Use an anemometer (1); Hold an anemometer in the air / put on a roof (1); Do the task away from buildings / obstruction / in open area (1); Cups / disks spin / rotate (1); Read meter every 24 hours / fixed time / everyday (1); (Read) km / h / mph / m / s / knots (1); Put data in table / chart (1); (1 + 1 + 1 + 1) 4
What you needed in this session
Cambridge’s own grade thresholds for 2022 May/June, Paper 4 · Variant 2. A higher threshold means an easier paper — the bar moves with how the cohort did.