Cambridge IGCSE Geography 0460 — 2020 Oct/Nov Paper 4 · Variant 3
0460/43/O/N/20 · 2 questions · 60 marks · ≈68 min
The question paper and its mark scheme, free to read here and free to download. This is Cambridge’s own paper, exactly as it was sat.
Question paper20 pages




Mark scheme9 pages
Answers below. Sit the paper first if you are practising.
Questions as text
Q1 · Students investigated differences in weather in a city centre square
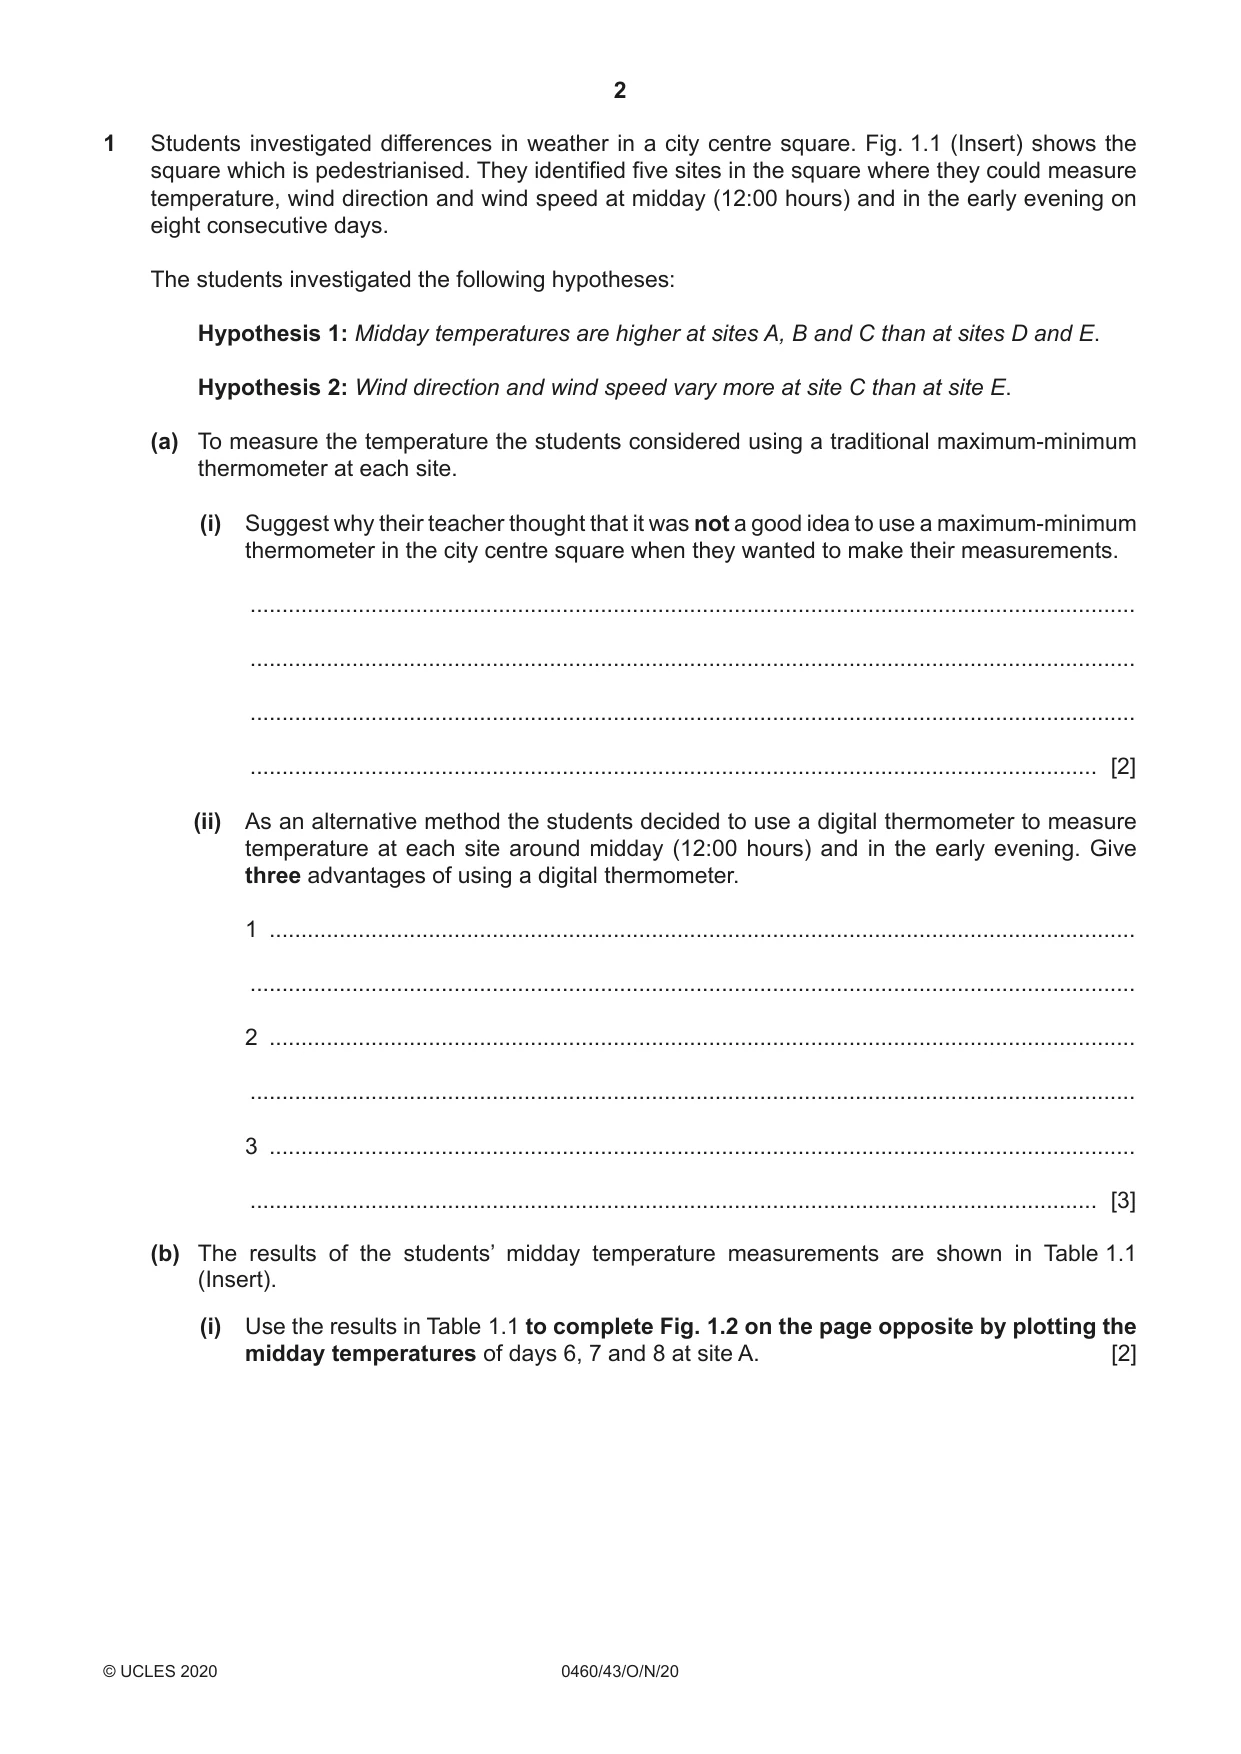
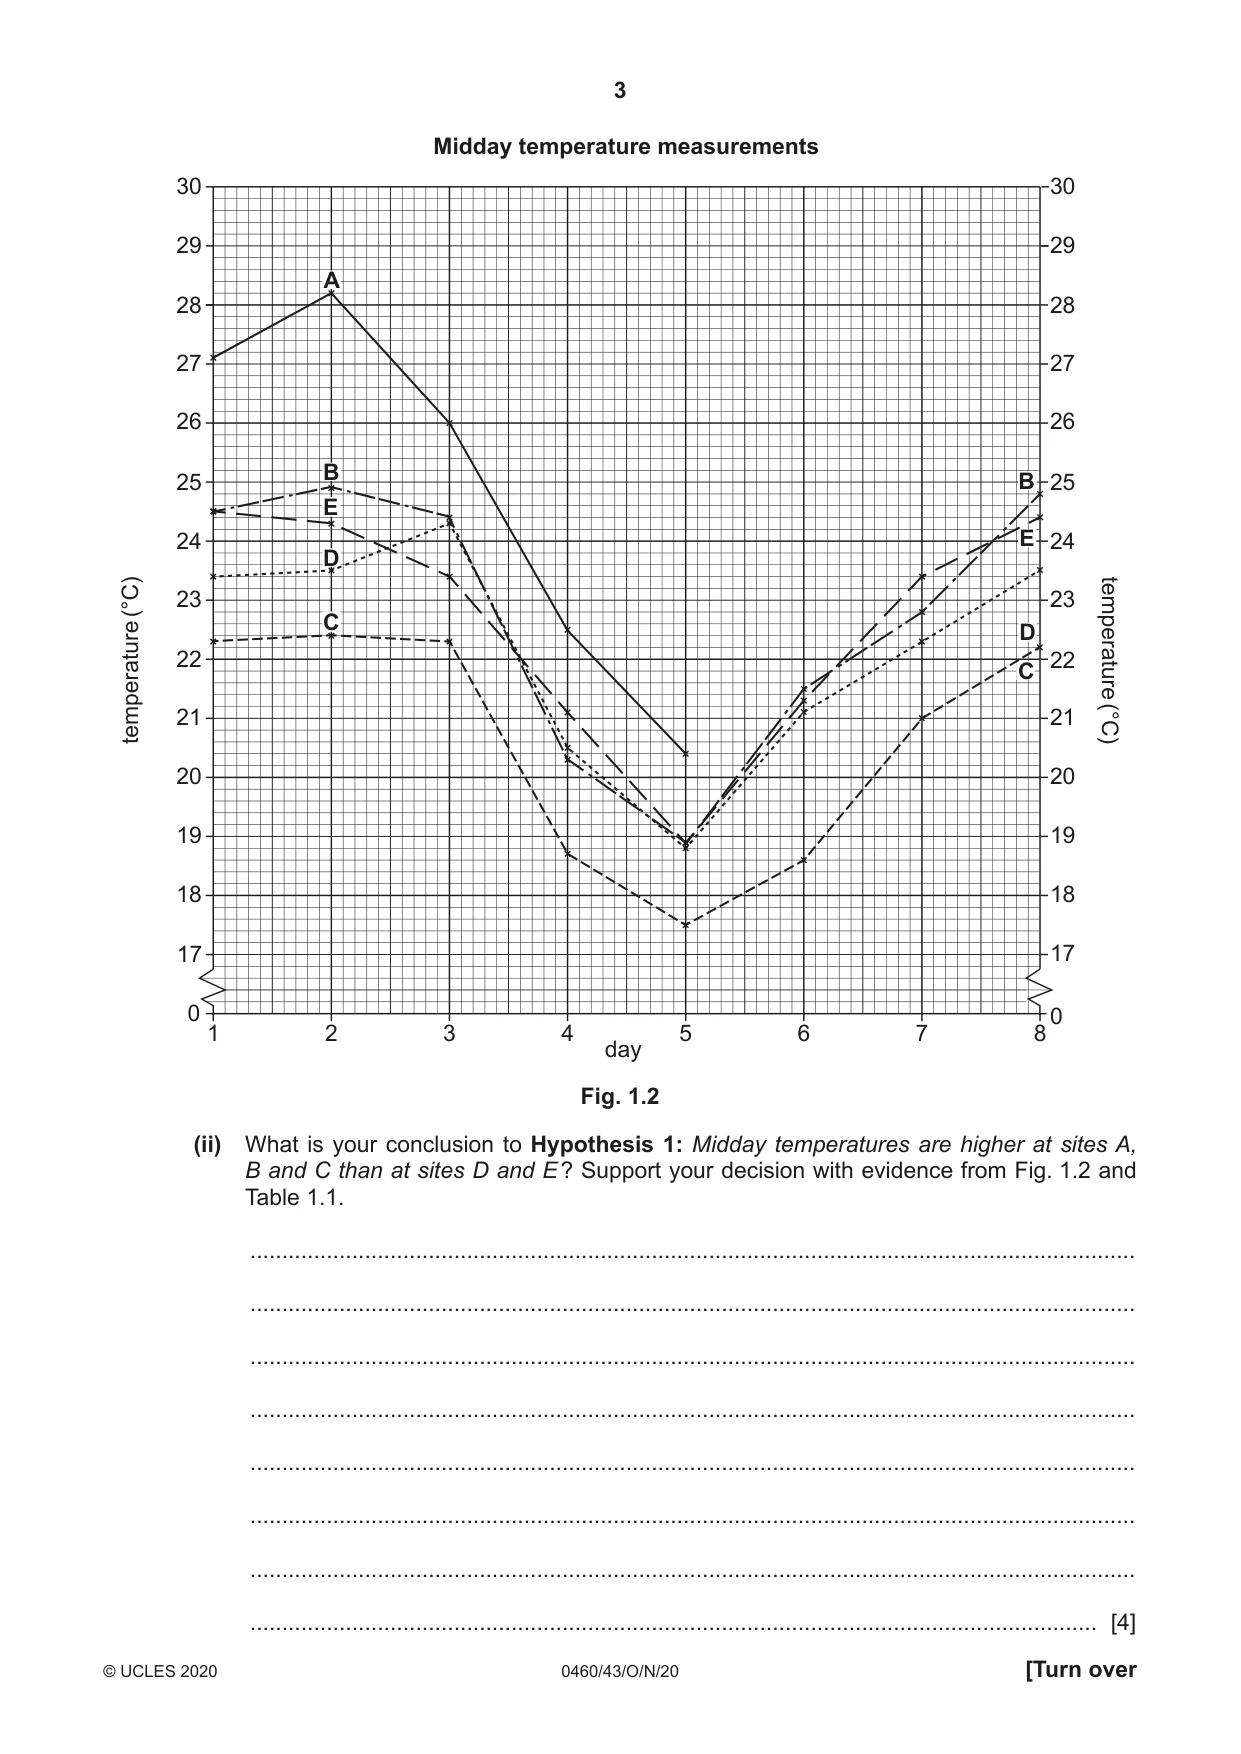
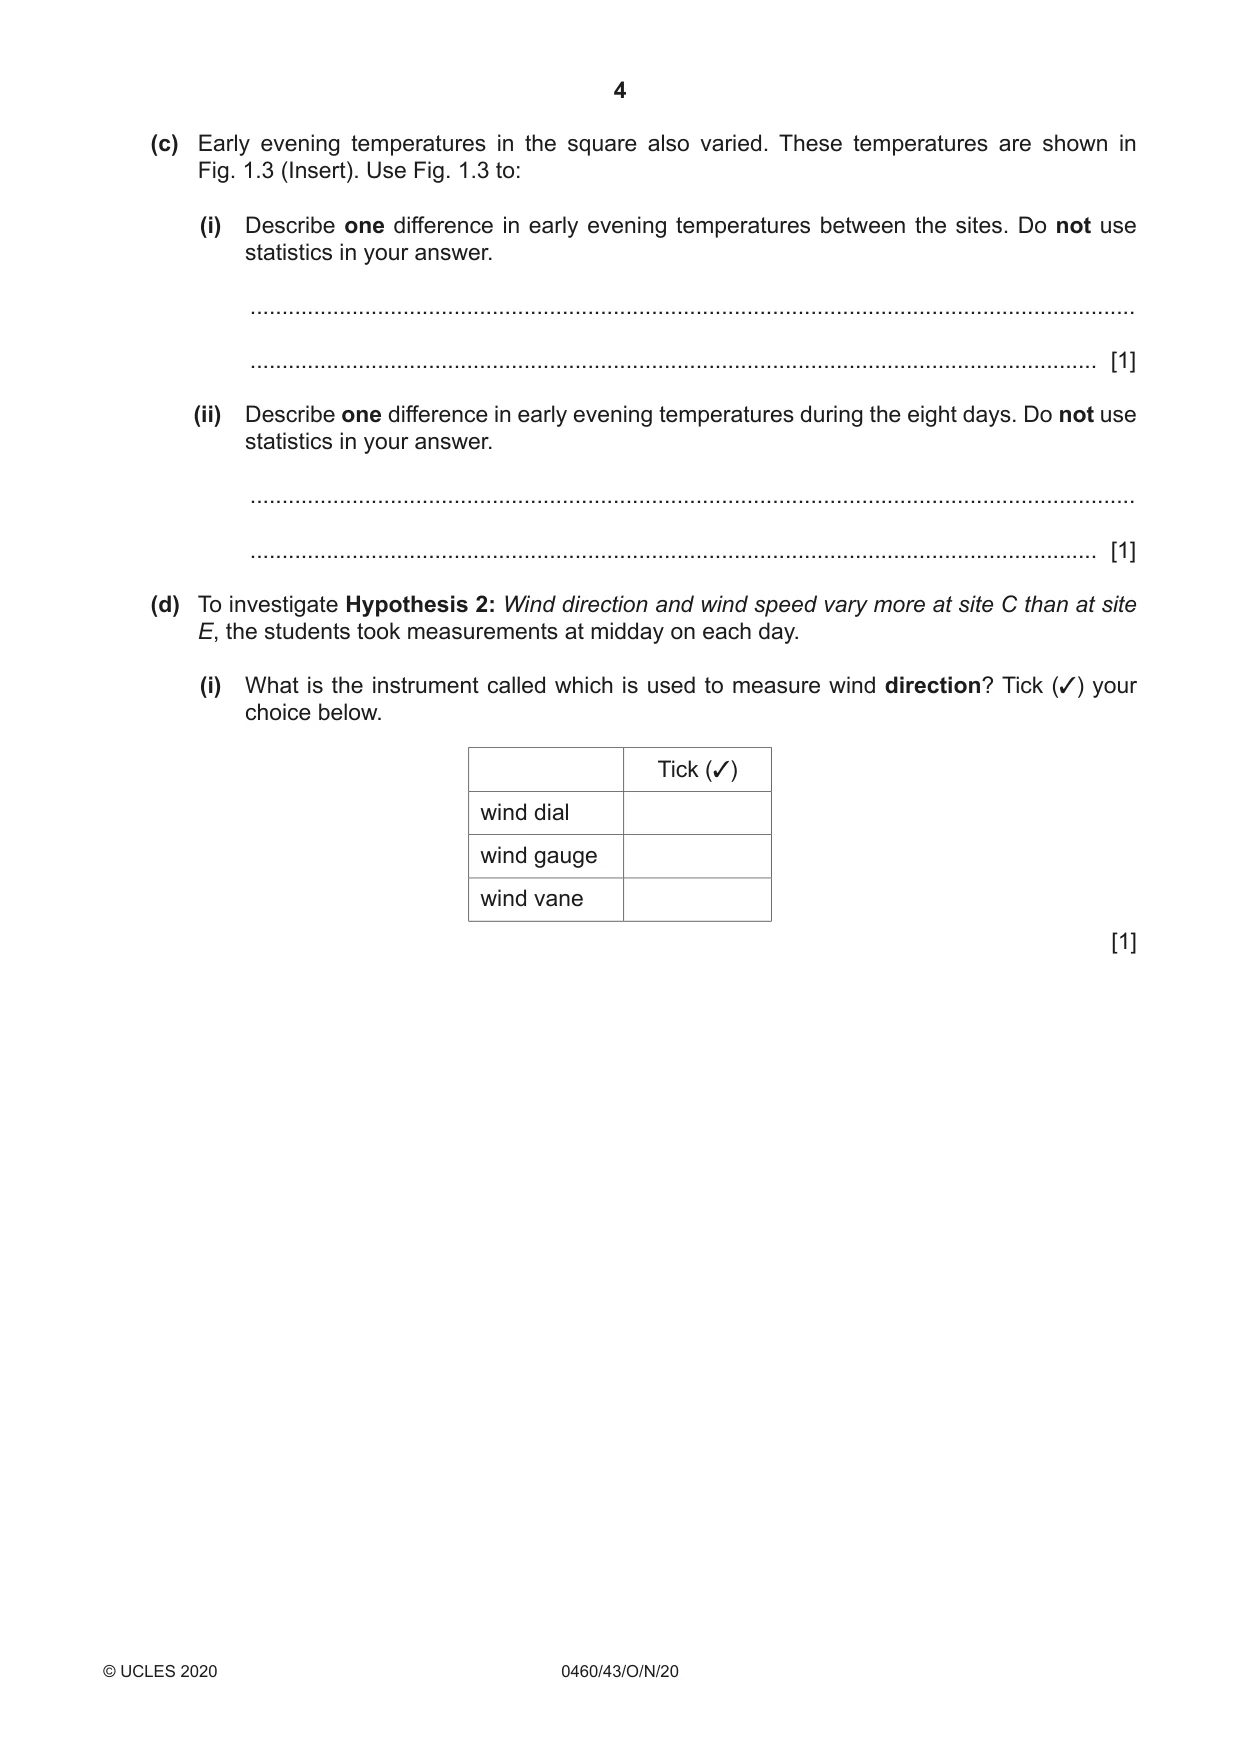
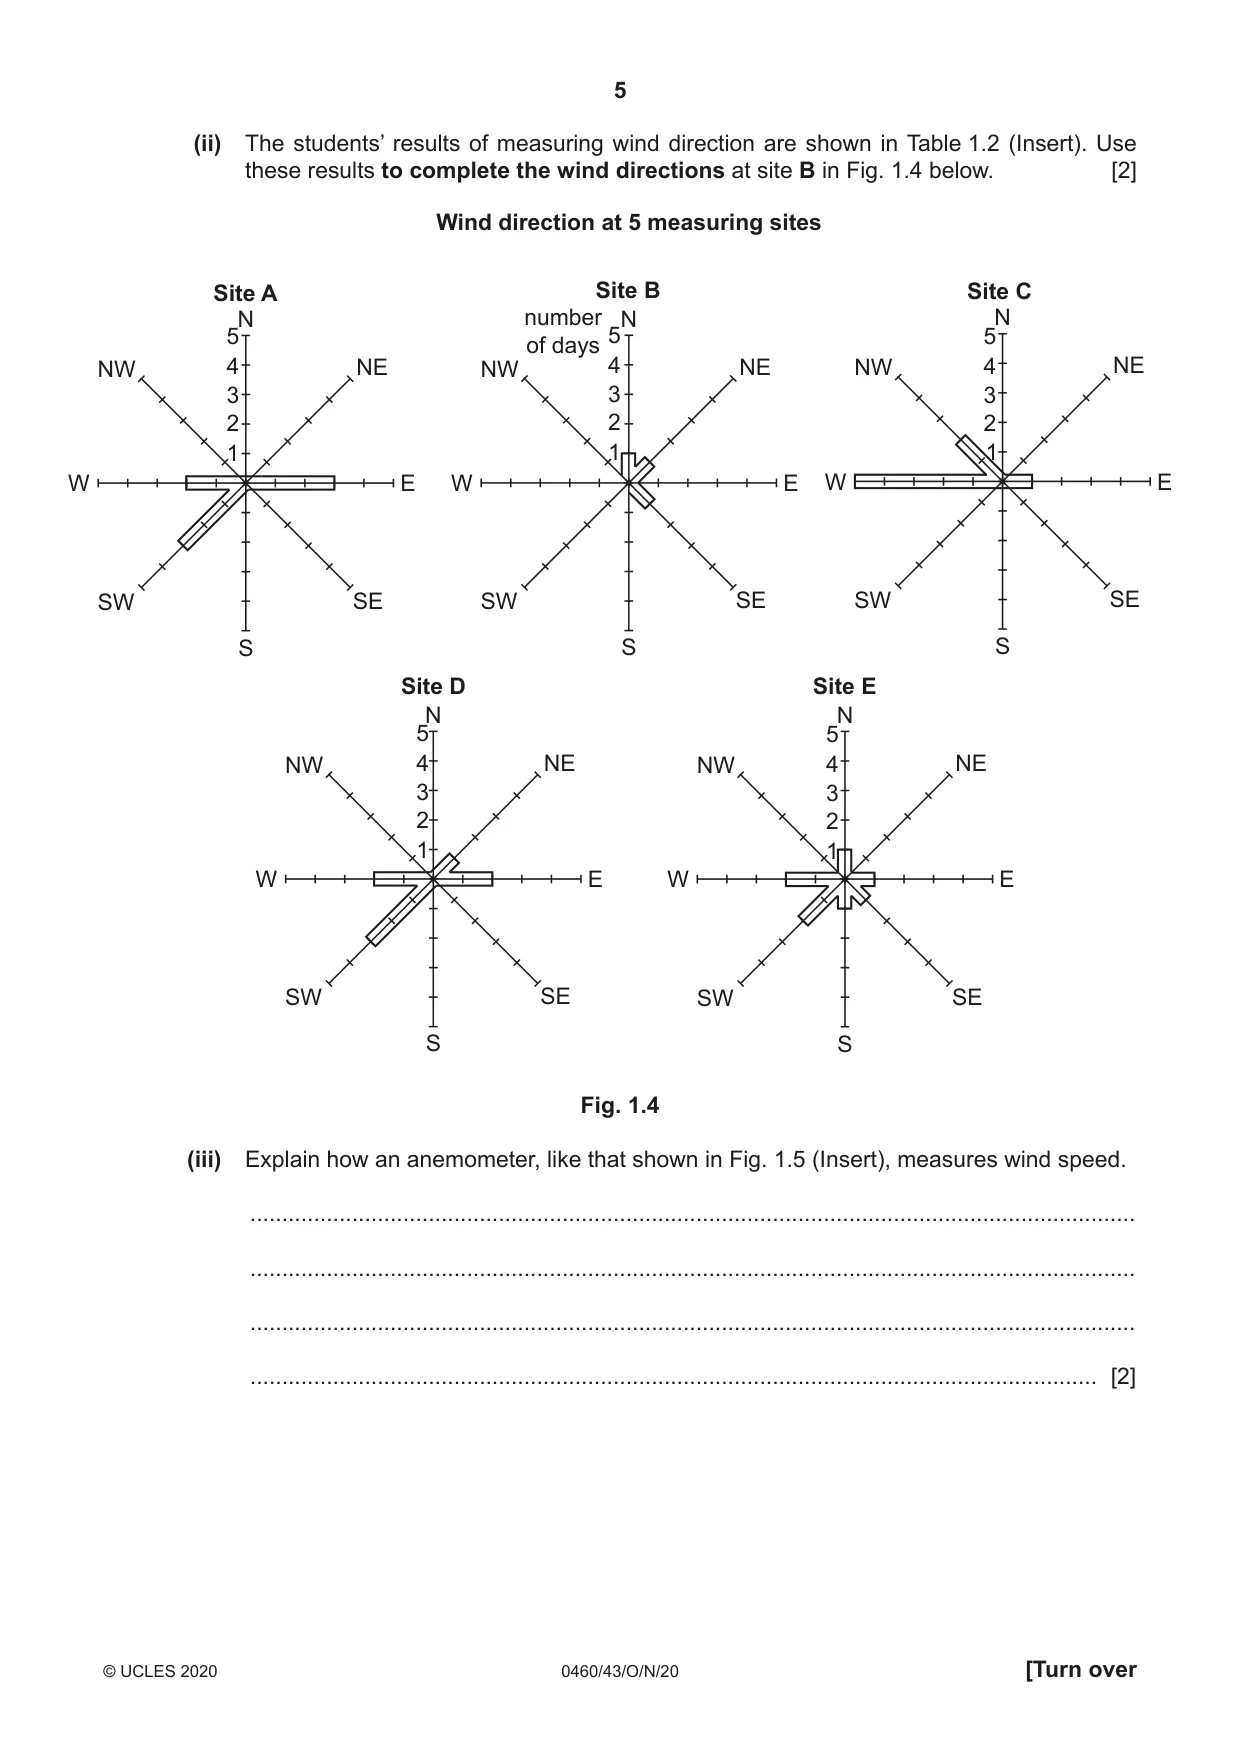
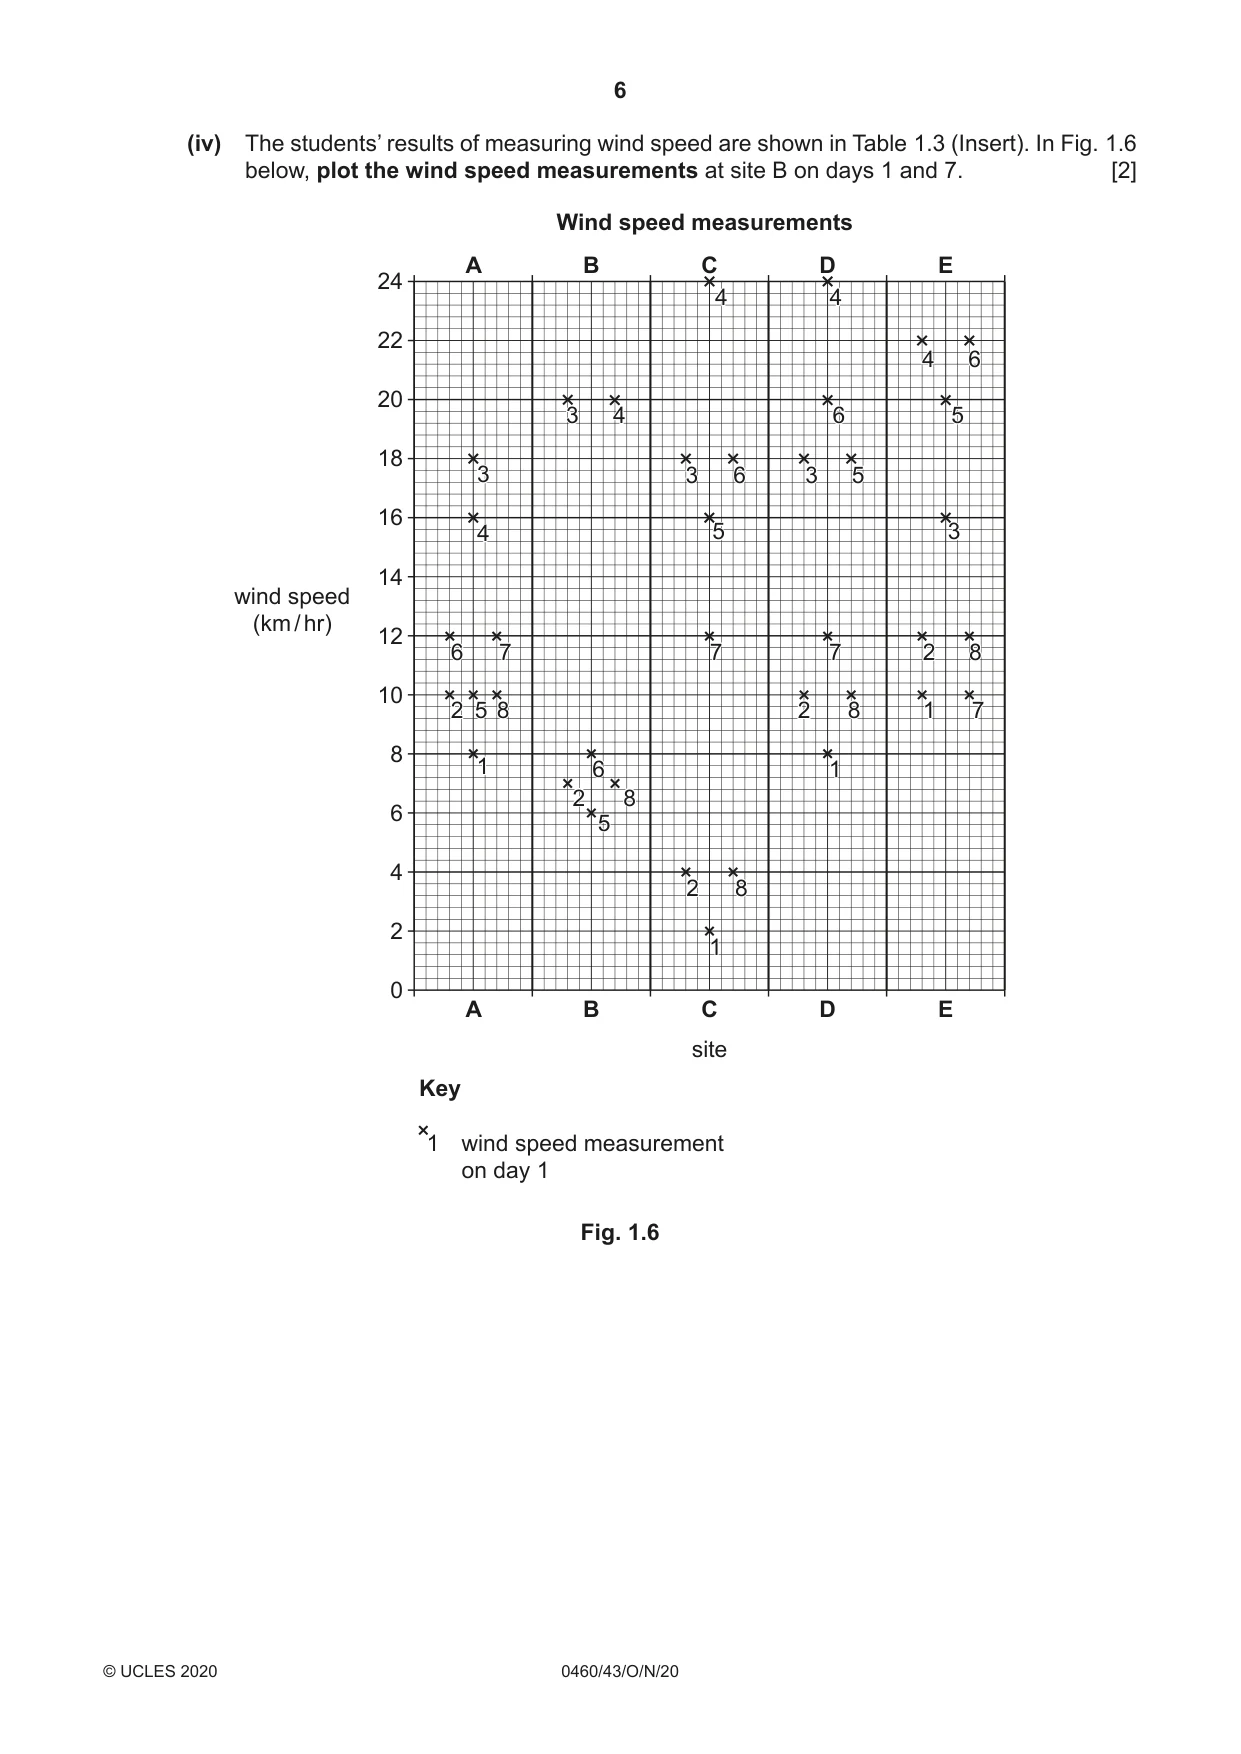
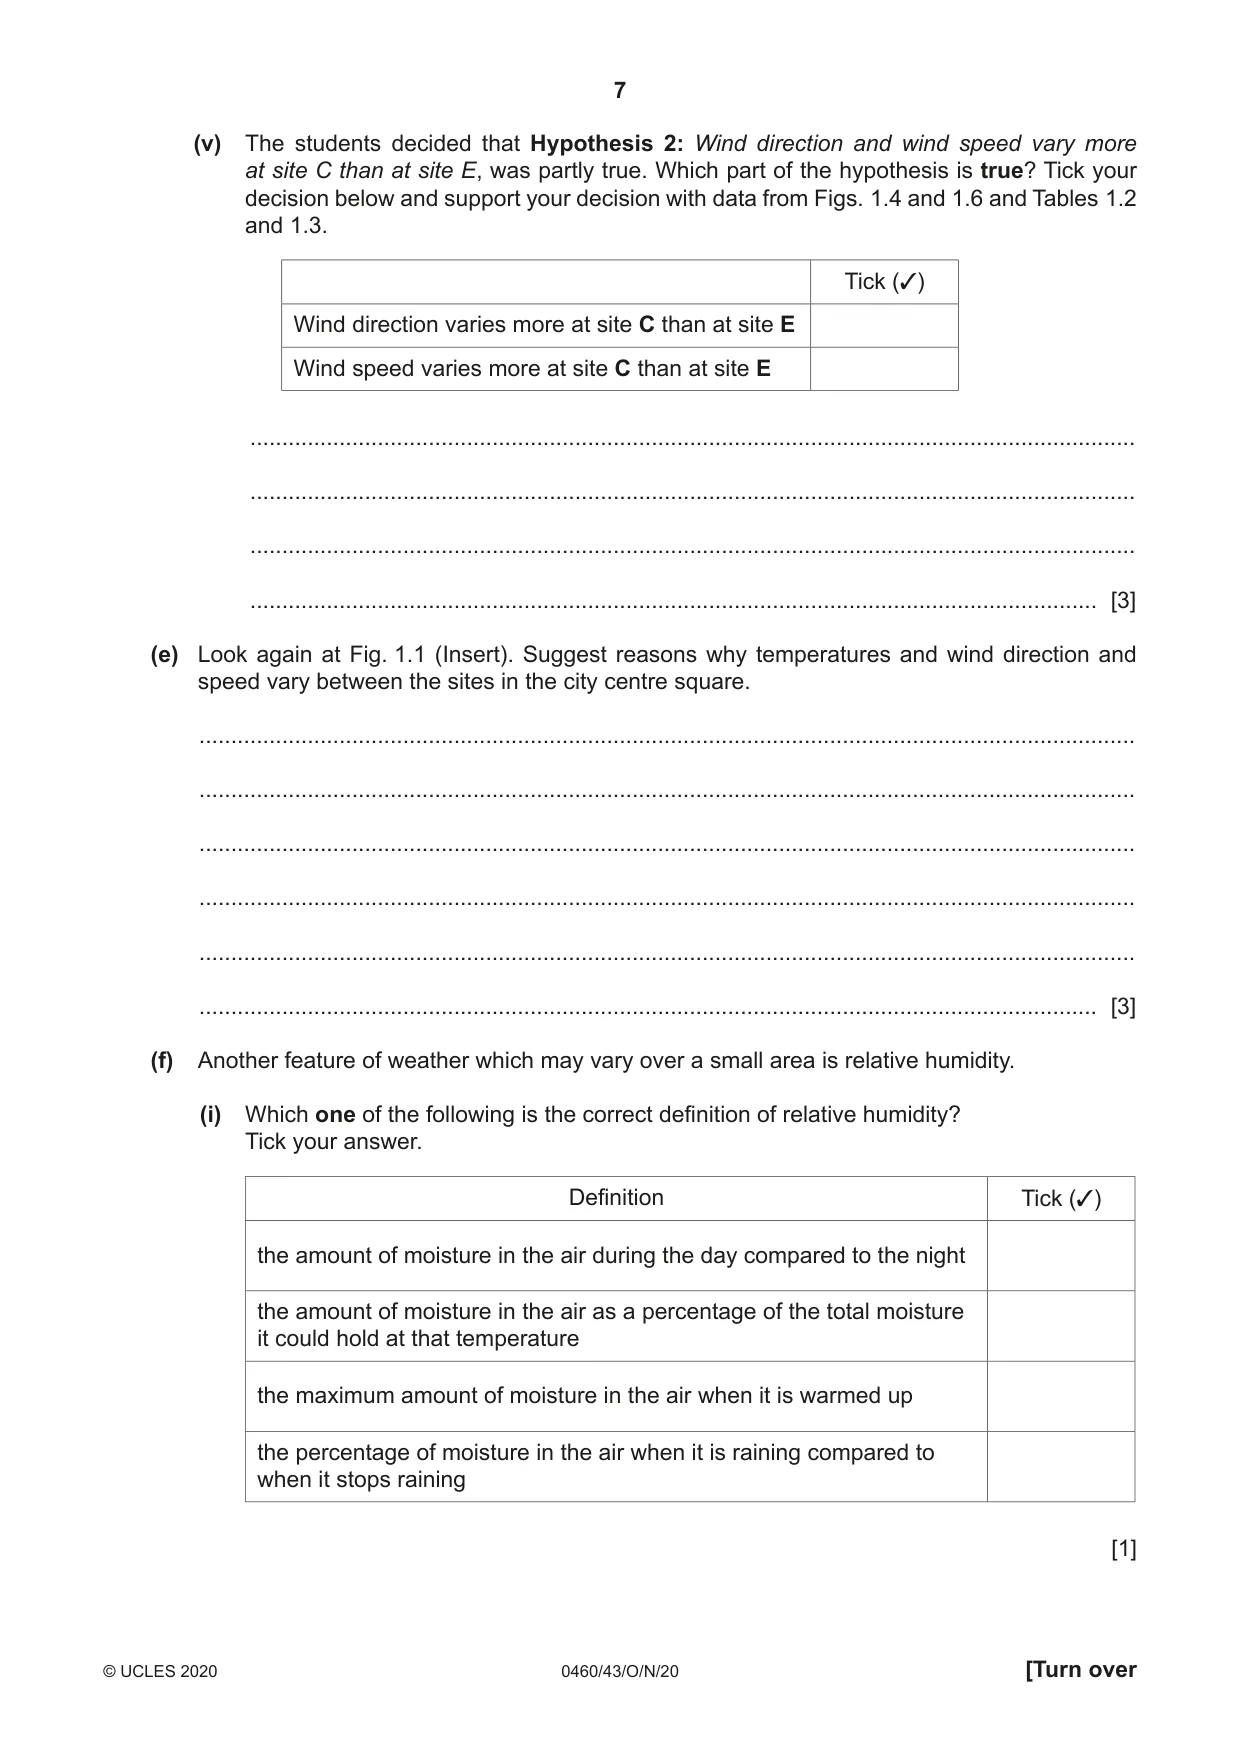
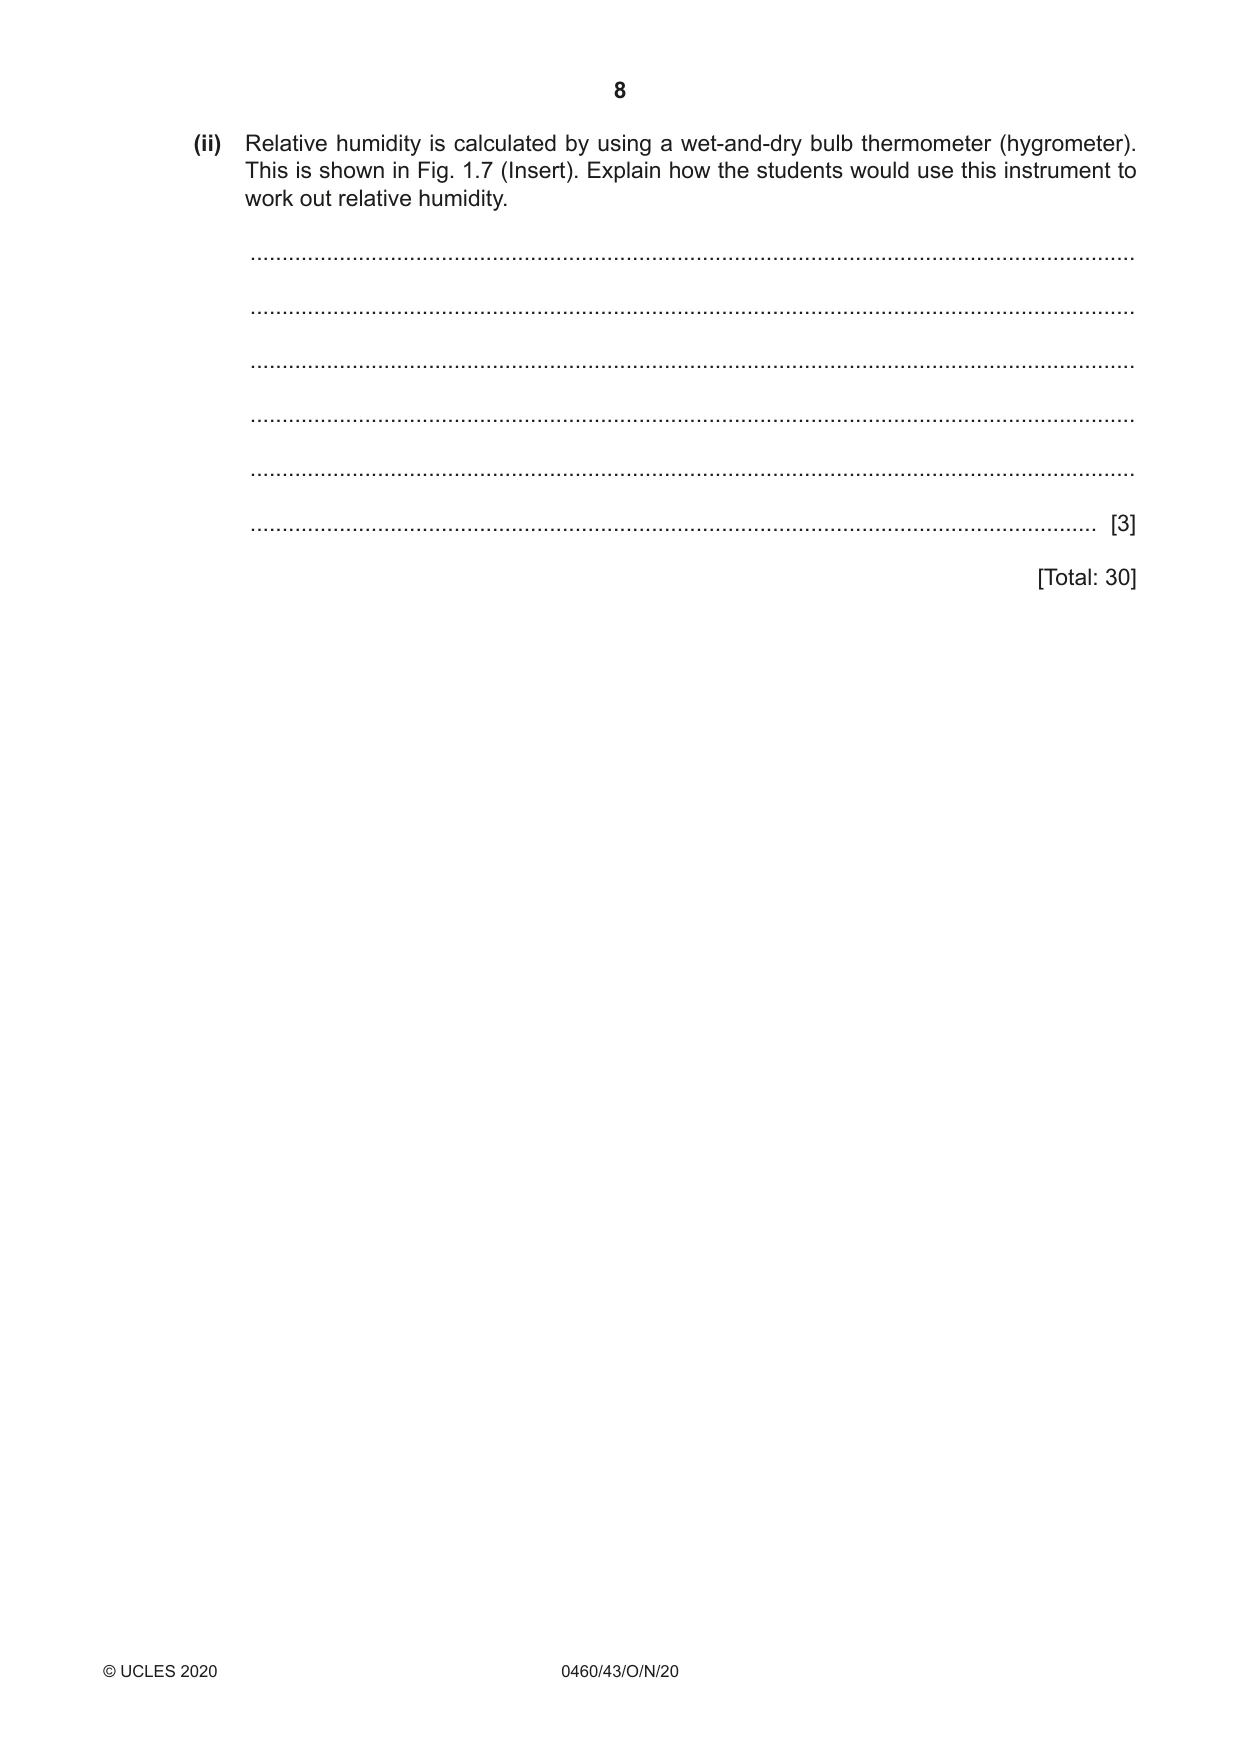
1 Students investigated differences in weather in a city centre square. Fig. 1.1 (Insert) shows the square which is pedestrianised. They identified five sites in the square where they could measure temperature, wind direction and wind speed at midday (12:00 hours) and in the early evening on eight consecutive days. The students investigated the following hypotheses: Hypothesis 1: Midday temperatures are higher at sites A, B and C than at sites D and E. Hypothesis 2: Wind direction and wind speed vary more at site C than at site E. (a) To measure the temperature the students considered using a traditional maximum-minimum thermometer at each site. (i) Suggest why their teacher thought that it was not a good idea to use a maximum-minimum thermometer in the city centre square when they wanted to make their measurements. ........................................................................................................................................... ........................................................................................................................................... ........................................................................................................................................... ..................................................................................................................................... [2] (ii) As an alternative method the students decided to use a digital thermometer to measure temperature at each site around midday (12:00 hours) and in the early evening. Give three advantages of using a digital thermometer. 1 ........................................................................................................................................ ........................................................................................................................................... 2 ........................................................................................................................................ ........................................................................................................................................... 3 ........................................................................................................................................ ..................................................................................................................................... [3] (b) The results of the students’ midday temperature measurements are shown in Table 1.1 (Insert). (i) Use the results in Table 1.1 to complete Fig. 1.2 on the page opposite by plotting the midday temperatures of days 6, 7 and 8 at site A. [2] Midday temperature measurements 30 30 29 29 A 28 28 27 27 26 26 B 25 B 25 E 24 E 24 D (°C) 23 23 C D 22 22 C temperature 21 21 (°C)temperature 20 20 19 19 18 18 17 17 0 0 1 2 3 4 5 6 7 8 day Fig. 1.2 (ii) What is your conclusion to Hypothesis 1: Midday temperatures are higher at sites A, B and C than at sites D and E ? Support your decision with evidence from Fig. 1.2 and Table 1.1. ........................................................................................................................................... ........................................................................................................................................... ........................................................................................................................................... ........................................................................................................................................... ........................................................................................................................................... ........................................................................................................................................... ........................................................................................................................................... ..................................................................................................................................... [4] (c) Early evening temperatures in the square also varied. These temperatures are shown in Fig. 1.3 (Insert). Use Fig. 1.3 to: (i) Describe one difference in early evening temperatures between the sites. Do not use statistics in your answer. ........................................................................................................................................... ..................................................................................................................................... [1] (ii) Describe one difference in early evening temperatures during the eight days. Do not use statistics in your answer. ........................................................................................................................................... ..................................................................................................................................... [1] (d) To investigate Hypothesis 2: Wind direction and wind speed vary more at site C than at site E, the students took measurements at midday on each day. (i) What is the instrument called which is used to measure wind direction? Tick (3) your choice below. Tick (3) wind dial wind gauge wind vane [1] (ii) The students’ results of measuring wind direction are shown in Table 1.2 (Insert). Use these results to complete the wind directions at site B in Fig. 1.4 below. [2] Wind direction at 5 measuring sites Site A Site B Site C N number N N 5 5 5 of days NW 4 NE NW 4 NE NW 4 NE 3 3 3 2 2 2 1 1 1 W E W E W E SW SE SW SE SW SE S S S Site D Site E N N 5 5 NW 4 NE NW 4 NE 3 3 2 2 1 1 W E W E SW SE SW SE S S Fig. 1.4 (iii) Explain how an anemometer, like that shown in Fig. 1.5 (Insert), measures wind speed. ........................................................................................................................................... ........................................................................................................................................... ........................................................................................................................................... ..................................................................................................................................... [2] (iv) The students’ results of measuring wind speed are shown in Table 1.3 (Insert). In Fig. 1.6 below, plot the wind speed measurements at site B on days 1 and 7. [2] Wind speed measurements A B C D E 24 44 44 22 44 66 20 33 44 66 55 18 33 33 66 33 55 16 44 55 33 14 wind speed (km / hr) 12 66 77 77 77 22 88 10 22 55 88 22 88 11 77 8 11 66 11 22 88 6 55 4 22 88 2 11 0 A B C D E site Key 1 wind speed measurement on day 1 Fig. 1.6 (v) The students decided that Hypothesis 2: Wind direction and wind speed vary more at site C than at site E, was partly true. Which part of the hypothesis is true? Tick your decision below and support your decision with data from Figs. 1.4 and 1.6 and Tables 1.2 and 1.3. Tick (3) Wind direction varies more at site C than at site E Wind speed varies more at site C than at site E ........................................................................................................................................... ........................................................................................................................................... ........................................................................................................................................... ..................................................................................................................................... [3] (e) Look again at Fig. 1.1 (Insert). Suggest reasons why temperatures and wind direction and speed vary between the sites in the city centre square. ................................................................................................................................................... ................................................................................................................................................... ................................................................................................................................................... ................................................................................................................................................... ................................................................................................................................................... ............................................................................................................................................. [3] (f) Another feature of weather which may vary over a small area is relative humidity. (i) Which one of the following is the correct definition of relative humidity? Tick your answer. Definition Tick (3) the amount of moisture in the air during the day compared to the night the amount of moisture in the air as a percentage of the total moisture it could hold at that temperature the maximum amount of moisture in the air when it is warmed up the percentage of moisture in the air when it is raining compared to when it stops raining [1] (ii) Relative humidity is calculated by using a wet-and-dry bulb thermometer (hygrometer). This is shown in Fig. 1.7 (Insert). Explain how the students would use this instrument to work out relative humidity. ........................................................................................................................................... ........................................................................................................................................... ........................................................................................................................................... ........................................................................................................................................... ........................................................................................................................................... ..................................................................................................................................... [3] [Total: 30]
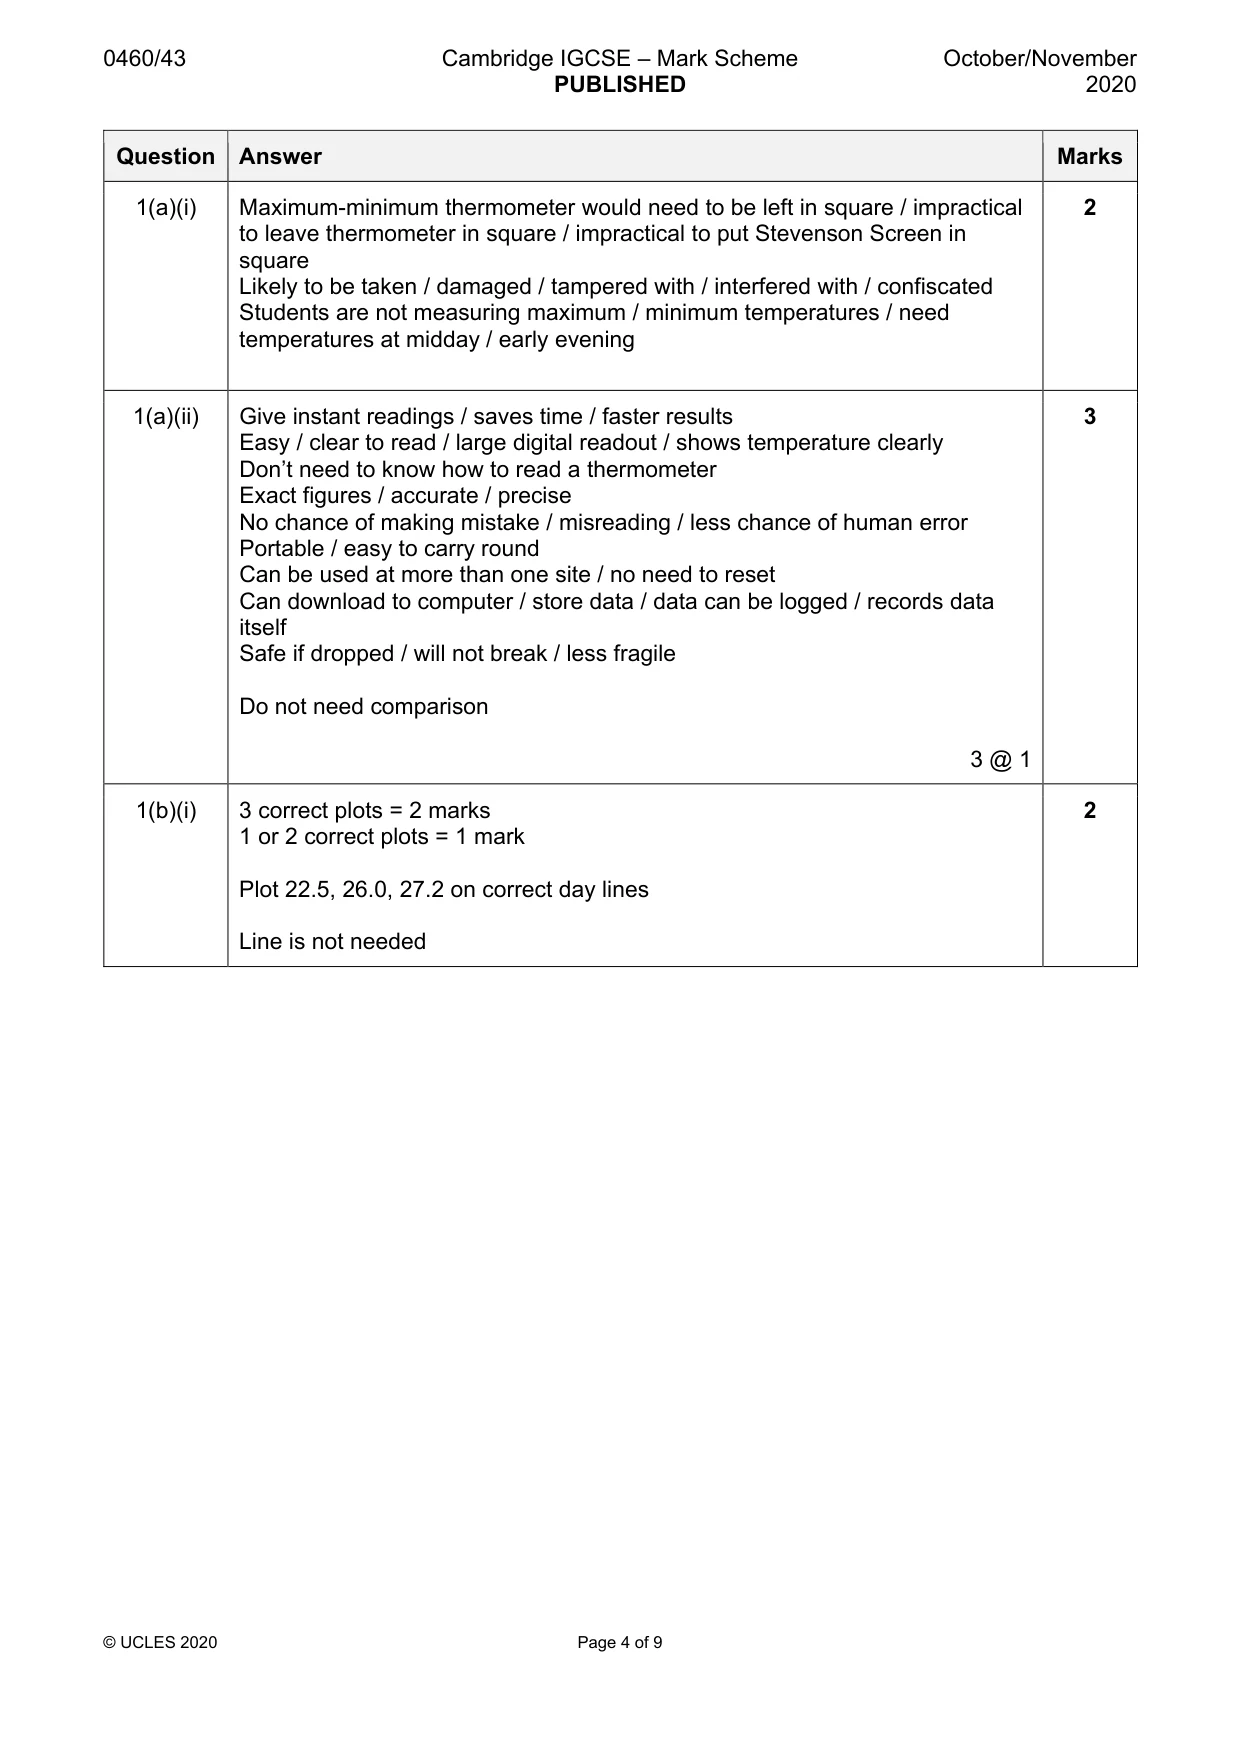
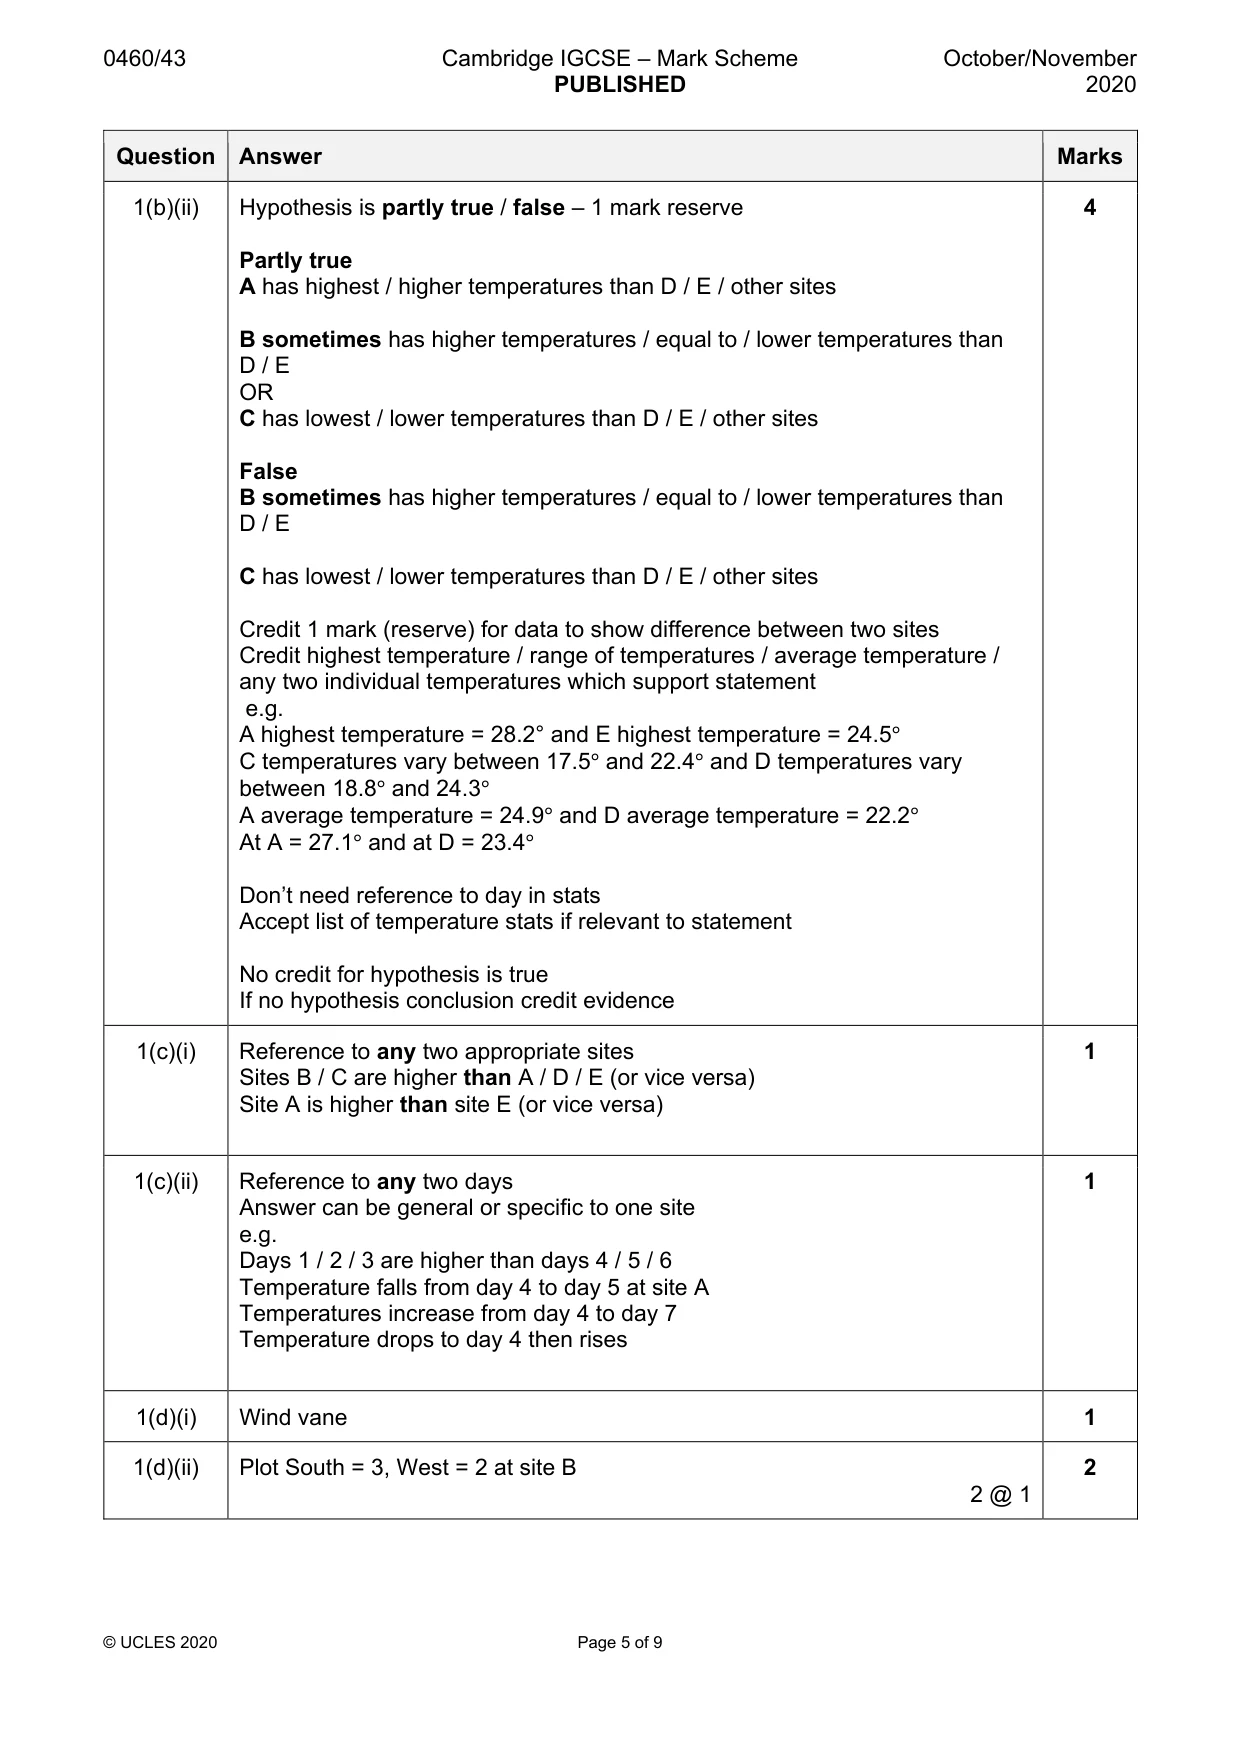
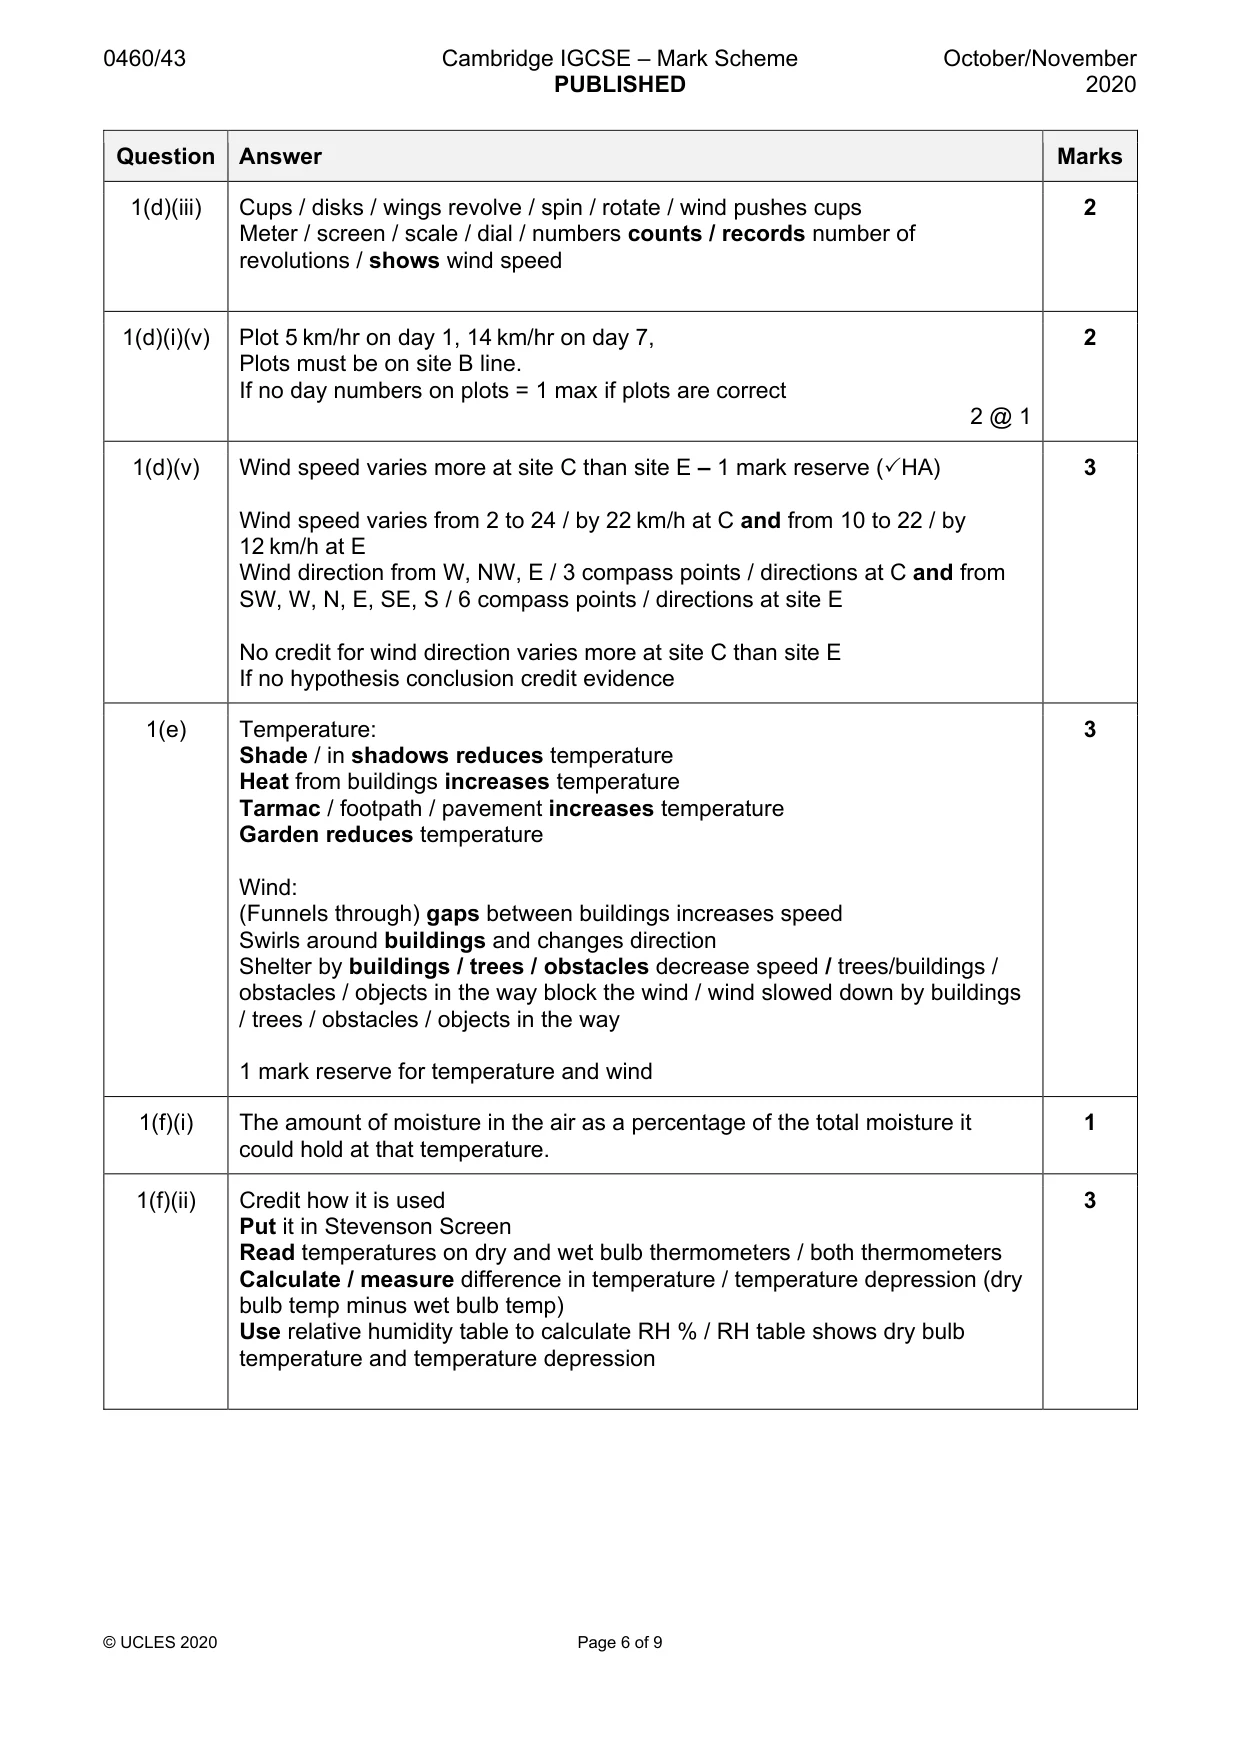
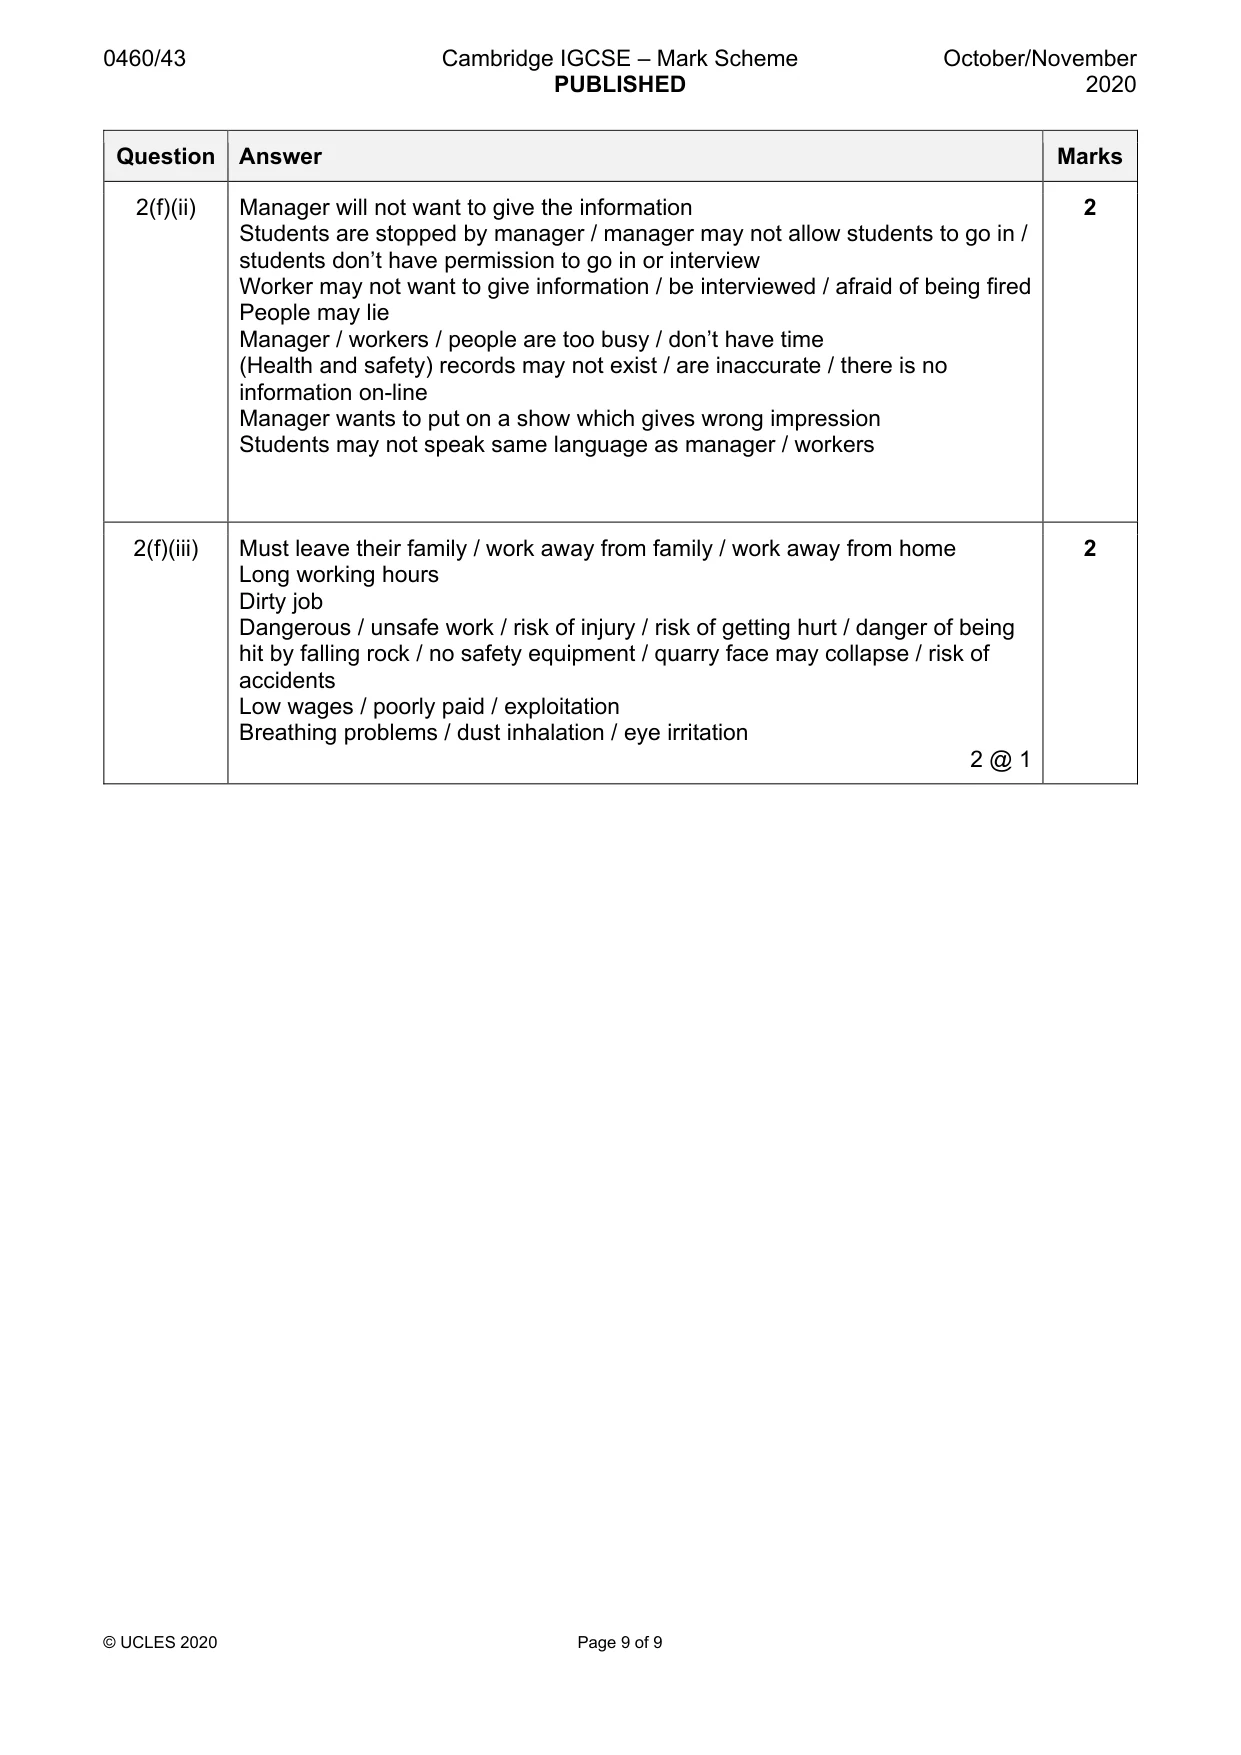
Mark scheme: 1(a)(i) Maximum-minimum thermometer would need to be left in square / impractical 2 to leave thermometer in square / impractical to put Stevenson Screen in square Likely to be taken / damaged / tampered with / interfered with / confiscated Students are not measuring maximum / minimum temperatures / need temperatures at midday / early evening 1(a)(ii) Give instant readings / saves time / faster results 3 Easy / clear to read / large digital readout / shows temperature clearly Don’t need to know how to read a thermometer Exact figures / accurate / precise No chance of making mistake / misreading / less chance of human error Portable / easy to carry round Can be used at more than one site / no need to reset Can download to computer / store data / data can be logged / records data itself Safe if dropped / will not break / less fragile Do not need comparison 3 @ 1 1(b)(i) 3 correct plots = 2 marks 2 1 or 2 correct plots = 1 mark Plot 22.5, 26.0, 27.2 on correct day lines Line is not needed Question Answer Marks 1(b)(ii) Hypothesis is partly true / false – 1 mark reserve 4 Partly true A has highest / higher temperatures than D / E / other sites B sometimes has higher temperatures / equal to / lower temperatures than D / E OR C has lowest / lower temperatures than D / E / other sites False B sometimes has higher temperatures / equal to / lower temperatures than D / E C has lowest / lower temperatures than D / E / other sites Credit 1 mark (reserve) for data to show difference between two sites Credit highest temperature / range of temperatures / average temperature / any two individual temperatures which support statement e.g. A highest temperature = 28.2° and E highest temperature = 24.5° C temperatures vary between 17.5° and 22.4° and D temperatures vary between 18.8° and 24.3° A average temperature = 24.9° and D average temperature = 22.2° At A = 27.1° and at D = 23.4° Don’t need reference to day in stats Accept list of temperature stats if relevant to statement No credit for hypothesis is true If no hypothesis conclusion credit evidence 1(c)(i) Reference to any two appropriate sites 1 Sites B / C are higher than A / D / E (or vice versa) Site A is higher than site E (or vice versa) 1(c)(ii) Reference to any two days 1 Answer can be general or specific to one site e.g. Days 1 / 2 / 3 are higher than days 4 / 5 / 6 Temperature falls from day 4 to day 5 at site A Temperatures increase from day 4 to day 7 Temperature drops to day 4 then rises 1(d)(i) Wind vane 1 1(d)(ii) Plot South = 3, West = 2 at site B 2 2 @ 1 Question Answer Marks 1(d)(iii) Cups / disks / wings revolve / spin / rotate / wind pushes cups 2 Meter / screen / scale / dial / numbers counts / records number of revolutions / shows wind speed 1(d)(i)(v) Plot 5 km/hr on day 1, 14 km/hr on day 7, 2 Plots must be on site B line. If no day numbers on plots = 1 max if plots are correct 2 @ 1 1(d)(v) Wind speed varies more at site C than site E – 1 mark reserve (HA) 3 Wind speed varies from 2 to 24 / by 22 km/h at C and from 10 to 22 / by 12 km/h at E Wind direction from W, NW, E / 3 compass points / directions at C and from SW, W, N, E, SE, S / 6 compass points / directions at site E No credit for wind direction varies more at site C than site E If no hypothesis conclusion credit evidence 1(e) Temperature: 3 Shade / in shadows reduces temperature Heat from buildings increases temperature Tarmac / footpath / pavement increases temperature Garden reduces temperature Wind: (Funnels through) gaps between buildings increases speed Swirls around buildings and changes direction Shelter by buildings / trees / obstacles decrease speed / trees/buildings / obstacles / objects in the way block the wind / wind slowed down by buildings / trees / obstacles / objects in the way 1 mark reserve for temperature and wind 1(f)(i) The amount of moisture in the air as a percentage of the total moisture it 1 could hold at that temperature. 1(f)(ii) Credit how it is used 3 Put it in Stevenson Screen Read temperatures on dry and wet bulb thermometers / both thermometers Calculate / measure difference in temperature / temperature depression (dry bulb temp minus wet bulb temp) Use relative humidity table to calculate RH % / RH table shows dry bulb temperature and temperature depression Question Answer Marks 2(a) 330 km 1
Q2 · A group of students in The Gambia visited Bafoloto quarry
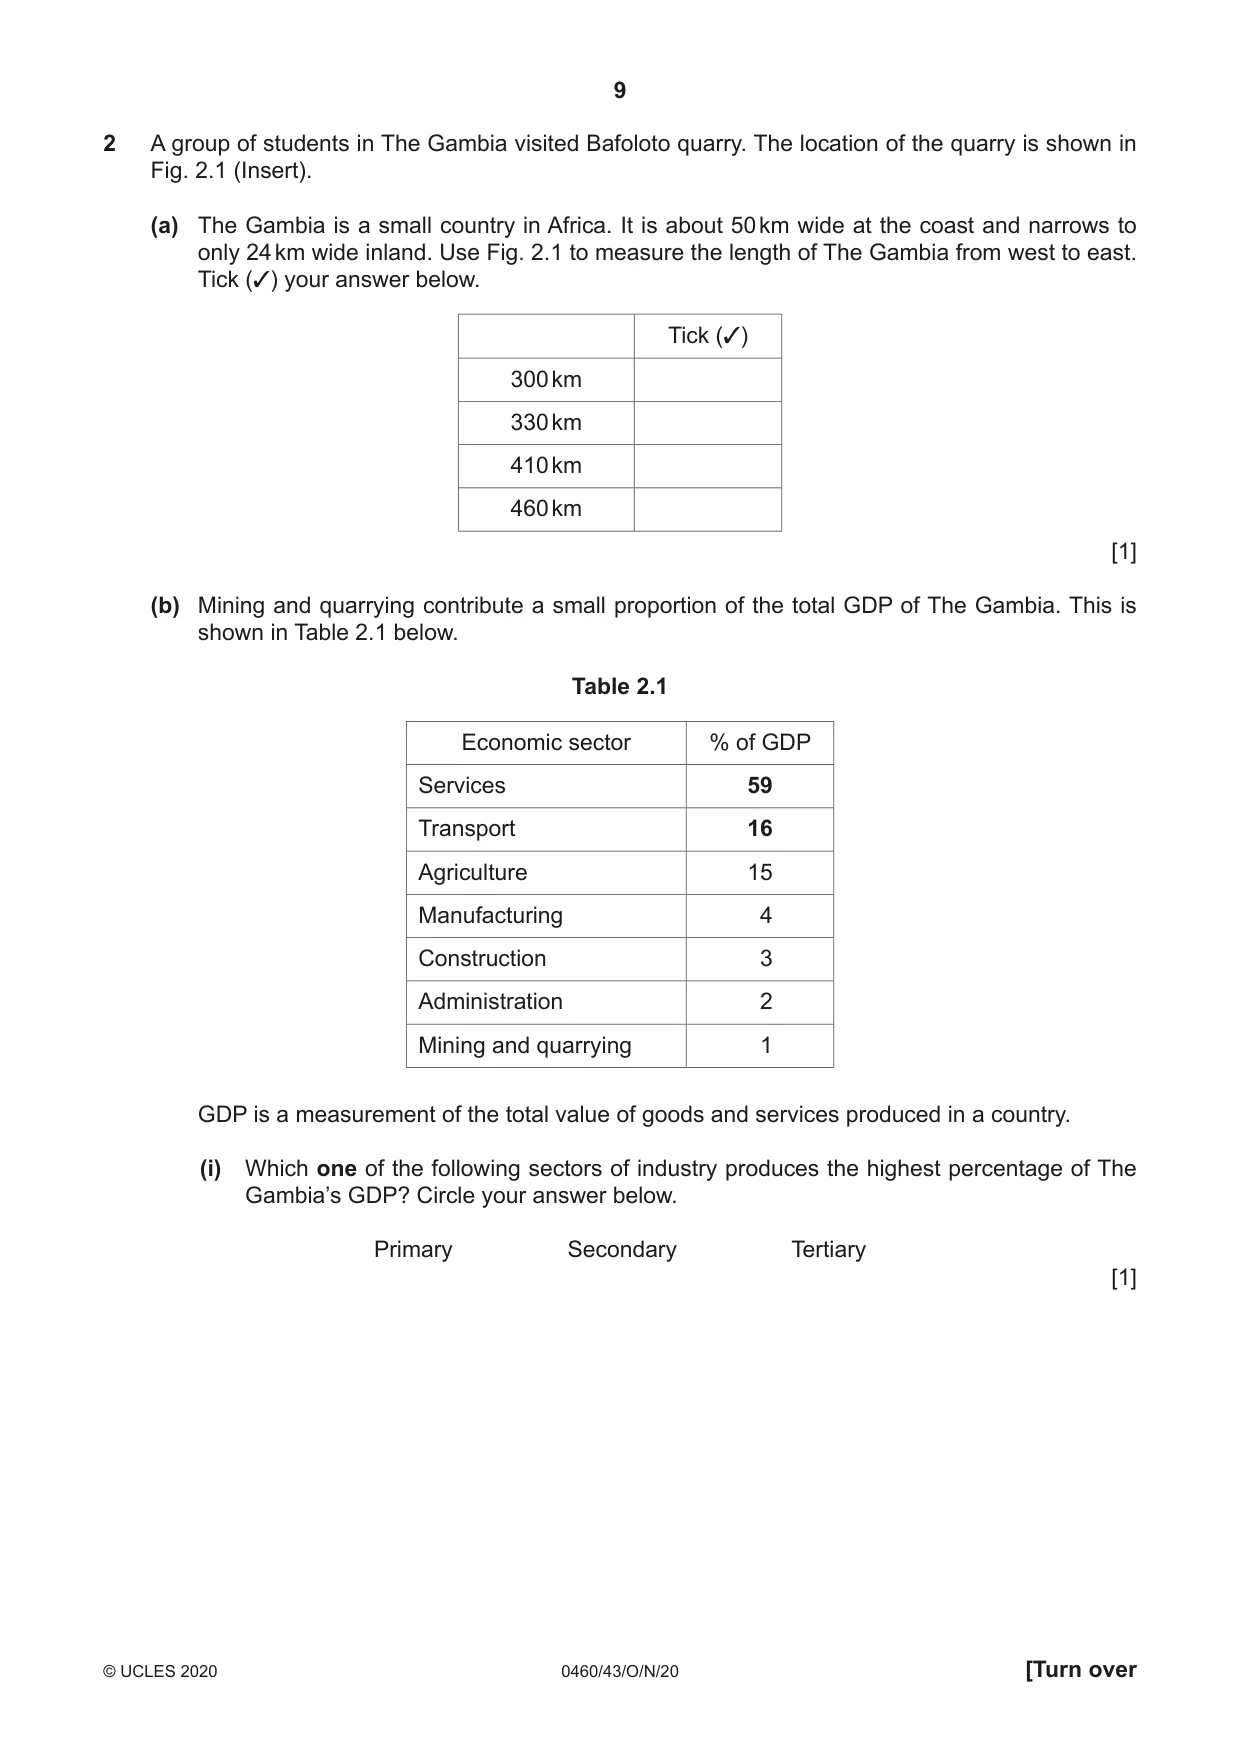
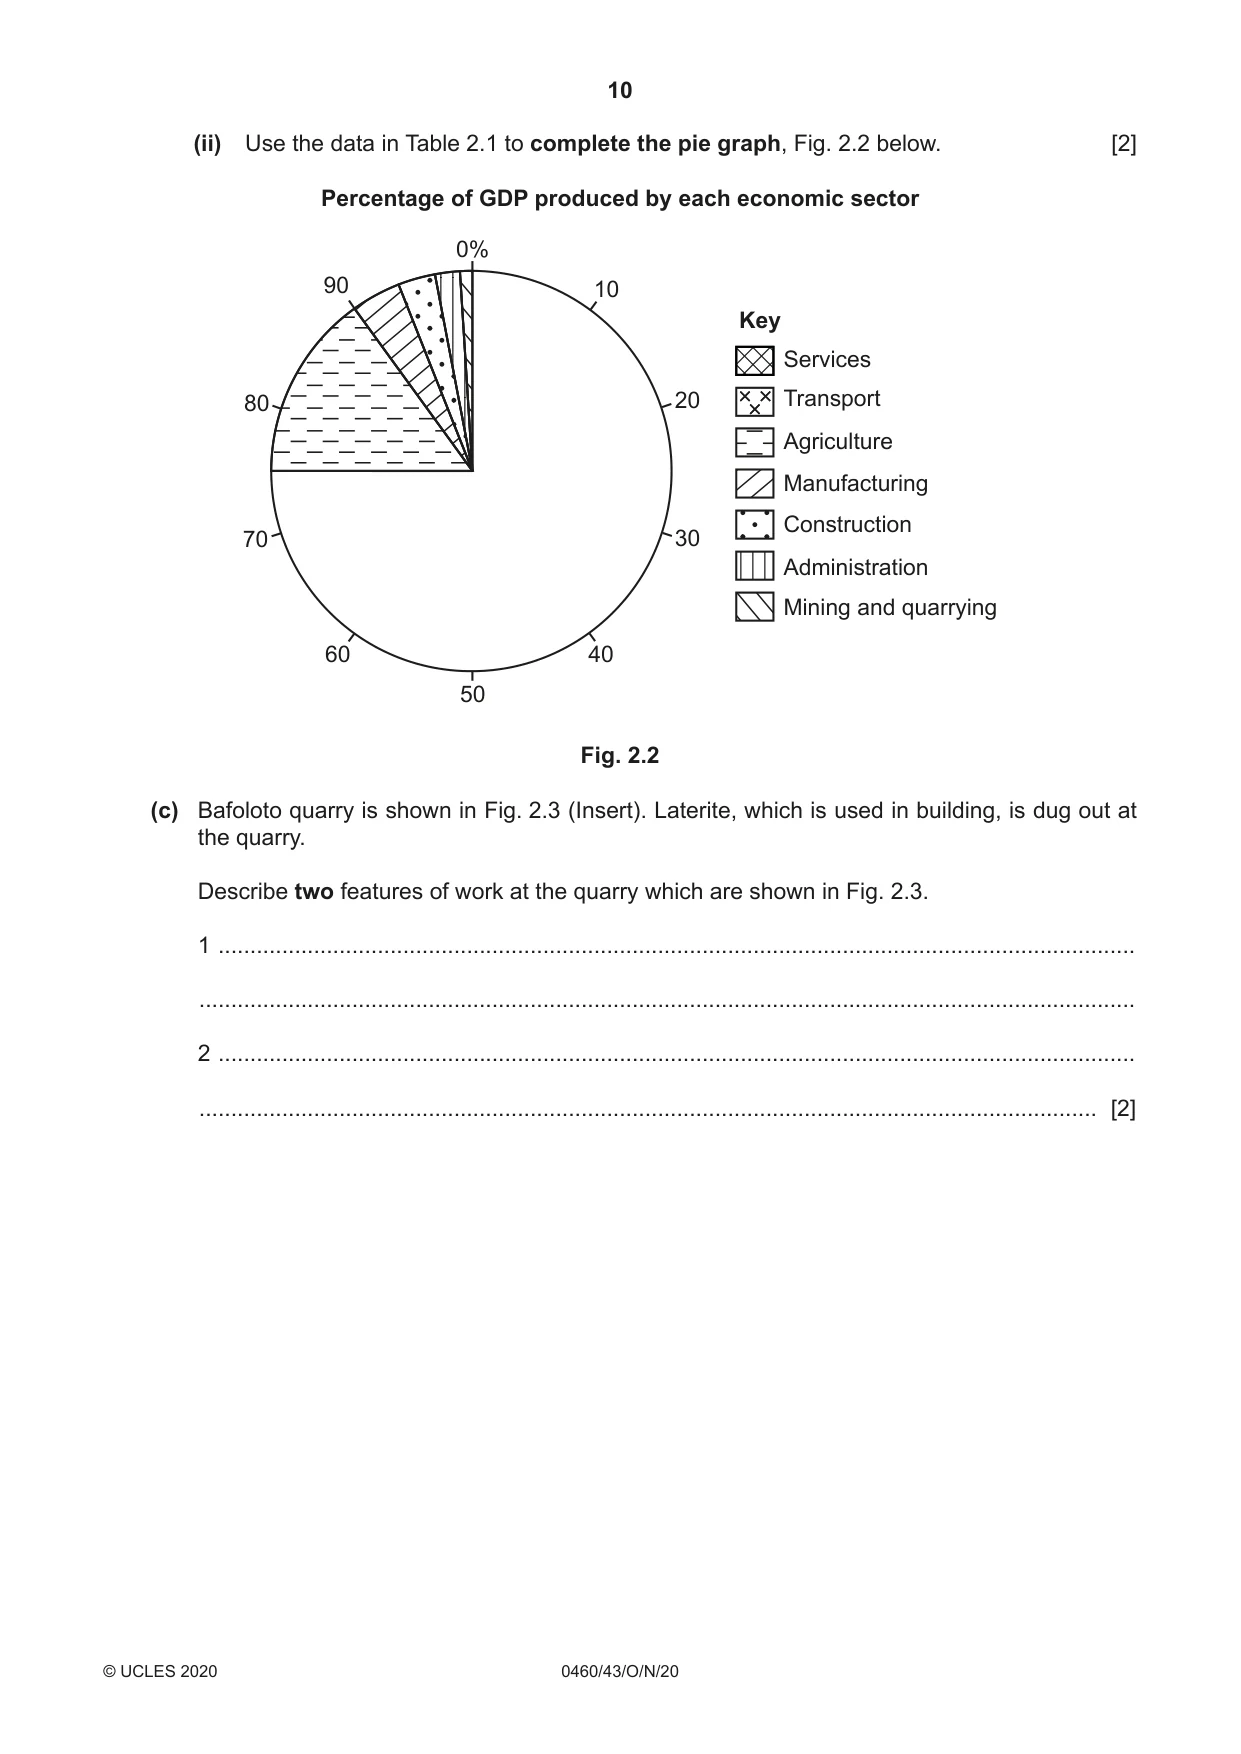
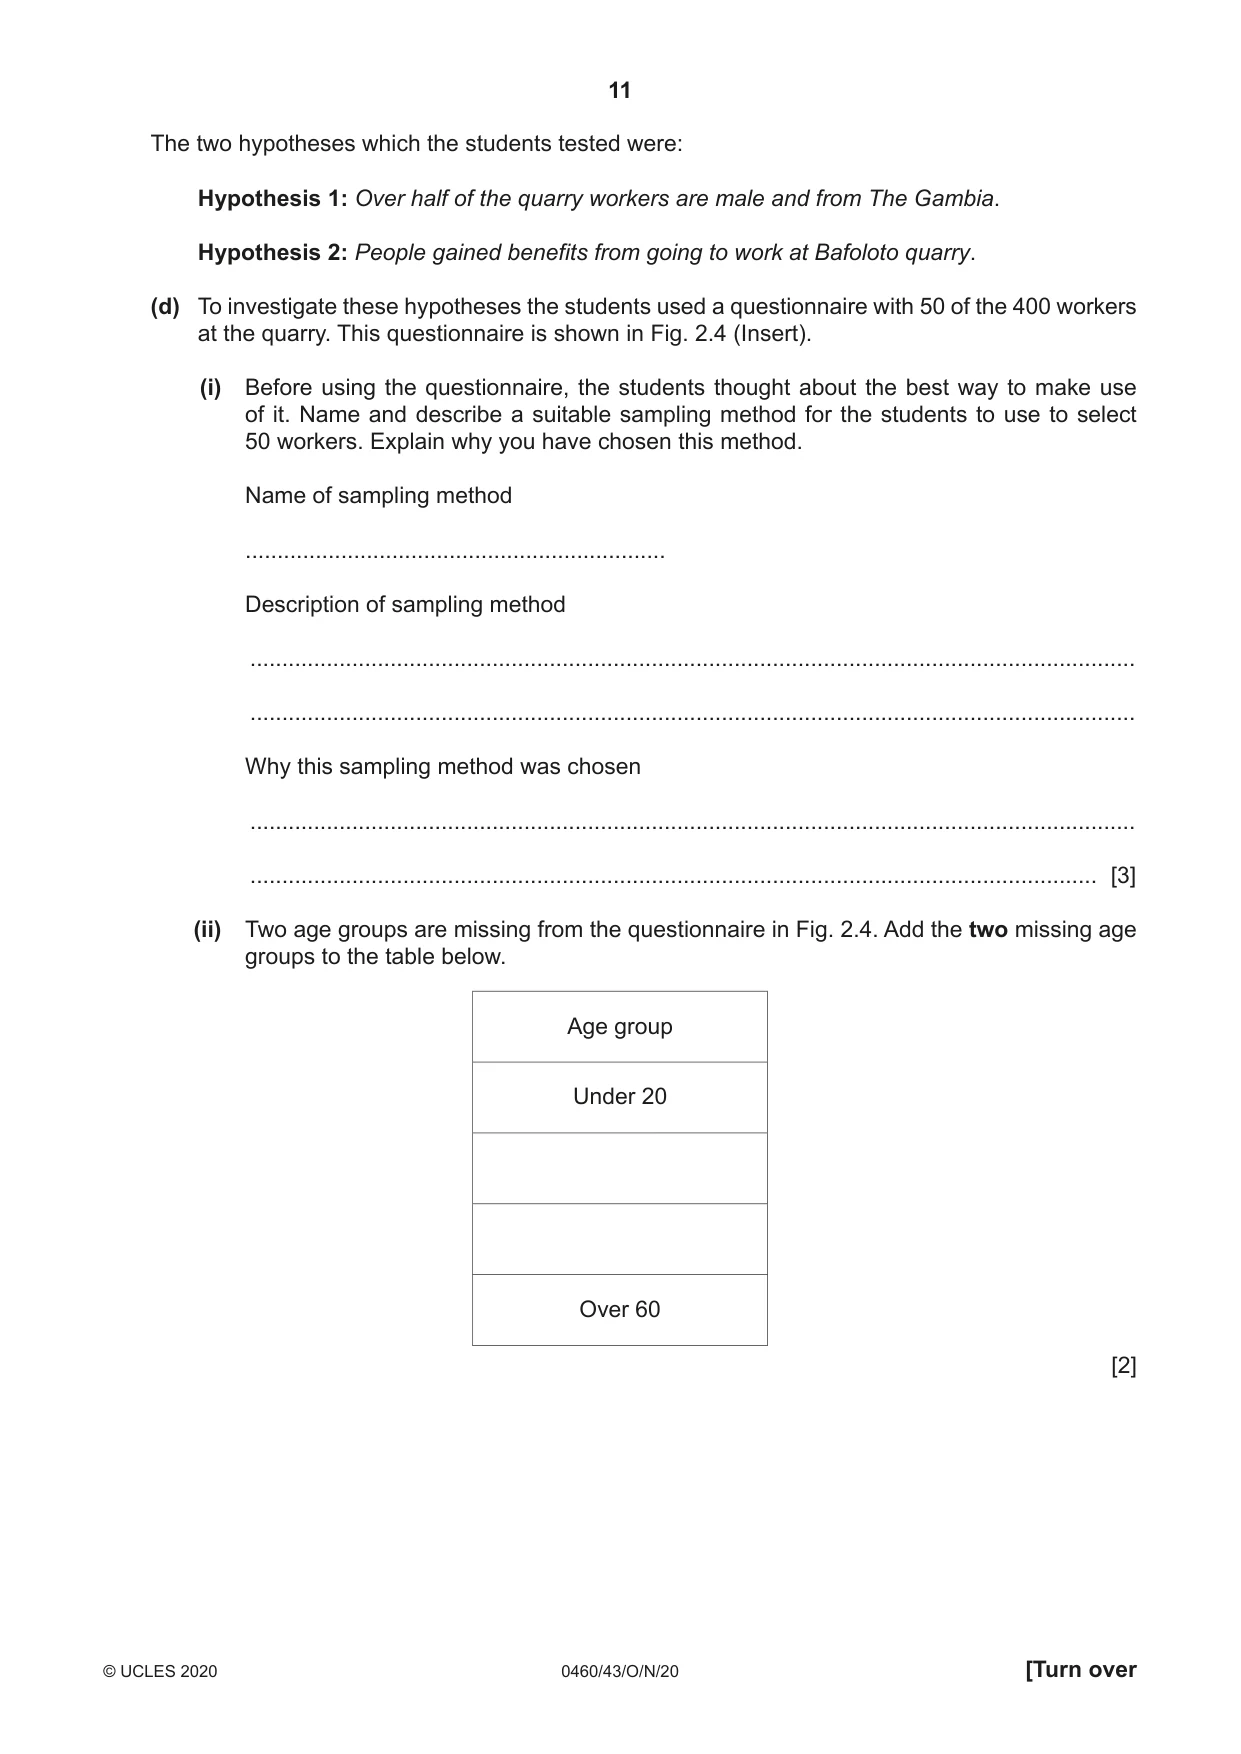
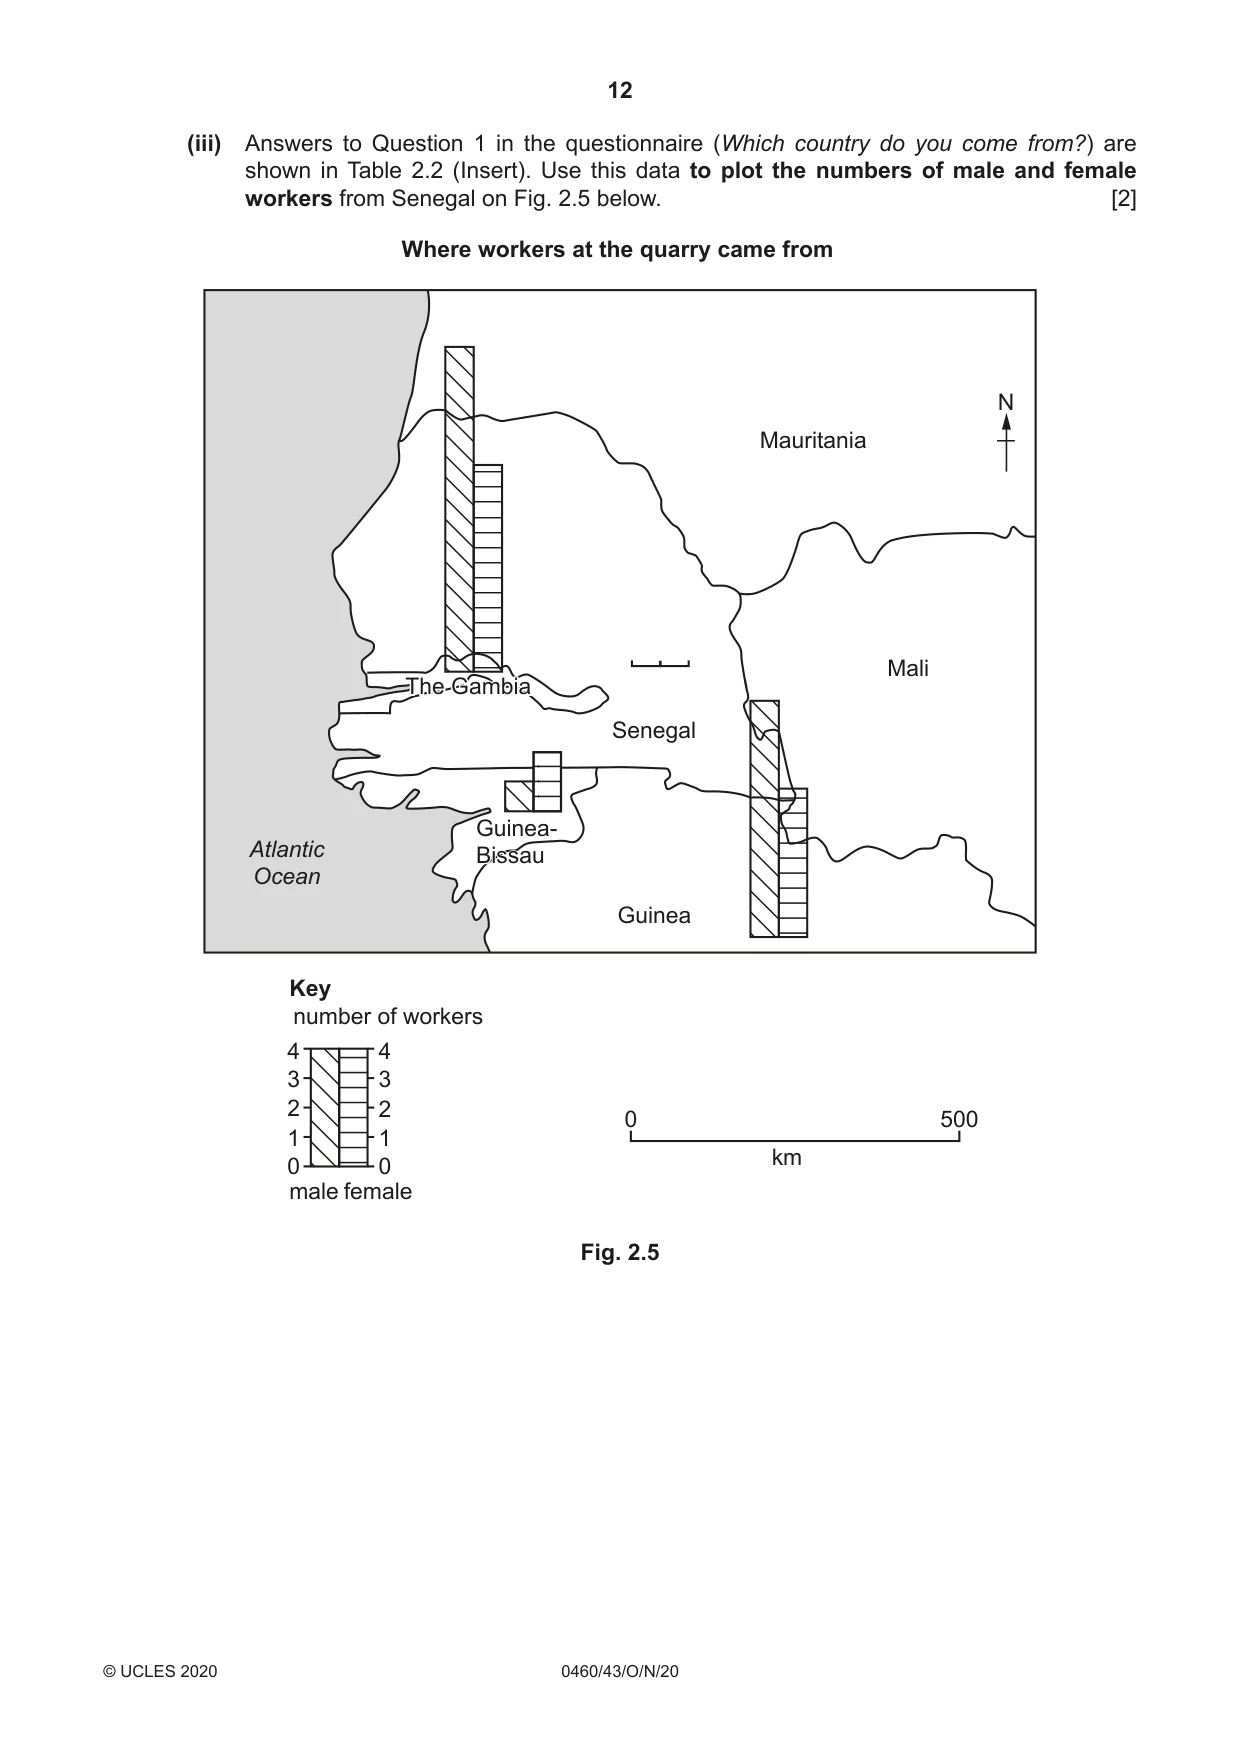
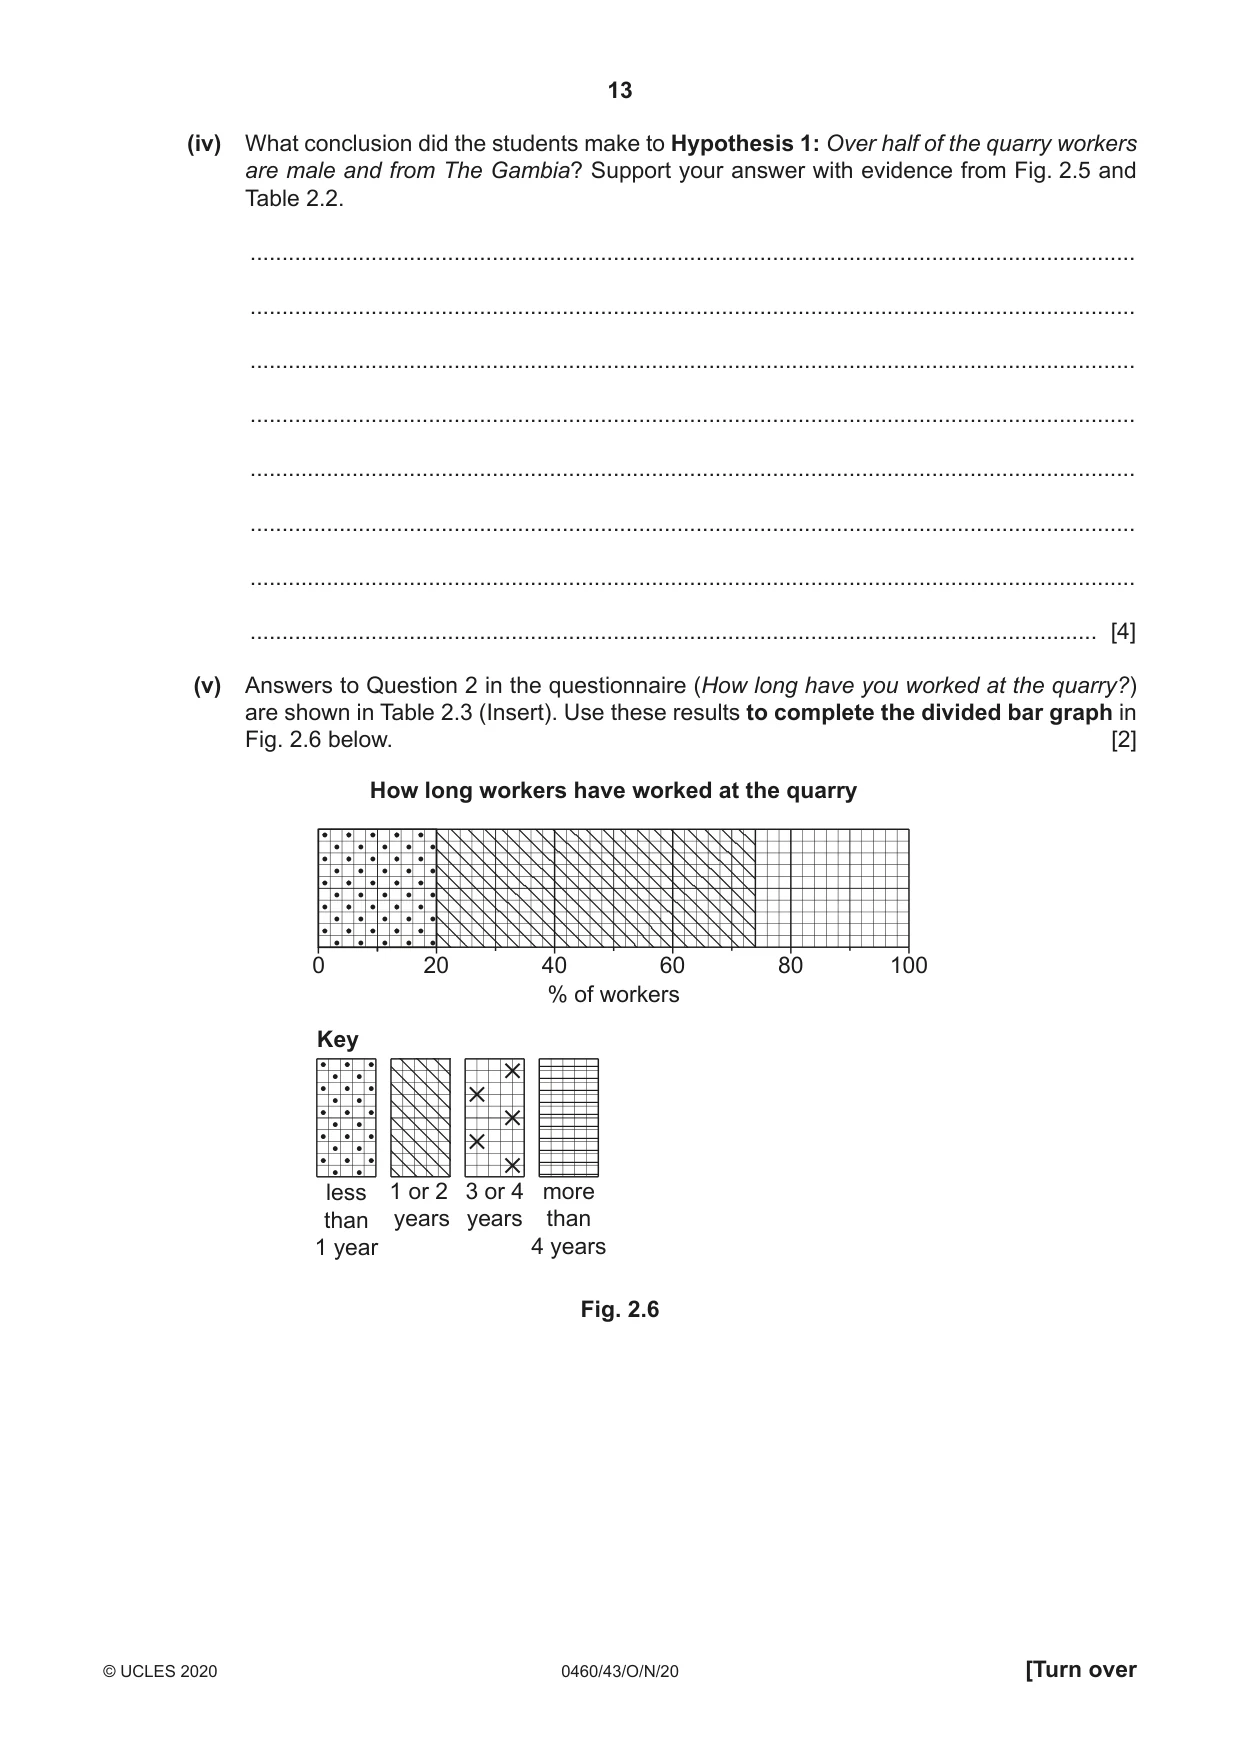
2 A group of students in The Gambia visited Bafoloto quarry. The location of the quarry is shown in Fig. 2.1 (Insert). (a) The Gambia is a small country in Africa. It is about 50 km wide at the coast and narrows to only 24 km wide inland. Use Fig. 2.1 to measure the length of The Gambia from west to east. Tick (3) your answer below. Tick (3) 300 km 330 km 410 km 460 km [1] (b) Mining and quarrying contribute a small proportion of the total GDP of The Gambia. This is shown in Table 2.1 below. Table 2.1 Economic sector % of GDP Services 59 Transport 16 Agriculture 15 Manufacturing 4 Construction 3 Administration 2 Mining and quarrying 1 GDP is a measurement of the total value of goods and services produced in a country. (i) Which one of the following sectors of industry produces the highest percentage of The Gambia’s GDP? Circle your answer below. Primary Secondary Tertiary [1] (ii) Use the data in Table 2.1 to complete the pie graph, Fig. 2.2 below. [2] Percentage of GDP produced by each economic sector 0% 90 10 Key Services 80 20 Transport Agriculture Manufacturing Construction 70 30 Administration Mining and quarrying 60 40 50 Fig. 2.2 (c) Bafoloto quarry is shown in Fig. 2.3 (Insert). Laterite, which is used in building, is dug out at the quarry. Describe two features of work at the quarry which are shown in Fig. 2.3. 1 ................................................................................................................................................ ................................................................................................................................................... 2 ................................................................................................................................................ ............................................................................................................................................. [2] The two hypotheses which the students tested were: Hypothesis 1: Over half of the quarry workers are male and from The Gambia. Hypothesis 2: People gained benefits from going to work at Bafoloto quarry. (d) To investigate these hypotheses the students used a questionnaire with 50 of the 400 workers at the quarry. This questionnaire is shown in Fig. 2.4 (Insert). (i) Before using the questionnaire, the students thought about the best way to make use of it. Name and describe a suitable sampling method for the students to use to select 50 workers. Explain why you have chosen this method. Name of sampling method .................................................................. Description of sampling method ........................................................................................................................................... ........................................................................................................................................... Why this sampling method was chosen ........................................................................................................................................... ..................................................................................................................................... [3] (ii) Two age groups are missing from the questionnaire in Fig. 2.4. Add the two missing age groups to the table below. Age group Under 20 Over 60 [2]
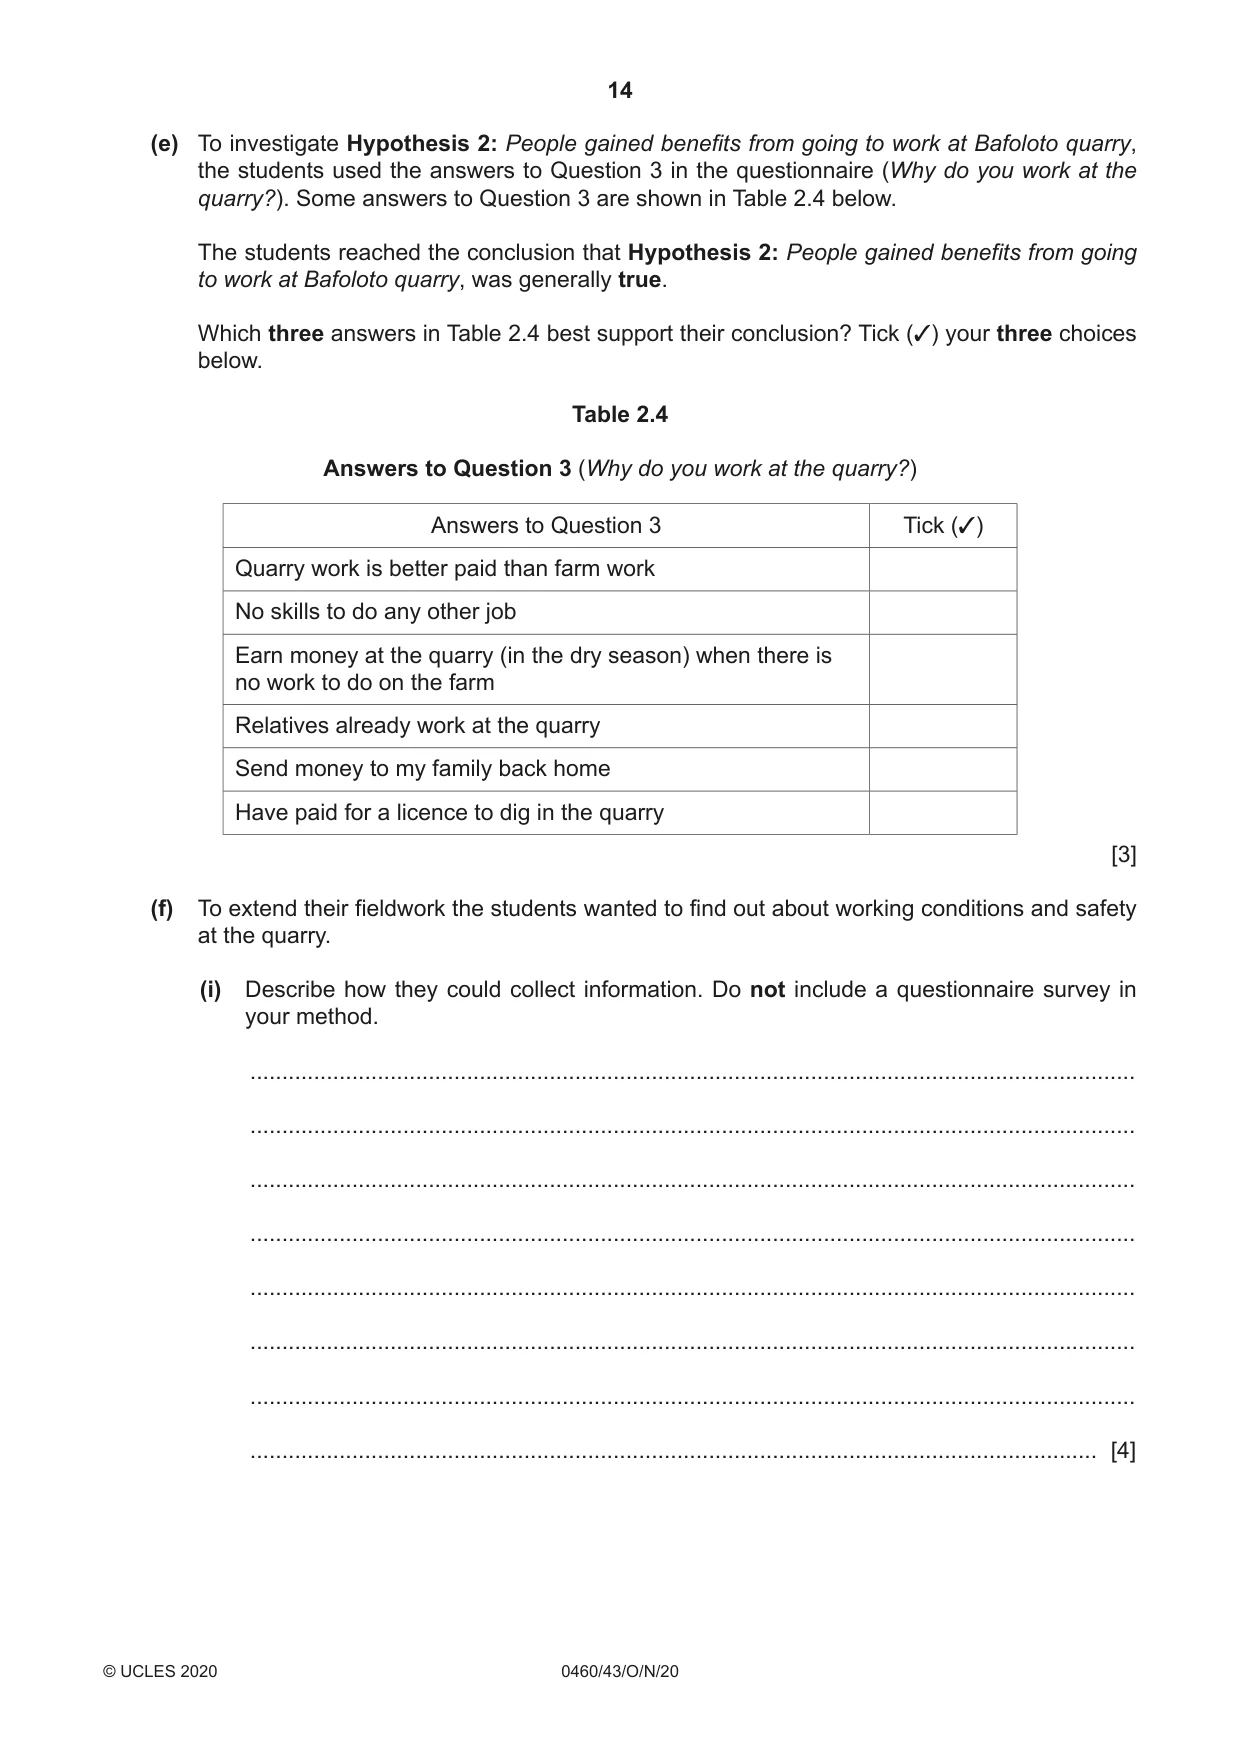
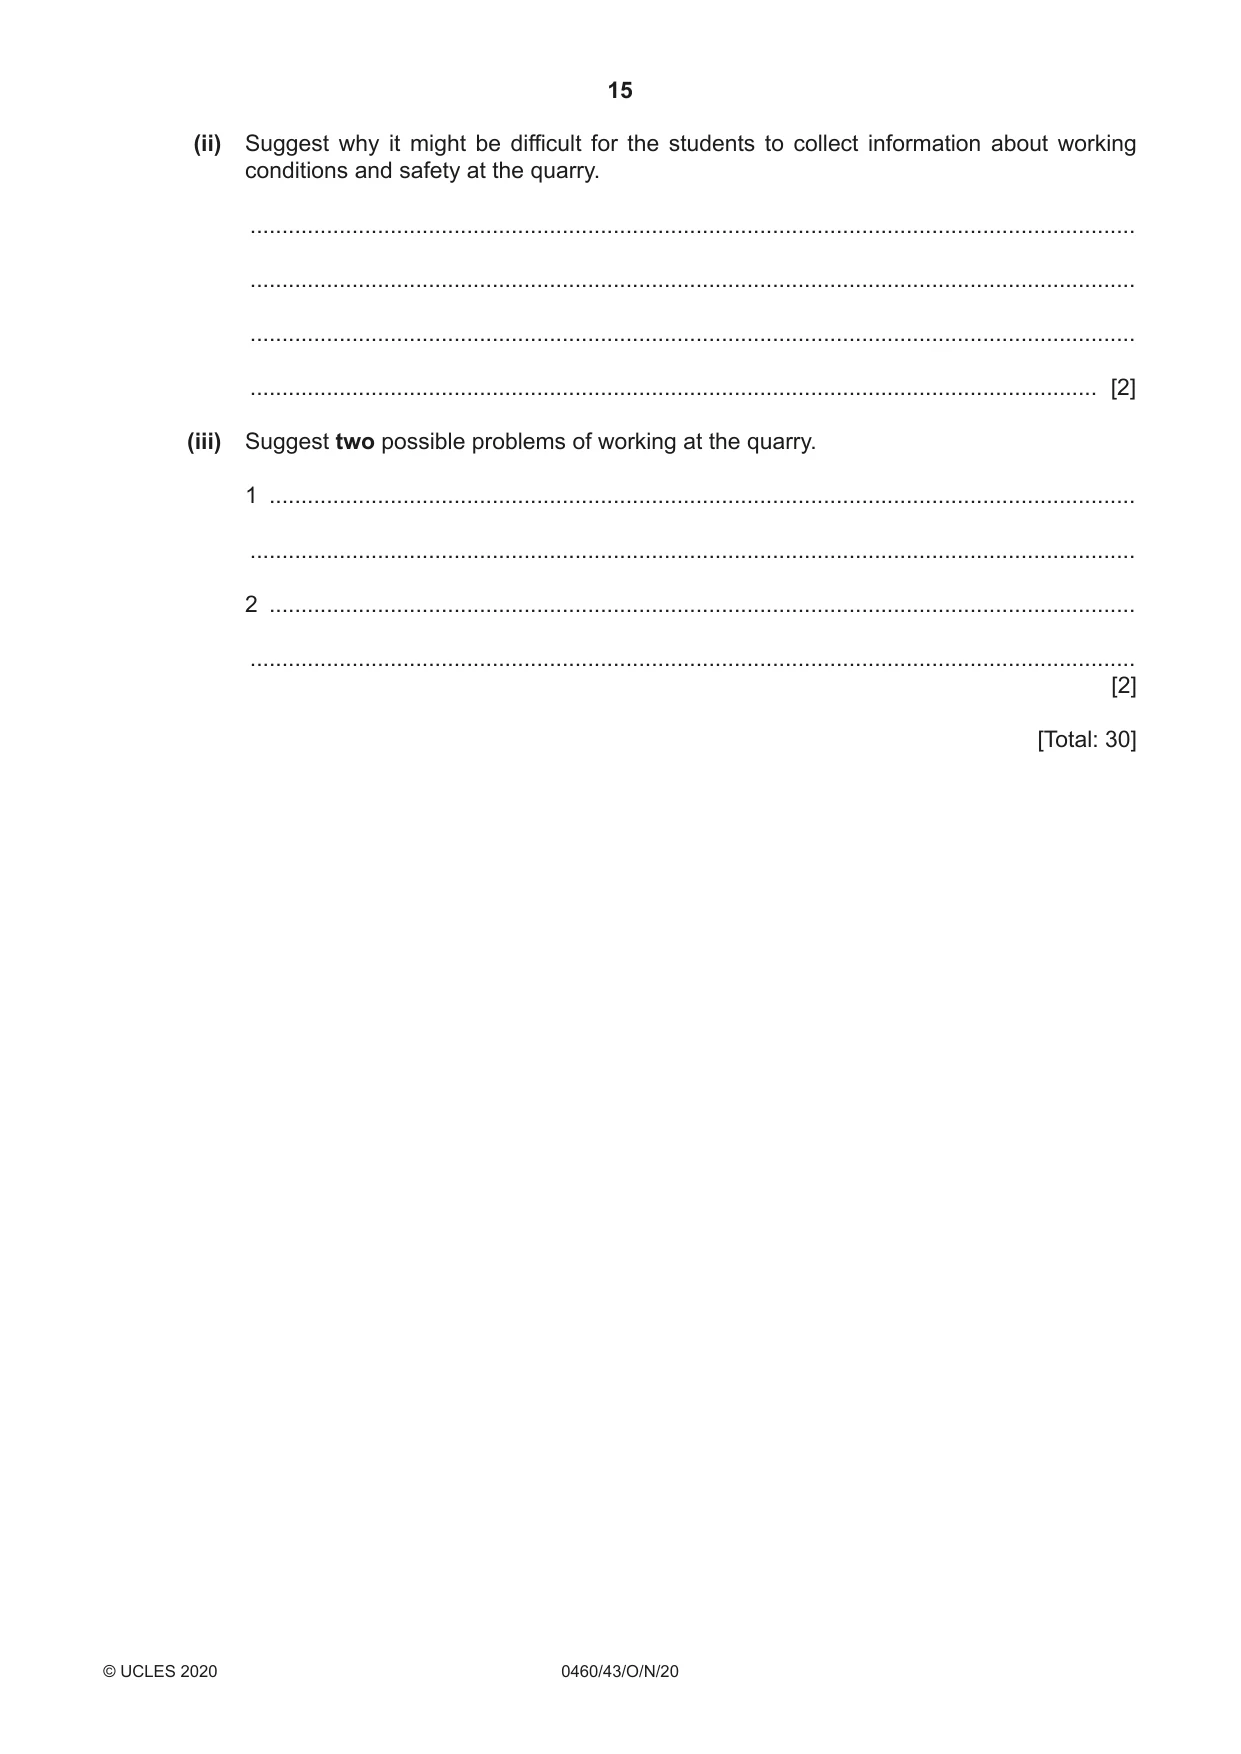
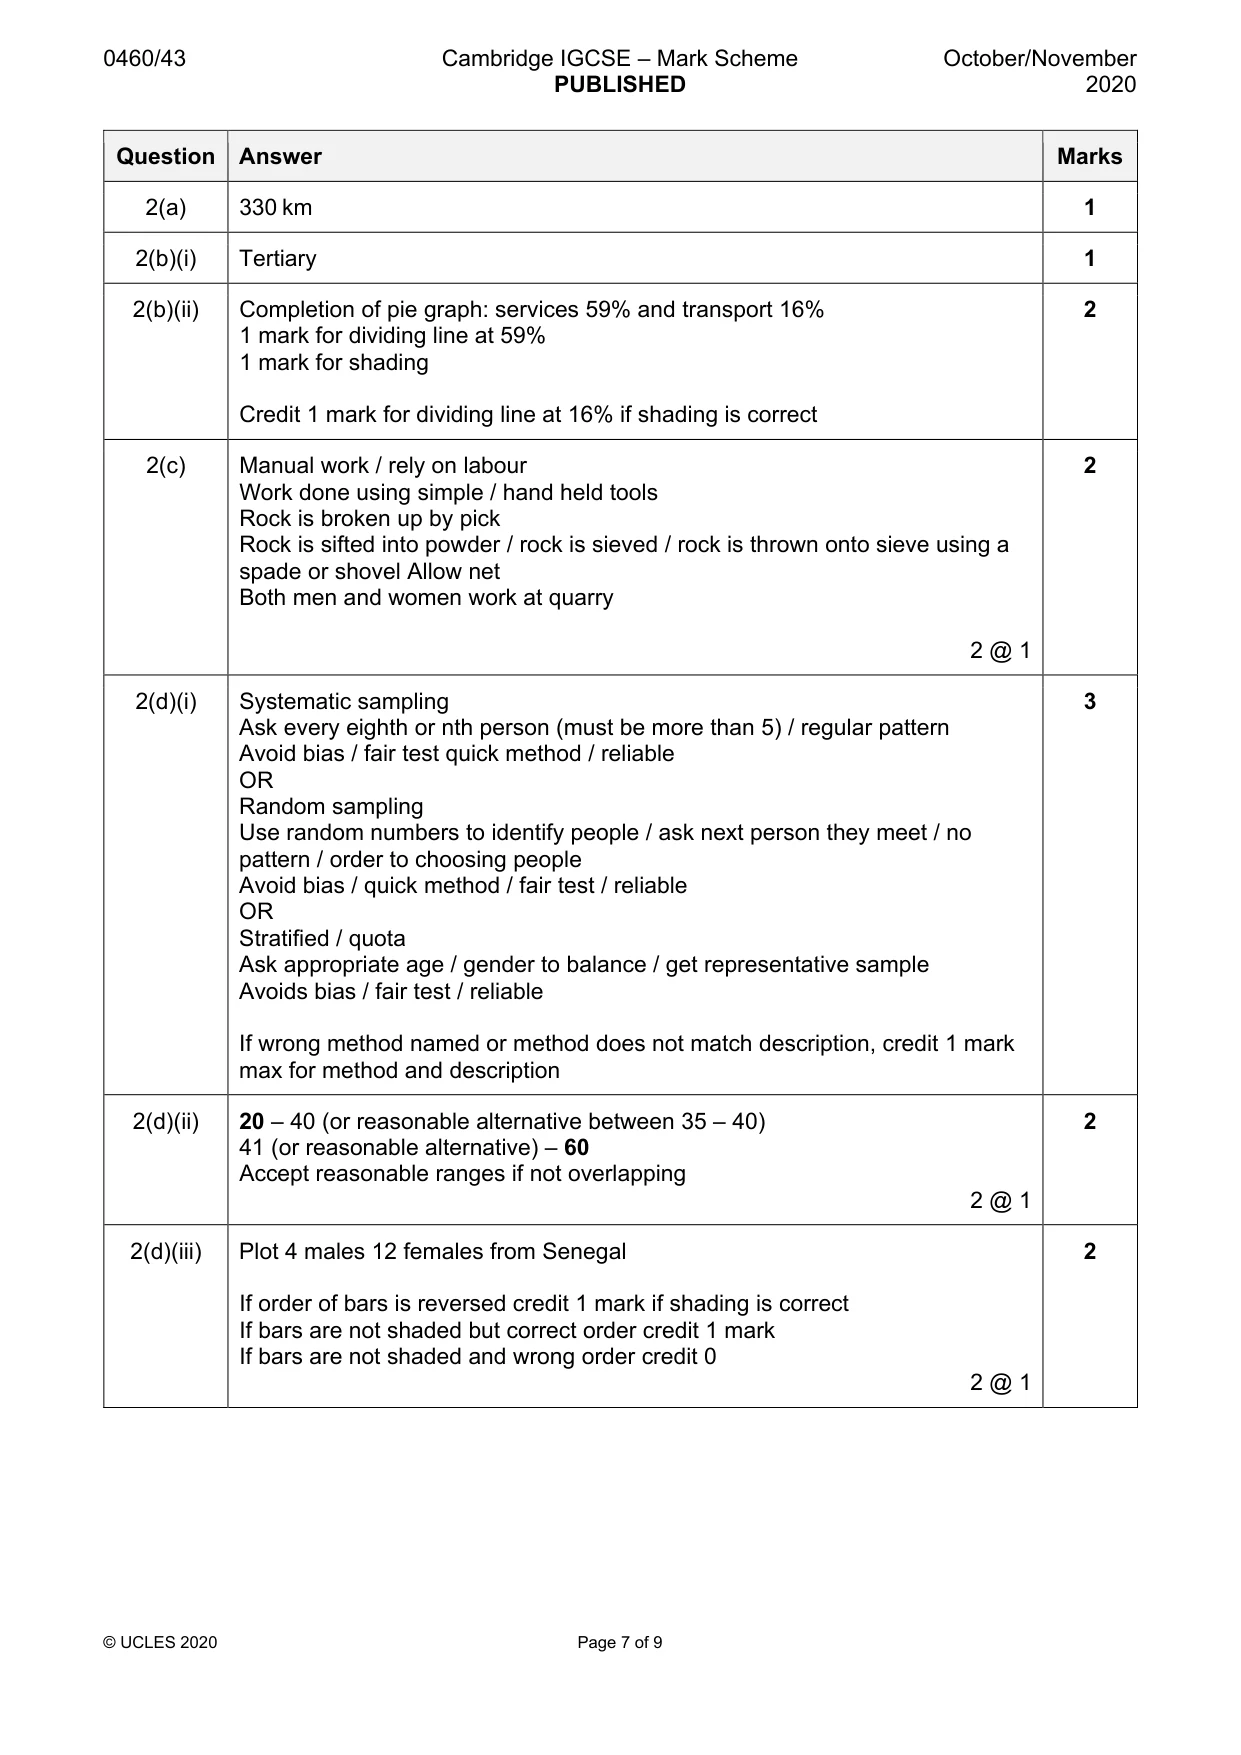
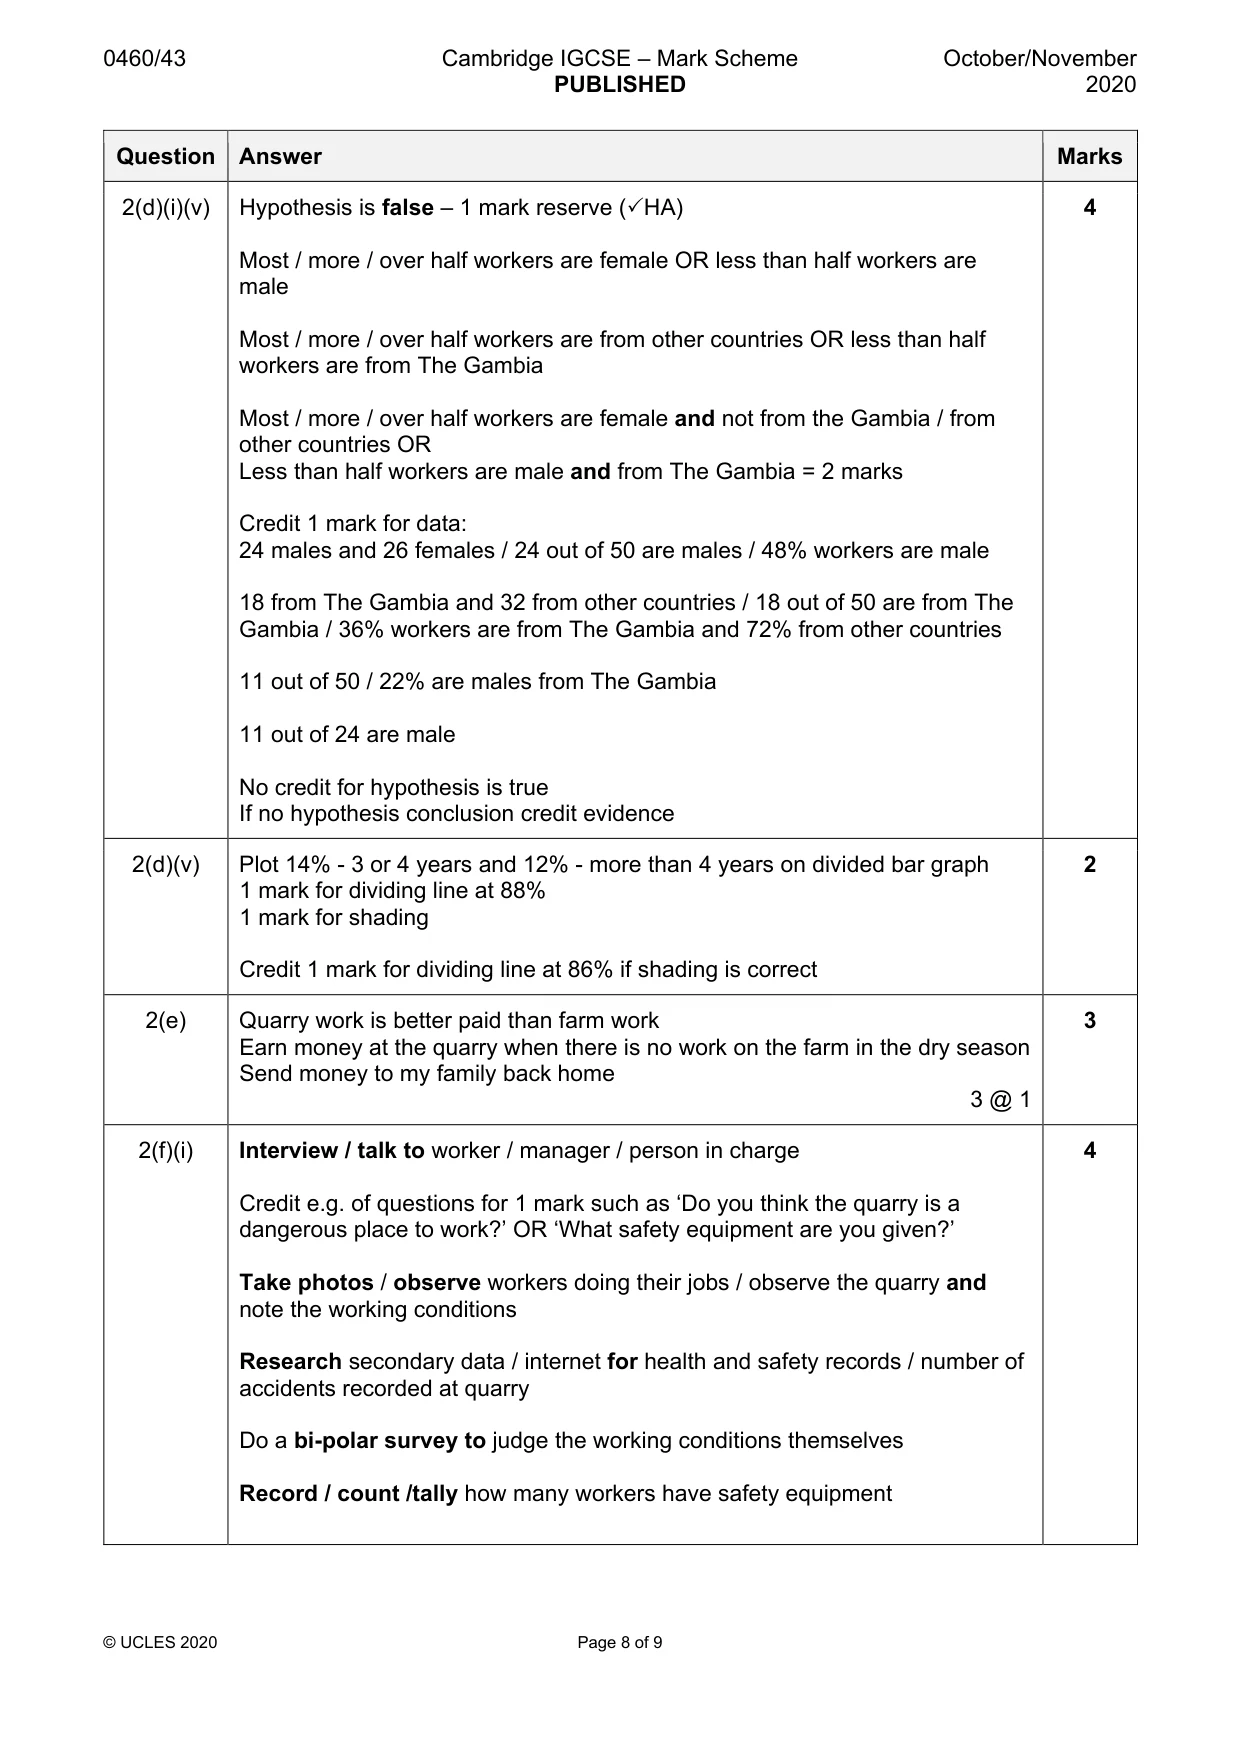
Mark scheme: 2(b)(i) Tertiary 1 2(b)(ii) Completion of pie graph: services 59% and transport 16% 2 1 mark for dividing line at 59% 1 mark for shading Credit 1 mark for dividing line at 16% if shading is correct 2(c) Manual work / rely on labour 2 Work done using simple / hand held tools Rock is broken up by pick Rock is sifted into powder / rock is sieved / rock is thrown onto sieve using a spade or shovel Allow net Both men and women work at quarry 2 @ 1 2(d)(i) Systematic sampling 3 Ask every eighth or nth person (must be more than 5) / regular pattern Avoid bias / fair test quick method / reliable OR Random sampling Use random numbers to identify people / ask next person they meet / no pattern / order to choosing people Avoid bias / quick method / fair test / reliable OR Stratified / quota Ask appropriate age / gender to balance / get representative sample Avoids bias / fair test / reliable If wrong method named or method does not match description, credit 1 mark max for method and description 2(d)(ii) 20 – 40 (or reasonable alternative between 35 – 40) 2 41 (or reasonable alternative) – 60 Accept reasonable ranges if not overlapping 2 @ 1 2(d)(iii) Plot 4 males 12 females from Senegal 2 If order of bars is reversed credit 1 mark if shading is correct If bars are not shaded but correct order credit 1 mark If bars are not shaded and wrong order credit 0 2 @ 1 Question Answer Marks 2(d)(i)(v) Hypothesis is false – 1 mark reserve (HA) 4 Most / more / over half workers are female OR less than half workers are male Most / more / over half workers are from other countries OR less than half workers are from The Gambia Most / more / over half workers are female and not from the Gambia / from other countries OR Less than half workers are male and from The Gambia = 2 marks Credit 1 mark for data: 24 males and 26 females / 24 out of 50 are males / 48% workers are male 18 from The Gambia and 32 from other countries / 18 out of 50 are from The Gambia / 36% workers are from The Gambia and 72% from other countries 11 out of 50 / 22% are males from The Gambia 11 out of 24 are male No credit for hypothesis is true If no hypothesis conclusion credit evidence 2(d)(v) Plot 14% - 3 or 4 years and 12% - more than 4 years on divided bar graph 2 1 mark for dividing line at 88% 1 mark for shading Credit 1 mark for dividing line at 86% if shading is correct 2(e) Quarry work is better paid than farm work 3 Earn money at the quarry when there is no work on the farm in the dry season Send money to my family back home 3 @ 1 2(f)(i) Interview / talk to worker / manager / person in charge 4 Credit e.g. of questions for 1 mark such as ‘Do you think the quarry is a dangerous place to work?’ OR ‘What safety equipment are you given?’ Take photos / observe workers doing their jobs / observe the quarry and note the working conditions Research secondary data / internet for health and safety records / number of accidents recorded at quarry Do a bi-polar survey to judge the working conditions themselves Record / count /tally how many workers have safety equipment Question Answer Marks 2(f)(ii) Manager will not want to give the information 2 Students are stopped by manager / manager may not allow students to go in / students don’t have permission to go in or interview Worker may not want to give information / be interviewed / afraid of being fired People may lie Manager / workers / people are too busy / don’t have time (Health and safety) records may not exist / are inaccurate / there is no information on-line Manager wants to put on a show which gives wrong impression Students may not speak same language as manager / workers 2(f)(iii) Must leave their family / work away from family / work away from home 2 Long working hours Dirty job Dangerous / unsafe work / risk of injury / risk of getting hurt / danger of being hit by falling rock / no safety equipment / quarry face may collapse / risk of accidents Low wages / poorly paid / exploitation Breathing problems / dust inhalation / eye irritation 2 @ 1
What was in this paper
The subtopics covered by these 2 questions, and how many questions each got. Open one in a new tab to see every Cambridge question on it.
What you needed in this session
Cambridge’s own grade thresholds for 2020 Oct/Nov, Paper 4 · Variant 3. A higher threshold means an easier paper — the bar moves with how the cohort did.