Cambridge IGCSE Geography 0460 — 2020 Oct/Nov Paper 4 · Variant 1
0460/41/O/N/20 · 2 questions · 60 marks · ≈68 min
The question paper and its mark scheme, free to read here and free to download. This is Cambridge’s own paper, exactly as it was sat.
Question paper16 pages



Mark scheme9 pages
Answers below. Sit the paper first if you are practising.
Questions as text
Q1 · Students in Italy were studying population migration
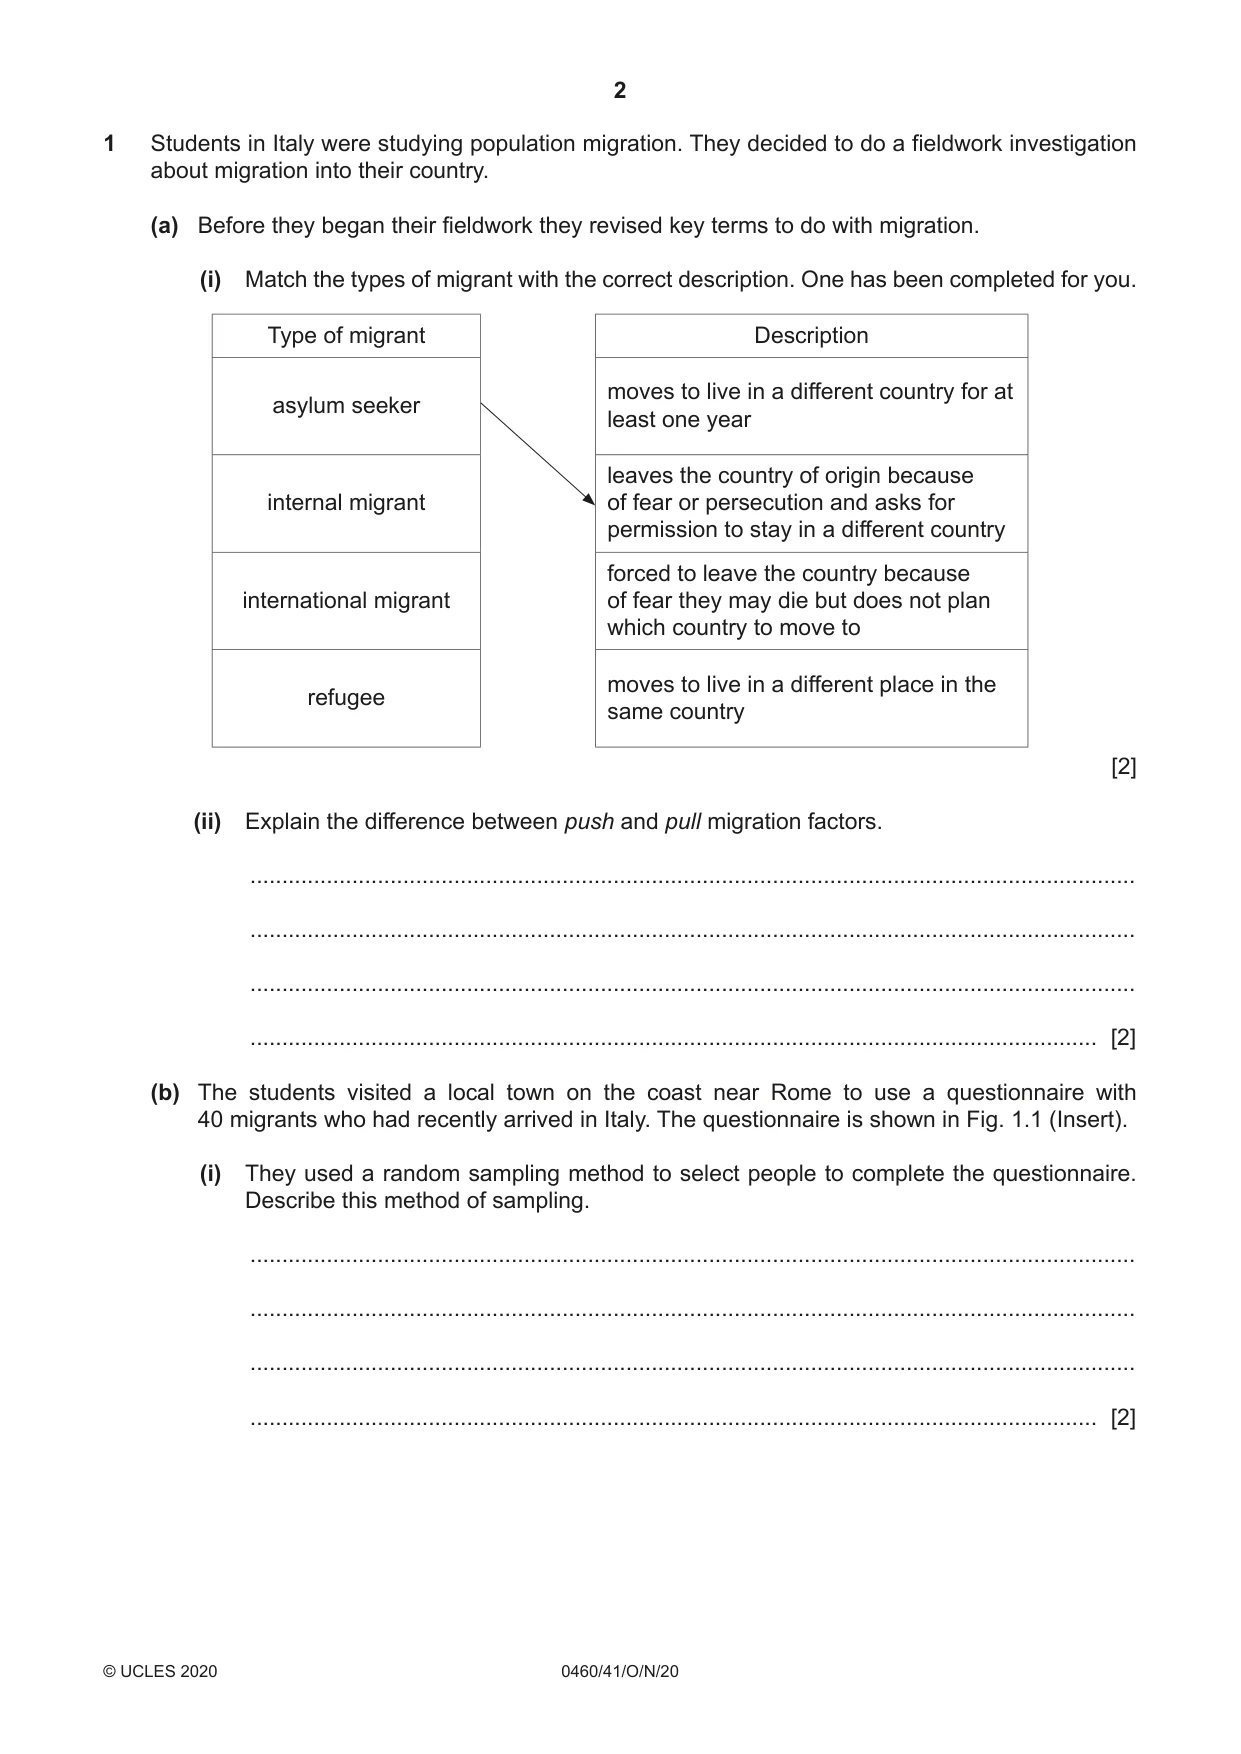
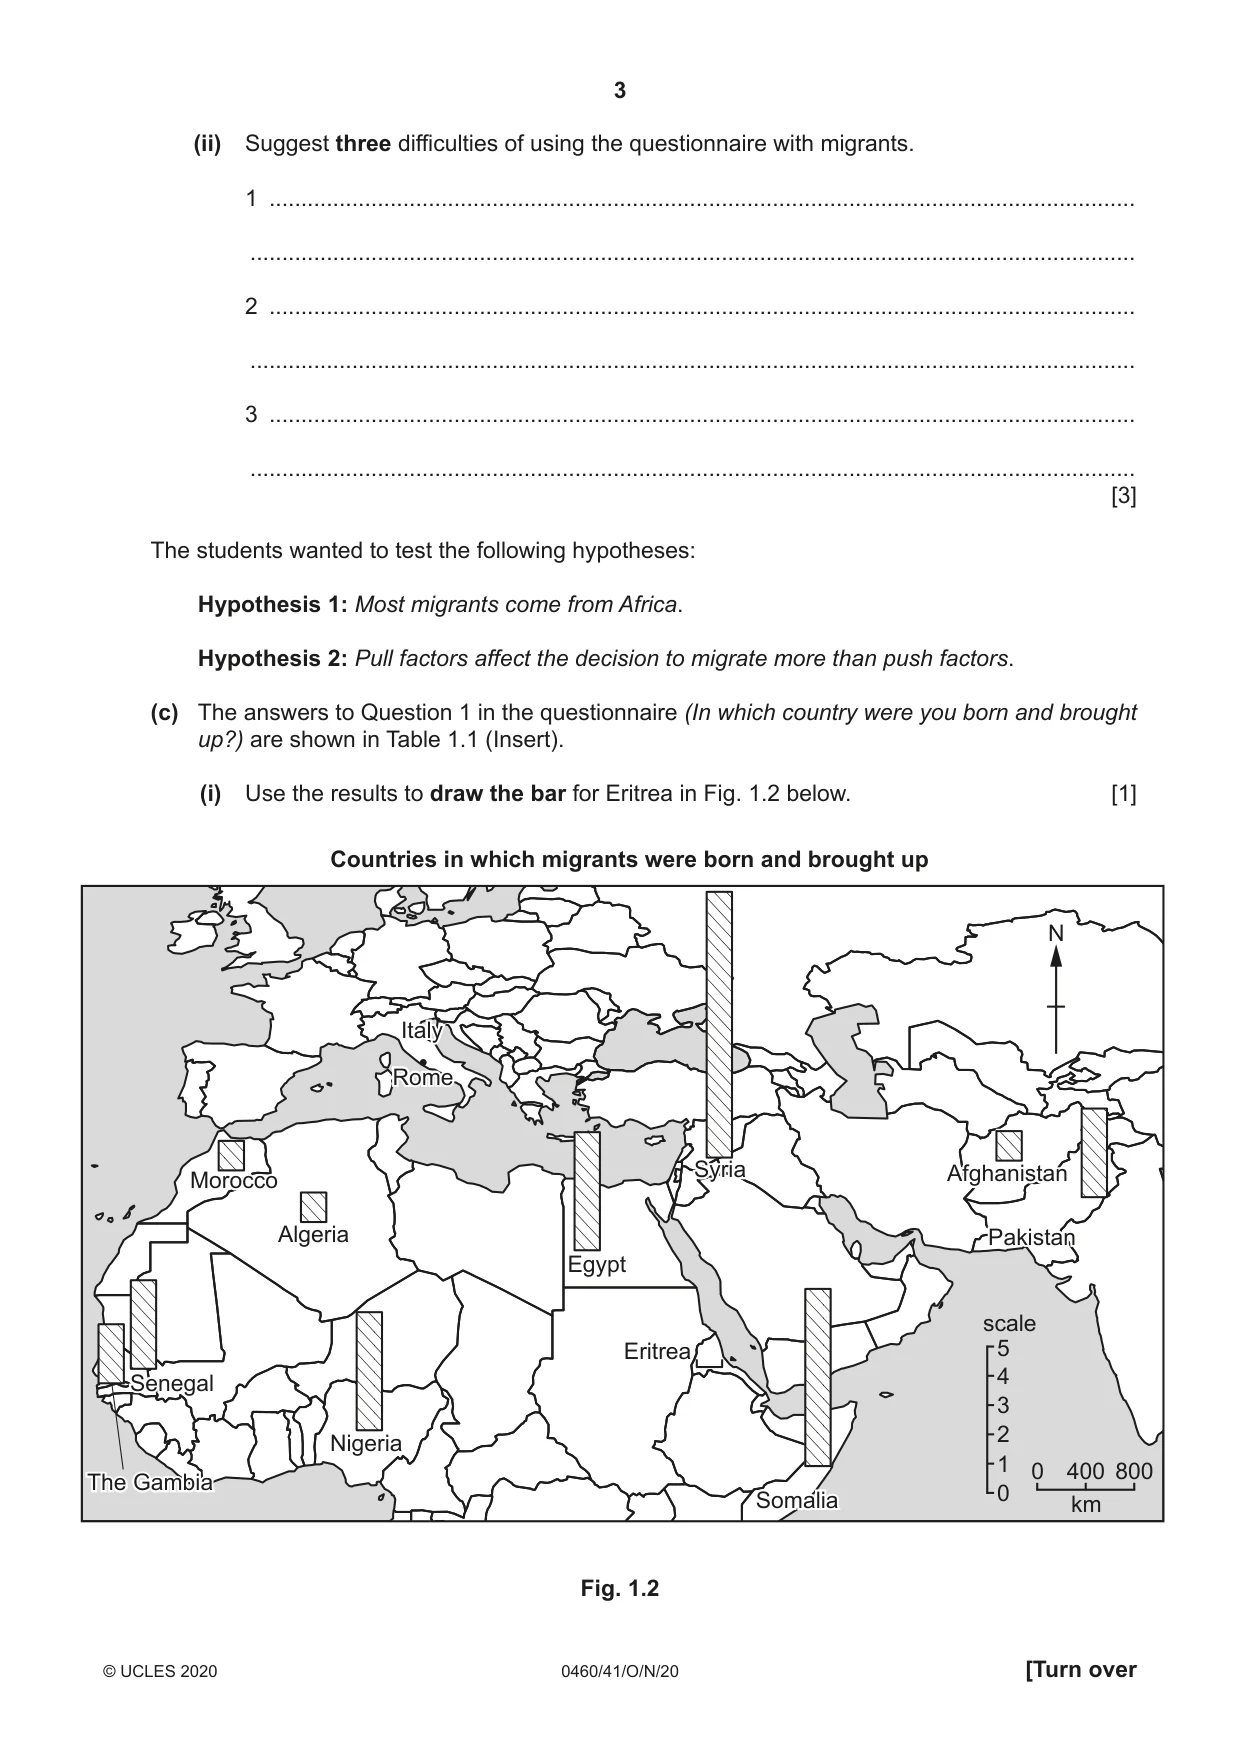
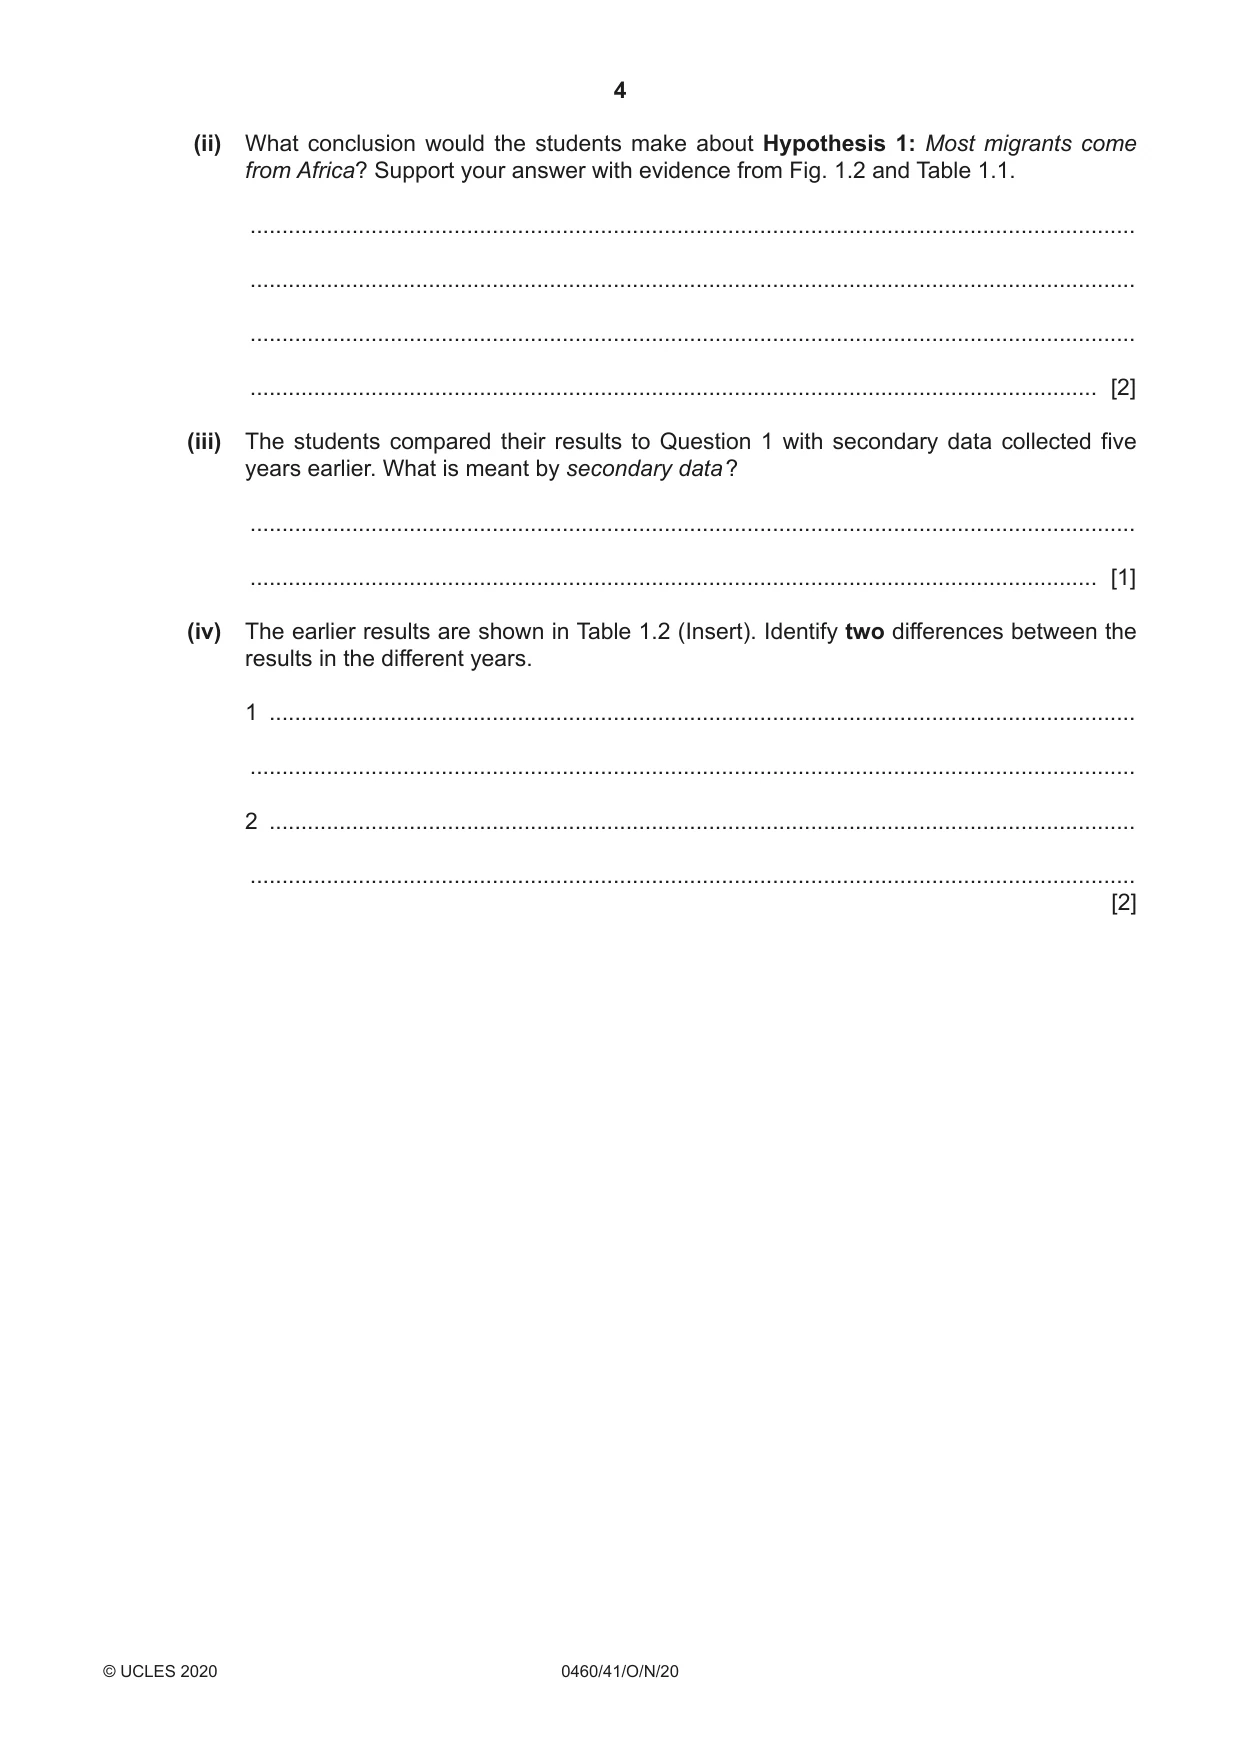
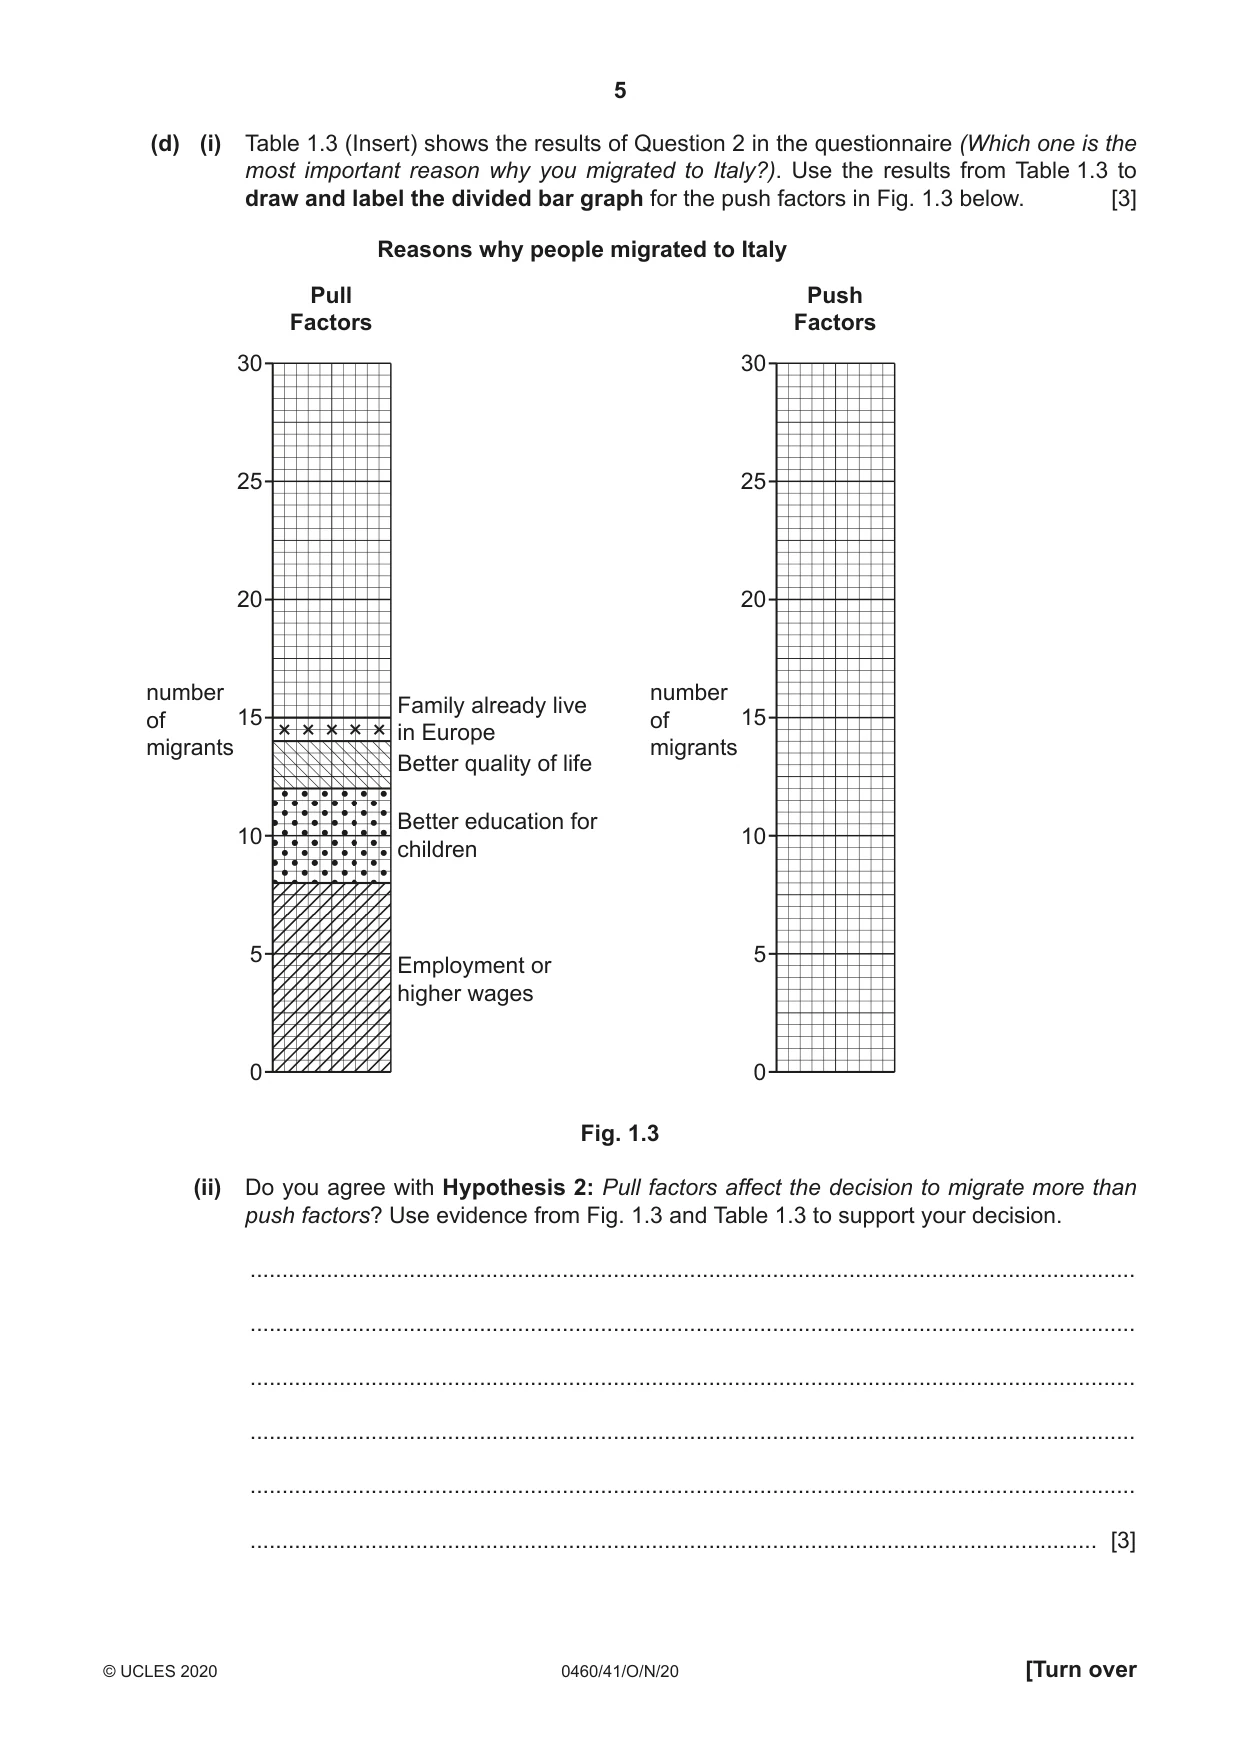
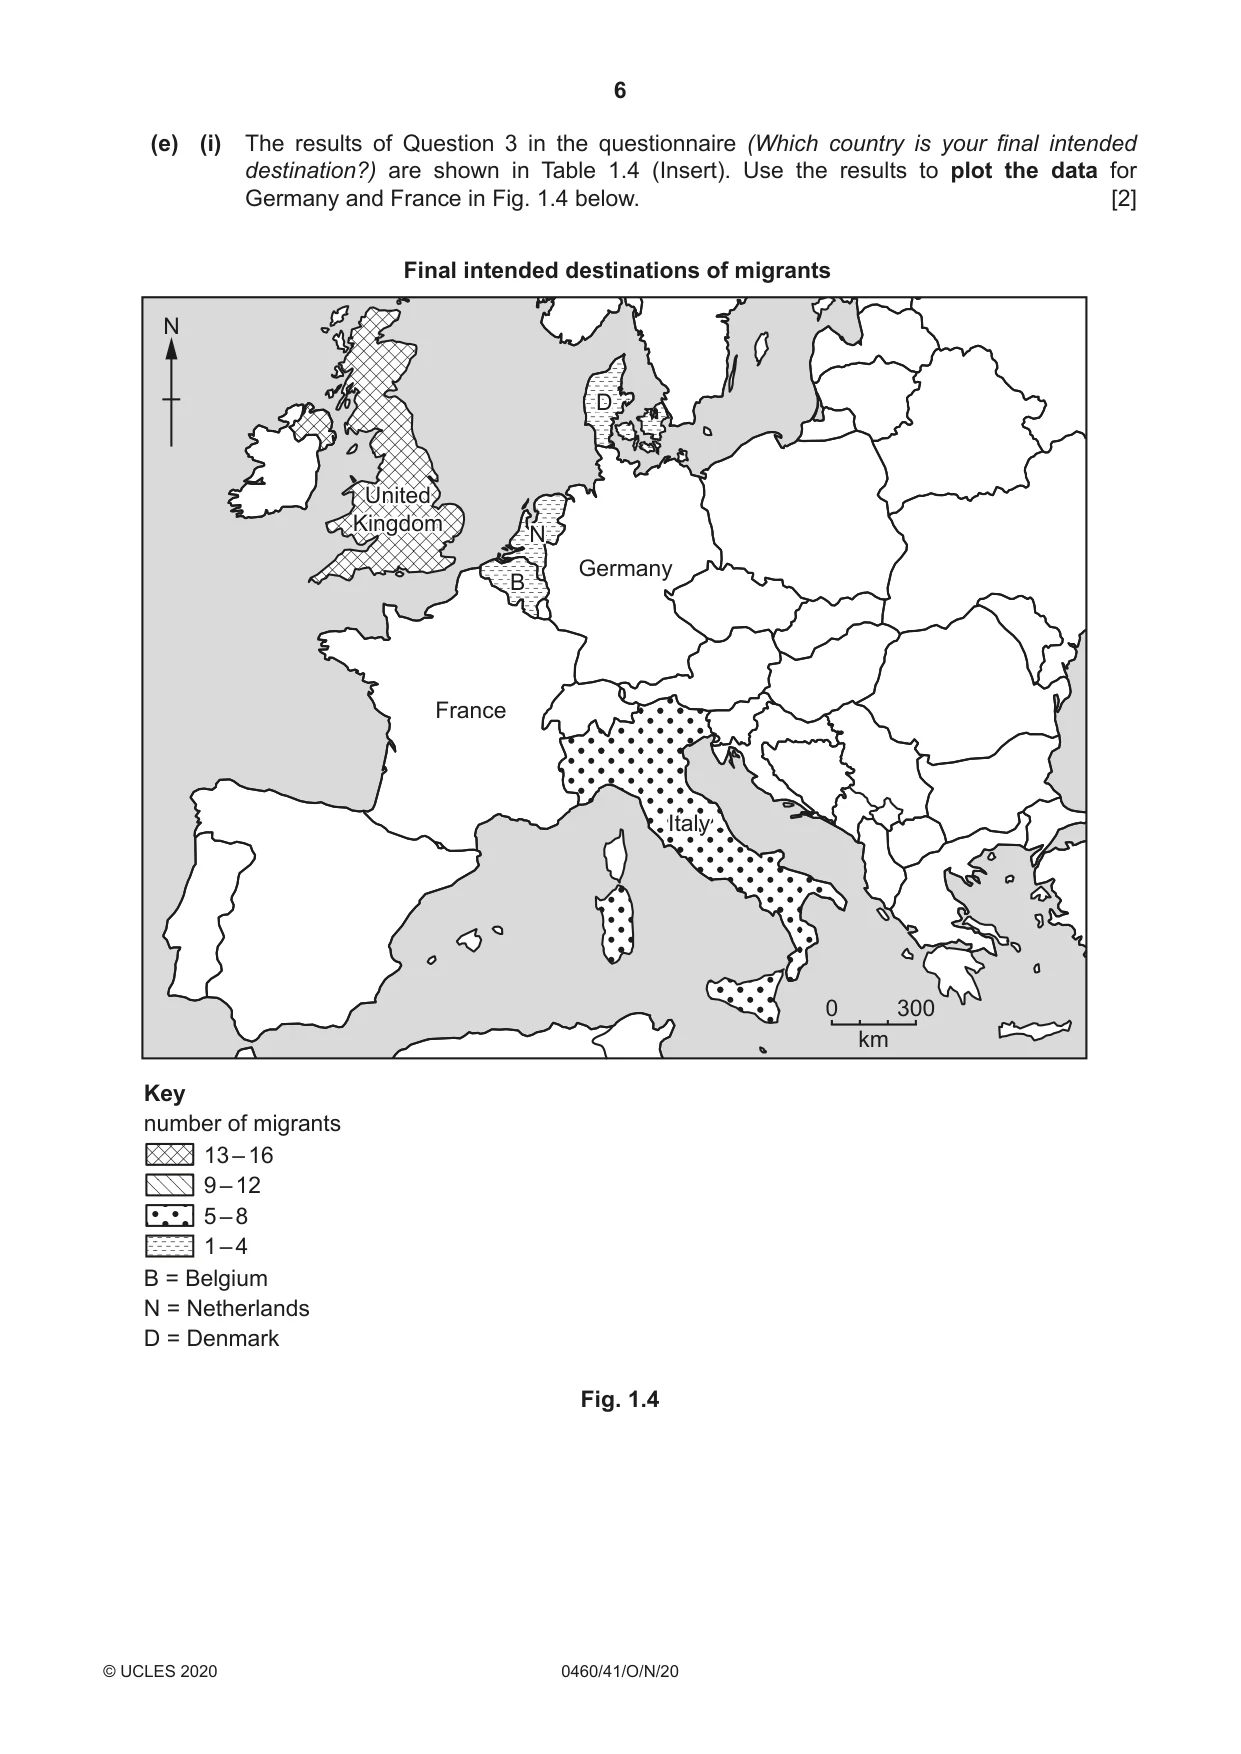
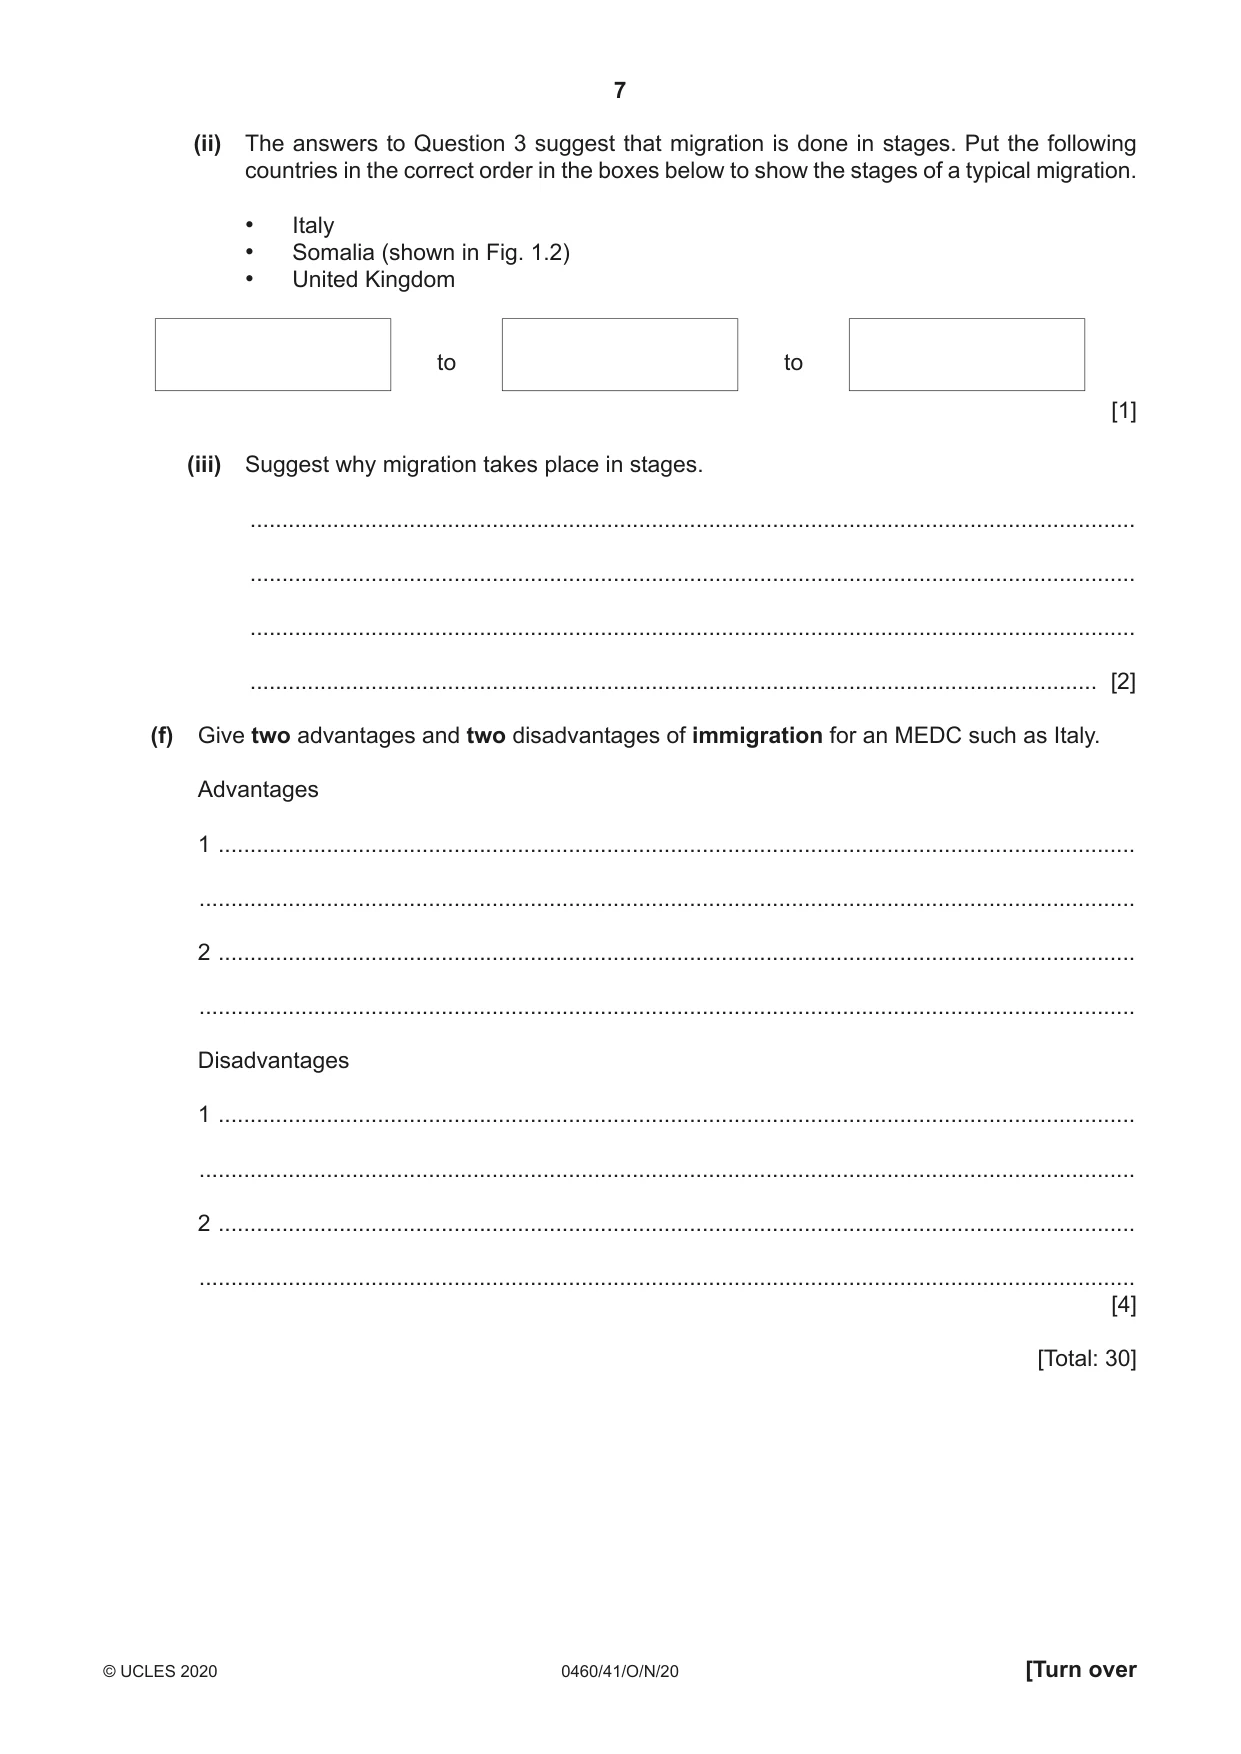
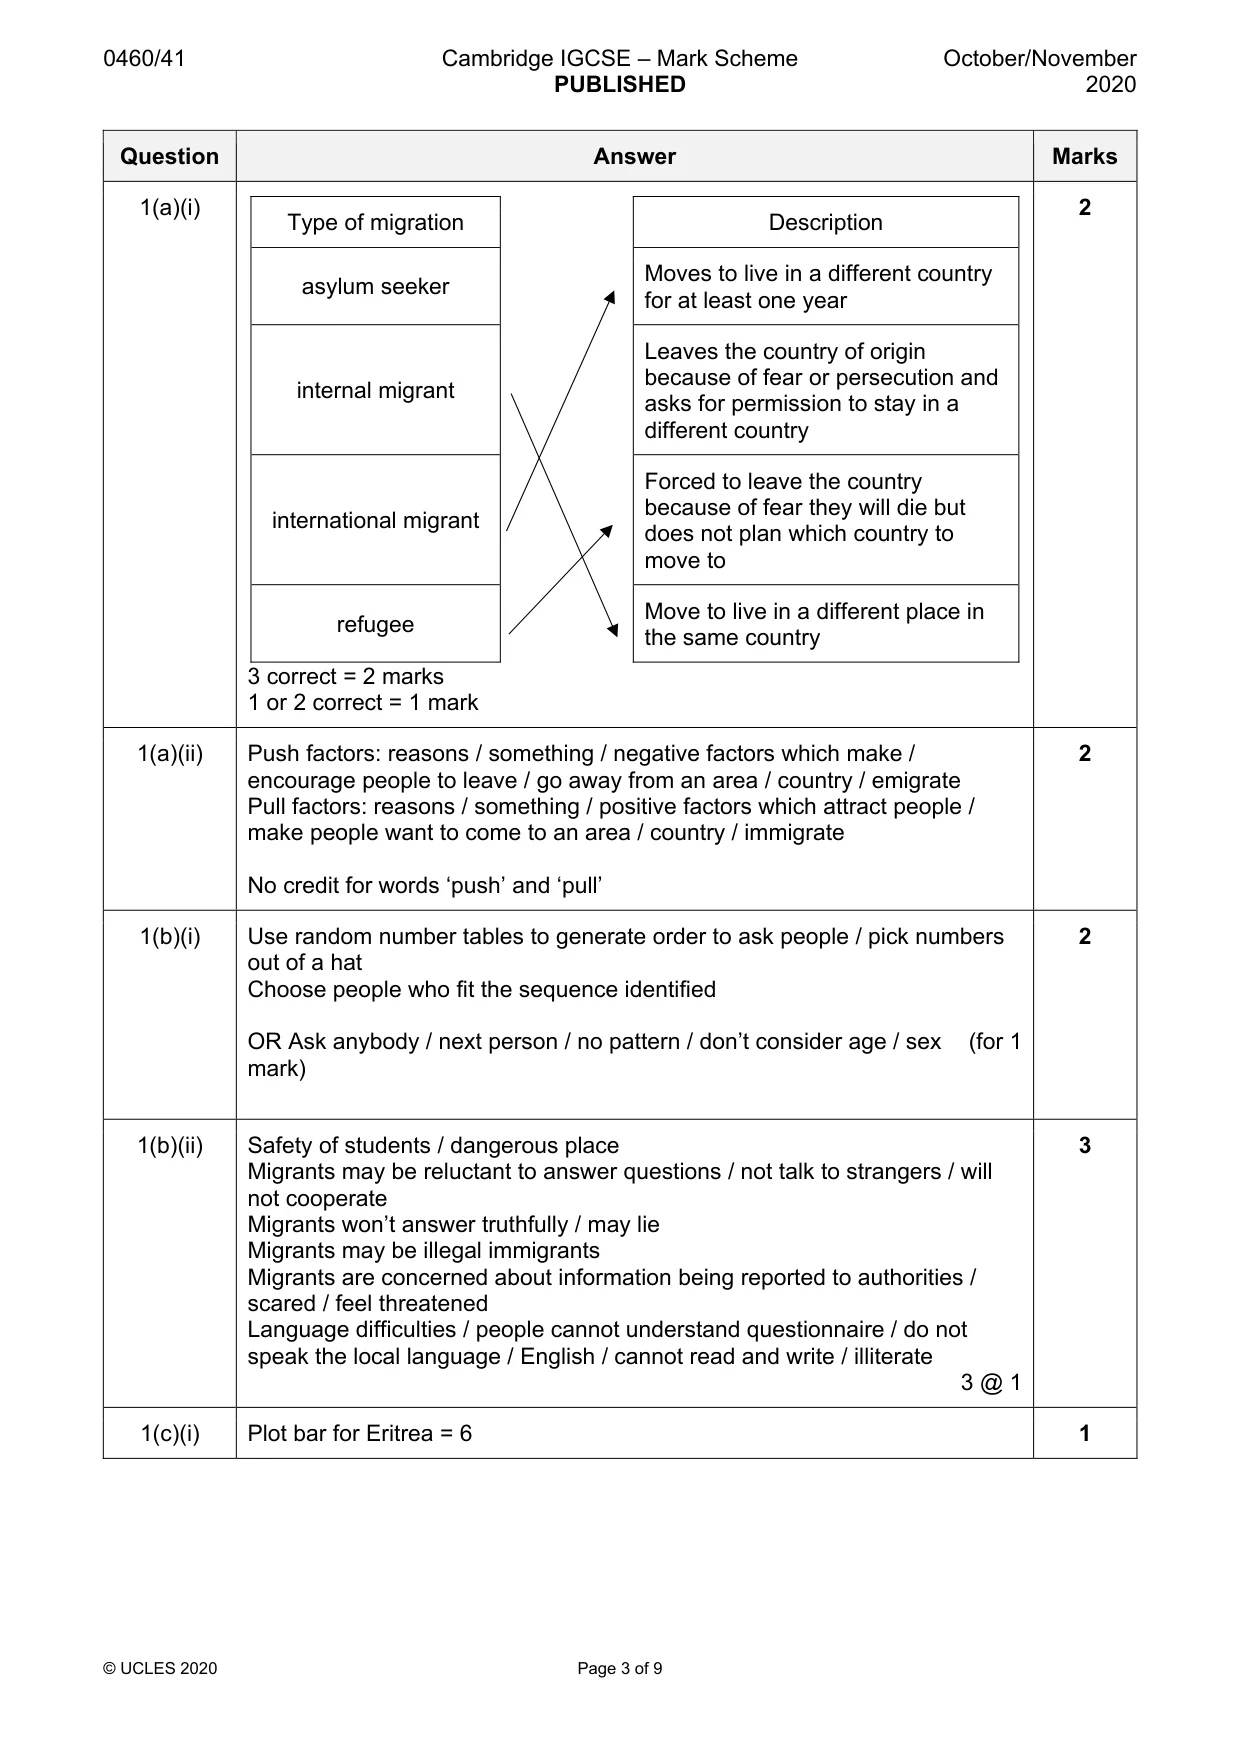
1 Students in Italy were studying population migration. They decided to do a fieldwork investigation about migration into their country. (a) Before they began their fieldwork they revised key terms to do with migration. (i) Match the types of migrant with the correct description. One has been completed for you. Type of migrant Description moves to live in a different country for at asylum seeker least one year leaves the country of origin because internal migrant of fear or persecution and asks for permission to stay in a different country forced to leave the country because international migrant of fear they may die but does not plan which country to move to moves to live in a different place in the refugee same country [2] (ii) Explain the difference between push and pull migration factors. ........................................................................................................................................... ........................................................................................................................................... ........................................................................................................................................... ..................................................................................................................................... [2] (b) The students visited a local town on the coast near Rome to use a questionnaire with 40 migrants who had recently arrived in Italy. The questionnaire is shown in Fig. 1.1 (Insert). (i) They used a random sampling method to select people to complete the questionnaire. Describe this method of sampling. ........................................................................................................................................... ........................................................................................................................................... ........................................................................................................................................... ..................................................................................................................................... [2] (ii) Suggest three difficulties of using the questionnaire with migrants. 1 ........................................................................................................................................ ........................................................................................................................................... 2 ........................................................................................................................................ ........................................................................................................................................... 3 ........................................................................................................................................ ........................................................................................................................................... [3] The students wanted to test the following hypotheses: Hypothesis 1: Most migrants come from Africa. Hypothesis 2: Pull factors affect the decision to migrate more than push factors. (c) The answers to Question 1 in the questionnaire (In which country were you born and brought up?) are shown in Table 1.1 (Insert). (i) Use the results to draw the bar for Eritrea in Fig. 1.2 below. [1] Countries in which migrants were born and brought up N ItalyItaly RomeRome SyriaSyria AfghanistanAfghanistan MoroccoMorocco AlgeriaAlgeria PakistanPakistan EgyptEgypt scale Eritrea 5 4 SenegalSenegal 3 2 NigeriaNigeria 1 0 400 800TheThe GambiaGambia 0 SomaliaSomalia km Fig. 1.2 (ii) What conclusion would the students make about Hypothesis 1: Most migrants come from Africa? Support your answer with evidence from Fig. 1.2 and Table 1.1. ........................................................................................................................................... ........................................................................................................................................... ........................................................................................................................................... ..................................................................................................................................... [2] (iii) The students compared their results to Question 1 with secondary data collected five years earlier. What is meant by secondary data ? ........................................................................................................................................... ..................................................................................................................................... [1] (iv) The earlier results are shown in Table 1.2 (Insert). Identify two differences between the results in the different years. 1 ........................................................................................................................................ ........................................................................................................................................... 2 ........................................................................................................................................ ........................................................................................................................................... [2] (d) (i) Table 1.3 (Insert) shows the results of Question 2 in the questionnaire (Which one is the most important reason why you migrated to Italy?). Use the results from Table 1.3 to draw and label the divided bar graph for the push factors in Fig. 1.3 below. [3] Reasons why people migrated to Italy Pull Push Factors Factors 30 30 25 25 20 20 number number Family already liveof 15 of 15 in Europemigrants migrants Better quality of life Better education for 10 10 children 5 5 Employment or higher wages 0 0 Fig. 1.3 (ii) Do you agree with Hypothesis 2: Pull factors affect the decision to migrate more than push factors? Use evidence from Fig. 1.3 and Table 1.3 to support your decision. ........................................................................................................................................... ........................................................................................................................................... ........................................................................................................................................... ........................................................................................................................................... ........................................................................................................................................... ..................................................................................................................................... [3] (e) (i) The results of Question 3 in the questionnaire (Which country is your final intended destination?) are shown in Table 1.4 (Insert). Use the results to plot the data for Germany and France in Fig. 1.4 below. [2] Final intended destinations of migrants N DD UnitedUnited KingdomKingdom NN Germany BB France ItalyItaly 0 300 km Key number of migrants 13 – 16 9 – 12 5 – 8 1 – 4 B = Belgium N = Netherlands D = Denmark Fig. 1.4 (ii) The answers to Question 3 suggest that migration is done in stages. Put the following countries in the correct order in the boxes below to show the stages of a typical migration. • Italy • Somalia (shown in Fig. 1.2) • United Kingdom to to [1] (iii) Suggest why migration takes place in stages. ........................................................................................................................................... ........................................................................................................................................... ........................................................................................................................................... ..................................................................................................................................... [2] (f) Give two advantages and two disadvantages of immigration for an MEDC such as Italy. Advantages 1 ................................................................................................................................................ ................................................................................................................................................... 2 ................................................................................................................................................ ................................................................................................................................................... Disadvantages 1 ................................................................................................................................................ ................................................................................................................................................... 2 ................................................................................................................................................ ................................................................................................................................................... [4] [Total: 30]
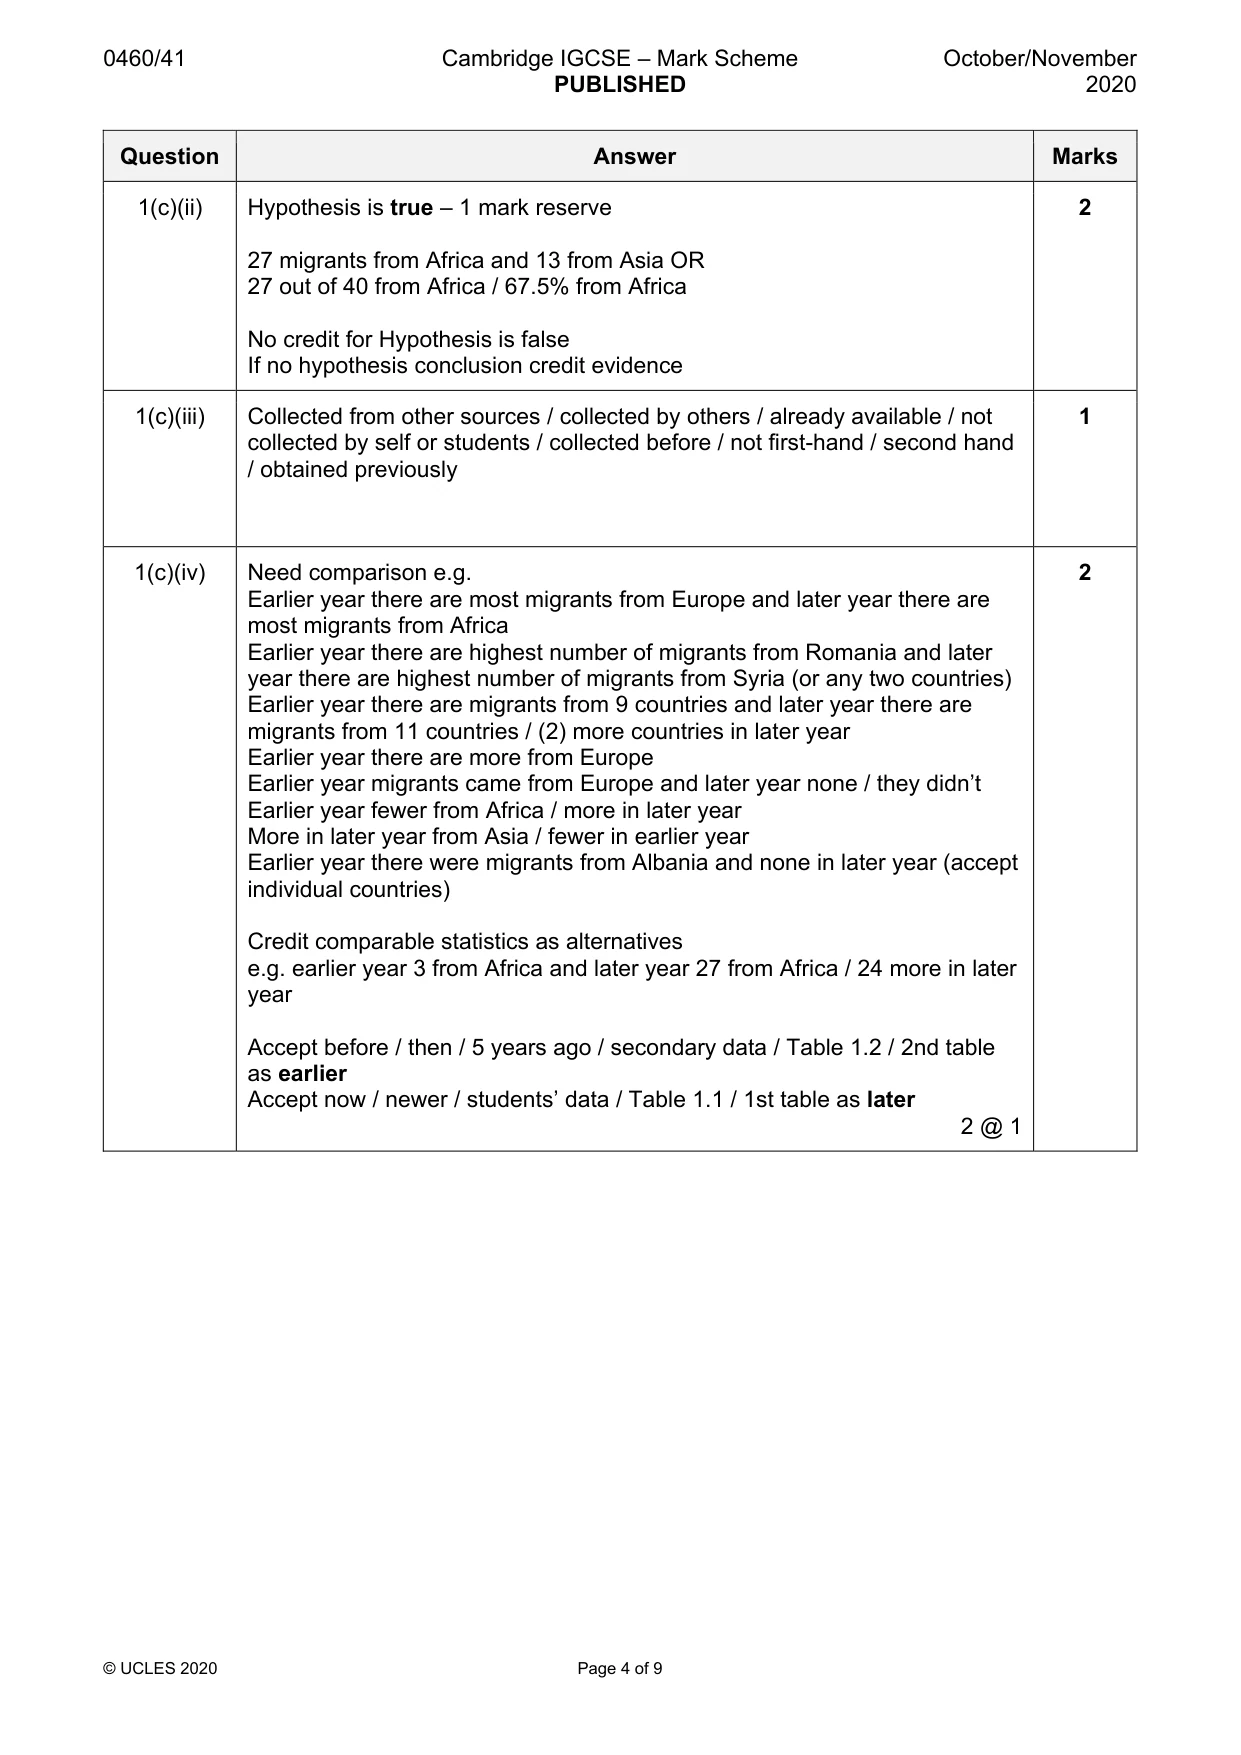
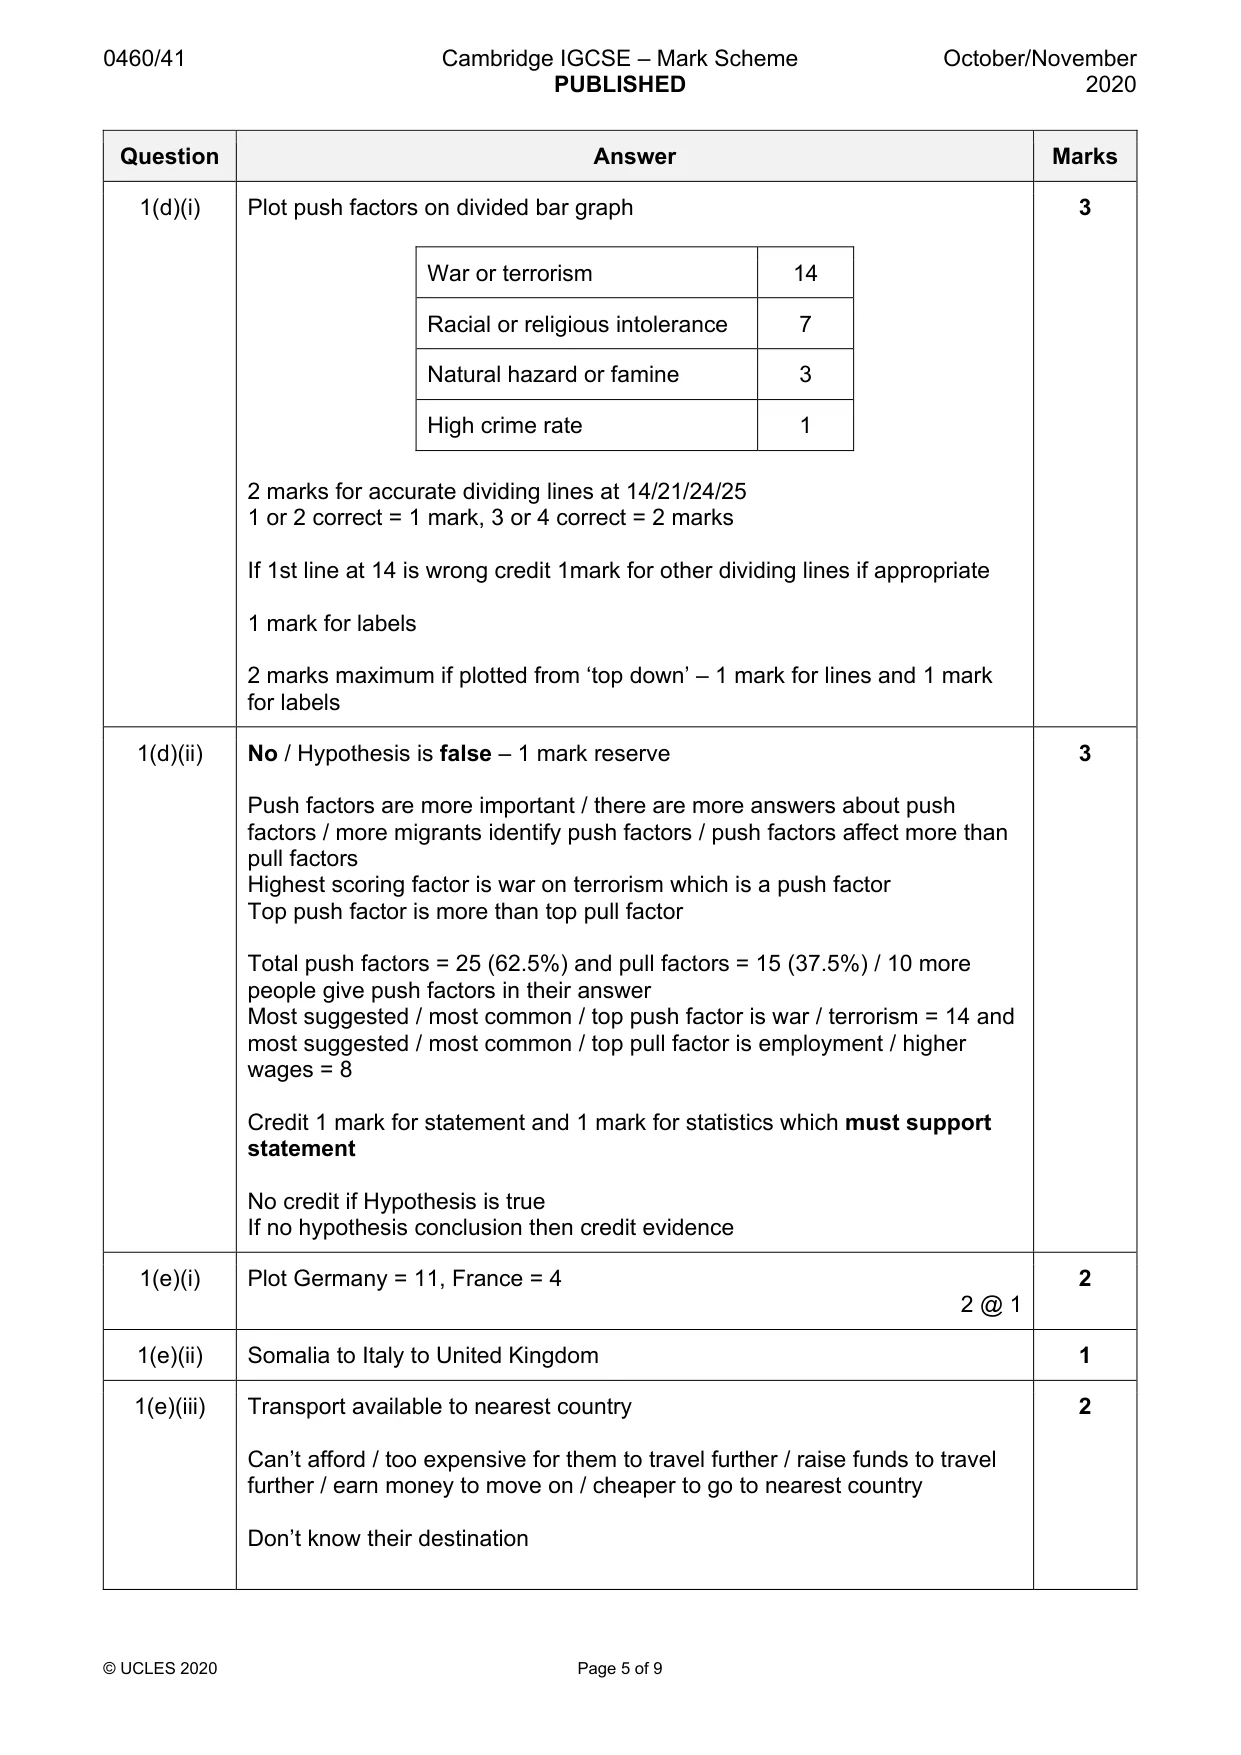
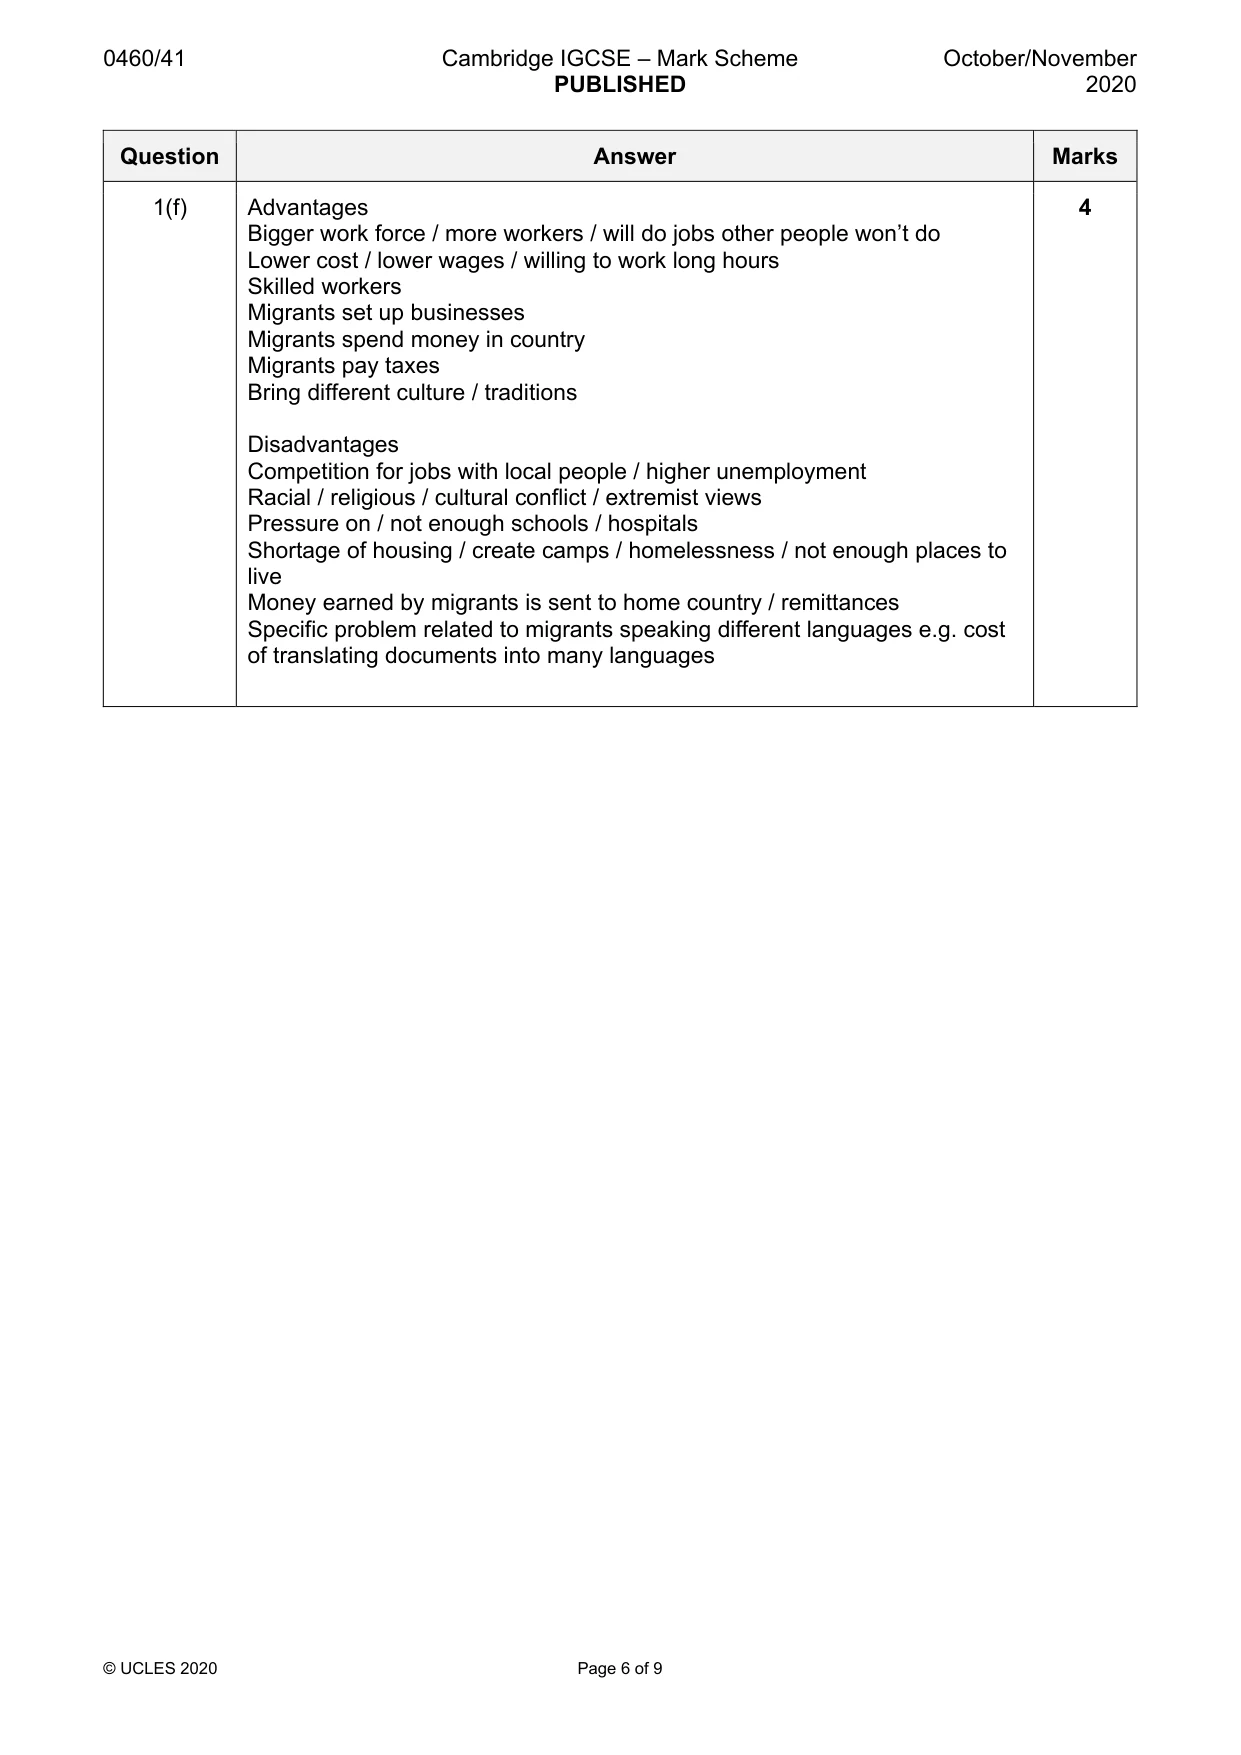
Mark scheme: Question Answer Marks 1(a)(i) 2 Type of migration Description Moves to live in a different country asylum seeker for at least one year Leaves the country of origin because of fear or persecution and internal migrant asks for permission to stay in a different country Forced to leave the country because of fear they will die but international migrant does not plan which country to move to Move to live in a different place in refugee the same country 3 correct = 2 marks 1 or 2 correct = 1 mark 1(a)(ii) Push factors: reasons / something / negative factors which make / 2 encourage people to leave / go away from an area / country / emigrate Pull factors: reasons / something / positive factors which attract people / make people want to come to an area / country / immigrate No credit for words ‘push’ and ‘pull’ 1(b)(i) Use random number tables to generate order to ask people / pick numbers 2 out of a hat Choose people who fit the sequence identified OR Ask anybody / next person / no pattern / don’t consider age / sex (for 1 mark) 1(b)(ii) Safety of students / dangerous place 3 Migrants may be reluctant to answer questions / not talk to strangers / will not cooperate Migrants won’t answer truthfully / may lie Migrants may be illegal immigrants Migrants are concerned about information being reported to authorities / scared / feel threatened Language difficulties / people cannot understand questionnaire / do not speak the local language / English / cannot read and write / illiterate 3 @ 1 1(c)(i) Plot bar for Eritrea = 6 1 1(c)(ii) Hypothesis is true – 1 mark reserve 2 27 migrants from Africa and 13 from Asia OR 27 out of 40 from Africa / 67.5% from Africa No credit for Hypothesis is false If no hypothesis conclusion credit evidence 1(c)(iii) Collected from other sources / collected by others / already available / not 1 collected by self or students / collected before / not first-hand / second hand / obtained previously 1(c)(iv) Need comparison e.g. 2 Earlier year there are most migrants from Europe and later year there are most migrants from Africa Earlier year there are highest number of migrants from Romania and later year there are highest number of migrants from Syria (or any two countries) Earlier year there are migrants from 9 countries and later year there are migrants from 11 countries / (2) more countries in later year Earlier year there are more from Europe Earlier year migrants came from Europe and later year none / they didn’t Earlier year fewer from Africa / more in later year More in later year from Asia / fewer in earlier year Earlier year there were migrants from Albania and none in later year (accept individual countries) Credit comparable statistics as alternatives e.g. earlier year 3 from Africa and later year 27 from Africa / 24 more in later year Accept before / then / 5 years ago / secondary data / Table 1.2 / 2nd table as earlier Accept now / newer / students’ data / Table 1.1 / 1st table as later 2 @ 1 1(d)(i) Plot push factors on divided bar graph 3 War or terrorism 14 Racial or religious intolerance 7 Natural hazard or famine 3 High crime rate 1 2 marks for accurate dividing lines at 14/21/24/25 1 or 2 correct = 1 mark, 3 or 4 correct = 2 marks If 1st line at 14 is wrong credit 1mark for other dividing lines if appropriate 1 mark for labels 2 marks maximum if plotted from ‘top down’ – 1 mark for lines and 1 mark for labels 1(d)(ii) No / Hypothesis is false – 1 mark reserve 3 Push factors are more important / there are more answers about push factors / more migrants identify push factors / push factors affect more than pull factors Highest scoring factor is war on terrorism which is a push factor Top push factor is more than top pull factor Total push factors = 25 (62.5%) and pull factors = 15 (37.5%) / 10 more people give push factors in their answer Most suggested / most common / top push factor is war / terrorism = 14 and most suggested / most common / top pull factor is employment / higher wages = 8 Credit 1 mark for statement and 1 mark for statistics which must support statement No credit if Hypothesis is true If no hypothesis conclusion then credit evidence 1(e)(i) Plot Germany = 11, France = 4 2 2 @ 1 1(e)(ii) Somalia to Italy to United Kingdom 1 1(e)(iii) Transport available to nearest country 2 Can’t afford / too expensive for them to travel further / raise funds to travel further / earn money to move on / cheaper to go to nearest country Don’t know their destination 1(f) Advantages 4 Bigger work force / more workers / will do jobs other people won’t do Lower cost / lower wages / willing to work long hours Skilled workers Migrants set up businesses Migrants spend money in country Migrants pay taxes Bring different culture / traditions Disadvantages Competition for jobs with local people / higher unemployment Racial / religious / cultural conflict / extremist views Pressure on / not enough schools / hospitals Shortage of housing / create camps / homelessness / not enough places to live Money earned by migrants is sent to home country / remittances Specific problem related to migrants speaking different languages e.g. cost of translating documents into many languages
Q2 · Students were studying the Bradshaw model which describes how the characteristics of a…
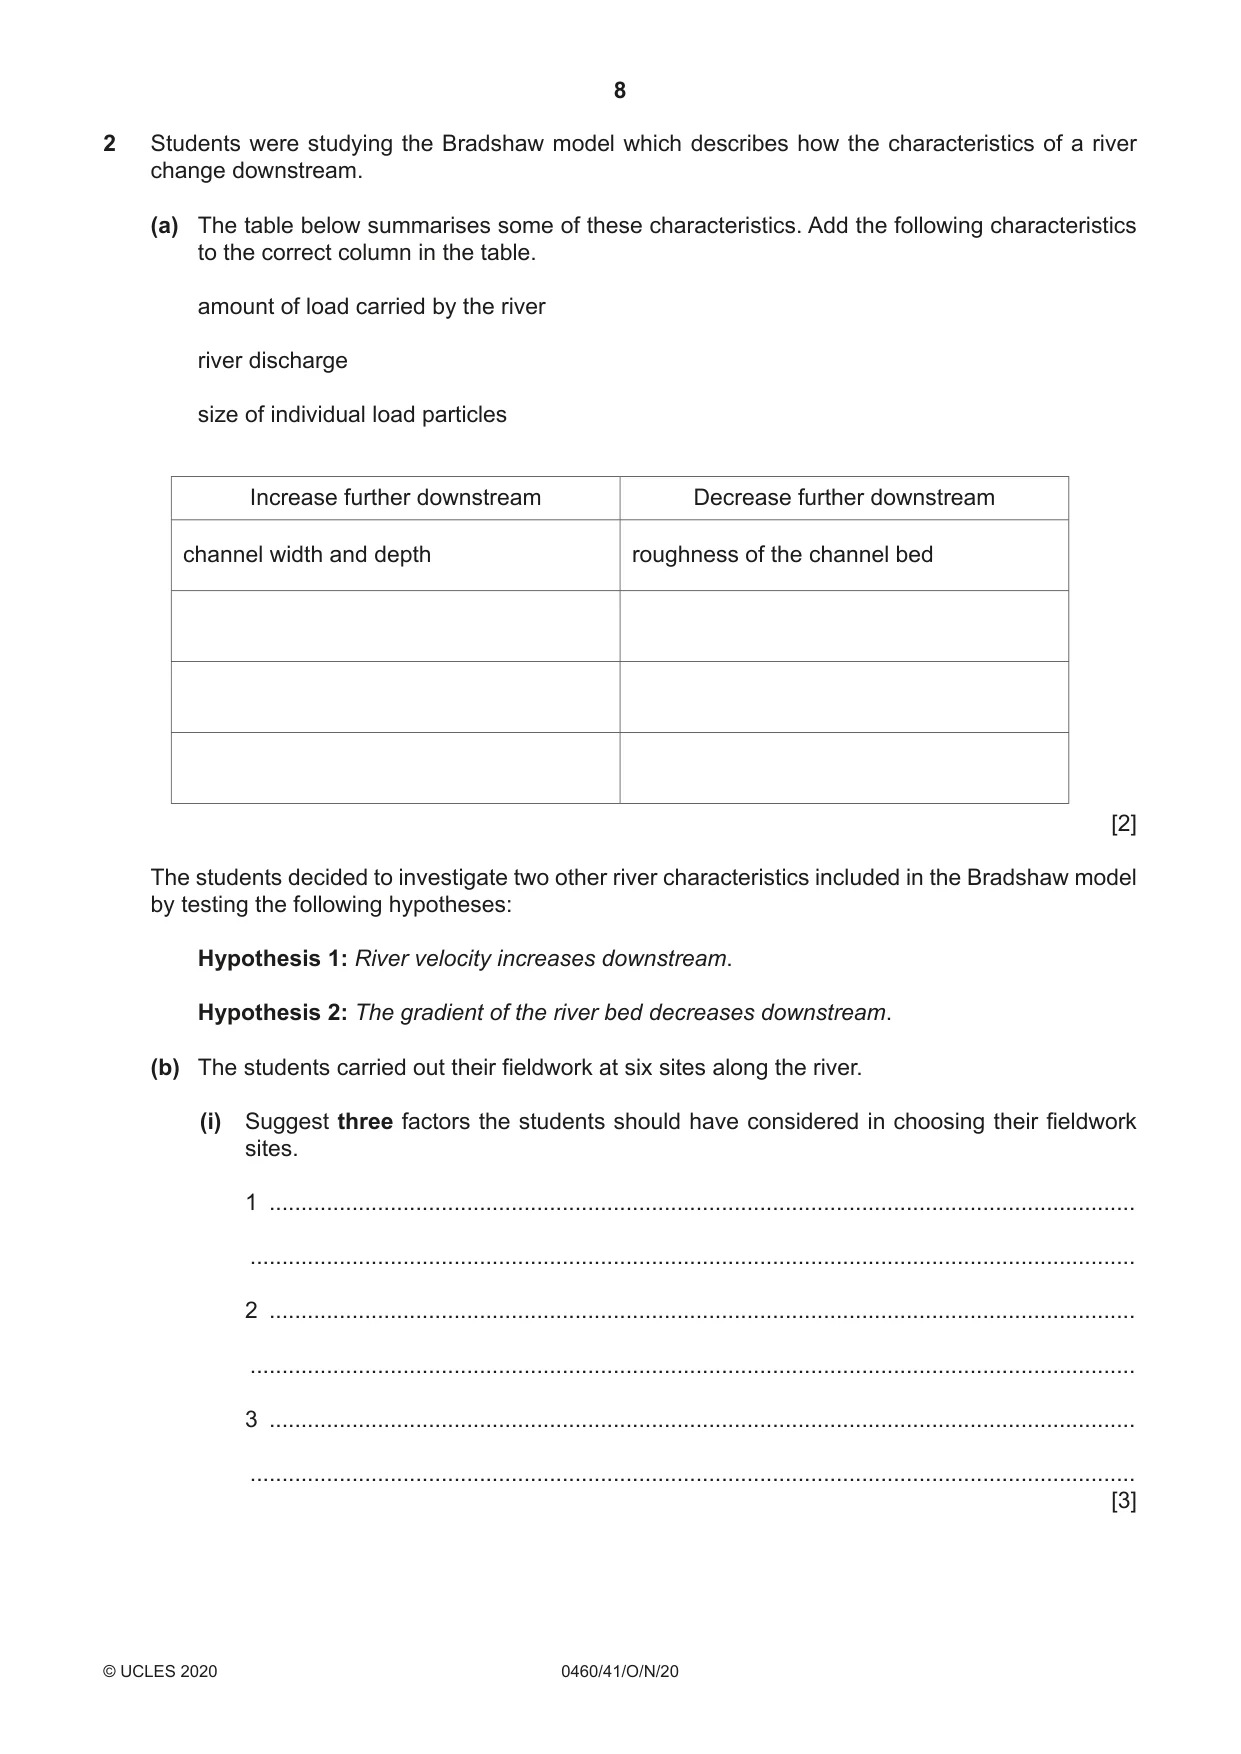
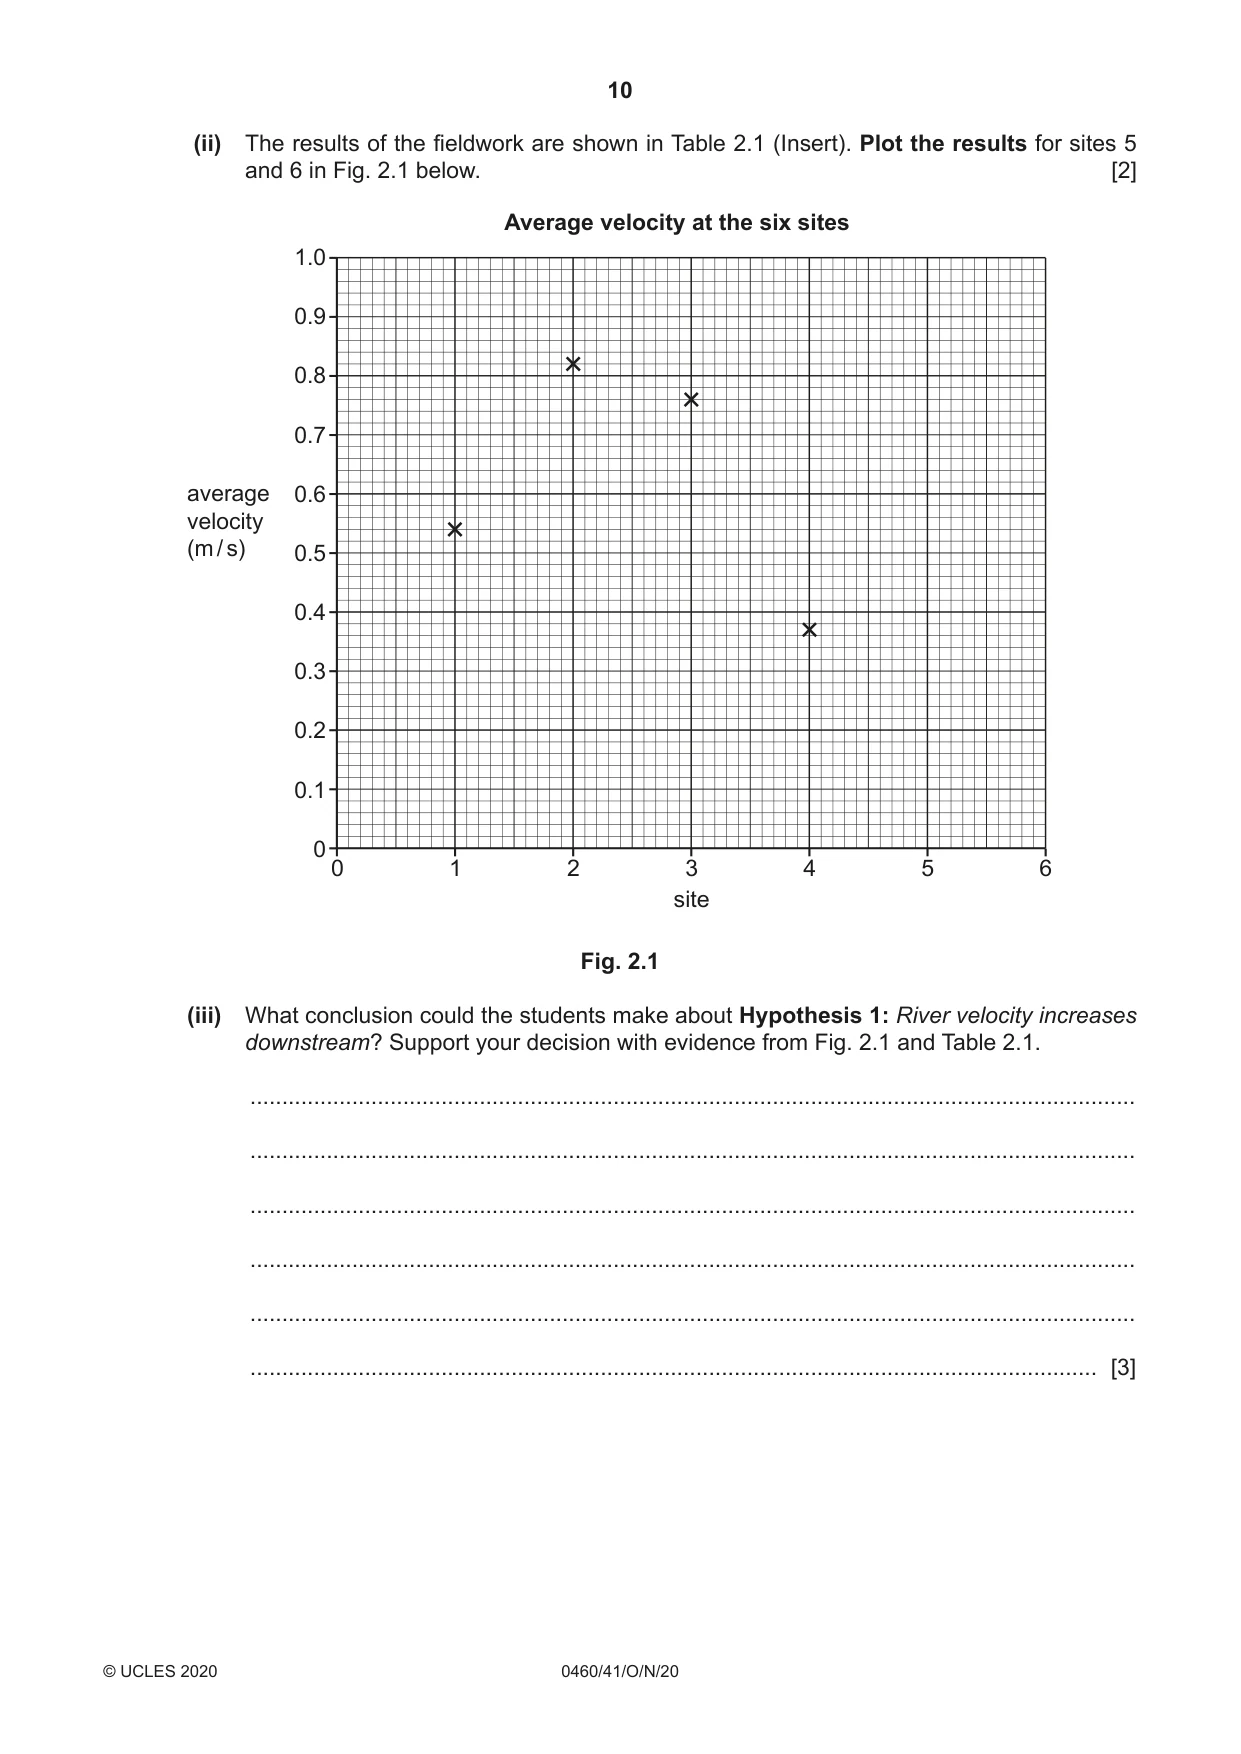
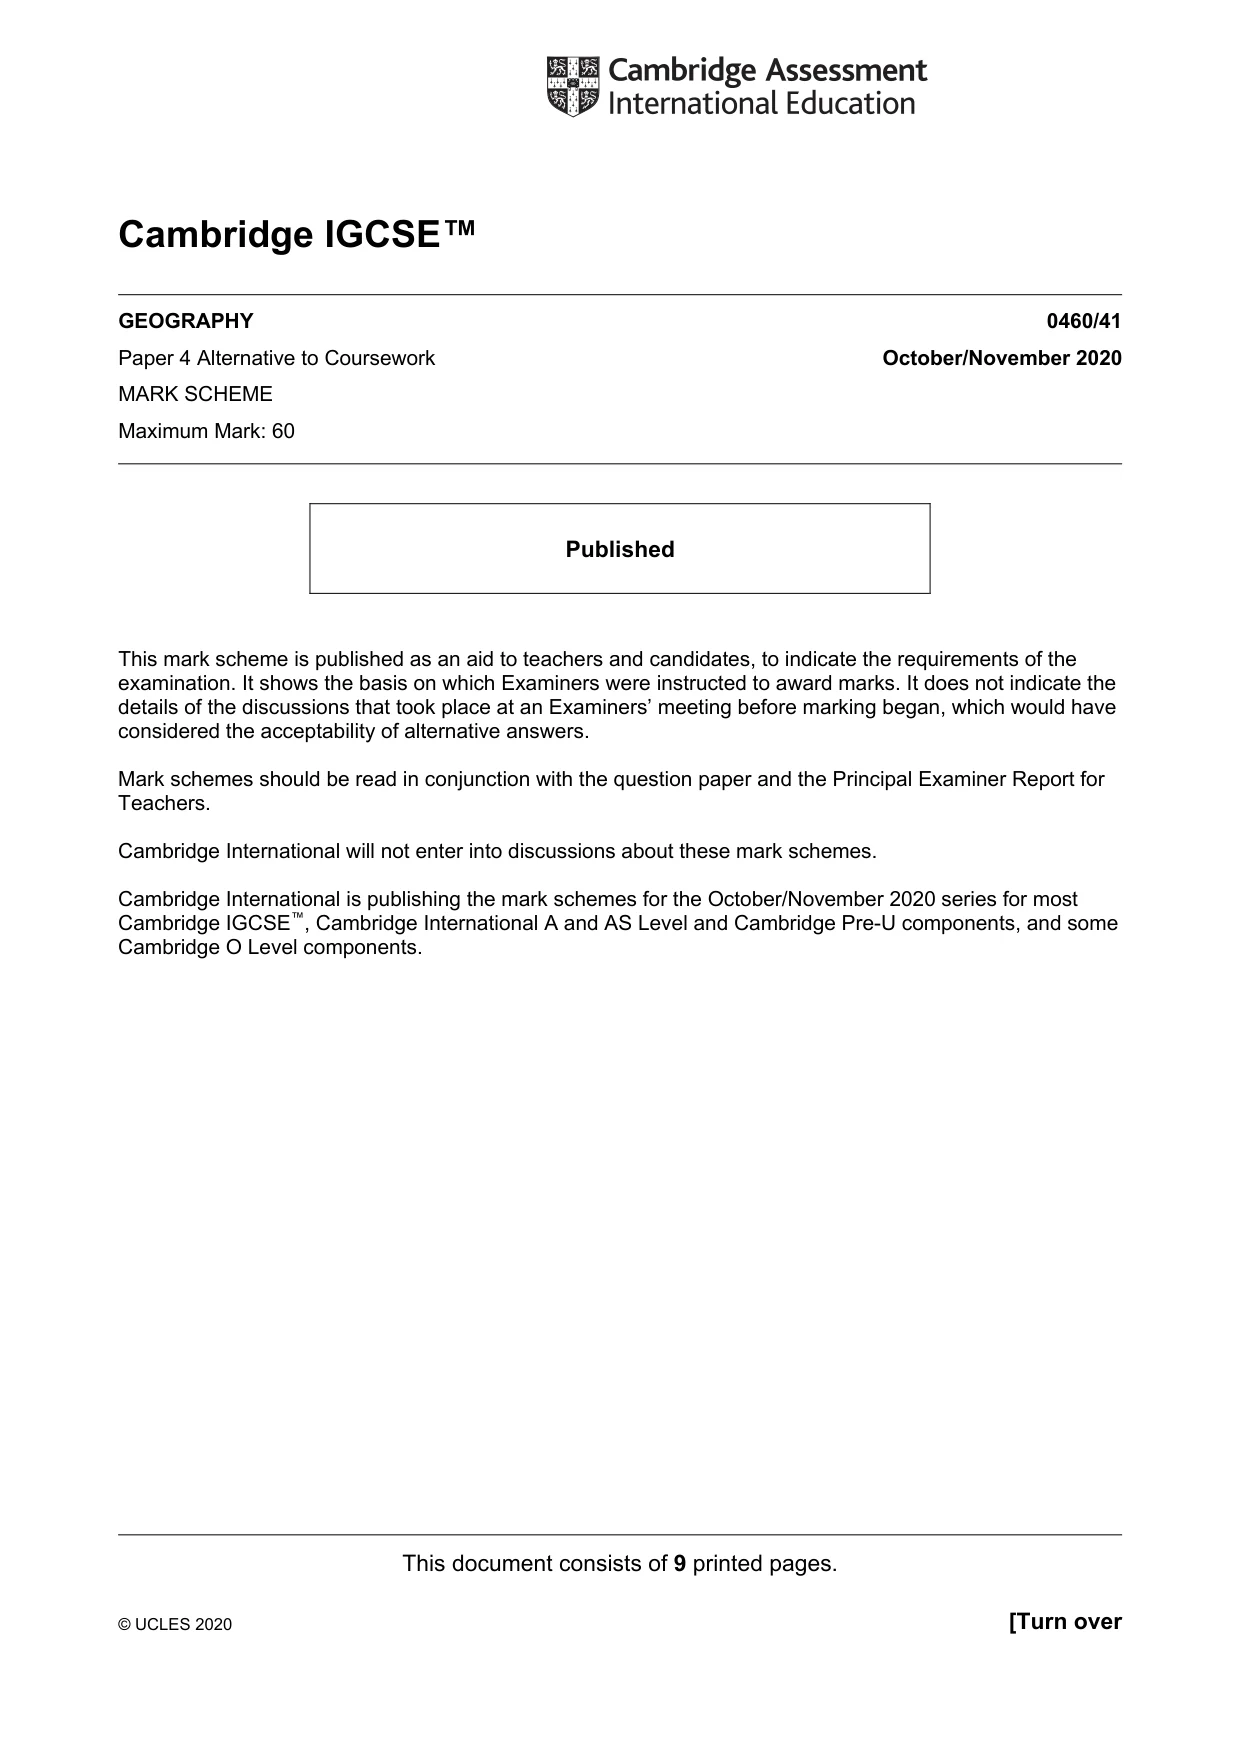
2 Students were studying the Bradshaw model which describes how the characteristics of a river change downstream. (a) The table below summarises some of these characteristics. Add the following characteristics to the correct column in the table. amount of load carried by the river river discharge size of individual load particles Increase further downstream Decrease further downstream channel width and depth roughness of the channel bed [2] The students decided to investigate two other river characteristics included in the Bradshaw model by testing the following hypotheses: Hypothesis 1: River velocity increases downstream. Hypothesis 2: The gradient of the river bed decreases downstream. (b) The students carried out their fieldwork at six sites along the river. (i) Suggest three factors the students should have considered in choosing their fieldwork sites. 1 ........................................................................................................................................ ........................................................................................................................................... 2 ........................................................................................................................................ ........................................................................................................................................... 3 ........................................................................................................................................ ........................................................................................................................................... [3] (ii) The students made all their measurements on the same day. Suggest why this was important. ........................................................................................................................................... ..................................................................................................................................... [1] (c) (i) To investigate Hypothesis 1: River velocity increases downstream, the students used the following equipment: float stop-watch tape measure two ranging poles Describe how the students used this equipment to measure river velocity. ........................................................................................................................................... ........................................................................................................................................... ........................................................................................................................................... ........................................................................................................................................... ........................................................................................................................................... ........................................................................................................................................... ........................................................................................................................................... ..................................................................................................................................... [4] (ii) The results of the fieldwork are shown in Table 2.1 (Insert). Plot the results for sites 5 and 6 in Fig. 2.1 below. [2] Average velocity at the six sites 1.0 0.9 0.8 0.7 average 0.6 velocity (m / s) 0.5 0.4 0.3 0.2 0.1 0 0 1 2 3 4 5 6 site Fig. 2.1 (iii) What conclusion could the students make about Hypothesis 1: River velocity increases downstream? Support your decision with evidence from Fig. 2.1 and Table 2.1. ........................................................................................................................................... ........................................................................................................................................... ........................................................................................................................................... ........................................................................................................................................... ........................................................................................................................................... ..................................................................................................................................... [3]
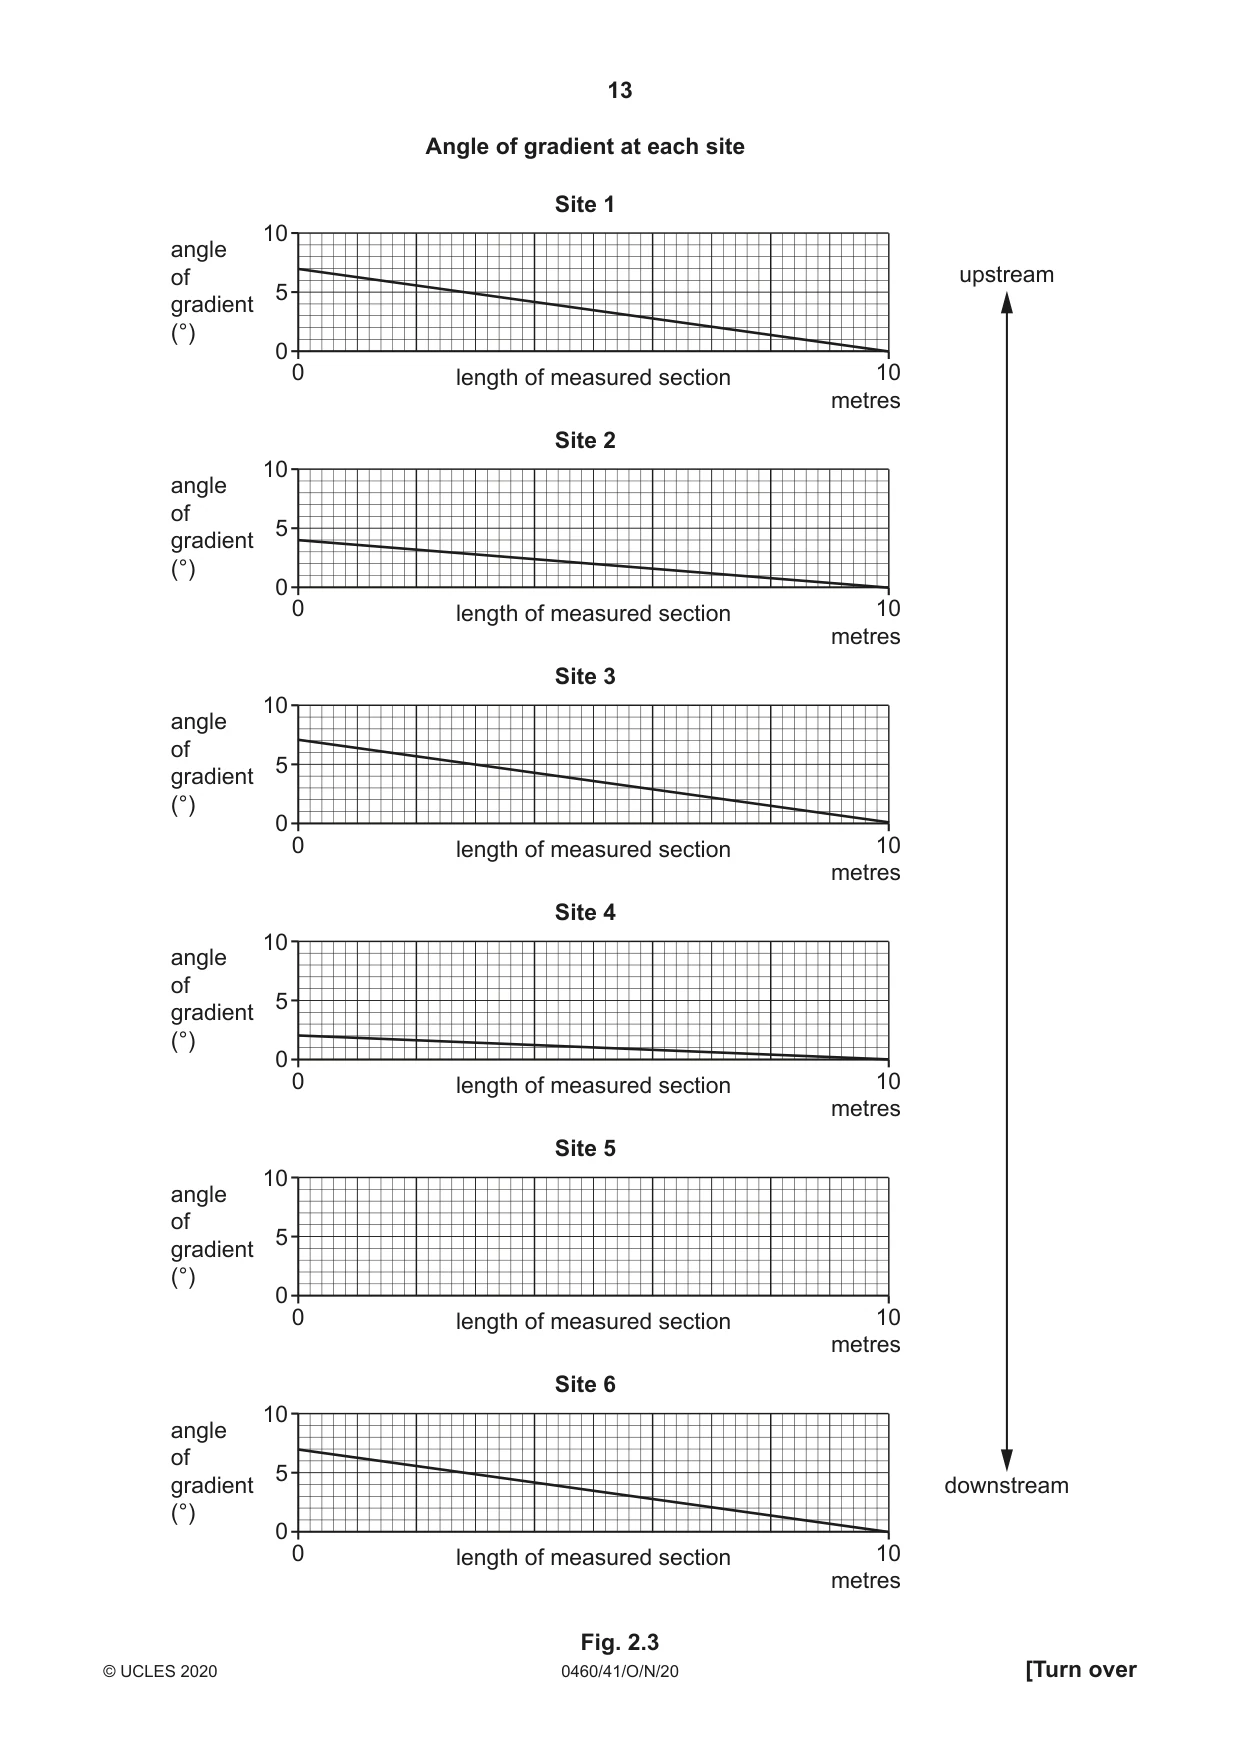
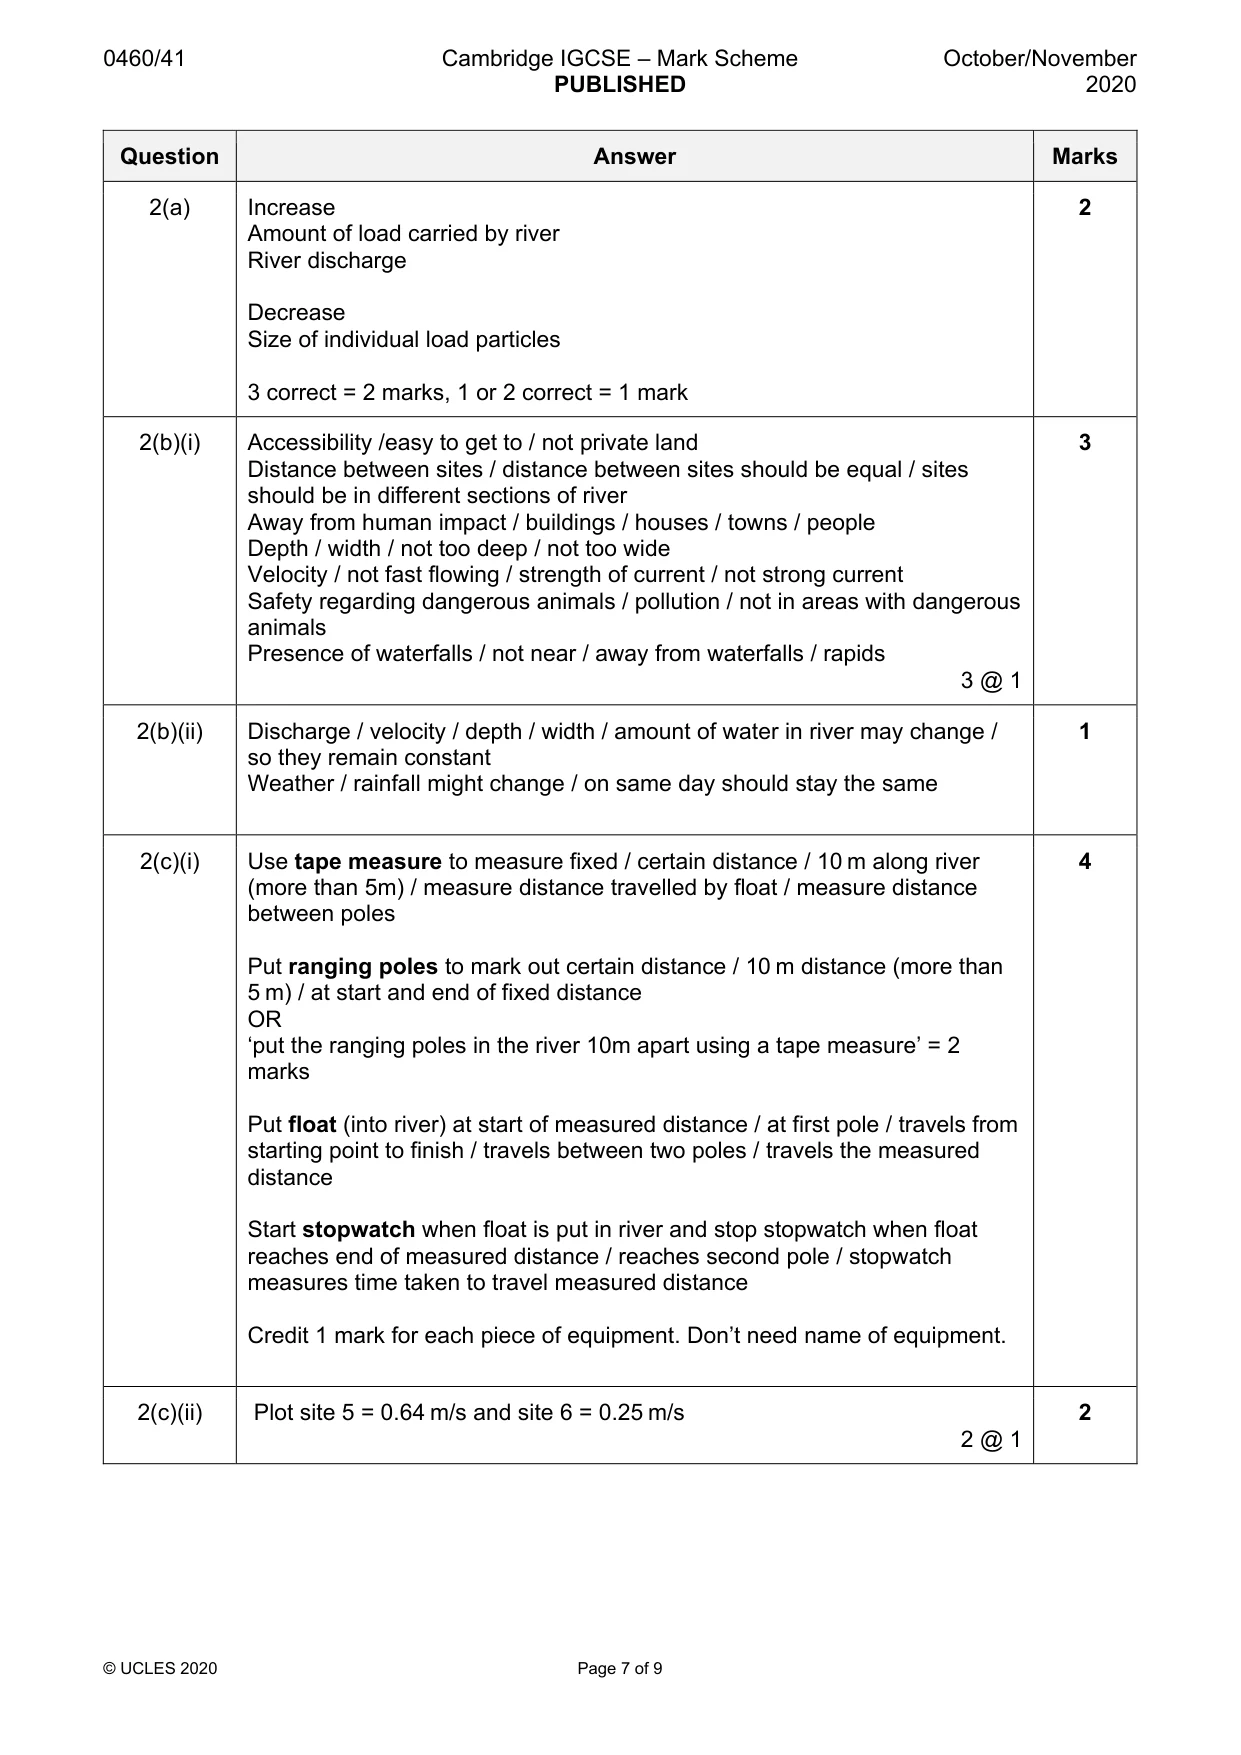
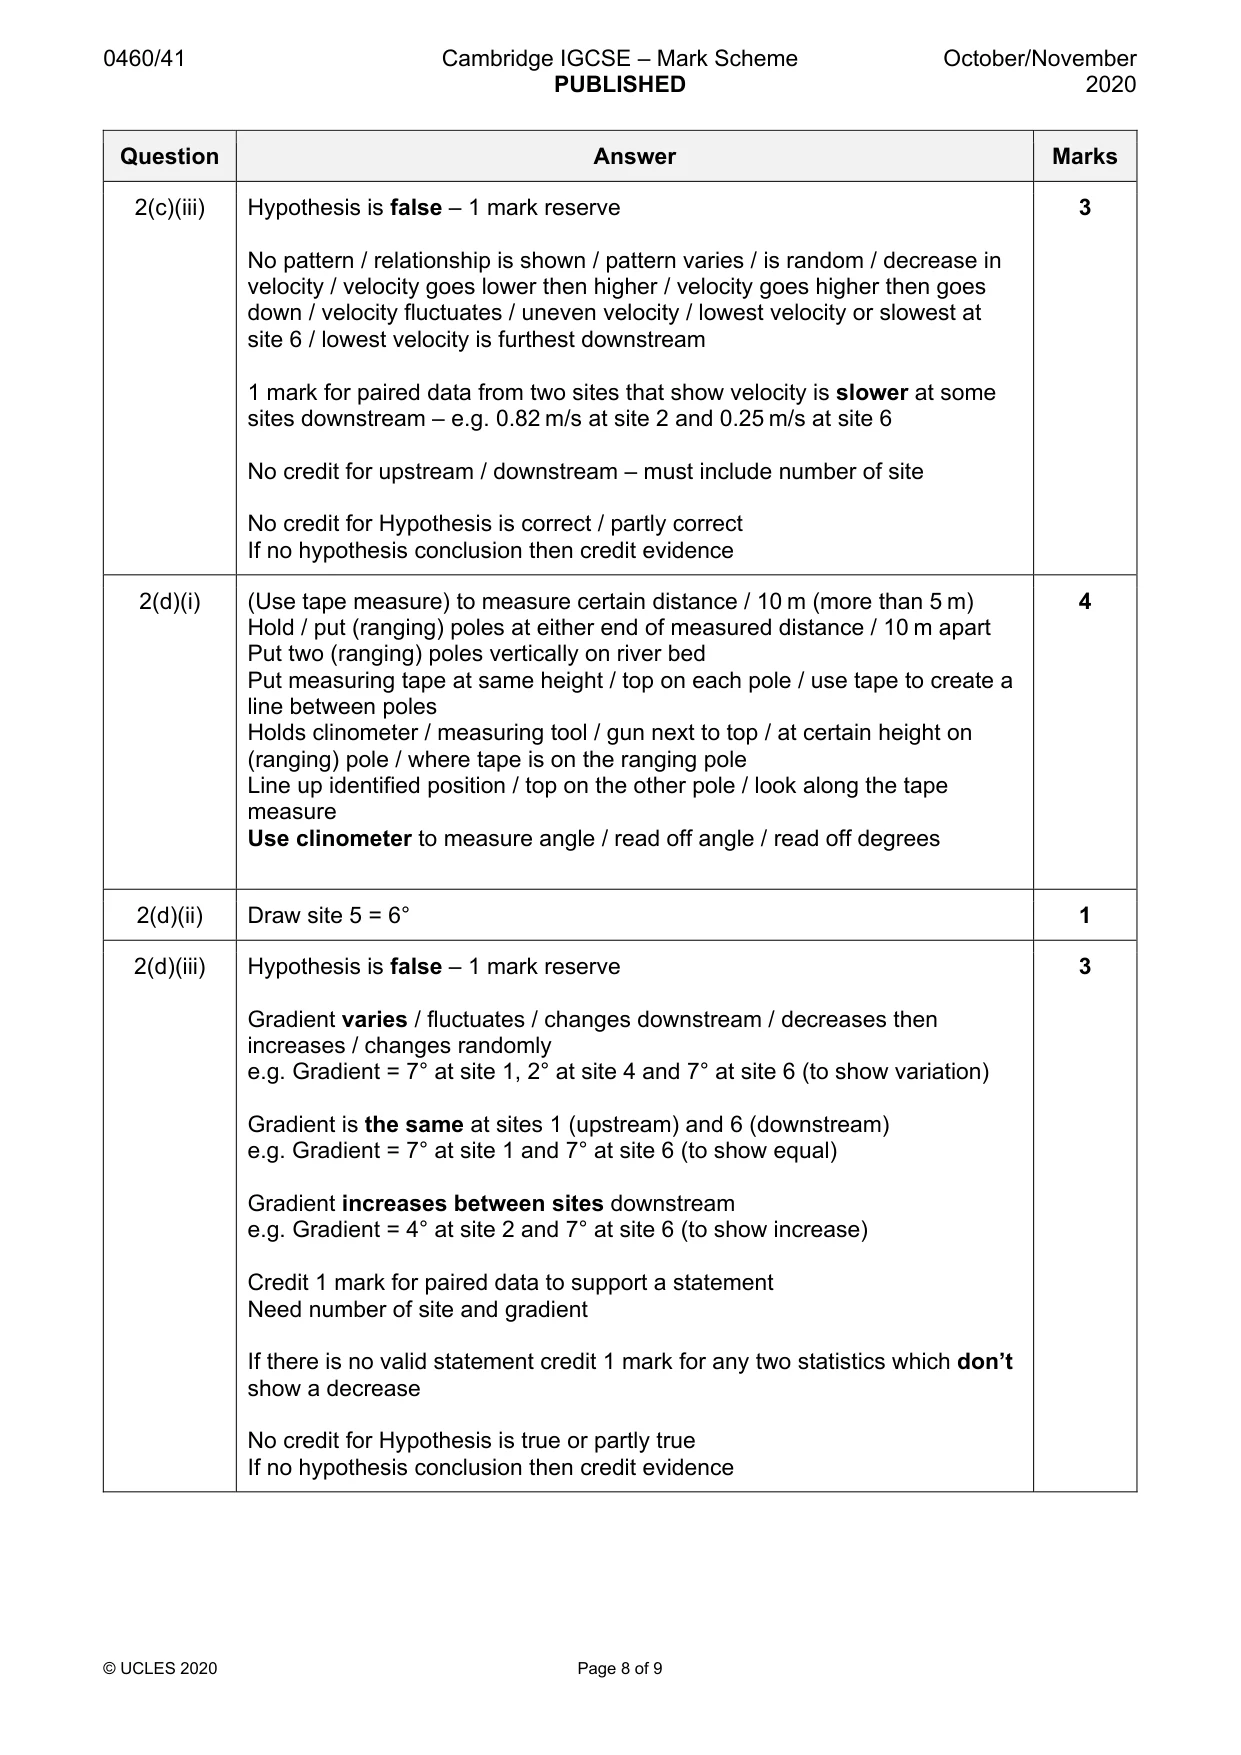
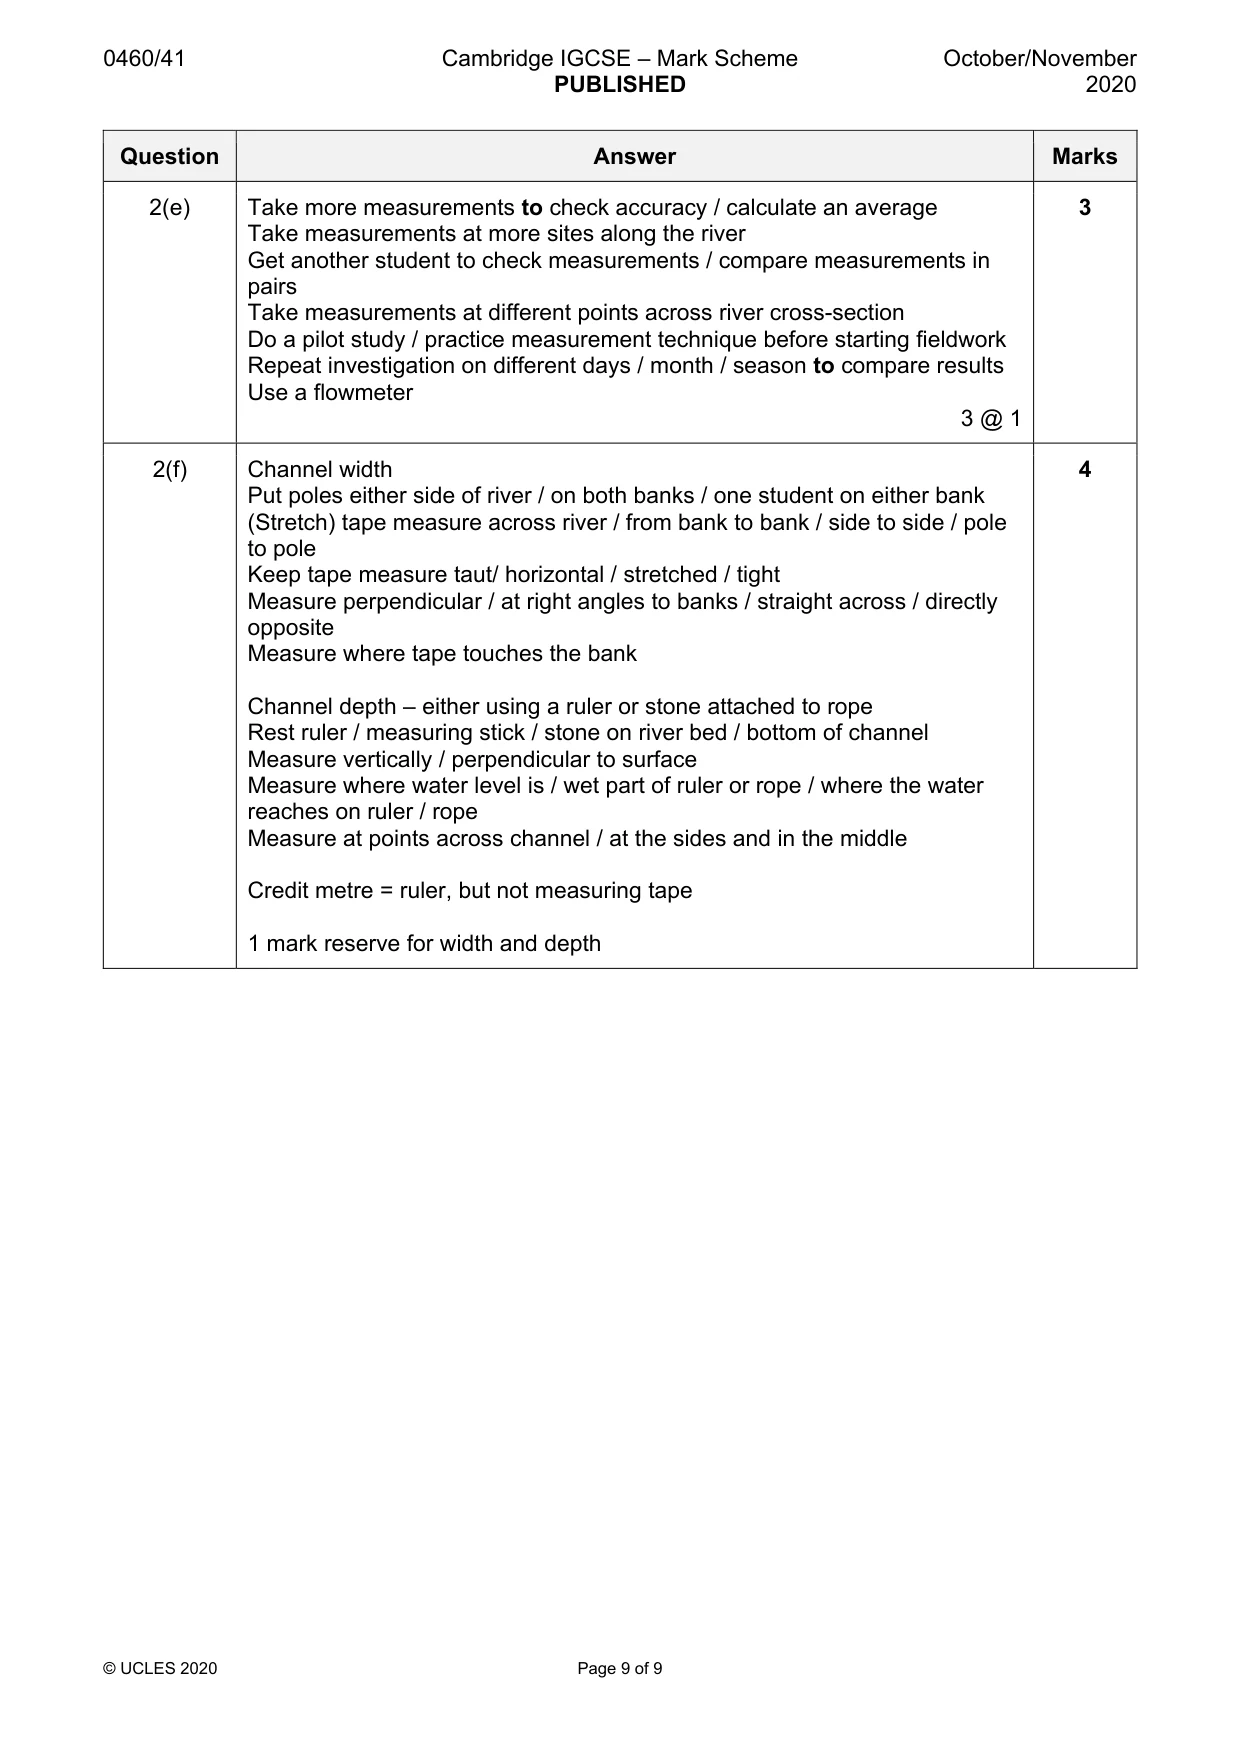
Mark scheme: 2(a) Increase 2 Amount of load carried by river River discharge Decrease Size of individual load particles 3 correct = 2 marks, 1 or 2 correct = 1 mark 2(b)(i) Accessibility /easy to get to / not private land 3 Distance between sites / distance between sites should be equal / sites should be in different sections of river Away from human impact / buildings / houses / towns / people Depth / width / not too deep / not too wide Velocity / not fast flowing / strength of current / not strong current Safety regarding dangerous animals / pollution / not in areas with dangerous animals Presence of waterfalls / not near / away from waterfalls / rapids 3 @ 1 2(b)(ii) Discharge / velocity / depth / width / amount of water in river may change / 1 so they remain constant Weather / rainfall might change / on same day should stay the same 2(c)(i) Use tape measure to measure fixed / certain distance / 10 m along river 4 (more than 5m) / measure distance travelled by float / measure distance between poles Put ranging poles to mark out certain distance / 10 m distance (more than 5 m) / at start and end of fixed distance OR ‘put the ranging poles in the river 10m apart using a tape measure’ = 2 marks Put float (into river) at start of measured distance / at first pole / travels from starting point to finish / travels between two poles / travels the measured distance Start stopwatch when float is put in river and stop stopwatch when float reaches end of measured distance / reaches second pole / stopwatch measures time taken to travel measured distance Credit 1 mark for each piece of equipment. Don’t need name of equipment. 2(c)(ii) Plot site 5 = 0.64 m/s and site 6 = 0.25 m/s 2 2 @ 1 2(c)(iii) Hypothesis is false – 1 mark reserve 3 No pattern / relationship is shown / pattern varies / is random / decrease in velocity / velocity goes lower then higher / velocity goes higher then goes down / velocity fluctuates / uneven velocity / lowest velocity or slowest at site 6 / lowest velocity is furthest downstream 1 mark for paired data from two sites that show velocity is slower at some sites downstream – e.g. 0.82 m/s at site 2 and 0.25 m/s at site 6 No credit for upstream / downstream – must include number of site No credit for Hypothesis is correct / partly correct If no hypothesis conclusion then credit evidence 2(d)(i) (Use tape measure) to measure certain distance / 10 m (more than 5 m) 4 Hold / put (ranging) poles at either end of measured distance / 10 m apart Put two (ranging) poles vertically on river bed Put measuring tape at same height / top on each pole / use tape to create a line between poles Holds clinometer / measuring tool / gun next to top / at certain height on (ranging) pole / where tape is on the ranging pole Line up identified position / top on the other pole / look along the tape measure Use clinometer to measure angle / read off angle / read off degrees 2(d)(ii) Draw site 5 = 6° 1 2(d)(iii) Hypothesis is false – 1 mark reserve 3 Gradient varies / fluctuates / changes downstream / decreases then increases / changes randomly e.g. Gradient = 7° at site 1, 2° at site 4 and 7° at site 6 (to show variation) Gradient is the same at sites 1 (upstream) and 6 (downstream) e.g. Gradient = 7° at site 1 and 7° at site 6 (to show equal) Gradient increases between sites downstream e.g. Gradient = 4° at site 2 and 7° at site 6 (to show increase) Credit 1 mark for paired data to support a statement Need number of site and gradient If there is no valid statement credit 1 mark for any two statistics which don’t show a decrease No credit for Hypothesis is true or partly true If no hypothesis conclusion then credit evidence 2(e) Take more measurements to check accuracy / calculate an average 3 Take measurements at more sites along the river Get another student to check measurements / compare measurements in pairs Take measurements at different points across river cross-section Do a pilot study / practice measurement technique before starting fieldwork Repeat investigation on different days / month / season to compare results Use a flowmeter 3 @ 1 2(f) Channel width 4 Put poles either side of river / on both banks / one student on either bank (Stretch) tape measure across river / from bank to bank / side to side / pole to pole Keep tape measure taut/ horizontal / stretched / tight Measure perpendicular / at right angles to banks / straight across / directly opposite Measure where tape touches the bank Channel depth – either using a ruler or stone attached to rope Rest ruler / measuring stick / stone on river bed / bottom of channel Measure vertically / perpendicular to surface Measure where water level is / wet part of ruler or rope / where the water reaches on ruler / rope Measure at points across channel / at the sides and in the middle Credit metre = ruler, but not measuring tape 1 mark reserve for width and depth
What was in this paper
The subtopics covered by these 2 questions, and how many questions each got. Open one in a new tab to see every Cambridge question on it.
What you needed in this session
Cambridge’s own grade thresholds for 2020 Oct/Nov, Paper 4 · Variant 1. A higher threshold means an easier paper — the bar moves with how the cohort did.