Cambridge IGCSE Geography 0460 — 2020 Oct/Nov Paper 4 · Variant 2
0460/42/O/N/20 · 2 questions · 60 marks · ≈68 min
The question paper and its mark scheme, free to read here and free to download. This is Cambridge’s own paper, exactly as it was sat.
Question paper20 pages


Mark scheme8 pages
Answers below. Sit the paper first if you are practising.
Questions as text
Q1 · Students at a school in Seattle, USA, measured atmospheric pressure, temperature and…
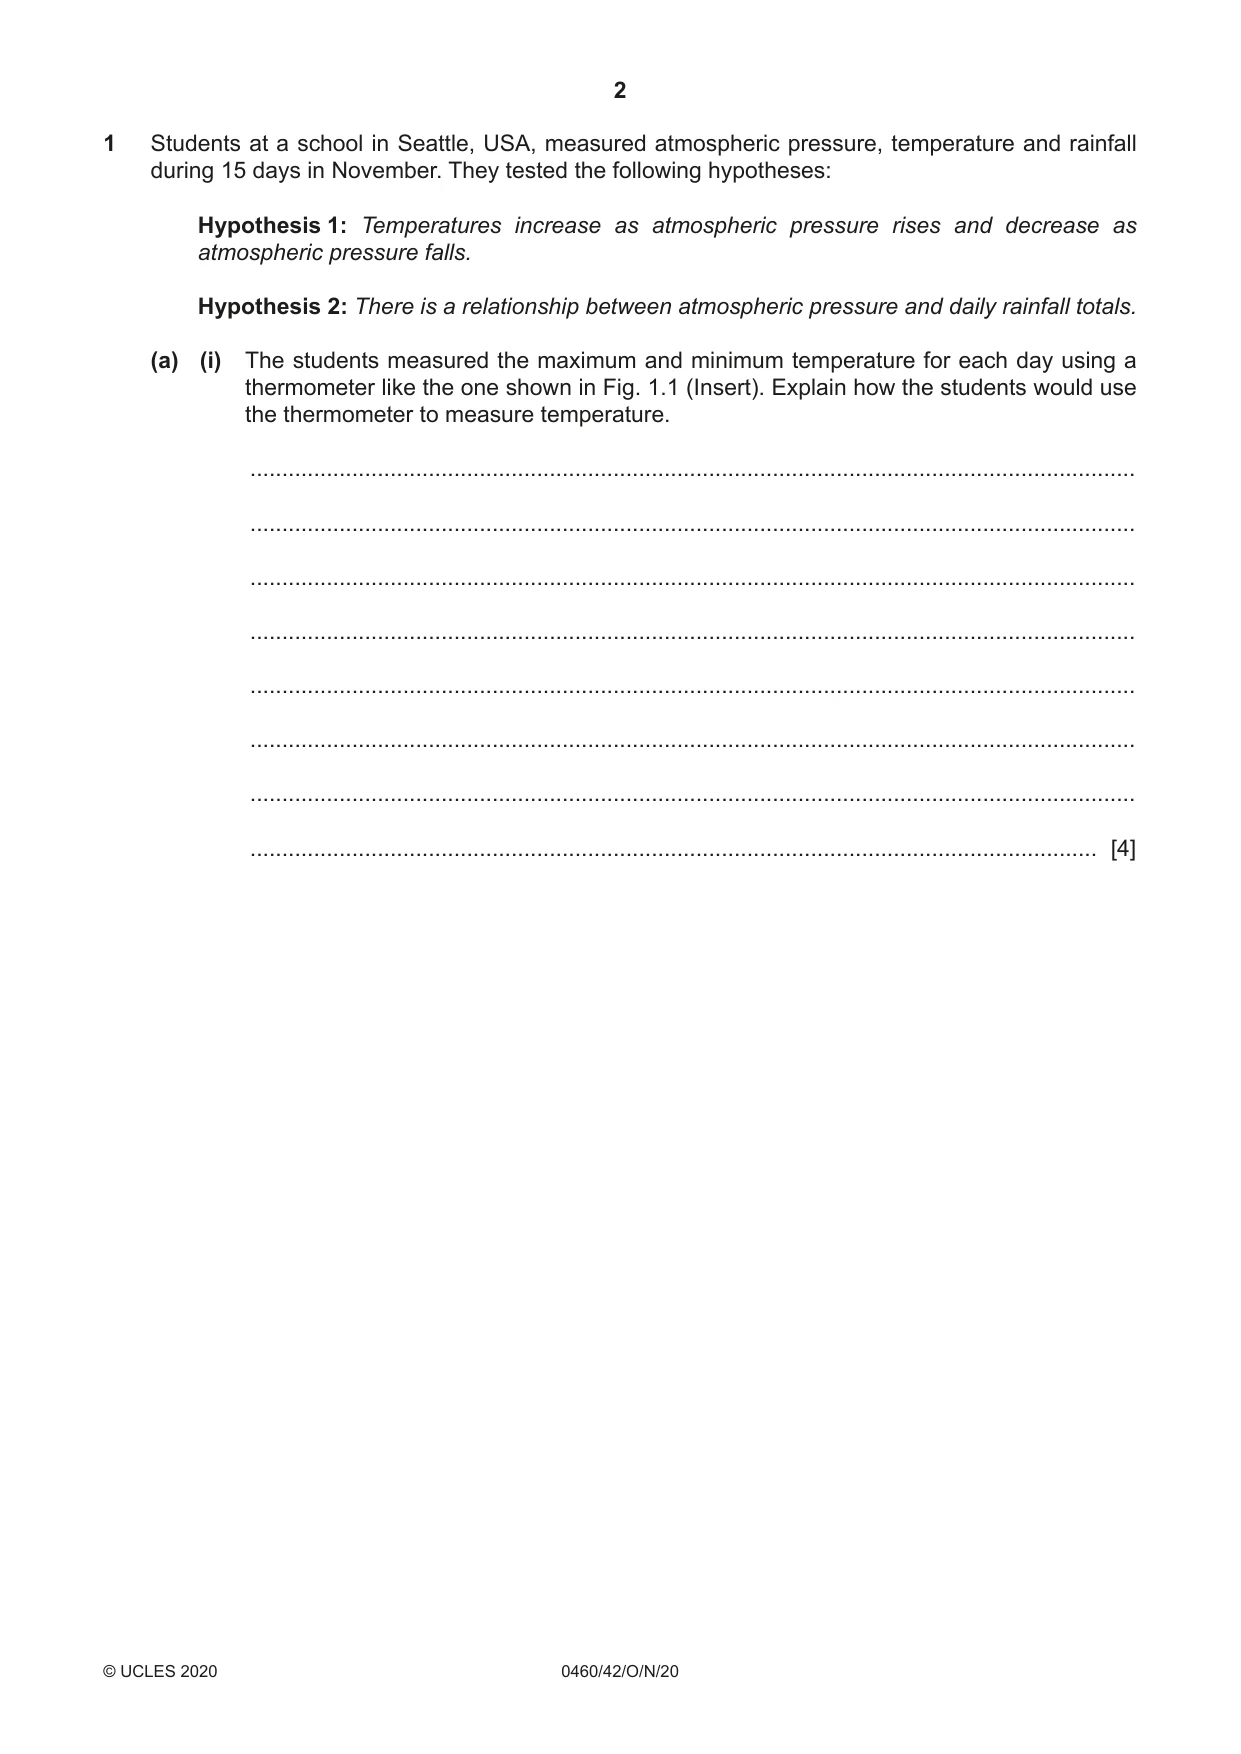
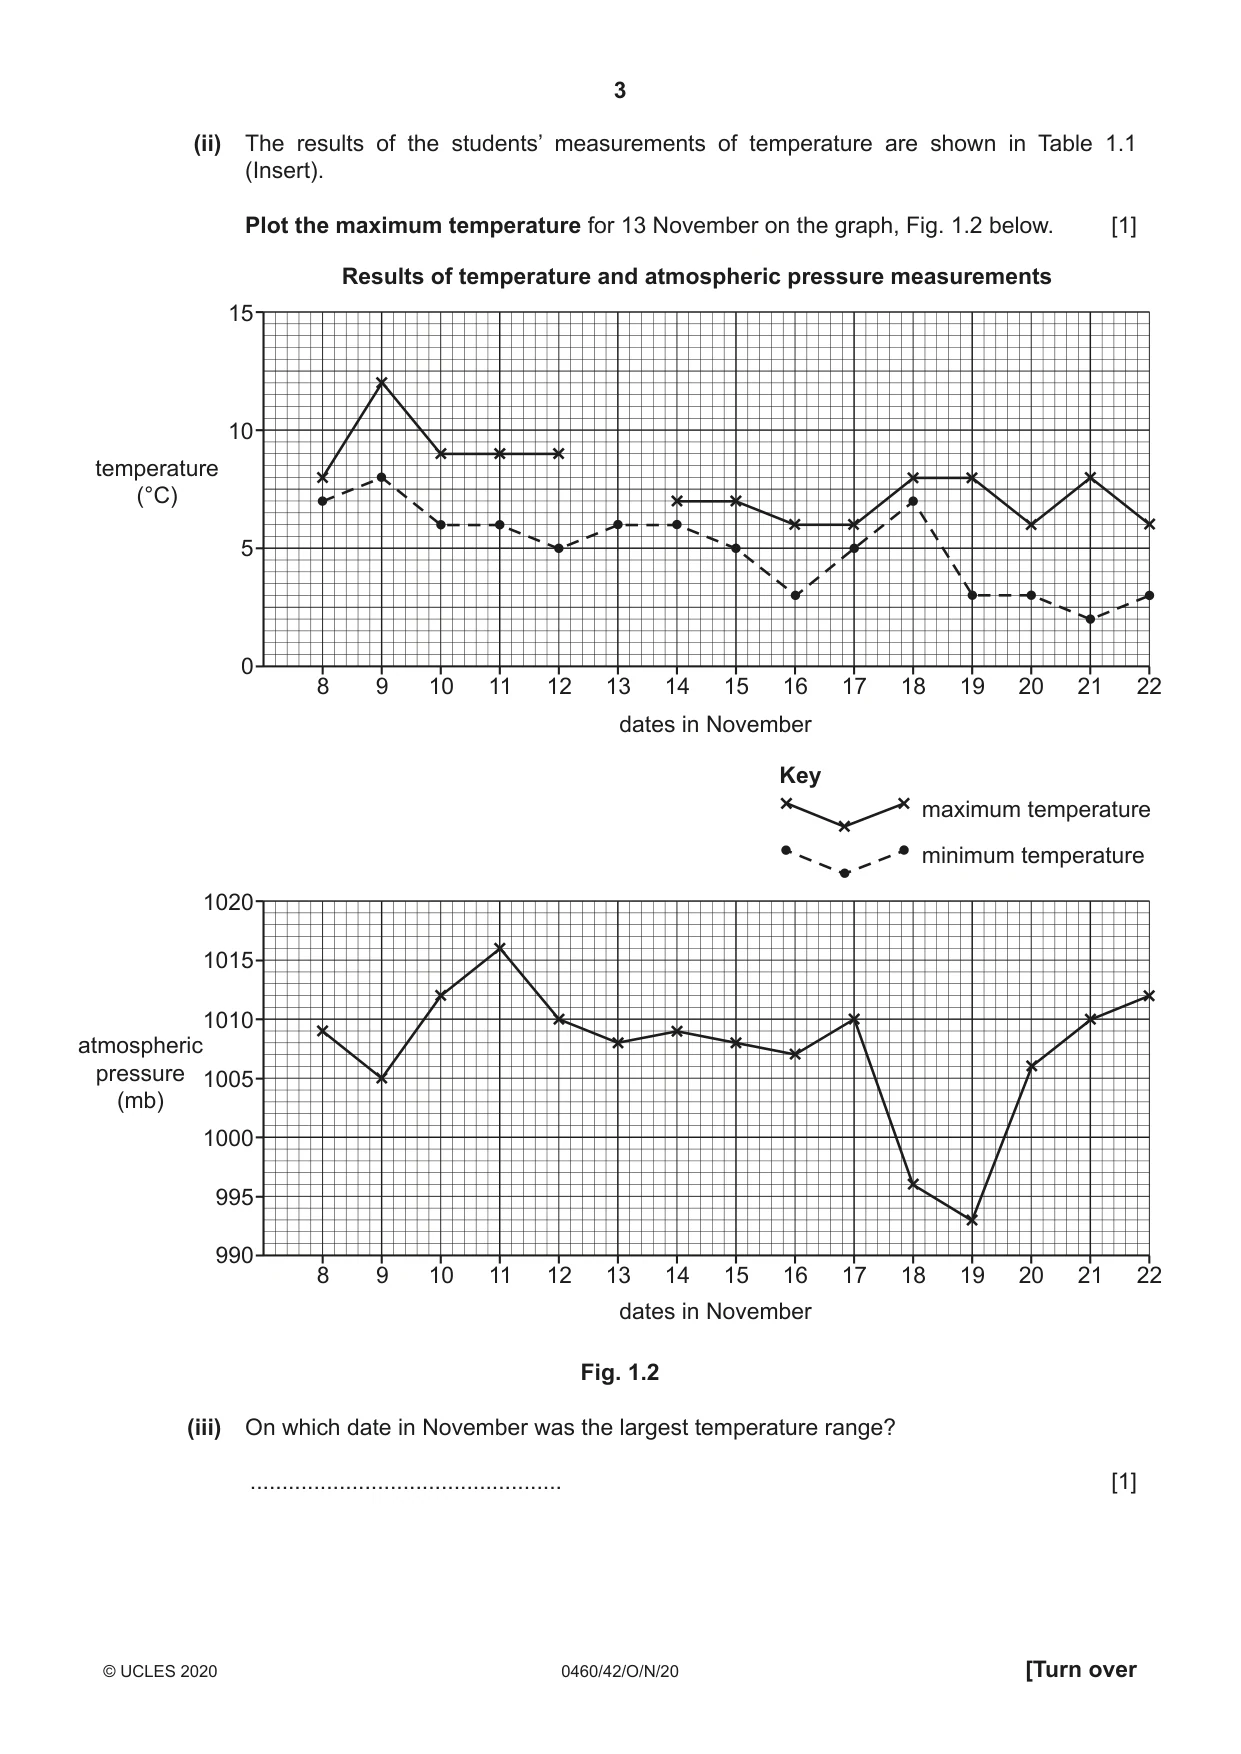
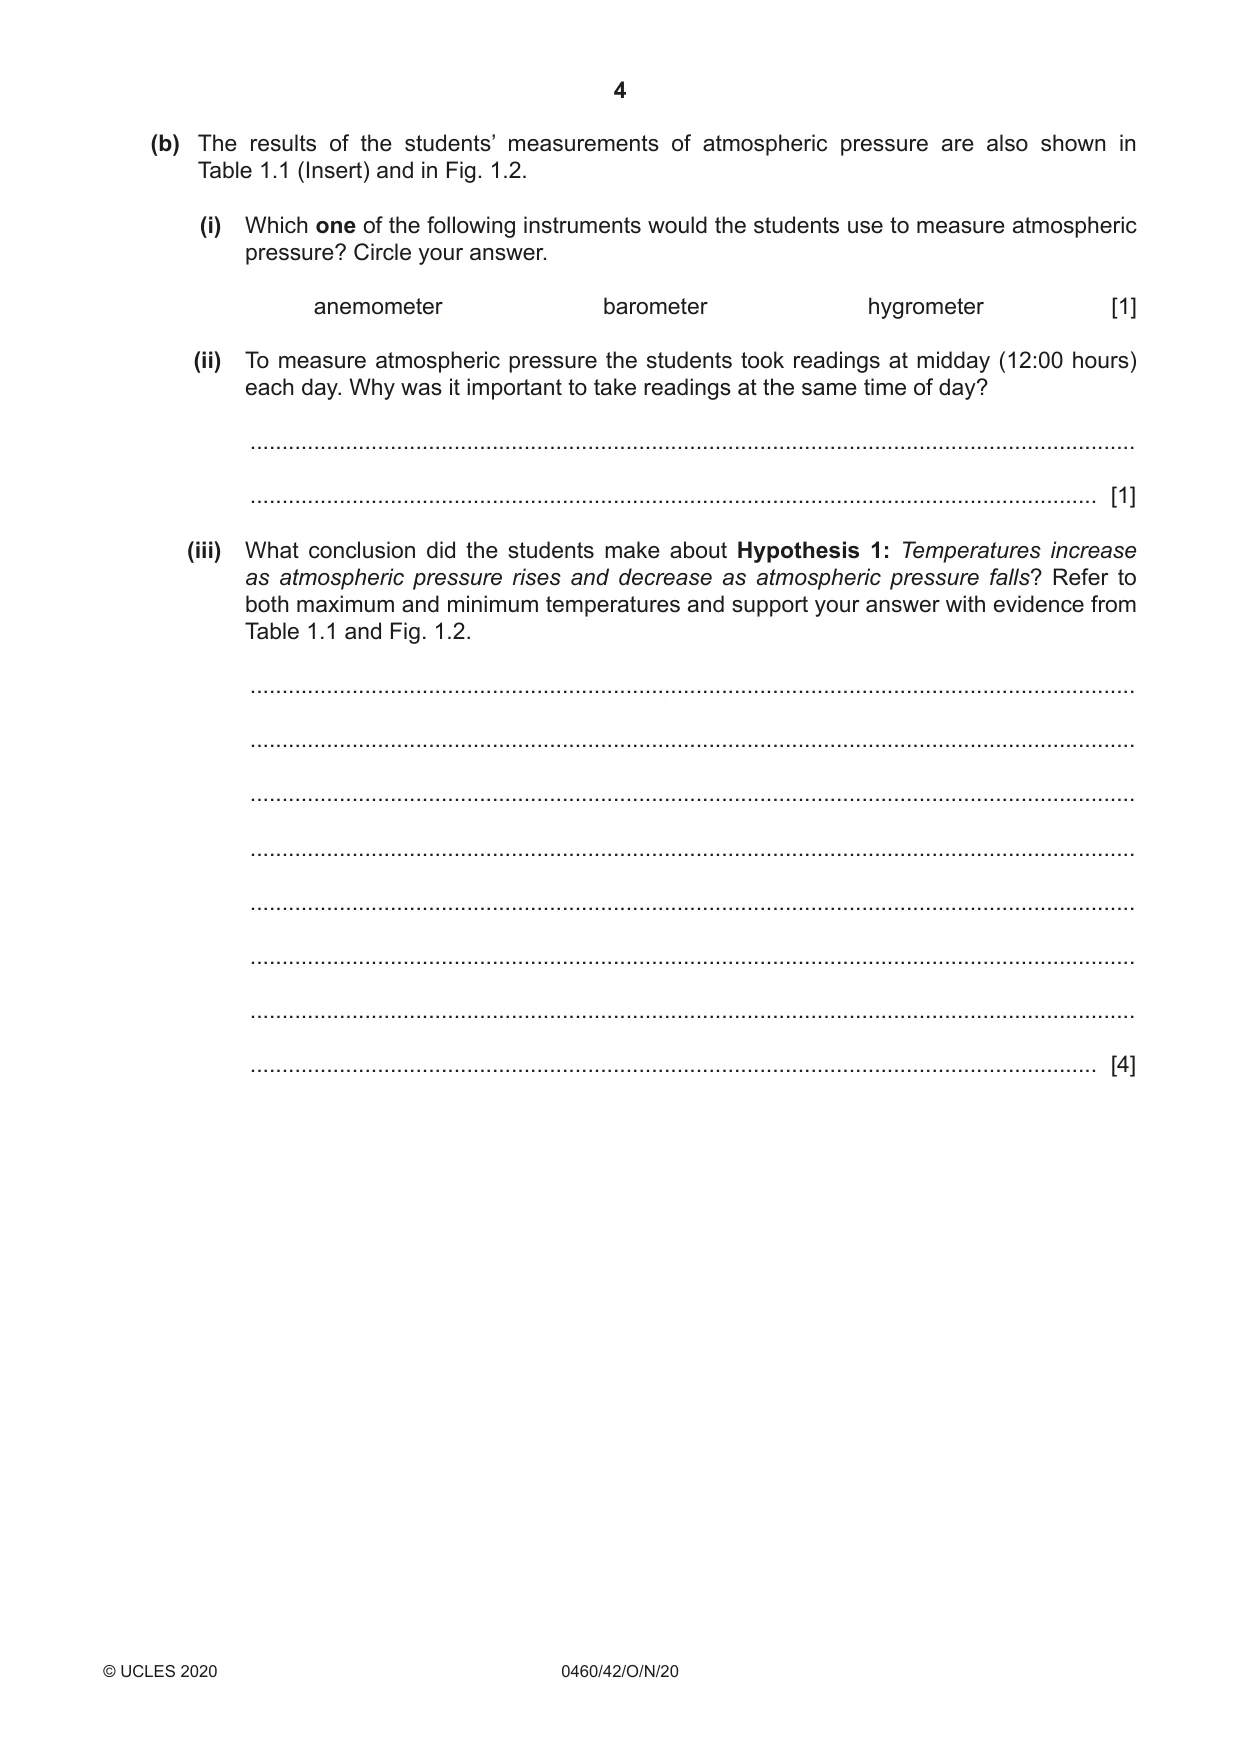
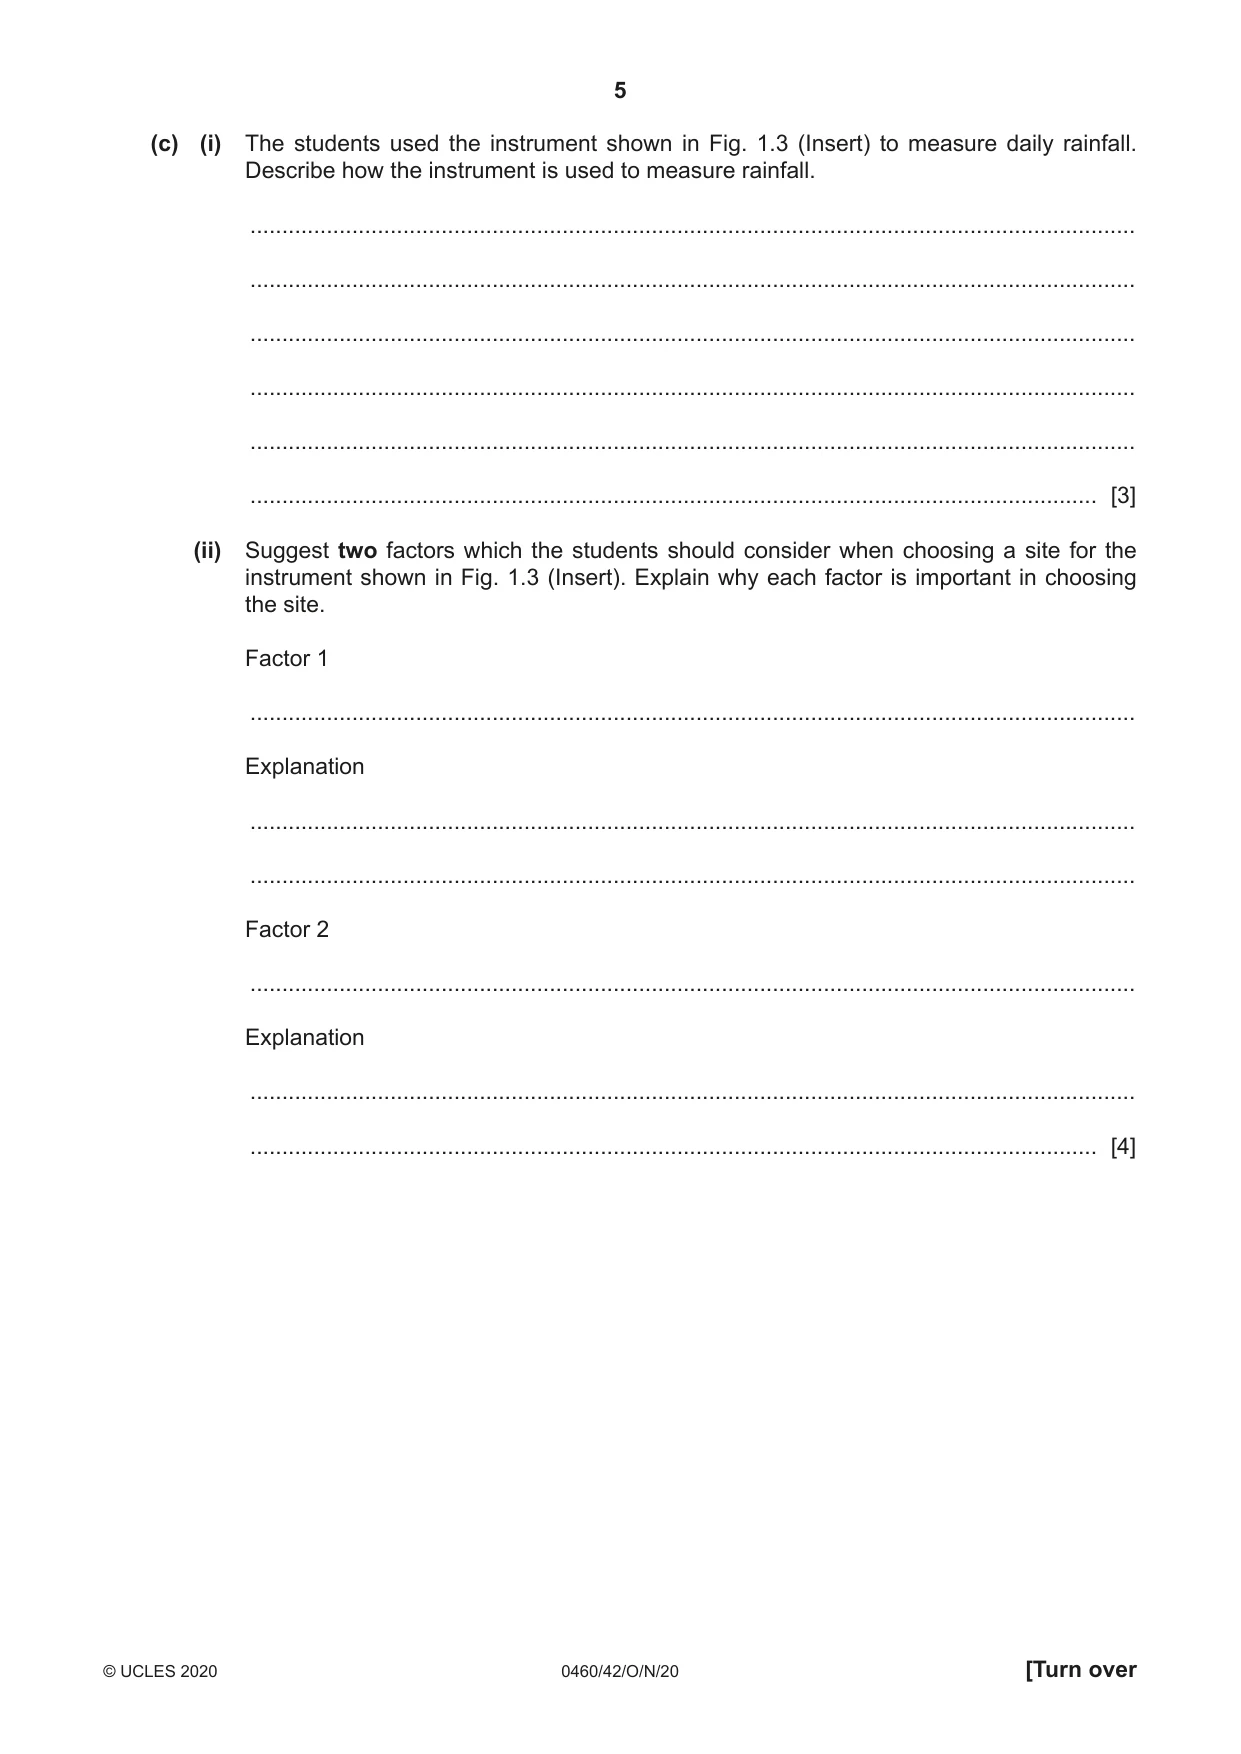
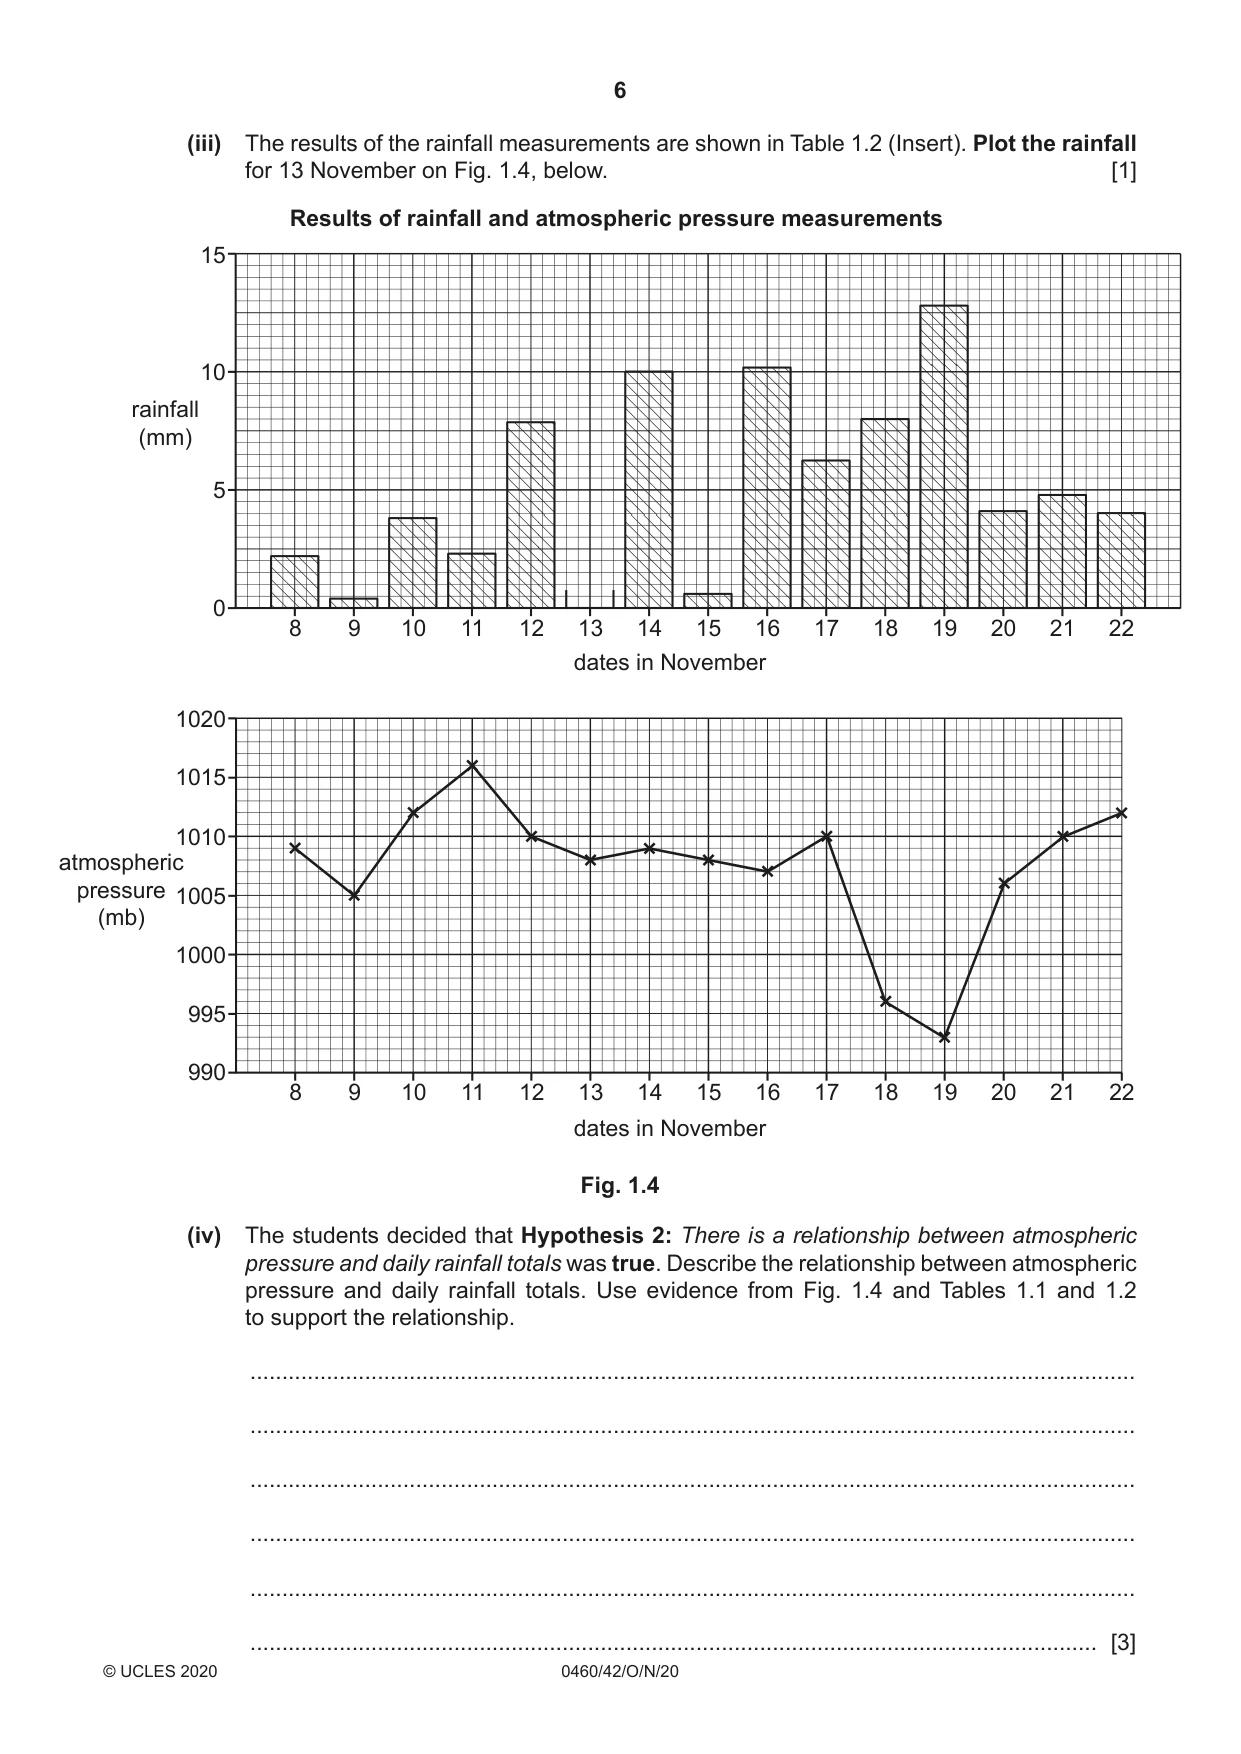
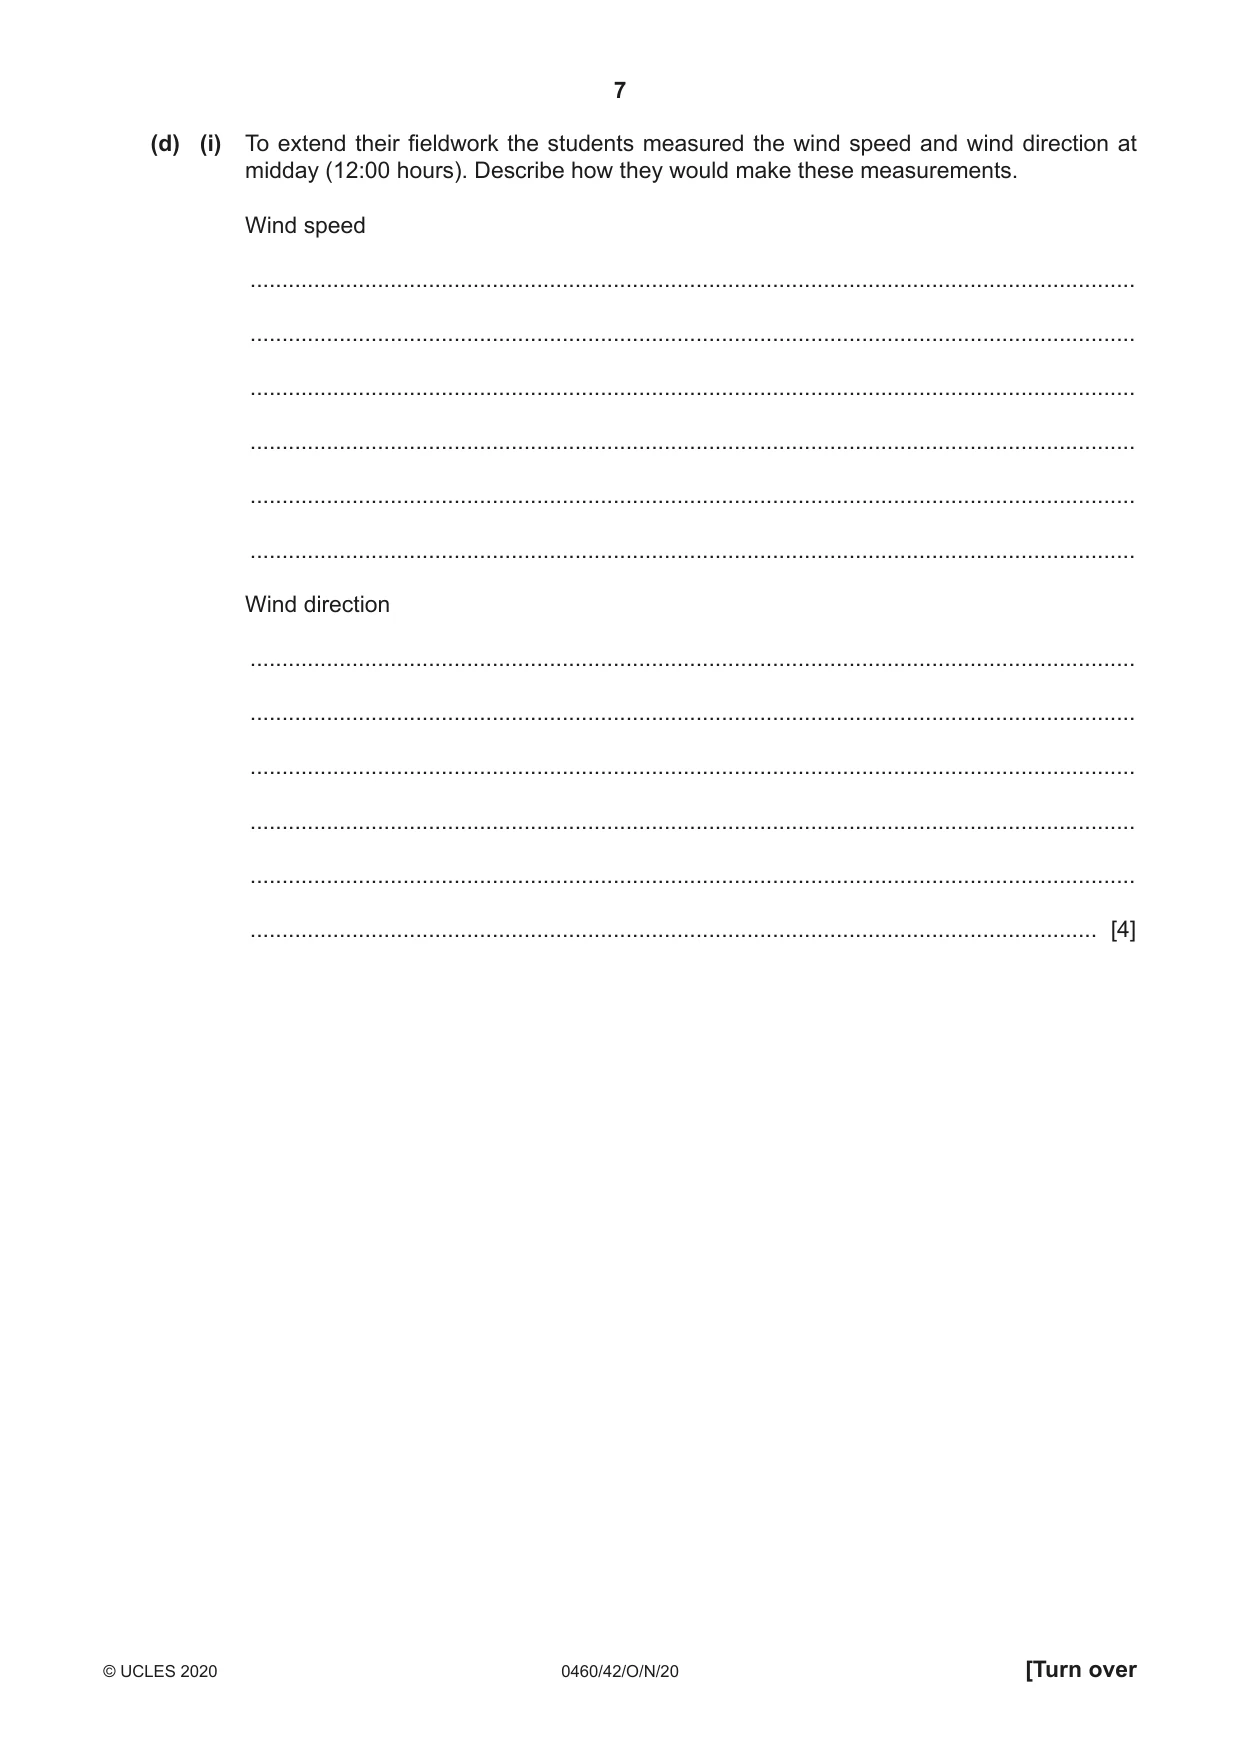
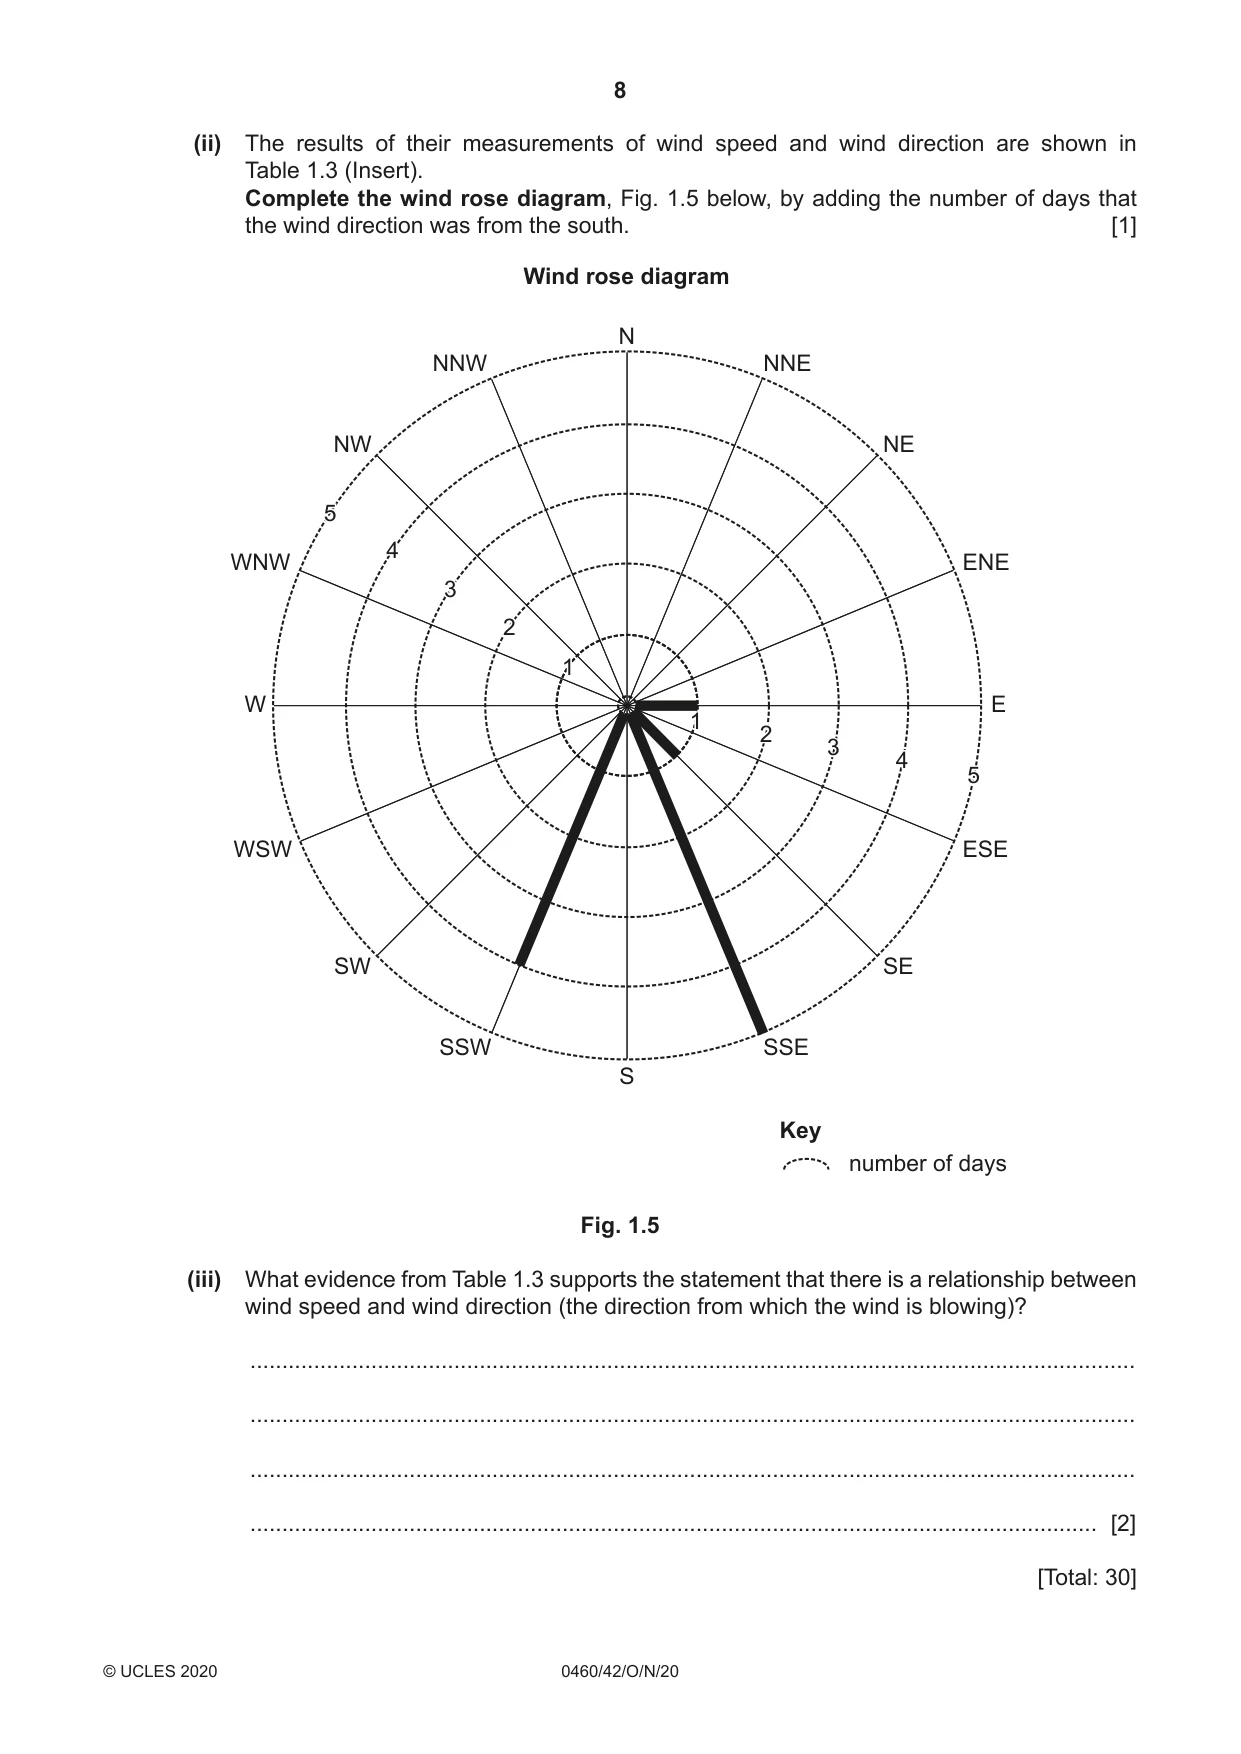
1 Students at a school in Seattle, USA, measured atmospheric pressure, temperature and rainfall during 15 days in November. They tested the following hypotheses: Hypothesis 1: Temperatures increase as atmospheric pressure rises and decrease as atmospheric pressure falls. Hypothesis 2: There is a relationship between atmospheric pressure and daily rainfall totals. (a) (i) The students measured the maximum and minimum temperature for each day using a thermometer like the one shown in Fig. 1.1 (Insert). Explain how the students would use the thermometer to measure temperature. ........................................................................................................................................... ........................................................................................................................................... ........................................................................................................................................... ........................................................................................................................................... ........................................................................................................................................... ........................................................................................................................................... ........................................................................................................................................... ..................................................................................................................................... [4] (ii) The results of the students’ measurements of temperature are shown in Table 1.1 (Insert). Plot the maximum temperature for 13 November on the graph, Fig. 1.2 below. [1] Results of temperature and atmospheric pressure measurements 15 10 temperature (°C) 5 0 8 9 10 11 12 13 14 15 16 17 18 19 20 21 22 dates in November Key maximum temperature minimum temperature 1020 1015 1010 atmospheric pressure 1005 (mb) 1000 995 990 8 9 10 11 12 13 14 15 16 17 18 19 20 21 22 dates in November Fig. 1.2 (iii) On which date in November was the largest temperature range? ................................................. [1] (b) The results of the students’ measurements of atmospheric pressure are also shown in Table 1.1 (Insert) and in Fig. 1.2. (i) Which one of the following instruments would the students use to measure atmospheric pressure? Circle your answer. anemometer barometer hygrometer [1] (ii) To measure atmospheric pressure the students took readings at midday (12:00 hours) each day. Why was it important to take readings at the same time of day? ........................................................................................................................................... ..................................................................................................................................... [1] (iii) What conclusion did the students make about Hypothesis 1: Temperatures increase as atmospheric pressure rises and decrease as atmospheric pressure falls? Refer to both maximum and minimum temperatures and support your answer with evidence from Table 1.1 and Fig. 1.2. ........................................................................................................................................... ........................................................................................................................................... ........................................................................................................................................... ........................................................................................................................................... ........................................................................................................................................... ........................................................................................................................................... ........................................................................................................................................... ..................................................................................................................................... [4] (c) (i) The students used the instrument shown in Fig. 1.3 (Insert) to measure daily rainfall. Describe how the instrument is used to measure rainfall. ........................................................................................................................................... ........................................................................................................................................... ........................................................................................................................................... ........................................................................................................................................... ........................................................................................................................................... ..................................................................................................................................... [3] (ii) Suggest two factors which the students should consider when choosing a site for the instrument shown in Fig. 1.3 (Insert). Explain why each factor is important in choosing the site. Factor 1 ........................................................................................................................................... Explanation ........................................................................................................................................... ........................................................................................................................................... Factor 2 ........................................................................................................................................... Explanation ........................................................................................................................................... ..................................................................................................................................... [4] (iii) The results of the rainfall measurements are shown in Table 1.2 (Insert). Plot the rainfall for 13 November on Fig. 1.4, below. [1] Results of rainfall and atmospheric pressure measurements 15 10 rainfall (mm) 5 0 8 9 10 11 12 13 14 15 16 17 18 19 20 21 22 dates in November 1020 1015 1010 atmospheric pressure 1005 (mb) 1000 995 990 8 9 10 11 12 13 14 15 16 17 18 19 20 21 22 dates in November Fig. 1.4 (iv) The students decided that Hypothesis 2: There is a relationship between atmospheric pressure and daily rainfall totals was true. Describe the relationship between atmospheric pressure and daily rainfall totals. Use evidence from Fig. 1.4 and Tables 1.1 and 1.2 to support the relationship. ........................................................................................................................................... ........................................................................................................................................... ........................................................................................................................................... ........................................................................................................................................... ........................................................................................................................................... ..................................................................................................................................... [3] (d) (i) To extend their fieldwork the students measured the wind speed and wind direction at midday (12:00 hours). Describe how they would make these measurements. Wind speed ........................................................................................................................................... ........................................................................................................................................... ........................................................................................................................................... ........................................................................................................................................... ........................................................................................................................................... ........................................................................................................................................... Wind direction ........................................................................................................................................... ........................................................................................................................................... ........................................................................................................................................... ........................................................................................................................................... ........................................................................................................................................... ..................................................................................................................................... [4] (ii) The results of their measurements of wind speed and wind direction are shown in Table 1.3 (Insert). Complete the wind rose diagram, Fig. 1.5 below, by adding the number of days that the wind direction was from the south. [1] Wind rose diagram N NNW NNE NW NE 55 44 WNW ENE 33 22 11 W E 11 22 33 44 55 WSW ESE SW SE SSW SSE S Key number of days Fig. 1.5 (iii) What evidence from Table 1.3 supports the statement that there is a relationship between wind speed and wind direction (the direction from which the wind is blowing)? ........................................................................................................................................... ........................................................................................................................................... ........................................................................................................................................... ..................................................................................................................................... [2] [Total: 30]
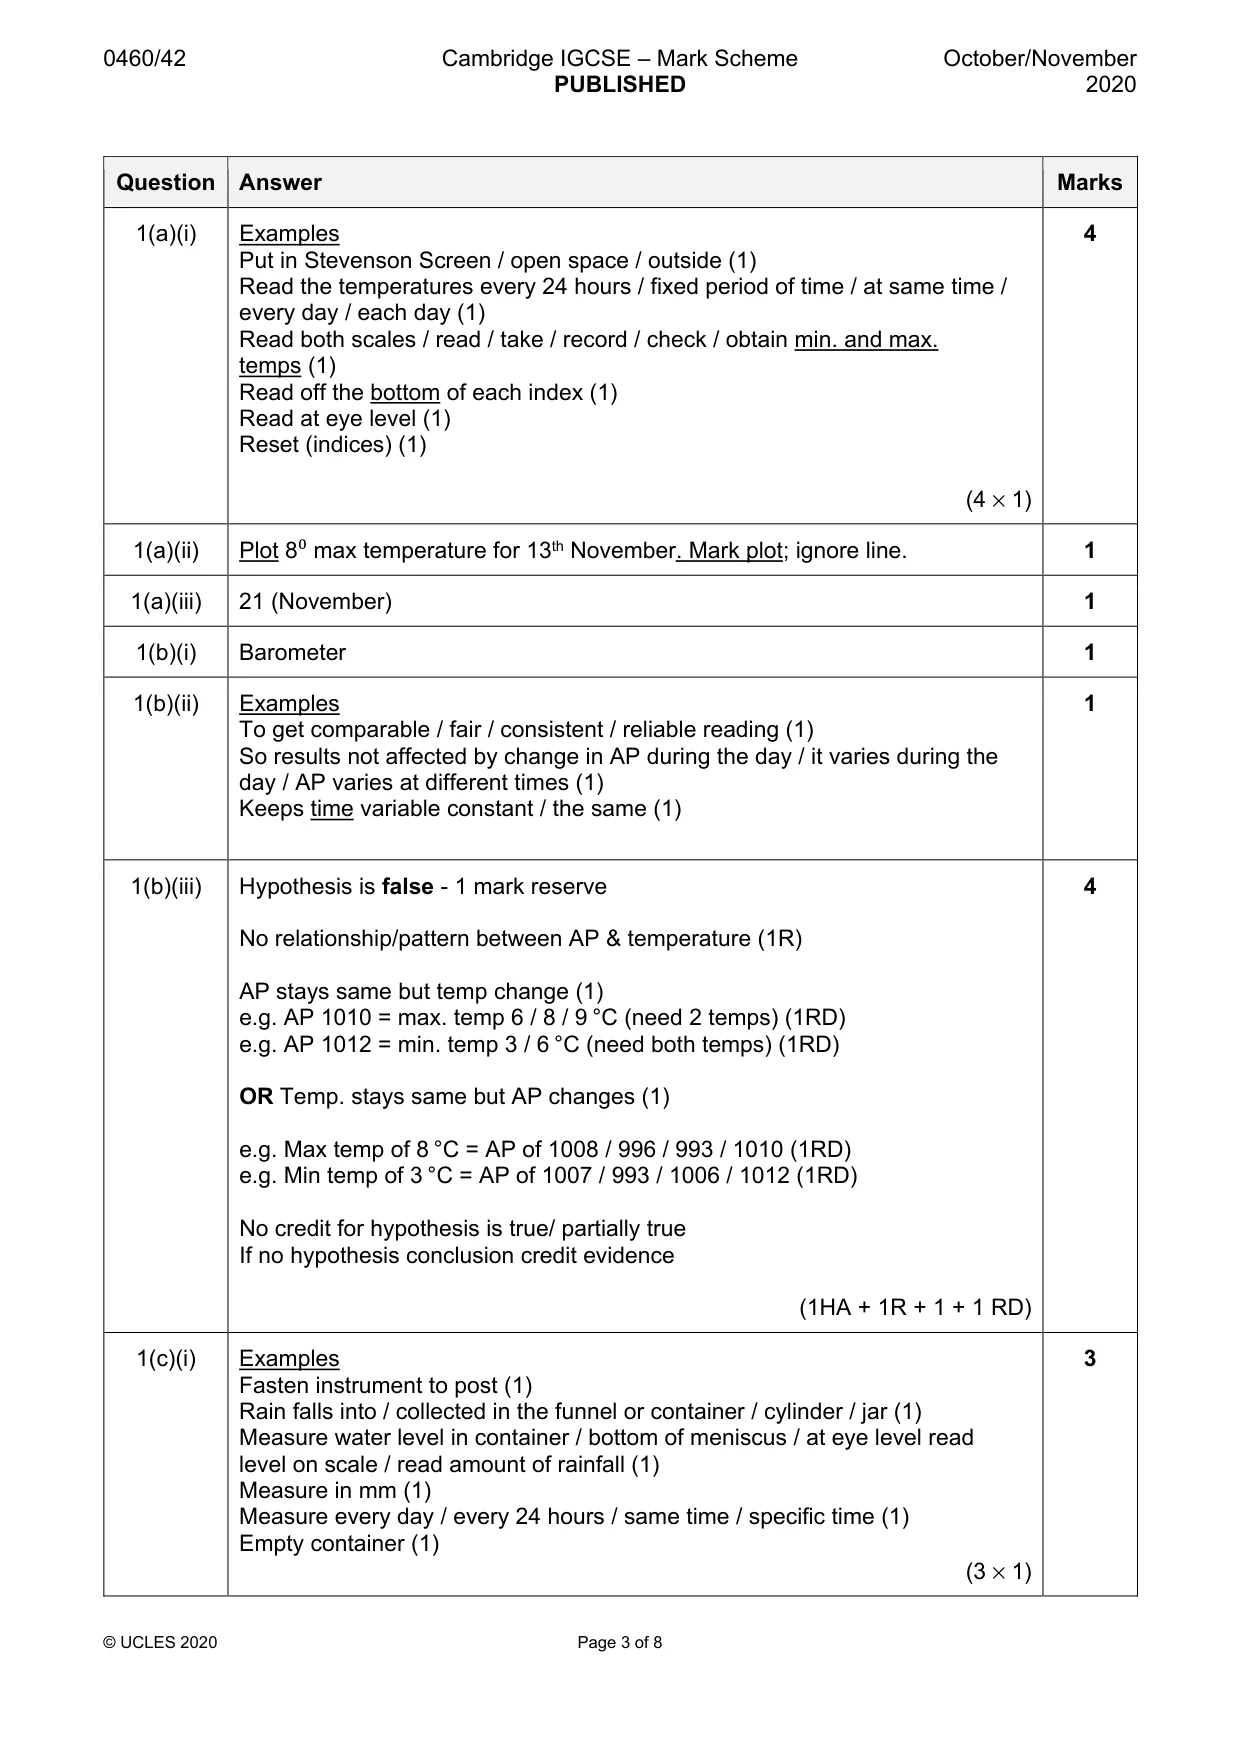
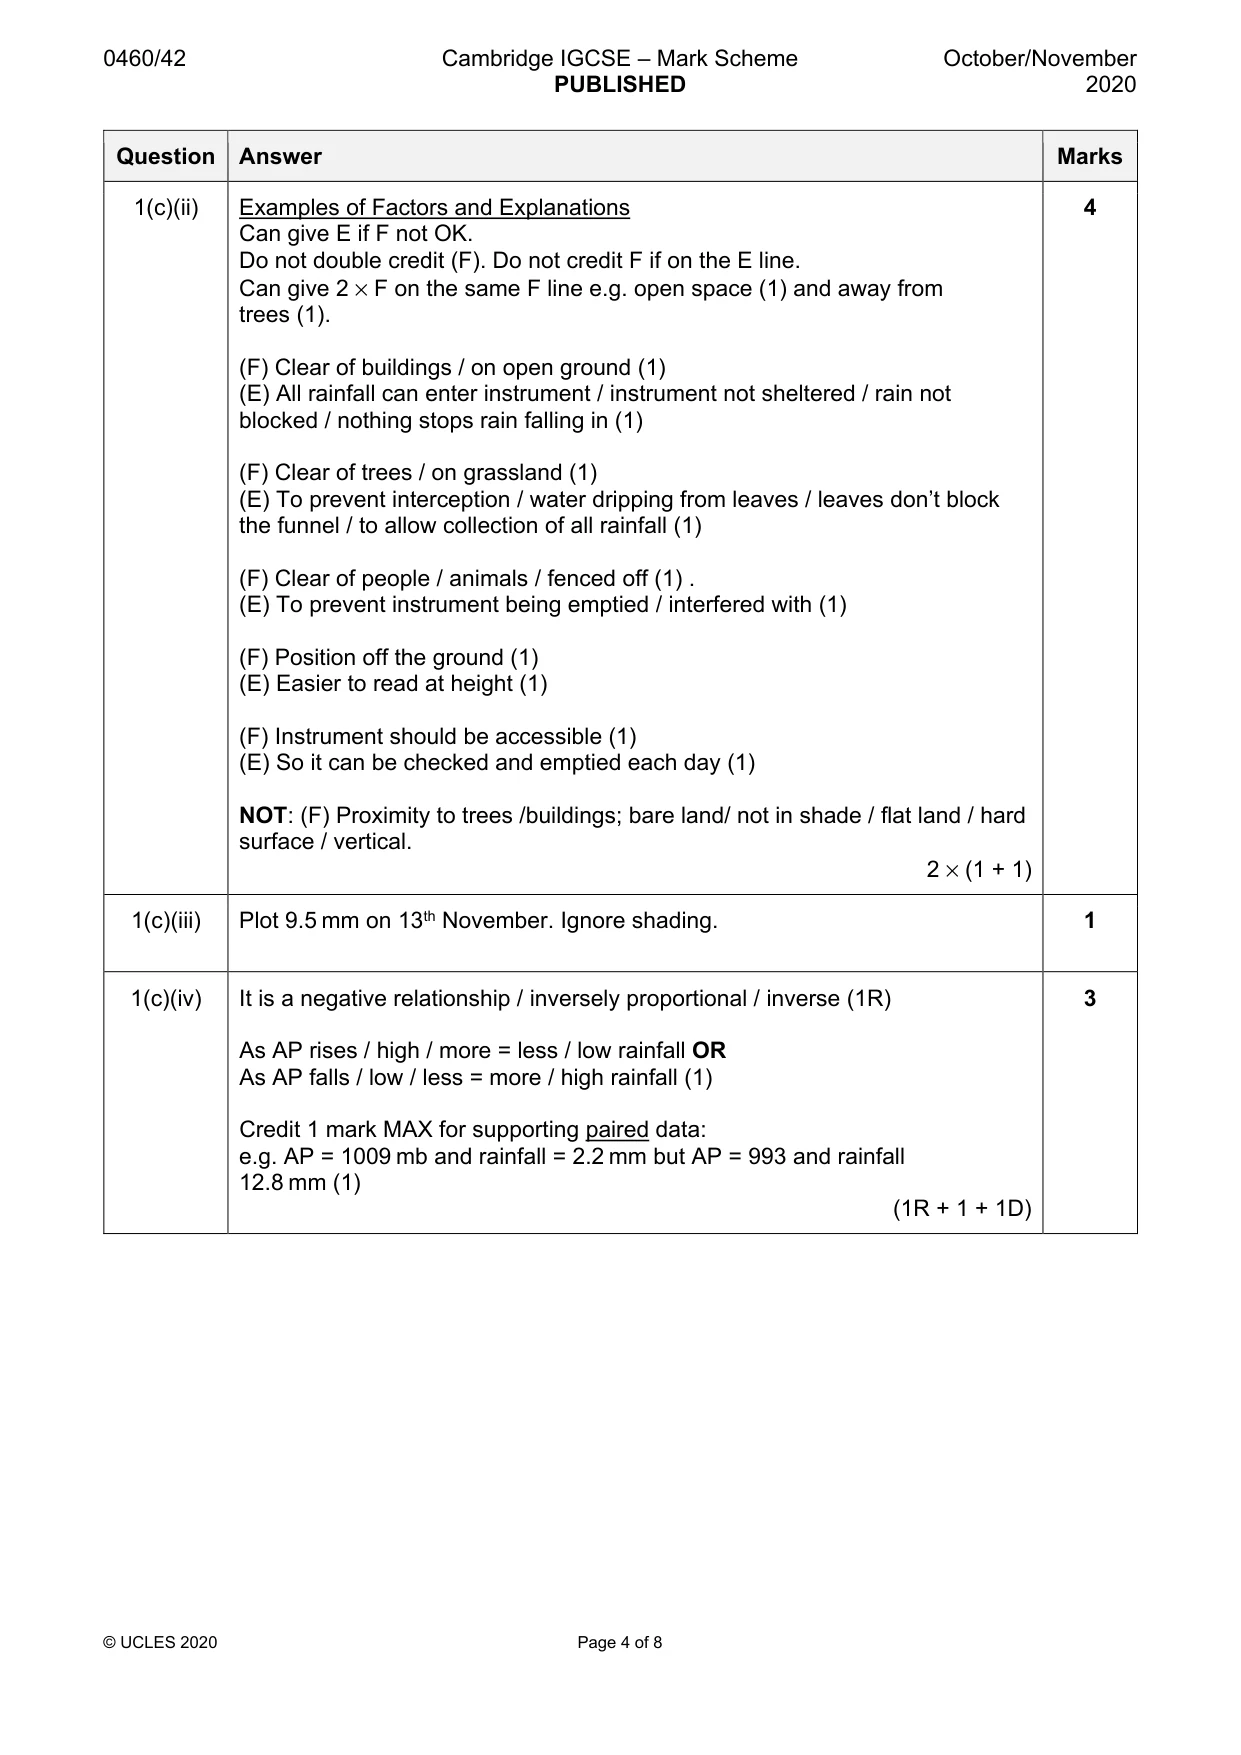
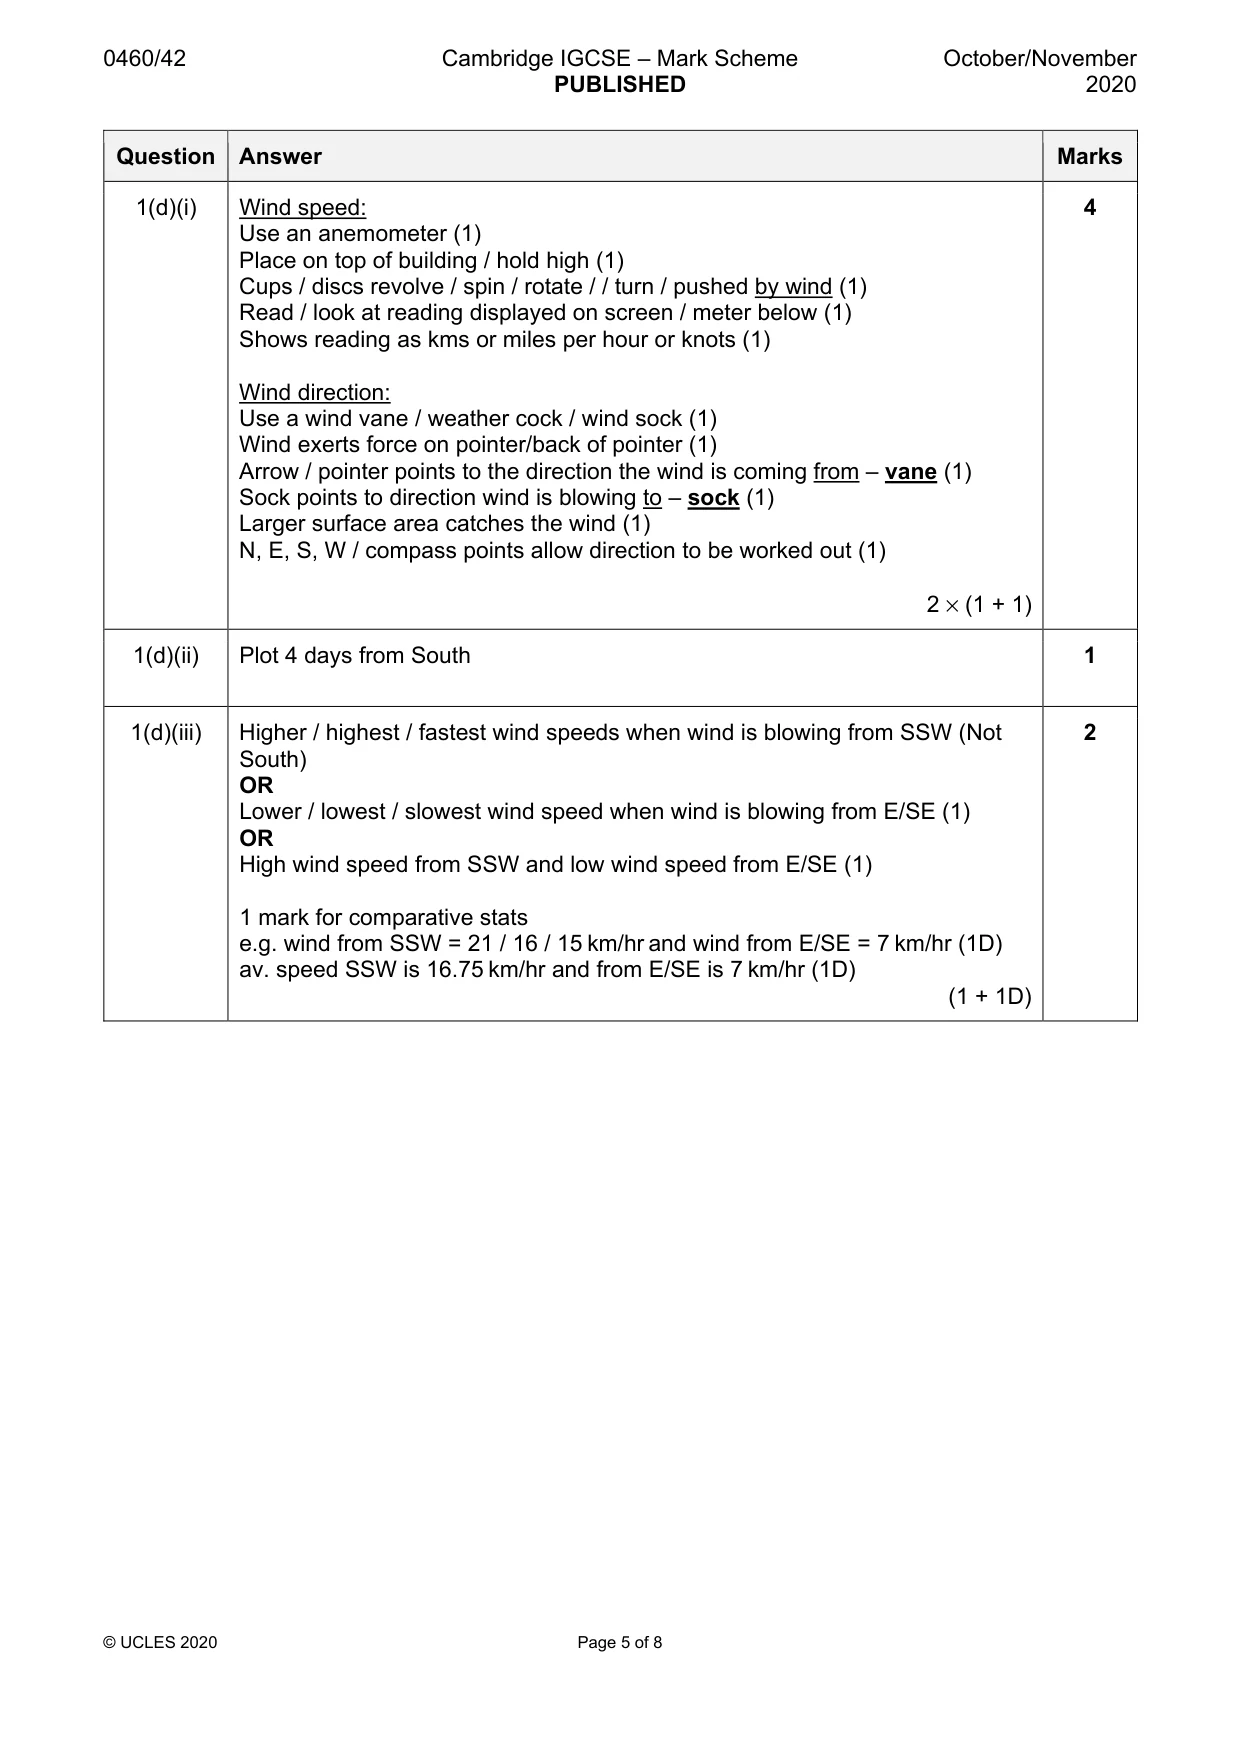
Mark scheme: 1(a)(i) Examples 4 Put in Stevenson Screen / open space / outside (1) Read the temperatures every 24 hours / fixed period of time / at same time / every day / each day (1) Read both scales / read / take / record / check / obtain min. and max. temps (1) Read off the bottom of each index (1) Read at eye level (1) Reset (indices) (1) (4 × 1) 1(a)(ii) Plot 8⁰ max temperature for 13th November. Mark plot; ignore line. 1 1(a)(iii) 21 (November) 1 1(b)(i) Barometer 1 1(b)(ii) Examples 1 To get comparable / fair / consistent / reliable reading (1) So results not affected by change in AP during the day / it varies during the day / AP varies at different times (1) Keeps time variable constant / the same (1) 1(b)(iii) Hypothesis is false - 1 mark reserve 4 No relationship/pattern between AP & temperature (1R) AP stays same but temp change (1) e.g. AP 1010 = max. temp 6 / 8 / 9 °C (need 2 temps) (1RD) e.g. AP 1012 = min. temp 3 / 6 °C (need both temps) (1RD) OR Temp. stays same but AP changes (1) e.g. Max temp of 8 °C = AP of 1008 / 996 / 993 / 1010 (1RD) e.g. Min temp of 3 °C = AP of 1007 / 993 / 1006 / 1012 (1RD) No credit for hypothesis is true/ partially true If no hypothesis conclusion credit evidence (1HA + 1R + 1 + 1 RD) 1(c)(i) Examples 3 Fasten instrument to post (1) Rain falls into / collected in the funnel or container / cylinder / jar (1) Measure water level in container / bottom of meniscus / at eye level read level on scale / read amount of rainfall (1) Measure in mm (1) Measure every day / every 24 hours / same time / specific time (1) Empty container (1) (3 × 1) Question Answer Marks 1(c)(ii) Examples of Factors and Explanations 4 Can give E if F not OK. Do not double credit (F). Do not credit F if on the E line. Can give 2 × F on the same F line e.g. open space (1) and away from trees (1). (F) Clear of buildings / on open ground (1) (E) All rainfall can enter instrument / instrument not sheltered / rain not blocked / nothing stops rain falling in (1) (F) Clear of trees / on grassland (1) (E) To prevent interception / water dripping from leaves / leaves don’t block the funnel / to allow collection of all rainfall (1) (F) Clear of people / animals / fenced off (1) . (E) To prevent instrument being emptied / interfered with (1) (F) Position off the ground (1) (E) Easier to read at height (1) (F) Instrument should be accessible (1) (E) So it can be checked and emptied each day (1) NOT: (F) Proximity to trees /buildings; bare land/ not in shade / flat land / hard surface / vertical. 2 × (1 + 1) 1(c)(iii) Plot 9.5 mm on 13th November. Ignore shading. 1 1(c)(iv) It is a negative relationship / inversely proportional / inverse (1R) 3 As AP rises / high / more = less / low rainfall OR As AP falls / low / less = more / high rainfall (1) Credit 1 mark MAX for supporting paired data: e.g. AP = 1009 mb and rainfall = 2.2 mm but AP = 993 and rainfall 12.8 mm (1) (1R + 1 + 1D) Question Answer Marks 1(d)(i) Wind speed: 4 Use an anemometer (1) Place on top of building / hold high (1) Cups / discs revolve / spin / rotate / / turn / pushed by wind (1) Read / look at reading displayed on screen / meter below (1) Shows reading as kms or miles per hour or knots (1) Wind direction: Use a wind vane / weather cock / wind sock (1) Wind exerts force on pointer/back of pointer (1) Arrow / pointer points to the direction the wind is coming from – vane (1) Sock points to direction wind is blowing to – sock (1) Larger surface area catches the wind (1) N, E, S, W / compass points allow direction to be worked out (1) 2 × (1 + 1) 1(d)(ii) Plot 4 days from South 1 1(d)(iii) Higher / highest / fastest wind speeds when wind is blowing from SSW (Not 2 South) OR Lower / lowest / slowest wind speed when wind is blowing from E/SE (1) OR High wind speed from SSW and low wind speed from E/SE (1) 1 mark for comparative stats e.g. wind from SSW = 21 / 16 / 15 km/hr and wind from E/SE = 7 km/hr (1D) av. speed SSW is 16.75 km/hr and from E/SE is 7 km/hr (1D) (1 + 1D) Question Answer Marks
Q2 · A class of students from a rural area of Wales was studying settlement and service…
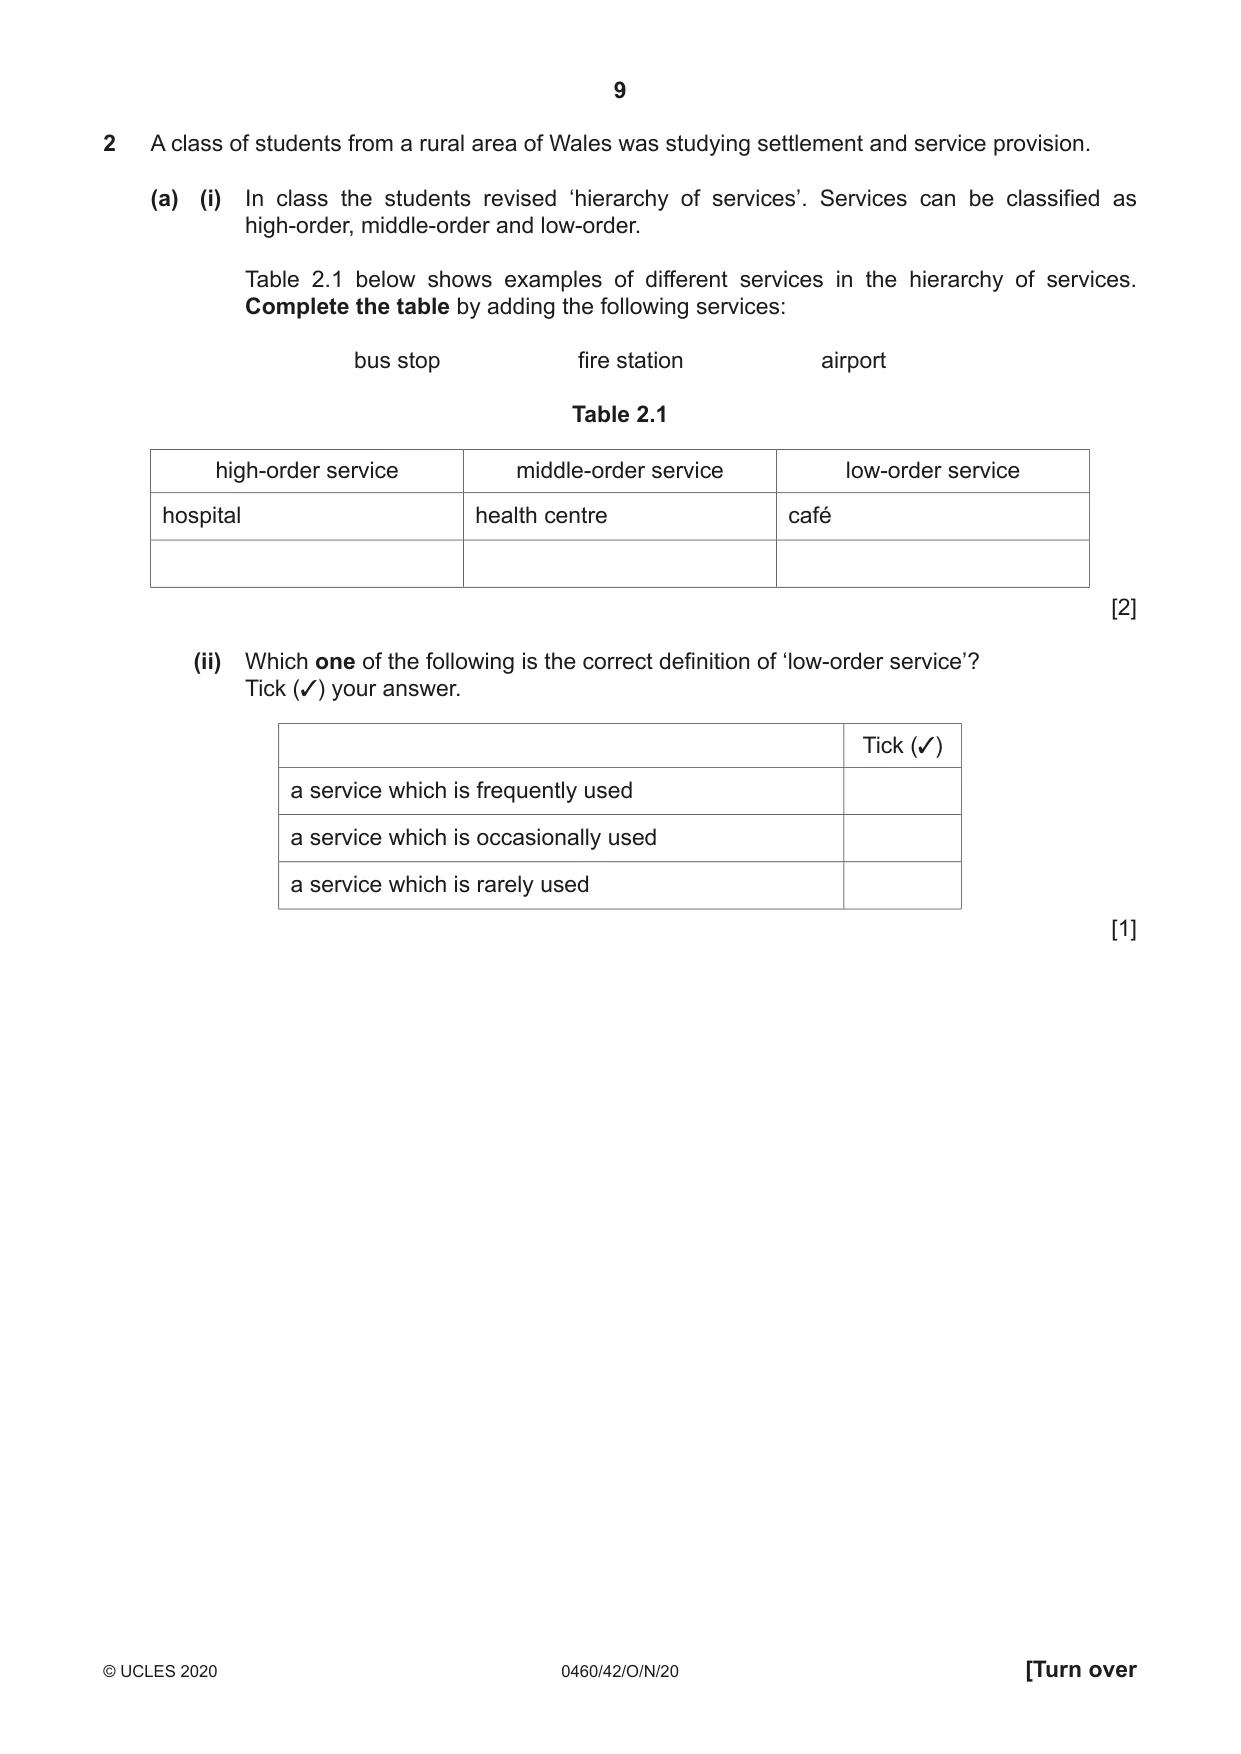
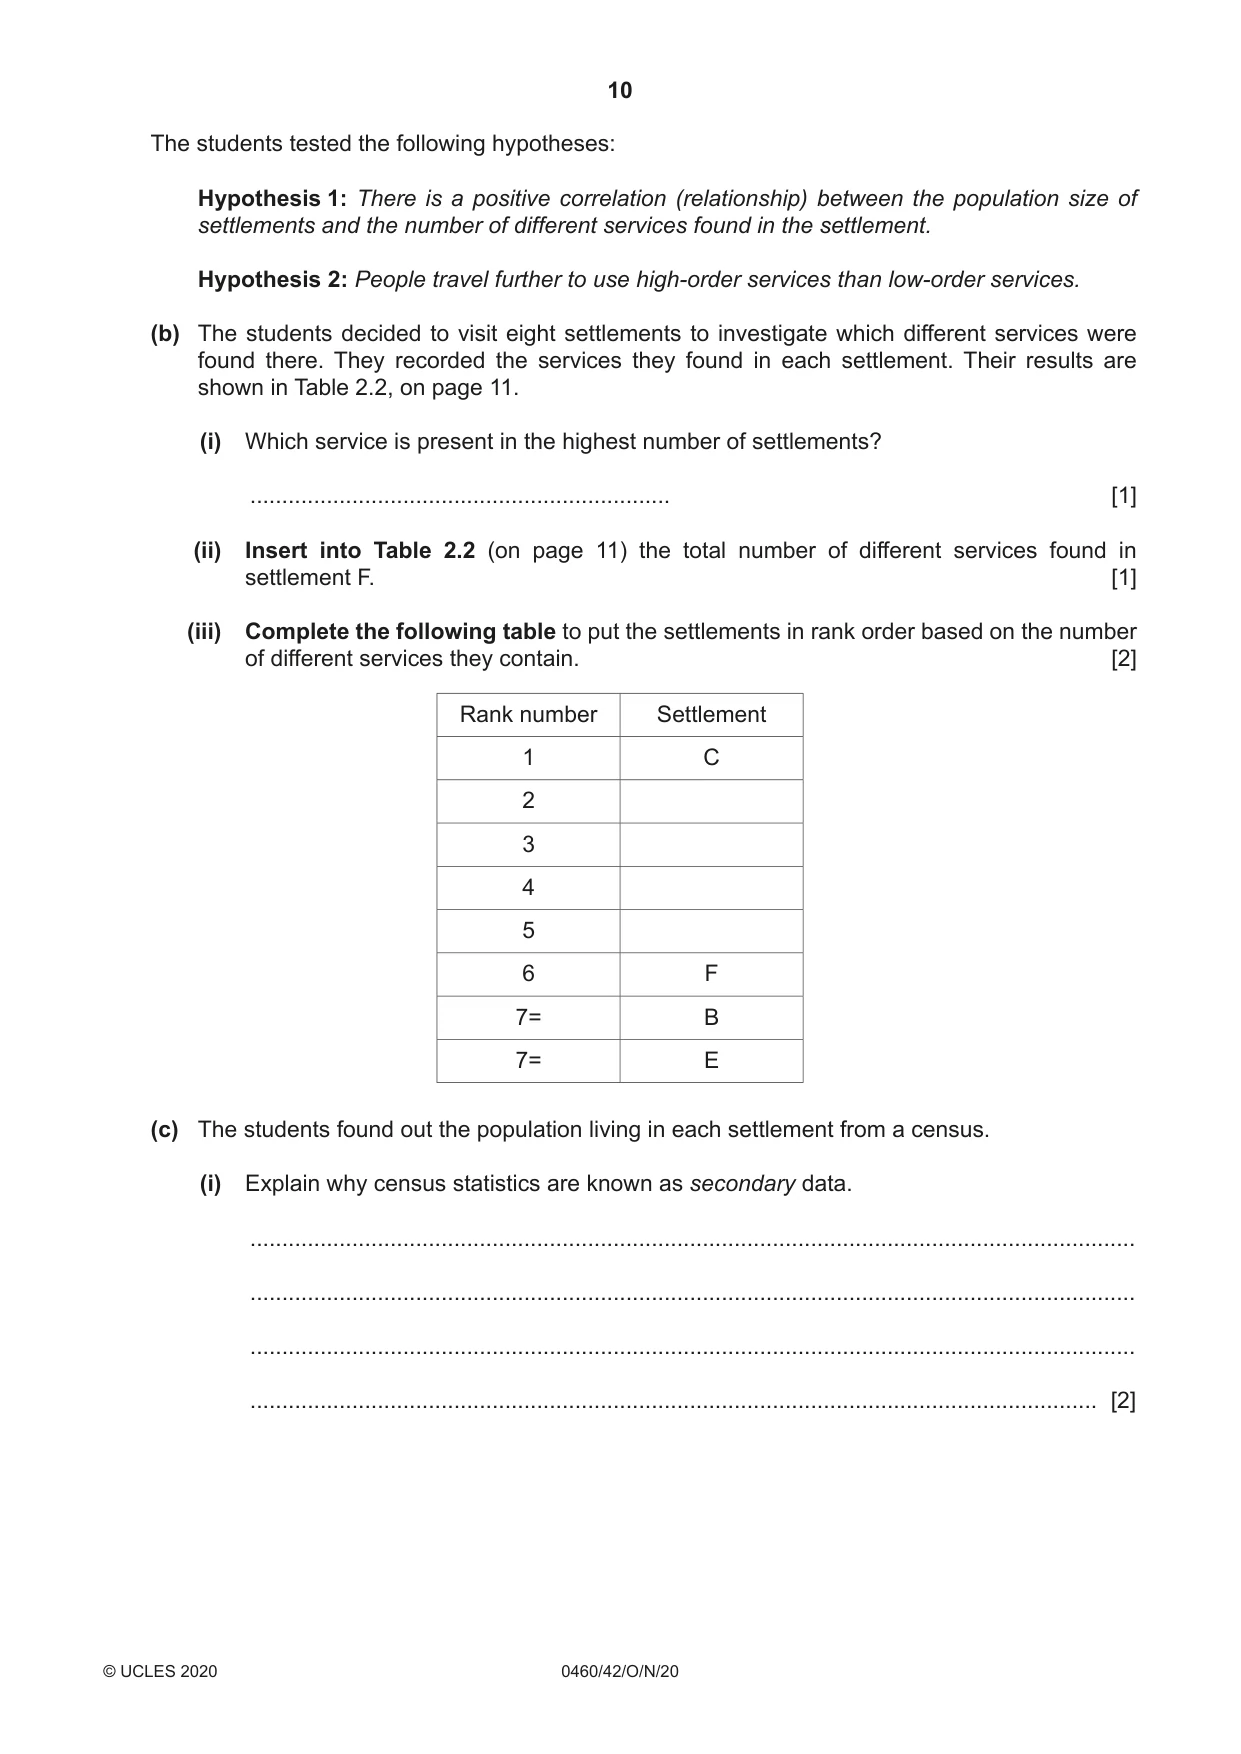
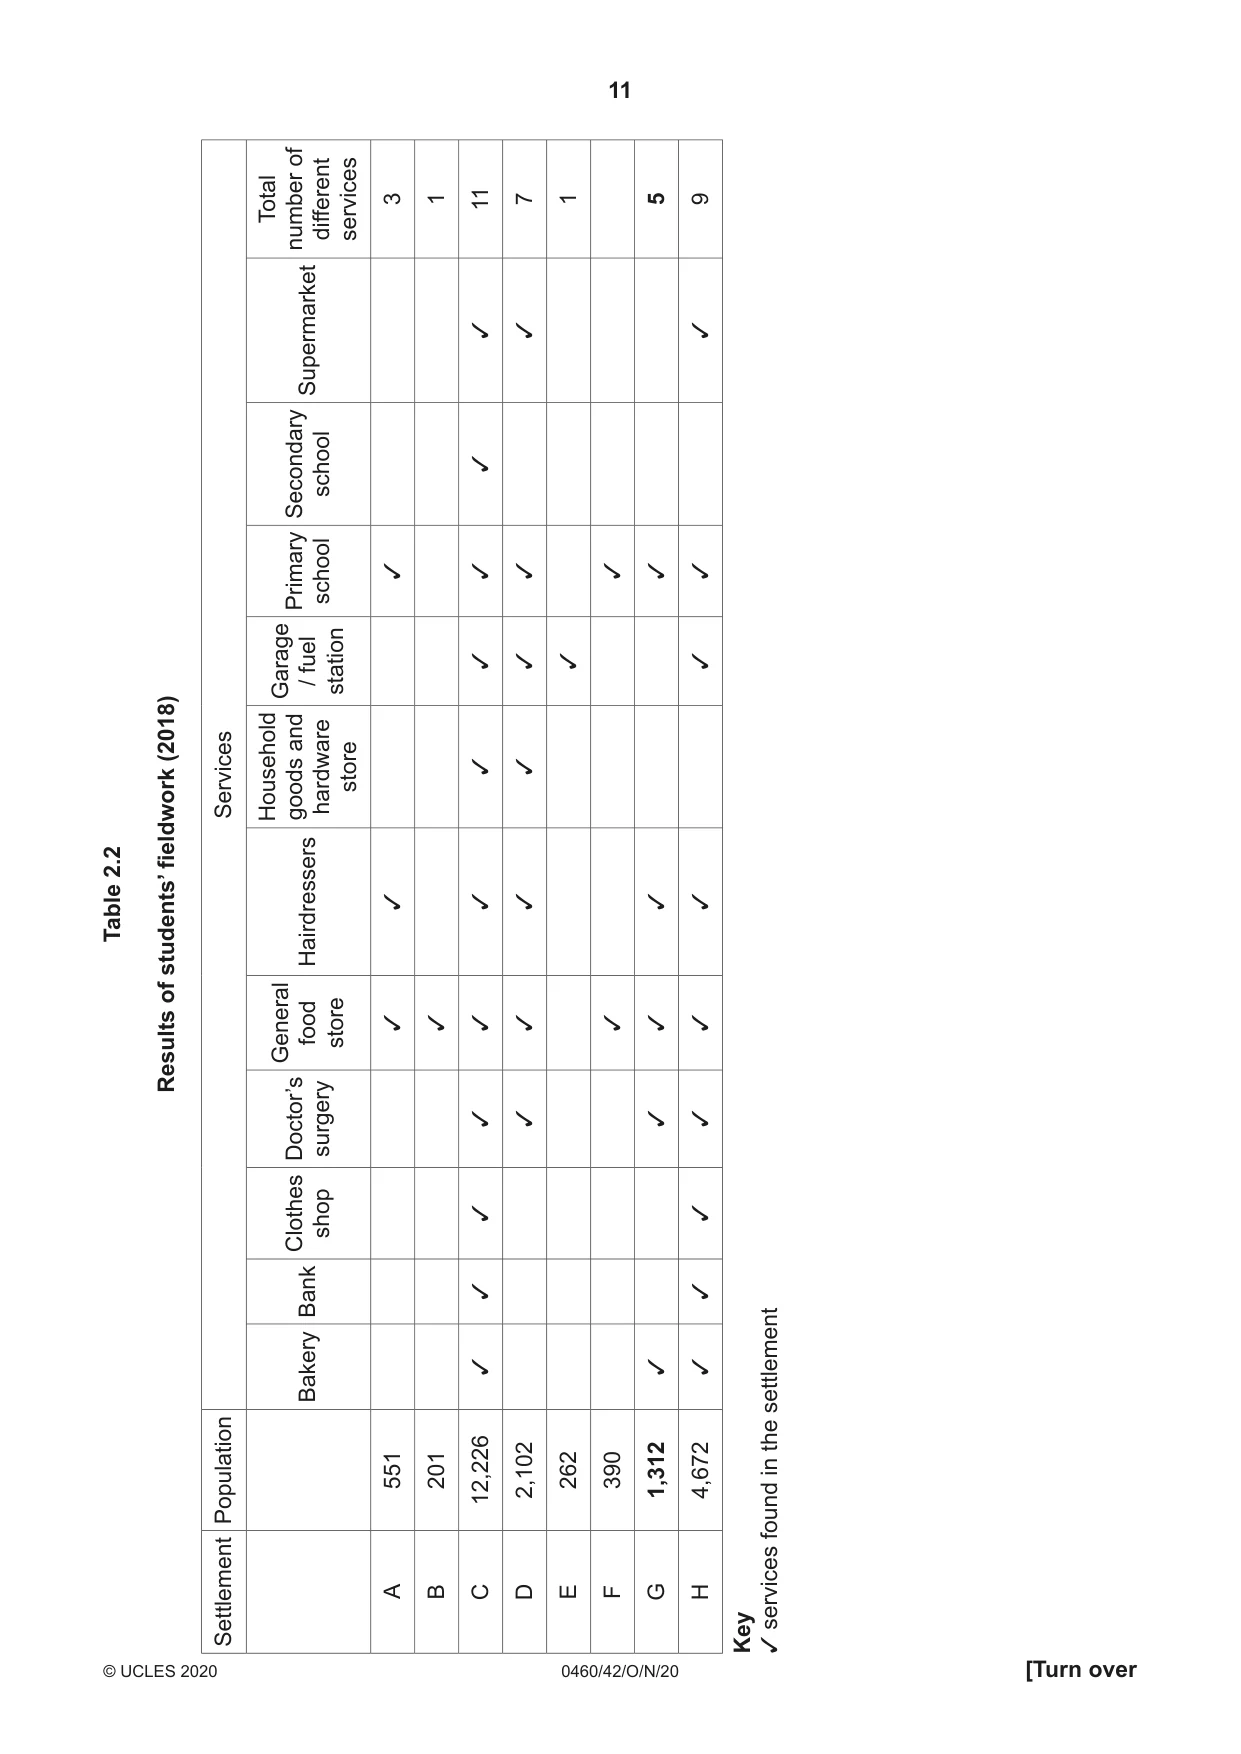
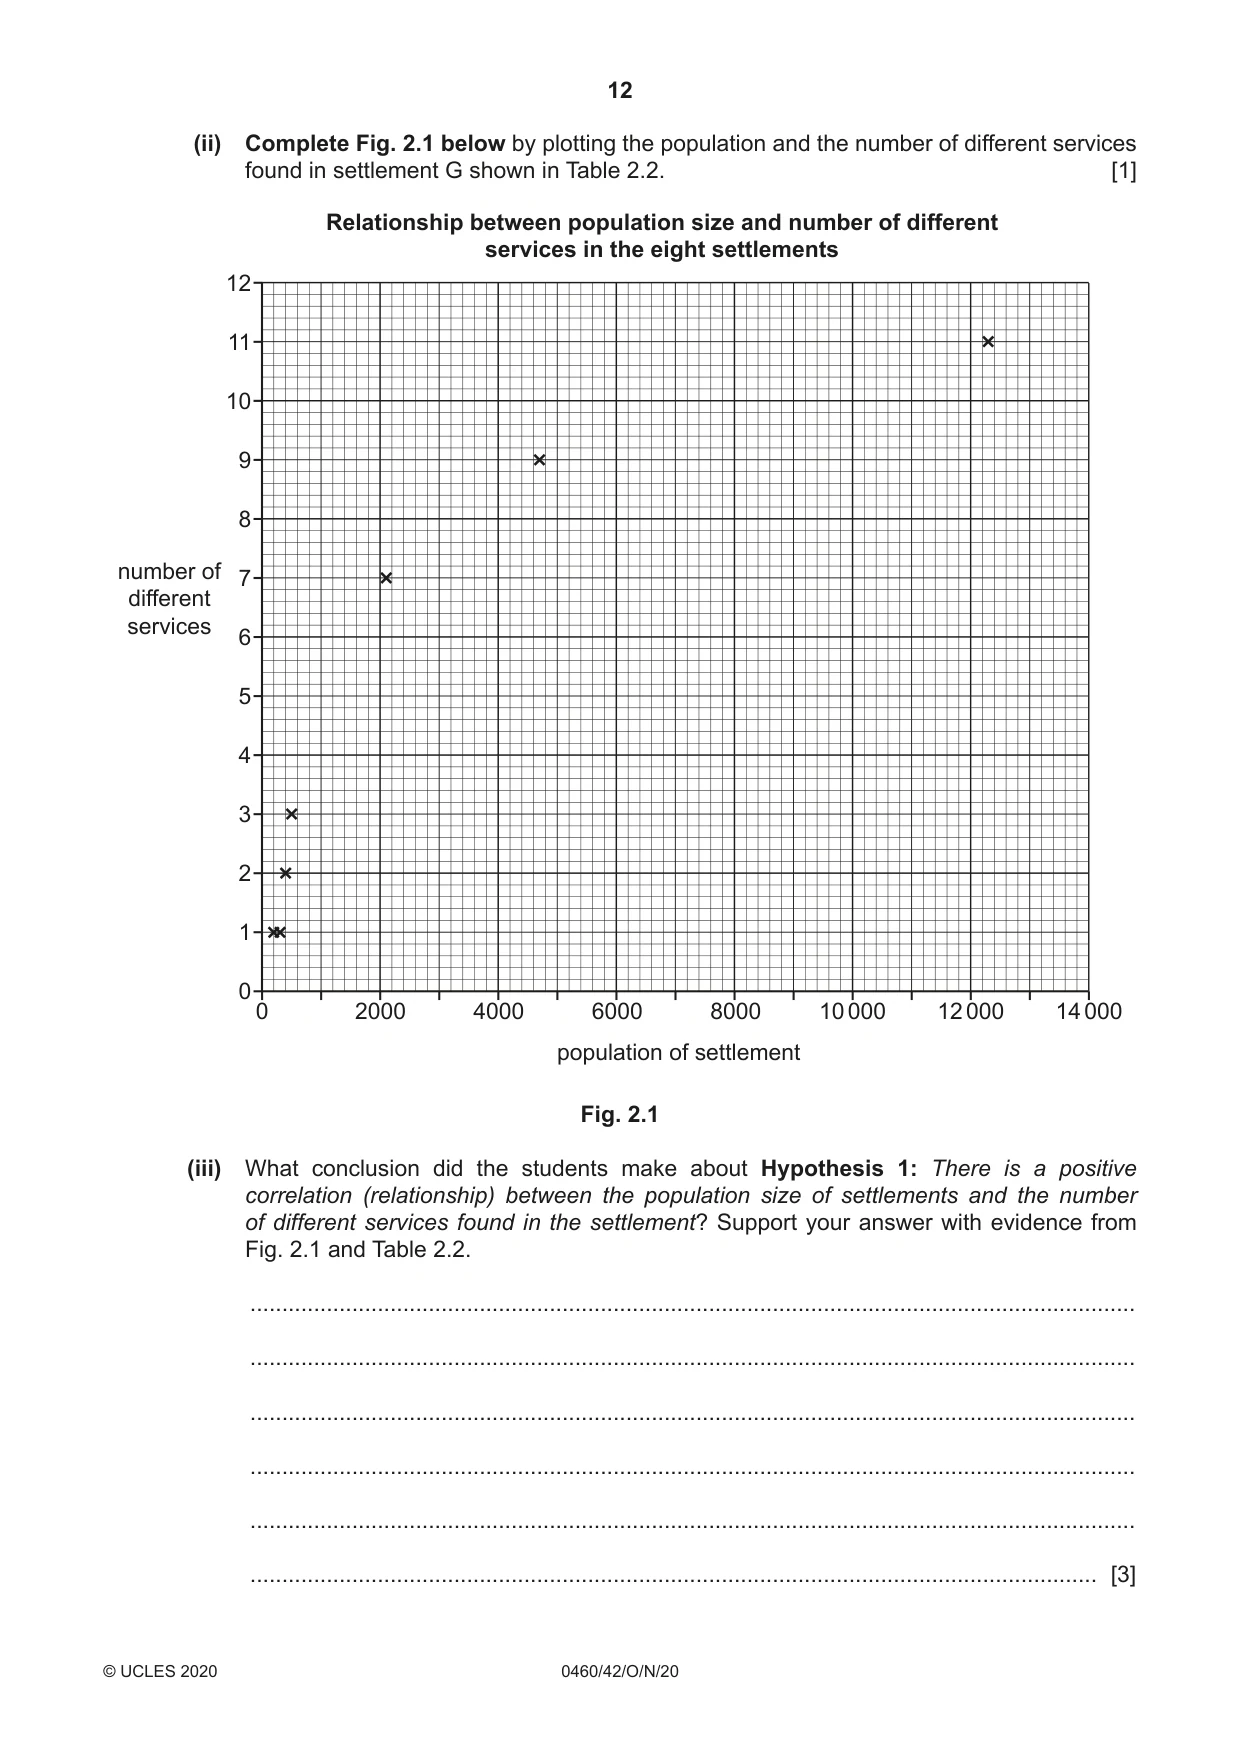
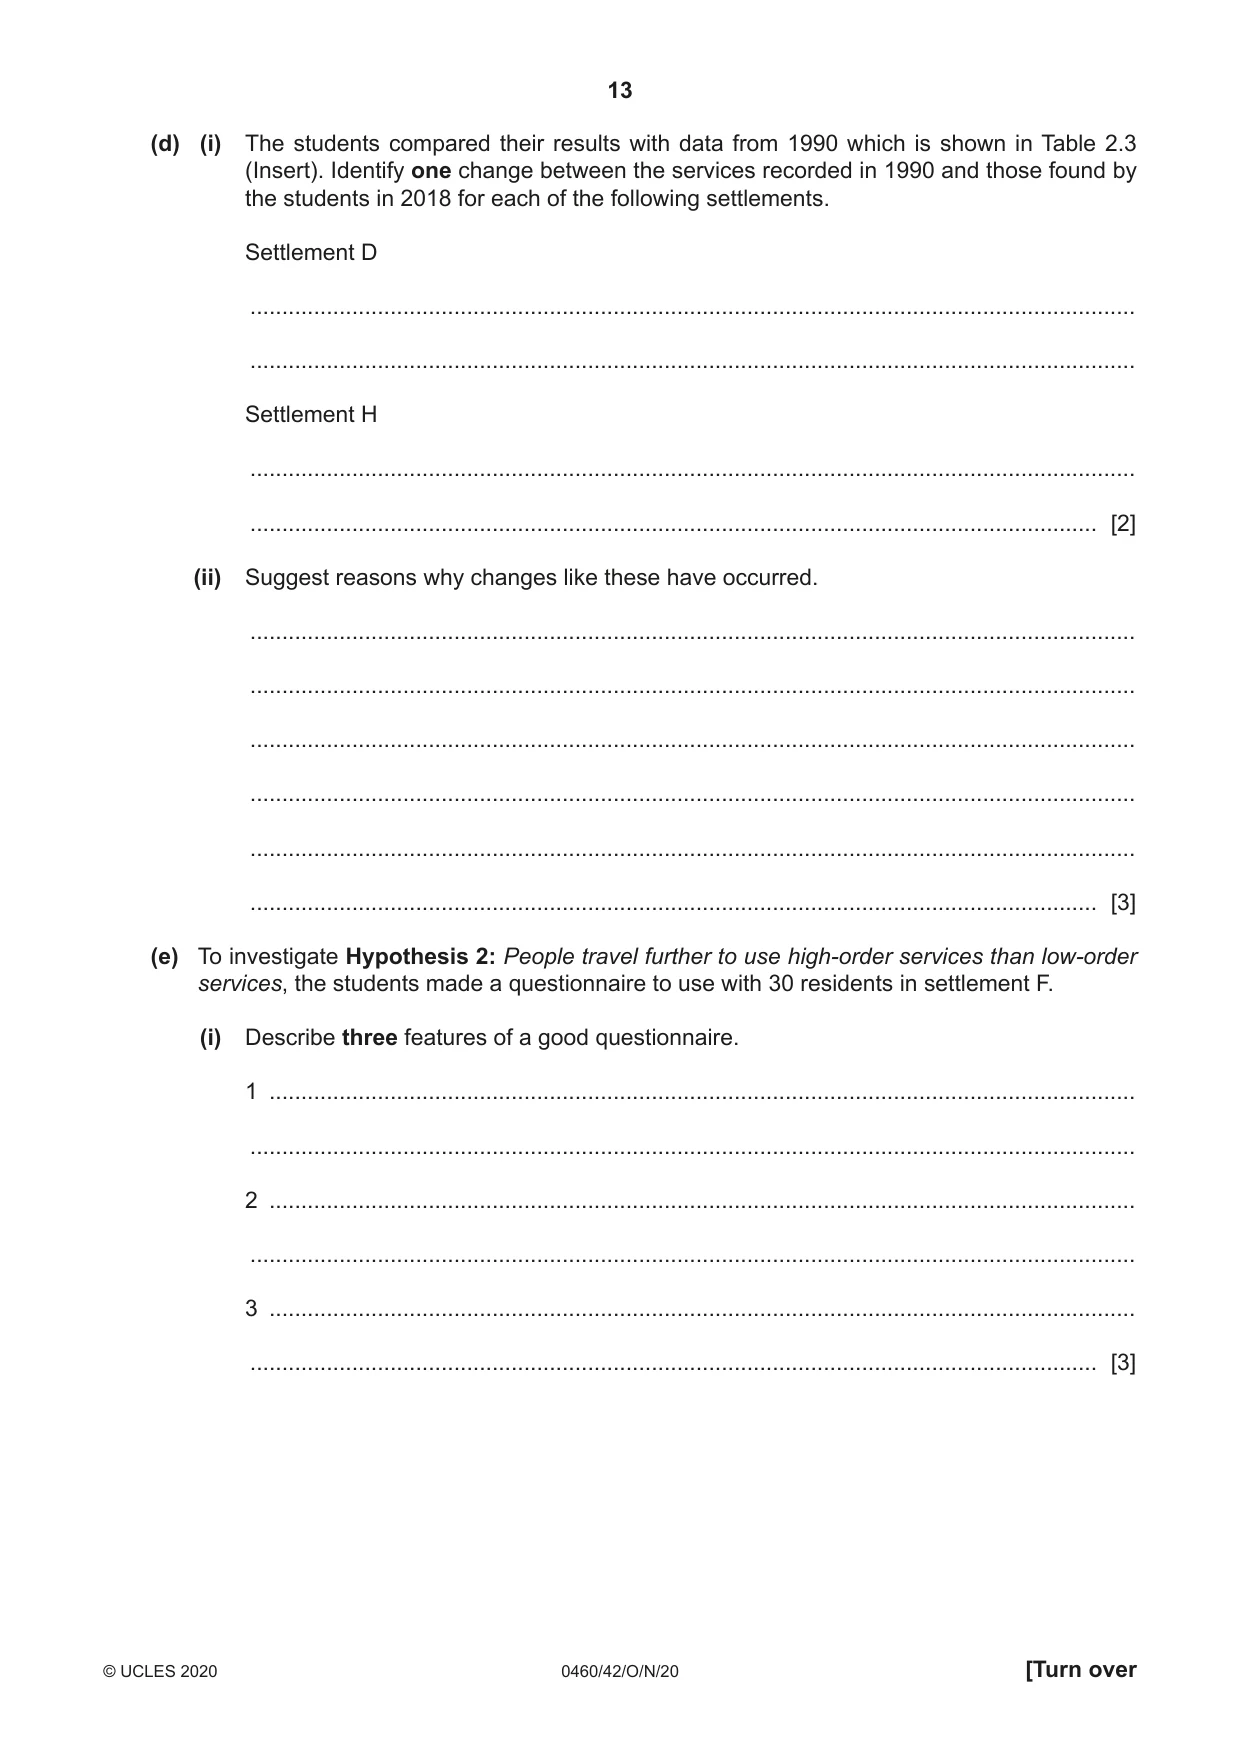
2 A class of students from a rural area of Wales was studying settlement and service provision. (a) (i) In class the students revised ‘hierarchy of services’. Services can be classified as high-order, middle-order and low-order. Table 2.1 below shows examples of different services in the hierarchy of services. Complete the table by adding the following services: bus stop fire station airport Table 2.1 high-order service middle-order service low-order service hospital health centre café [2] (ii) Which one of the following is the correct definition of ‘low-order service’? Tick (3) your answer. Tick (3) a service which is frequently used a service which is occasionally used a service which is rarely used [1] The students tested the following hypotheses: Hypothesis 1: There is a positive correlation (relationship) between the population size of settlements and the number of different services found in the settlement. Hypothesis 2: People travel further to use high-order services than low-order services. (b) The students decided to visit eight settlements to investigate which different services were found there. They recorded the services they found in each settlement. Their results are shown in Table 2.2, on page 11. (i) Which service is present in the highest number of settlements? .................................................................. [1] (ii) Insert into Table 2.2 (on page 11) the total number of different services found in settlement F. [1] (iii) Complete the following table to put the settlements in rank order based on the number of different services they contain. [2] Rank number Settlement 1 C 2 3 4 5 6 F 7= B 7= E (c) The students found out the population living in each settlement from a census. (i) Explain why census statistics are known as secondary data. ........................................................................................................................................... ........................................................................................................................................... ........................................................................................................................................... ..................................................................................................................................... [2] 5 9 3 3 3 3 3 3 3 3 3 3 3 3 3 3 3 3 settlement the in390 1,312 4,672 found F G H services Key3
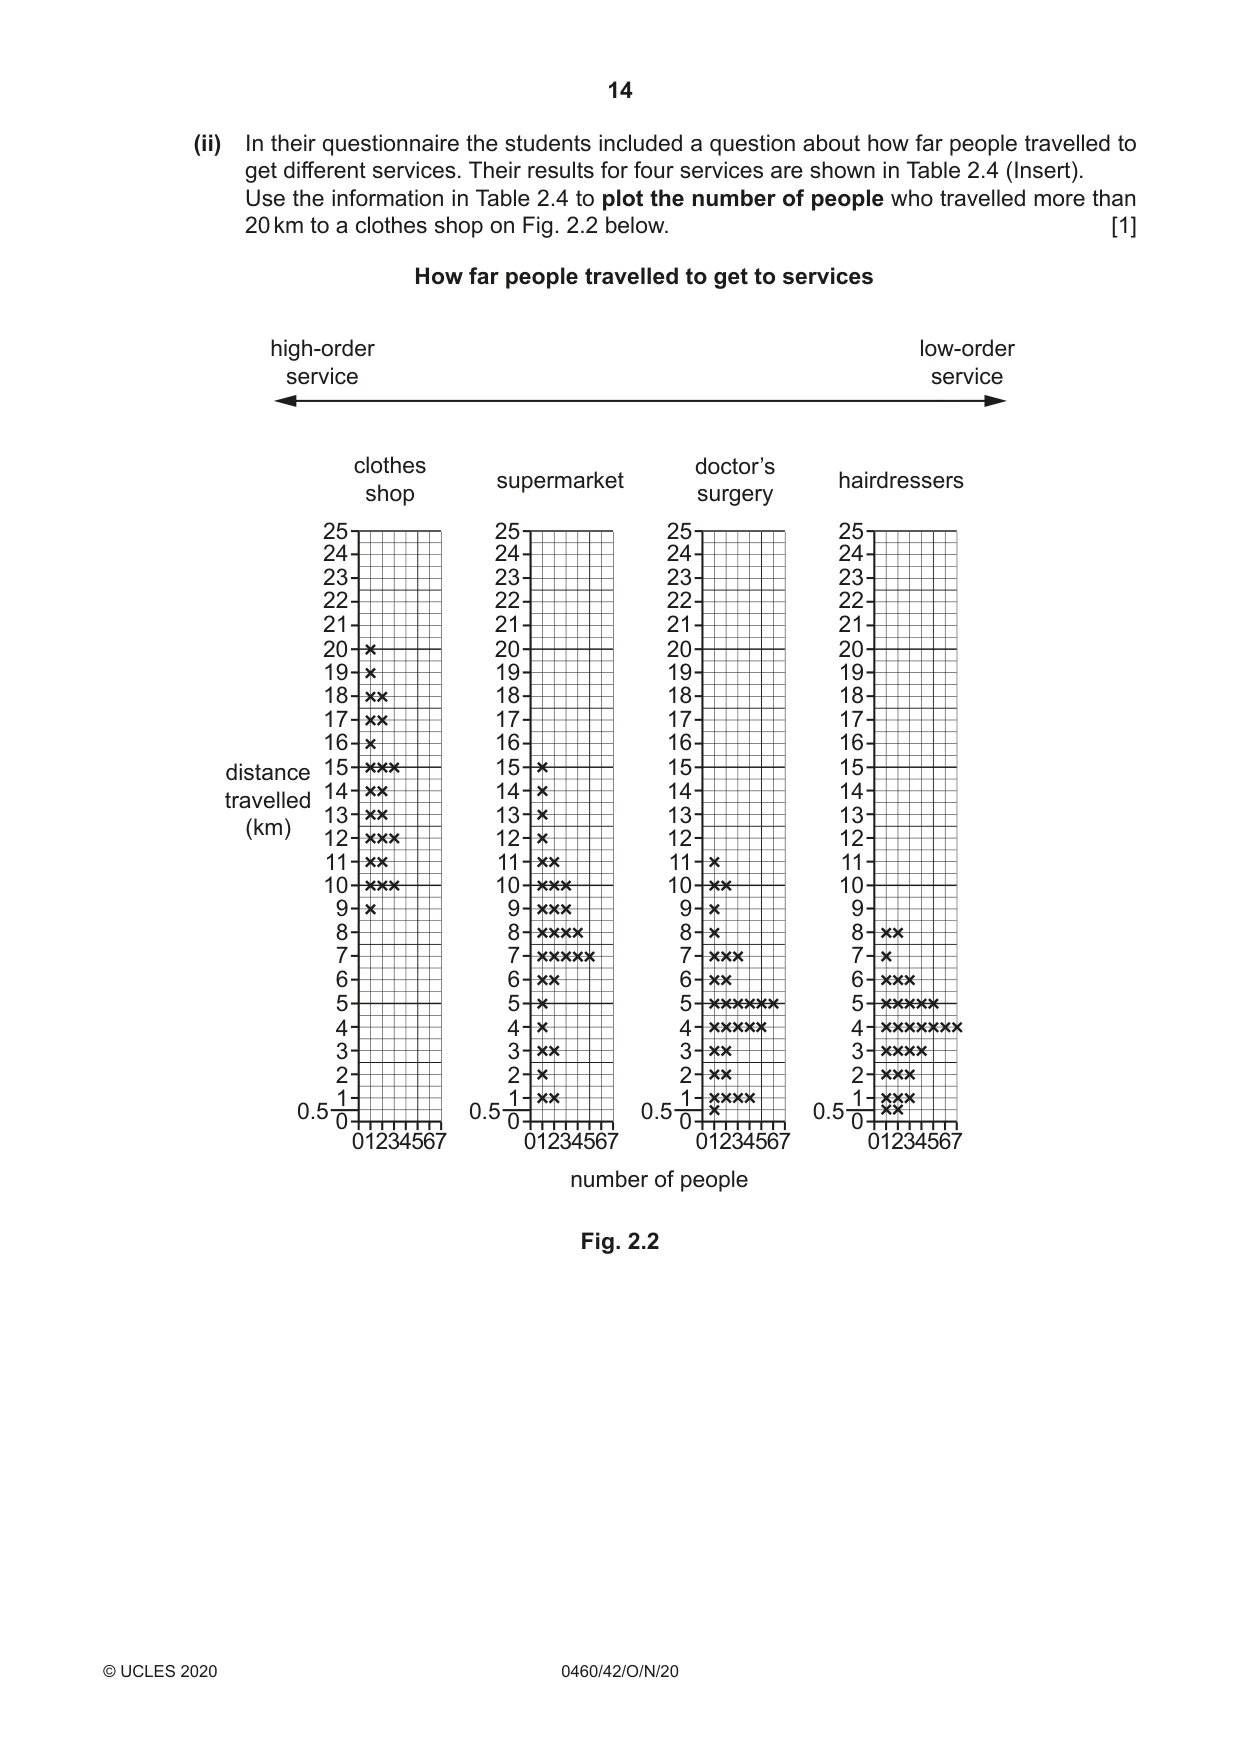
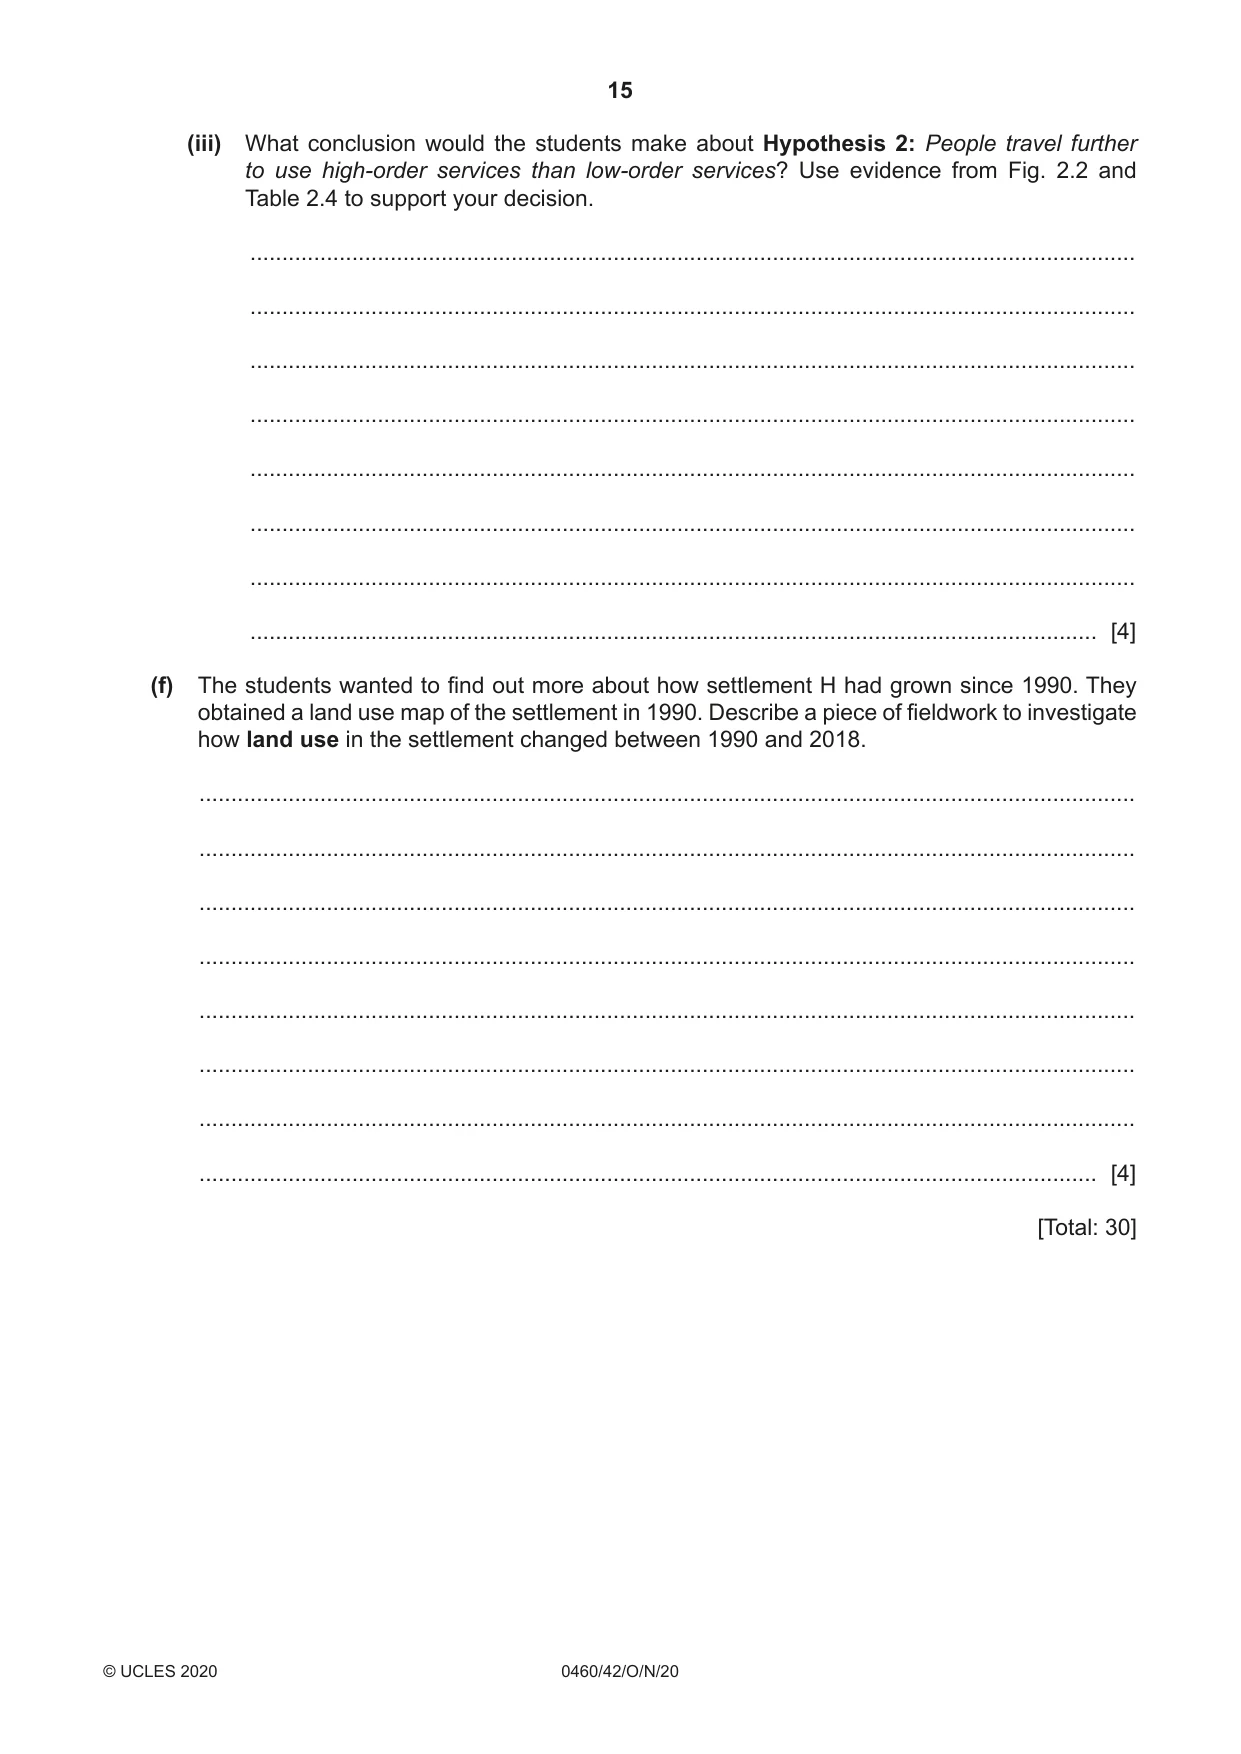
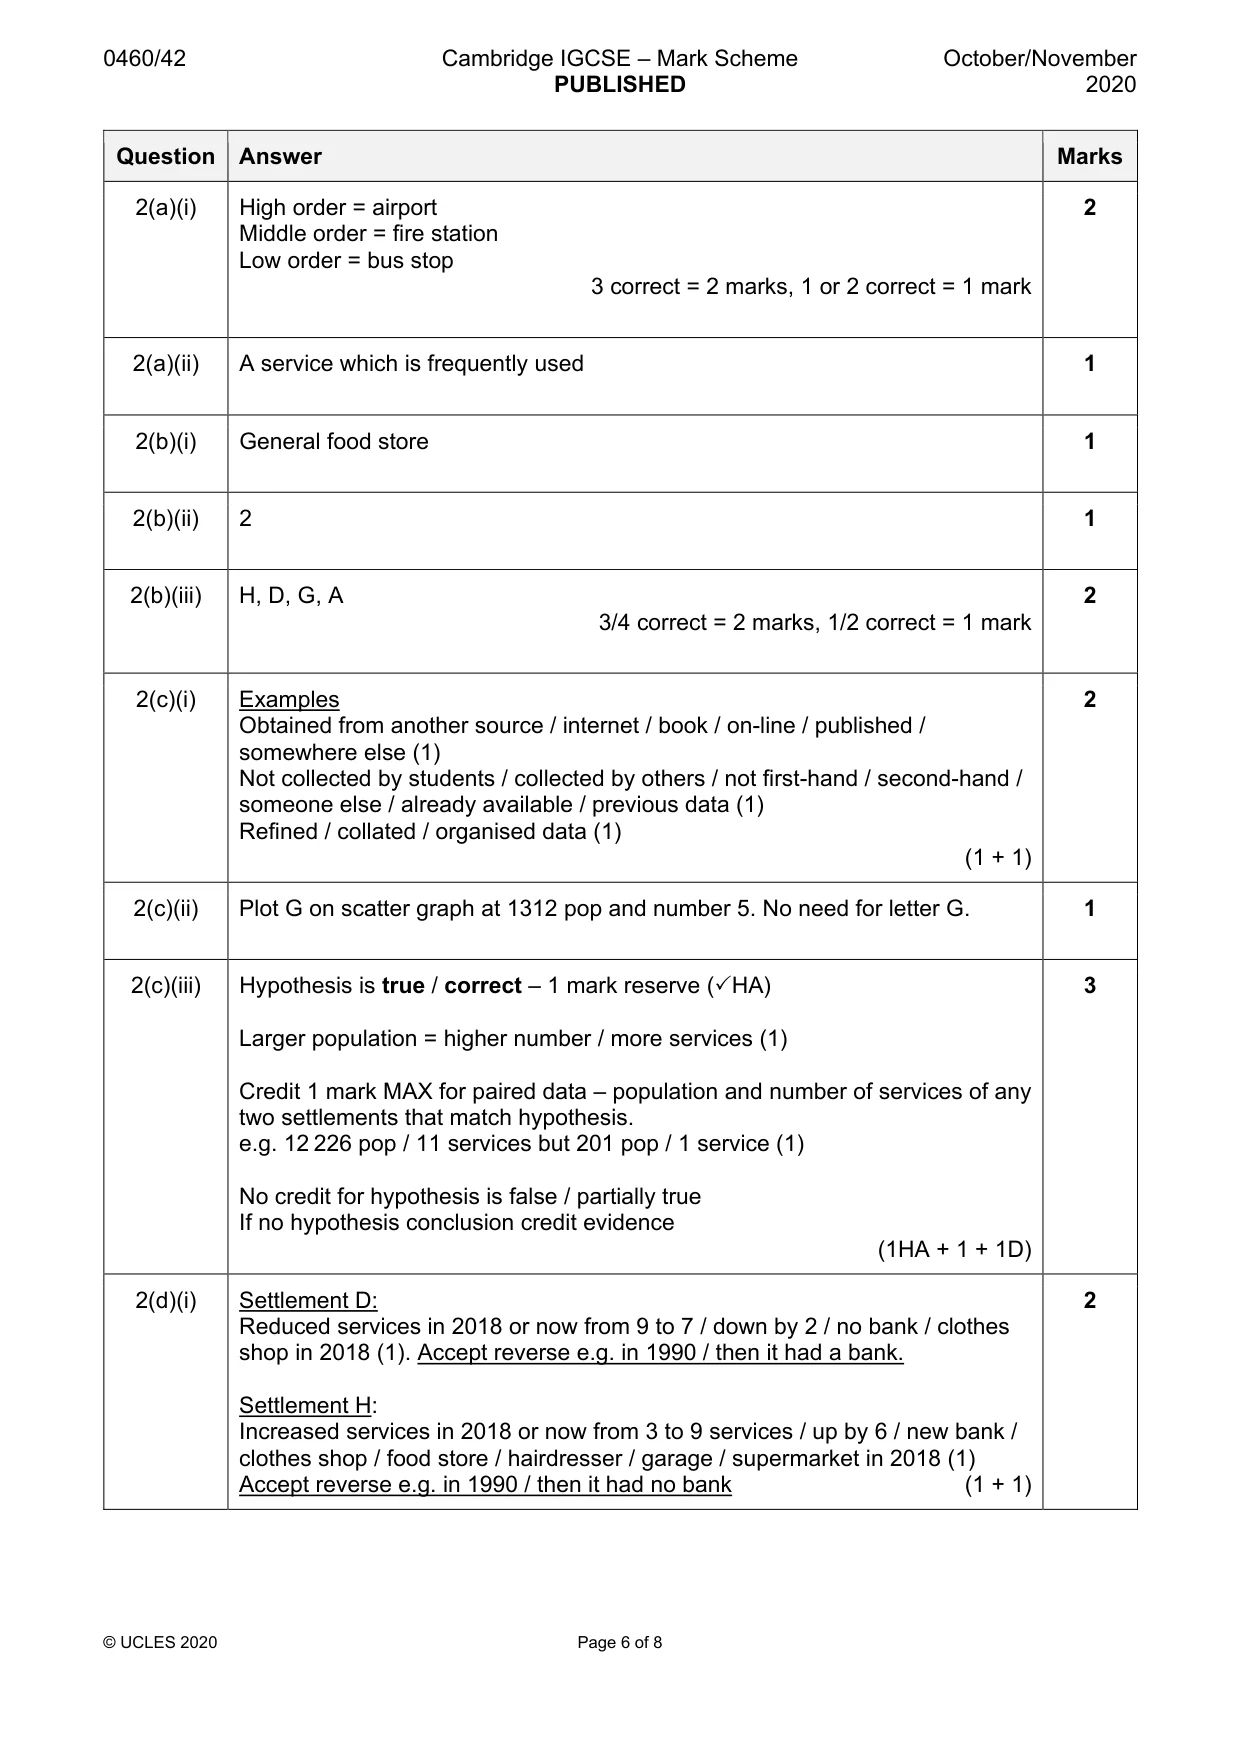
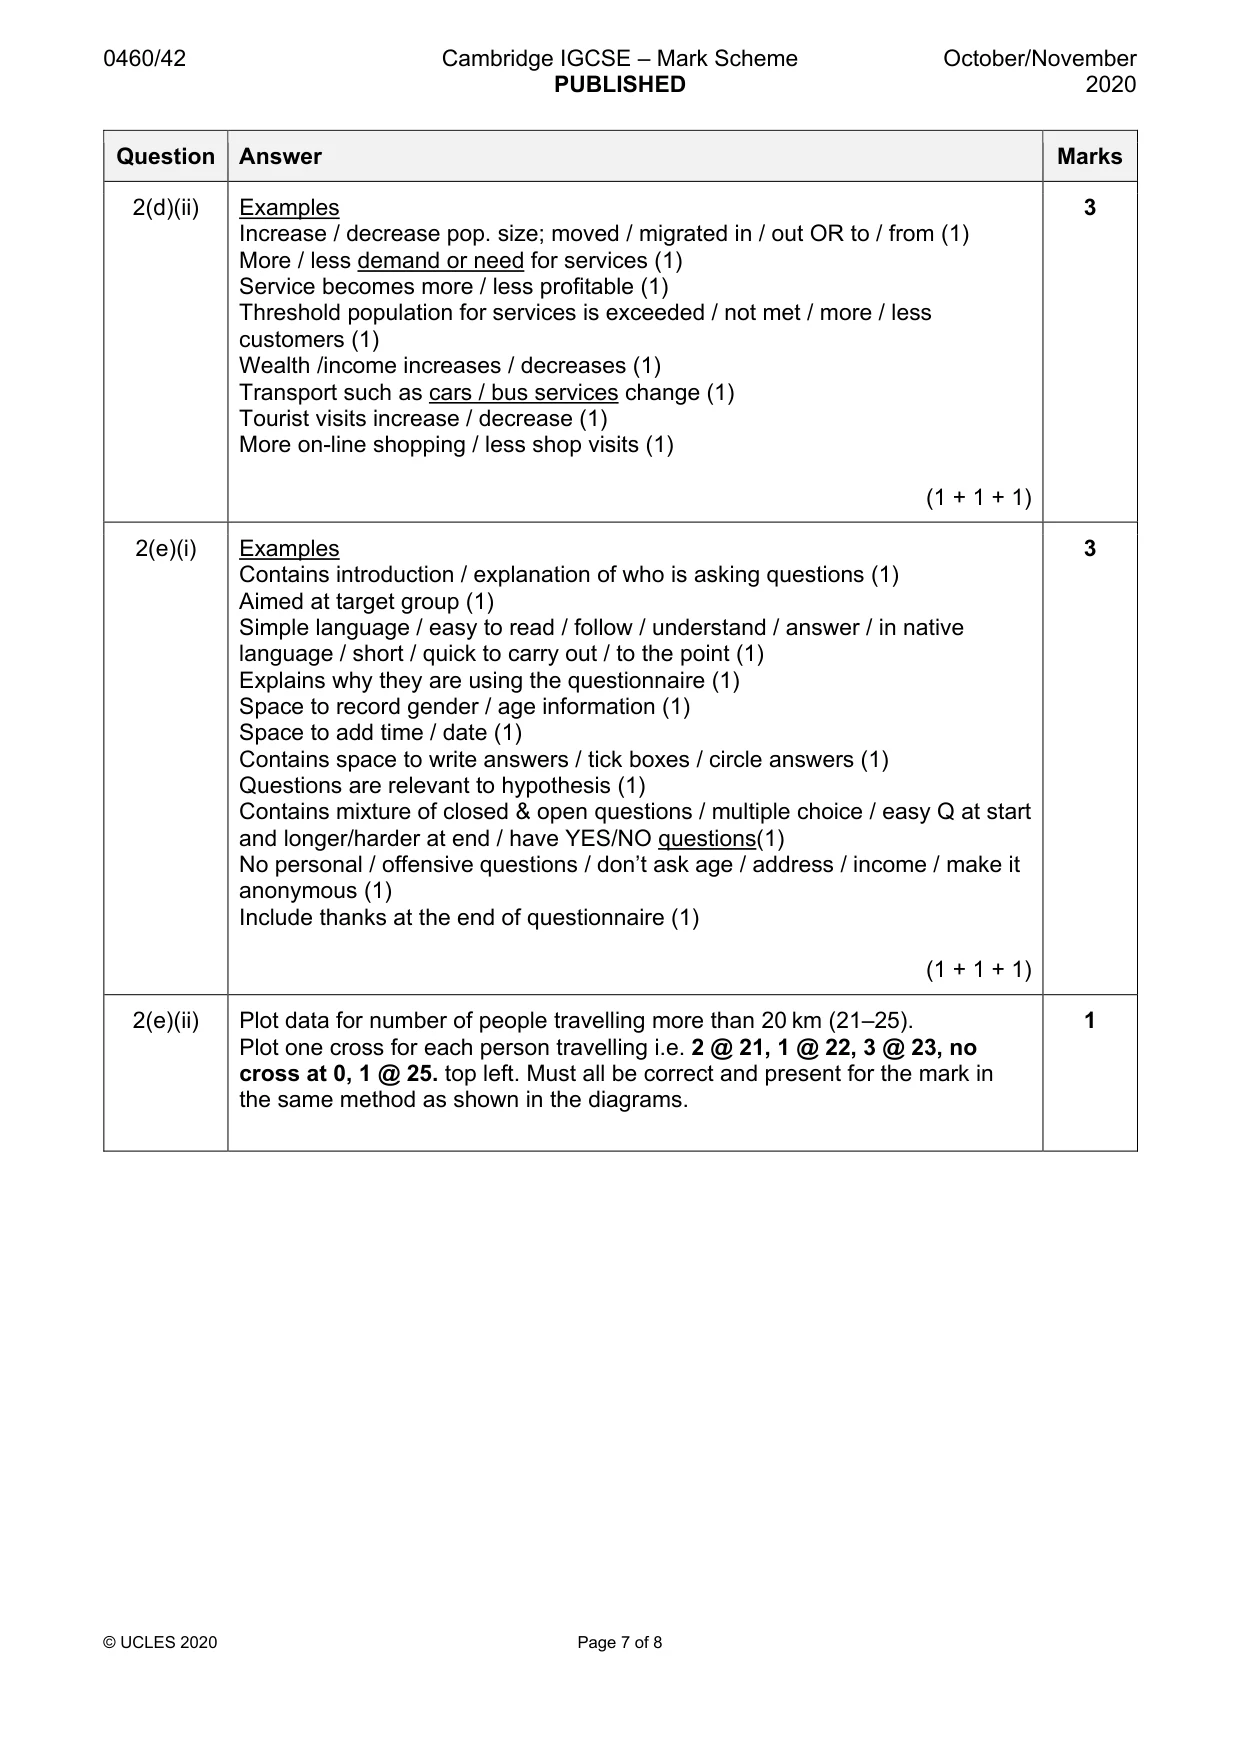
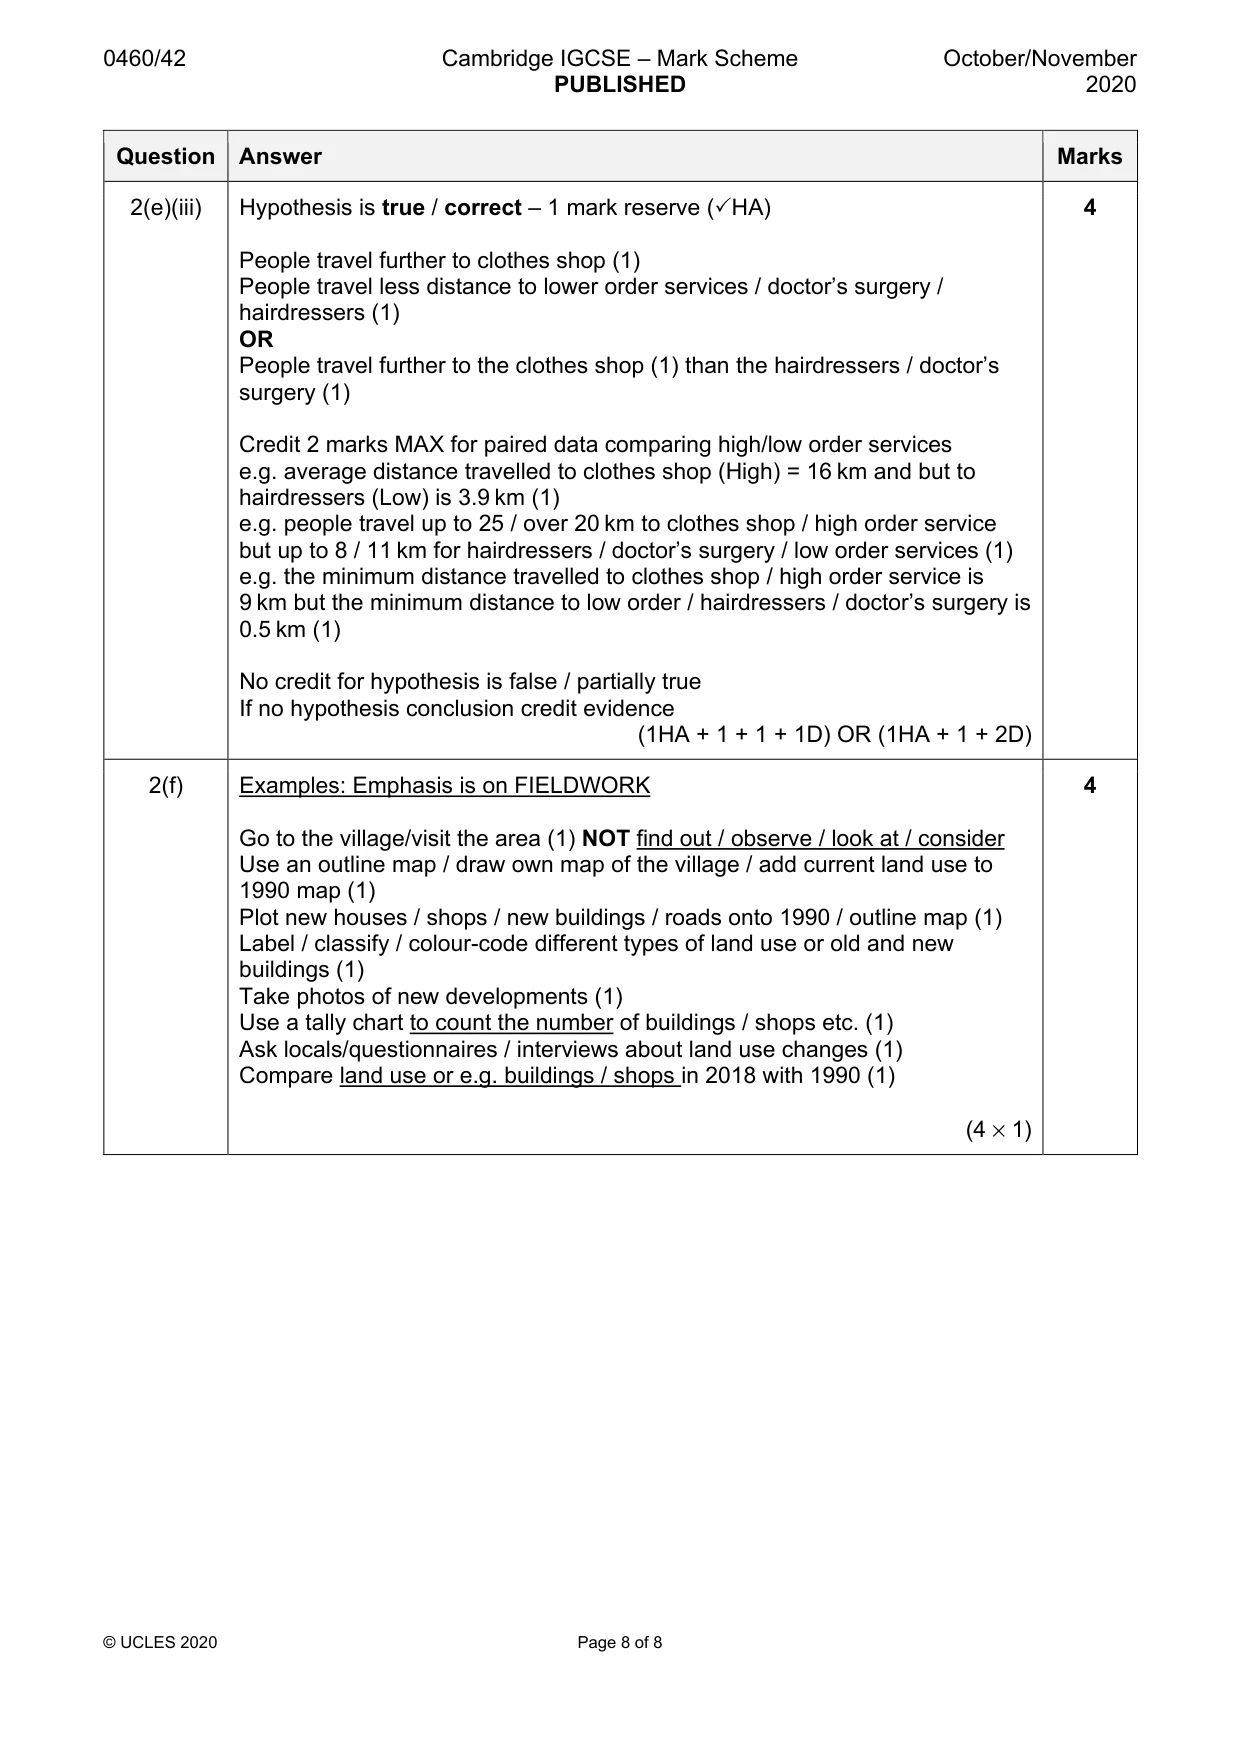
Mark scheme: 2(a)(i) High order = airport 2 Middle order = fire station Low order = bus stop 3 correct = 2 marks, 1 or 2 correct = 1 mark 2(a)(ii) A service which is frequently used 1 2(b)(i) General food store 1 2(b)(ii) 2 1 2(b)(iii) H, D, G, A 2 3/4 correct = 2 marks, 1/2 correct = 1 mark 2(c)(i) Examples 2 Obtained from another source / internet / book / on-line / published / somewhere else (1) Not collected by students / collected by others / not first-hand / second-hand / someone else / already available / previous data (1) Refined / collated / organised data (1) (1 + 1) 2(c)(ii) Plot G on scatter graph at 1312 pop and number 5. No need for letter G. 1 2(c)(iii) Hypothesis is true / correct – 1 mark reserve (HA) 3 Larger population = higher number / more services (1) Credit 1 mark MAX for paired data – population and number of services of any two settlements that match hypothesis. e.g. 12 226 pop / 11 services but 201 pop / 1 service (1) No credit for hypothesis is false / partially true If no hypothesis conclusion credit evidence (1HA + 1 + 1D) 2(d)(i) Settlement D: 2 Reduced services in 2018 or now from 9 to 7 / down by 2 / no bank / clothes shop in 2018 (1). Accept reverse e.g. in 1990 / then it had a bank. Settlement H: Increased services in 2018 or now from 3 to 9 services / up by 6 / new bank / clothes shop / food store / hairdresser / garage / supermarket in 2018 (1) Accept reverse e.g. in 1990 / then it had no bank (1 + 1) Question Answer Marks 2(d)(ii) Examples 3 Increase / decrease pop. size; moved / migrated in / out OR to / from (1) More / less demand or need for services (1) Service becomes more / less profitable (1) Threshold population for services is exceeded / not met / more / less customers (1) Wealth /income increases / decreases (1) Transport such as cars / bus services change (1) Tourist visits increase / decrease (1) More on-line shopping / less shop visits (1) (1 + 1 + 1) 2(e)(i) Examples 3 Contains introduction / explanation of who is asking questions (1) Aimed at target group (1) Simple language / easy to read / follow / understand / answer / in native language / short / quick to carry out / to the point (1) Explains why they are using the questionnaire (1) Space to record gender / age information (1) Space to add time / date (1) Contains space to write answers / tick boxes / circle answers (1) Questions are relevant to hypothesis (1) Contains mixture of closed & open questions / multiple choice / easy Q at start and longer/harder at end / have YES/NO questions(1) No personal / offensive questions / don’t ask age / address / income / make it anonymous (1) Include thanks at the end of questionnaire (1) (1 + 1 + 1) 2(e)(ii) Plot data for number of people travelling more than 20 km (21–25). 1 Plot one cross for each person travelling i.e. 2 @ 21, 1 @ 22, 3 @ 23, no cross at 0, 1 @ 25. top left. Must all be correct and present for the mark in the same method as shown in the diagrams. Question Answer Marks 2(e)(iii) Hypothesis is true / correct – 1 mark reserve (HA) 4 People travel further to clothes shop (1) People travel less distance to lower order services / doctor’s surgery / hairdressers (1) OR People travel further to the clothes shop (1) than the hairdressers / doctor’s surgery (1) Credit 2 marks MAX for paired data comparing high/low order services e.g. average distance travelled to clothes shop (High) = 16 km and but to hairdressers (Low) is 3.9 km (1) e.g. people travel up to 25 / over 20 km to clothes shop / high order service but up to 8 / 11 km for hairdressers / doctor’s surgery / low order services (1) e.g. the minimum distance travelled to clothes shop / high order service is 9 km but the minimum distance to low order / hairdressers / doctor’s surgery is 0.5 km (1) No credit for hypothesis is false / partially true If no hypothesis conclusion credit evidence (1HA + 1 + 1 + 1D) OR (1HA + 1 + 2D) 2(f) Examples: Emphasis is on FIELDWORK 4 Go to the village/visit the area (1) NOT find out / observe / look at / consider Use an outline map / draw own map of the village / add current land use to 1990 map (1) Plot new houses / shops / new buildings / roads onto 1990 / outline map (1) Label / classify / colour-code different types of land use or old and new buildings (1) Take photos of new developments (1) Use a tally chart to count the number of buildings / shops etc. (1) Ask locals/questionnaires / interviews about land use changes (1) Compare land use or e.g. buildings / shops in 2018 with 1990 (1) (4 × 1)
More questions on Settlements (rural and urban) and service provision
What was in this paper
The subtopics covered by these 2 questions, and how many questions each got. Open one in a new tab to see every Cambridge question on it.
What you needed in this session
Cambridge’s own grade thresholds for 2020 Oct/Nov, Paper 4 · Variant 2. A higher threshold means an easier paper — the bar moves with how the cohort did.