Cambridge IGCSE Geography 0460 — 2019 Oct/Nov Paper 4 · Variant 3
0460/43/O/N/19 · 2 questions · 60 marks · ≈68 min
The question paper and its mark scheme, free to read here and free to download. This is Cambridge’s own paper, exactly as it was sat.
Question paper16 pages




Mark scheme7 pages
Answers below. Sit the paper first if you are practising.
Questions as text
Q1 · Students from Brazil who lived near Tijuca National Park did some fieldwork to study the…
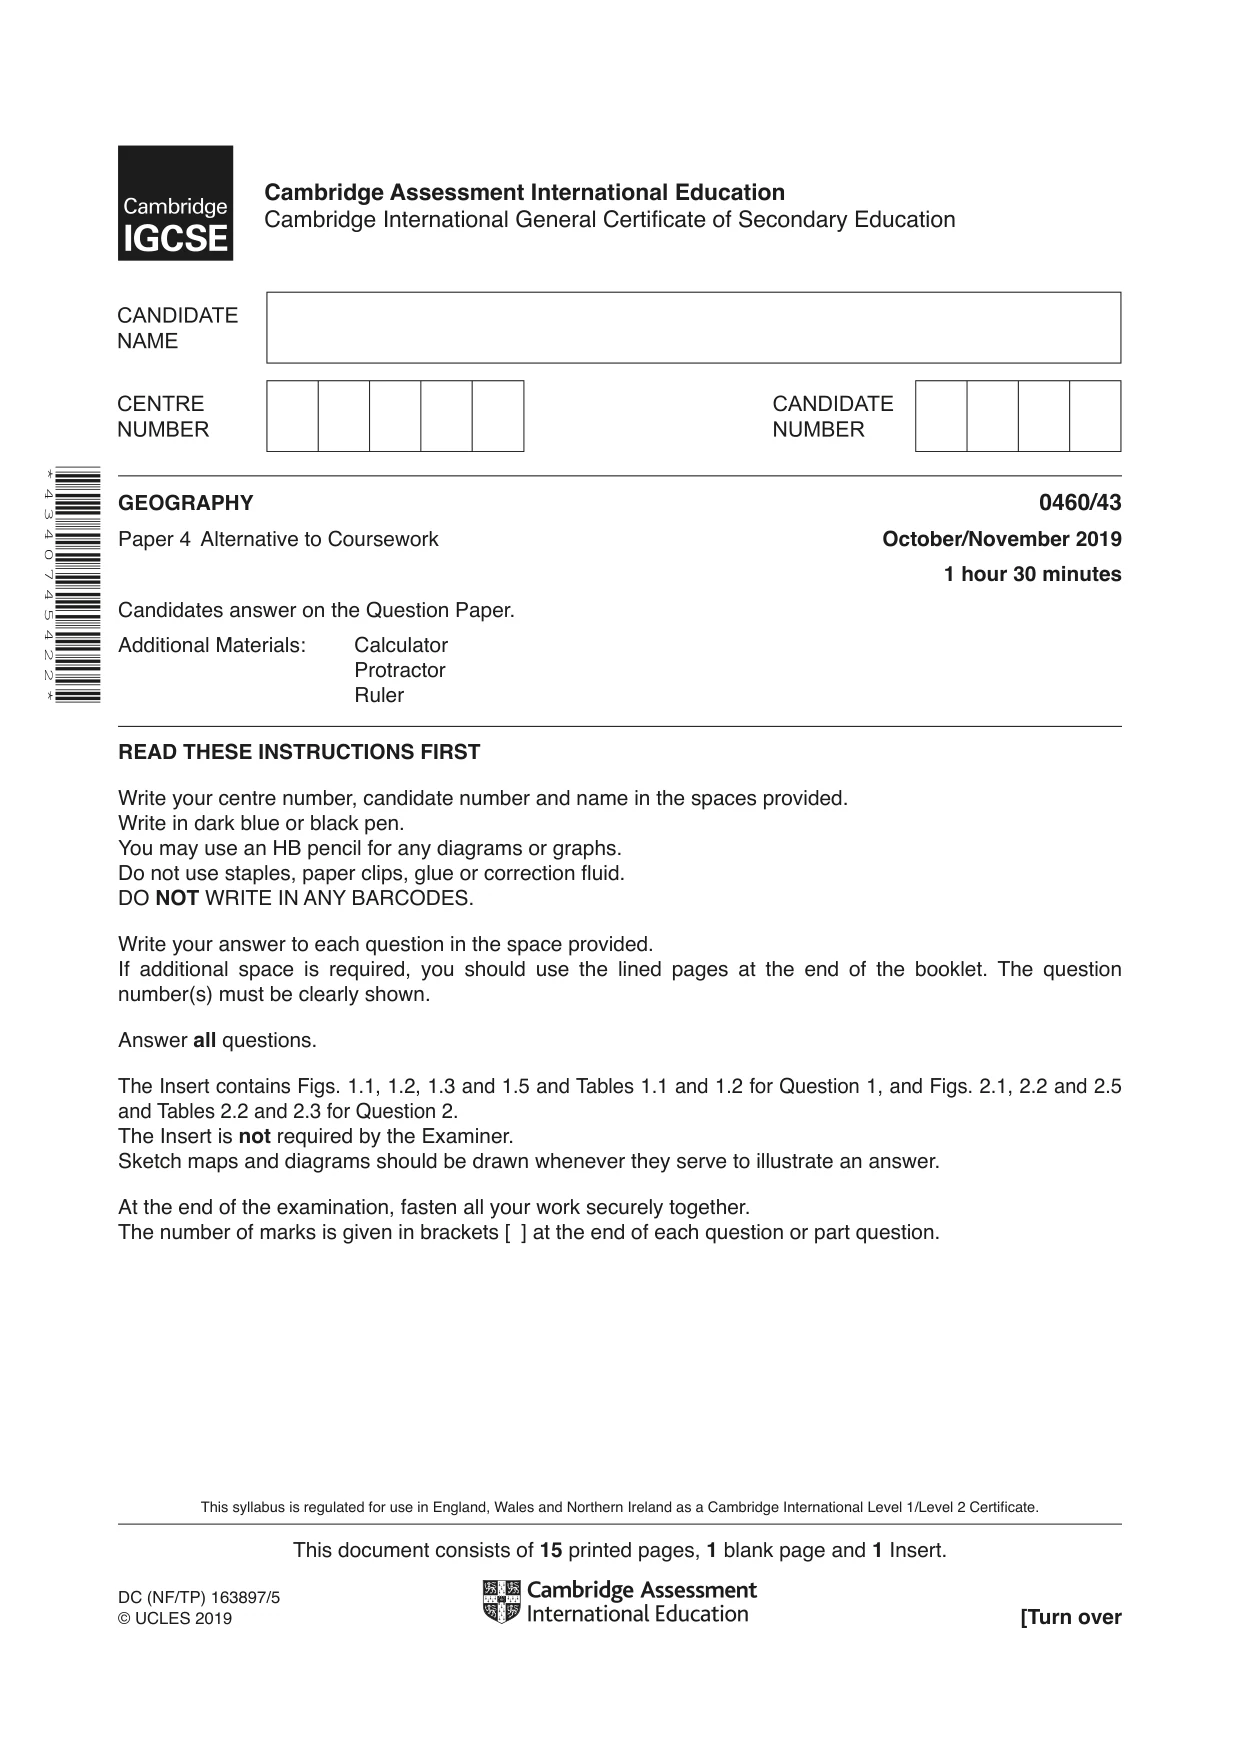
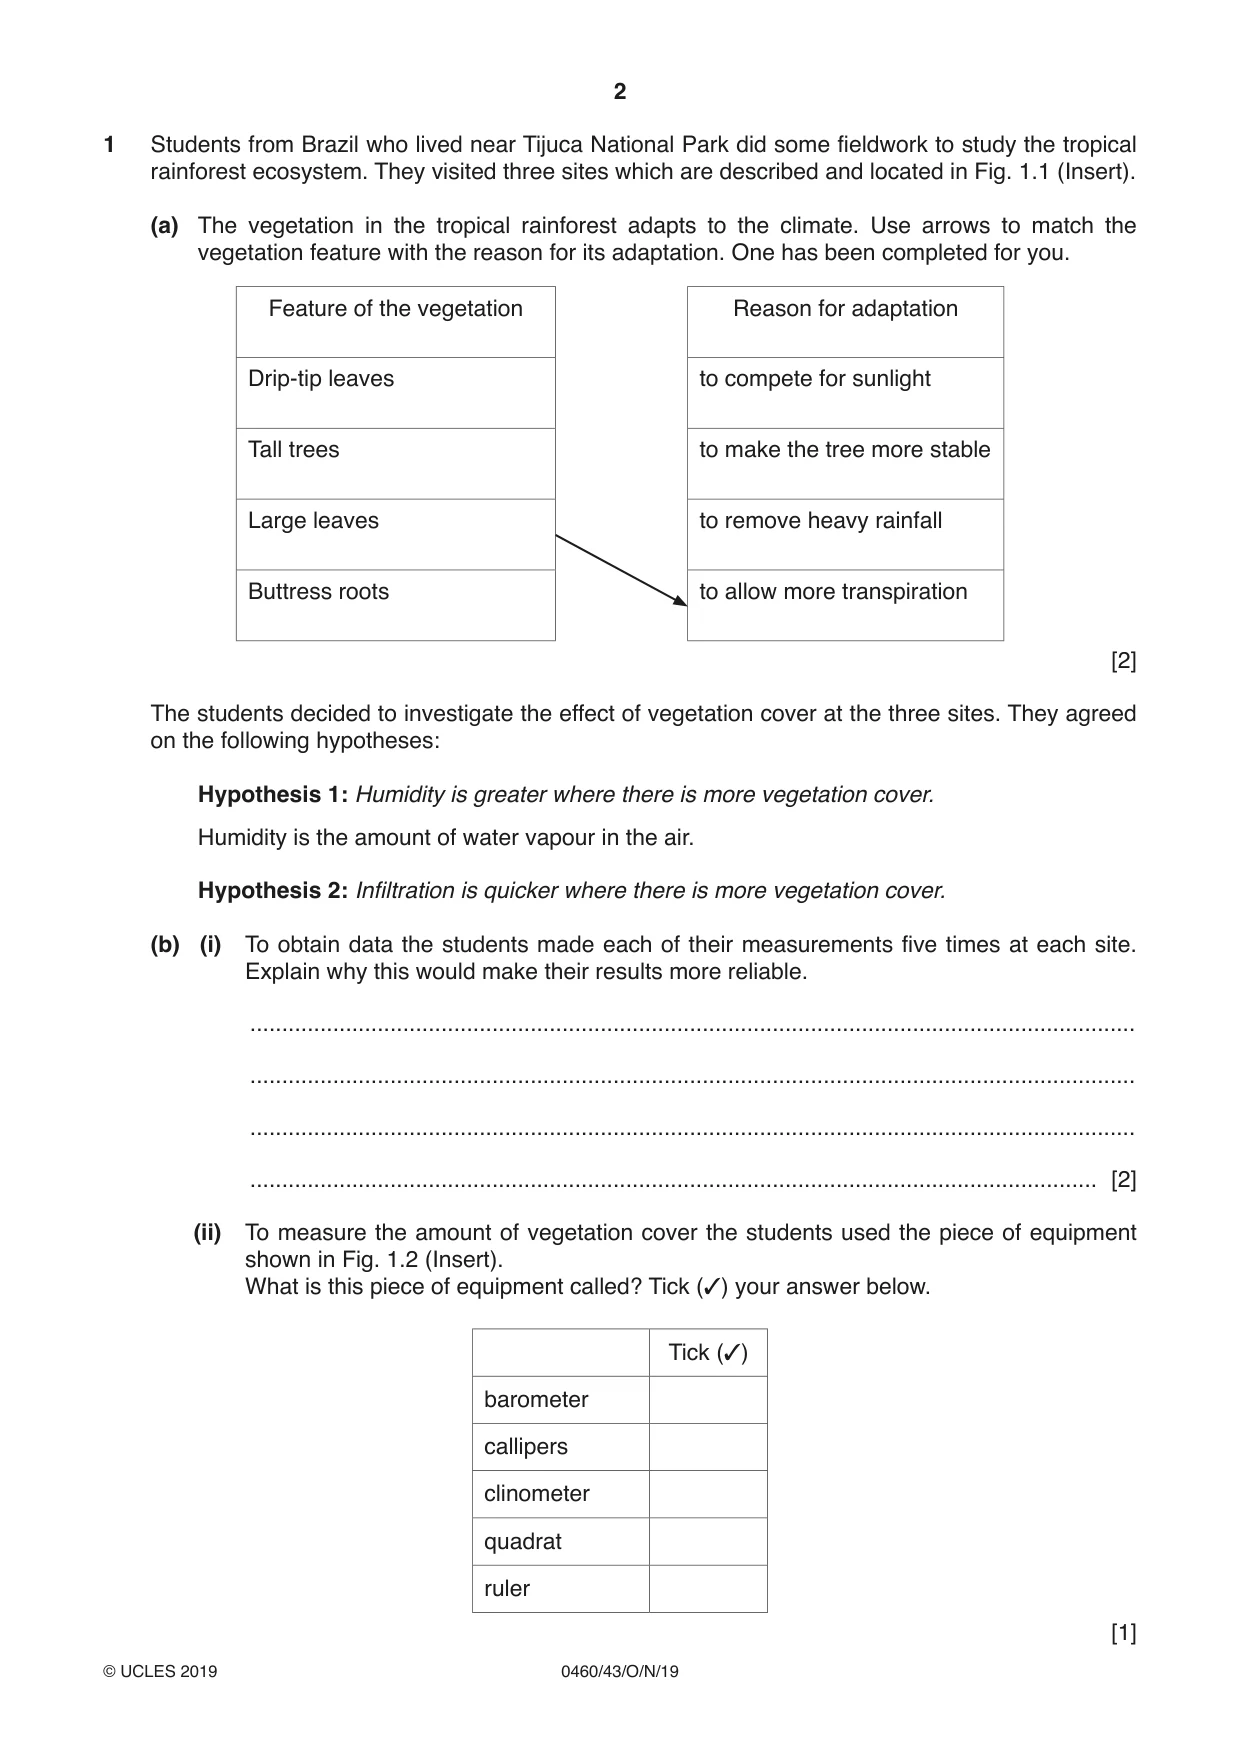
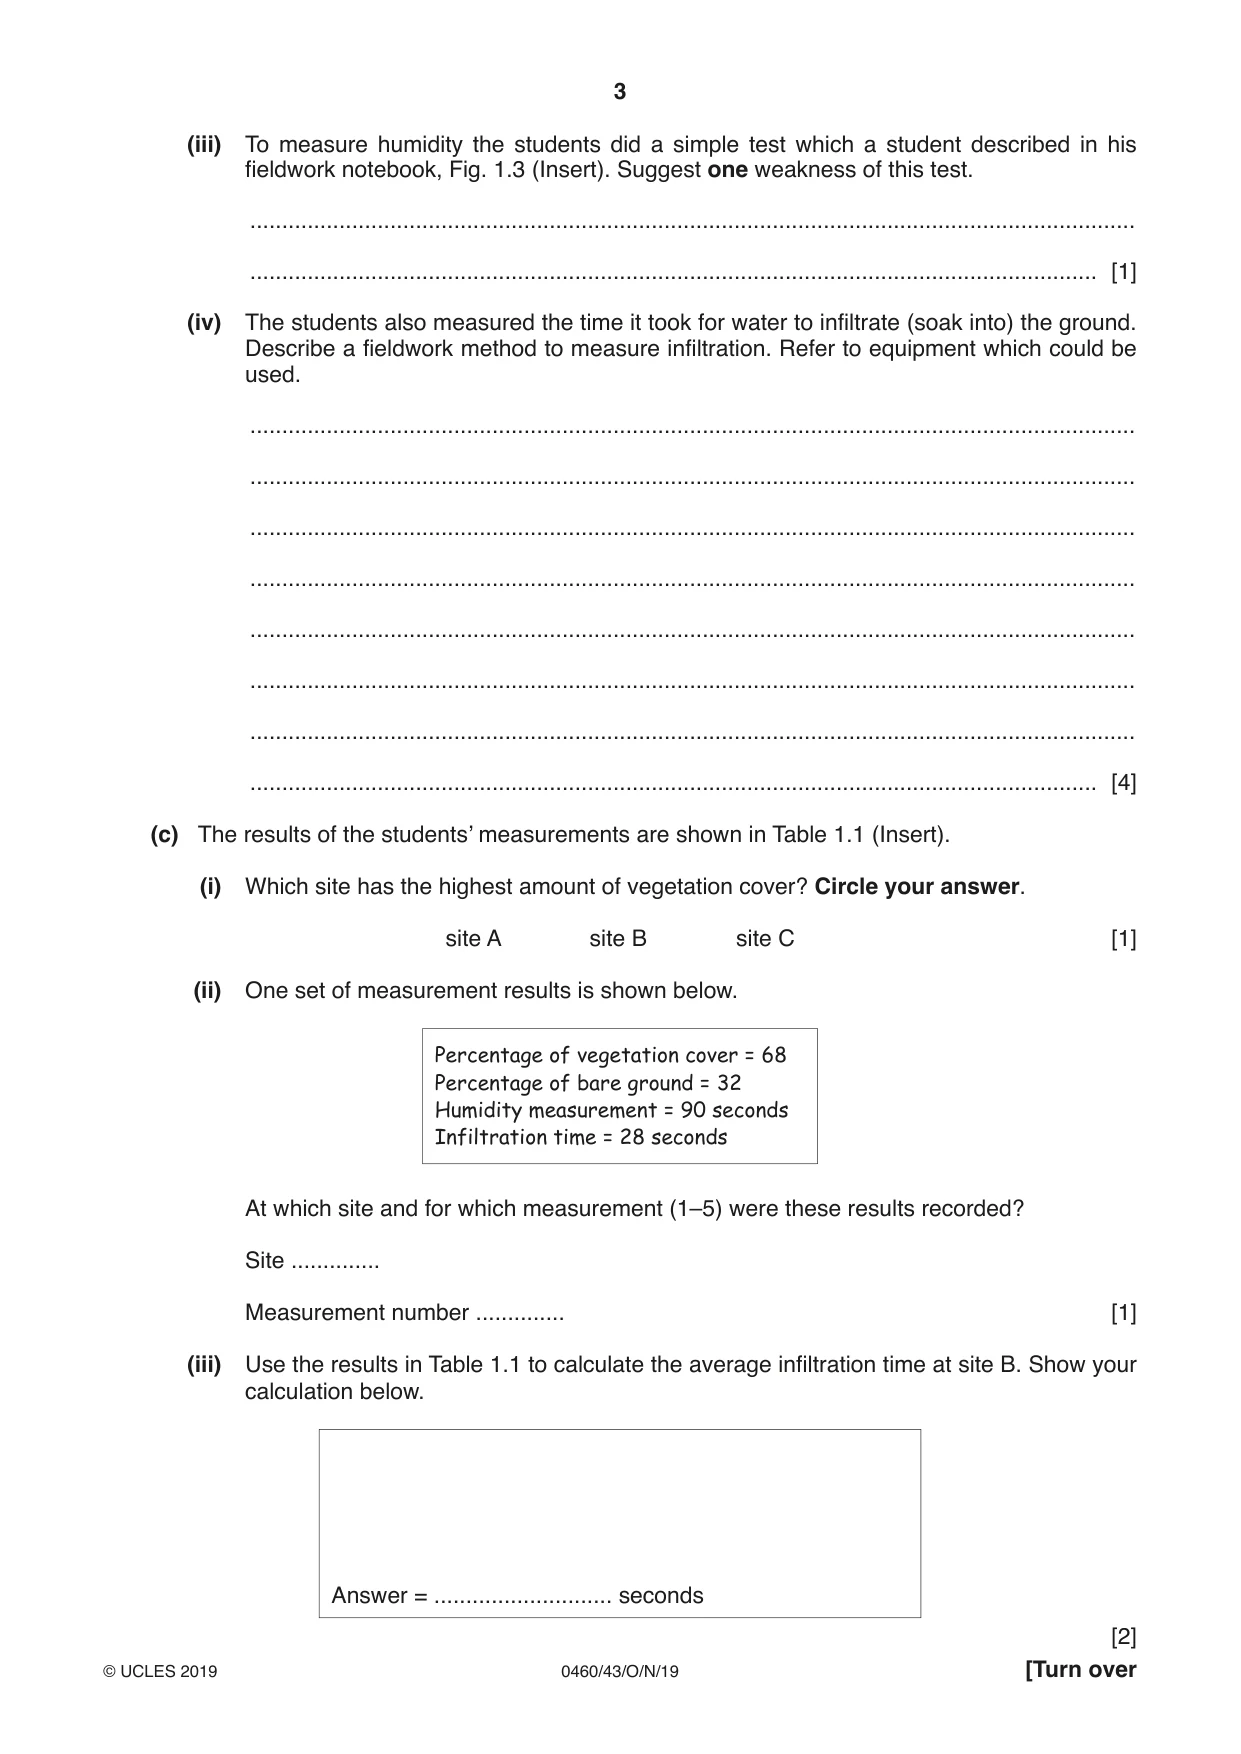
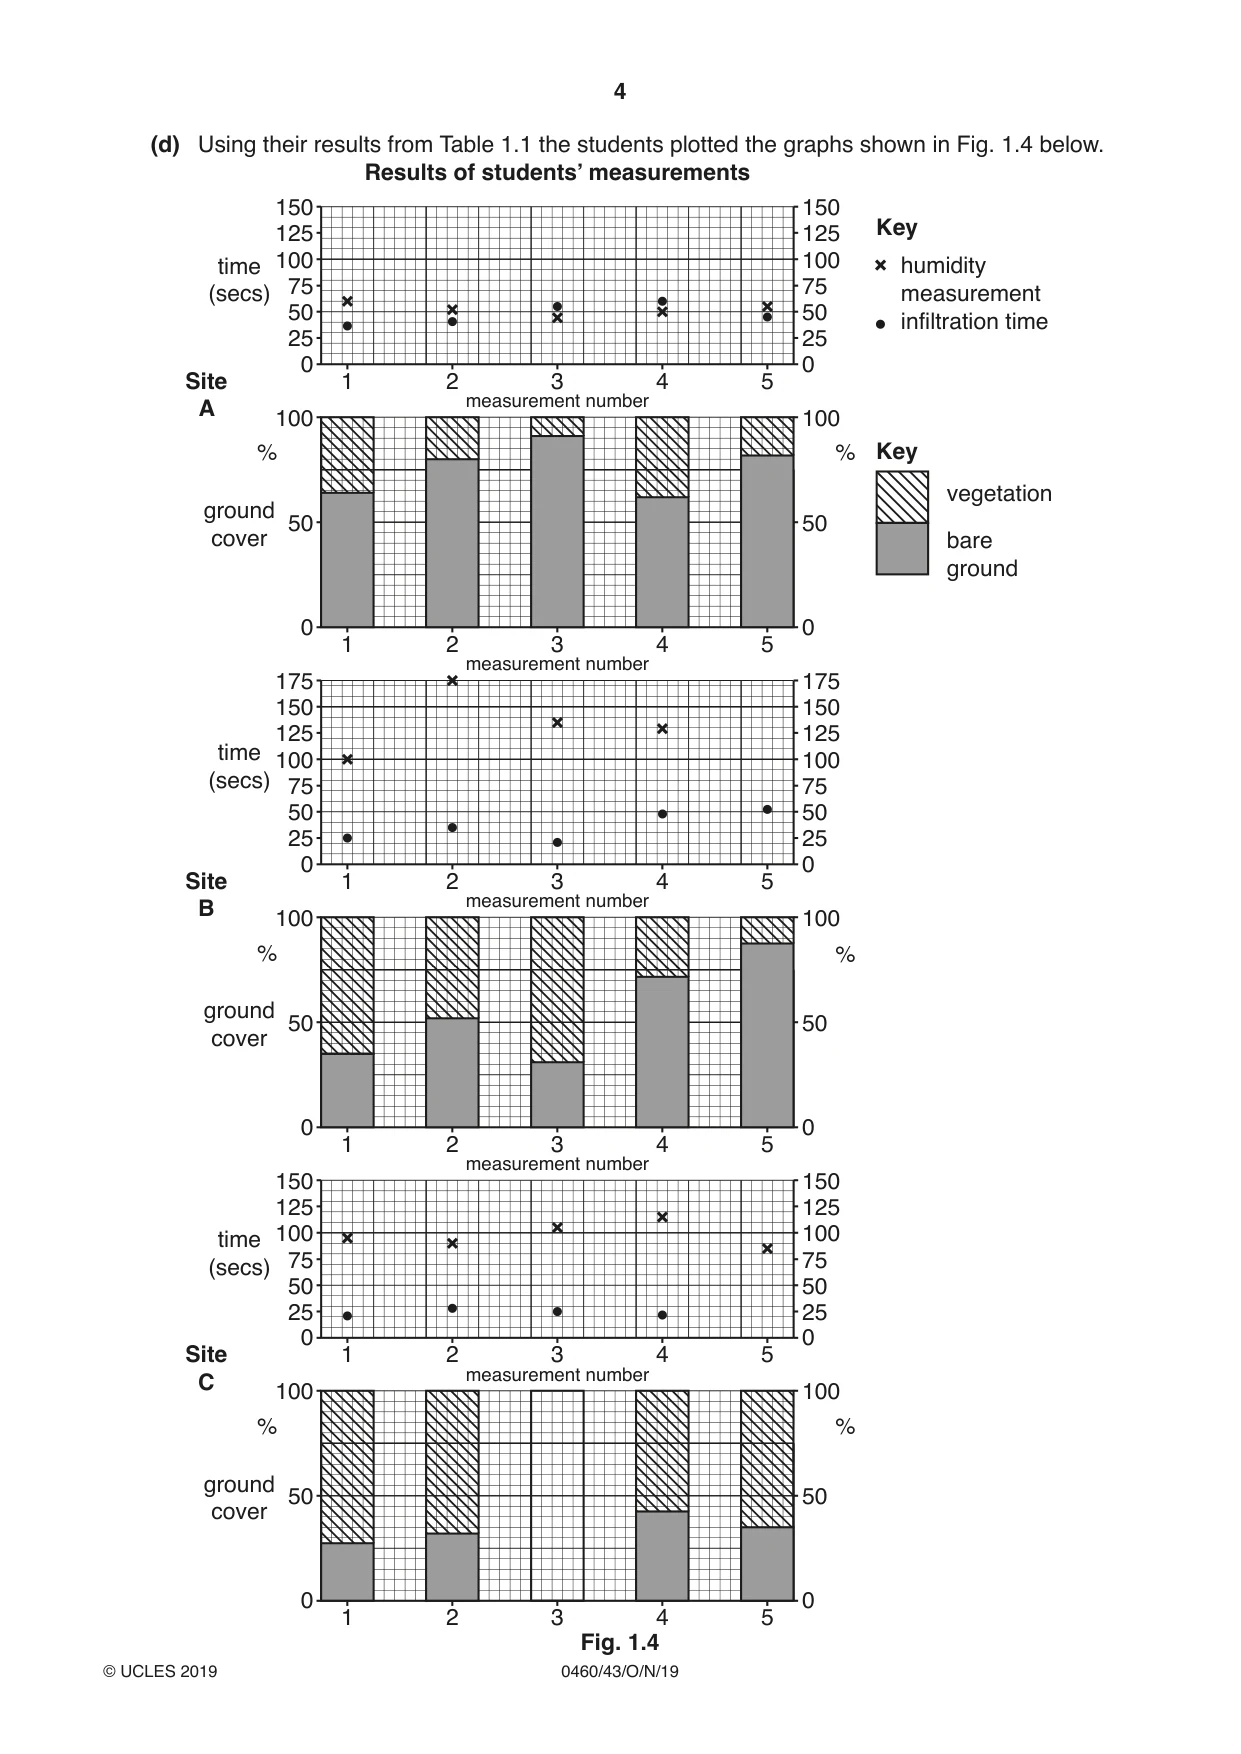
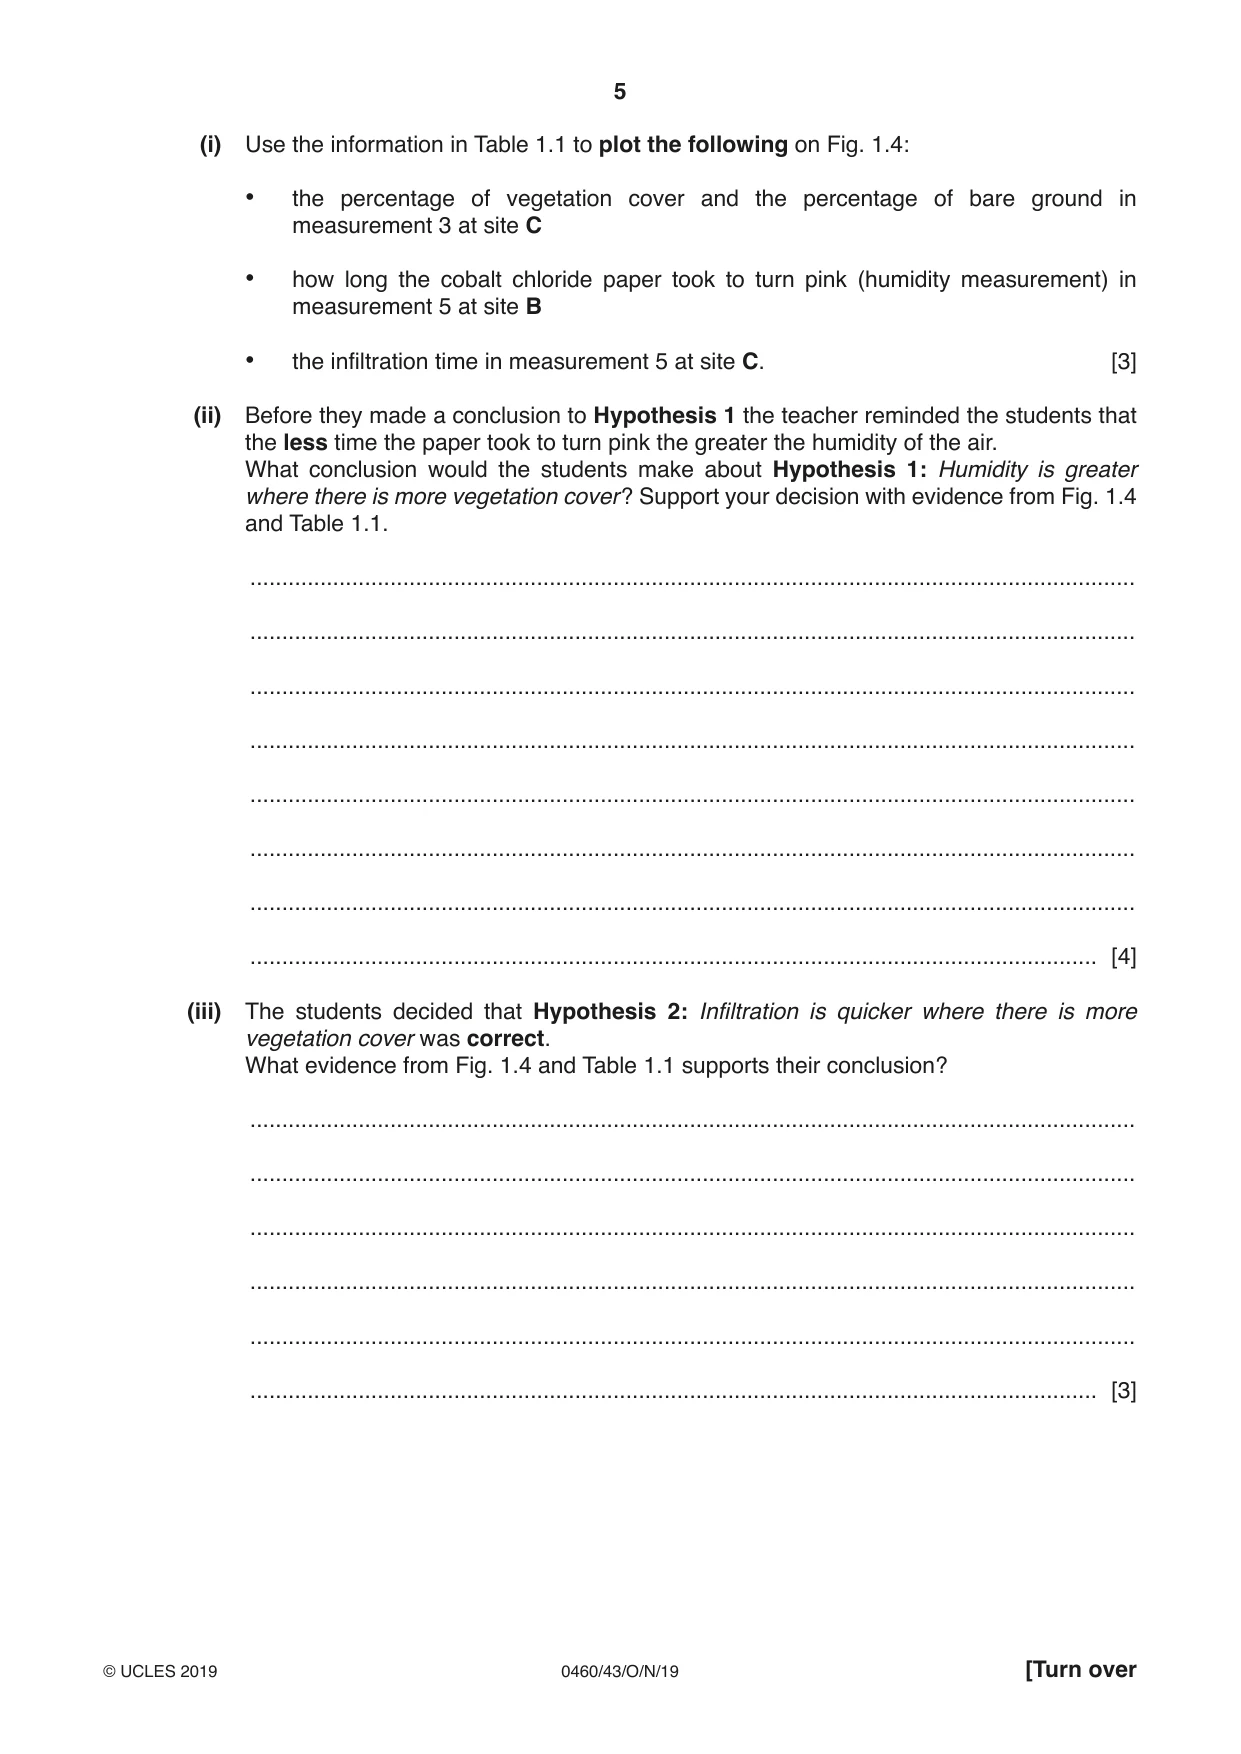
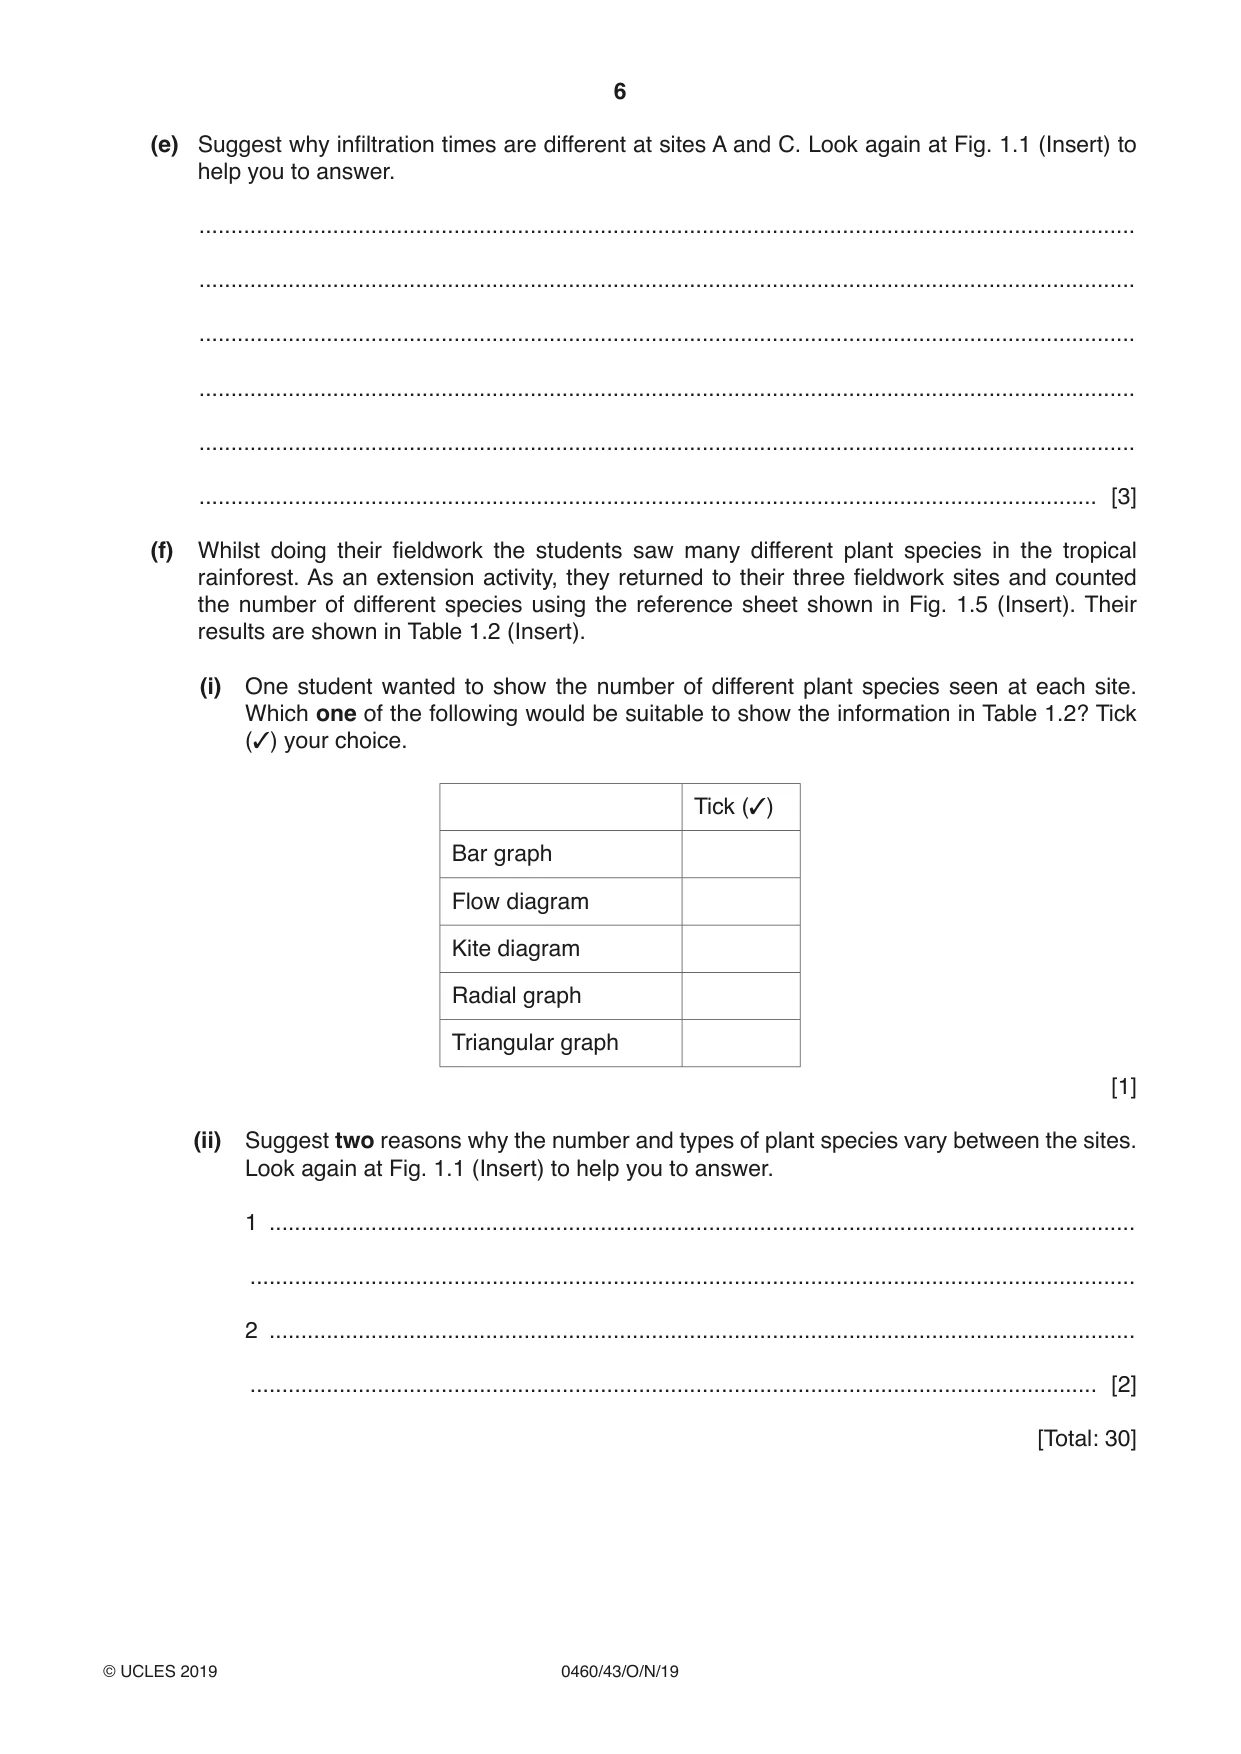
1 Students from Brazil who lived near Tijuca National Park did some fieldwork to study the tropical rainforest ecosystem. They visited three sites which are described and located in Fig. 1.1 (Insert). (a) The vegetation in the tropical rainforest adapts to the climate. Use arrows to match the vegetation feature with the reason for its adaptation. One has been completed for you. Feature of the vegetation Reason for adaptation Drip-tip leaves to compete for sunlight Tall trees to make the tree more stable Large leaves to remove heavy rainfall Buttress roots to allow more transpiration [2] The students decided to investigate the effect of vegetation cover at the three sites. They agreed on the following hypotheses: Hypothesis 1: Humidity is greater where there is more vegetation cover. Humidity is the amount of water vapour in the air. Hypothesis 2: Infiltration is quicker where there is more vegetation cover. (b) (i) To obtain data the students made each of their measurements five times at each site. Explain why this would make their results more reliable. ........................................................................................................................................... ........................................................................................................................................... ........................................................................................................................................... ..................................................................................................................................... [2] (ii) To measure the amount of vegetation cover the students used the piece of equipment shown in Fig. 1.2 (Insert). What is this piece of equipment called? Tick (✓) your answer below. Tick (✓) barometer callipers clinometer quadrat ruler [1] (iii) To measure humidity the students did a simple test which a student described in his fieldwork notebook, Fig. 1.3 (Insert). Suggest one weakness of this test. ........................................................................................................................................... ..................................................................................................................................... [1] (iv) The students also measured the time it took for water to infiltrate (soak into) the ground. Describe a fieldwork method to measure infiltration. Refer to equipment which could be used. ........................................................................................................................................... ........................................................................................................................................... ........................................................................................................................................... ........................................................................................................................................... ........................................................................................................................................... ........................................................................................................................................... ........................................................................................................................................... ..................................................................................................................................... [4] (c) The results of the students’ measurements are shown in Table 1.1 (Insert). (i) Which site has the highest amount of vegetation cover? Circle your answer. site A site B site C [1] (ii) One set of measurement results is shown below. Percentage of vegetation cover = 68 Percentage of bare ground = 32 Humidity measurement = 90 seconds Infiltration time = 28 seconds At which site and for which measurement (1–5) were these results recorded? Site .............. Measurement number .............. [1] (iii) Use the results in Table 1.1 to calculate the average infiltration time at site B. Show your calculation below. Answer = ............................ seconds (d) Using their results from Table 1.1 the students plotted the graphs shown in Fig. 1.4 below. Results of students’ measurements 150 150 125 125 Key time 100 100 humidity 75 75 (secs) measurement 50 50 infiltration time 25 25 0 0 Site 1 2 3 4 5 A measurement number 100 100 % % Key vegetation ground 50 50 cover bare ground 0 0 1 2 3 4 5 measurement number 175 175 150 150 125 125 time 100 100 (secs) 75 75 50 50 25 25 0 0 Site 1 2 3 4 5 B measurement number 100 100 % % ground 50 50 cover 0 0 1 2 3 4 5 measurement number 150 150 125 125 time 100 100 75 75 (secs) 50 50 25 25 0 0 Site 1 2 3 4 5 C measurement number 100 100 % % ground 50 50 cover 0 0 1 2 3 4 5 Fig. 1.4 (i) Use the information in Table 1.1 to plot the following on Fig. 1.4: • the percentage of vegetation cover and the percentage of bare ground in measurement 3 at site C • how long the cobalt chloride paper took to turn pink (humidity measurement) in measurement 5 at site B • the infiltration time in measurement 5 at site C. [3] (ii) Before they made a conclusion to Hypothesis 1 the teacher reminded the students that the less time the paper took to turn pink the greater the humidity of the air. What conclusion would the students make about Hypothesis 1: Humidity is greater where there is more vegetation cover? Support your decision with evidence from Fig. 1.4 and Table 1.1. ........................................................................................................................................... ........................................................................................................................................... ........................................................................................................................................... ........................................................................................................................................... ........................................................................................................................................... ........................................................................................................................................... ........................................................................................................................................... ..................................................................................................................................... [4] (iii) The students decided that Hypothesis 2: Infiltration is quicker where there is more vegetation cover was correct. What evidence from Fig. 1.4 and Table 1.1 supports their conclusion? ........................................................................................................................................... ........................................................................................................................................... ........................................................................................................................................... ........................................................................................................................................... ........................................................................................................................................... ..................................................................................................................................... [3] (e) Suggest why infiltration times are different at sites A and C. Look again at Fig. 1.1 (Insert) to help you to answer. ................................................................................................................................................... ................................................................................................................................................... ................................................................................................................................................... ................................................................................................................................................... ................................................................................................................................................... ............................................................................................................................................. [3] (f) Whilst doing their fieldwork the students saw many different plant species in the tropical rainforest. As an extension activity, they returned to their three fieldwork sites and counted the number of different species using the reference sheet shown in Fig. 1.5 (Insert). Their results are shown in Table 1.2 (Insert). (i) One student wanted to show the number of different plant species seen at each site. Which one of the following would be suitable to show the information in Table 1.2? Tick (✓) your choice. Tick (✓) Bar graph Flow diagram Kite diagram Radial graph Triangular graph [1] (ii) Suggest two reasons why the number and types of plant species vary between the sites. Look again at Fig. 1.1 (Insert) to help you to answer. 1 ........................................................................................................................................ ........................................................................................................................................... 2 ........................................................................................................................................ ..................................................................................................................................... [2] [Total: 30]
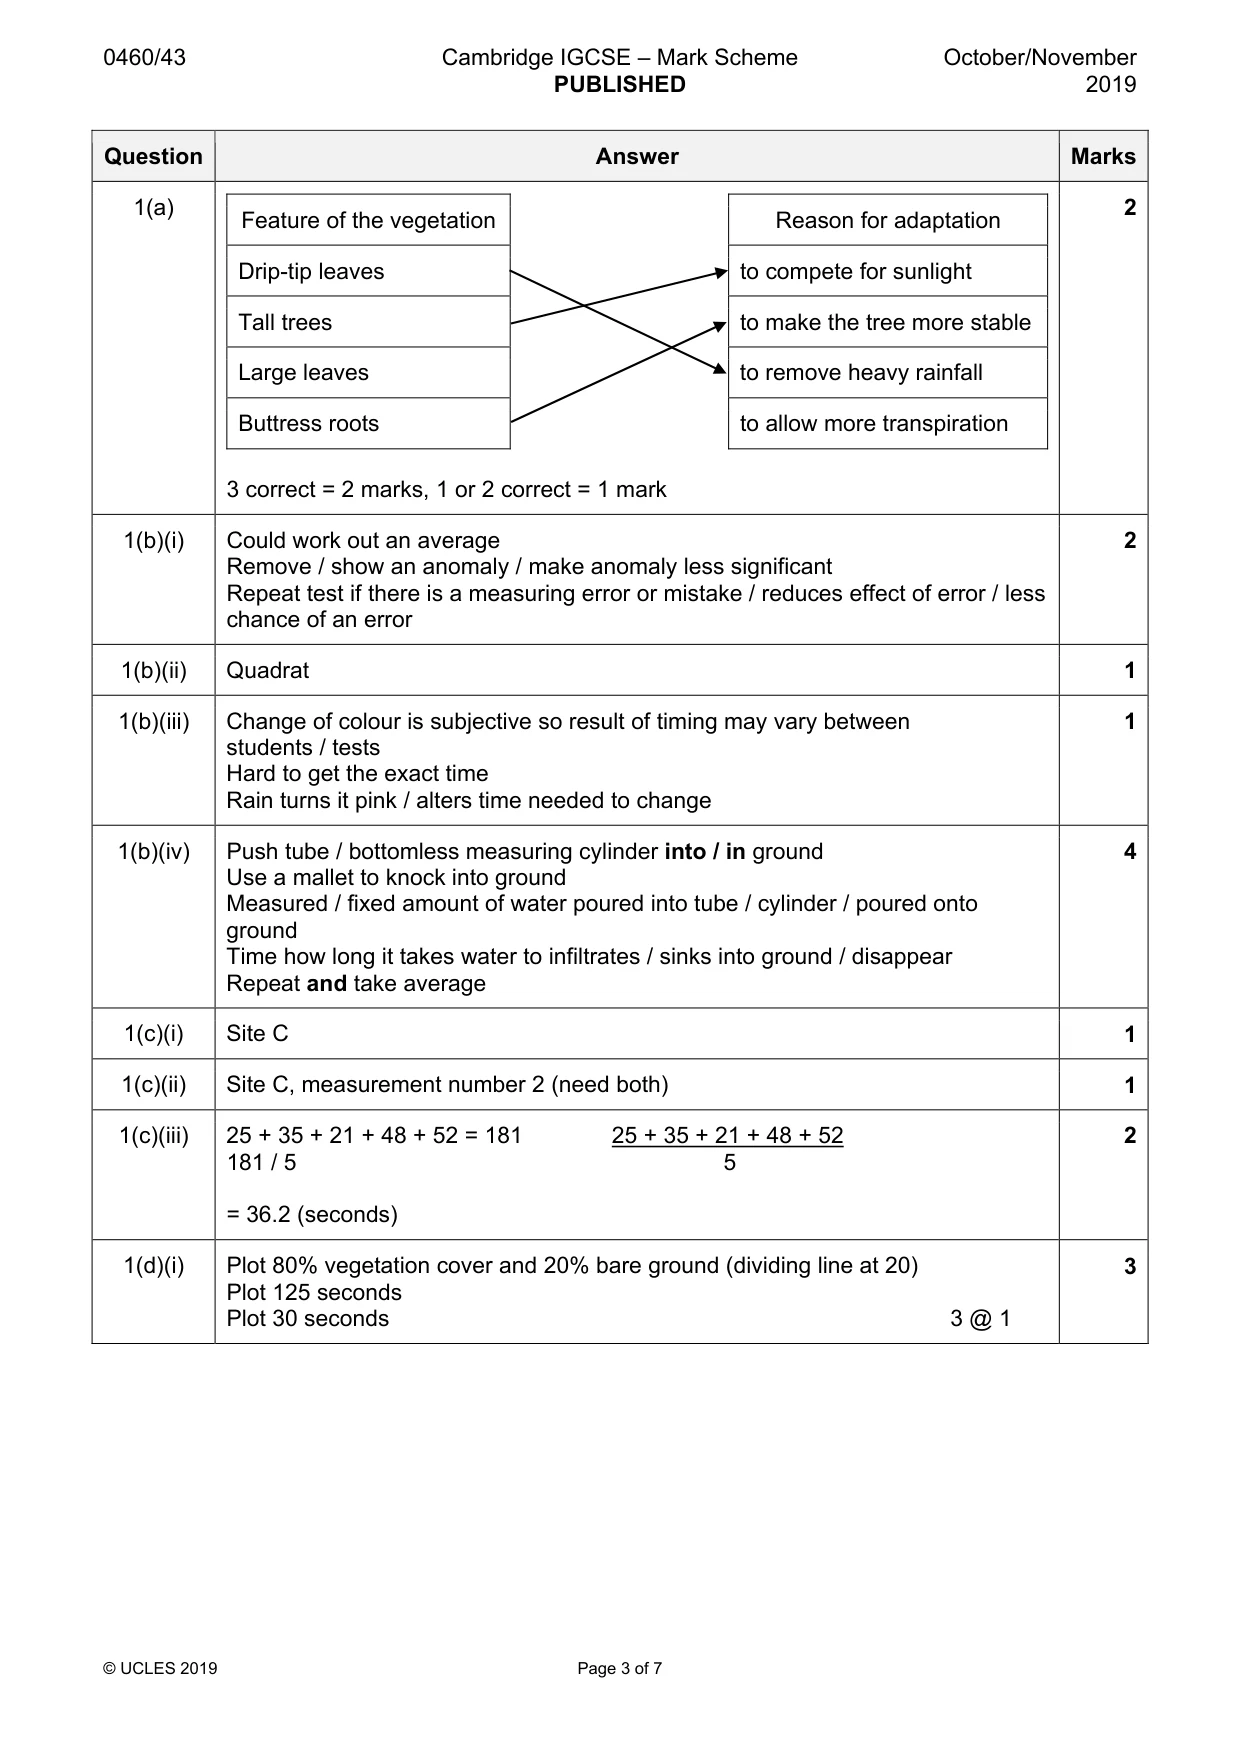
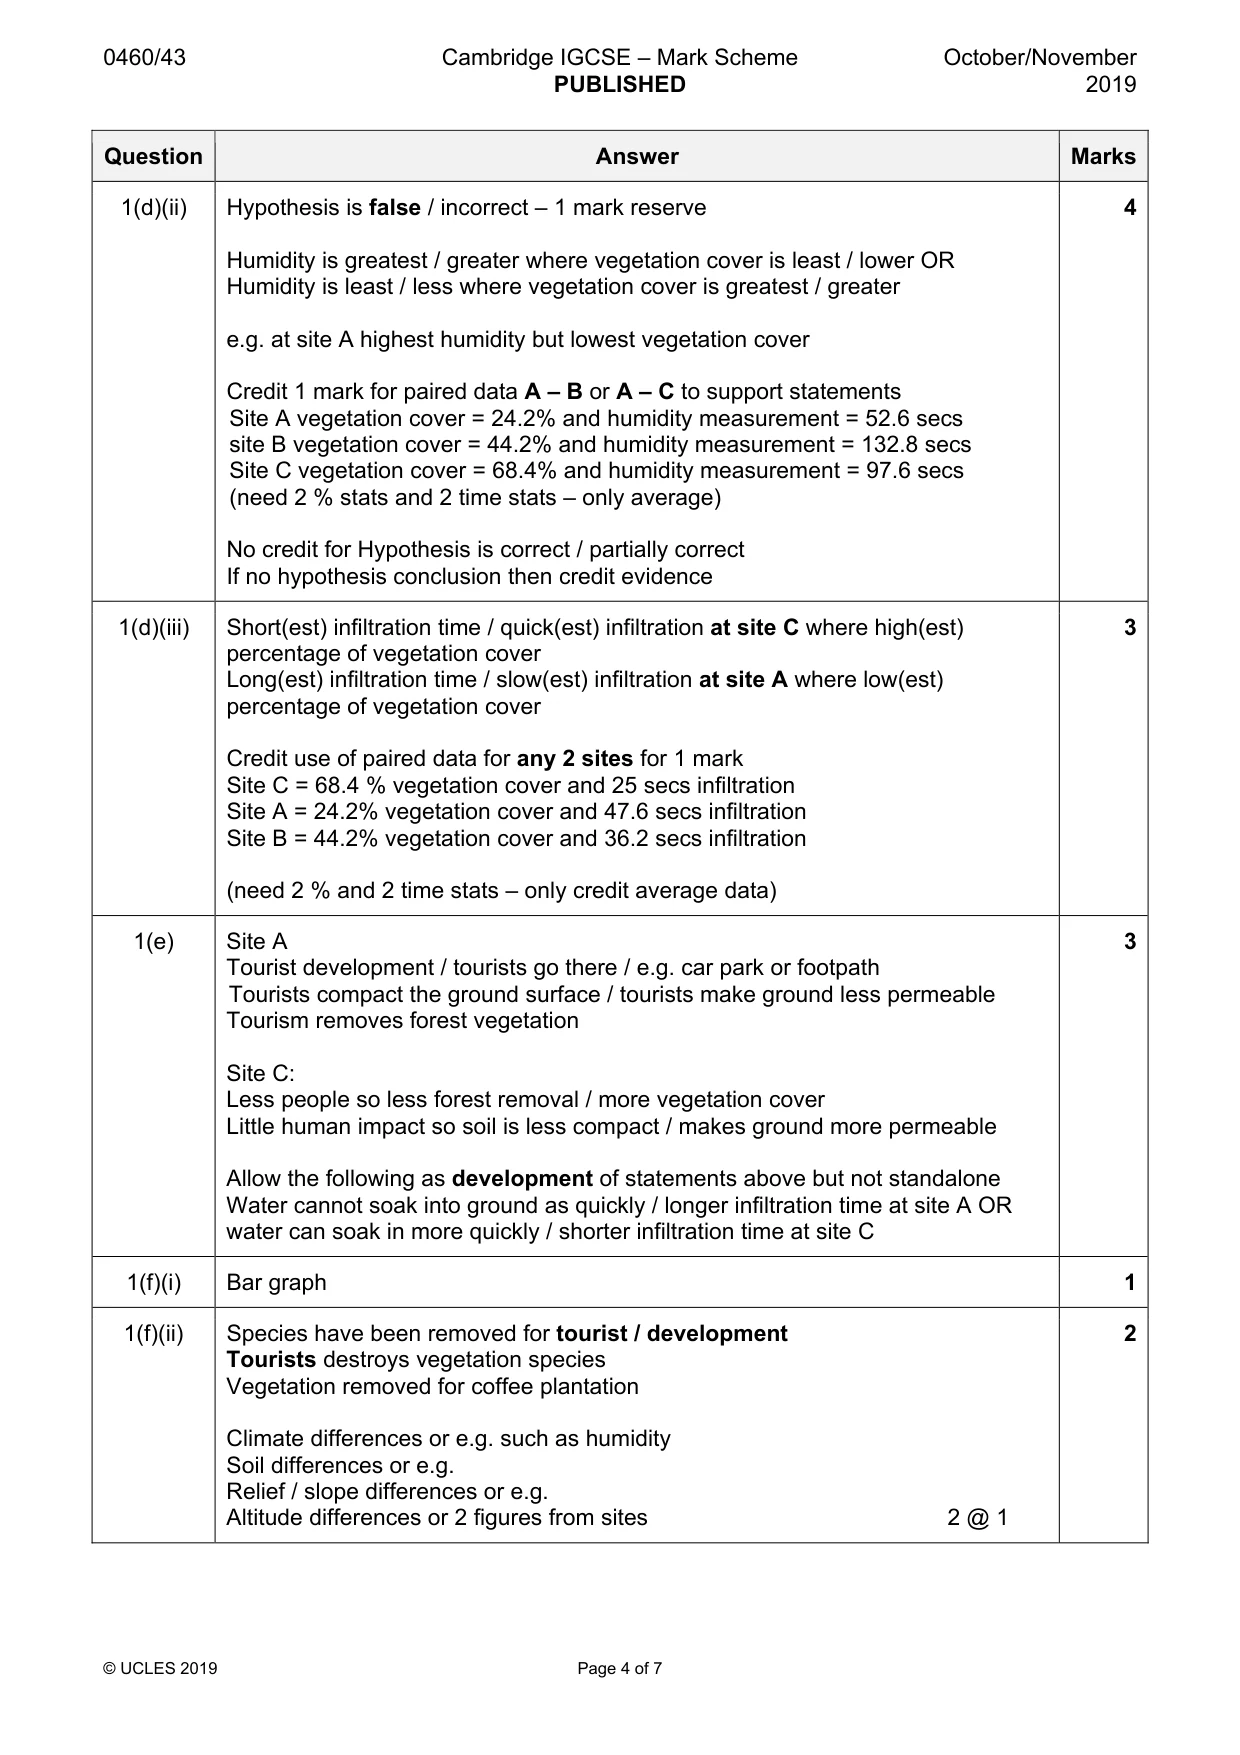
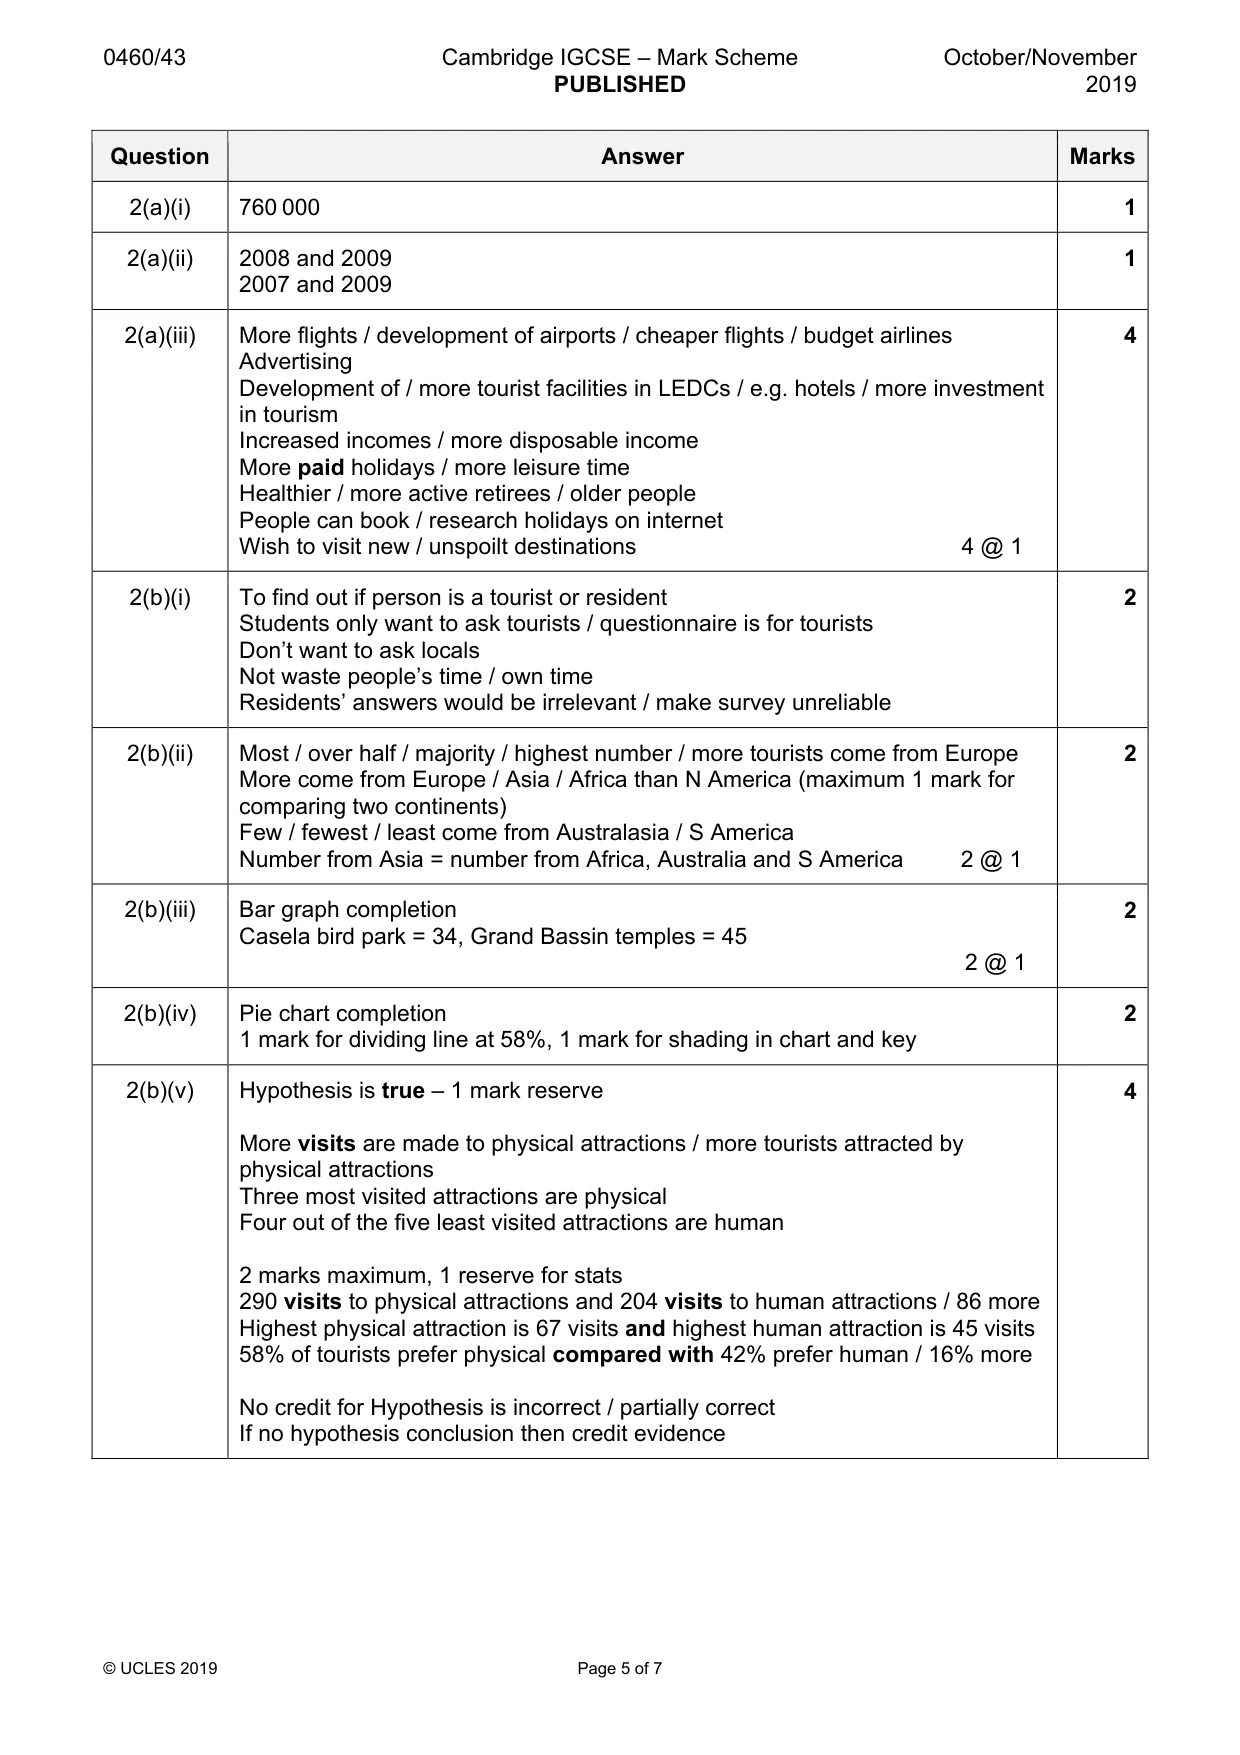
Mark scheme: Question Answer Marks 1(a) 2 Feature of the vegetation Reason for adaptation Drip-tip leaves to compete for sunlight Tall trees to make the tree more stable Large leaves to remove heavy rainfall Buttress roots to allow more transpiration 3 correct = 2 marks, 1 or 2 correct = 1 mark 1(b)(i) Could work out an average 2 Remove / show an anomaly / make anomaly less significant Repeat test if there is a measuring error or mistake / reduces effect of error / less chance of an error 1(b)(ii) Quadrat 1 1(b)(iii) Change of colour is subjective so result of timing may vary between 1 students / tests Hard to get the exact time Rain turns it pink / alters time needed to change 1(b)(iv) Push tube / bottomless measuring cylinder into / in ground 4 Use a mallet to knock into ground Measured / fixed amount of water poured into tube / cylinder / poured onto ground Time how long it takes water to infiltrates / sinks into ground / disappear Repeat and take average 1(c)(i) Site C 1 1(c)(ii) Site C, measurement number 2 (need both) 1 1(c)(iii) 25 + 35 + 21 + 48 + 52 = 181 25 + 35 + 21 + 48 + 52 2 181 / 5 5 = 36.2 (seconds) 1(d)(i) Plot 80% vegetation cover and 20% bare ground (dividing line at 20) 3 Plot 125 seconds Plot 30 seconds 3 @ 1 1(d)(ii) Hypothesis is false / incorrect – 1 mark reserve 4 Humidity is greatest / greater where vegetation cover is least / lower OR Humidity is least / less where vegetation cover is greatest / greater e.g. at site A highest humidity but lowest vegetation cover Credit 1 mark for paired data A – B or A – C to support statements Site A vegetation cover = 24.2% and humidity measurement = 52.6 secs site B vegetation cover = 44.2% and humidity measurement = 132.8 secs Site C vegetation cover = 68.4% and humidity measurement = 97.6 secs (need 2 % stats and 2 time stats – only average) No credit for Hypothesis is correct / partially correct If no hypothesis conclusion then credit evidence 1(d)(iii) Short(est) infiltration time / quick(est) infiltration at site C where high(est) 3 percentage of vegetation cover Long(est) infiltration time / slow(est) infiltration at site A where low(est) percentage of vegetation cover Credit use of paired data for any 2 sites for 1 mark Site C = 68.4 % vegetation cover and 25 secs infiltration Site A = 24.2% vegetation cover and 47.6 secs infiltration Site B = 44.2% vegetation cover and 36.2 secs infiltration (need 2 % and 2 time stats – only credit average data) 1(e) Site A 3 Tourist development / tourists go there / e.g. car park or footpath Tourists compact the ground surface / tourists make ground less permeable Tourism removes forest vegetation Site C: Less people so less forest removal / more vegetation cover Little human impact so soil is less compact / makes ground more permeable Allow the following as development of statements above but not standalone Water cannot soak into ground as quickly / longer infiltration time at site A OR water can soak in more quickly / shorter infiltration time at site C 1(f)(i) Bar graph 1 1(f)(ii) Species have been removed for tourist / development 2 Tourists destroys vegetation species Vegetation removed for coffee plantation Climate differences or e.g. such as humidity Soil differences or e.g. Relief / slope differences or e.g. Altitude differences or 2 figures from sites 2 @ 1
Q2 · Students in Mauritius, an island in the Indian Ocean, were studying tourism
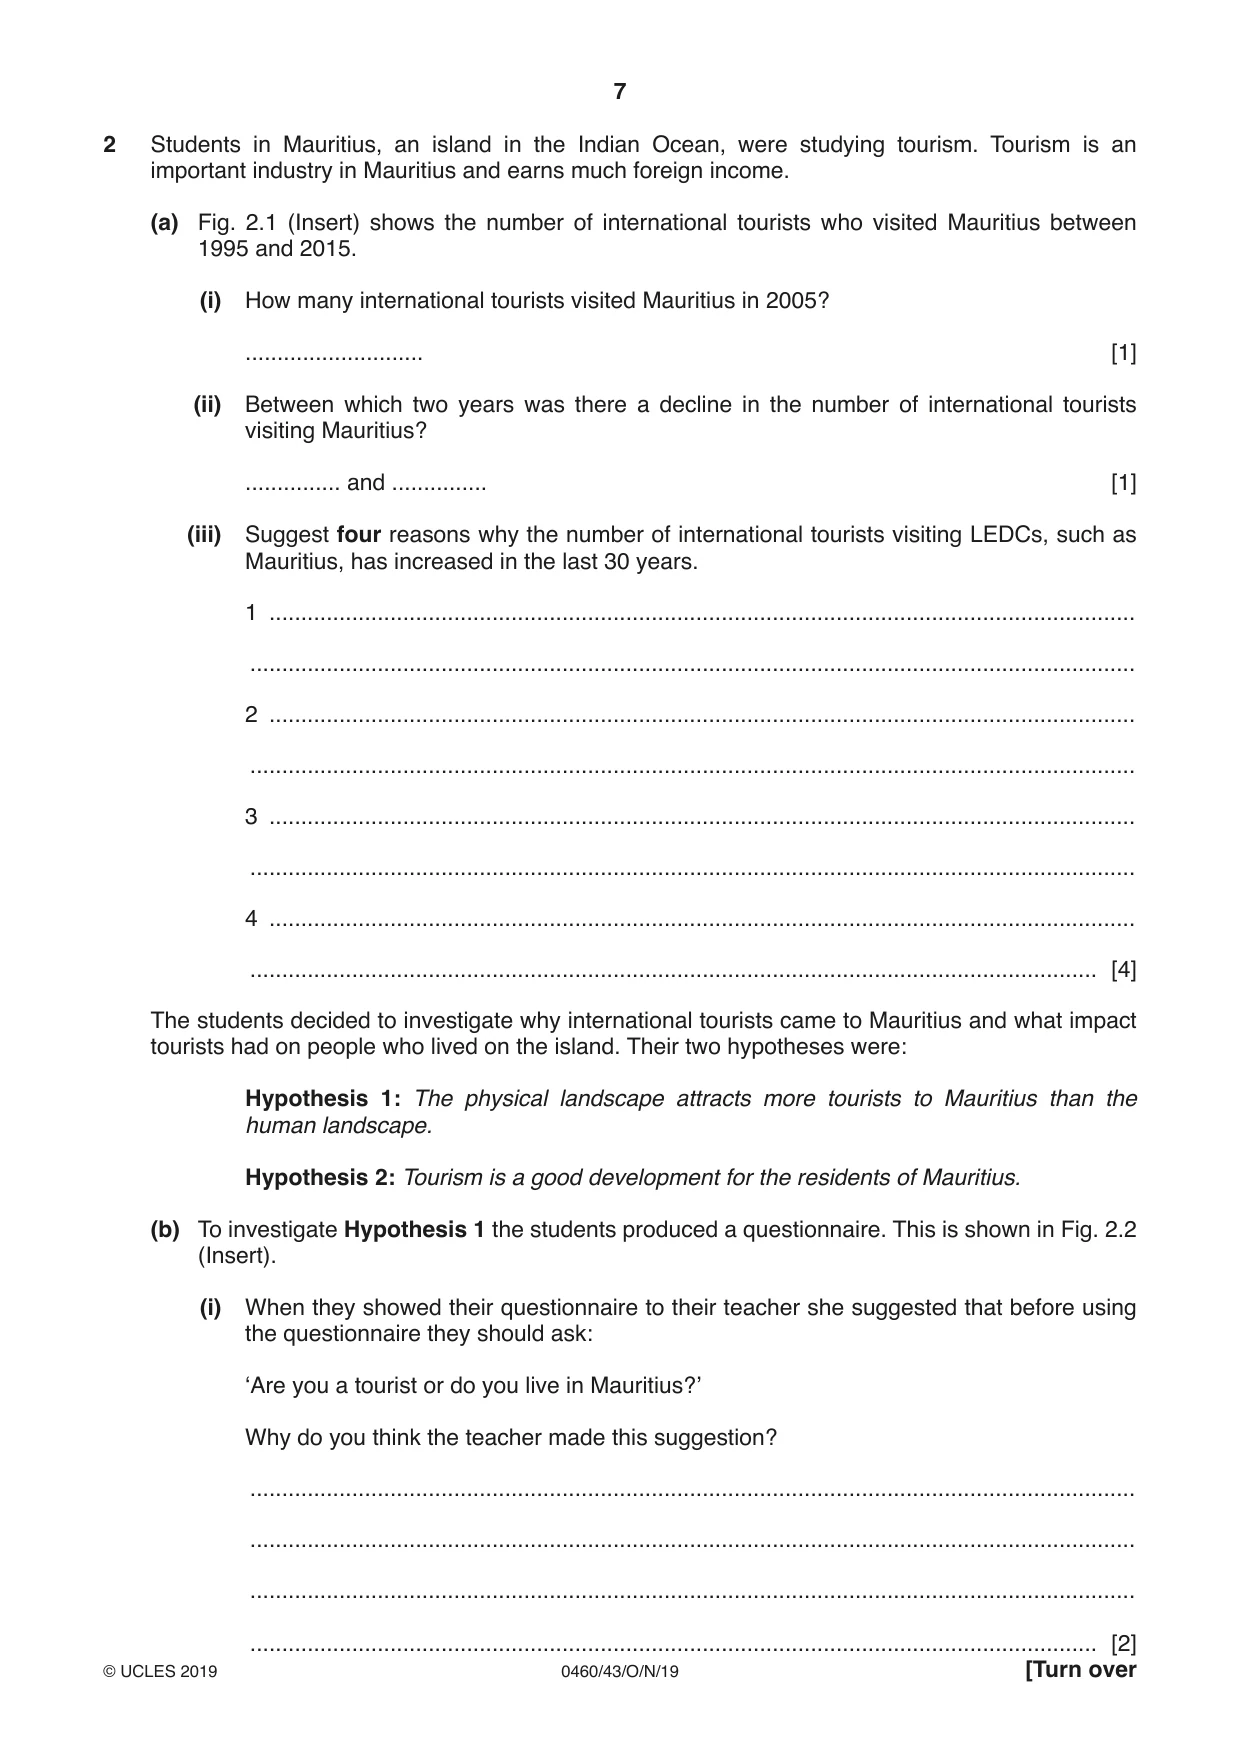
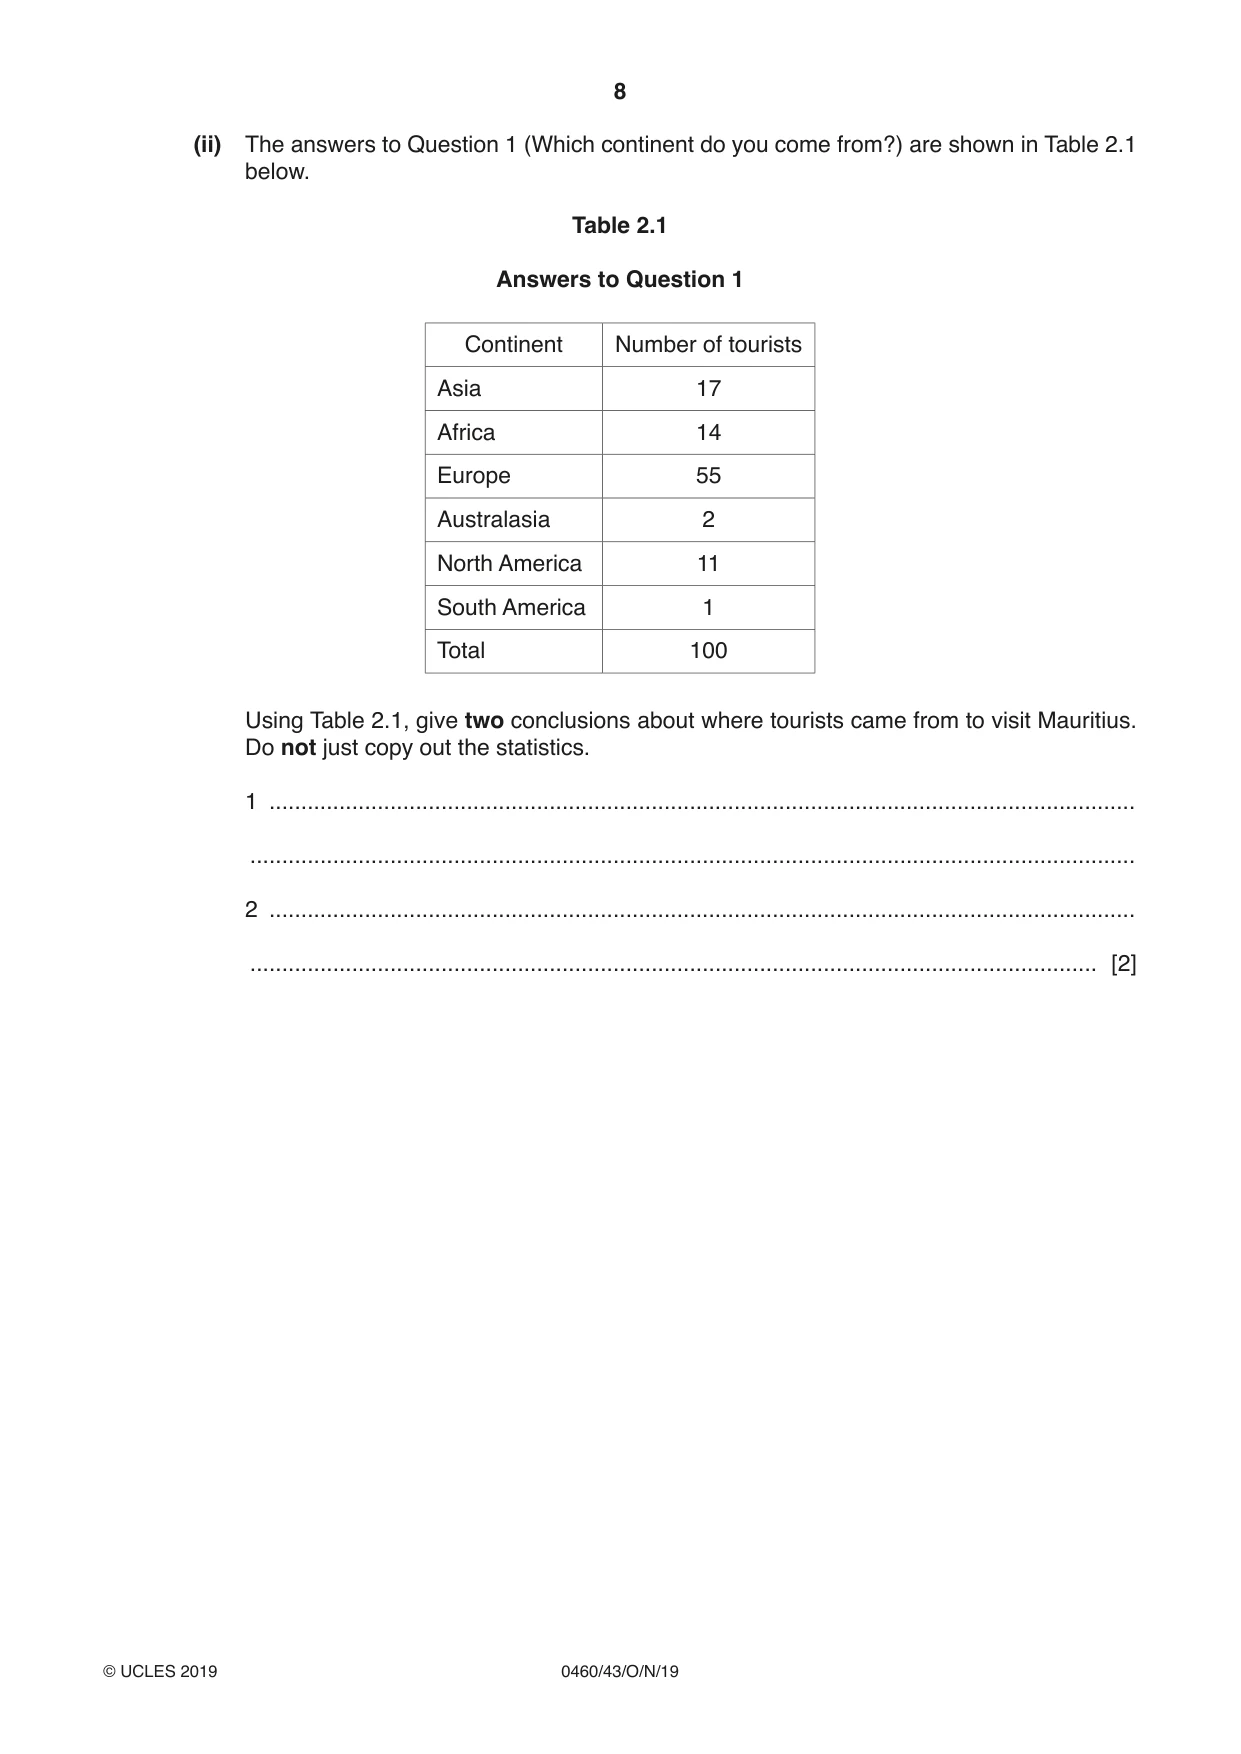
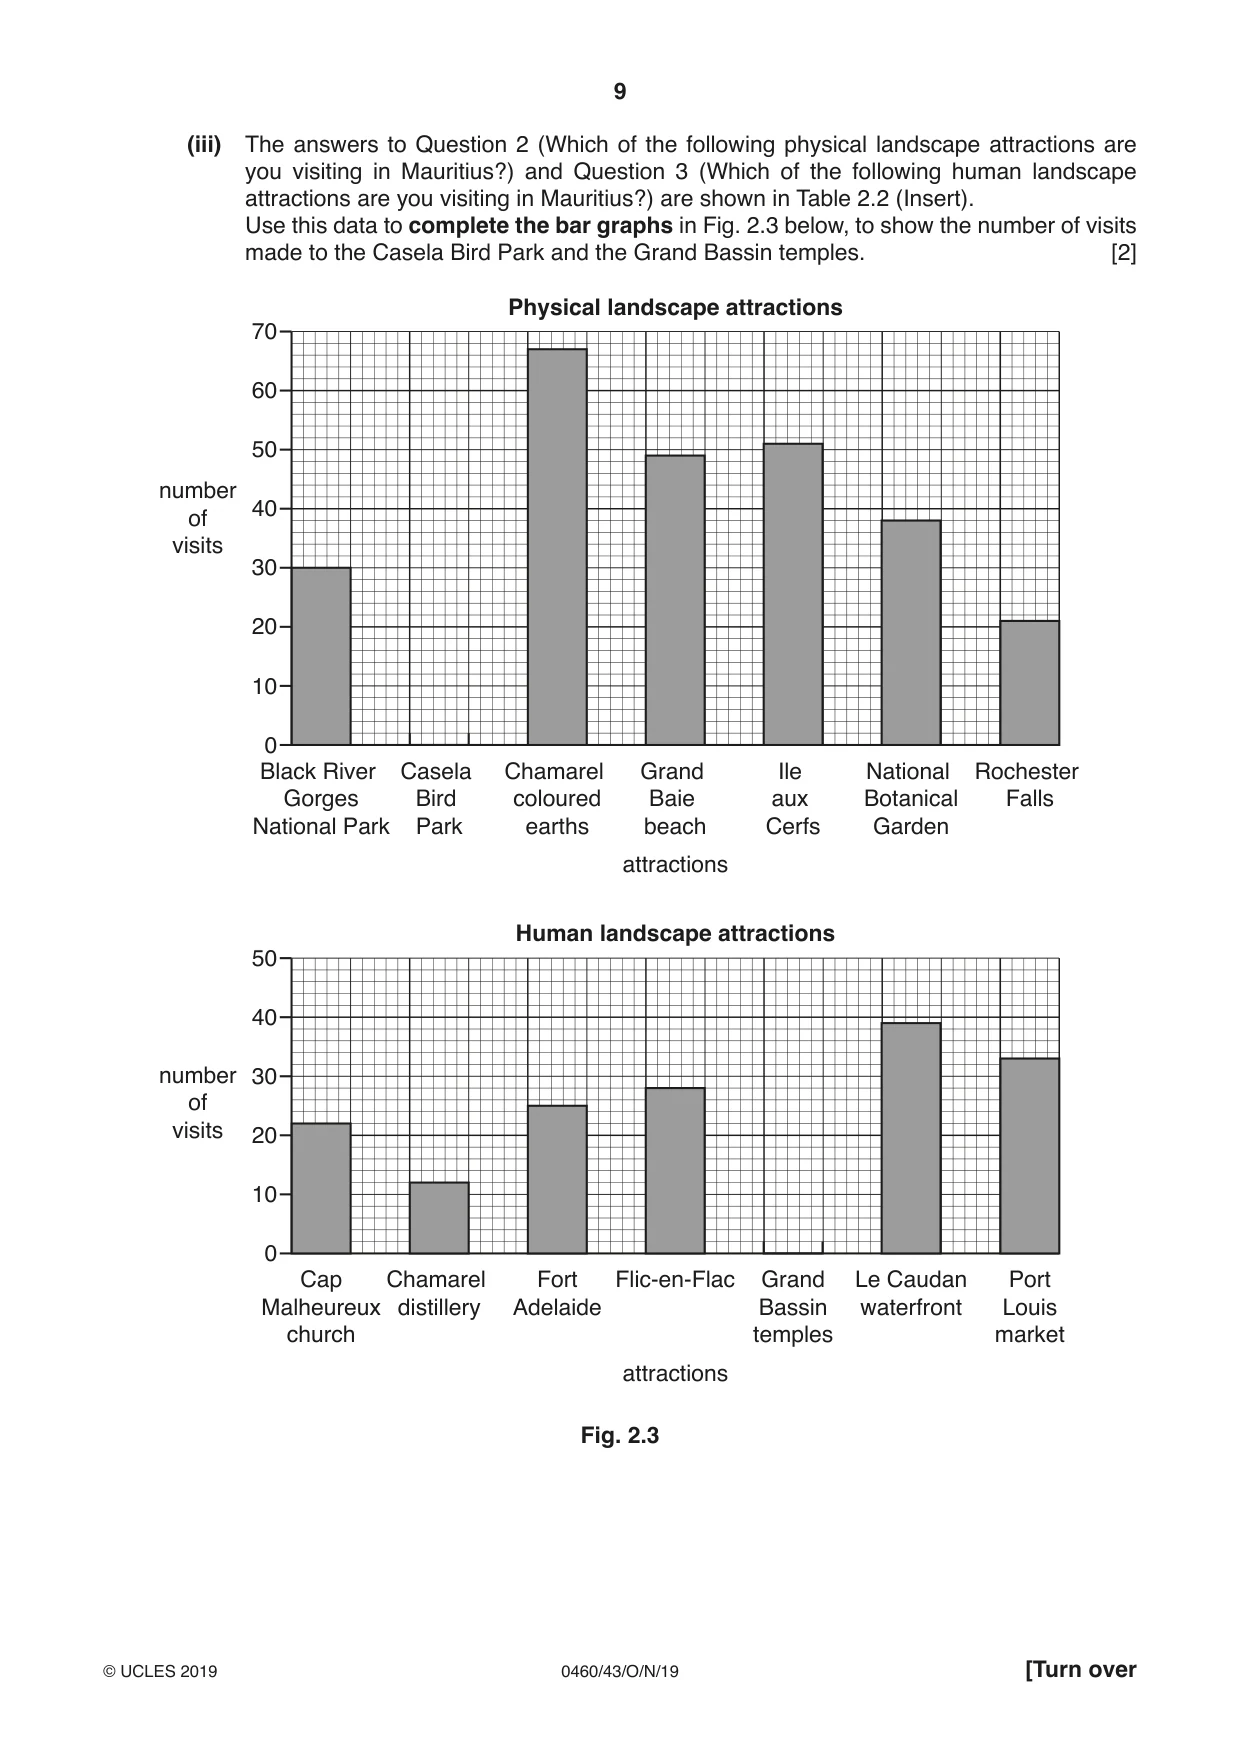
2 Students in Mauritius, an island in the Indian Ocean, were studying tourism. Tourism is an important industry in Mauritius and earns much foreign income. (a) Fig. 2.1 (Insert) shows the number of international tourists who visited Mauritius between 1995 and 2015. (i) How many international tourists visited Mauritius in 2005? ............................ [1] (ii) Between which two years was there a decline in the number of international tourists visiting Mauritius? ............... and ............... [1] (iii) Suggest four reasons why the number of international tourists visiting LEDCs, such as Mauritius, has increased in the last 30 years. 1 ........................................................................................................................................ ........................................................................................................................................... 2 ........................................................................................................................................ ........................................................................................................................................... 3 ........................................................................................................................................ ........................................................................................................................................... 4 ........................................................................................................................................ ..................................................................................................................................... [4] The students decided to investigate why international tourists came to Mauritius and what impact tourists had on people who lived on the island. Their two hypotheses were: Hypothesis 1: The physical landscape attracts more tourists to Mauritius than the human landscape. Hypothesis 2: Tourism is a good development for the residents of Mauritius. (b) To investigate Hypothesis 1 the students produced a questionnaire. This is shown in Fig. 2.2 (Insert). (i) When they showed their questionnaire to their teacher she suggested that before using the questionnaire they should ask: ‘Are you a tourist or do you live in Mauritius?’ Why do you think the teacher made this suggestion? ........................................................................................................................................... ........................................................................................................................................... ........................................................................................................................................... (ii) The answers to Question 1 (Which continent do you come from?) are shown in Table 2.1 below. Table 2.1 Answers to Question 1 Continent Number of tourists Asia 17 Africa 14 Europe 55 Australasia 2 North America 11 South America 1 Total 100 Using Table 2.1, give two conclusions about where tourists came from to visit Mauritius. Do not just copy out the statistics. 1 ........................................................................................................................................ ........................................................................................................................................... 2 ........................................................................................................................................ ..................................................................................................................................... [2] (iii) The answers to Question 2 (Which of the following physical landscape attractions are you visiting in Mauritius?) and Question 3 (Which of the following human landscape attractions are you visiting in Mauritius?) are shown in Table 2.2 (Insert). Use this data to complete the bar graphs in Fig. 2.3 below, to show the number of visits made to the Casela Bird Park and the Grand Bassin temples. [2] Physical landscape attractions 70 60 50 number 40 of visits 30 20 10 0 Black River Casela Chamarel Grand Ile National Rochester Gorges Bird coloured Baie aux Botanical Falls National Park Park earths beach Cerfs Garden attractions Human landscape attractions 50 40 number 30 of visits 20 10 0 Cap Chamarel Fort Flic-en-Flac Grand Le Caudan Port Malheureux distillery Adelaide Bassin waterfront Louis church temples market attractions Fig. 2.3
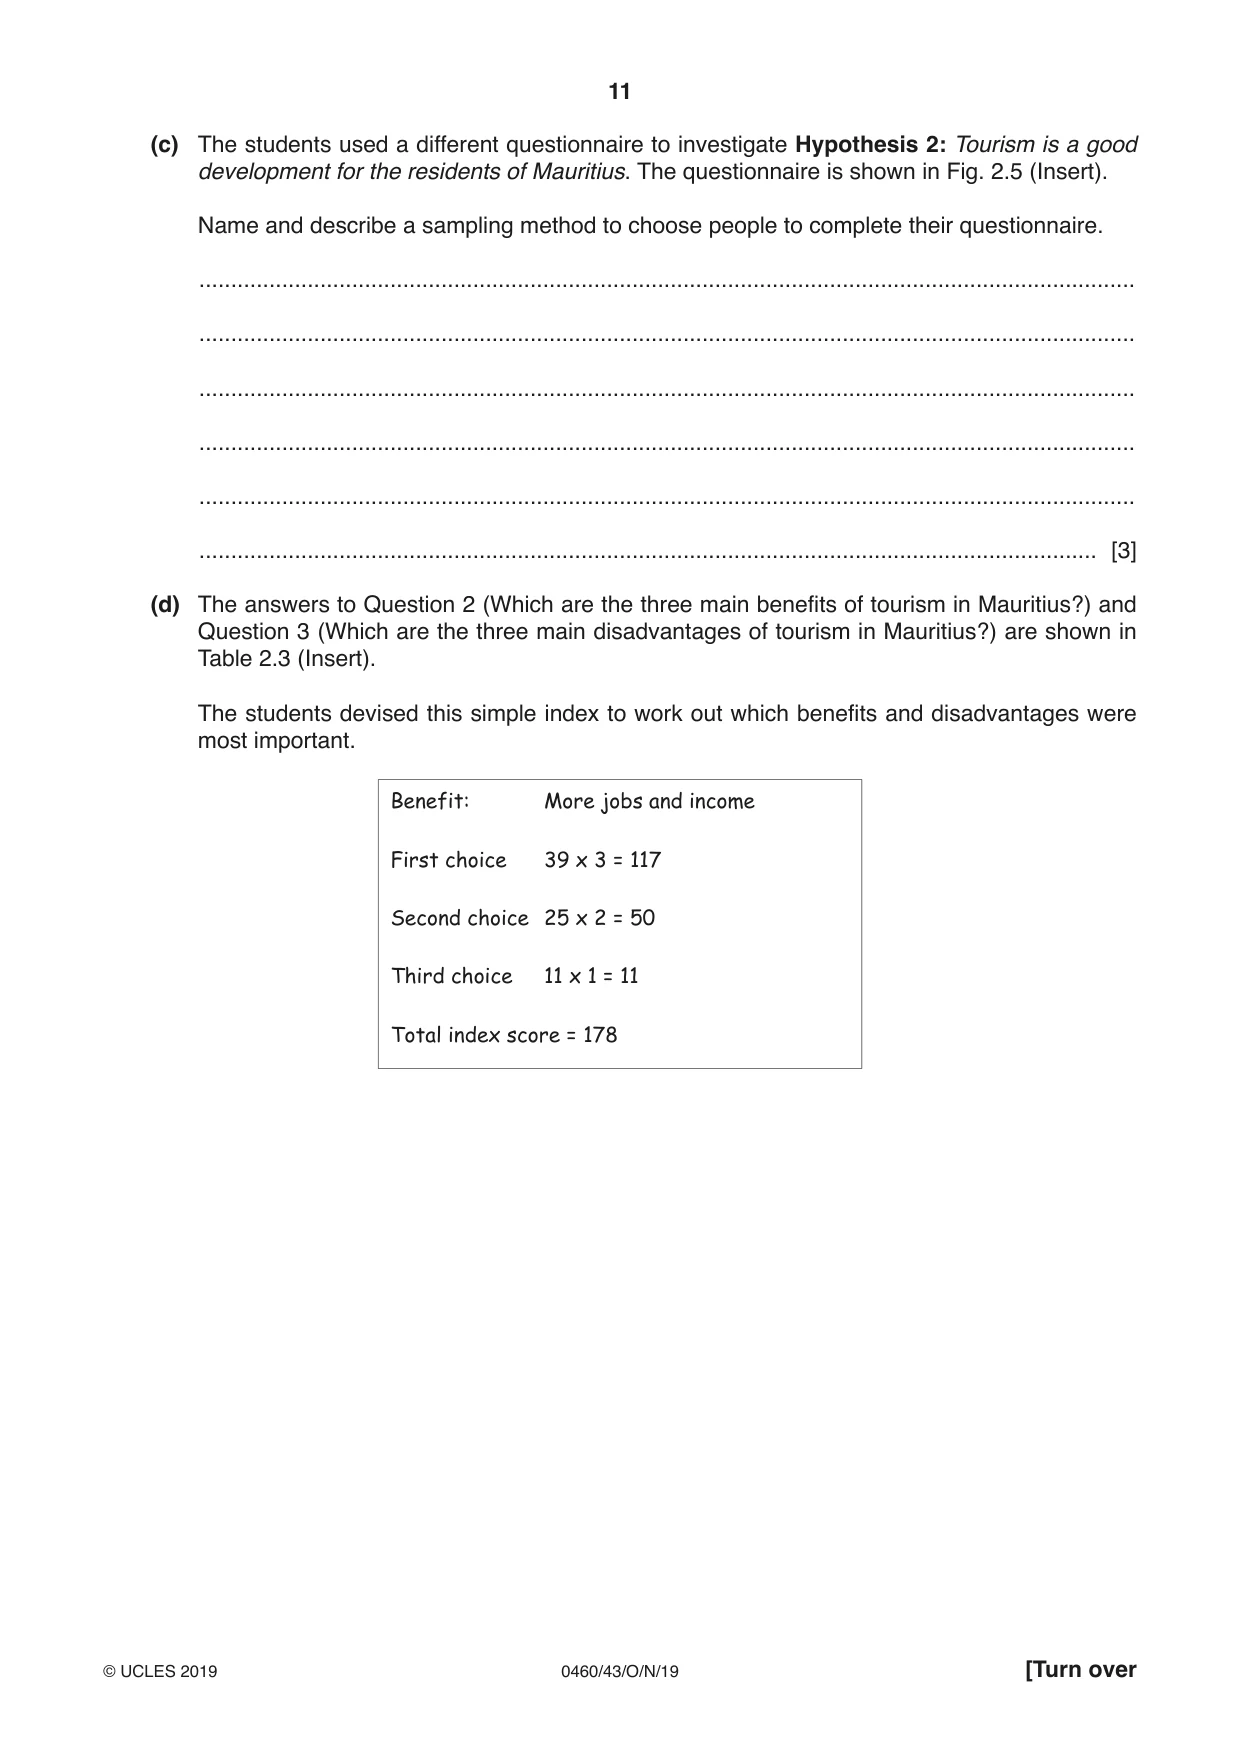
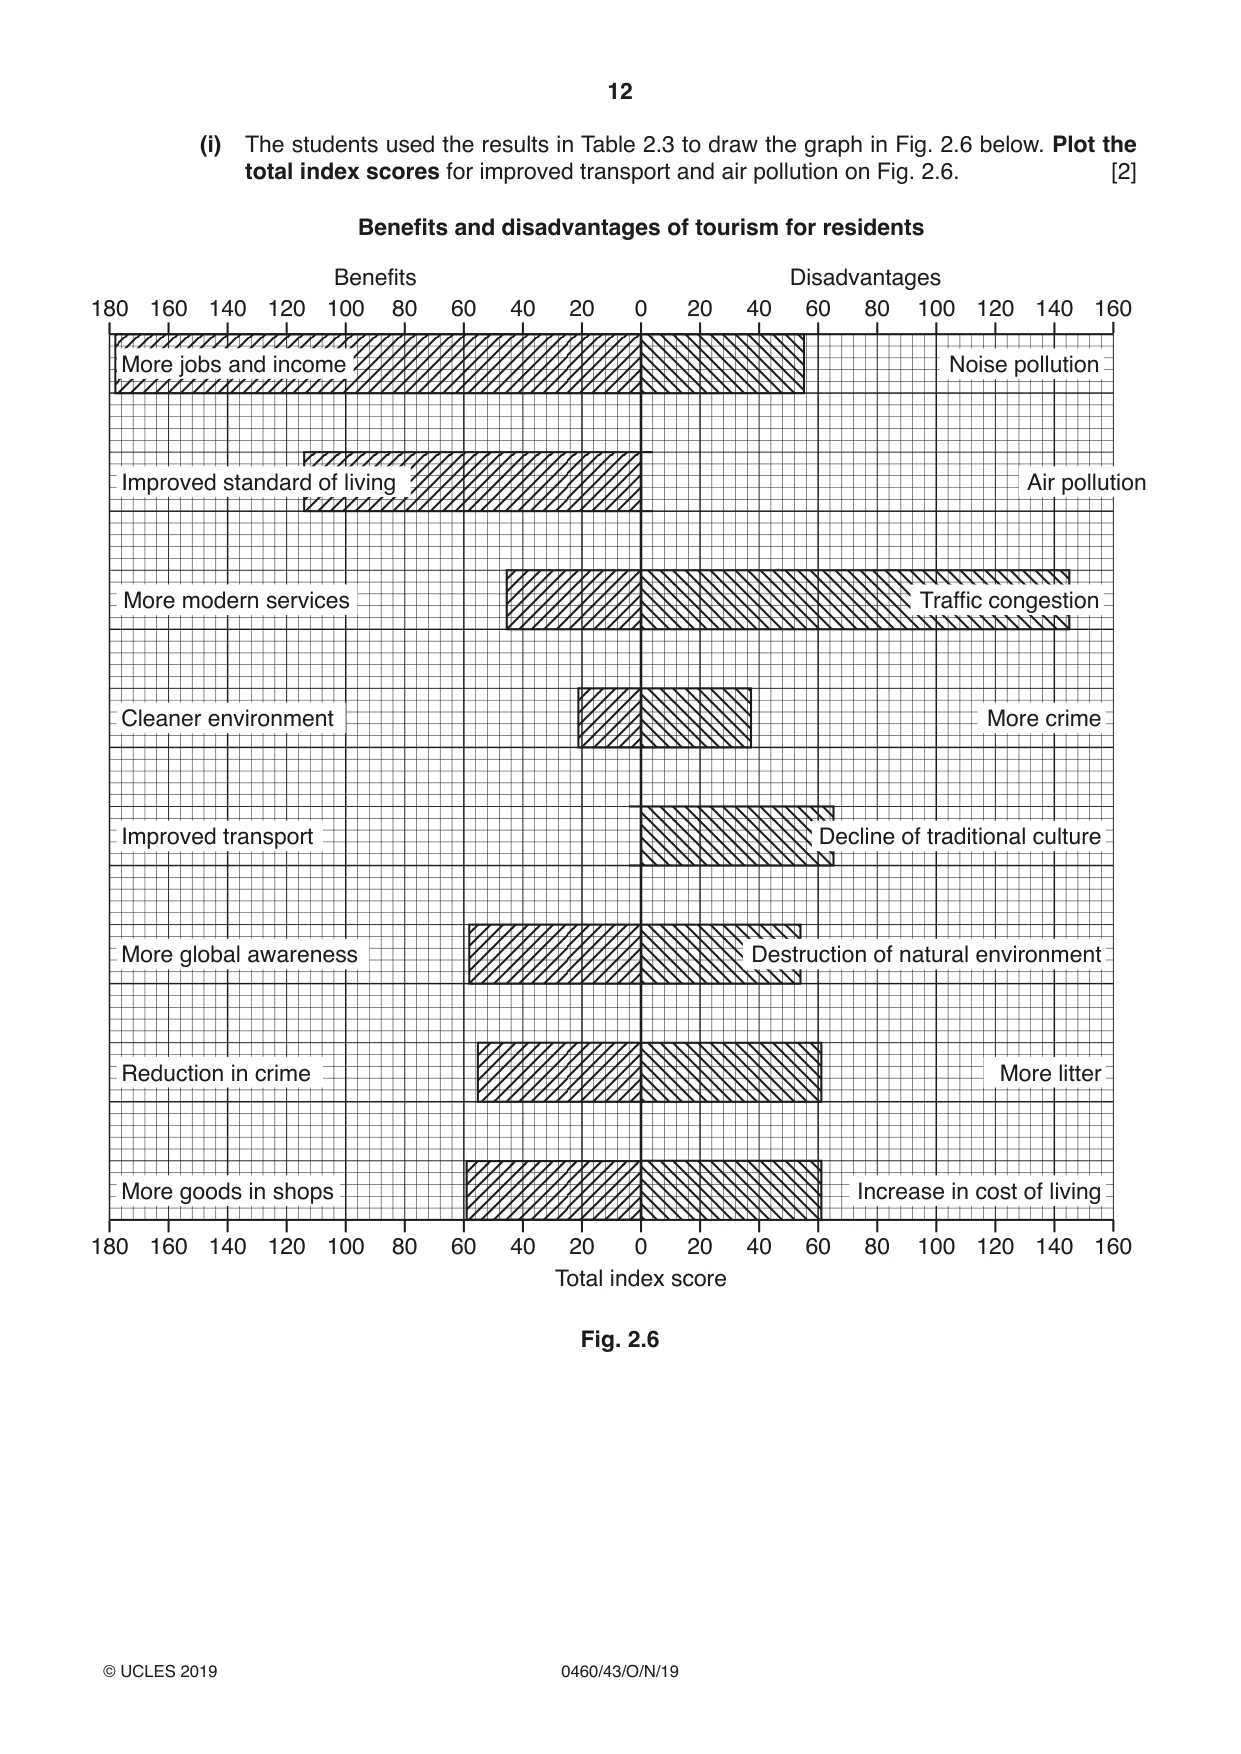
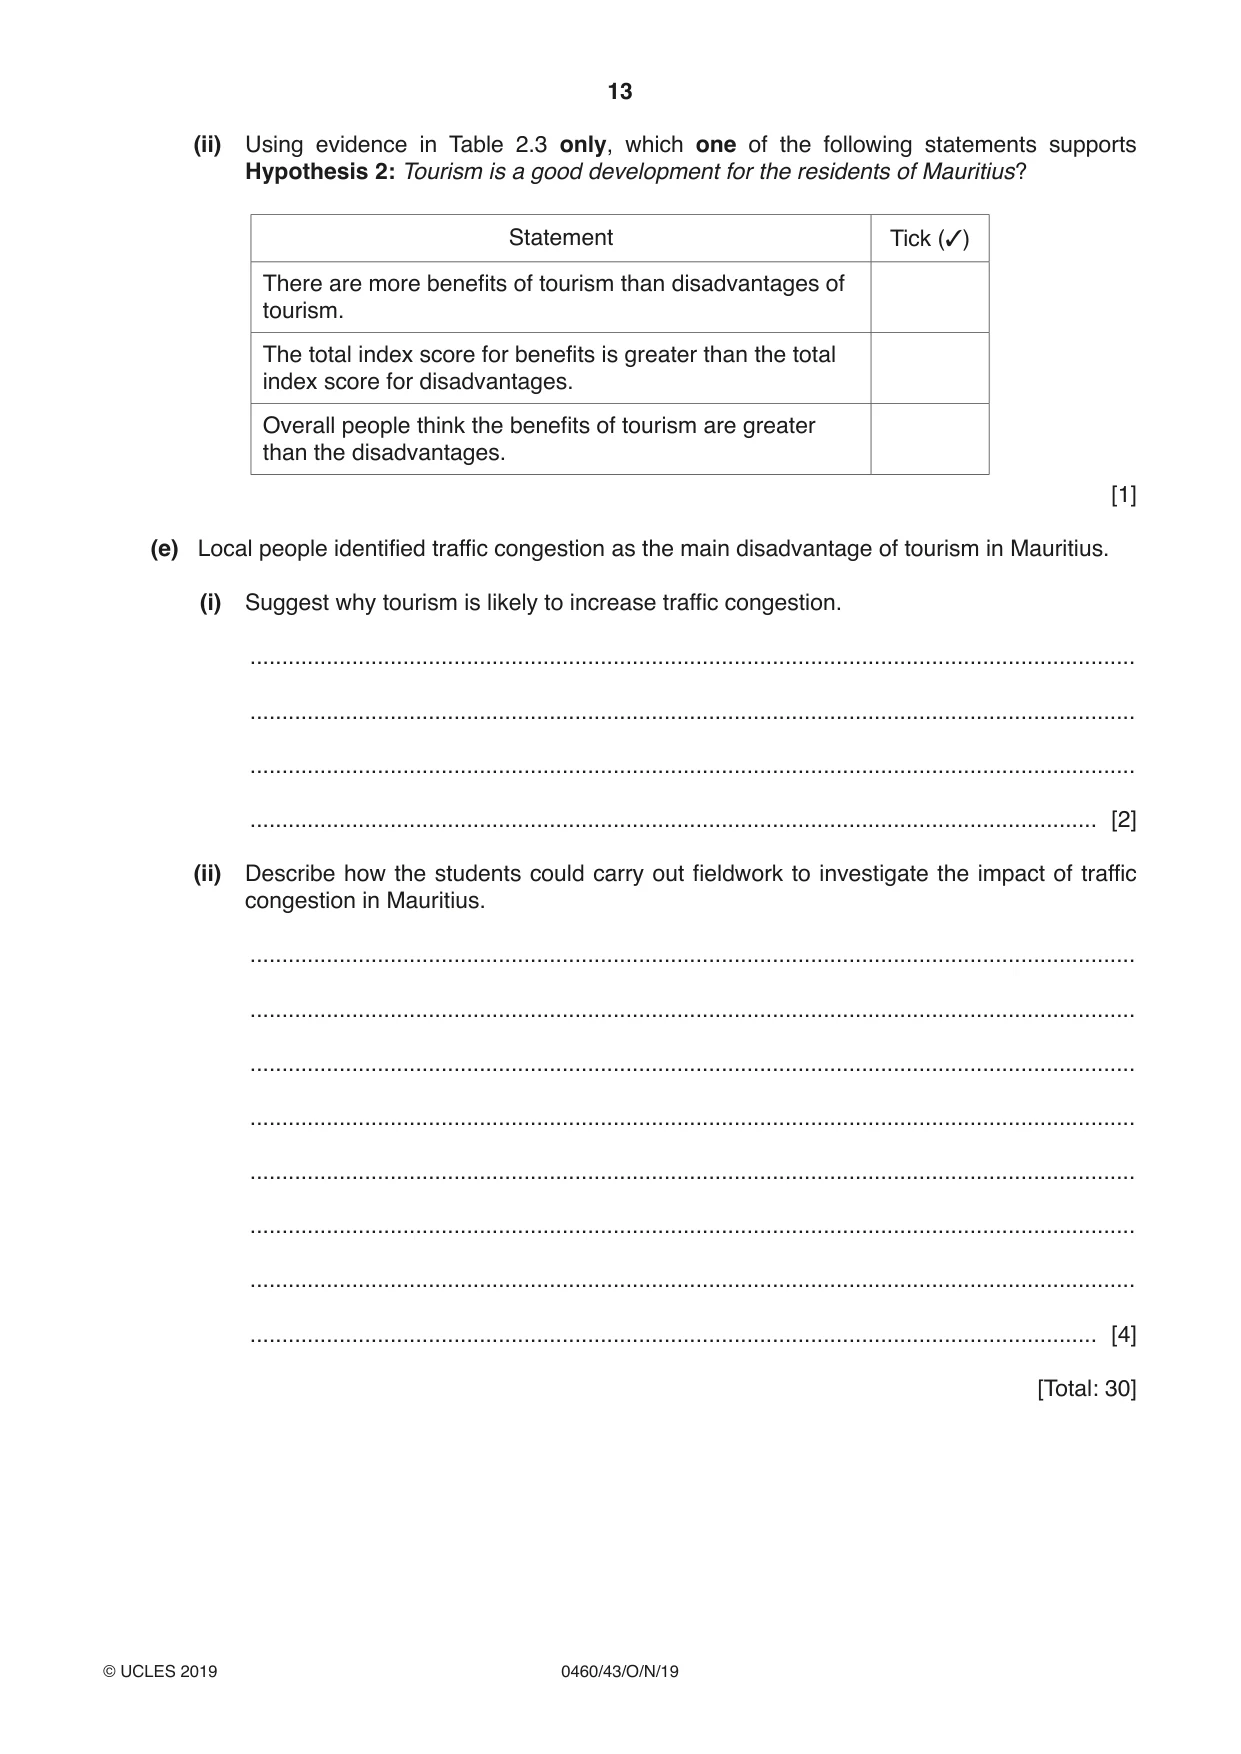
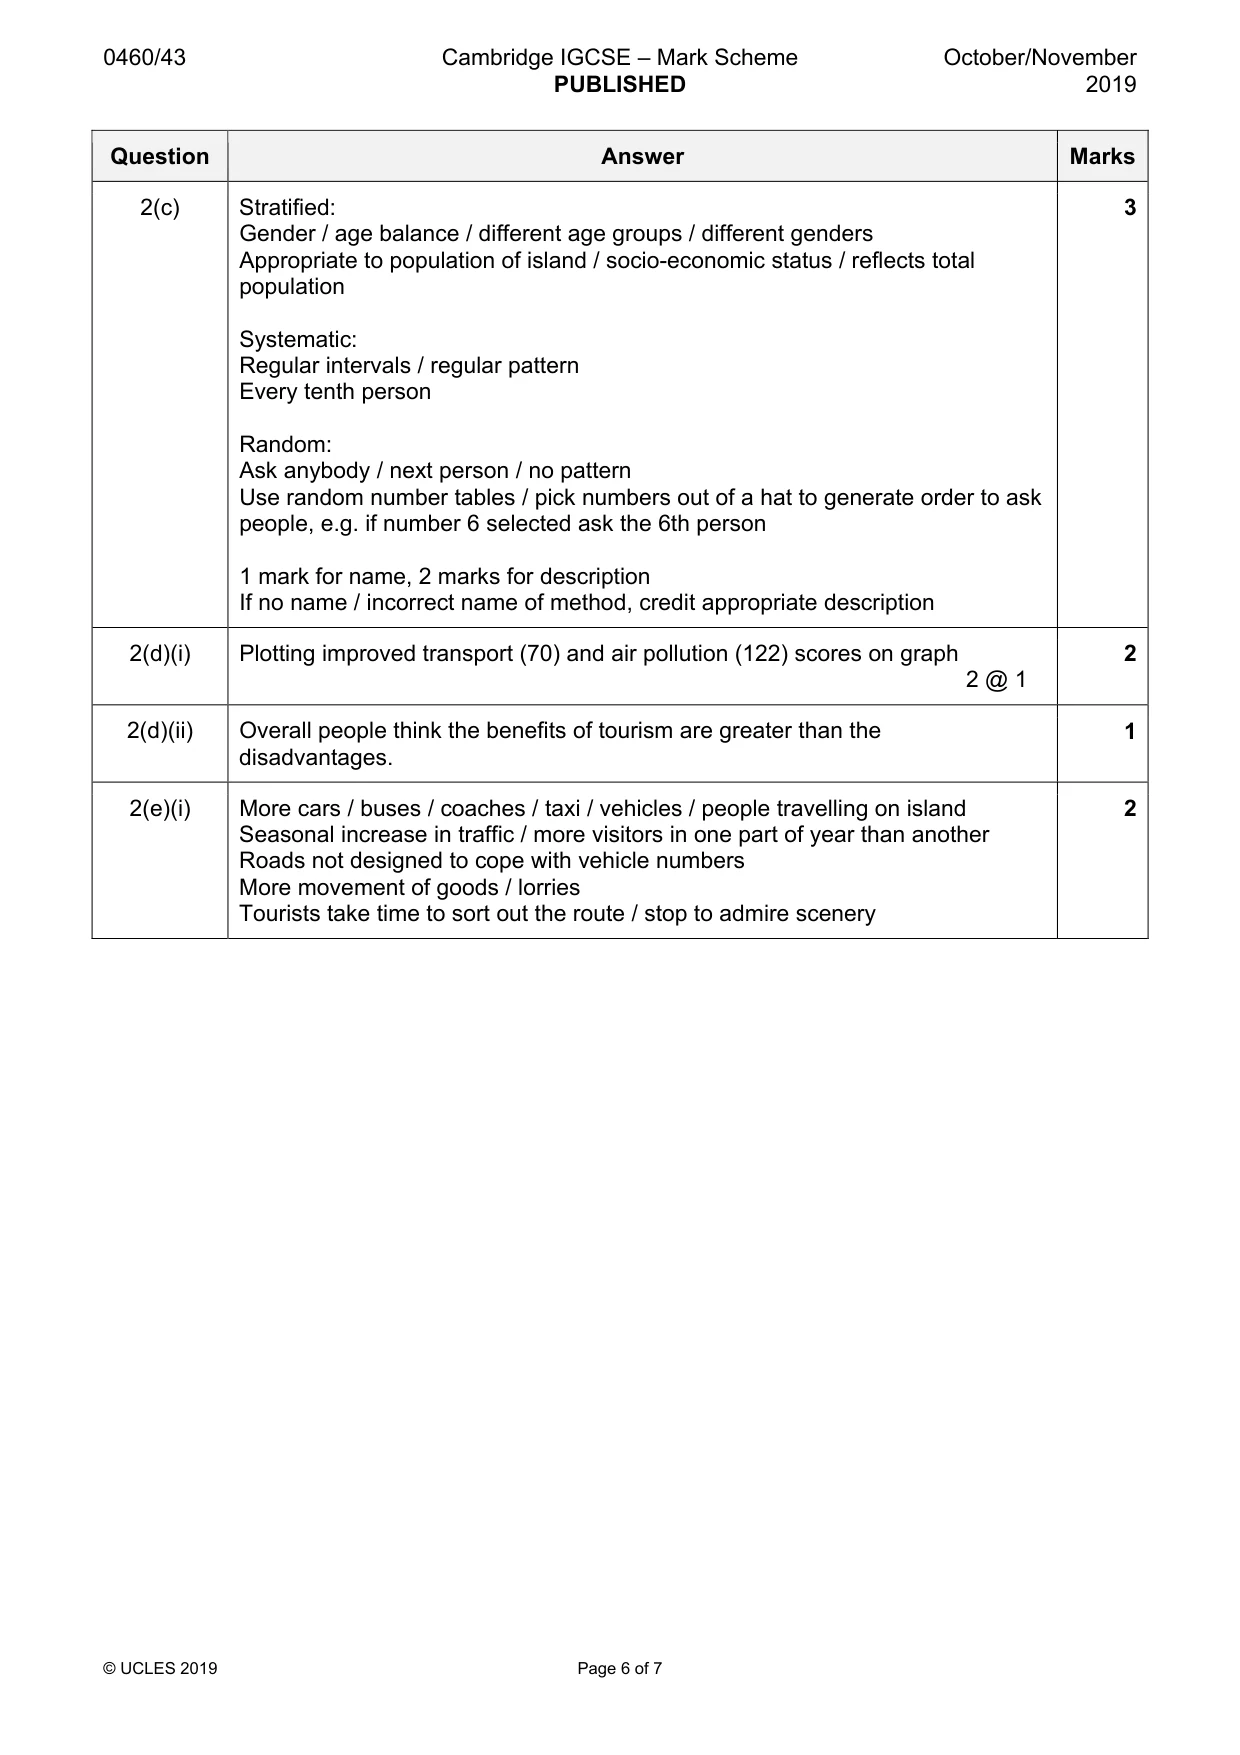
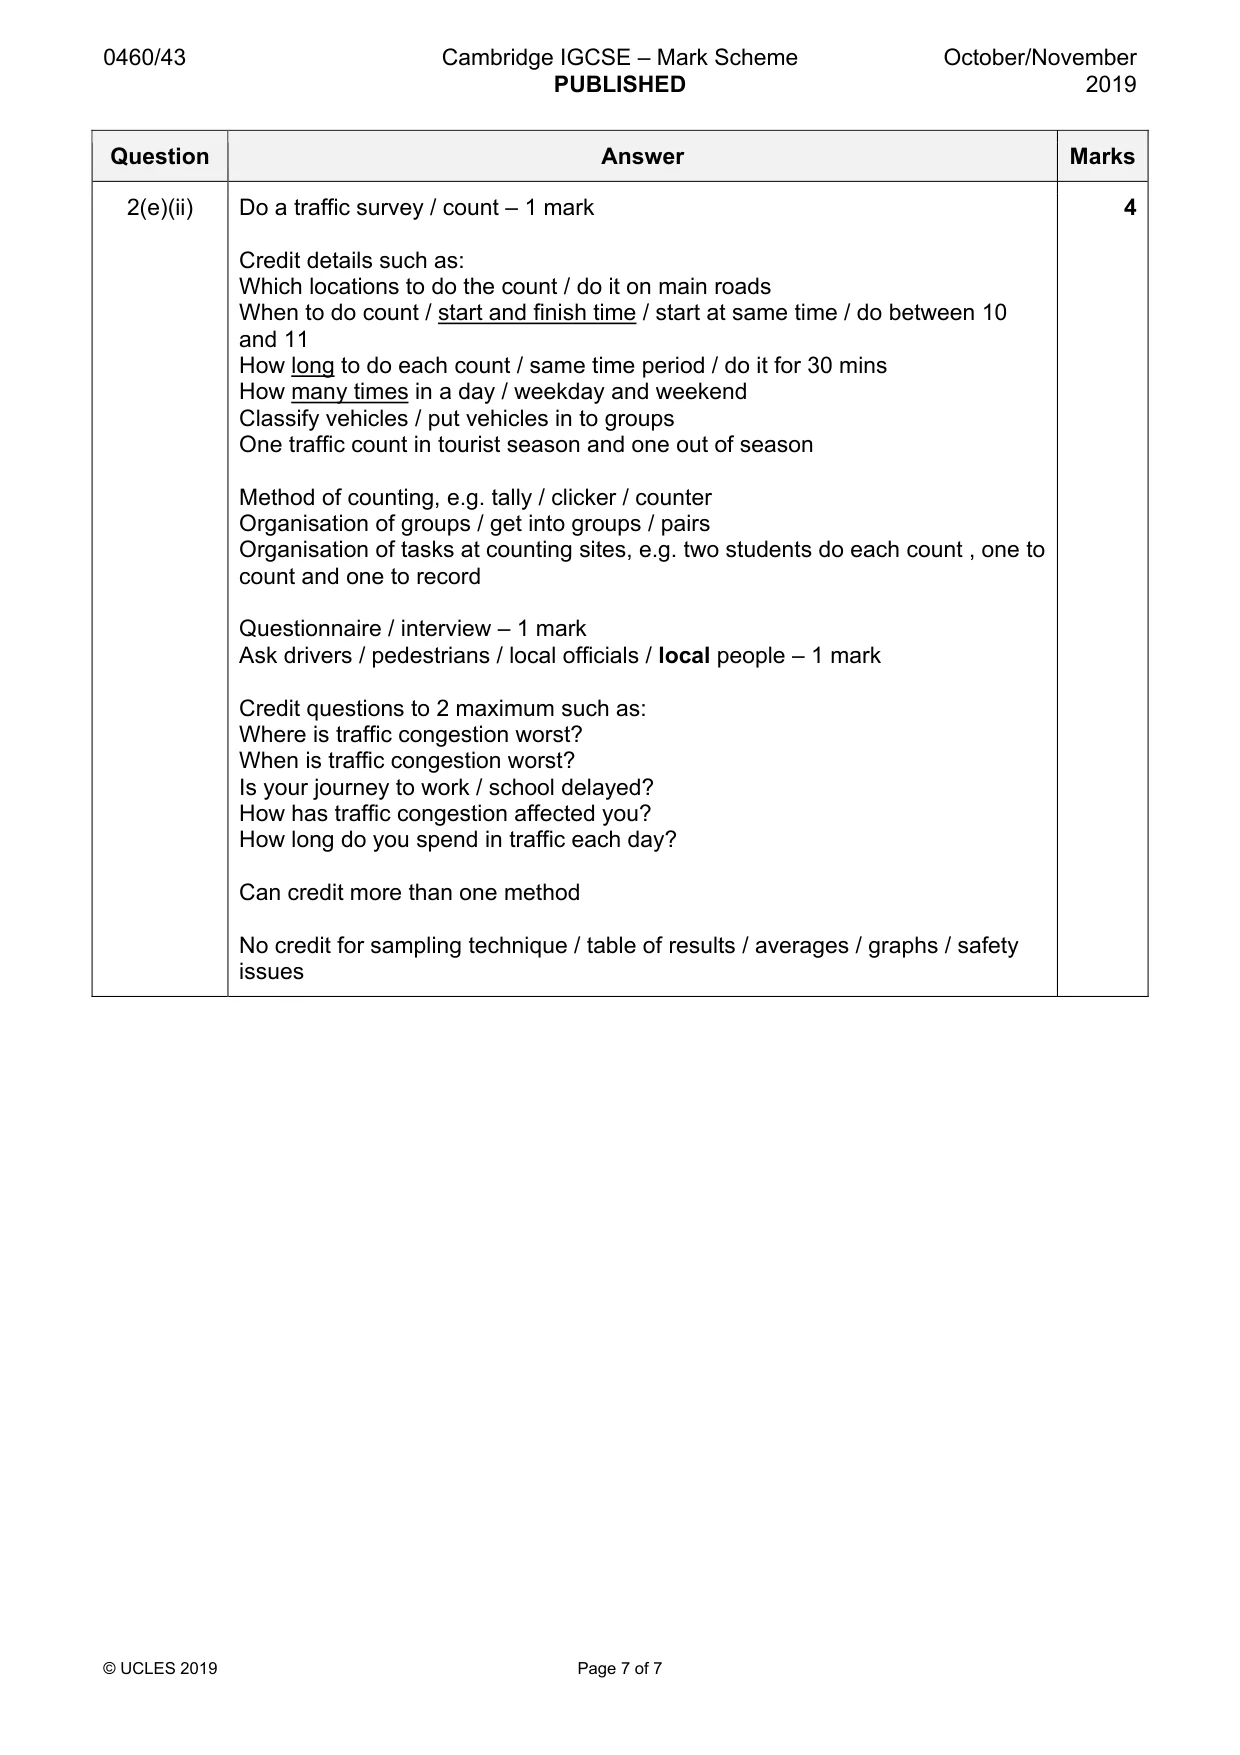
Mark scheme: 2(a)(i) 760 000 1 2(a)(ii) 2008 and 2009 1 2007 and 2009 2(a)(iii) More flights / development of airports / cheaper flights / budget airlines 4 Advertising Development of / more tourist facilities in LEDCs / e.g. hotels / more investment in tourism Increased incomes / more disposable income More paid holidays / more leisure time Healthier / more active retirees / older people People can book / research holidays on internet Wish to visit new / unspoilt destinations 4 @ 1 2(b)(i) To find out if person is a tourist or resident 2 Students only want to ask tourists / questionnaire is for tourists Don’t want to ask locals Not waste people’s time / own time Residents’ answers would be irrelevant / make survey unreliable 2(b)(ii) Most / over half / majority / highest number / more tourists come from Europe 2 More come from Europe / Asia / Africa than N America (maximum 1 mark for comparing two continents) Few / fewest / least come from Australasia / S America Number from Asia = number from Africa, Australia and S America 2 @ 1 2(b)(iii) Bar graph completion 2 Casela bird park = 34, Grand Bassin temples = 45 2 @ 1 2(b)(iv) Pie chart completion 2 1 mark for dividing line at 58%, 1 mark for shading in chart and key 2(b)(v) Hypothesis is true – 1 mark reserve 4 More visits are made to physical attractions / more tourists attracted by physical attractions Three most visited attractions are physical Four out of the five least visited attractions are human 2 marks maximum, 1 reserve for stats 290 visits to physical attractions and 204 visits to human attractions / 86 more Highest physical attraction is 67 visits and highest human attraction is 45 visits 58% of tourists prefer physical compared with 42% prefer human / 16% more No credit for Hypothesis is incorrect / partially correct If no hypothesis conclusion then credit evidence 2(c) Stratified: 3 Gender / age balance / different age groups / different genders Appropriate to population of island / socio-economic status / reflects total population Systematic: Regular intervals / regular pattern Every tenth person Random: Ask anybody / next person / no pattern Use random number tables / pick numbers out of a hat to generate order to ask people, e.g. if number 6 selected ask the 6th person 1 mark for name, 2 marks for description If no name / incorrect name of method, credit appropriate description 2(d)(i) Plotting improved transport (70) and air pollution (122) scores on graph 2 2 @ 1 2(d)(ii) Overall people think the benefits of tourism are greater than the 1 disadvantages. 2(e)(i) More cars / buses / coaches / taxi / vehicles / people travelling on island 2 Seasonal increase in traffic / more visitors in one part of year than another Roads not designed to cope with vehicle numbers More movement of goods / lorries Tourists take time to sort out the route / stop to admire scenery 2(e)(ii) Do a traffic survey / count – 1 mark 4 Credit details such as: Which locations to do the count / do it on main roads When to do count / start and finish time / start at same time / do between 10 and 11 How long to do each count / same time period / do it for 30 mins How many times in a day / weekday and weekend Classify vehicles / put vehicles in to groups One traffic count in tourist season and one out of season Method of counting, e.g. tally / clicker / counter Organisation of groups / get into groups / pairs Organisation of tasks at counting sites, e.g. two students do each count , one to count and one to record Questionnaire / interview – 1 mark Ask drivers / pedestrians / local officials / local people – 1 mark Credit questions to 2 maximum such as: Where is traffic congestion worst? When is traffic congestion worst? Is your journey to work / school delayed? How has traffic congestion affected you? How long do you spend in traffic each day? Can credit more than one method No credit for sampling technique / table of results / averages / graphs / safety issues
What was in this paper
The subtopics covered by these 2 questions, and how many questions each got. Open one in a new tab to see every Cambridge question on it.
What you needed in this session
Cambridge’s own grade thresholds for 2019 Oct/Nov, Paper 4 · Variant 3. A higher threshold means an easier paper — the bar moves with how the cohort did.