Cambridge IGCSE Geography 0460 — 2019 Oct/Nov Paper 4 · Variant 2
0460/42/O/N/19 · 2 questions · 60 marks · ≈68 min
The question paper and its mark scheme, free to read here and free to download. This is Cambridge’s own paper, exactly as it was sat.
Question paper20 pages








Mark scheme8 pages
Answers below. Sit the paper first if you are practising.
Questions as text
Q1 · A class of students did fieldwork in their town
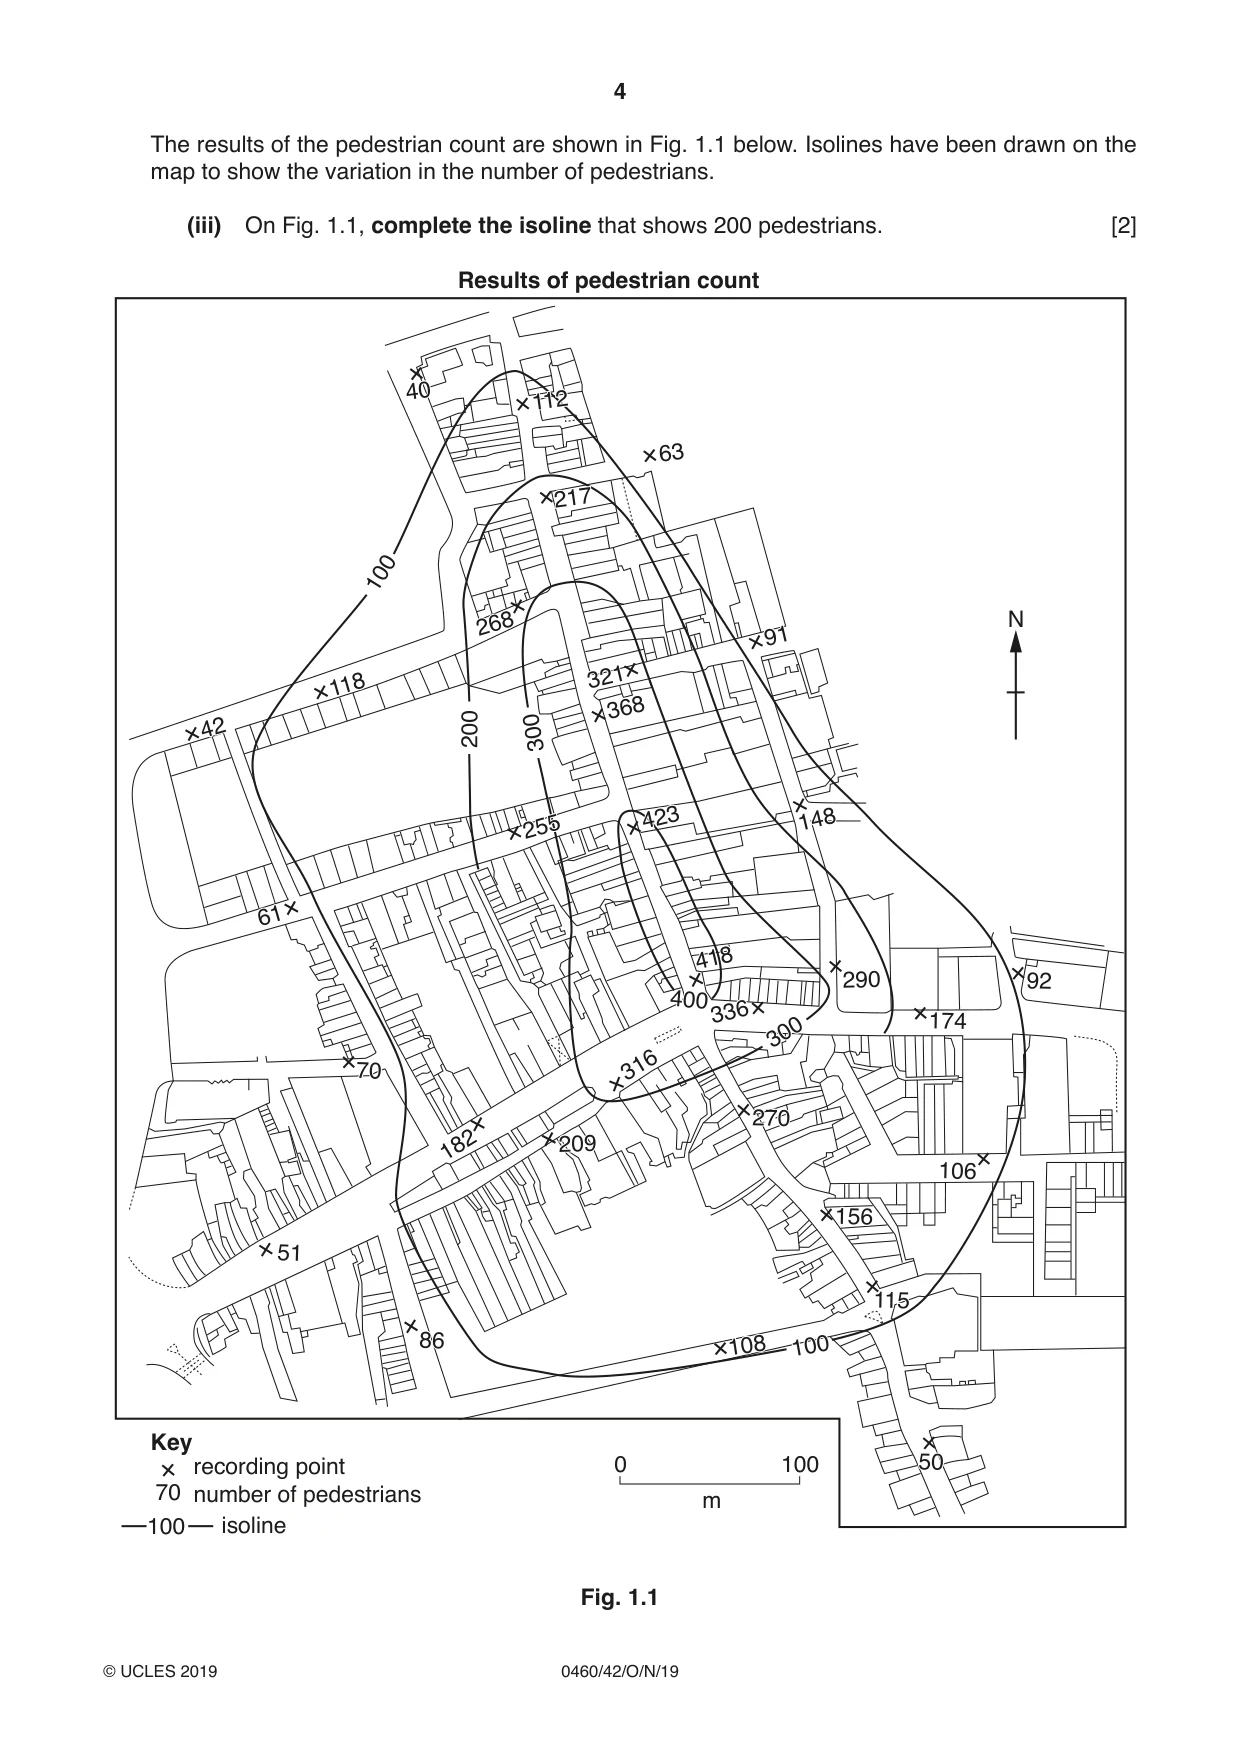
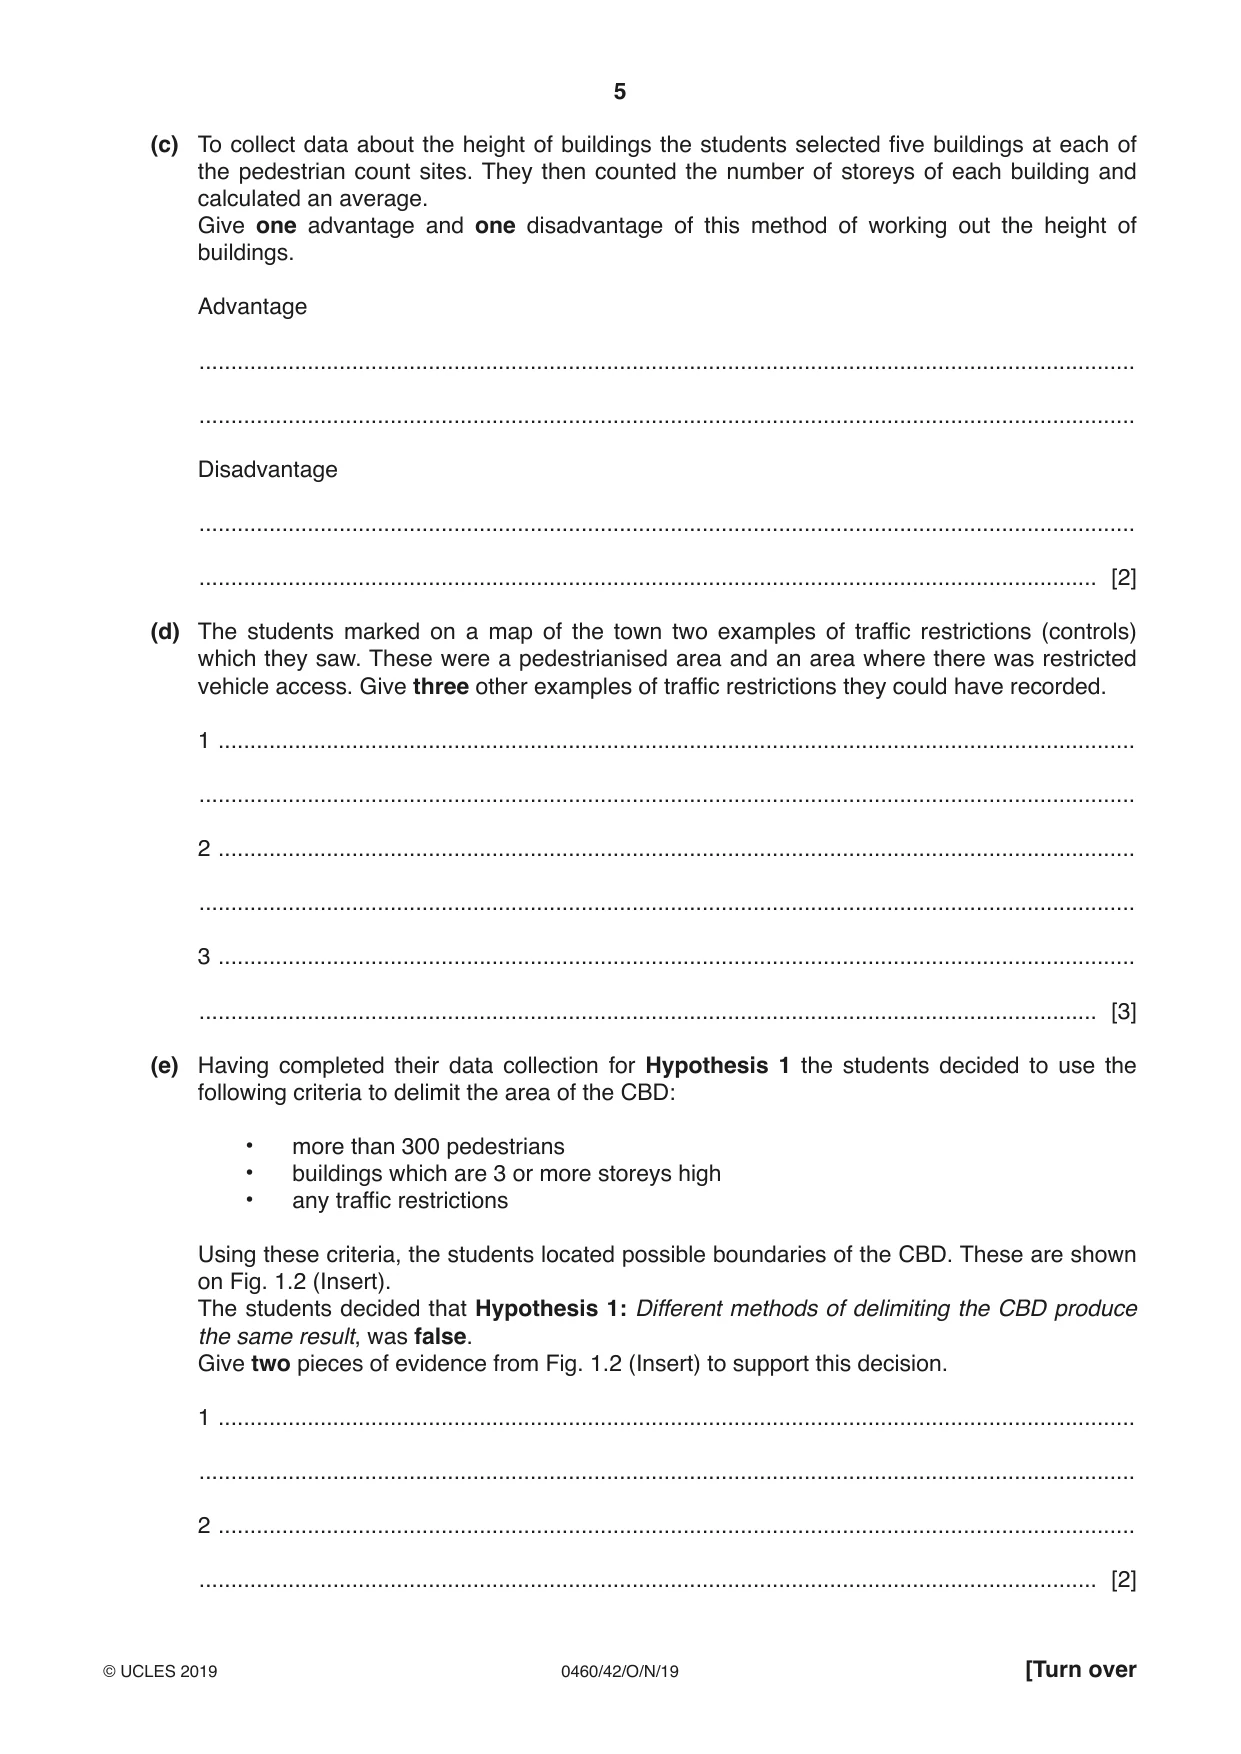
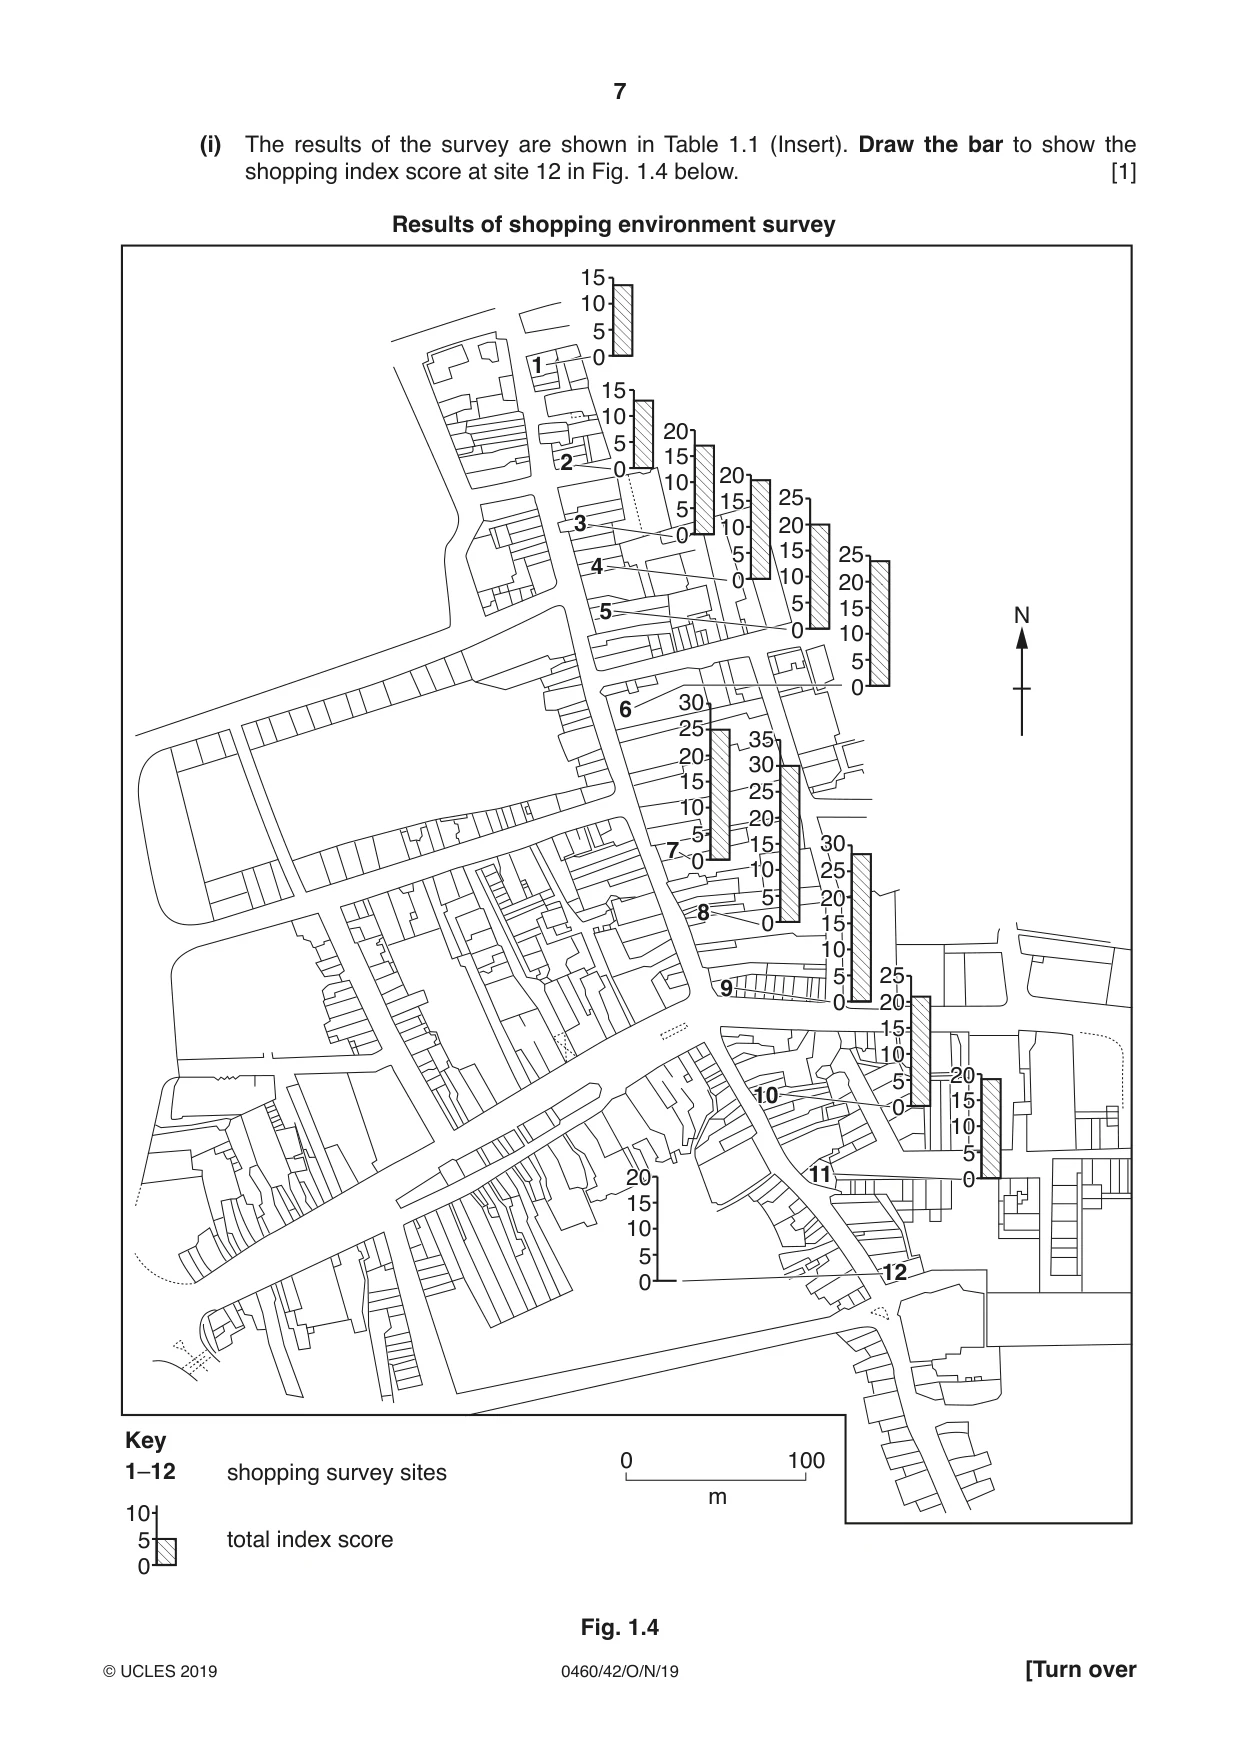
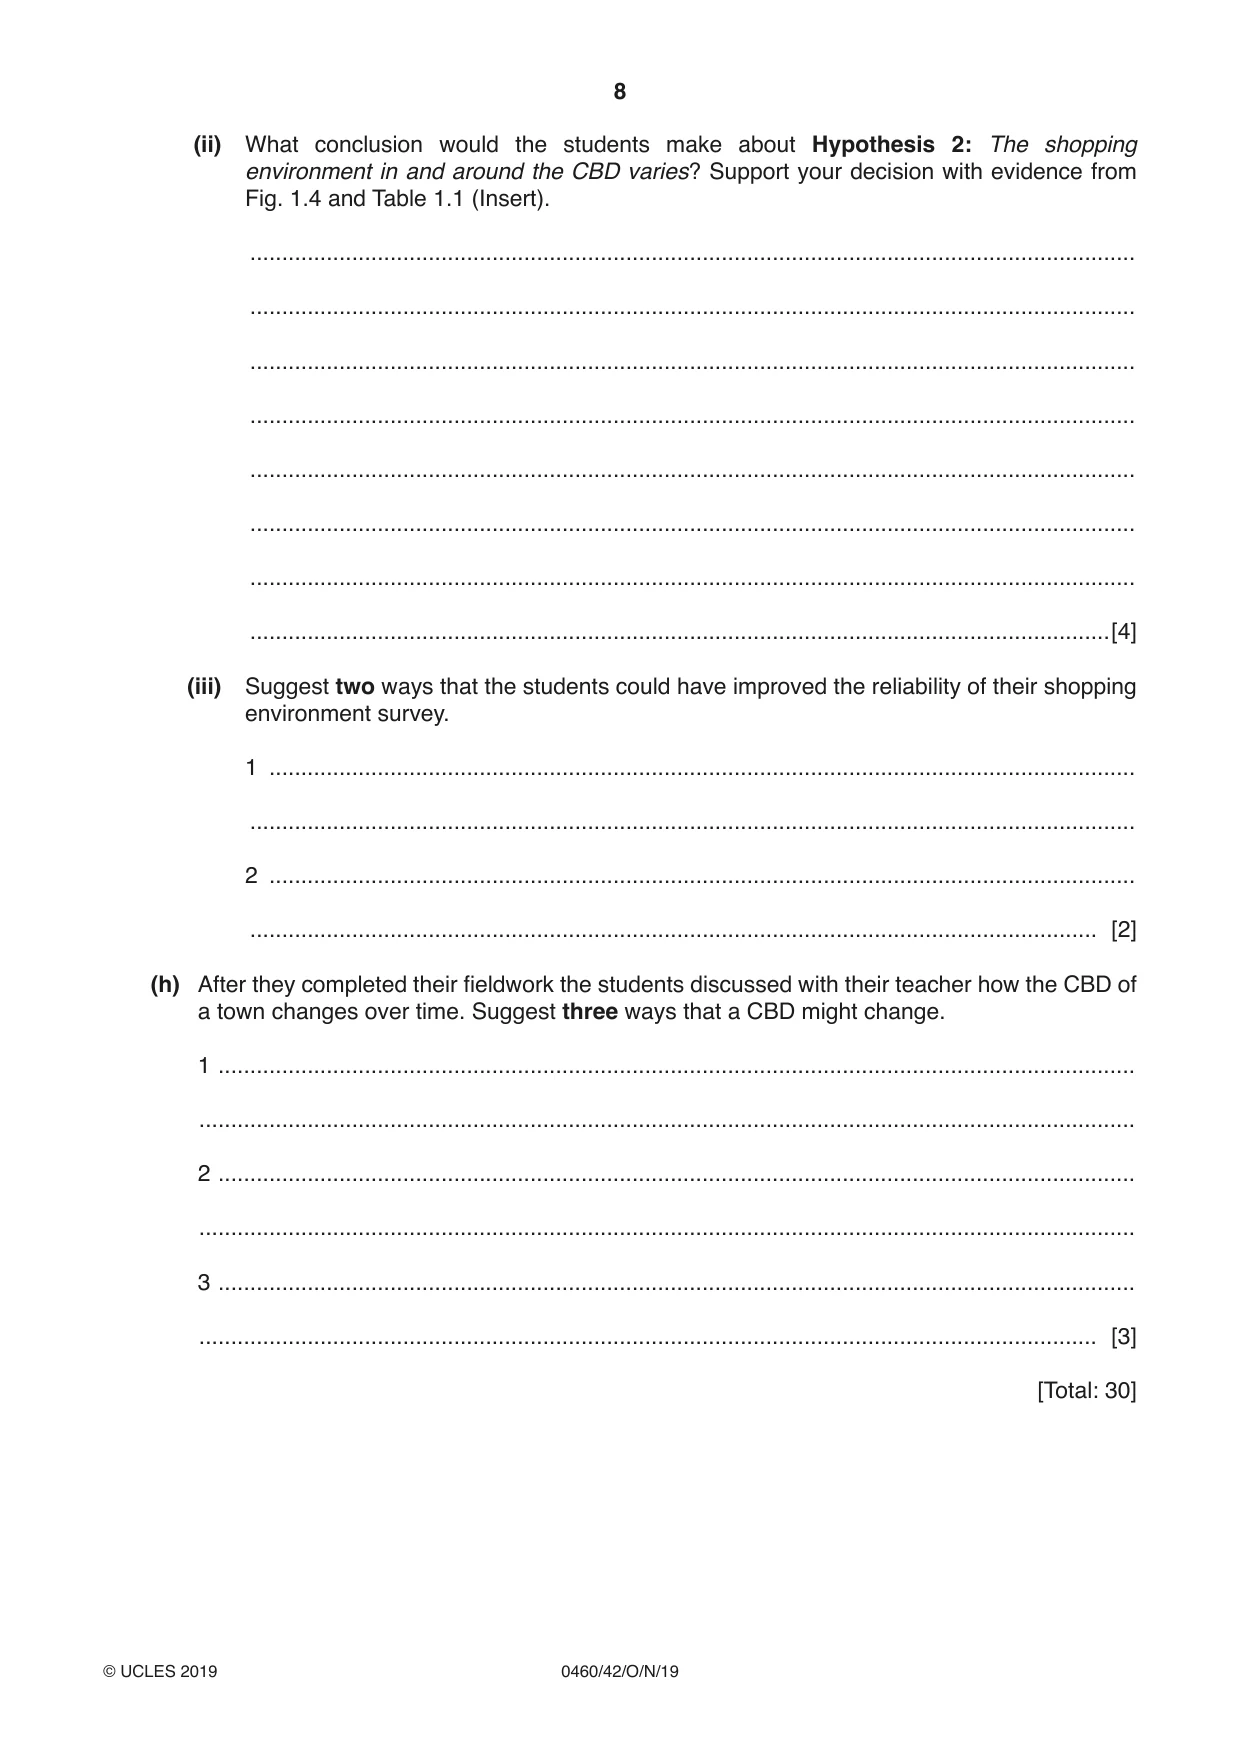
1 A class of students did fieldwork in their town. They wanted to find out where the boundary of the CBD was located. They had learned in class that this is known as ‘delimiting’ the CBD. They discussed with their teacher several fieldwork methods they could use to delimit the CBD. One group of students also investigated the quality of shops in and around the CBD. (a) What does CBD stand for? C ....................... B ....................... D ....................... [1] The students decided to test the following hypotheses. Hypothesis 1: Different methods of delimiting the CBD produce the same result. Hypothesis 2: The shopping environment in and around the CBD varies. (b) The students used the following methods to test Hypothesis 1: • pedestrian counts • survey of building heights • survey of traffic restrictions (controls) (i) The students did pedestrian counts at 30 sites around the town centre. In the space below, draw a recording sheet the students could have used at each site. [3] (ii) Describe an appropriate method to ensure the students obtained reliable results from the pedestrian count. ........................................................................................................................................... ........................................................................................................................................... ........................................................................................................................................... ........................................................................................................................................... ........................................................................................................................................... ........................................................................................................................................... ........................................................................................................................................... ..................................................................................................................................... [4] The results of the pedestrian count are shown in Fig. 1.1 below. Isolines have been drawn on the map to show the variation in the number of pedestrians. (iii) On Fig. 1.1, complete the isoline that shows 200 pedestrians. [2] Results of pedestrian count 40 112 63 217 100 268 N 91 321 118 368 42 200 300 423 148 255 61 418 290 92 400 336 174 300 70 316 270 182 209 106 156 51 115 86 108 100 Key recording point 0 100 50 70 number of pedestrians m 100 isoline Fig. 1.1 (c) To collect data about the height of buildings the students selected five buildings at each of the pedestrian count sites. They then counted the number of storeys of each building and calculated an average. Give one advantage and one disadvantage of this method of working out the height of buildings. Advantage ................................................................................................................................................... ................................................................................................................................................... Disadvantage ................................................................................................................................................... ............................................................................................................................................. [2] (d) The students marked on a map of the town two examples of traffic restrictions (controls) which they saw. These were a pedestrianised area and an area where there was restricted vehicle access. Give three other examples of traffic restrictions they could have recorded. 1 ................................................................................................................................................ ................................................................................................................................................... 2 ................................................................................................................................................ ................................................................................................................................................... 3 ................................................................................................................................................ ............................................................................................................................................. [3] (e) Having completed their data collection for Hypothesis 1 the students decided to use the following criteria to delimit the area of the CBD: • more than 300 pedestrians • buildings which are 3 or more storeys high • any traffic restrictions Using these criteria, the students located possible boundaries of the CBD. These are shown on Fig. 1.2 (Insert). The students decided that Hypothesis 1: Different methods of delimiting the CBD produce the same result, was false. Give two pieces of evidence from Fig. 1.2 (Insert) to support this decision. 1 ................................................................................................................................................ ................................................................................................................................................... 2 ................................................................................................................................................ ............................................................................................................................................. [2] (f) Another group of students chose a different fieldwork method to delimit the CBD. They drew a land use map of the town centre and using this map they decided where the boundary of the CBD was. Describe how they would carry out these tasks. ................................................................................................................................................... ................................................................................................................................................... ................................................................................................................................................... ................................................................................................................................................... ................................................................................................................................................... ............................................................................................................................................. [3] (g) To investigate Hypothesis 2: The shopping environment in and around the CBD varies, the students did a survey using the shopping environment index shown in Fig. 1.3 (Insert). (i) The results of the survey are shown in Table 1.1 (Insert). Draw the bar to show the shopping index score at site 12 in Fig. 1.4 below. [1] Results of shopping environment survey 15 10 5 0 1 15 10 20 5 2 15 0 20 10 15 25 5 3 10 20 0 5 15 25 4 0 10 20 5 15 5 N 0 10 5 0 30 6 25 35 20 30 15 25 10 20 5 7 15 30 0 10 25 5 20 8 0 15 10 5 25 9 0 20 15 10 5 20 10 15 0 10 5 20 11 0 15 10 5 12 0 Key 0 1001–12 shopping survey sites m10 5 total index score 0 Fig. 1.4 (ii) What conclusion would the students make about Hypothesis 2: The shopping environment in and around the CBD varies? Support your decision with evidence from Fig. 1.4 and Table 1.1 (Insert). ........................................................................................................................................... ........................................................................................................................................... ........................................................................................................................................... ........................................................................................................................................... ........................................................................................................................................... ........................................................................................................................................... ........................................................................................................................................... .......................................................................................................................................[4] (iii) Suggest two ways that the students could have improved the reliability of their shopping environment survey. 1 ........................................................................................................................................ ........................................................................................................................................... 2 ........................................................................................................................................ ..................................................................................................................................... [2] (h) After they completed their fieldwork the students discussed with their teacher how the CBD of a town changes over time. Suggest three ways that a CBD might change. 1 ................................................................................................................................................ ................................................................................................................................................... 2 ................................................................................................................................................ ................................................................................................................................................... 3 ................................................................................................................................................ ............................................................................................................................................. [3] [Total: 30]
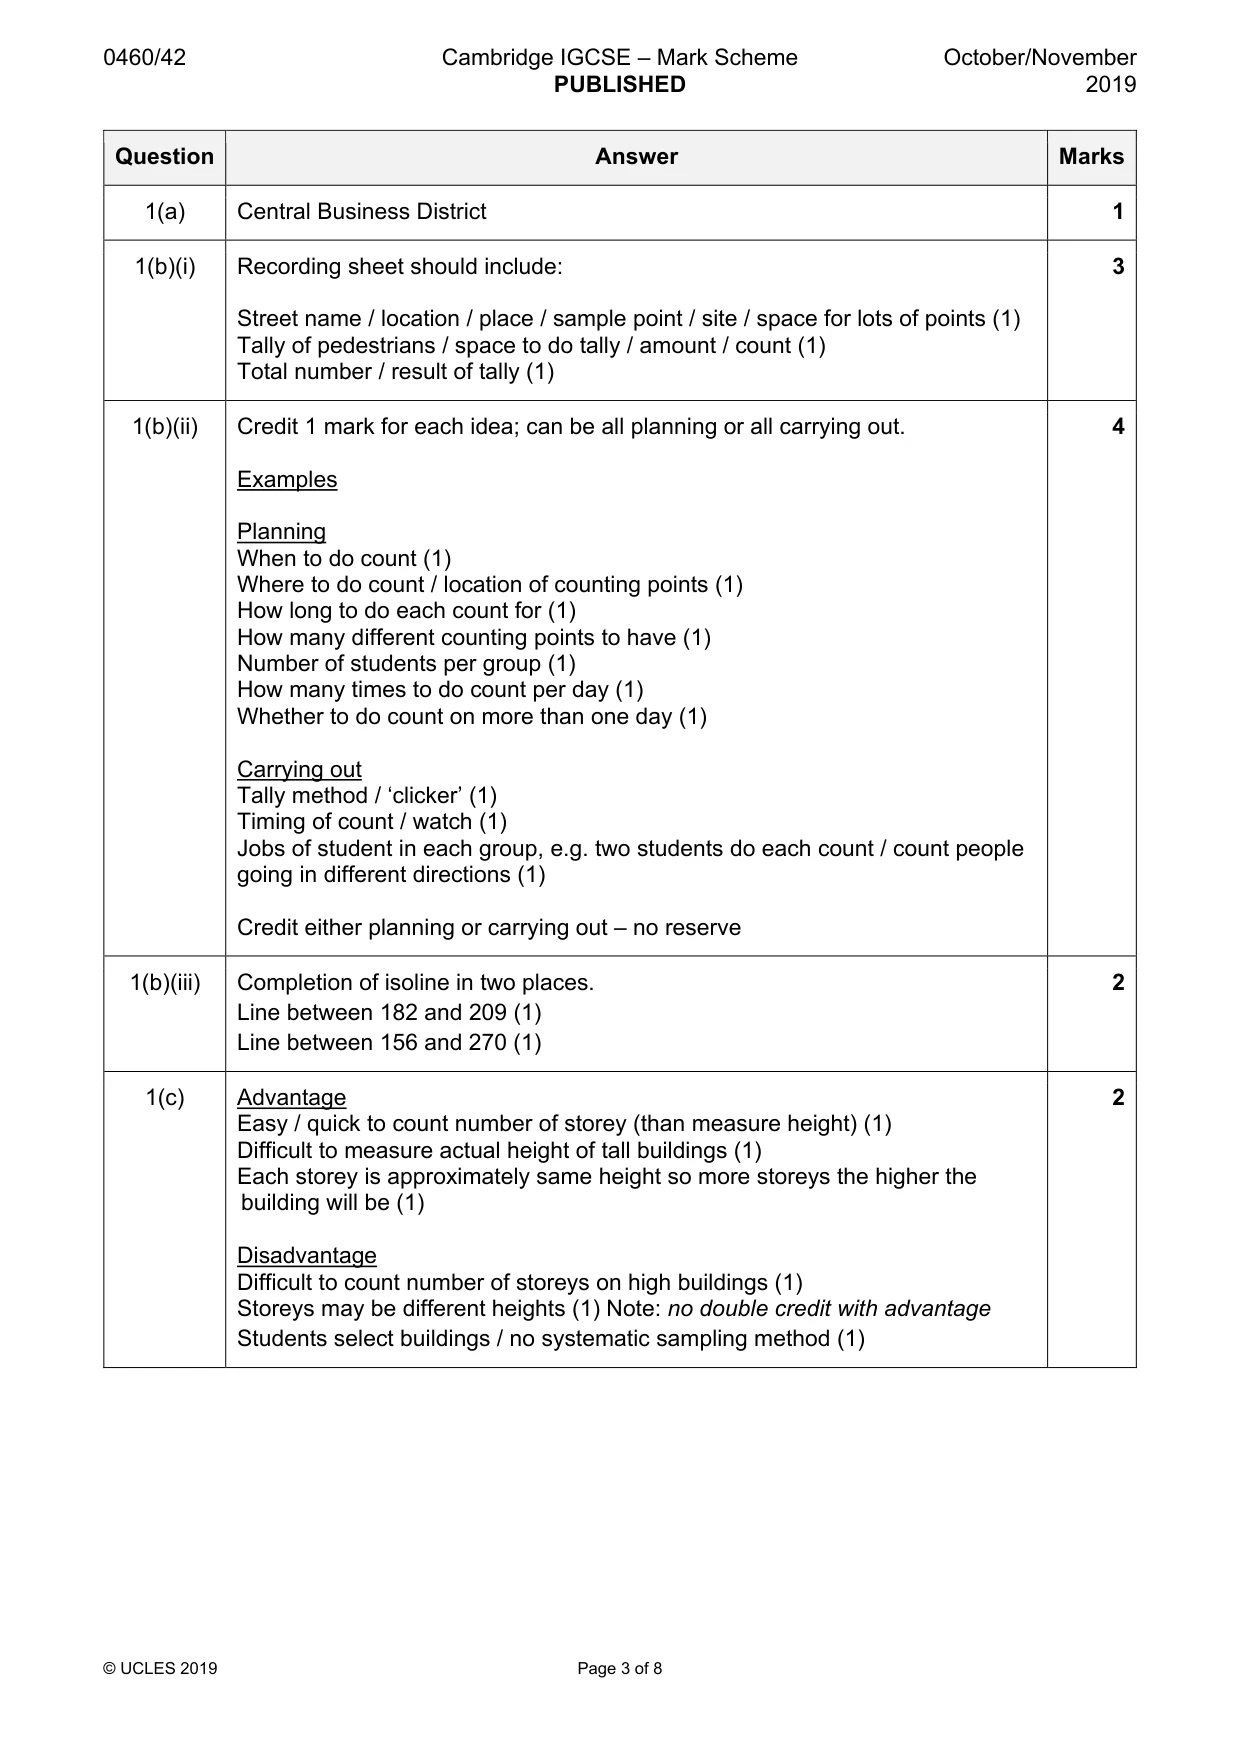
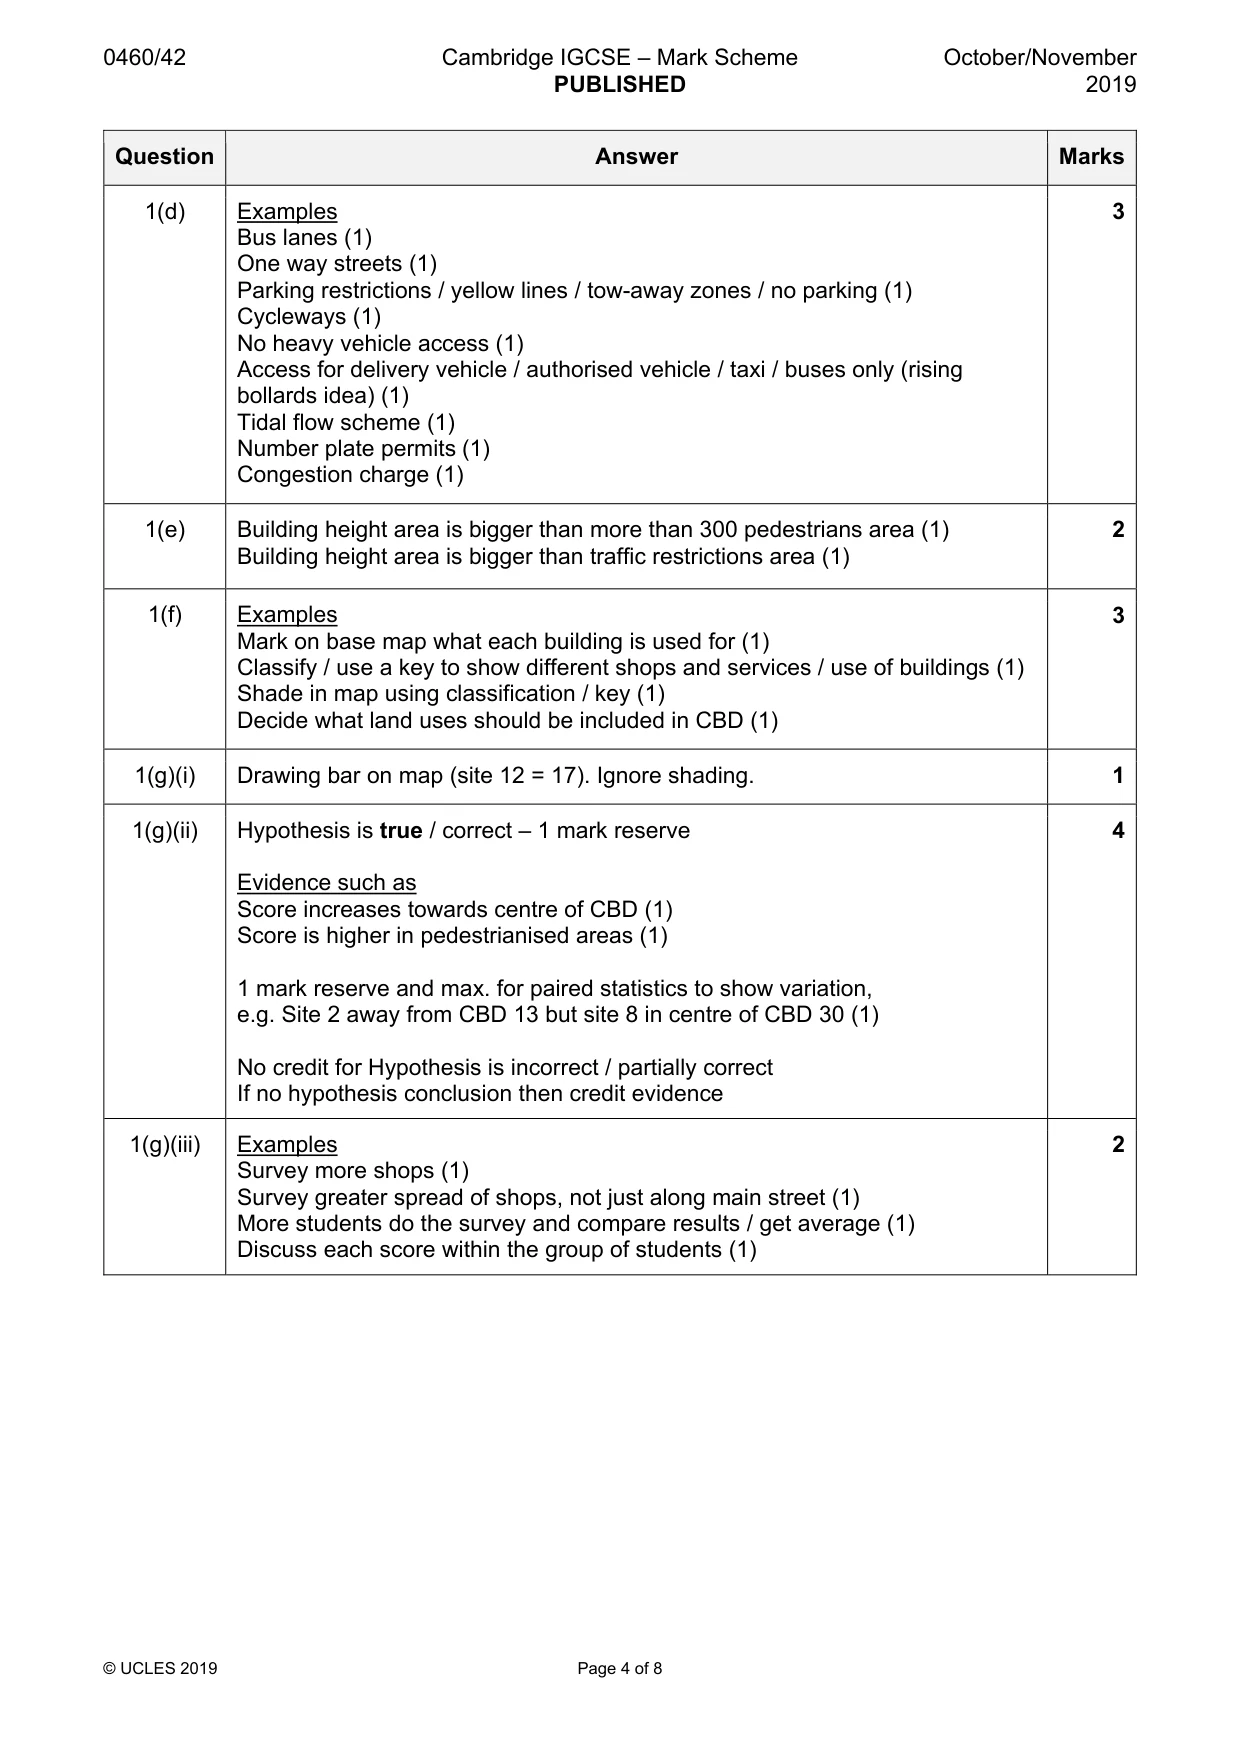
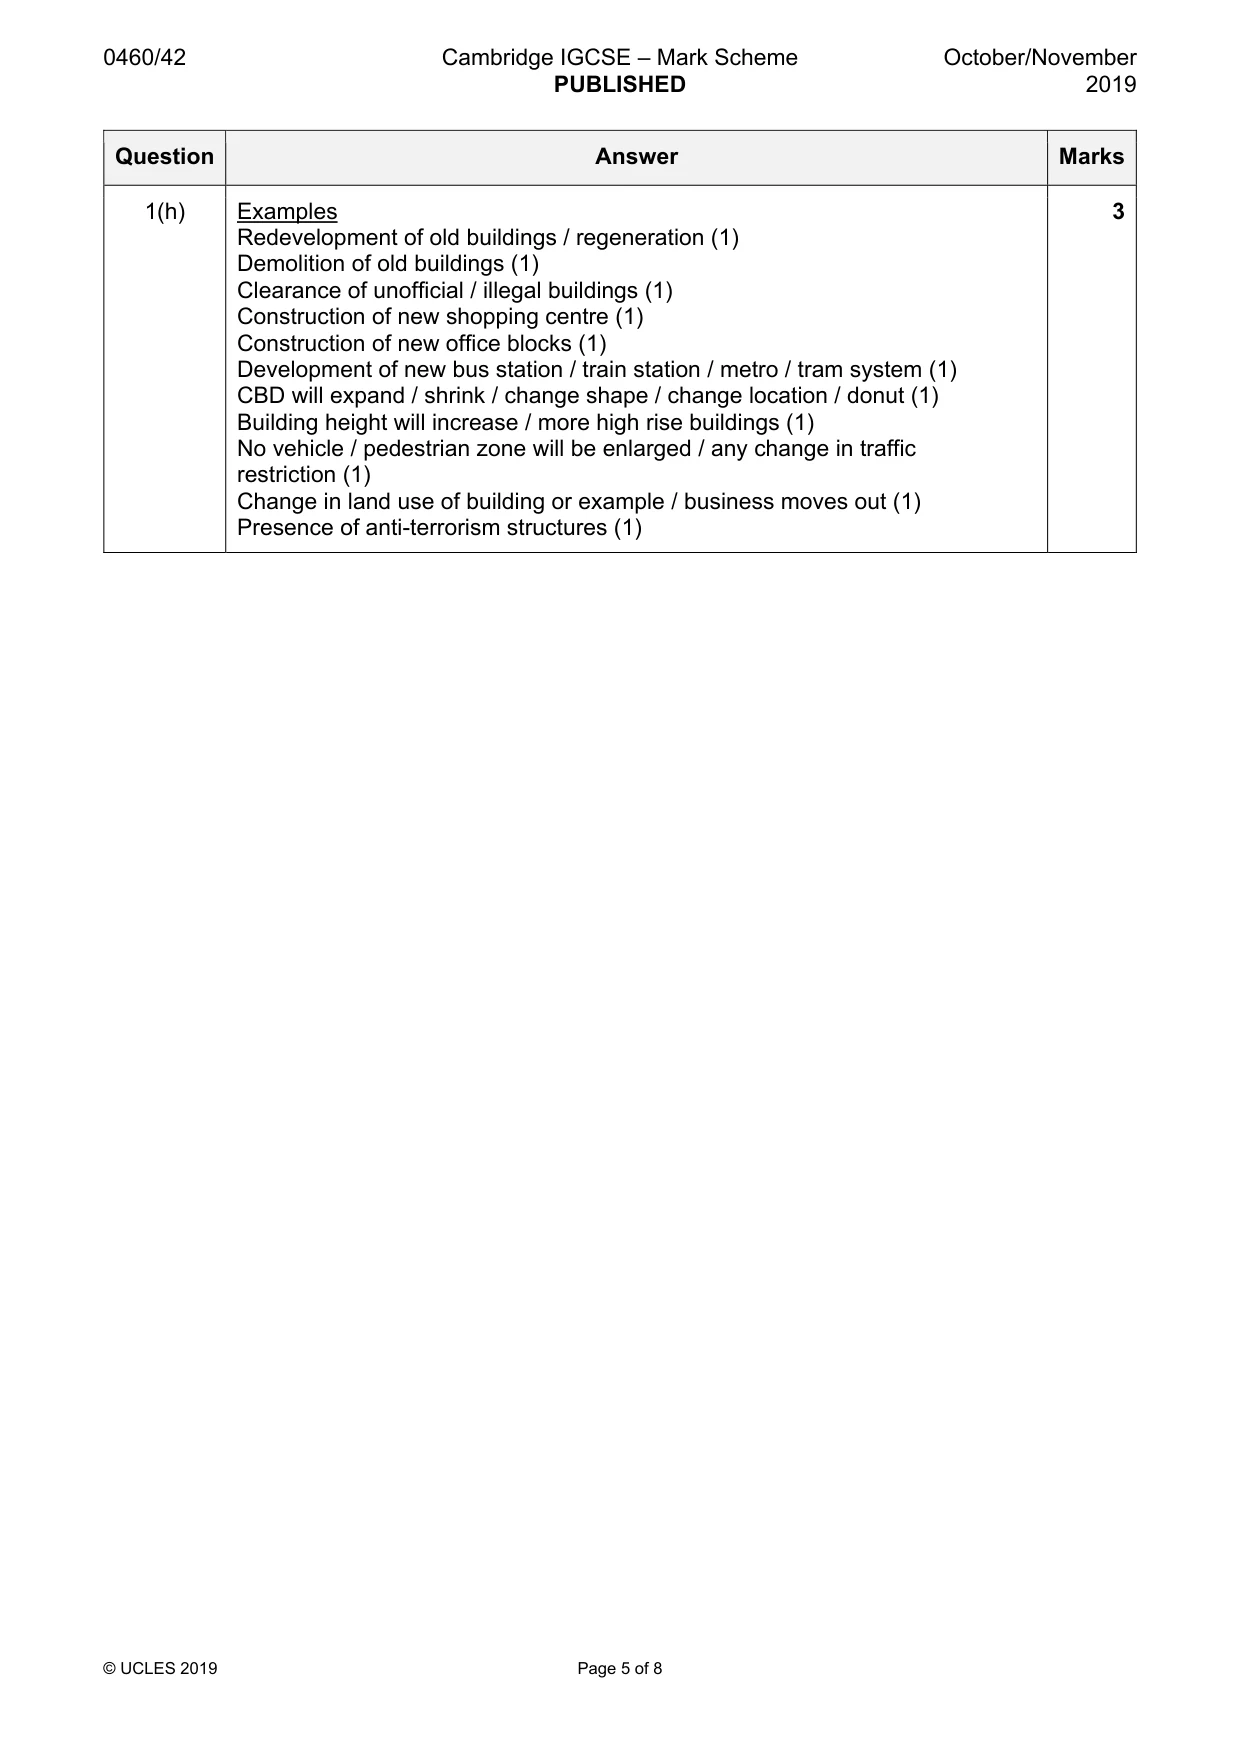
Mark scheme: Question Answer Marks 1(a) Central Business District 1 1(b)(i) Recording sheet should include: 3 Street name / location / place / sample point / site / space for lots of points (1) Tally of pedestrians / space to do tally / amount / count (1) Total number / result of tally (1) 1(b)(ii) Credit 1 mark for each idea; can be all planning or all carrying out. 4 Examples Planning When to do count (1) Where to do count / location of counting points (1) How long to do each count for (1) How many different counting points to have (1) Number of students per group (1) How many times to do count per day (1) Whether to do count on more than one day (1) Carrying out Tally method / ‘clicker’ (1) Timing of count / watch (1) Jobs of student in each group, e.g. two students do each count / count people going in different directions (1) Credit either planning or carrying out – no reserve 1(b)(iii) Completion of isoline in two places. 2 Line between 182 and 209 (1) Line between 156 and 270 (1) 1(c) Advantage 2 Easy / quick to count number of storey (than measure height) (1) Difficult to measure actual height of tall buildings (1) Each storey is approximately same height so more storeys the higher the building will be (1) Disadvantage Difficult to count number of storeys on high buildings (1) Storeys may be different heights (1) Note: no double credit with advantage Students select buildings / no systematic sampling method (1) 1(d) Examples 3 Bus lanes (1) One way streets (1) Parking restrictions / yellow lines / tow-away zones / no parking (1) Cycleways (1) No heavy vehicle access (1) Access for delivery vehicle / authorised vehicle / taxi / buses only (rising bollards idea) (1) Tidal flow scheme (1) Number plate permits (1) Congestion charge (1) 1(e) Building height area is bigger than more than 300 pedestrians area (1) 2 Building height area is bigger than traffic restrictions area (1) 1(f) Examples 3 Mark on base map what each building is used for (1) Classify / use a key to show different shops and services / use of buildings (1) Shade in map using classification / key (1) Decide what land uses should be included in CBD (1) 1(g)(i) Drawing bar on map (site 12 = 17). Ignore shading. 1 1(g)(ii) Hypothesis is true / correct – 1 mark reserve 4 Evidence such as Score increases towards centre of CBD (1) Score is higher in pedestrianised areas (1) 1 mark reserve and max. for paired statistics to show variation, e.g. Site 2 away from CBD 13 but site 8 in centre of CBD 30 (1) No credit for Hypothesis is incorrect / partially correct If no hypothesis conclusion then credit evidence 1(g)(iii) Examples 2 Survey more shops (1) Survey greater spread of shops, not just along main street (1) More students do the survey and compare results / get average (1) Discuss each score within the group of students (1) 1(h) Examples 3 Redevelopment of old buildings / regeneration (1) Demolition of old buildings (1) Clearance of unofficial / illegal buildings (1) Construction of new shopping centre (1) Construction of new office blocks (1) Development of new bus station / train station / metro / tram system (1) CBD will expand / shrink / change shape / change location / donut (1) Building height will increase / more high rise buildings (1) No vehicle / pedestrian zone will be enlarged / any change in traffic restriction (1) Change in land use of building or example / business moves out (1) Presence of anti-terrorism structures (1)
Q2 · Students carried out fieldwork at a popular tourist beach in south east England
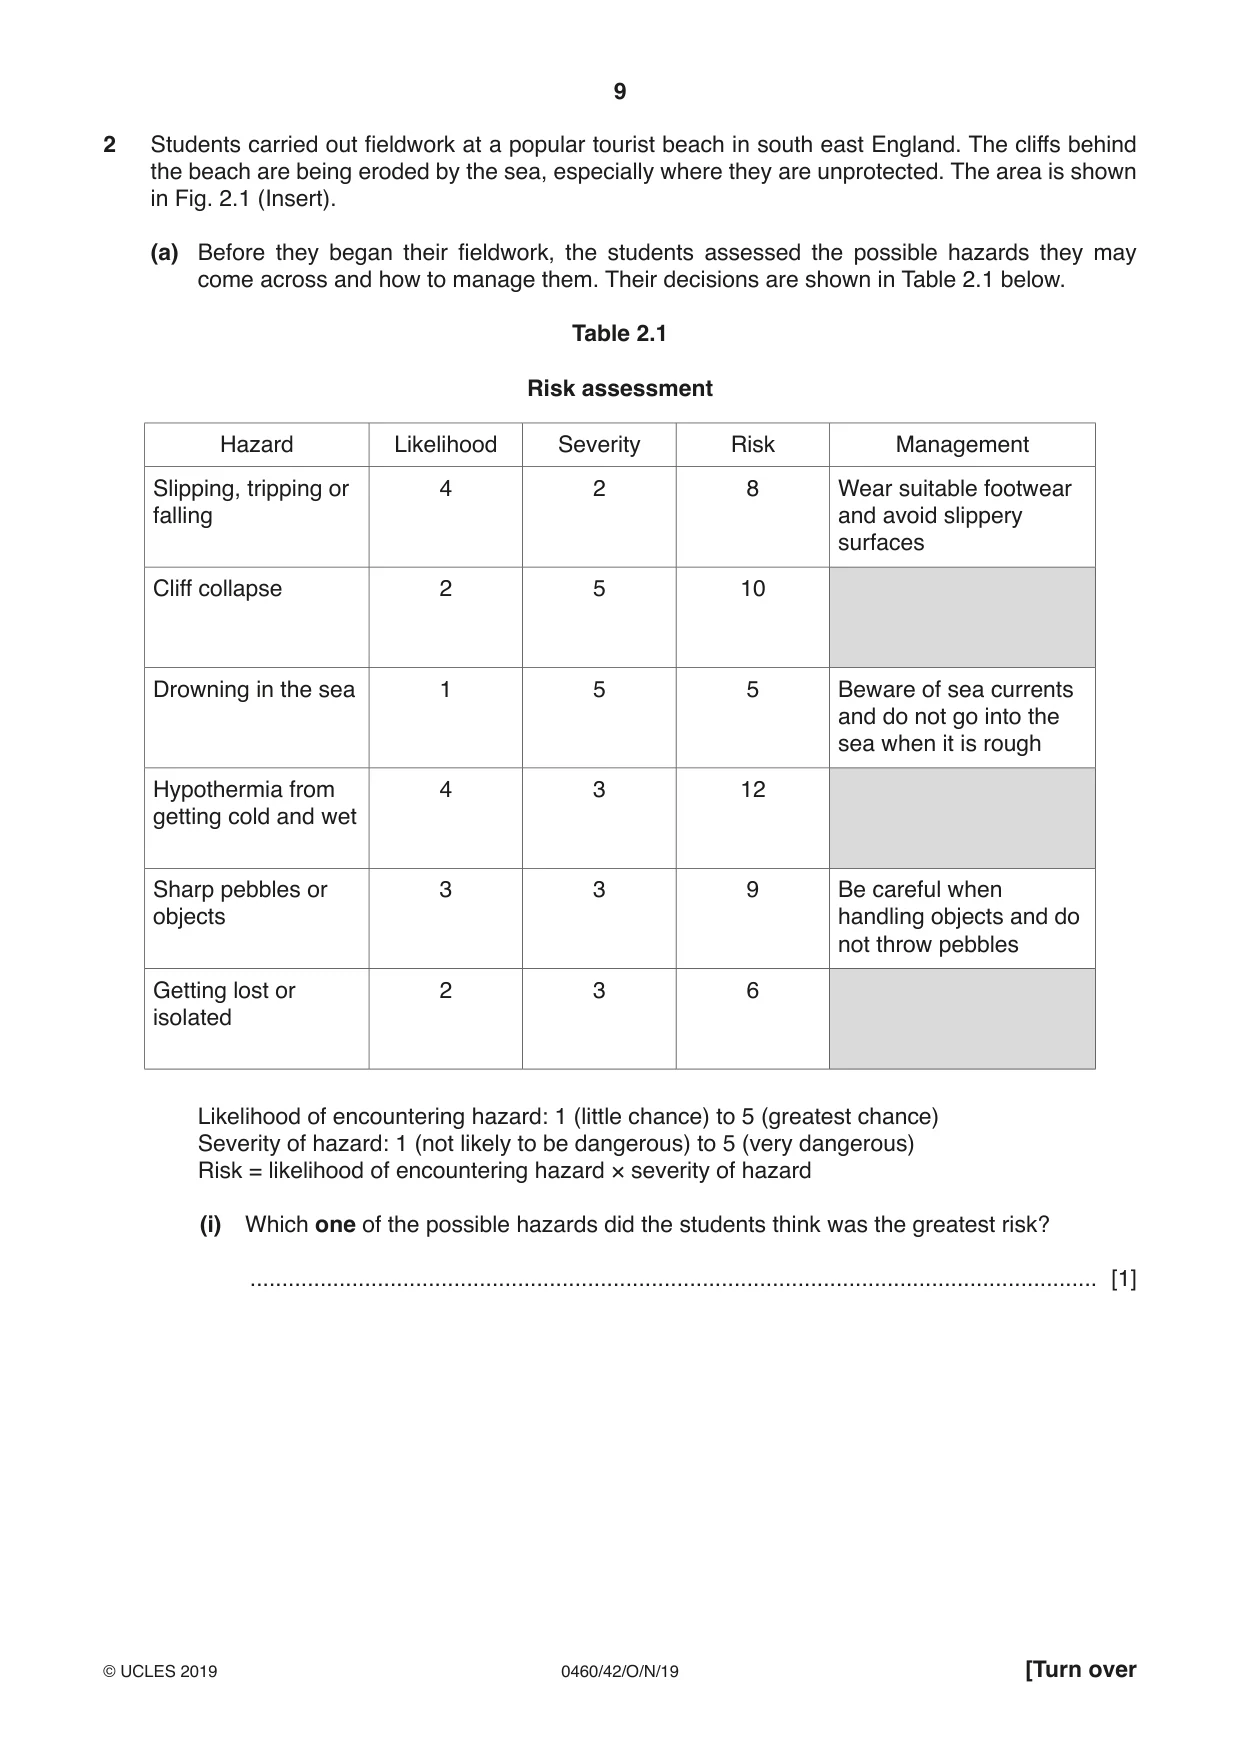
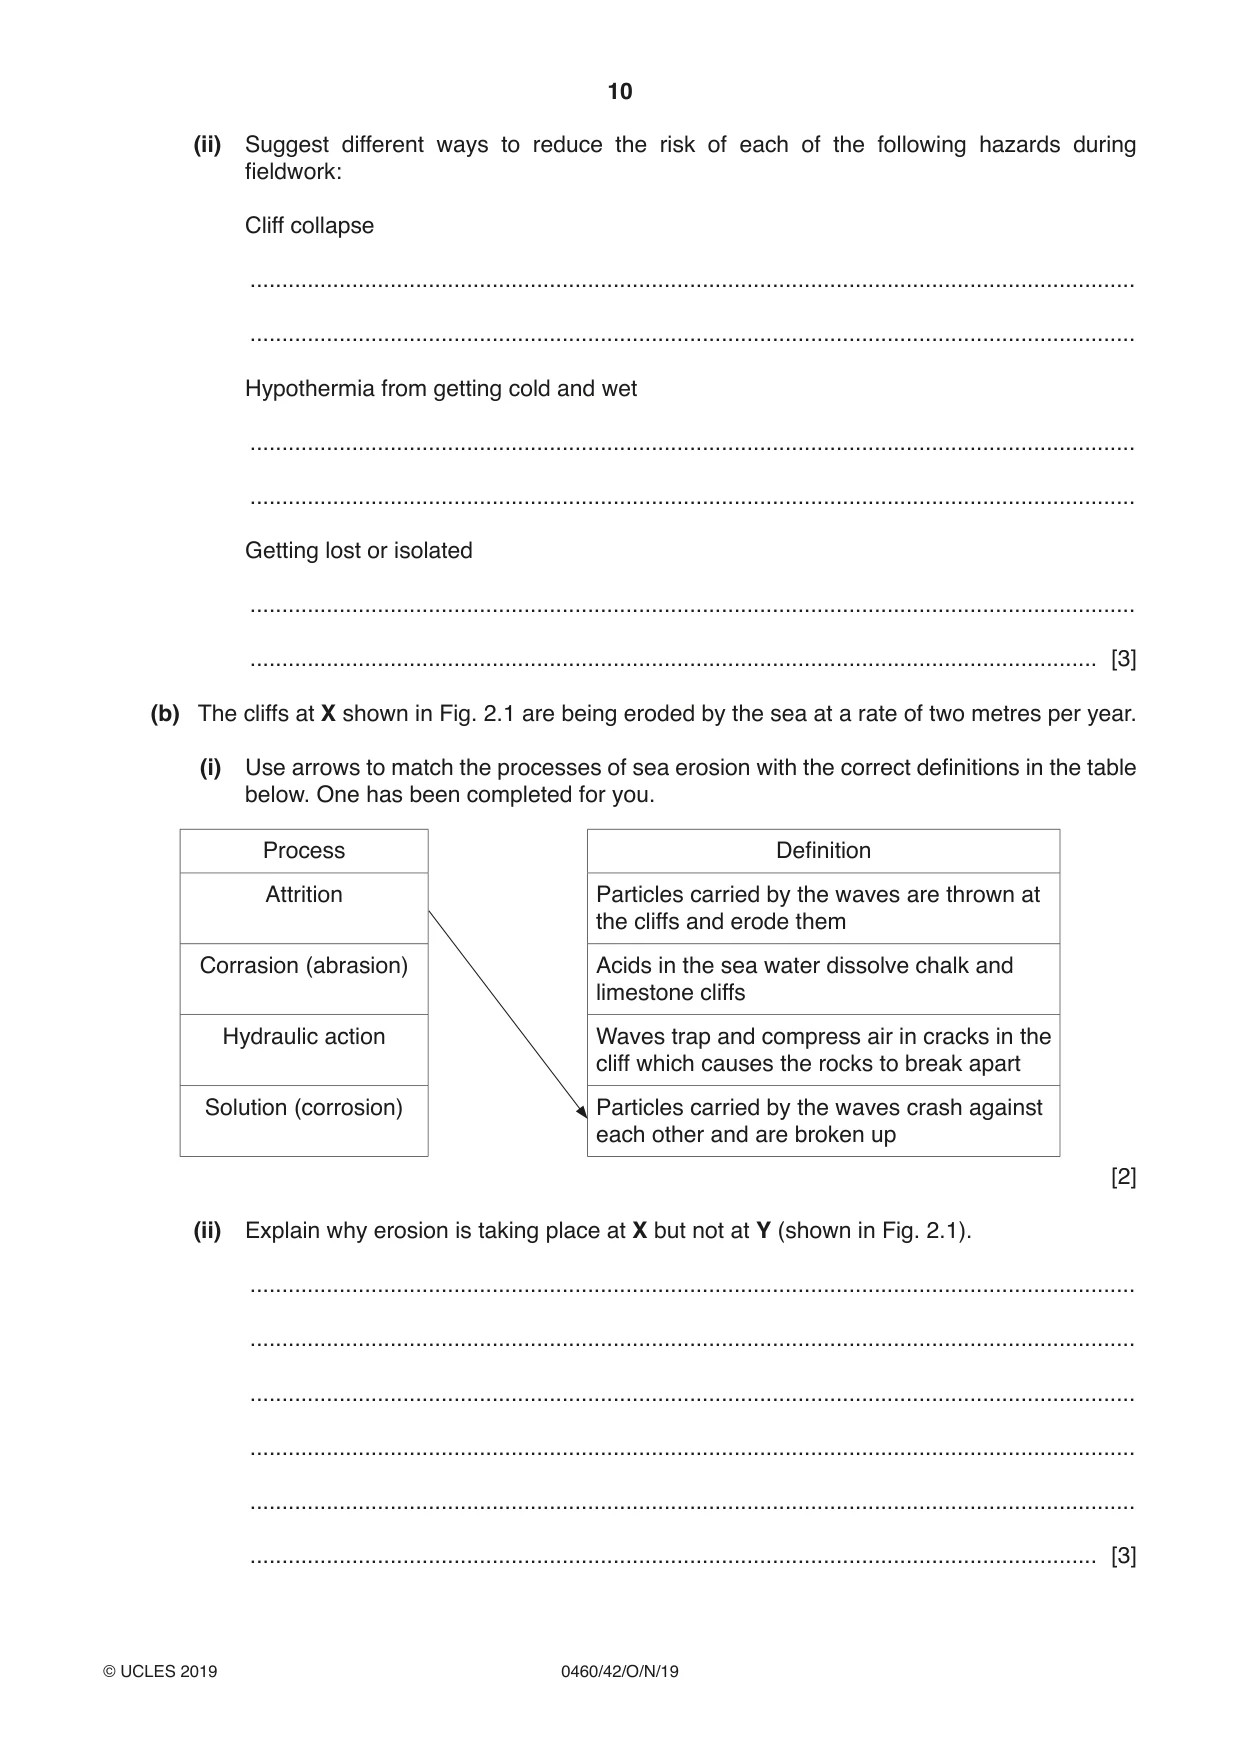
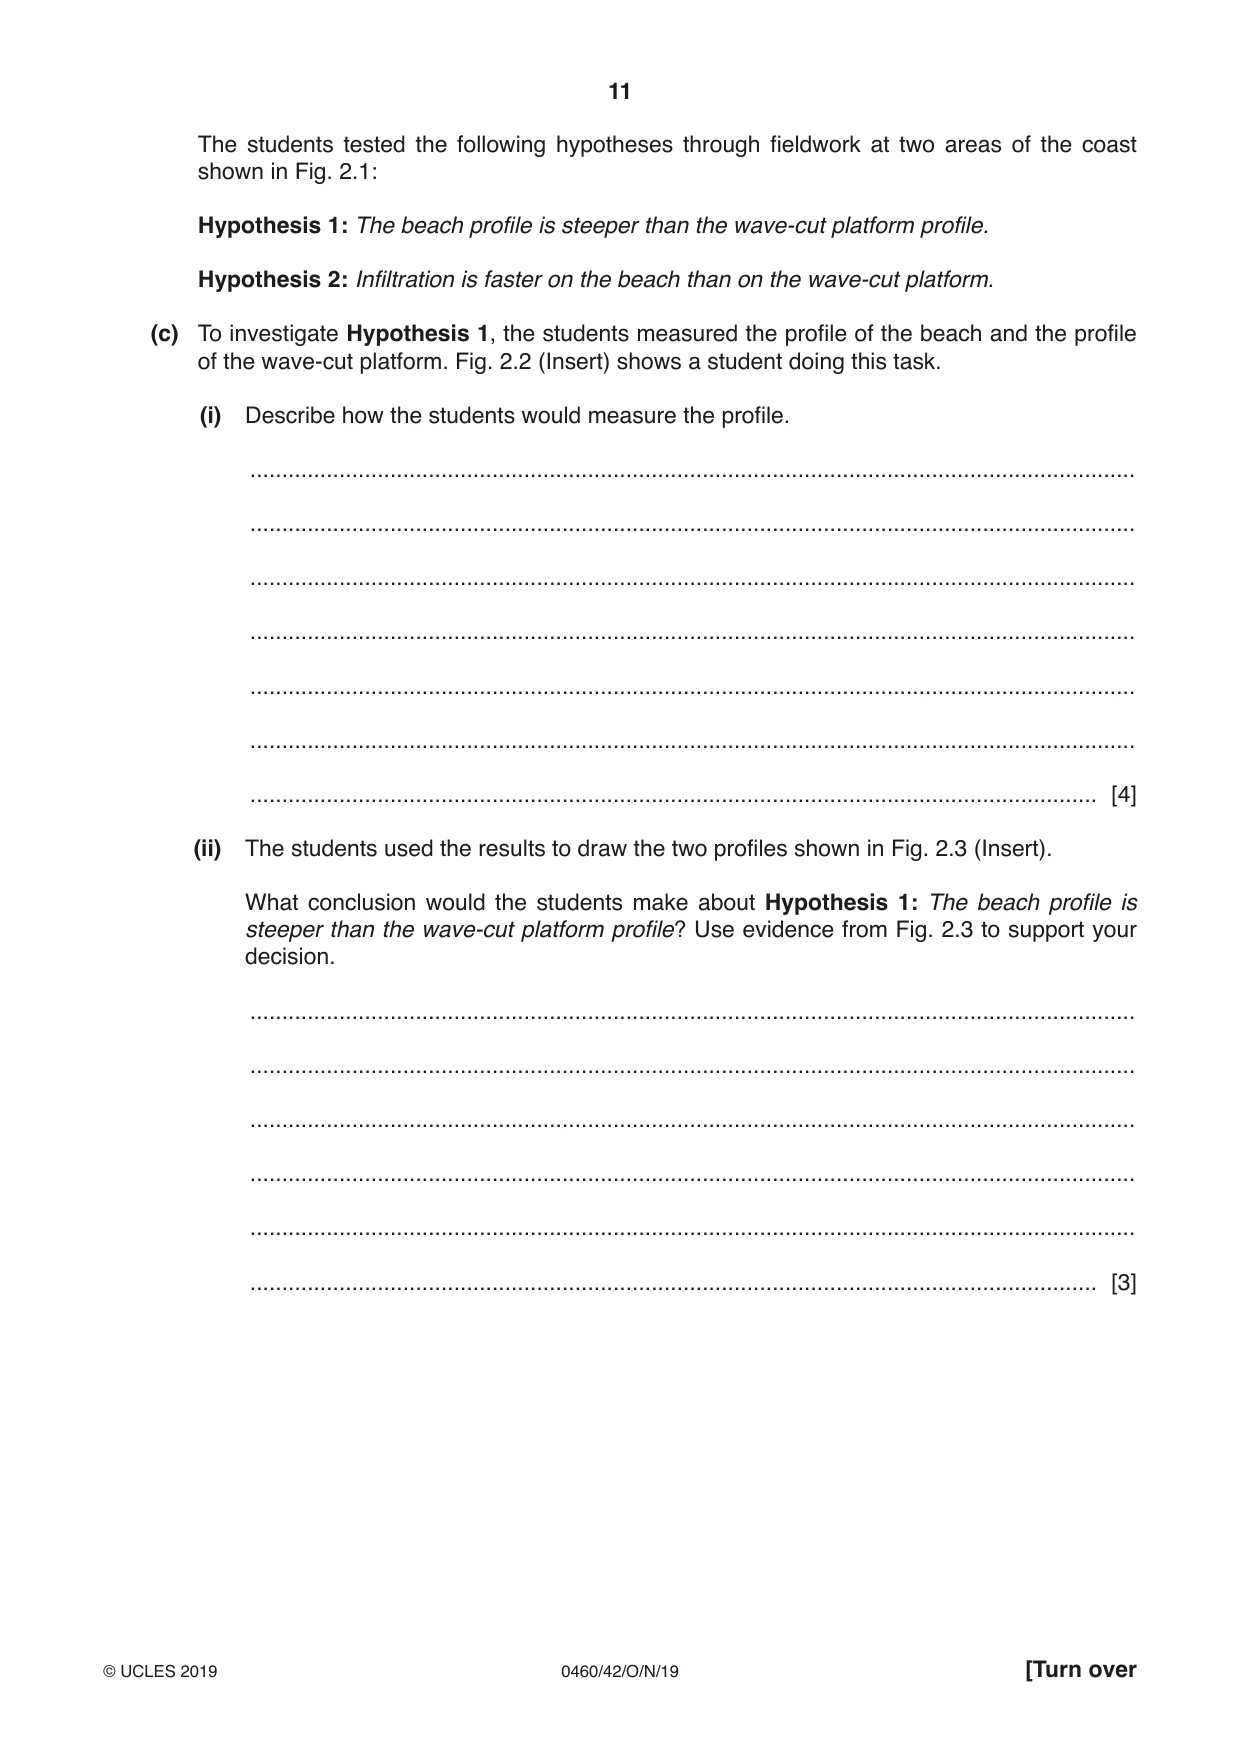
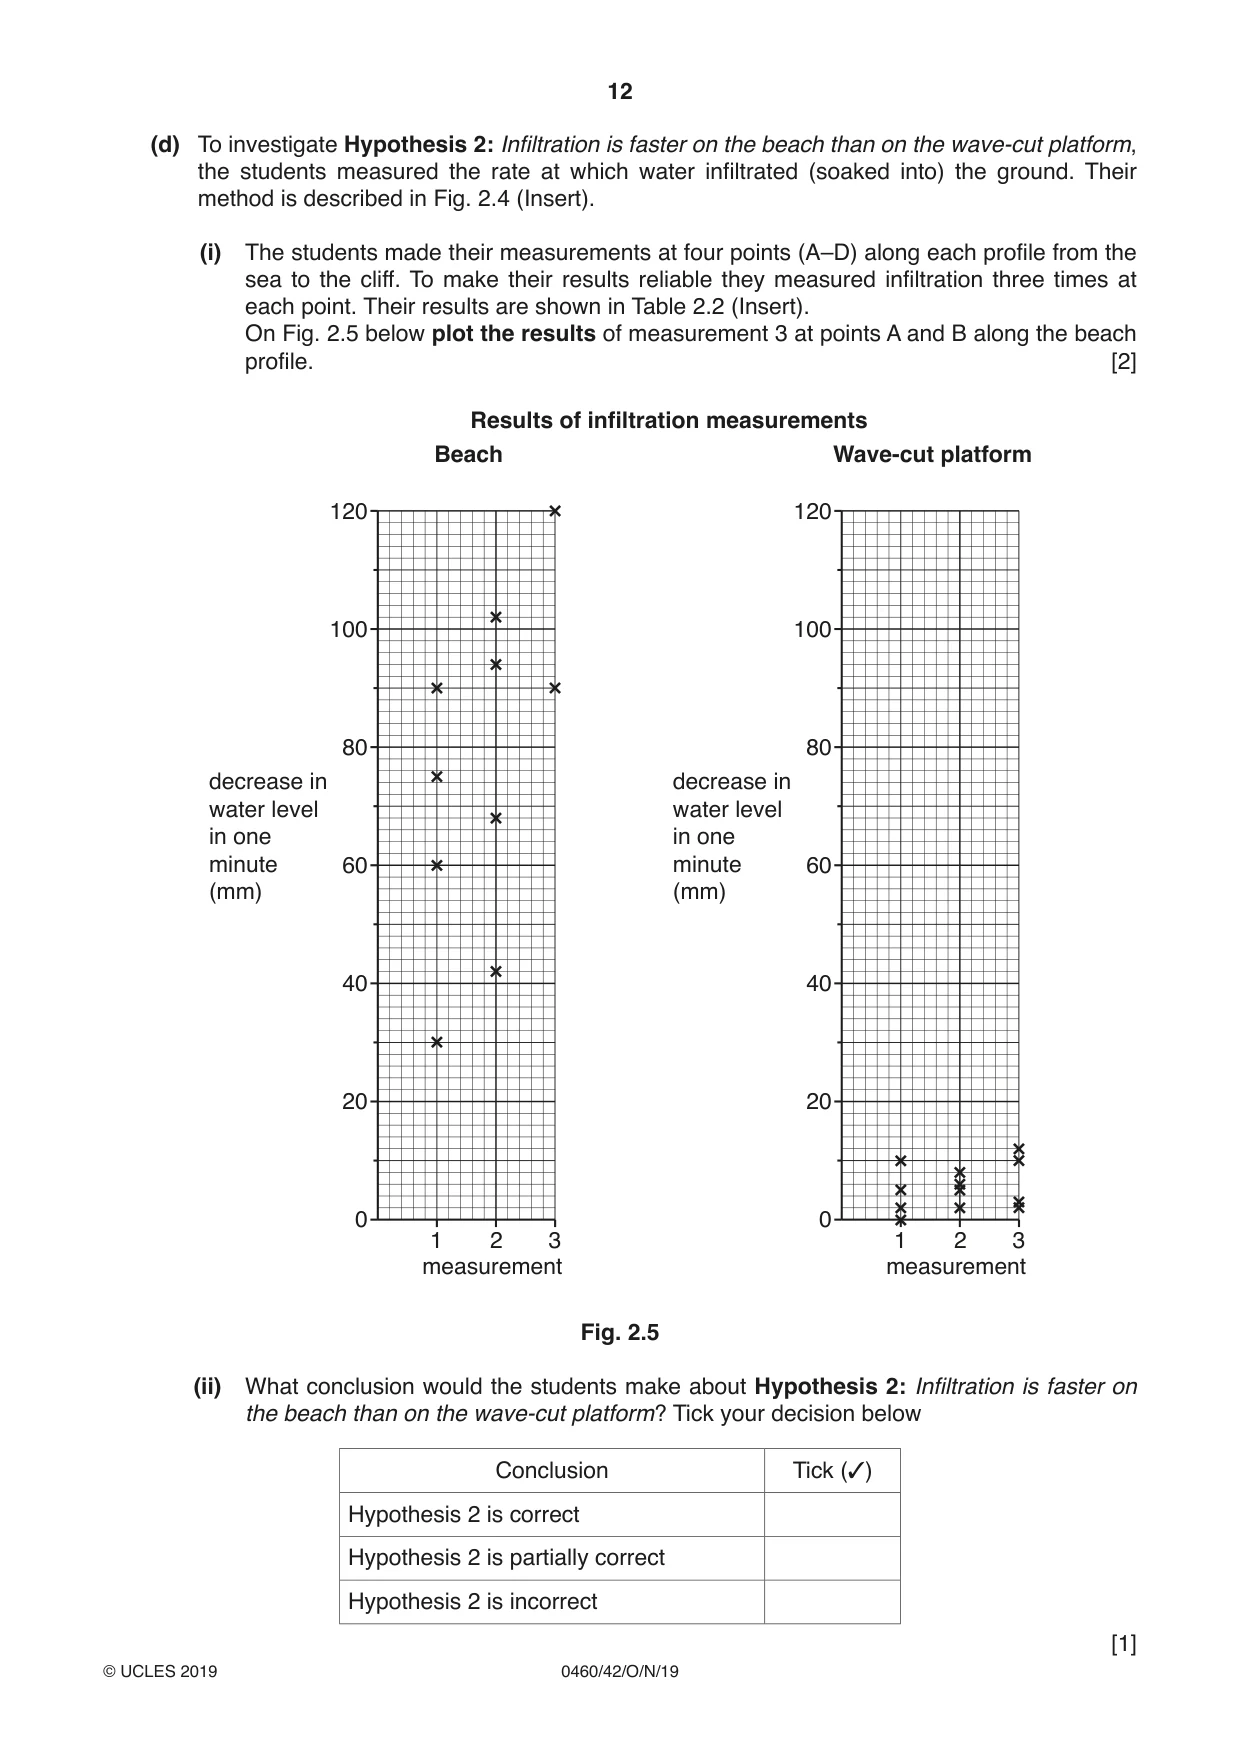
2 Students carried out fieldwork at a popular tourist beach in south east England. The cliffs behind the beach are being eroded by the sea, especially where they are unprotected. The area is shown in Fig. 2.1 (Insert). (a) Before they began their fieldwork, the students assessed the possible hazards they may come across and how to manage them. Their decisions are shown in Table 2.1 below. Table 2.1 Risk assessment Hazard Likelihood Severity Risk Management Slipping, tripping or 4 2 8 Wear suitable footwear falling and avoid slippery surfaces Cliff collapse 2 5 10 Drowning in the sea 1 5 5 Beware of sea currents and do not go into the sea when it is rough Hypothermia from 4 3 12 getting cold and wet Sharp pebbles or 3 3 9 Be careful when objects handling objects and do not throw pebbles Getting lost or 2 3 6 isolated Likelihood of encountering hazard: 1 (little chance) to 5 (greatest chance) Severity of hazard: 1 (not likely to be dangerous) to 5 (very dangerous) Risk = likelihood of encountering hazard × severity of hazard (i) Which one of the possible hazards did the students think was the greatest risk? ..................................................................................................................................... [1] (ii) Suggest different ways to reduce the risk of each of the following hazards during fieldwork: Cliff collapse ........................................................................................................................................... ........................................................................................................................................... Hypothermia from getting cold and wet ........................................................................................................................................... ........................................................................................................................................... Getting lost or isolated ........................................................................................................................................... ..................................................................................................................................... [3] (b) The cliffs at X shown in Fig. 2.1 are being eroded by the sea at a rate of two metres per year. (i) Use arrows to match the processes of sea erosion with the correct definitions in the table below. One has been completed for you. Process Definition Attrition Particles carried by the waves are thrown at the cliffs and erode them Corrasion (abrasion) Acids in the sea water dissolve chalk and limestone cliffs Hydraulic action Waves trap and compress air in cracks in the cliff which causes the rocks to break apart Solution (corrosion) Particles carried by the waves crash against each other and are broken up [2] (ii) Explain why erosion is taking place at X but not at Y (shown in Fig. 2.1). ........................................................................................................................................... ........................................................................................................................................... ........................................................................................................................................... ........................................................................................................................................... ........................................................................................................................................... ..................................................................................................................................... [3] The students tested the following hypotheses through fieldwork at two areas of the coast shown in Fig. 2.1: Hypothesis 1: The beach profile is steeper than the wave-cut platform profile. Hypothesis 2: Infiltration is faster on the beach than on the wave-cut platform. (c) To investigate Hypothesis 1, the students measured the profile of the beach and the profile of the wave-cut platform. Fig. 2.2 (Insert) shows a student doing this task. (i) Describe how the students would measure the profile. ........................................................................................................................................... ........................................................................................................................................... ........................................................................................................................................... ........................................................................................................................................... ........................................................................................................................................... ........................................................................................................................................... ..................................................................................................................................... [4] (ii) The students used the results to draw the two profiles shown in Fig. 2.3 (Insert). What conclusion would the students make about Hypothesis 1: The beach profile is steeper than the wave-cut platform profile? Use evidence from Fig. 2.3 to support your decision. ........................................................................................................................................... ........................................................................................................................................... ........................................................................................................................................... ........................................................................................................................................... ........................................................................................................................................... ..................................................................................................................................... [3]
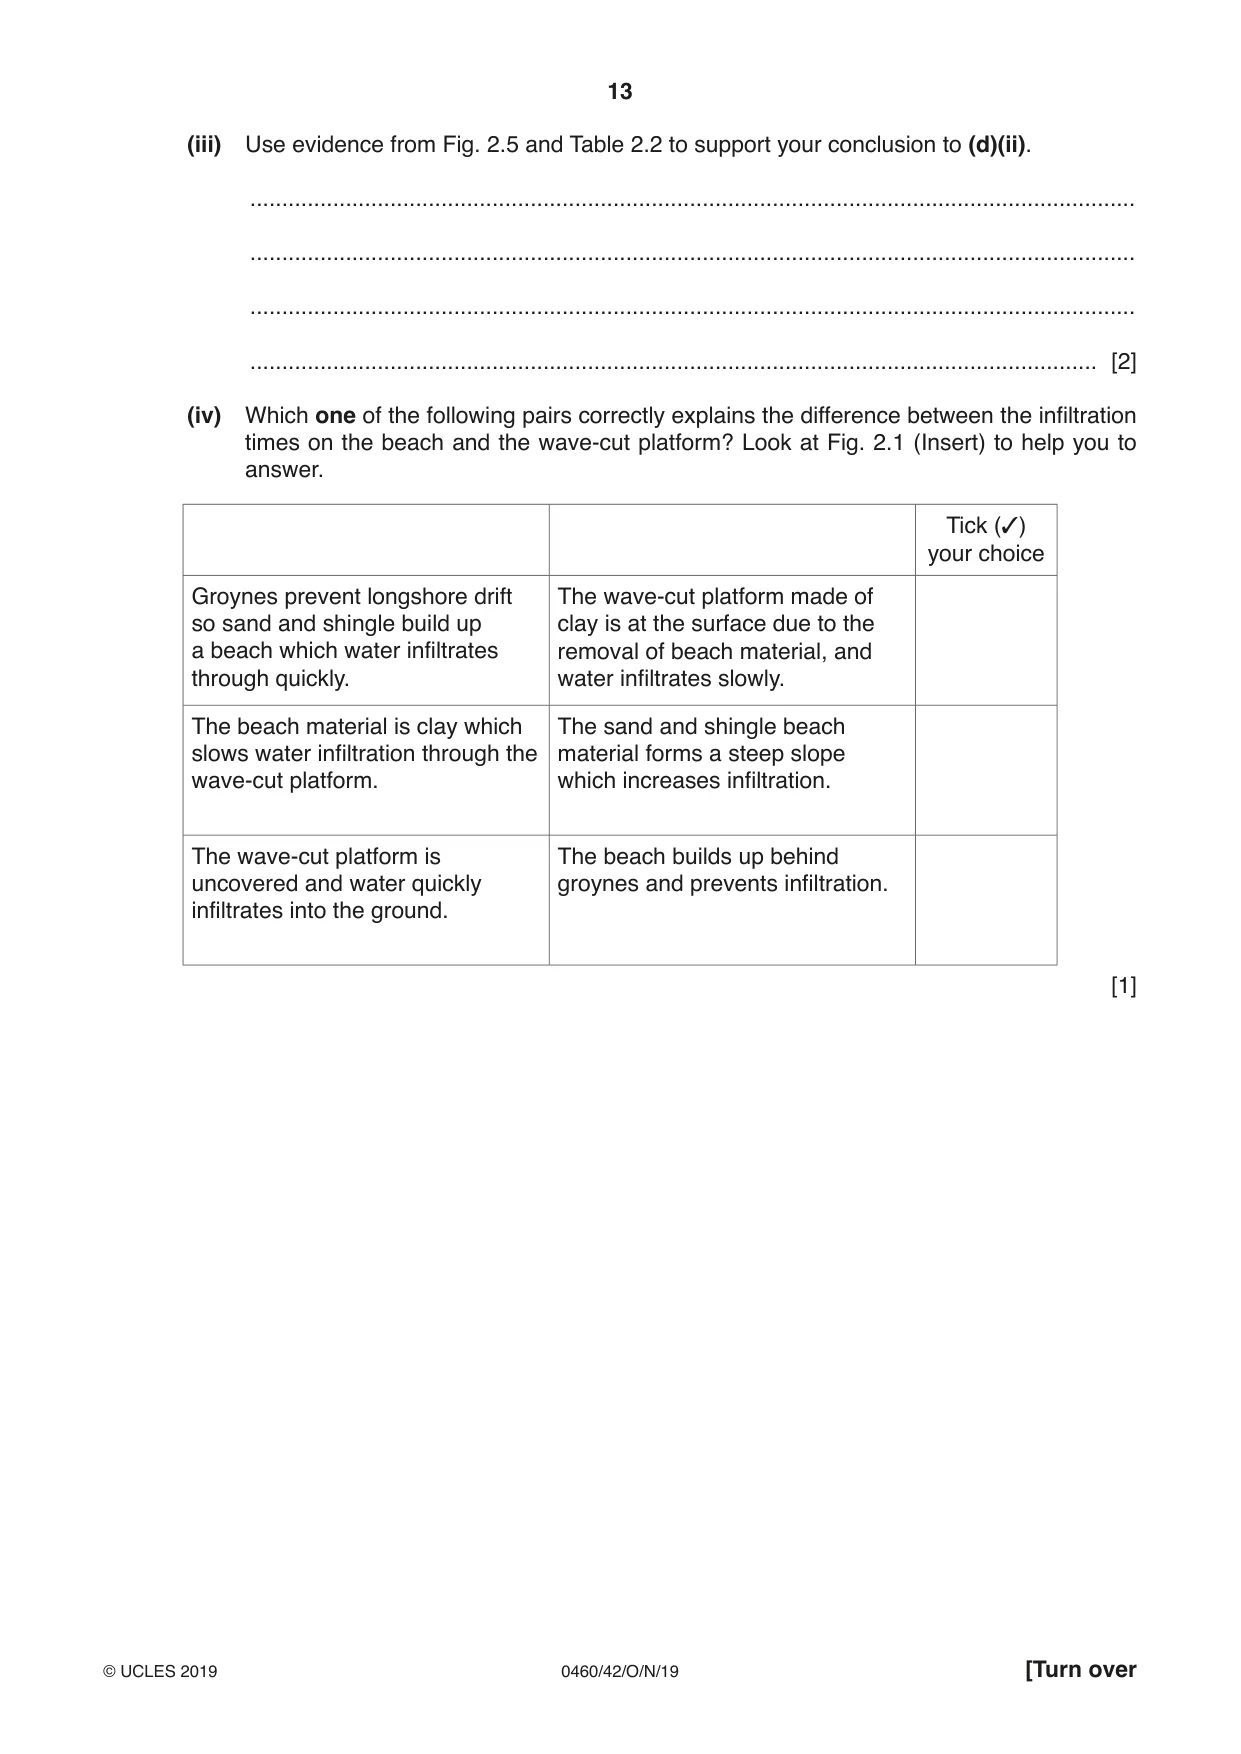
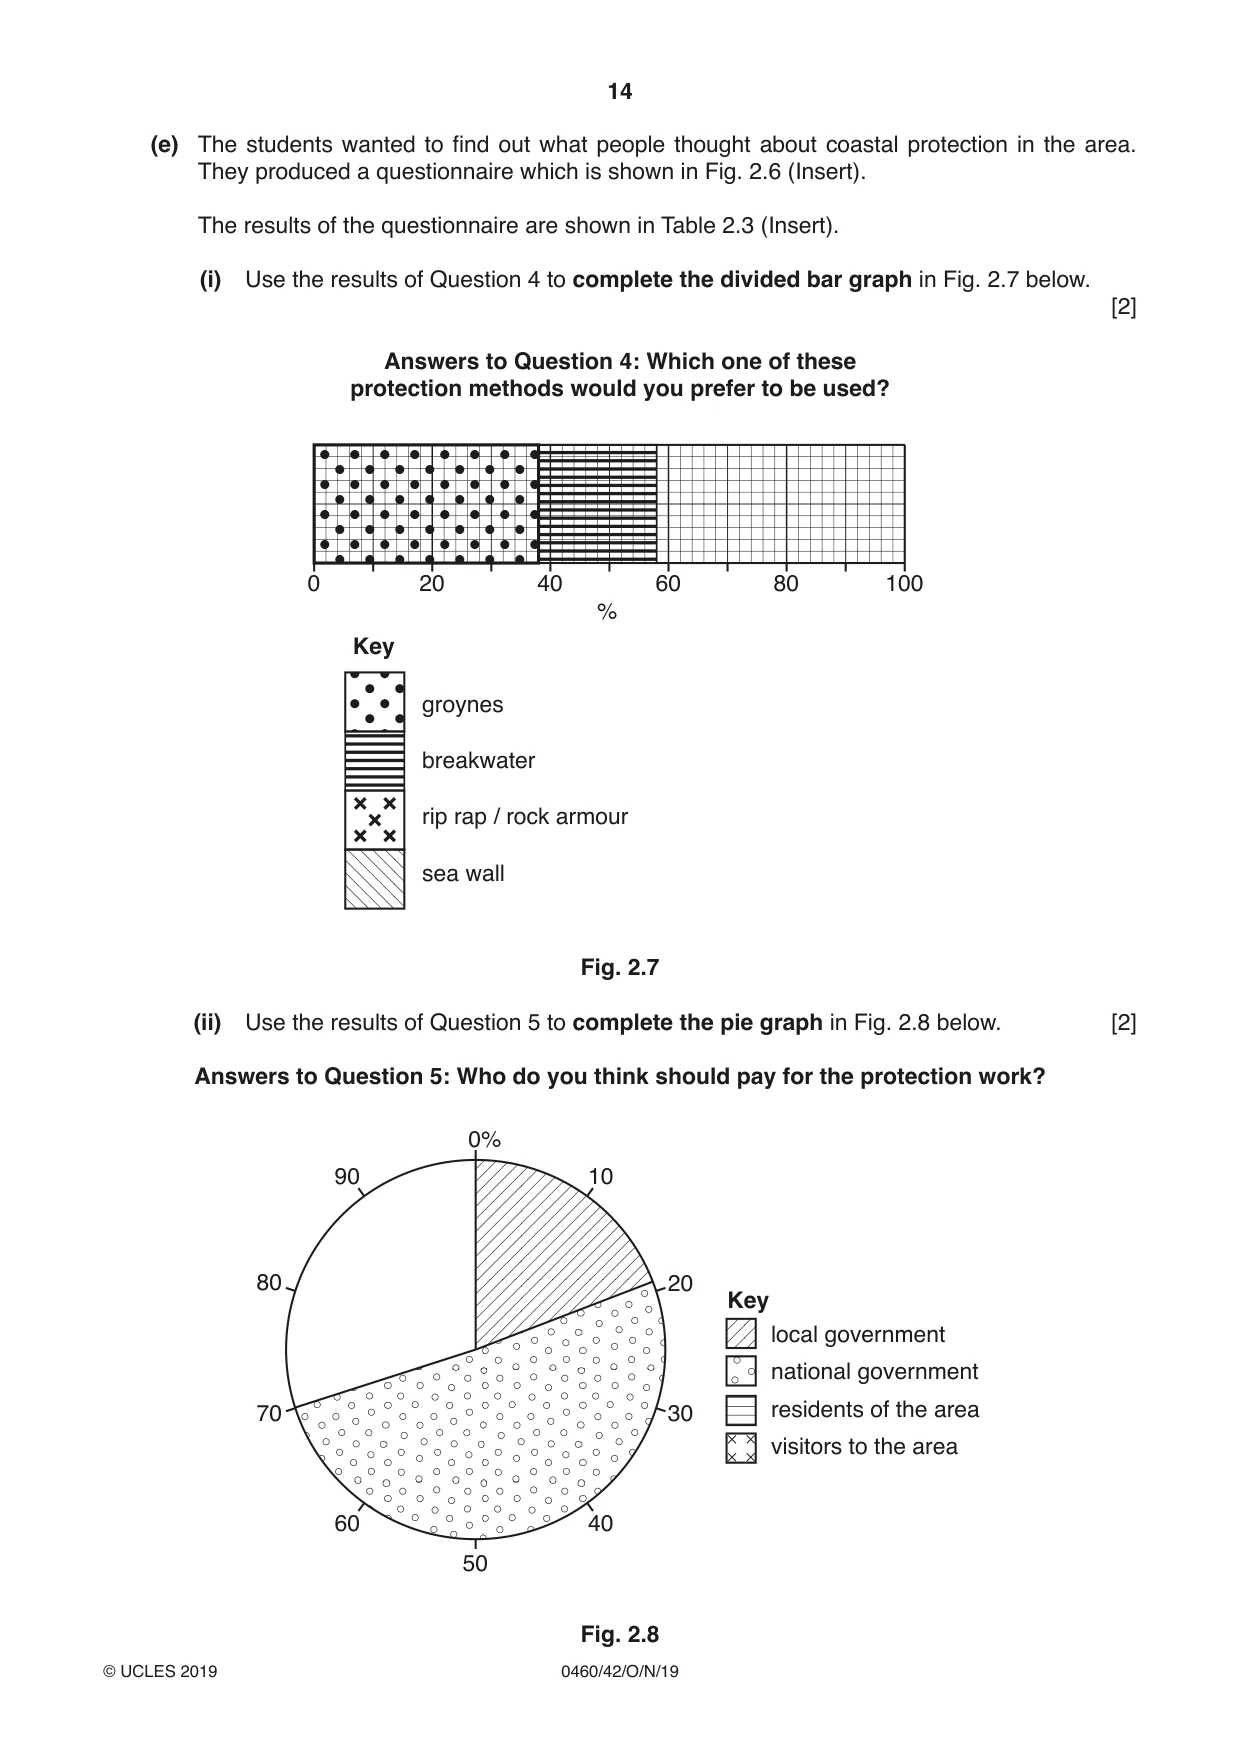
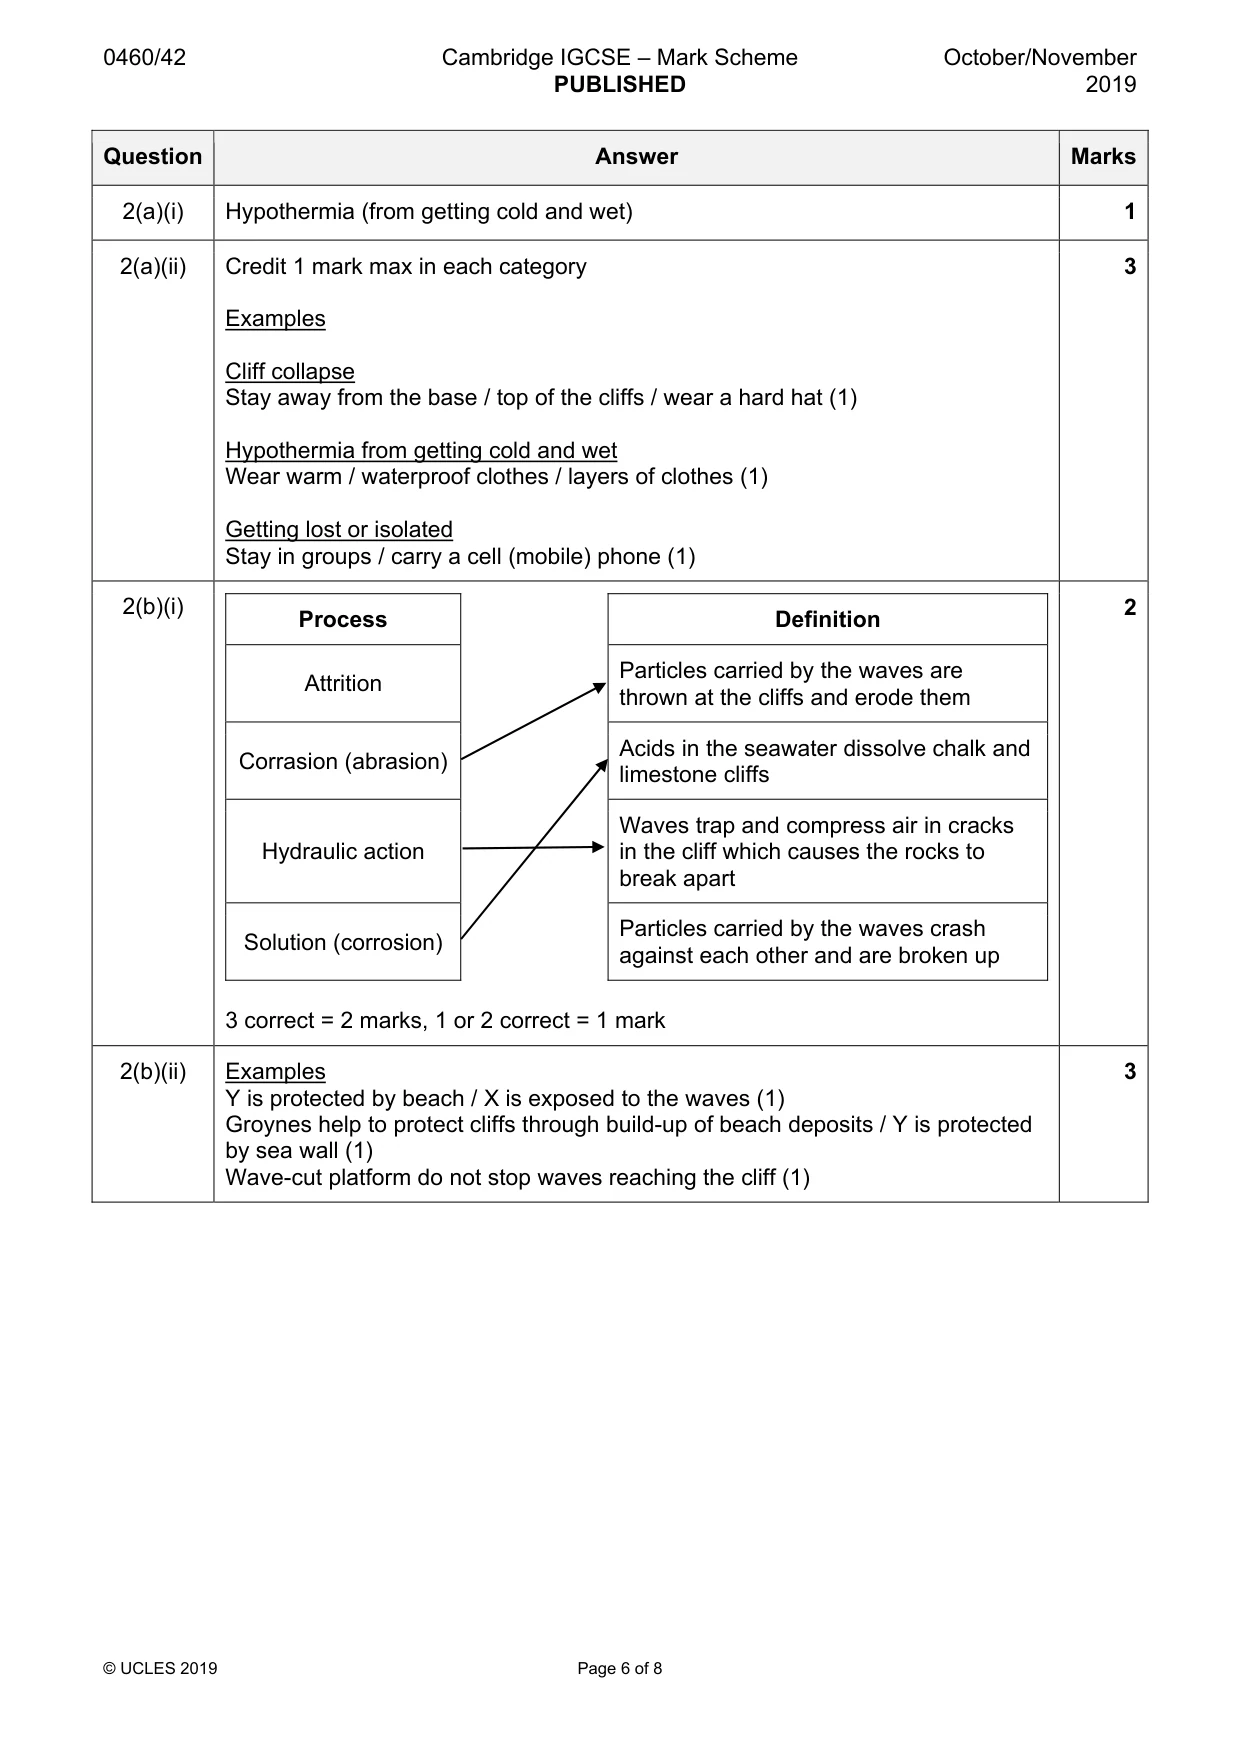
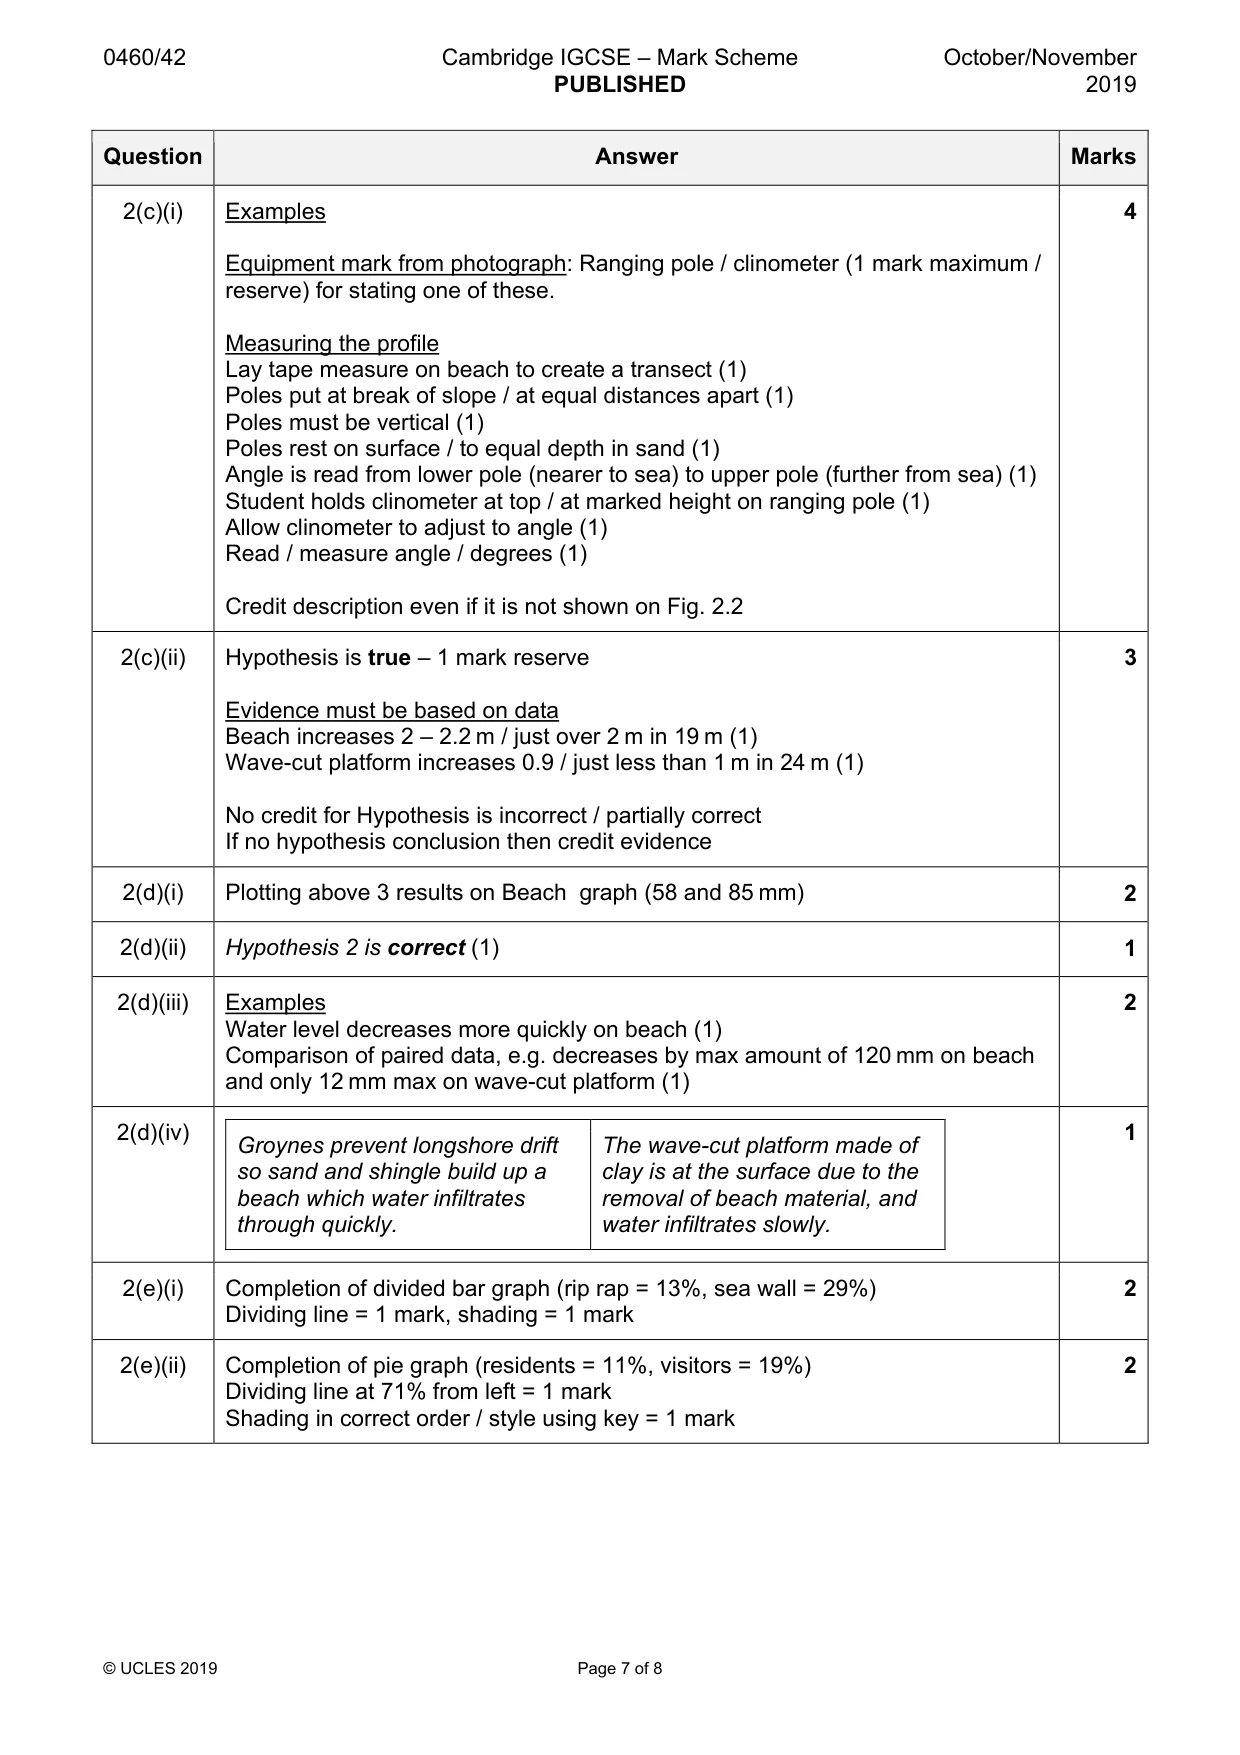
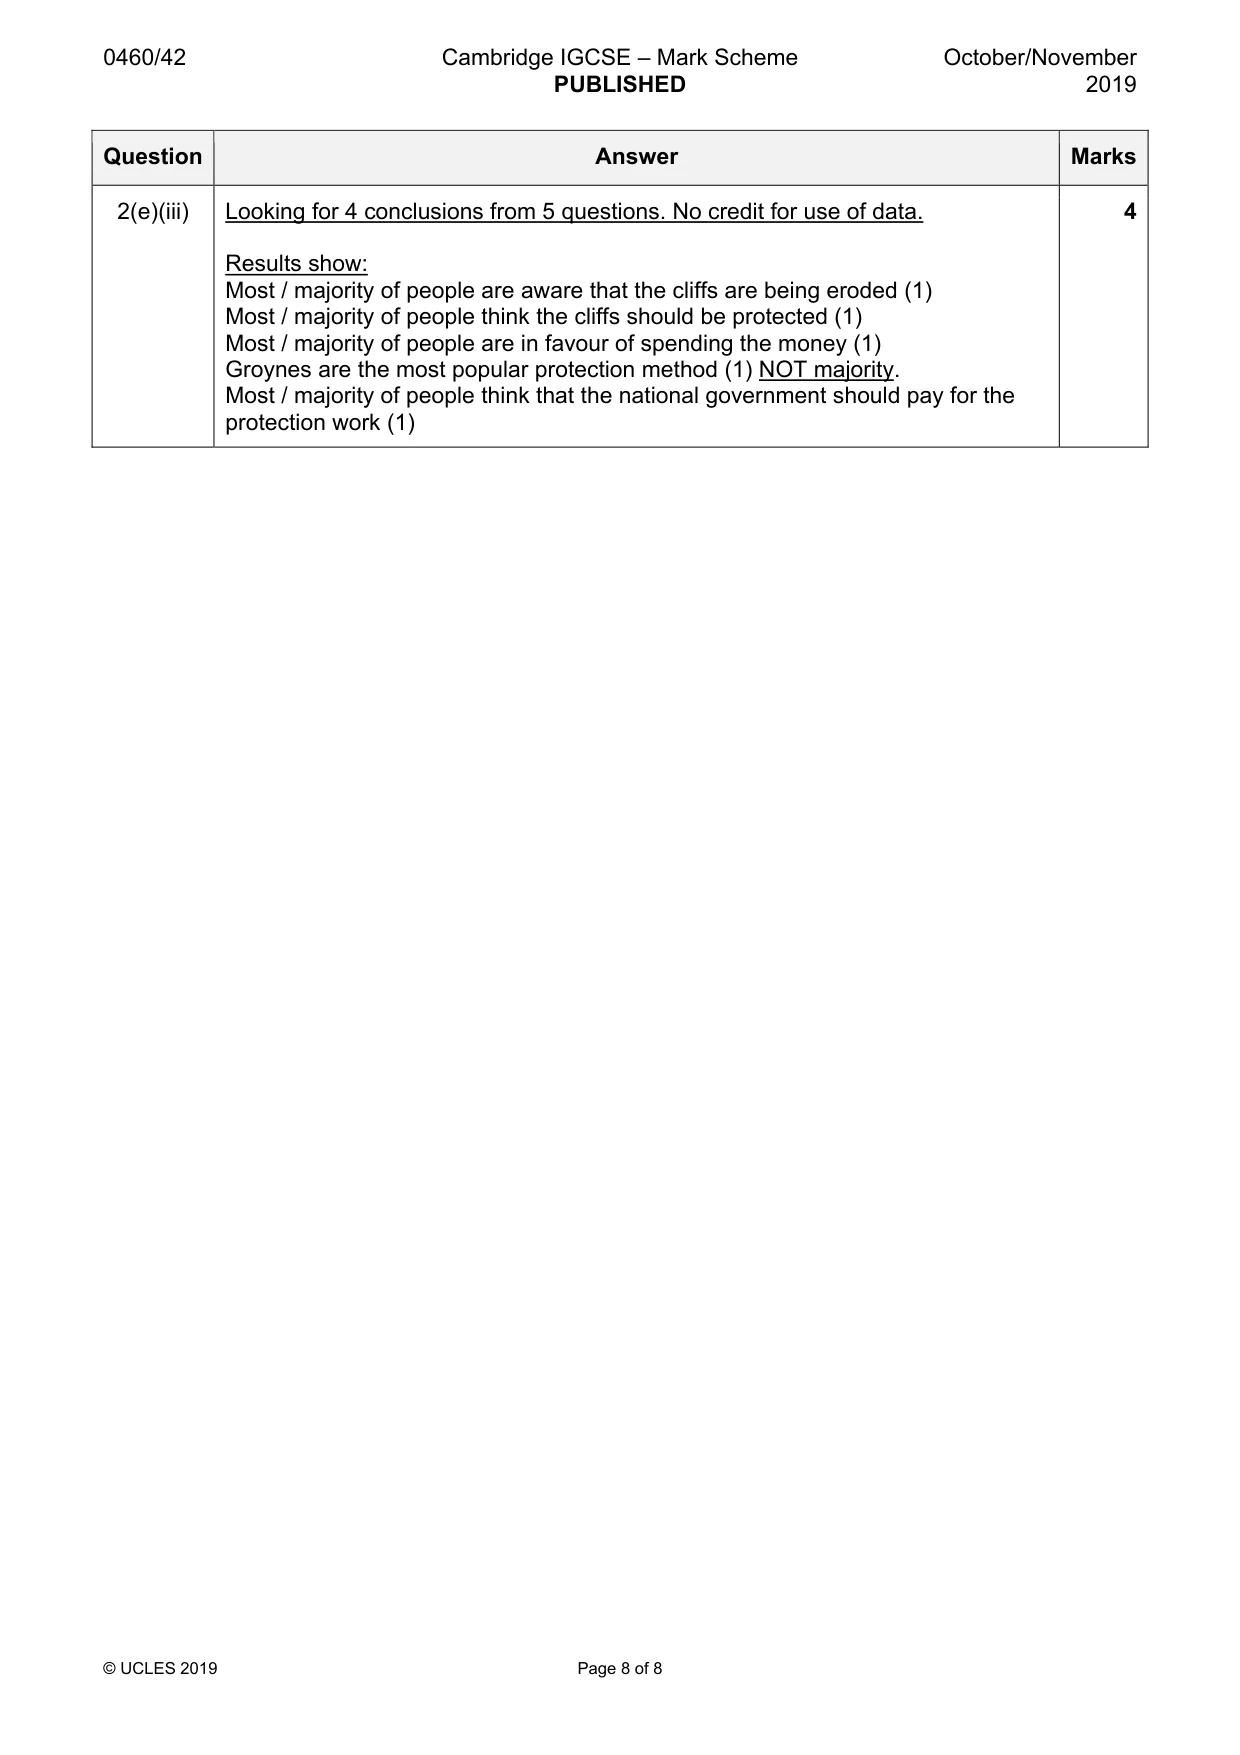
Mark scheme: 2(a)(i) Hypothermia (from getting cold and wet) 1 2(a)(ii) Credit 1 mark max in each category 3 Examples Cliff collapse Stay away from the base / top of the cliffs / wear a hard hat (1) Hypothermia from getting cold and wet Wear warm / waterproof clothes / layers of clothes (1) Getting lost or isolated Stay in groups / carry a cell (mobile) phone (1) 2(b)(i) 2 Process Definition Particles carried by the waves are Attrition thrown at the cliffs and erode them Acids in the seawater dissolve chalk and Corrasion (abrasion) limestone cliffs Waves trap and compress air in cracks Hydraulic action in the cliff which causes the rocks to break apart Particles carried by the waves crash Solution (corrosion) against each other and are broken up 3 correct = 2 marks, 1 or 2 correct = 1 mark 2(b)(ii) Examples 3 Y is protected by beach / X is exposed to the waves (1) Groynes help to protect cliffs through build-up of beach deposits / Y is protected by sea wall (1) Wave-cut platform do not stop waves reaching the cliff (1) 2(c)(i) Examples 4 Equipment mark from photograph: Ranging pole / clinometer (1 mark maximum / reserve) for stating one of these. Measuring the profile Lay tape measure on beach to create a transect (1) Poles put at break of slope / at equal distances apart (1) Poles must be vertical (1) Poles rest on surface / to equal depth in sand (1) Angle is read from lower pole (nearer to sea) to upper pole (further from sea) (1) Student holds clinometer at top / at marked height on ranging pole (1) Allow clinometer to adjust to angle (1) Read / measure angle / degrees (1) Credit description even if it is not shown on Fig. 2.2 2(c)(ii) Hypothesis is true – 1 mark reserve 3 Evidence must be based on data Beach increases 2 – 2.2 m / just over 2 m in 19 m (1) Wave-cut platform increases 0.9 / just less than 1 m in 24 m (1) No credit for Hypothesis is incorrect / partially correct If no hypothesis conclusion then credit evidence 2(d)(i) Plotting above 3 results on Beach graph (58 and 85 mm) 2 2(d)(ii) Hypothesis 2 is correct (1) 1 2(d)(iii) Examples 2 Water level decreases more quickly on beach (1) Comparison of paired data, e.g. decreases by max amount of 120 mm on beach and only 12 mm max on wave-cut platform (1) 2(d)(iv) 1 Groynes prevent longshore drift The wave-cut platform made of so sand and shingle build up a clay is at the surface due to the beach which water infiltrates removal of beach material, and through quickly. water infiltrates slowly. 2(e)(i) Completion of divided bar graph (rip rap = 13%, sea wall = 29%) 2 Dividing line = 1 mark, shading = 1 mark 2(e)(ii) Completion of pie graph (residents = 11%, visitors = 19%) 2 Dividing line at 71% from left = 1 mark Shading in correct order / style using key = 1 mark 2(e)(iii) Looking for 4 conclusions from 5 questions. No credit for use of data. 4 Results show: Most / majority of people are aware that the cliffs are being eroded (1) Most / majority of people think the cliffs should be protected (1) Most / majority of people are in favour of spending the money (1) Groynes are the most popular protection method (1) NOT majority. Most / majority of people think that the national government should pay for the protection work (1)
What was in this paper
The subtopics covered by these 2 questions, and how many questions each got. Open one in a new tab to see every Cambridge question on it.
What you needed in this session
Cambridge’s own grade thresholds for 2019 Oct/Nov, Paper 4 · Variant 2. A higher threshold means an easier paper — the bar moves with how the cohort did.