Cambridge IGCSE Geography 0460 — 2019 Oct/Nov Paper 4 · Variant 1
0460/41/O/N/19 · 2 questions · 60 marks · ≈68 min
The question paper and its mark scheme, free to read here and free to download. This is Cambridge’s own paper, exactly as it was sat.
Question paper16 pages







Mark scheme7 pages
Answers below. Sit the paper first if you are practising.

Questions as text
Q1 · A class of students investigated a local high technology industrial area
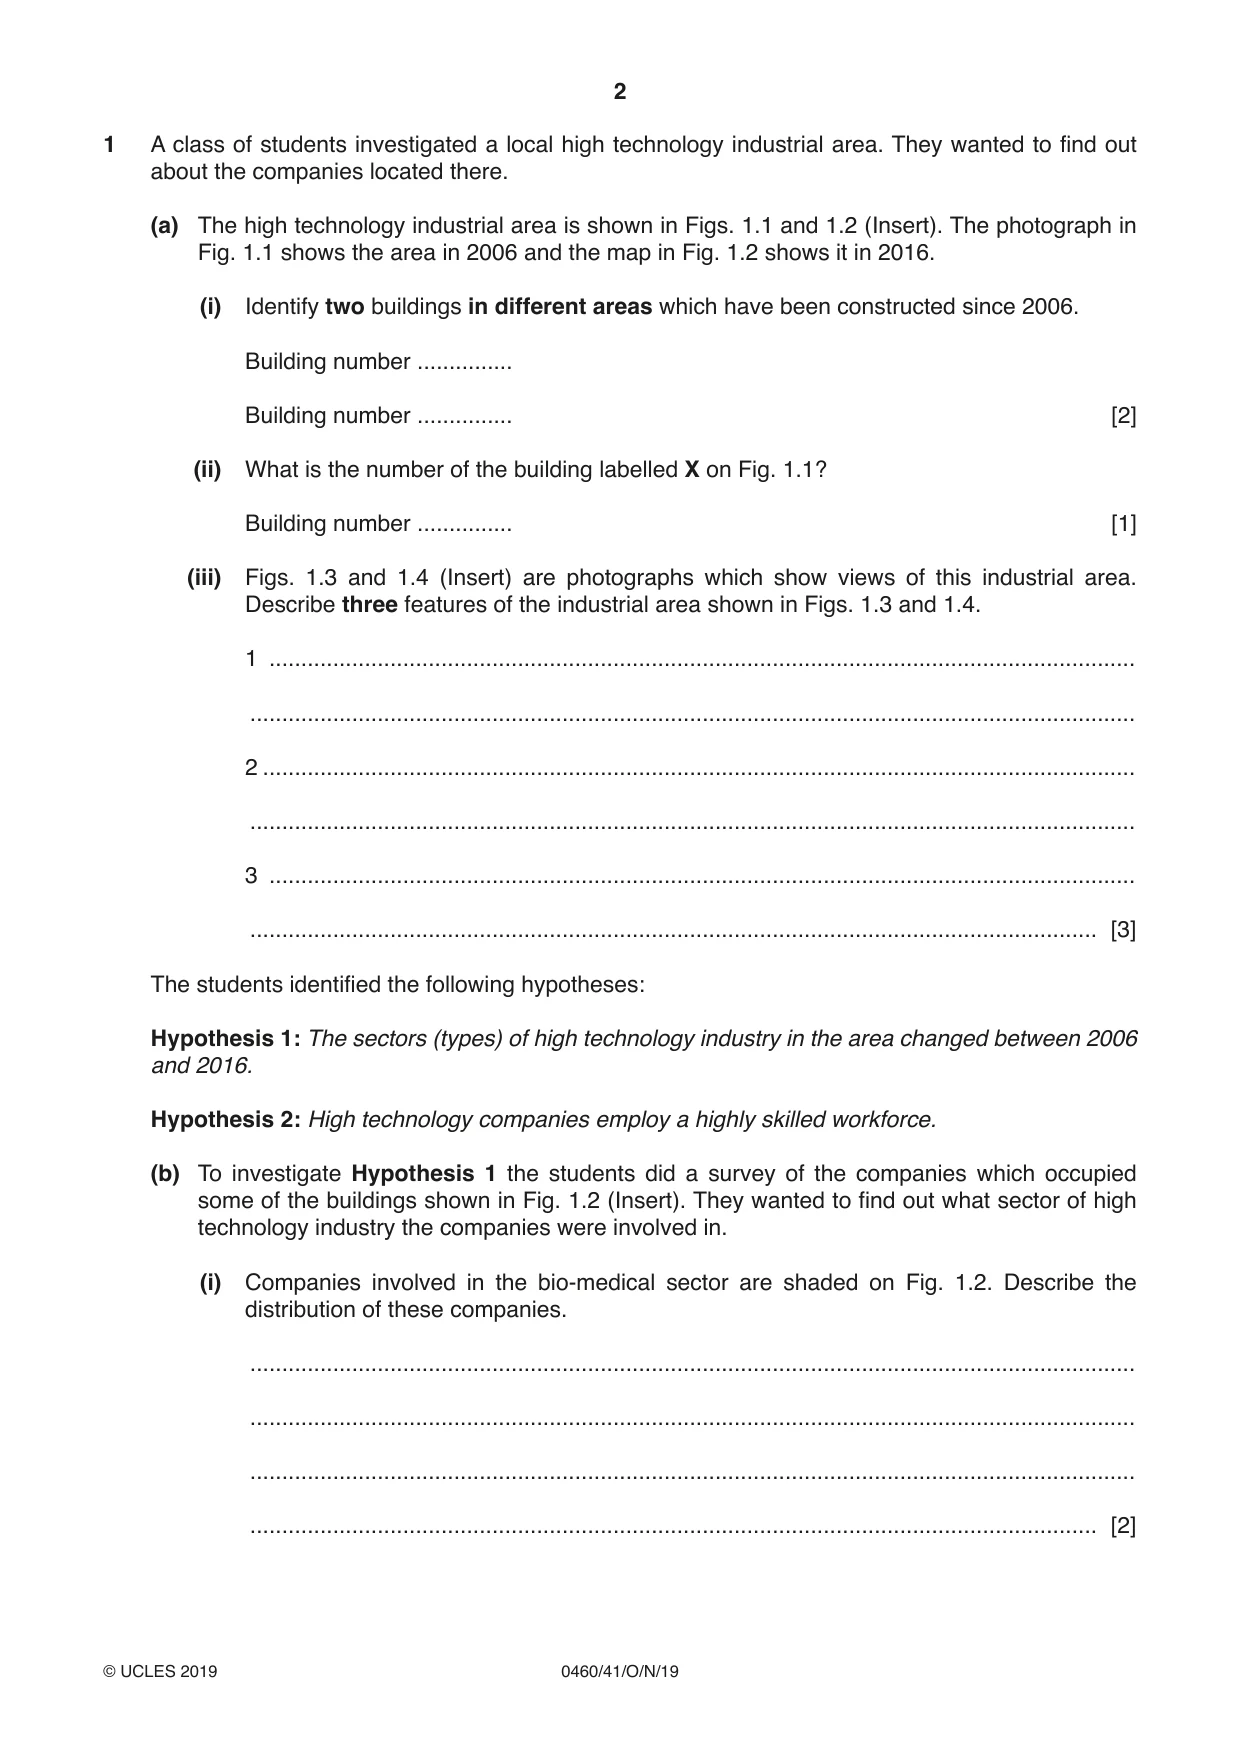
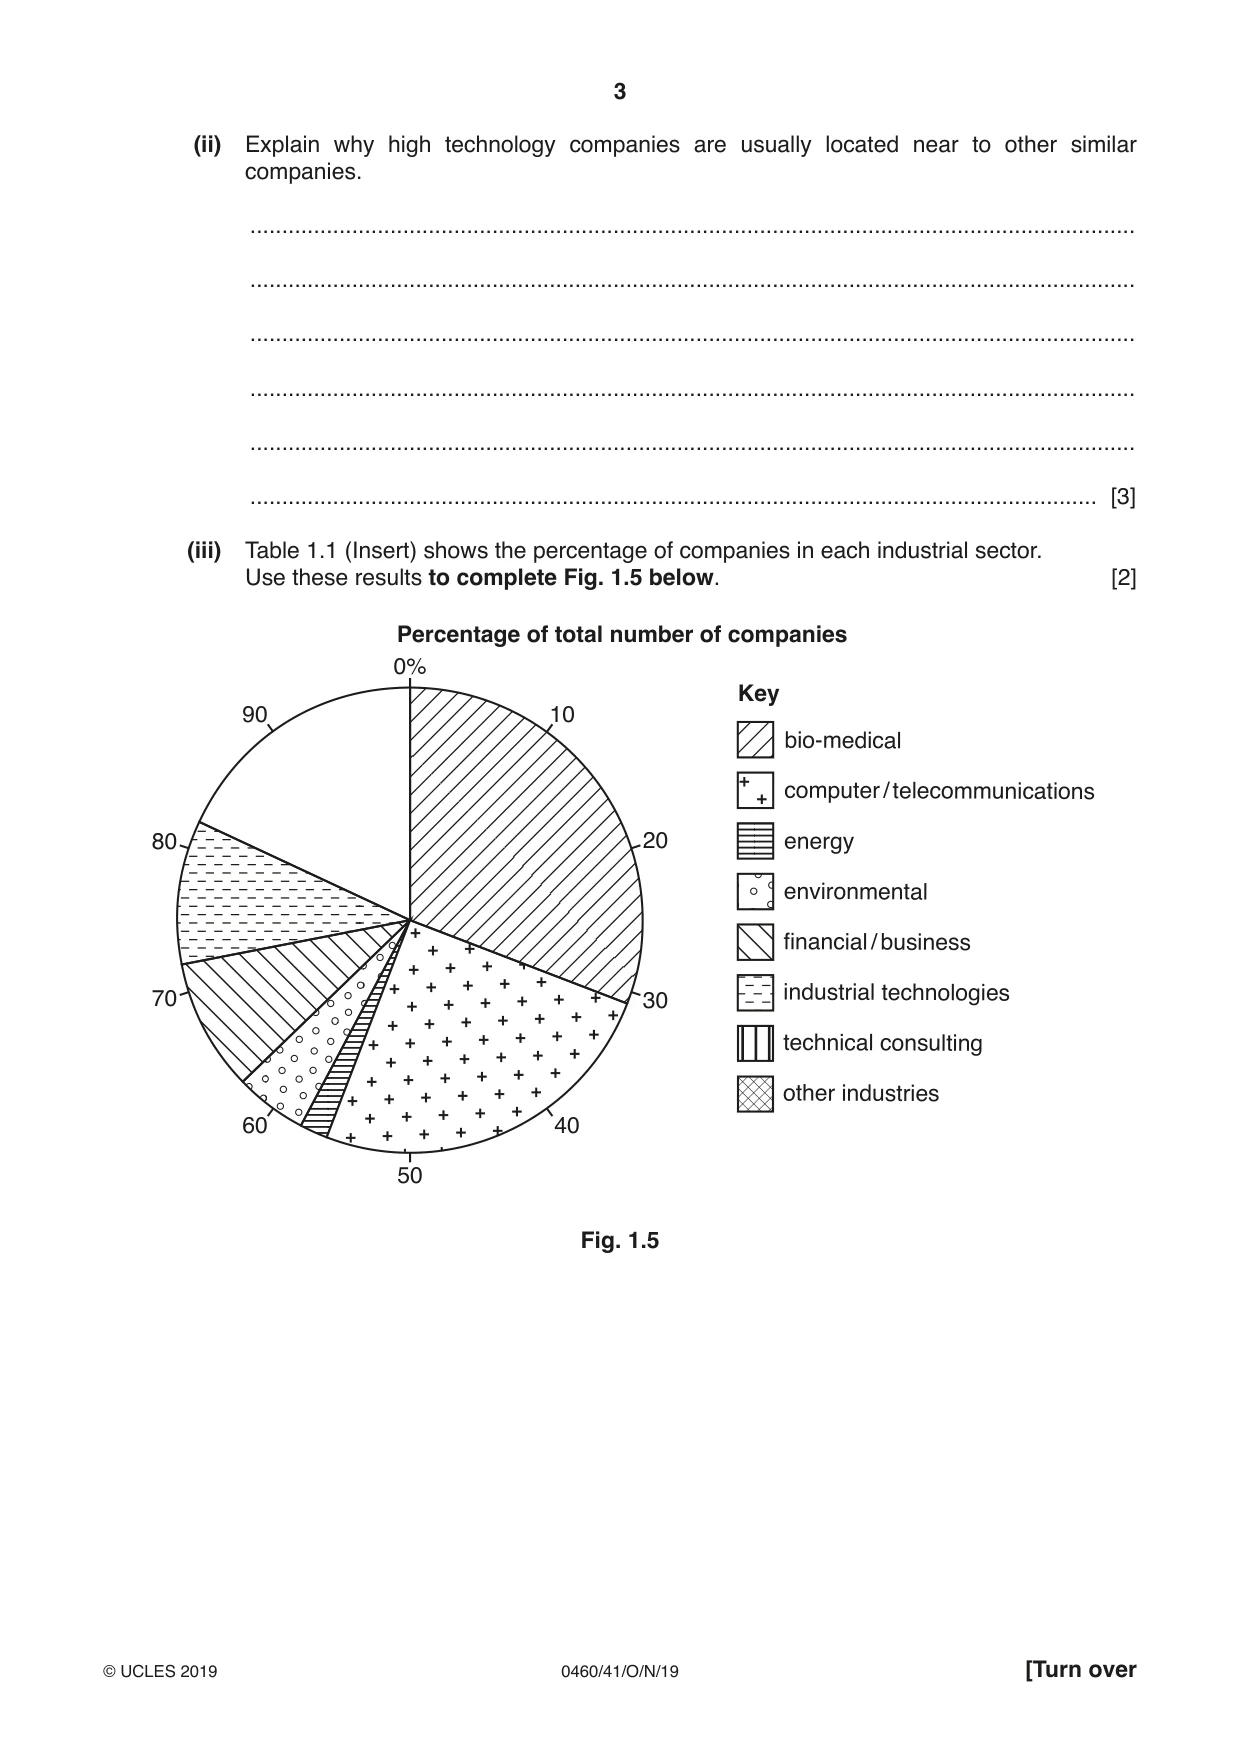
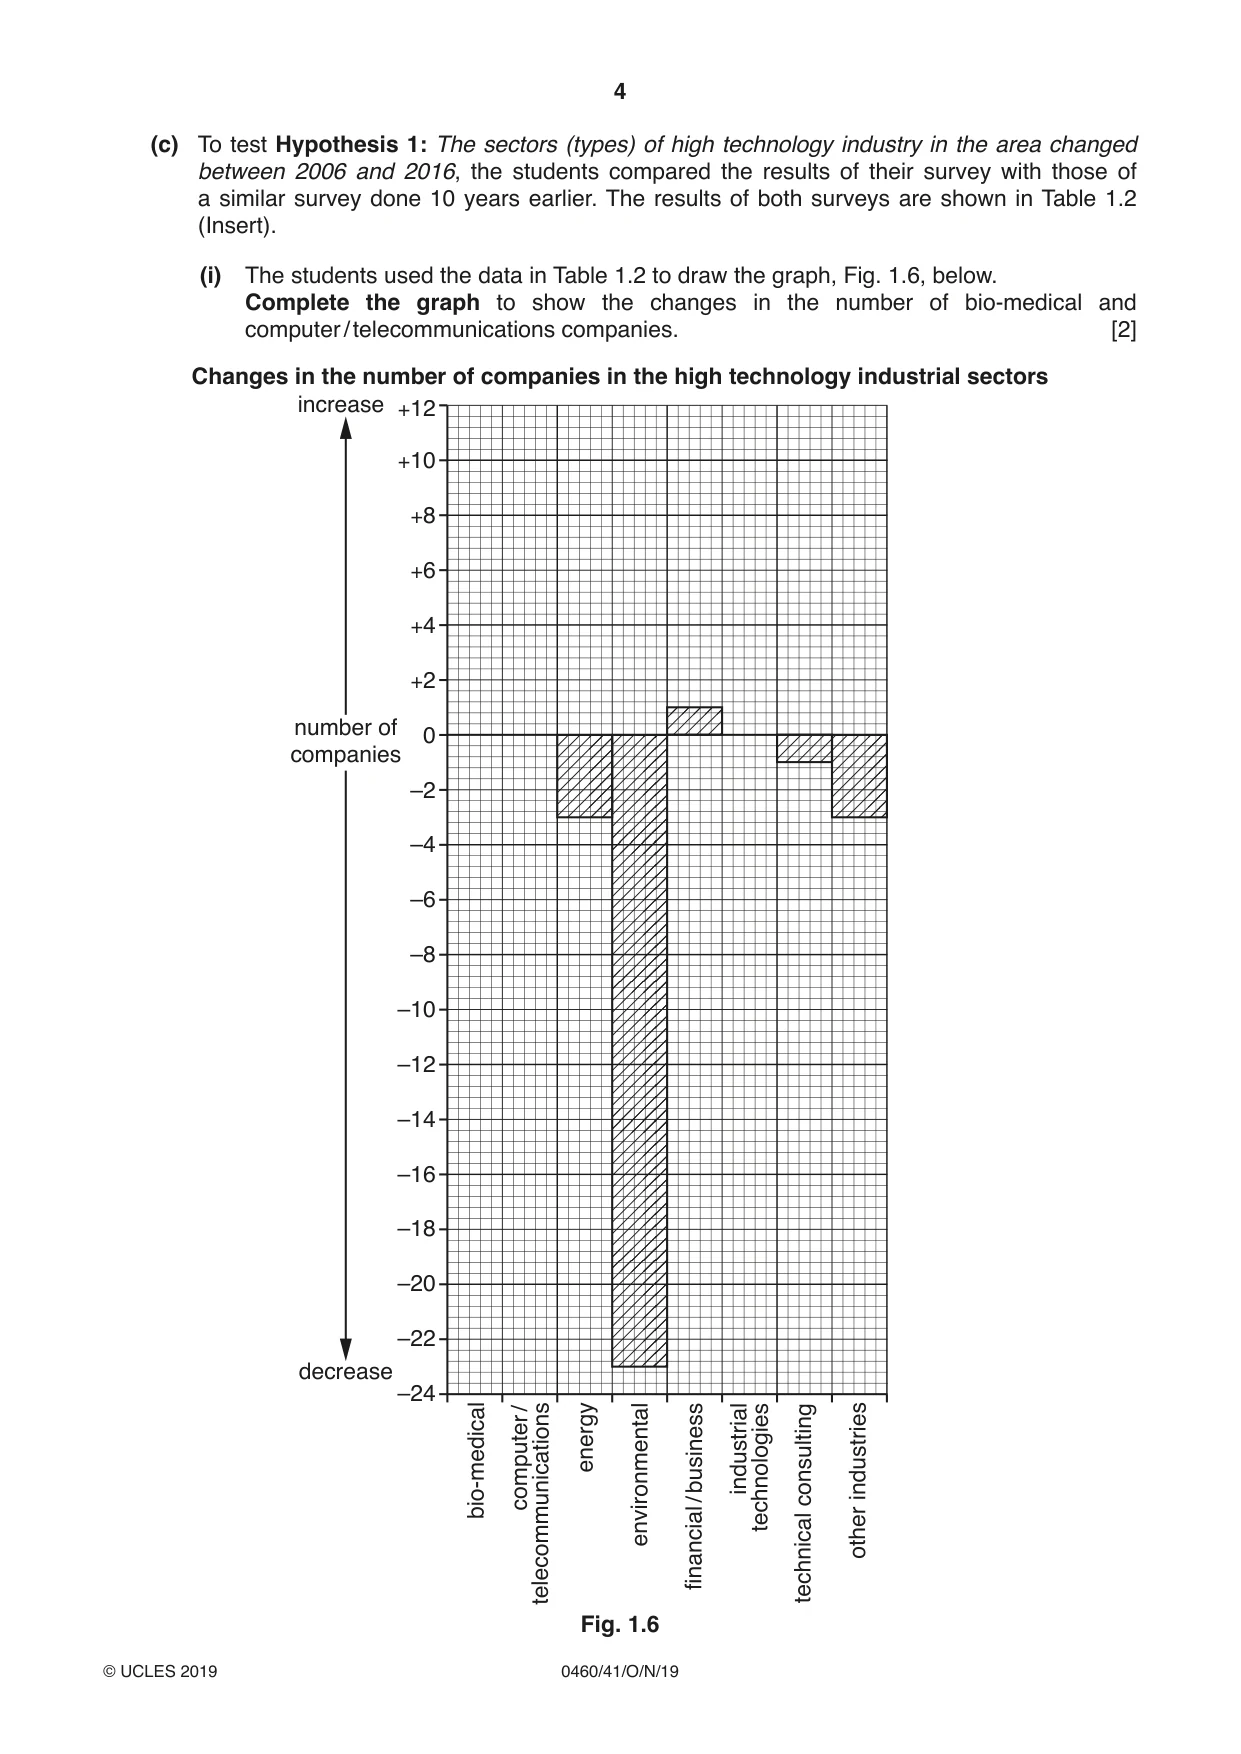
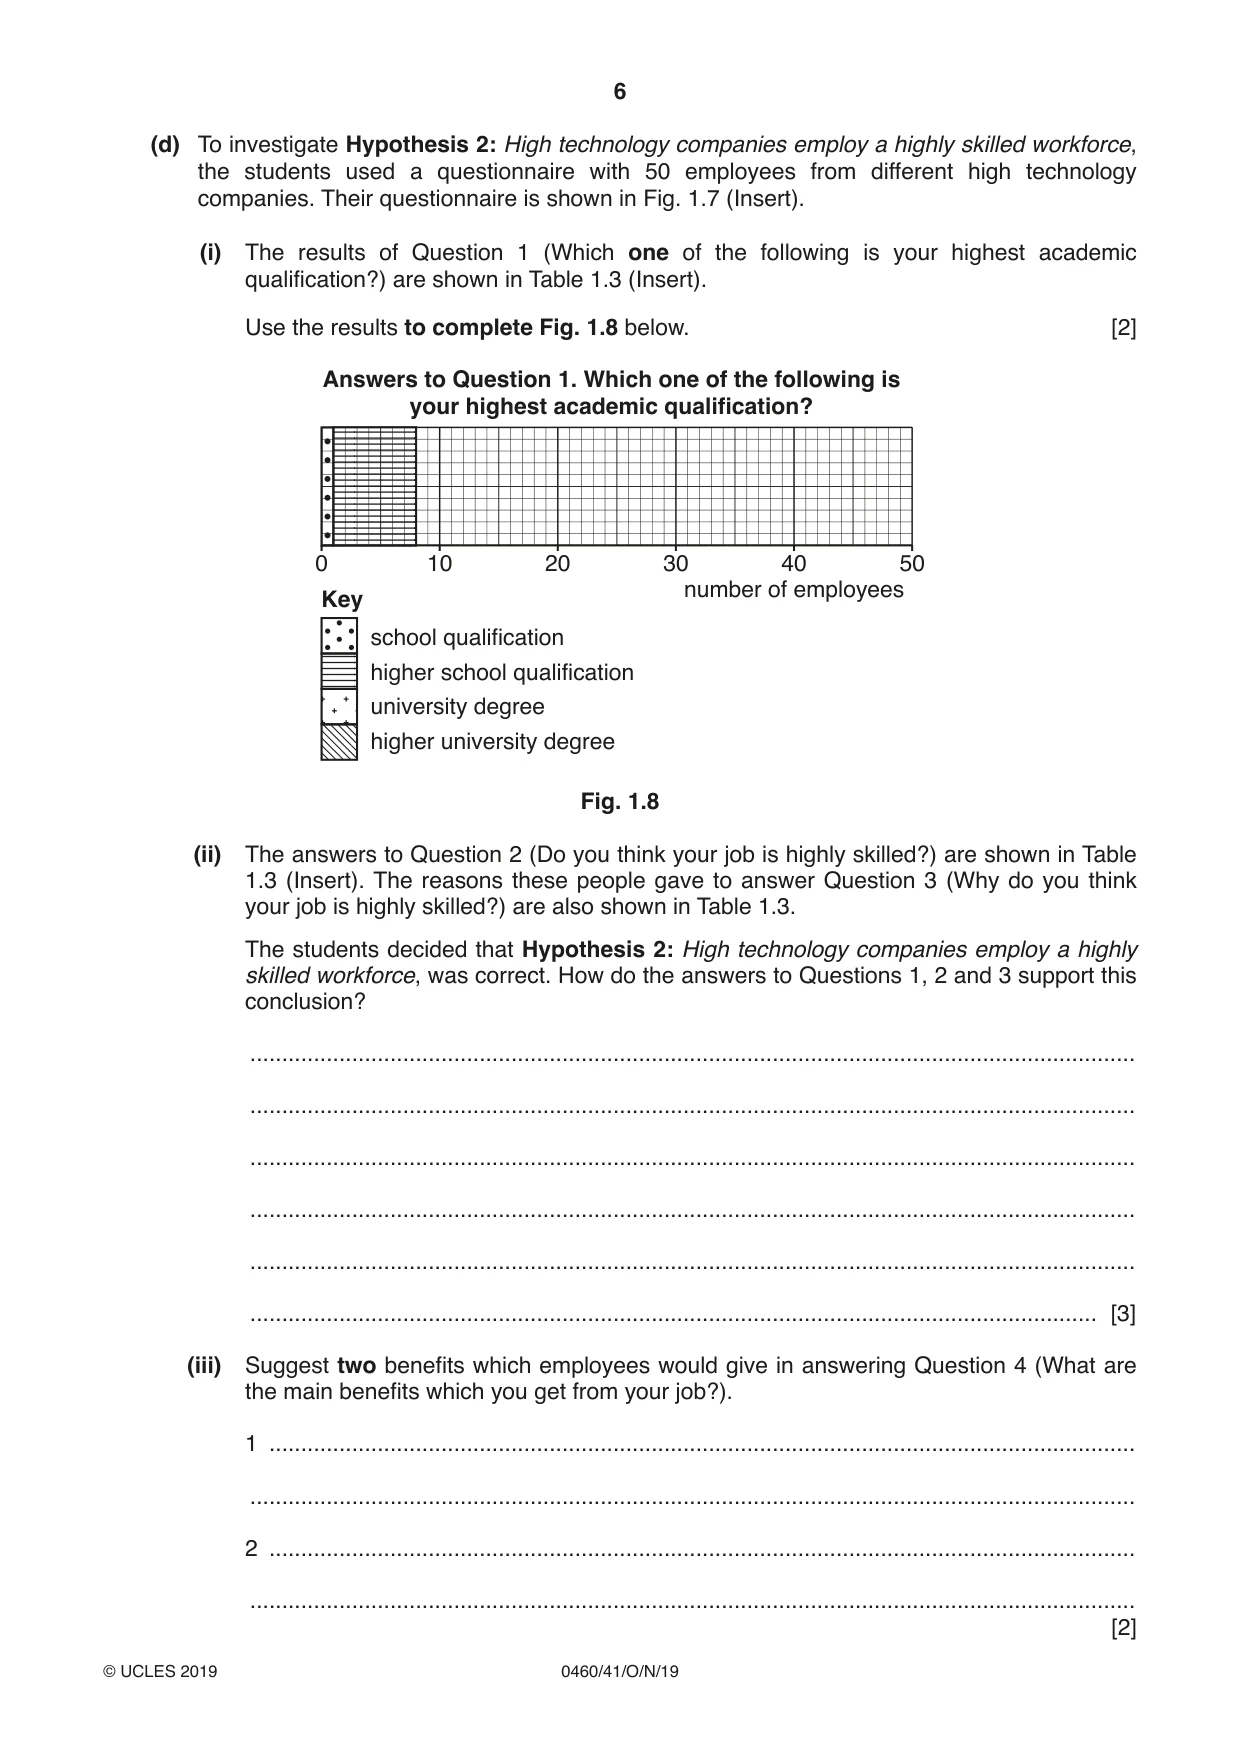
1 A class of students investigated a local high technology industrial area. They wanted to find out about the companies located there. (a) The high technology industrial area is shown in Figs. 1.1 and 1.2 (Insert). The photograph in Fig. 1.1 shows the area in 2006 and the map in Fig. 1.2 shows it in 2016. (i) Identify two buildings in different areas which have been constructed since 2006. Building number ............... Building number ............... [2] (ii) What is the number of the building labelled X on Fig. 1.1? Building number ............... [1] (iii) Figs. 1.3 and 1.4 (Insert) are photographs which show views of this industrial area. Describe three features of the industrial area shown in Figs. 1.3 and 1.4. 1 ........................................................................................................................................ ........................................................................................................................................... 2 ......................................................................................................................................... ........................................................................................................................................... 3 ........................................................................................................................................ ..................................................................................................................................... [3] The students identified the following hypotheses: Hypothesis 1: The sectors (types) of high technology industry in the area changed between 2006 and 2016. Hypothesis 2: High technology companies employ a highly skilled workforce. (b) To investigate Hypothesis 1 the students did a survey of the companies which occupied some of the buildings shown in Fig. 1.2 (Insert). They wanted to find out what sector of high technology industry the companies were involved in. (i) Companies involved in the bio-medical sector are shaded on Fig. 1.2. Describe the distribution of these companies. ........................................................................................................................................... ........................................................................................................................................... ........................................................................................................................................... ..................................................................................................................................... [2] (ii) Explain why high technology companies are usually located near to other similar companies. ........................................................................................................................................... ........................................................................................................................................... ........................................................................................................................................... ........................................................................................................................................... ........................................................................................................................................... ..................................................................................................................................... [3] (iii) Table 1.1 (Insert) shows the percentage of companies in each industrial sector. Use these results to complete Fig. 1.5 below. [2] Percentage of total number of companies 0% Key 90 10 bio-medical computer / telecommunications 80 20 energy environmental financial / business industrial technologies70 30 technical consulting other industries 60 40 50 Fig. 1.5 (c) To test Hypothesis 1: The sectors (types) of high technology industry in the area changed between 2006 and 2016, the students compared the results of their survey with those of a similar survey done 10 years earlier. The results of both surveys are shown in Table 1.2 (Insert). (i) The students used the data in Table 1.2 to draw the graph, Fig. 1.6, below. Complete the graph to show the changes in the number of bio-medical and computer / telecommunications companies. [2] Changes in the number of companies in the high technology industrial sectors increase +12 +10 +8 +6 +4 +2 number of 0 companies –2 –4 –6 –8 –10 –12 –14 –16 –18 –20 –22 decrease –24 / / computer bio-medical business industrialtechnologies consulting industries energy environmental financial other telecommunications technical Fig. 1.6 (ii) What conclusion would the students make about Hypothesis 1: The sectors (types) of high technology industry in the area changed between 2006 and 2016? Support your decision with evidence from Fig. 1.6 and Table 1.2. ........................................................................................................................................... ........................................................................................................................................... ........................................................................................................................................... ........................................................................................................................................... ........................................................................................................................................... ........................................................................................................................................... ........................................................................................................................................... ..................................................................................................................................... [4] (iii) Companies in the ‘other industries’ sector shown in Table 1.1 include businesses such as a nursery (childcare centre), restaurant, and health club and gym. Suggest two advantages for these companies of a location in this industrial area. 1 ......................................................................................................................................... ........................................................................................................................................... 2 ........................................................................................................................................ ..................................................................................................................................... [2] (d) To investigate Hypothesis 2: High technology companies employ a highly skilled workforce, the students used a questionnaire with 50 employees from different high technology companies. Their questionnaire is shown in Fig. 1.7 (Insert). (i) The results of Question 1 (Which one of the following is your highest academic qualification?) are shown in Table 1.3 (Insert). Use the results to complete Fig. 1.8 below. [2] Answers to Question 1. Which one of the following is your highest academic qualification? 0 10 20 30 40 50 number of employees Key school qualification higher school qualification university degree higher university degree Fig. 1.8 (ii) The answers to Question 2 (Do you think your job is highly skilled?) are shown in Table 1.3 (Insert). The reasons these people gave to answer Question 3 (Why do you think your job is highly skilled?) are also shown in Table 1.3. The students decided that Hypothesis 2: High technology companies employ a highly skilled workforce, was correct. How do the answers to Questions 1, 2 and 3 support this conclusion? ........................................................................................................................................... ........................................................................................................................................... ........................................................................................................................................... ........................................................................................................................................... ........................................................................................................................................... ..................................................................................................................................... [3] (iii) Suggest two benefits which employees would give in answering Question 4 (What are the main benefits which you get from your job?). 1 ........................................................................................................................................ ........................................................................................................................................... 2 ........................................................................................................................................ ........................................................................................................................................... [2] (e) Which two of the following are factors which attract high technology industries to an area? Tick your choices in the table below. Location factor Tick (3) Air pollution from the buildings will not affect local residents Links to universities in the local area Large quantities of raw materials nearby Near to the main market for the produce Road, rail and air transport links make the area accessible [2] [Total: 30]
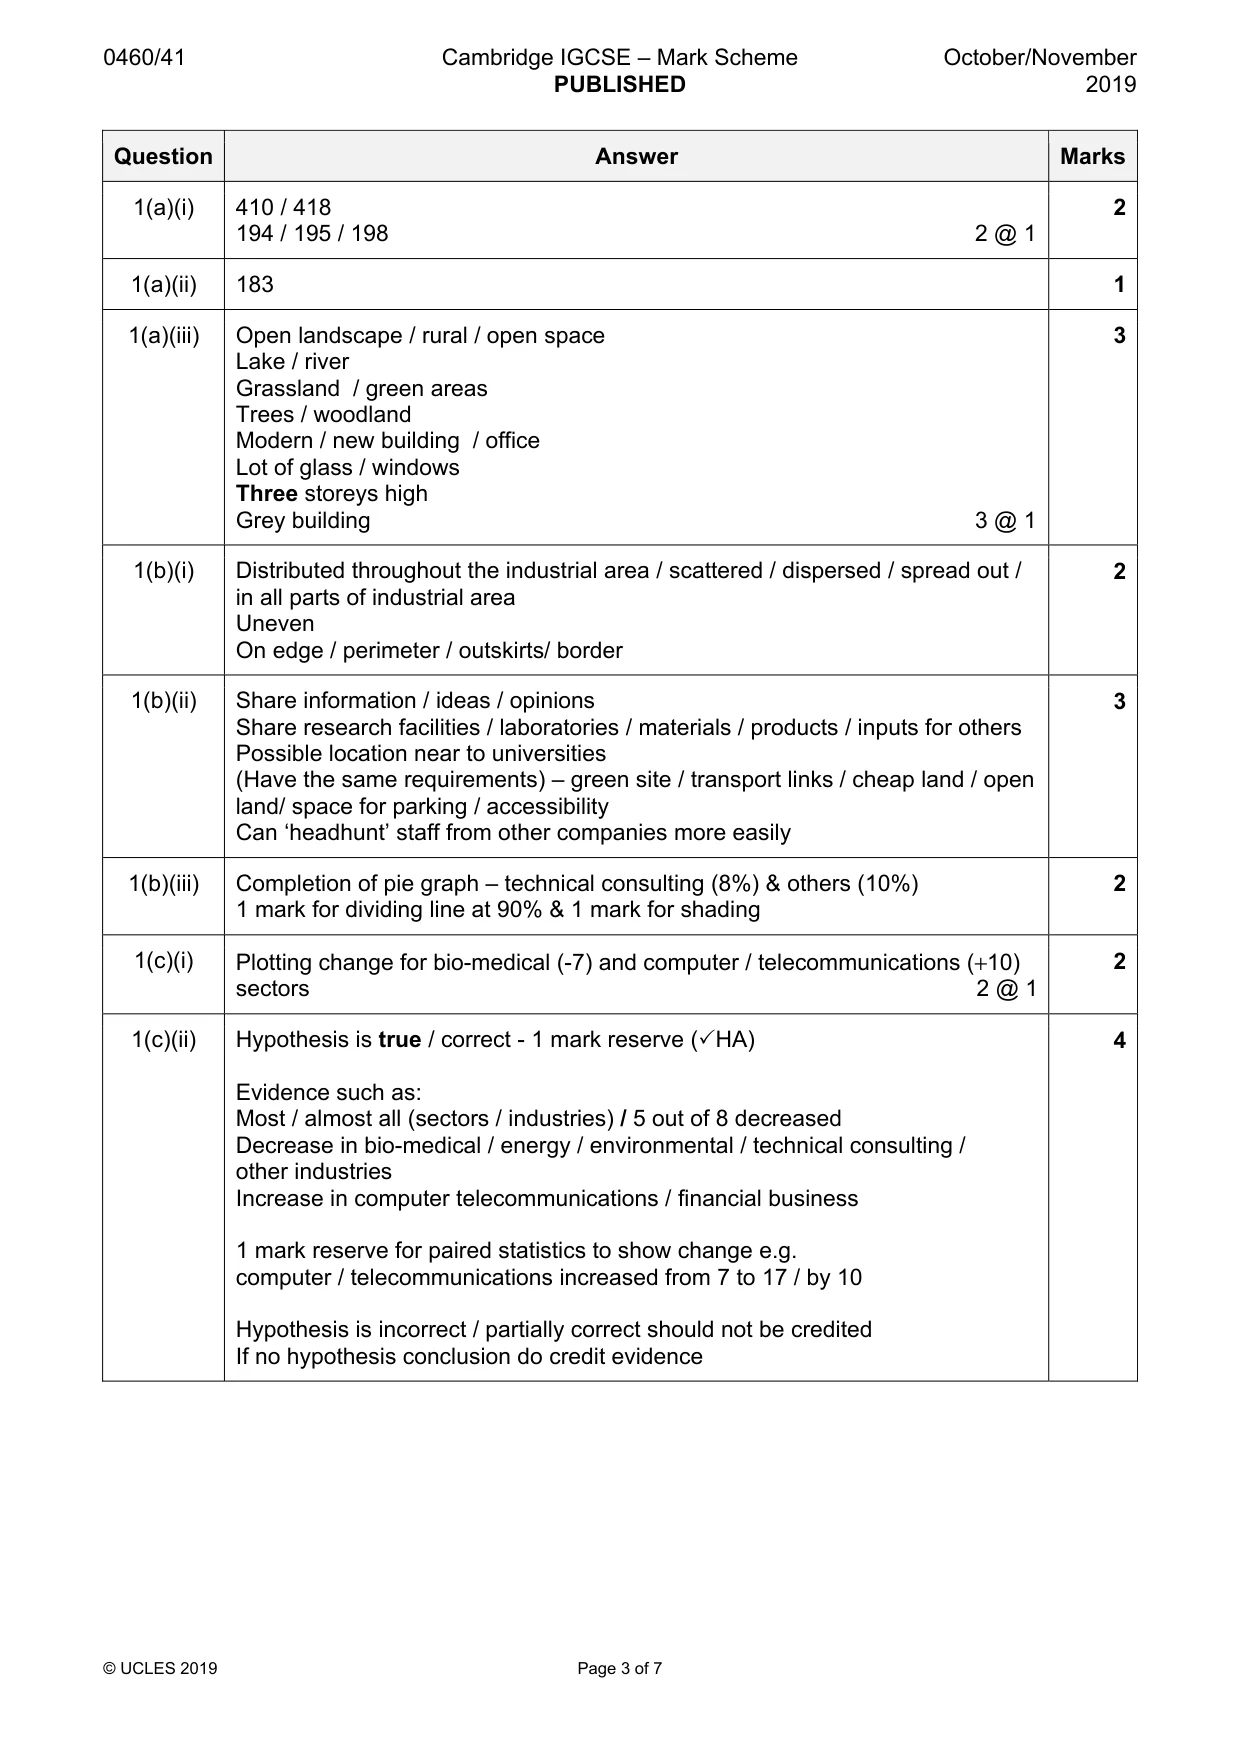
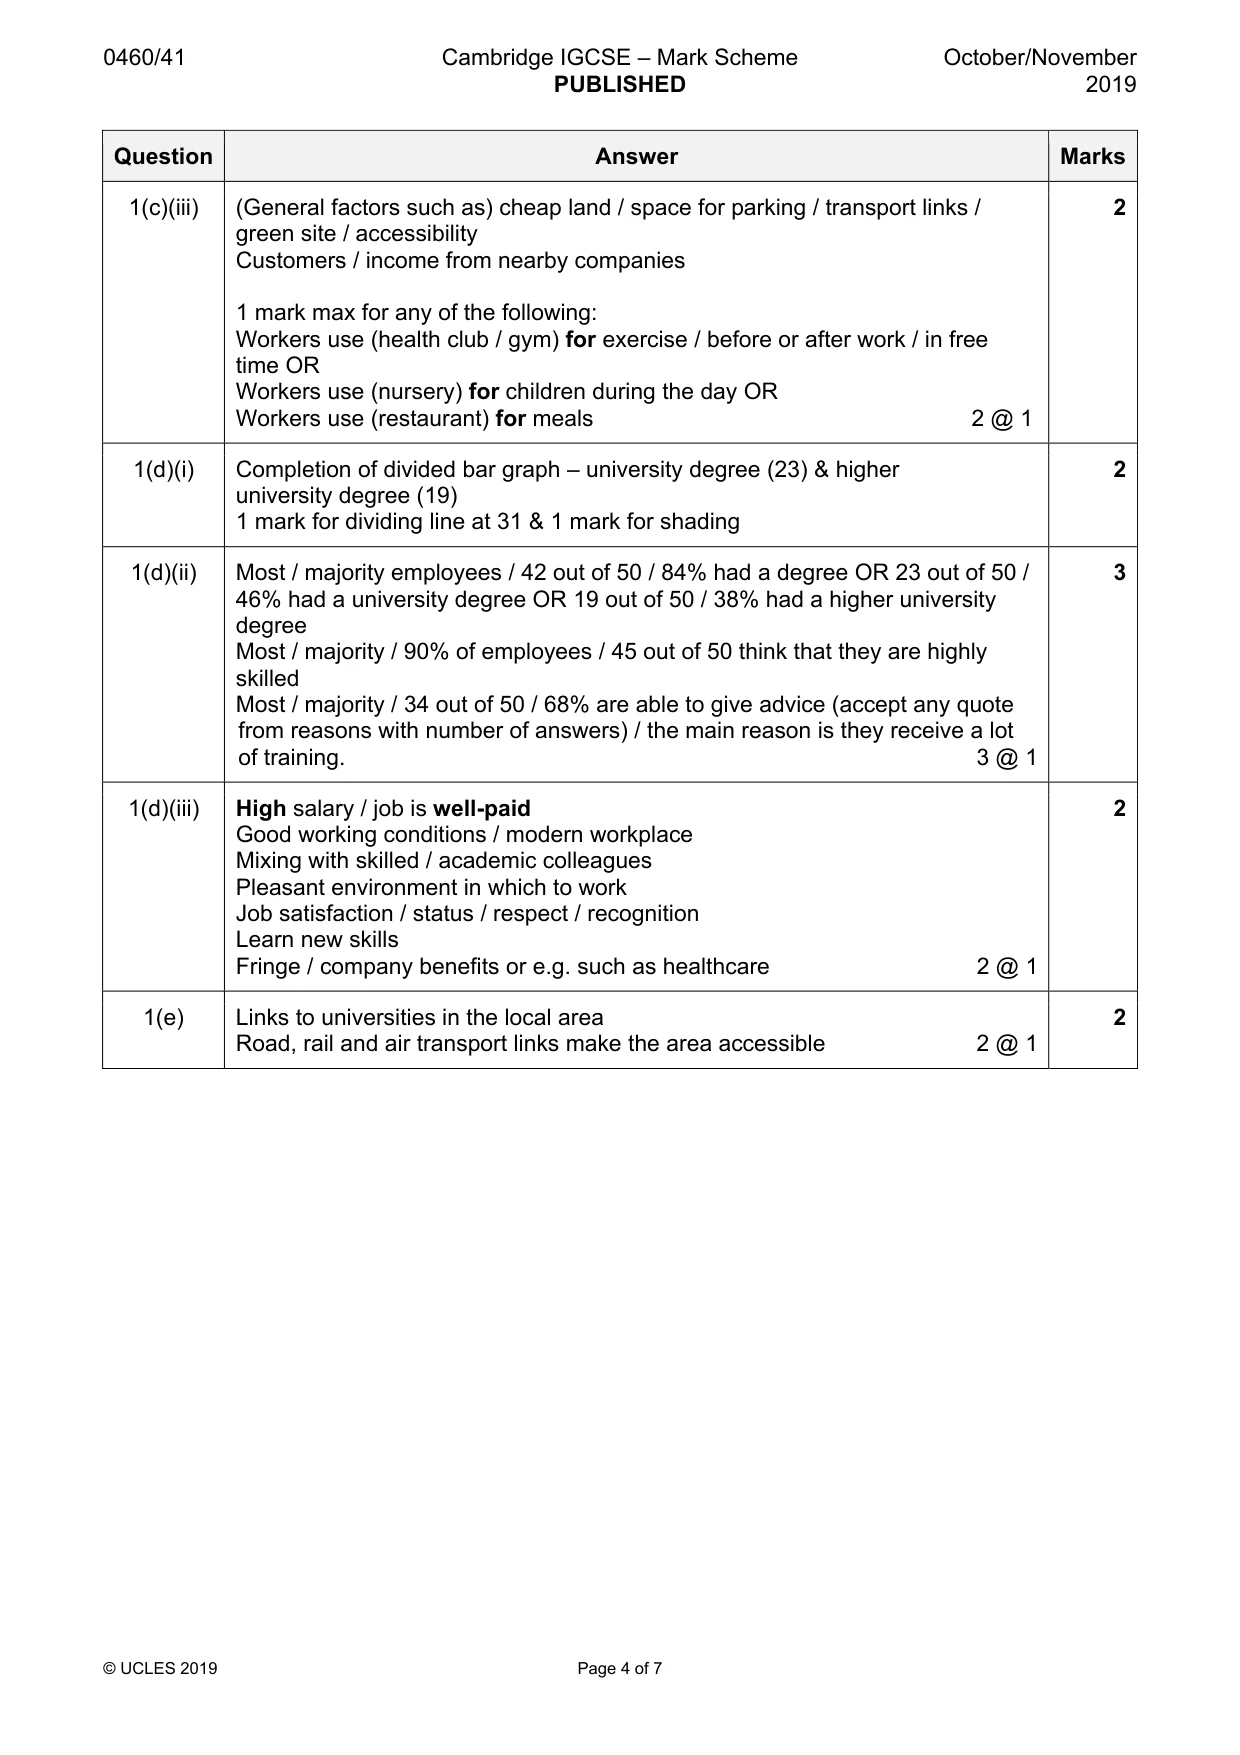
Mark scheme: Question Answer Marks 1(a)(i) 410 / 418 2 194 / 195 / 198 2 @ 1 1(a)(ii) 183 1 1(a)(iii) Open landscape / rural / open space 3 Lake / river Grassland / green areas Trees / woodland Modern / new building / office Lot of glass / windows Three storeys high Grey building 3 @ 1 1(b)(i) Distributed throughout the industrial area / scattered / dispersed / spread out / 2 in all parts of industrial area Uneven On edge / perimeter / outskirts/ border 1(b)(ii) Share information / ideas / opinions 3 Share research facilities / laboratories / materials / products / inputs for others Possible location near to universities (Have the same requirements) – green site / transport links / cheap land / open land/ space for parking / accessibility Can ‘headhunt’ staff from other companies more easily 1(b)(iii) Completion of pie graph – technical consulting (8%) & others (10%) 2 1 mark for dividing line at 90% & 1 mark for shading 1(c)(i) Plotting change for bio-medical (-7) and computer / telecommunications (+10) 2 sectors 2 @ 1 1(c)(ii) Hypothesis is true / correct - 1 mark reserve (3HA) 4 Evidence such as: Most / almost all (sectors / industries) / 5 out of 8 decreased Decrease in bio-medical / energy / environmental / technical consulting / other industries Increase in computer telecommunications / financial business 1 mark reserve for paired statistics to show change e.g. computer / telecommunications increased from 7 to 17 / by 10 Hypothesis is incorrect / partially correct should not be credited If no hypothesis conclusion do credit evidence 1(c)(iii) (General factors such as) cheap land / space for parking / transport links / 2 green site / accessibility Customers / income from nearby companies 1 mark max for any of the following: Workers use (health club / gym) for exercise / before or after work / in free time OR Workers use (nursery) for children during the day OR Workers use (restaurant) for meals 2 @ 1 1(d)(i) Completion of divided bar graph – university degree (23) & higher 2 university degree (19) 1 mark for dividing line at 31 & 1 mark for shading 1(d)(ii) Most / majority employees / 42 out of 50 / 84% had a degree OR 23 out of 50 / 3 46% had a university degree OR 19 out of 50 / 38% had a higher university degree Most / majority / 90% of employees / 45 out of 50 think that they are highly skilled Most / majority / 34 out of 50 / 68% are able to give advice (accept any quote from reasons with number of answers) / the main reason is they receive a lot of training. 3 @ 1 1(d)(iii) High salary / job is well-paid 2 Good working conditions / modern workplace Mixing with skilled / academic colleagues Pleasant environment in which to work Job satisfaction / status / respect / recognition Learn new skills Fringe / company benefits or e.g. such as healthcare 2 @ 1 1(e) Links to universities in the local area 2 Road, rail and air transport links make the area accessible 2 @ 1
Q2 · Geography students from Bantry in south west Ireland did a weather investigation
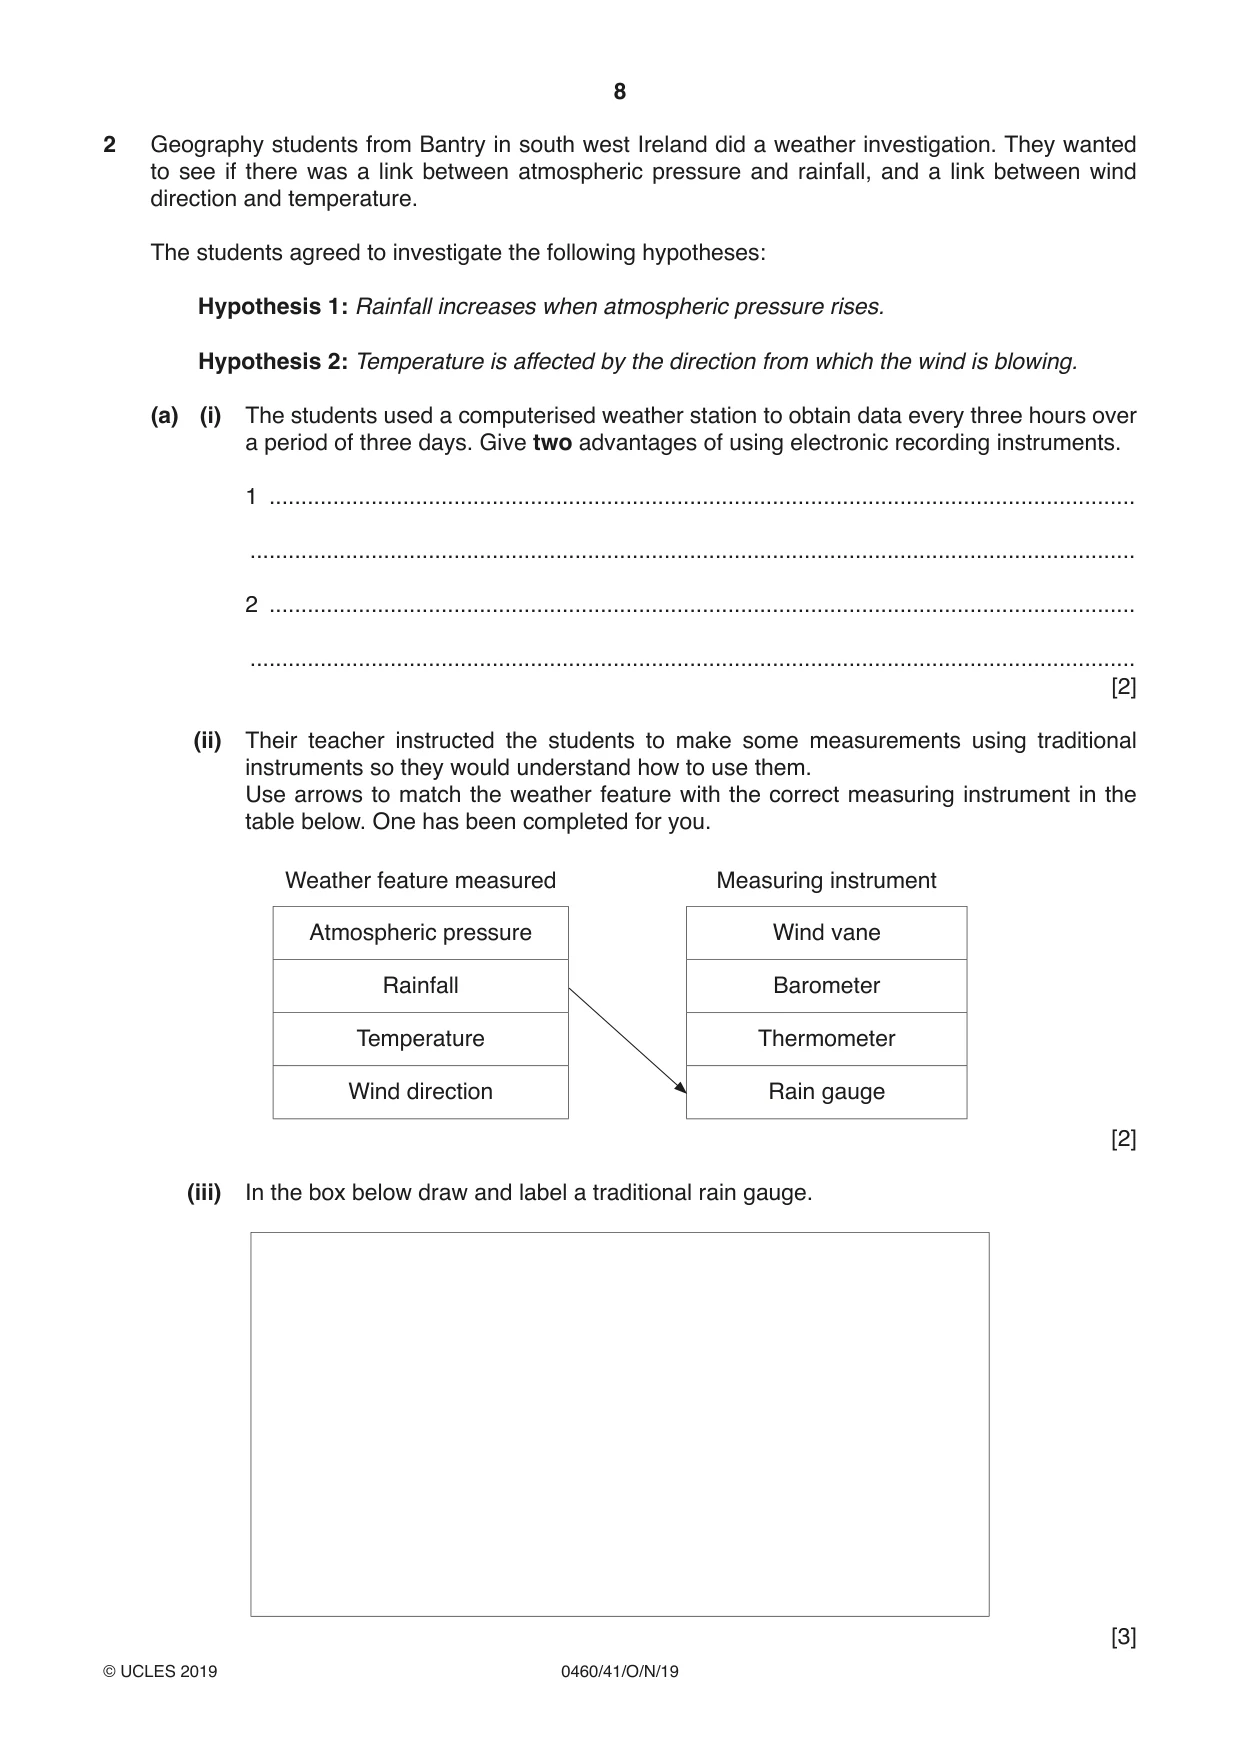
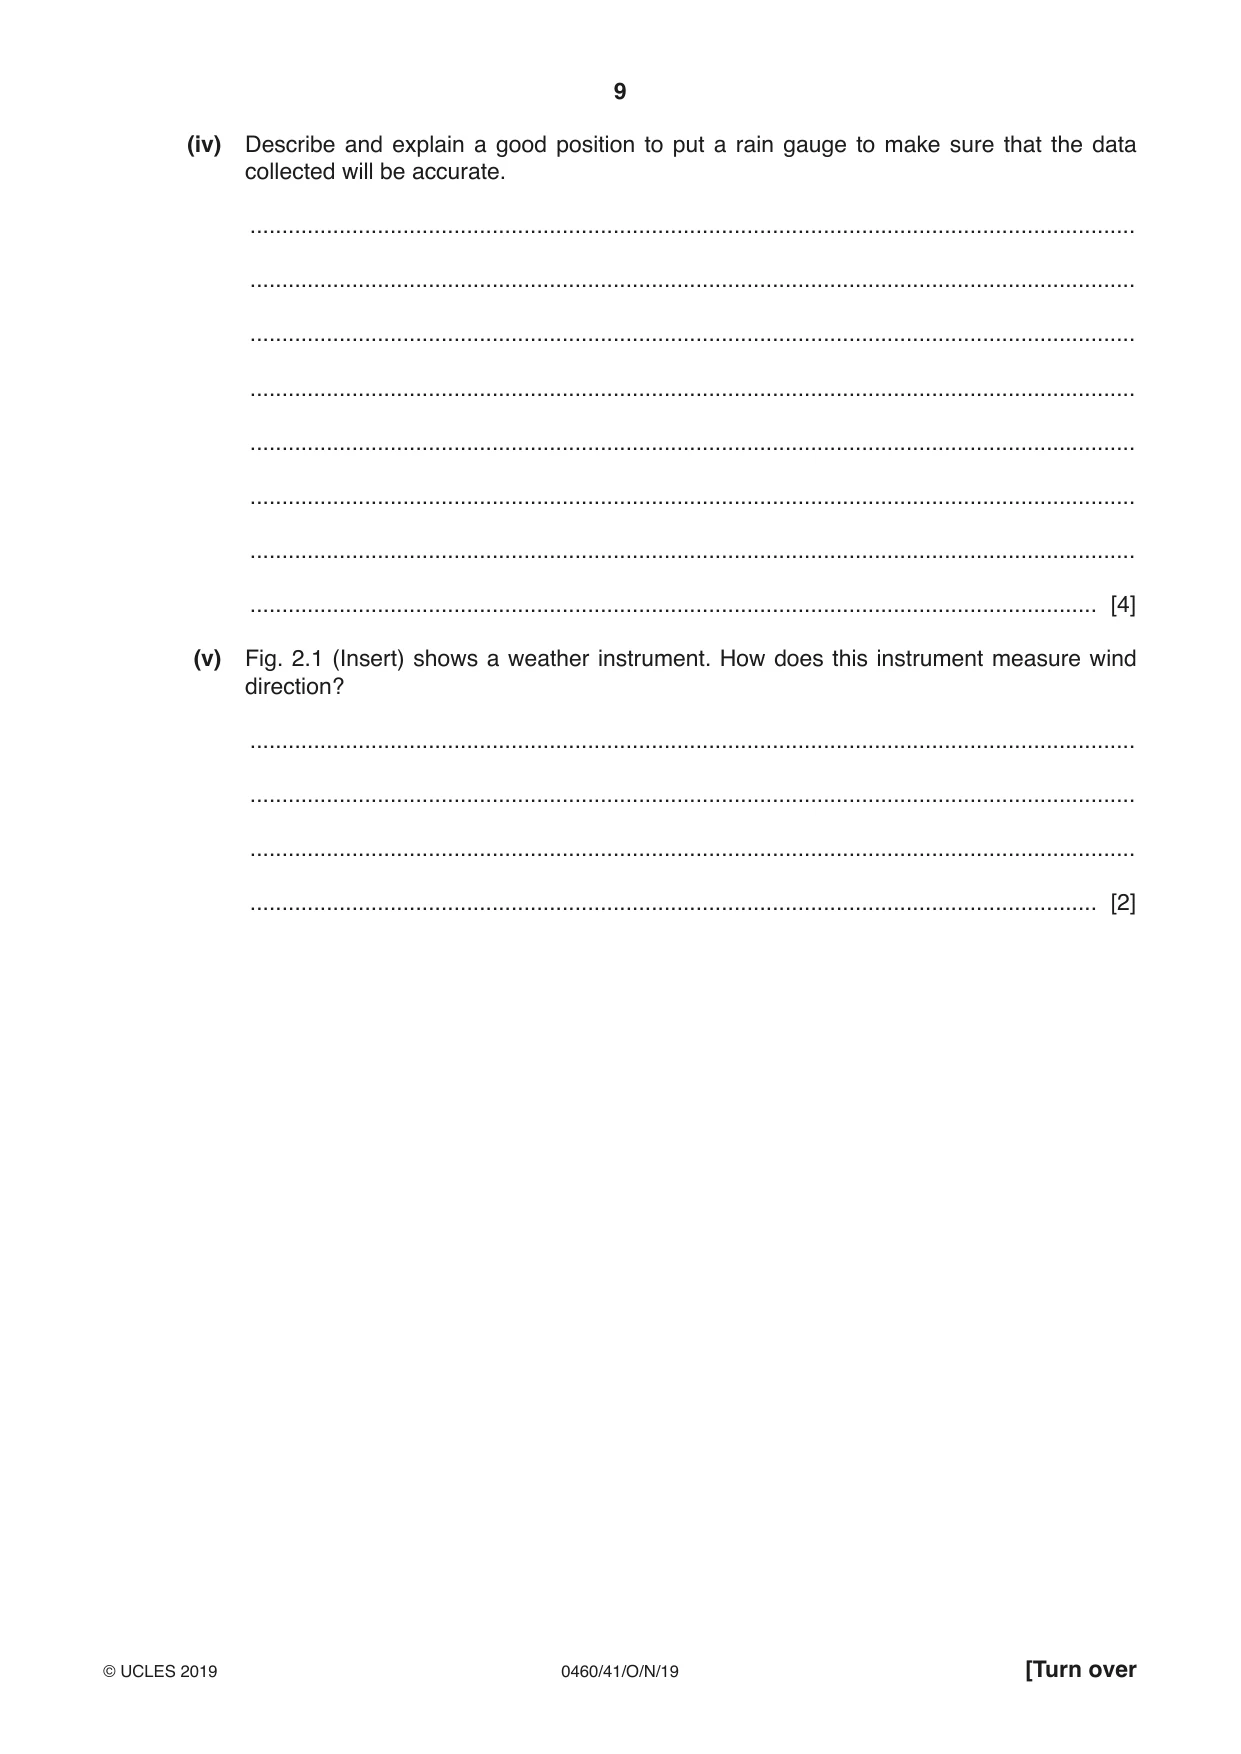
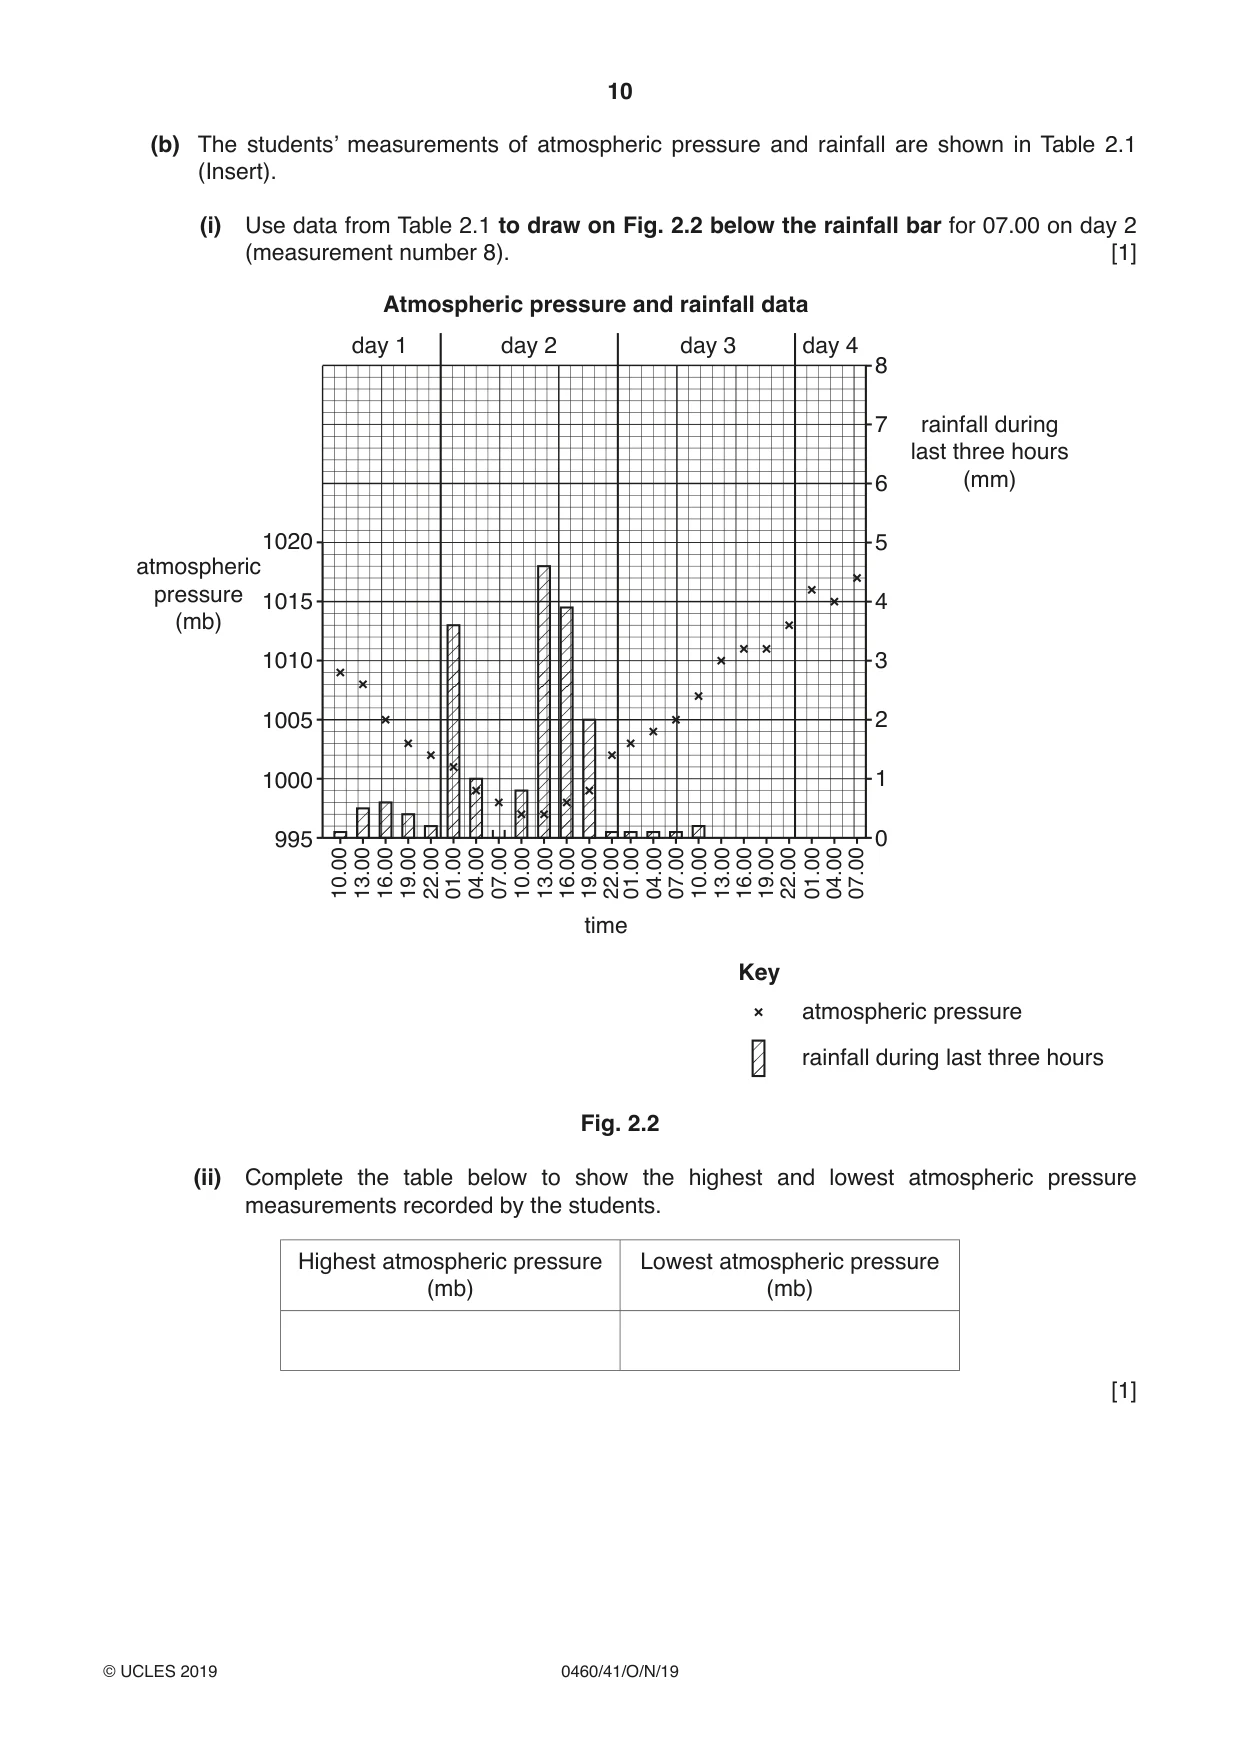
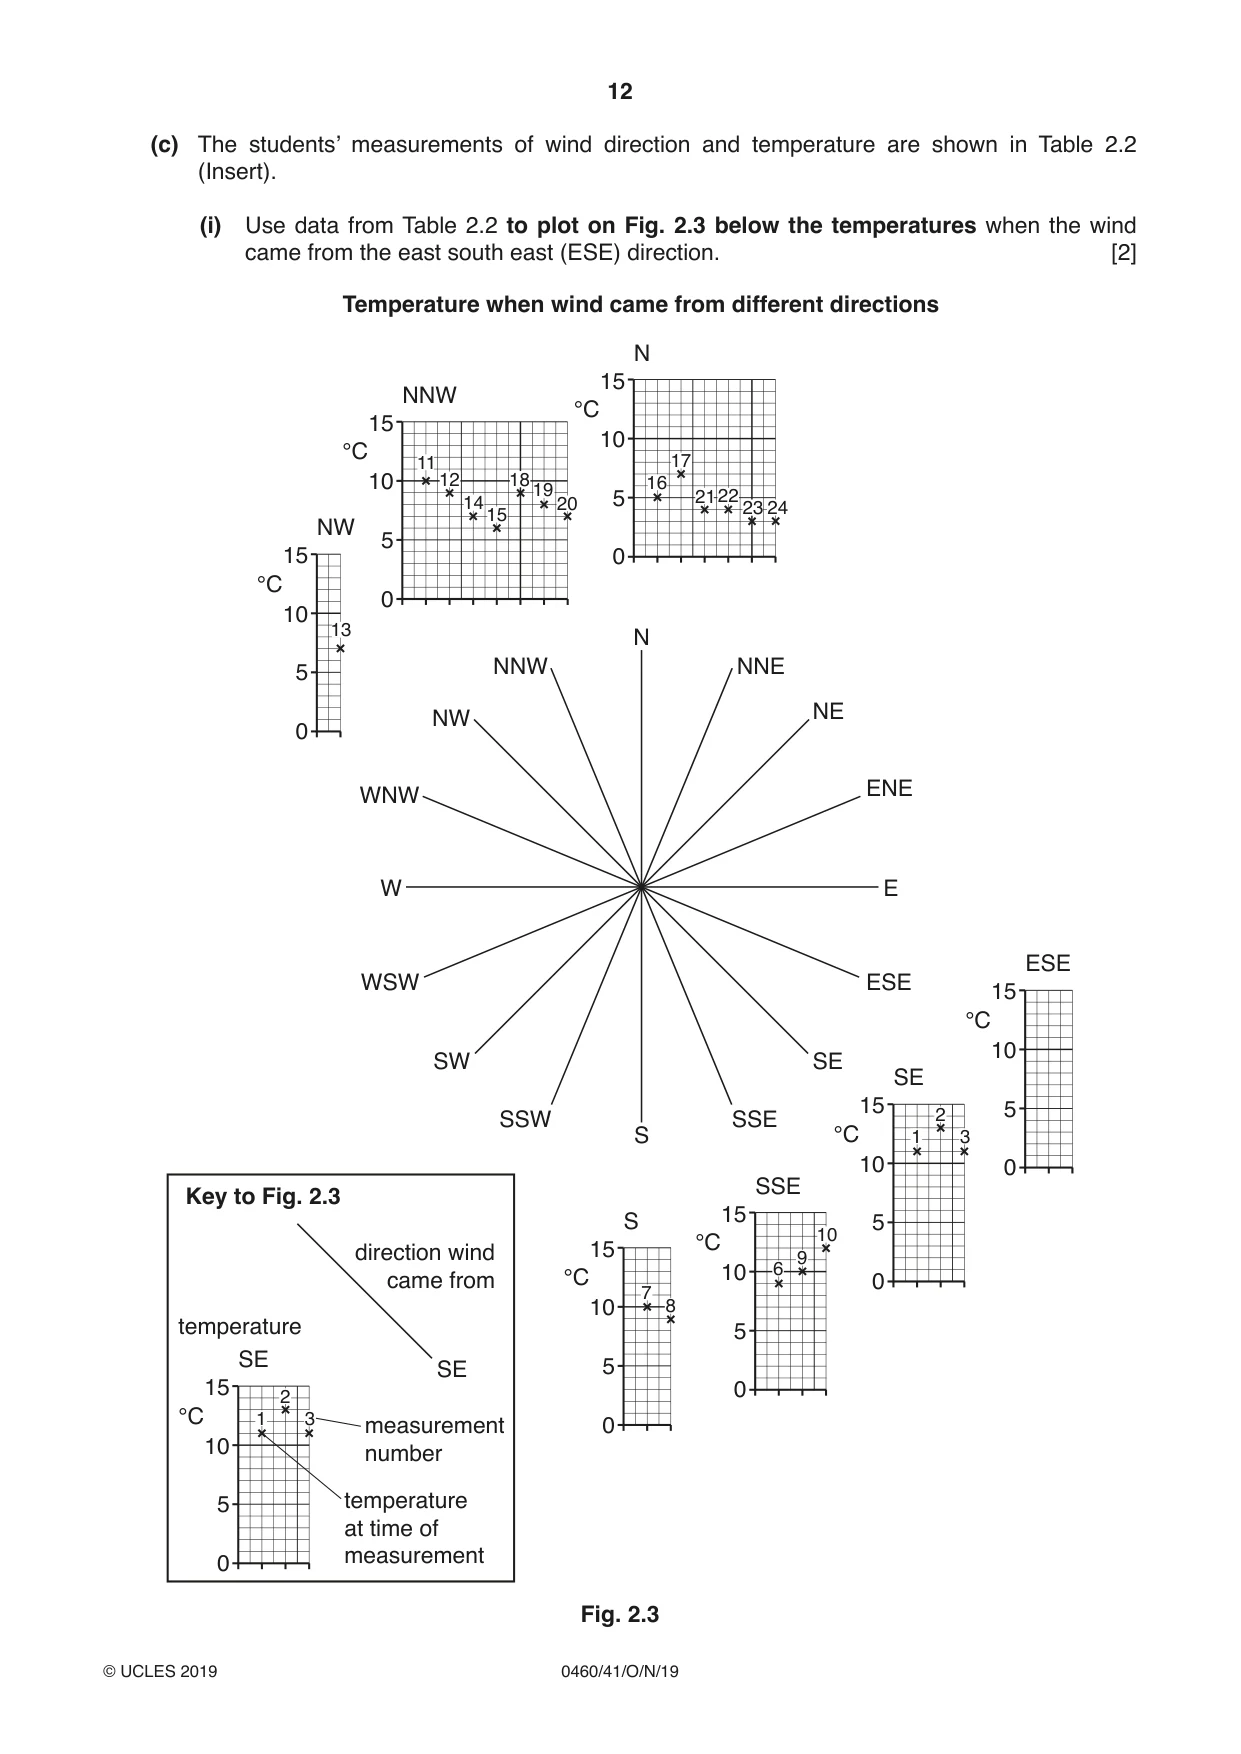
2 Geography students from Bantry in south west Ireland did a weather investigation. They wanted to see if there was a link between atmospheric pressure and rainfall, and a link between wind direction and temperature. The students agreed to investigate the following hypotheses: Hypothesis 1: Rainfall increases when atmospheric pressure rises. Hypothesis 2: Temperature is affected by the direction from which the wind is blowing. (a) (i) The students used a computerised weather station to obtain data every three hours over a period of three days. Give two advantages of using electronic recording instruments. 1 ........................................................................................................................................ ........................................................................................................................................... 2 ........................................................................................................................................ ........................................................................................................................................... [2] (ii) Their teacher instructed the students to make some measurements using traditional instruments so they would understand how to use them. Use arrows to match the weather feature with the correct measuring instrument in the table below. One has been completed for you. Weather feature measured Measuring instrument Atmospheric pressure Wind vane Rainfall Barometer Temperature Thermometer Wind direction Rain gauge [2] (iii) In the box below draw and label a traditional rain gauge. [3] (iv) Describe and explain a good position to put a rain gauge to make sure that the data collected will be accurate. ........................................................................................................................................... ........................................................................................................................................... ........................................................................................................................................... ........................................................................................................................................... ........................................................................................................................................... ........................................................................................................................................... ........................................................................................................................................... ..................................................................................................................................... [4] (v) Fig. 2.1 (Insert) shows a weather instrument. How does this instrument measure wind direction? ........................................................................................................................................... ........................................................................................................................................... ........................................................................................................................................... ..................................................................................................................................... [2] (b) The students’ measurements of atmospheric pressure and rainfall are shown in Table 2.1 (Insert). (i) Use data from Table 2.1 to draw on Fig. 2.2 below the rainfall bar for 07.00 on day 2 (measurement number 8). [1] Atmospheric pressure and rainfall data day 1 day 2 day 3 day 4 8 7 rainfall during last three hours 6 (mm) 1020 5 atmospheric pressure 1015 4 (mb) 1010 3 1005 2 1000 1 995 0 10.0013.0016.0019.0022.0001.0004.0007.0010.0013.0016.0019.0022.0001.0004.0007.0010.0013.0016.0019.0022.0001.0004.0007.00 time Key atmospheric pressure rainfall during last three hours Fig. 2.2 (ii) Complete the table below to show the highest and lowest atmospheric pressure measurements recorded by the students. Highest atmospheric pressure Lowest atmospheric pressure (mb) (mb) [1]
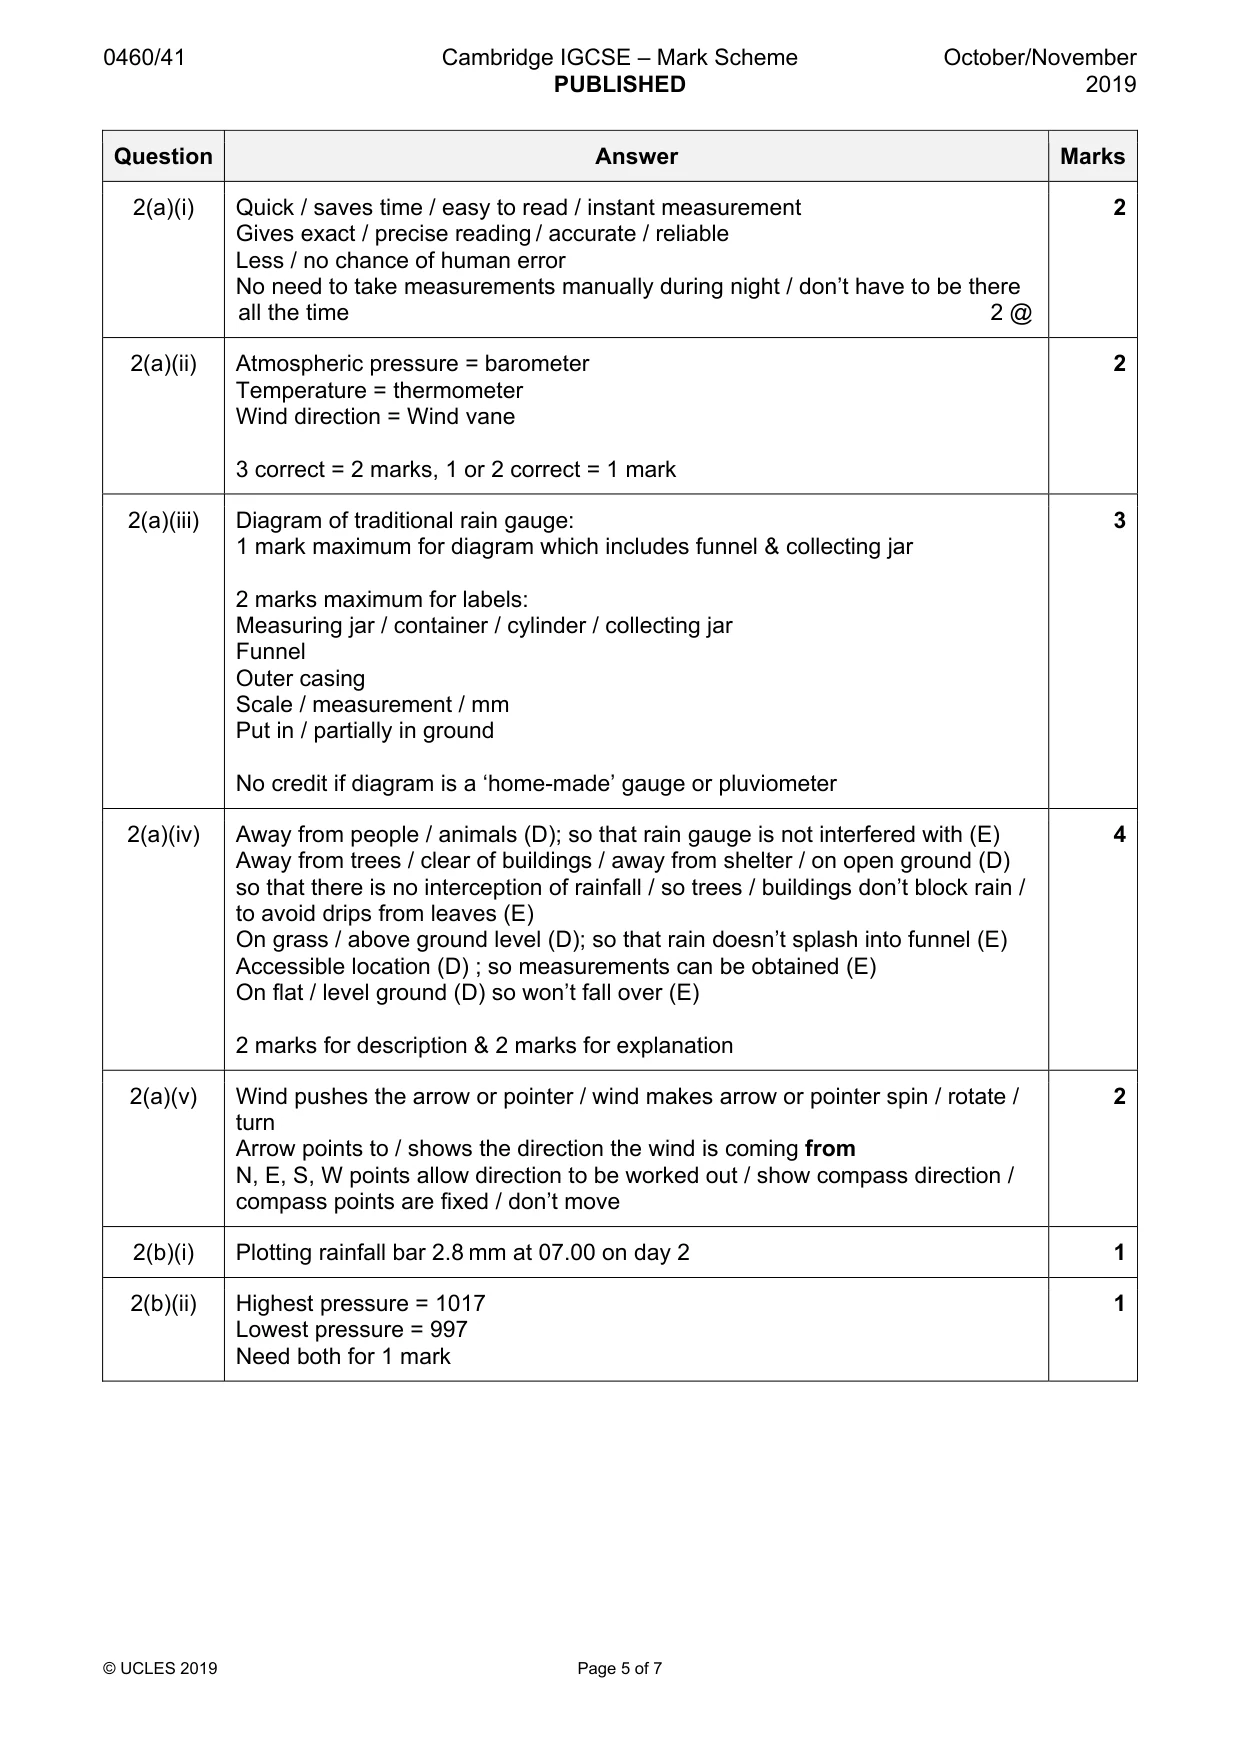
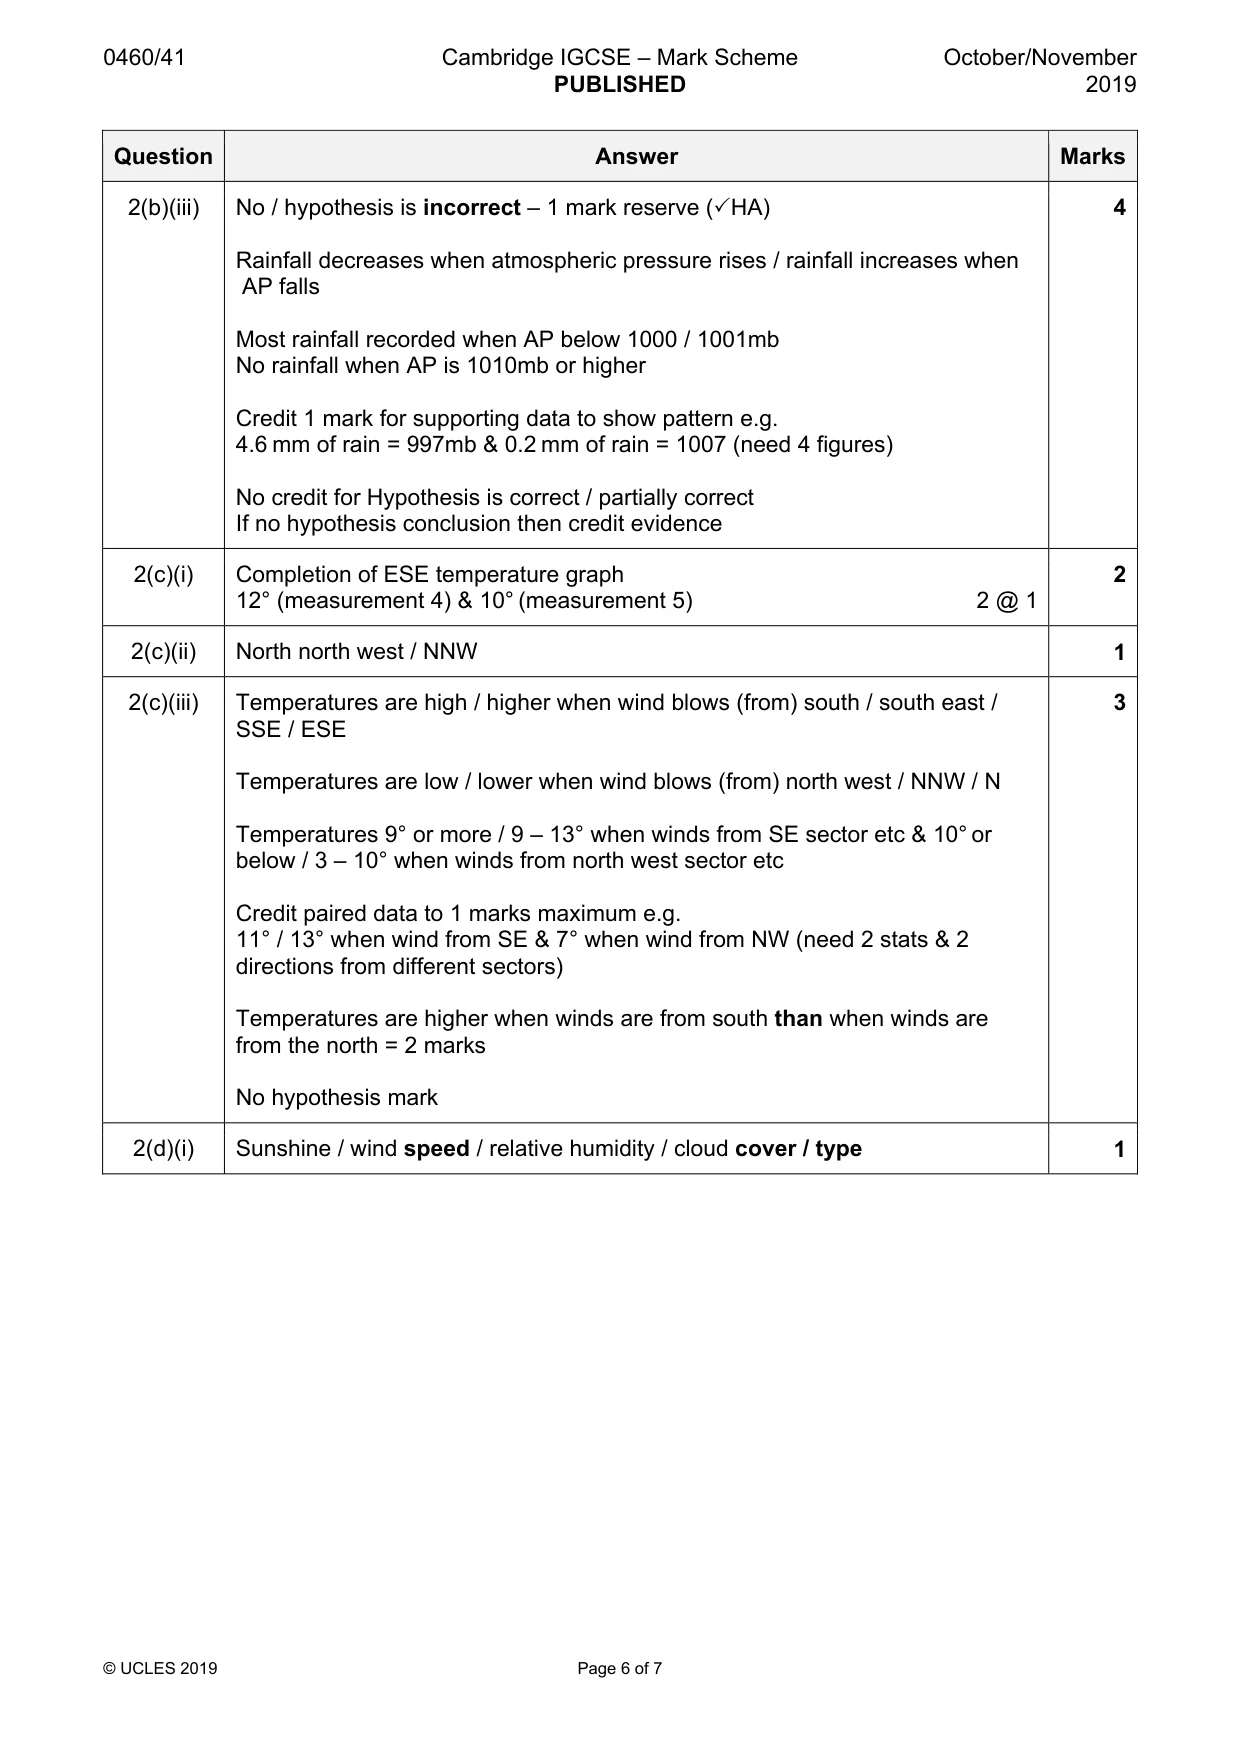
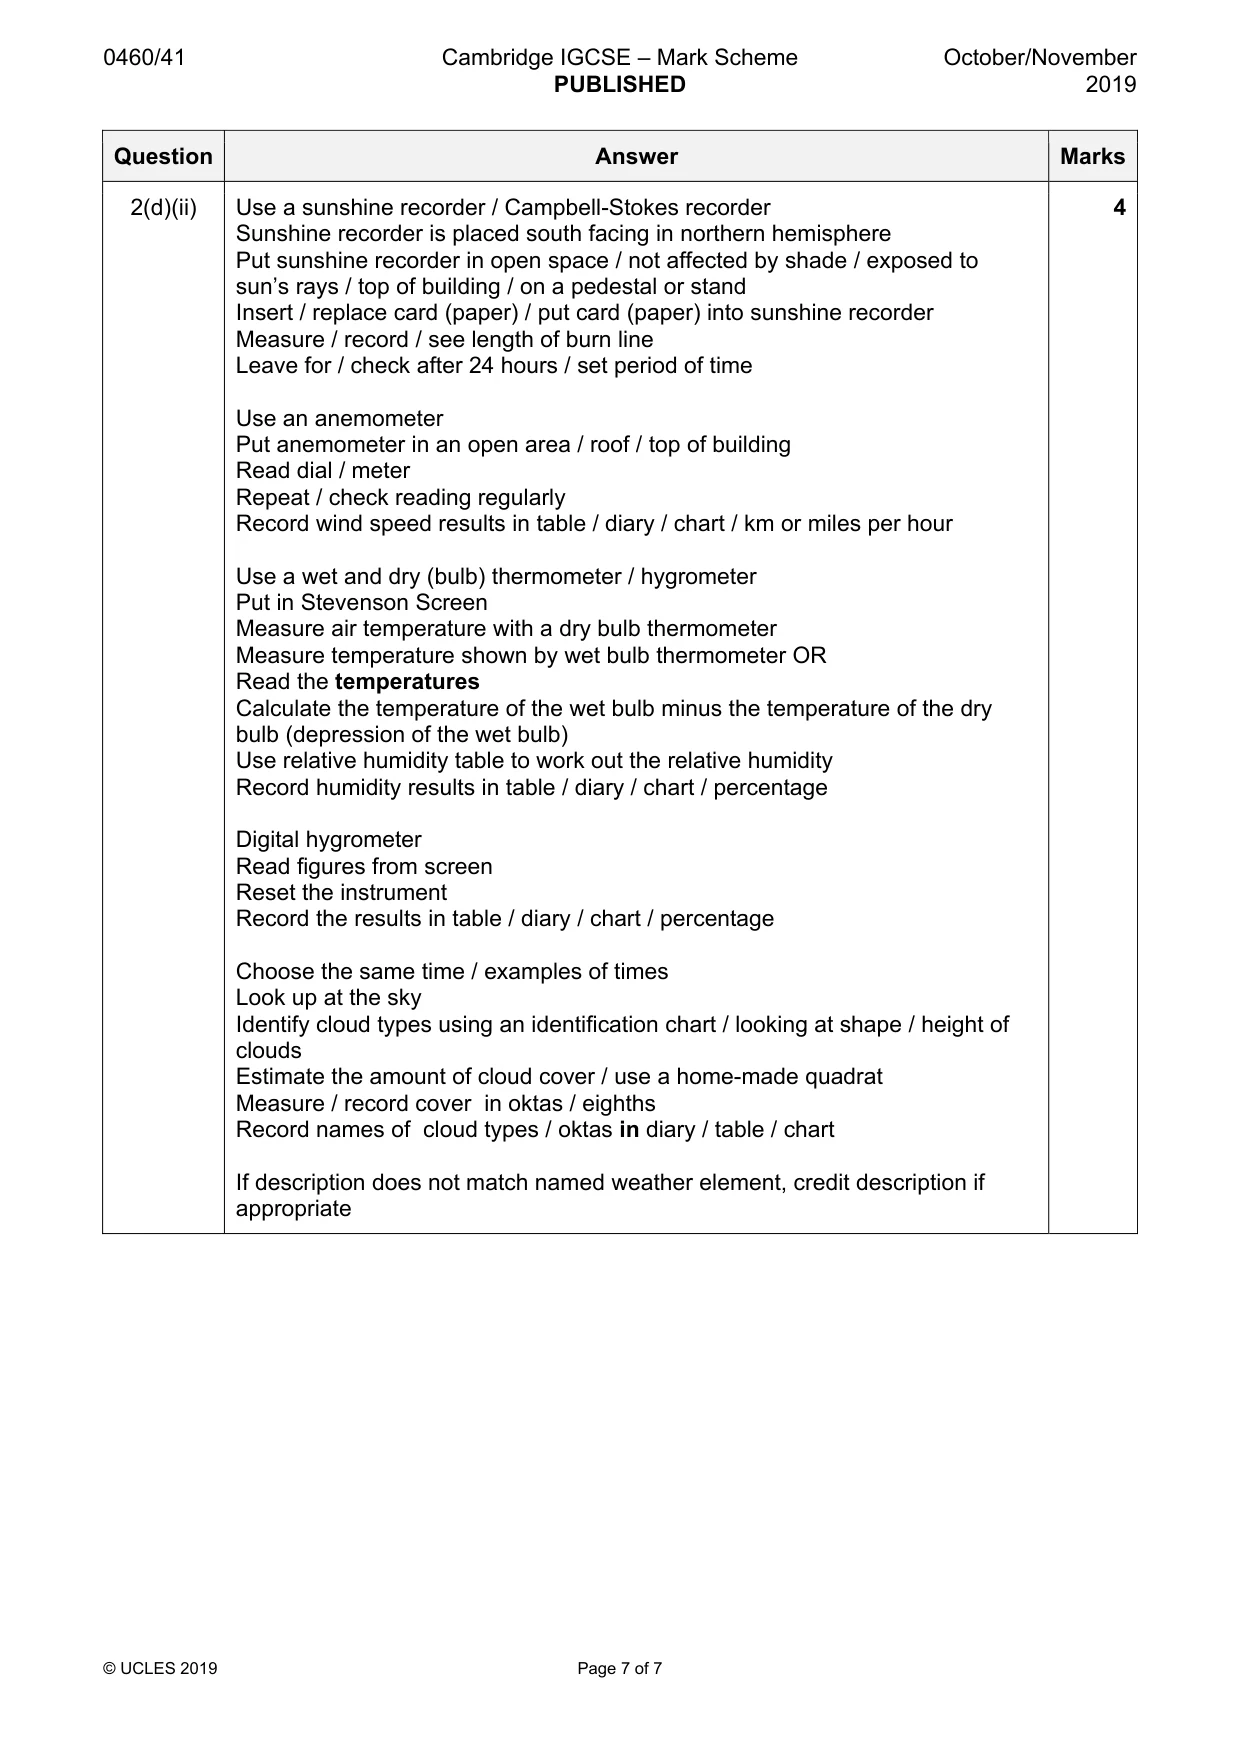
Mark scheme: 2(a)(i) Quick / saves time / easy to read / instant measurement 2 Gives exact / precise reading / accurate / reliable Less / no chance of human error No need to take measurements manually during night / don’t have to be there all the time 2 @ 2(a)(ii) Atmospheric pressure = barometer 2 Temperature = thermometer Wind direction = Wind vane 3 correct = 2 marks, 1 or 2 correct = 1 mark 2(a)(iii) Diagram of traditional rain gauge: 3 1 mark maximum for diagram which includes funnel & collecting jar 2 marks maximum for labels: Measuring jar / container / cylinder / collecting jar Funnel Outer casing Scale / measurement / mm Put in / partially in ground No credit if diagram is a ‘home-made’ gauge or pluviometer 2(a)(iv) Away from people / animals (D); so that rain gauge is not interfered with (E) 4 Away from trees / clear of buildings / away from shelter / on open ground (D) so that there is no interception of rainfall / so trees / buildings don’t block rain / to avoid drips from leaves (E) On grass / above ground level (D); so that rain doesn’t splash into funnel (E) Accessible location (D) ; so measurements can be obtained (E) On flat / level ground (D) so won’t fall over (E) 2 marks for description & 2 marks for explanation 2(a)(v) Wind pushes the arrow or pointer / wind makes arrow or pointer spin / rotate / 2 turn Arrow points to / shows the direction the wind is coming from N, E, S, W points allow direction to be worked out / show compass direction / compass points are fixed / don’t move 2(b)(i) Plotting rainfall bar 2.8 mm at 07.00 on day 2 1 2(b)(ii) Highest pressure = 1017 1 Lowest pressure = 997 Need both for 1 mark 2(b)(iii) No / hypothesis is incorrect – 1 mark reserve (3HA) 4 Rainfall decreases when atmospheric pressure rises / rainfall increases when AP falls Most rainfall recorded when AP below 1000 / 1001mb No rainfall when AP is 1010mb or higher Credit 1 mark for supporting data to show pattern e.g. 4.6 mm of rain = 997mb & 0.2 mm of rain = 1007 (need 4 figures) No credit for Hypothesis is correct / partially correct If no hypothesis conclusion then credit evidence 2(c)(i) Completion of ESE temperature graph 2 12° (measurement 4) & 10° (measurement 5) 2 @ 1 2(c)(ii) North north west / NNW 1 2(c)(iii) Temperatures are high / higher when wind blows (from) south / south east / 3 SSE / ESE Temperatures are low / lower when wind blows (from) north west / NNW / N Temperatures 9° or more / 9 – 13° when winds from SE sector etc & 10° or below / 3 – 10° when winds from north west sector etc Credit paired data to 1 marks maximum e.g. 11° / 13° when wind from SE & 7° when wind from NW (need 2 stats & 2 directions from different sectors) Temperatures are higher when winds are from south than when winds are from the north = 2 marks No hypothesis mark 2(d)(i) Sunshine / wind speed / relative humidity / cloud cover / type 1 2(d)(ii) Use a sunshine recorder / Campbell-Stokes recorder 4 Sunshine recorder is placed south facing in northern hemisphere Put sunshine recorder in open space / not affected by shade / exposed to sun’s rays / top of building / on a pedestal or stand Insert / replace card (paper) / put card (paper) into sunshine recorder Measure / record / see length of burn line Leave for / check after 24 hours / set period of time Use an anemometer Put anemometer in an open area / roof / top of building Read dial / meter Repeat / check reading regularly Record wind speed results in table / diary / chart / km or miles per hour Use a wet and dry (bulb) thermometer / hygrometer Put in Stevenson Screen Measure air temperature with a dry bulb thermometer Measure temperature shown by wet bulb thermometer OR Read the temperatures Calculate the temperature of the wet bulb minus the temperature of the dry bulb (depression of the wet bulb) Use relative humidity table to work out the relative humidity Record humidity results in table / diary / chart / percentage Digital hygrometer Read figures from screen Reset the instrument Record the results in table / diary / chart / percentage Choose the same time / examples of times Look up at the sky Identify cloud types using an identification chart / looking at shape / height of clouds Estimate the amount of cloud cover / use a home-made quadrat Measure / record cover in oktas / eighths Record names of cloud types / oktas in diary / table / chart If description does not match named weather element, credit description if appropriate
What was in this paper
The subtopics covered by these 2 questions, and how many questions each got. Open one in a new tab to see every Cambridge question on it.
What you needed in this session
Cambridge’s own grade thresholds for 2019 Oct/Nov, Paper 4 · Variant 1. A higher threshold means an easier paper — the bar moves with how the cohort did.