Cambridge IGCSE Geography 0460 — 2019 May/June Paper 4 · Variant 3
0460/43/M/J/19 · 2 questions · 60 marks · ≈68 min
The question paper and its mark scheme, free to read here and free to download. This is Cambridge’s own paper, exactly as it was sat.
Question paper16 pages






Mark scheme8 pages
Answers below. Sit the paper first if you are practising.

Questions as text
Q1 · Students in Greece were studying how different types of wave affected beaches
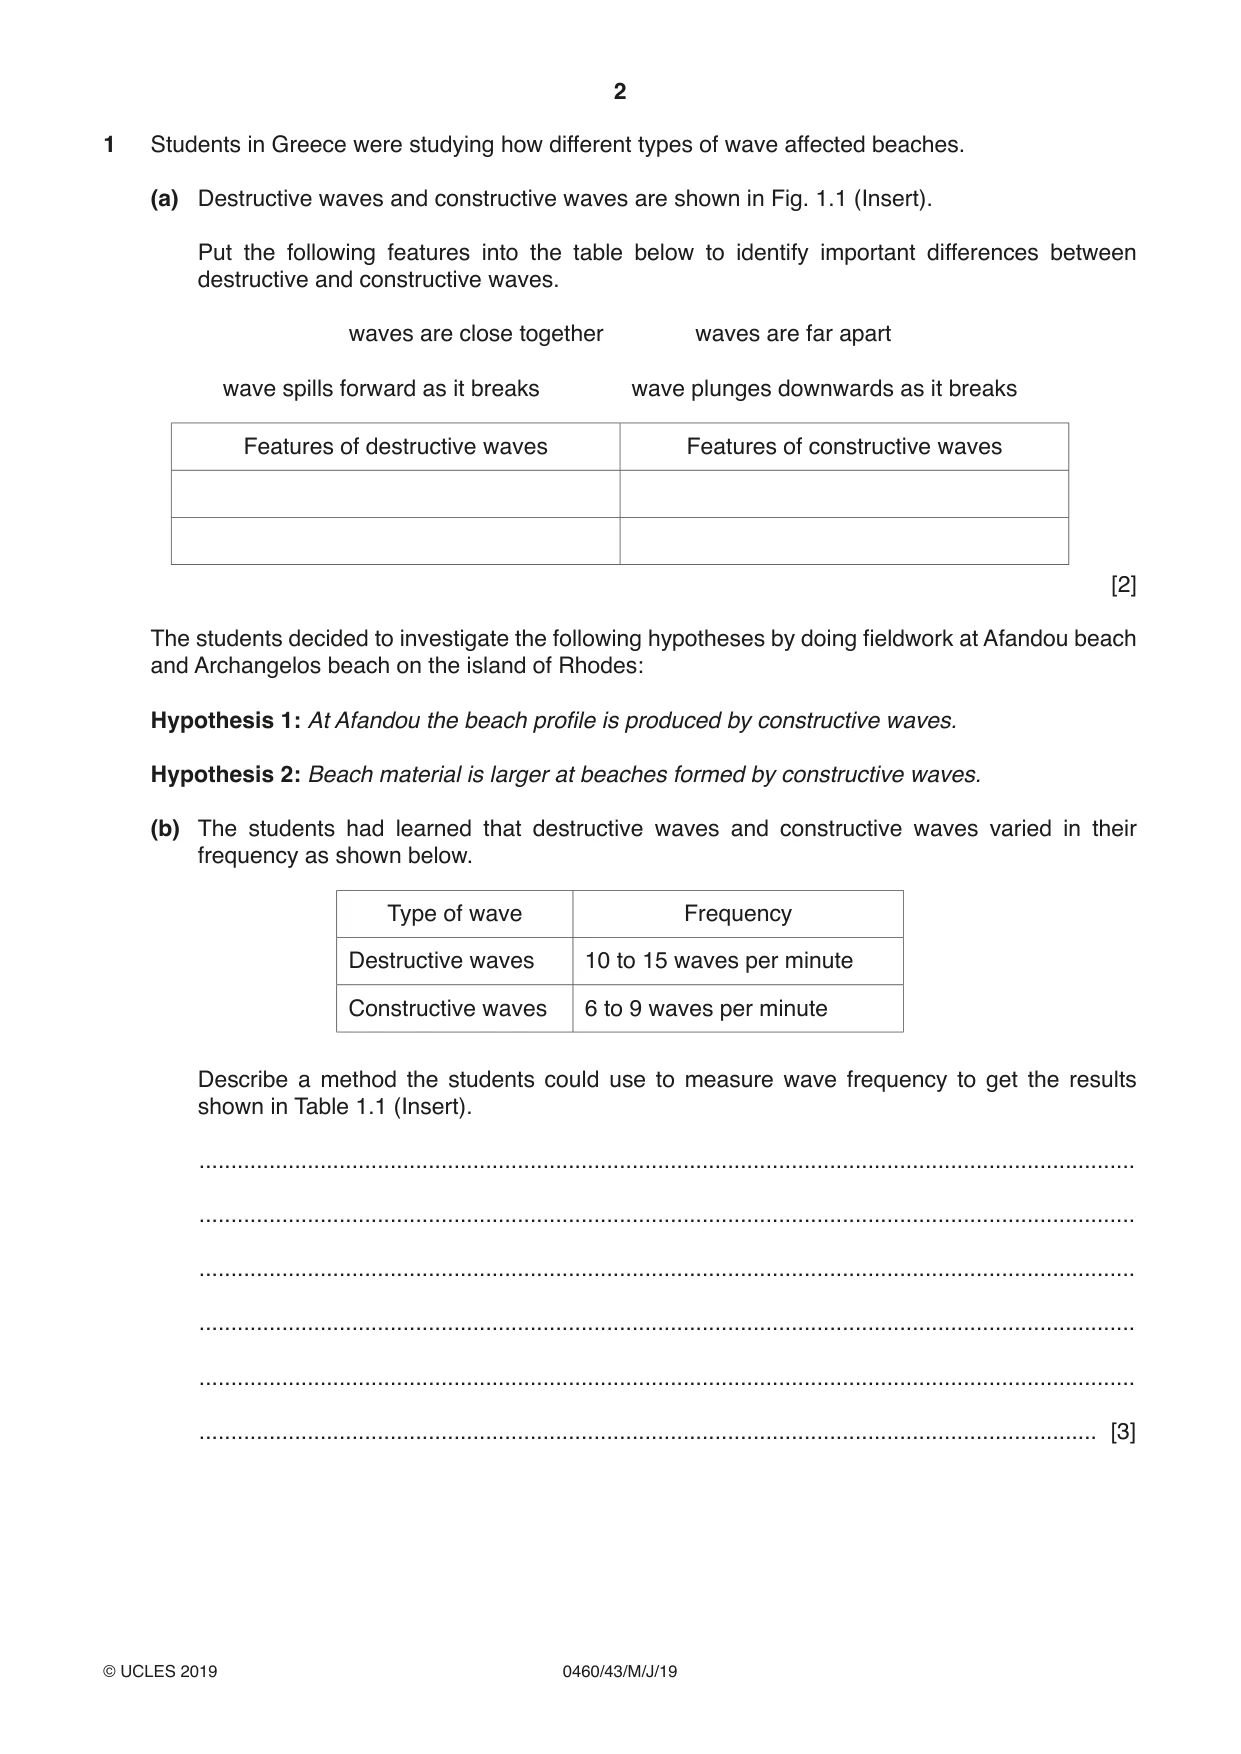
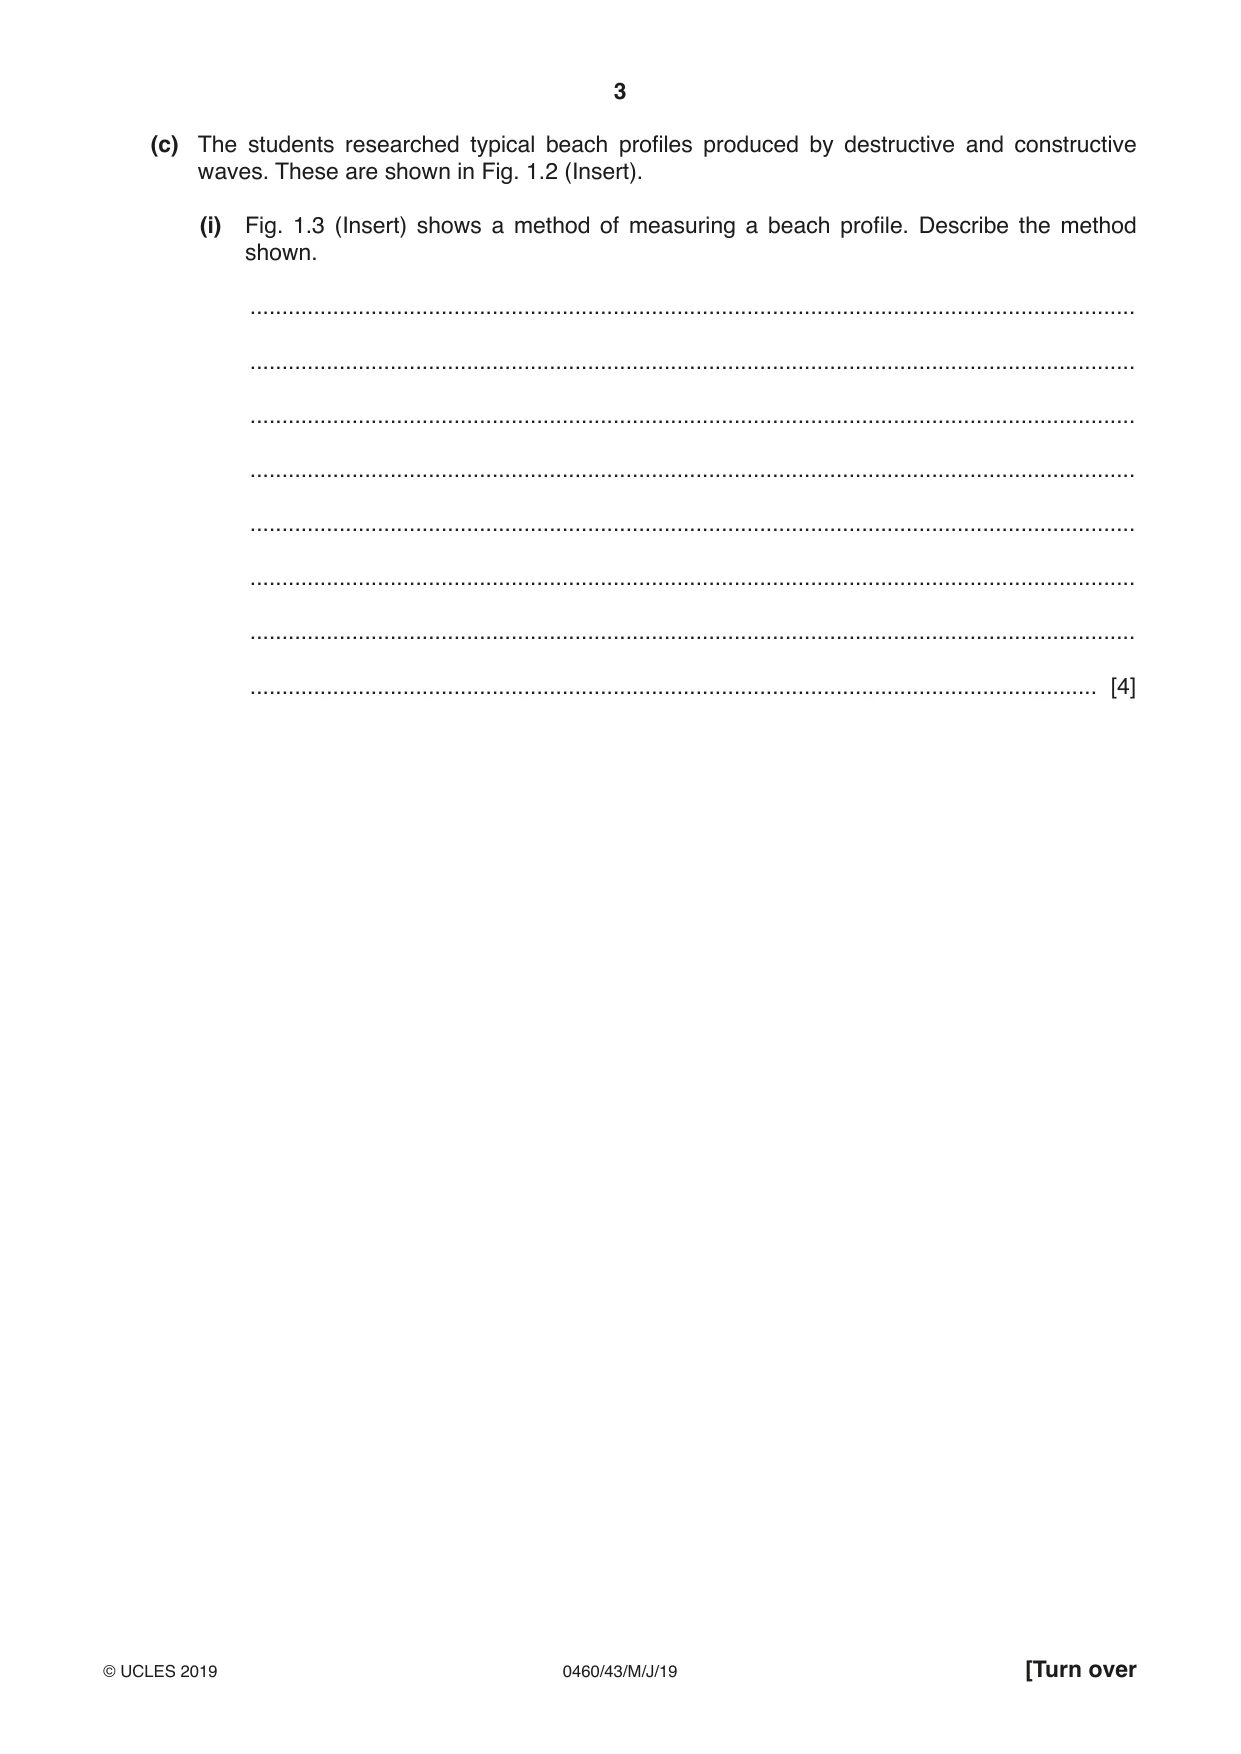
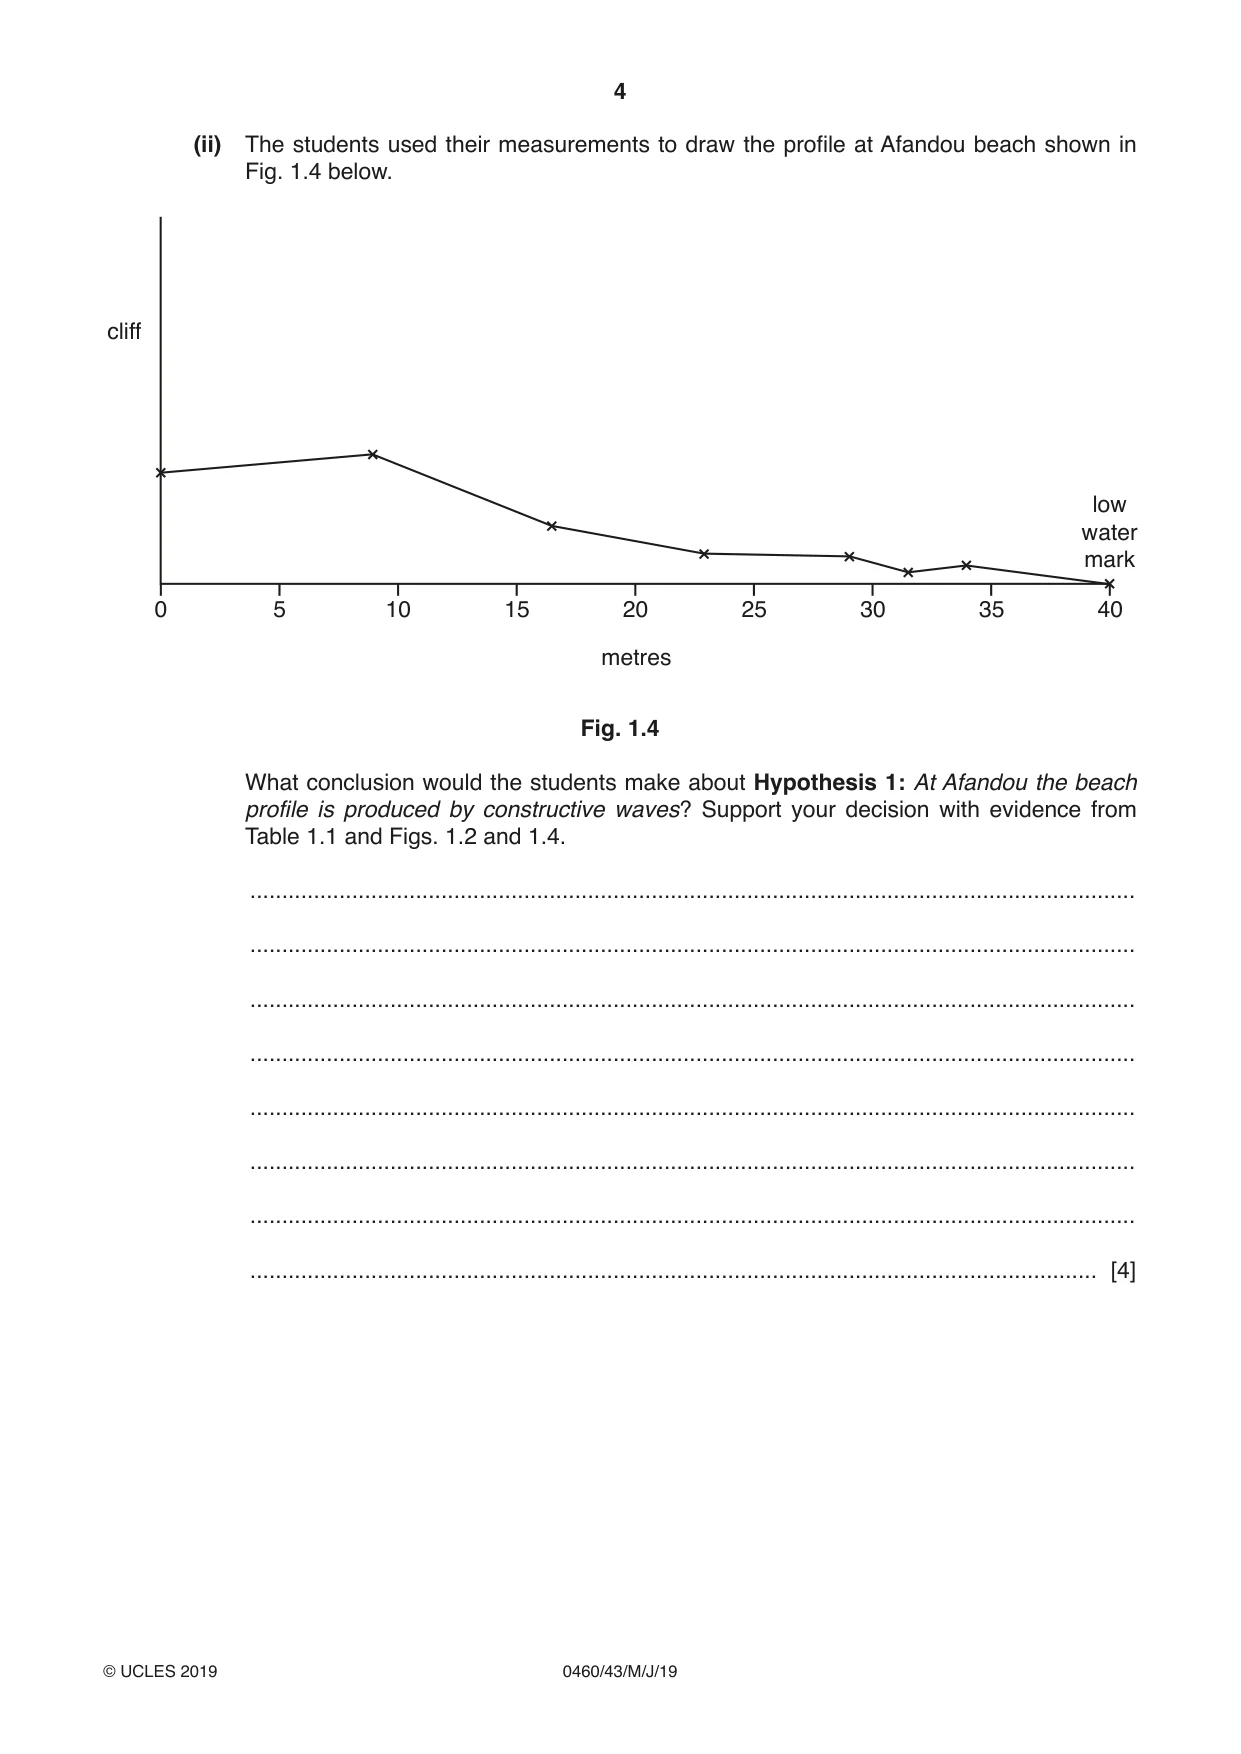
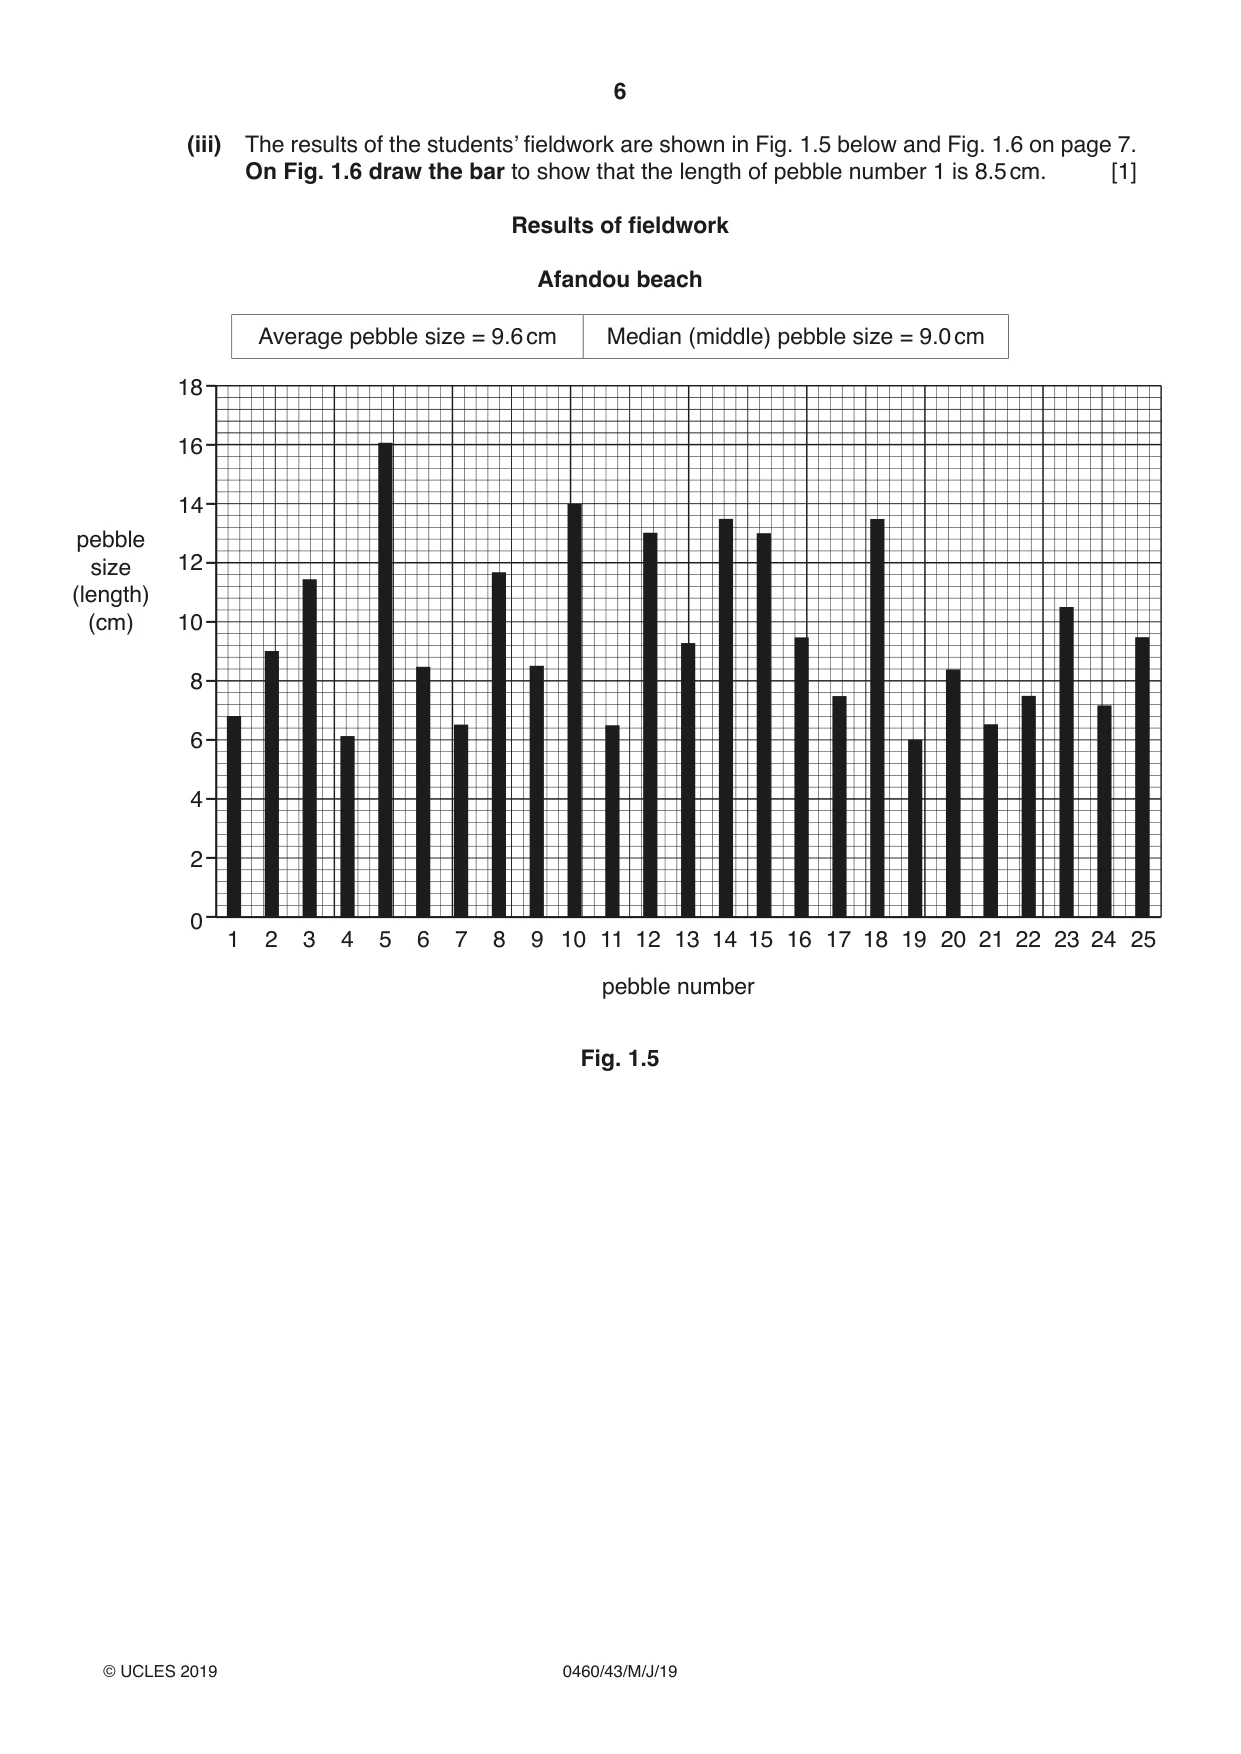
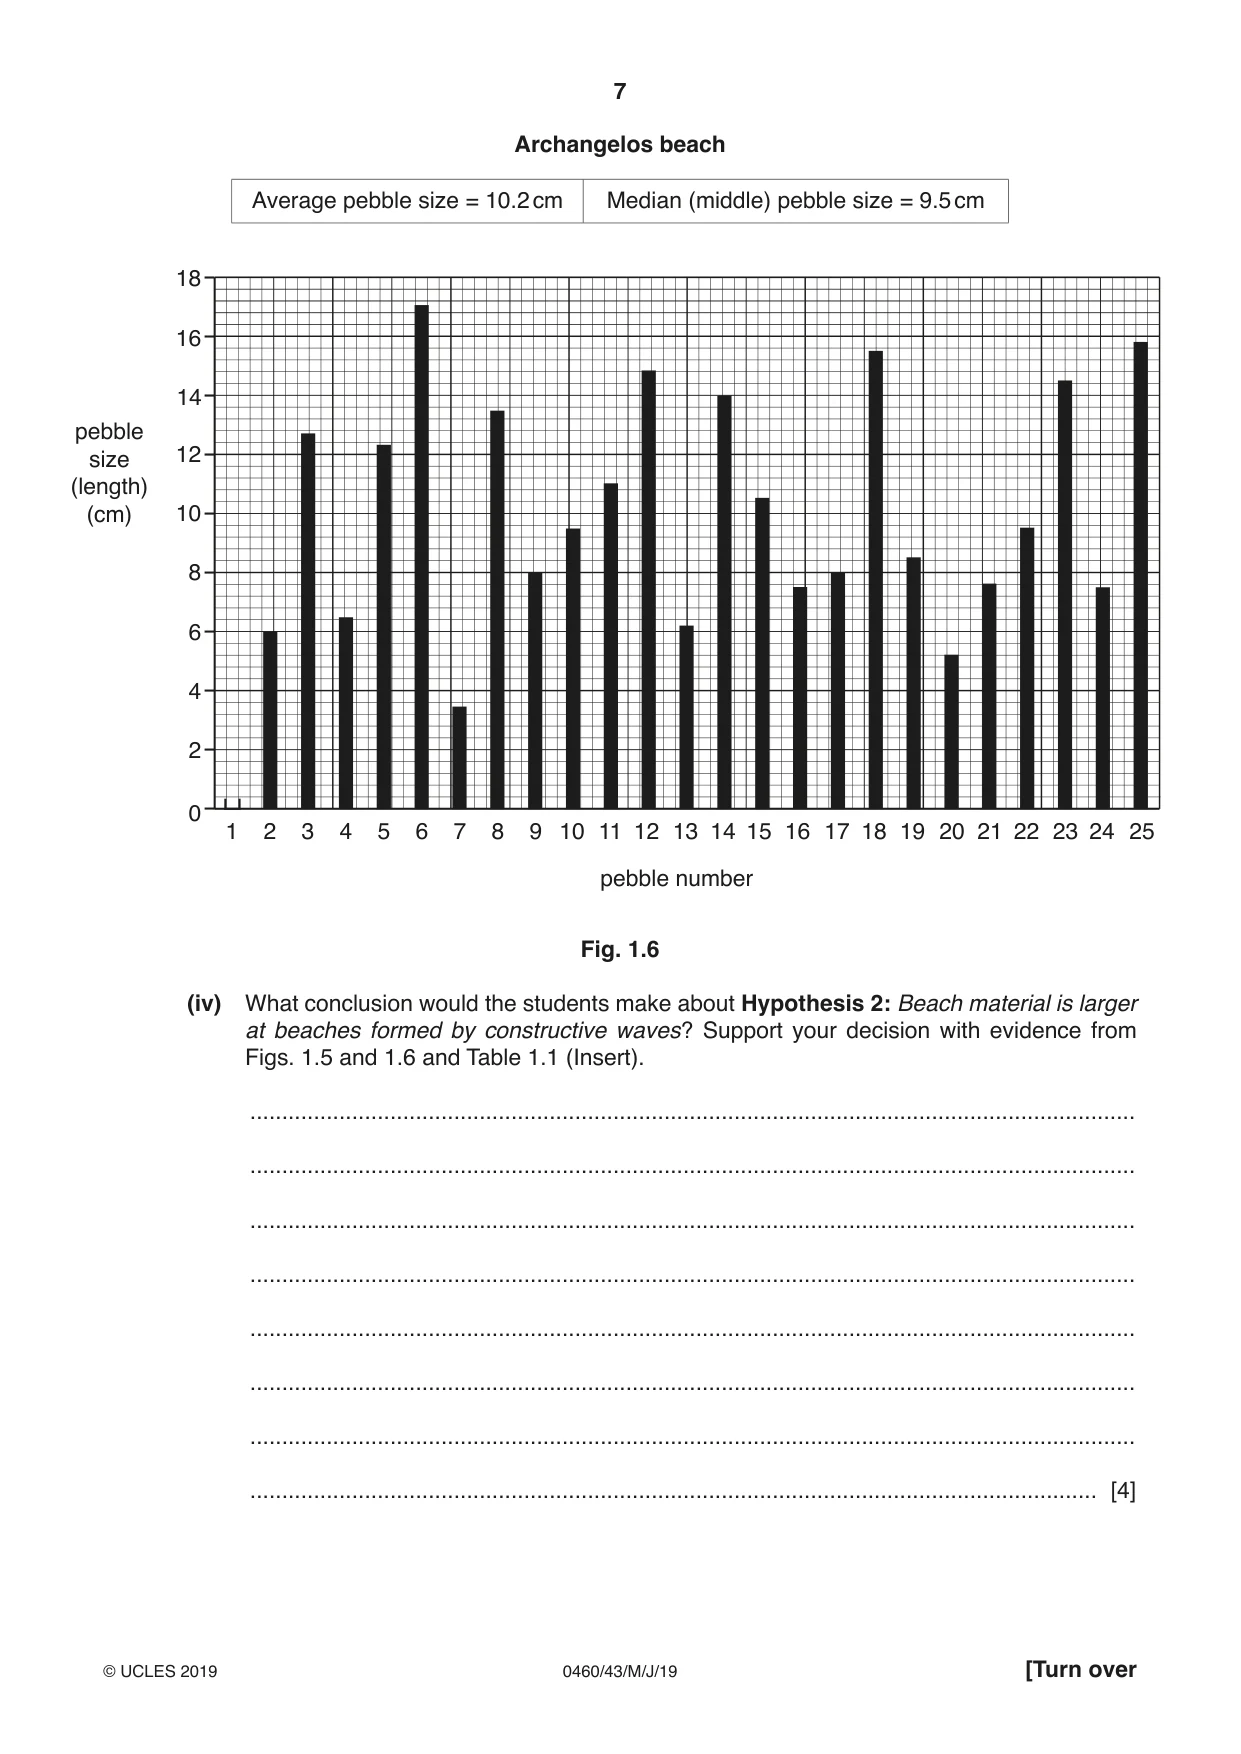
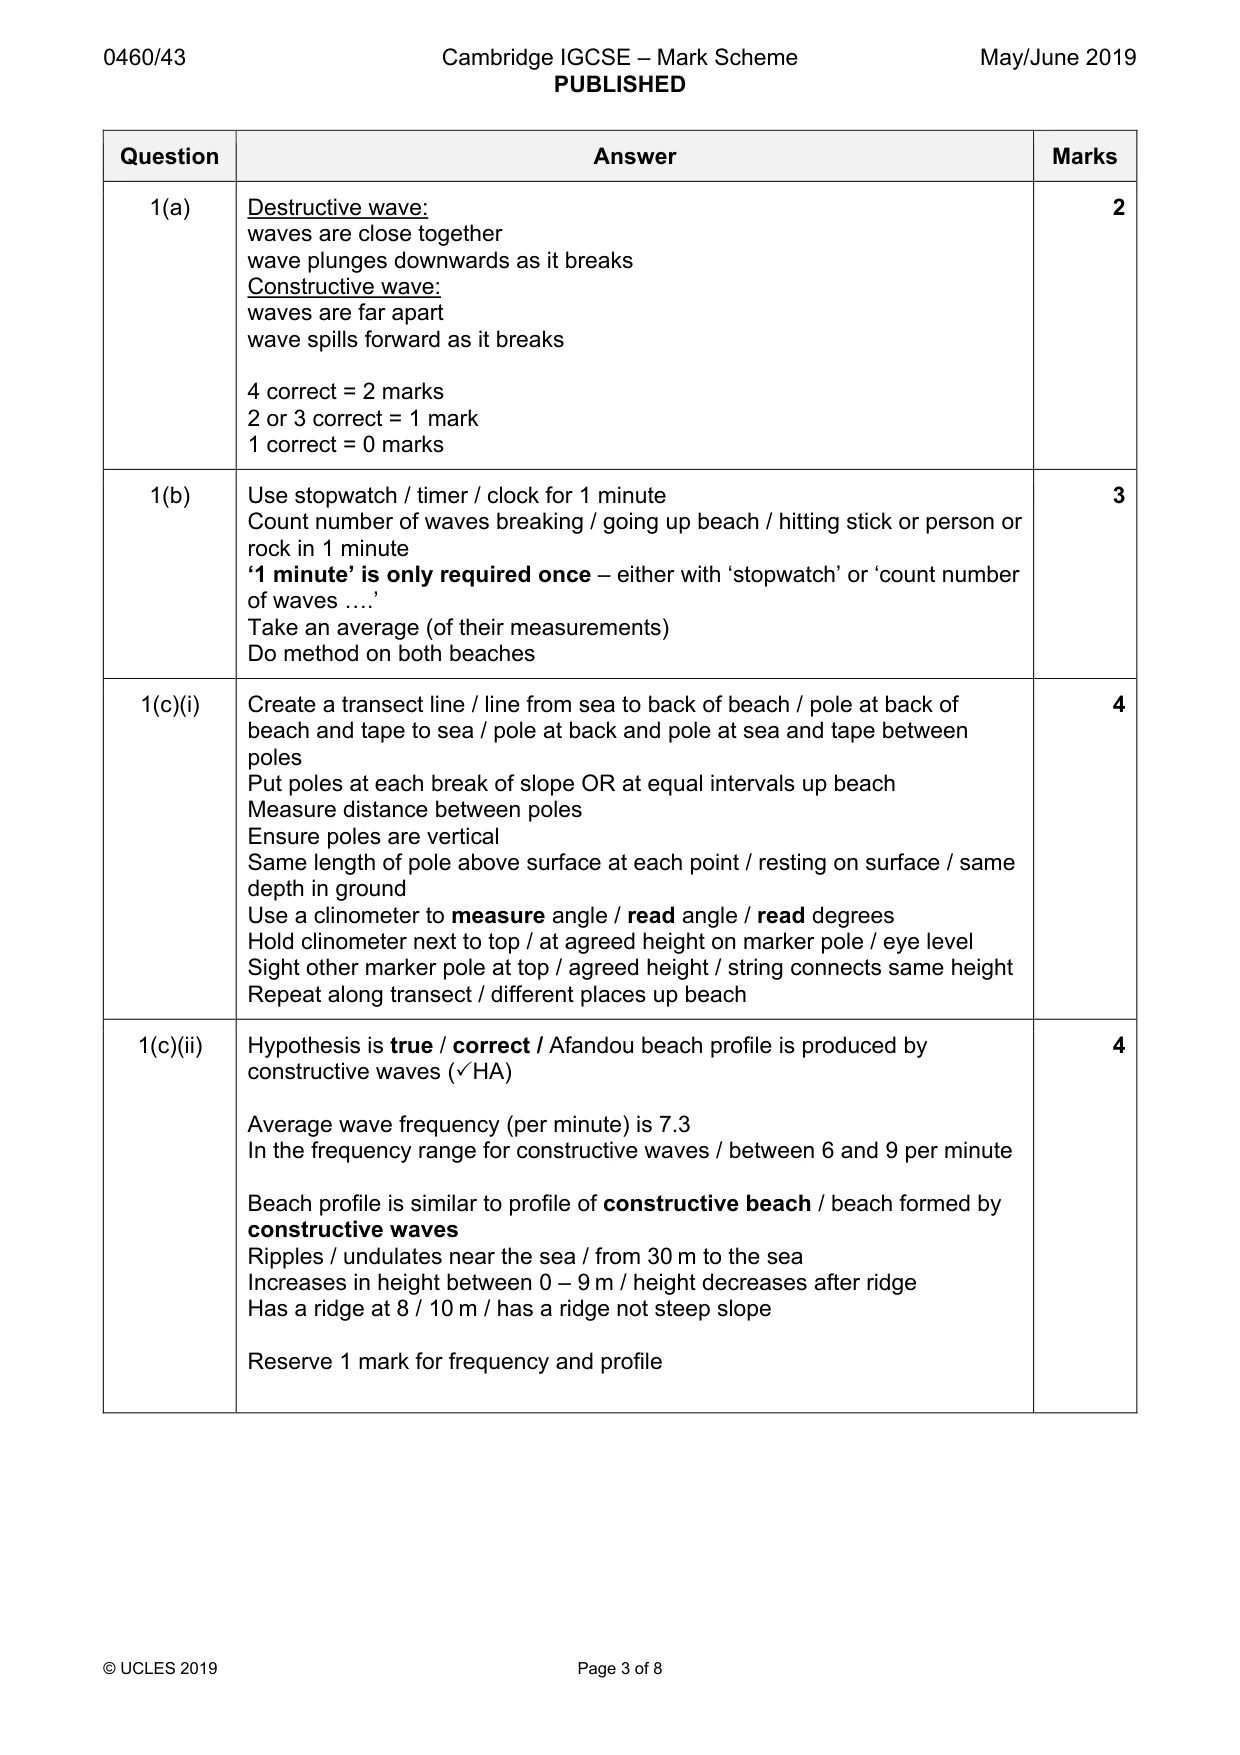
1 Students in Greece were studying how different types of wave affected beaches. (a) Destructive waves and constructive waves are shown in Fig. 1.1 (Insert). Put the following features into the table below to identify important differences between destructive and constructive waves. waves are close together waves are far apart wave spills forward as it breaks wave plunges downwards as it breaks Features of destructive waves Features of constructive waves [2] The students decided to investigate the following hypotheses by doing fieldwork at Afandou beach and Archangelos beach on the island of Rhodes: Hypothesis 1: At Afandou the beach profile is produced by constructive waves. Hypothesis 2: Beach material is larger at beaches formed by constructive waves. (b) The students had learned that destructive waves and constructive waves varied in their frequency as shown below. Type of wave Frequency Destructive waves 10 to 15 waves per minute Constructive waves 6 to 9 waves per minute Describe a method the students could use to measure wave frequency to get the results shown in Table 1.1 (Insert). ................................................................................................................................................... ................................................................................................................................................... ................................................................................................................................................... ................................................................................................................................................... ................................................................................................................................................... ............................................................................................................................................. [3] (c) The students researched typical beach profiles produced by destructive and constructive waves. These are shown in Fig. 1.2 (Insert). (i) Fig. 1.3 (Insert) shows a method of measuring a beach profile. Describe the method shown. ........................................................................................................................................... ........................................................................................................................................... ........................................................................................................................................... ........................................................................................................................................... ........................................................................................................................................... ........................................................................................................................................... ........................................................................................................................................... ..................................................................................................................................... [4] (ii) The students used their measurements to draw the profile at Afandou beach shown in Fig. 1.4 below. cliff low water mark 0 5 10 15 20 25 30 35 40 metres Fig. 1.4 What conclusion would the students make about Hypothesis 1: At Afandou the beach profile is produced by constructive waves? Support your decision with evidence from Table 1.1 and Figs. 1.2 and 1.4. ........................................................................................................................................... ........................................................................................................................................... ........................................................................................................................................... ........................................................................................................................................... ........................................................................................................................................... ........................................................................................................................................... ........................................................................................................................................... ..................................................................................................................................... [4] (d) (i) To investigate Hypothesis 2: Beach material is larger at beaches formed by constructive waves, the students then obtained a sample of pebbles from both beaches. Describe a method they could use to get reliable samples in order to compare them. ........................................................................................................................................... ........................................................................................................................................... ........................................................................................................................................... ........................................................................................................................................... ........................................................................................................................................... ..................................................................................................................................... [3] (ii) Describe a method to measure the size (length) of each pebble the students collected. ........................................................................................................................................... ........................................................................................................................................... ........................................................................................................................................... ........................................................................................................................................... ........................................................................................................................................... ..................................................................................................................................... [2] (iii) The results of the students’ fieldwork are shown in Fig. 1.5 below and Fig. 1.6 on page 7. On Fig. 1.6 draw the bar to show that the length of pebble number 1 is 8.5 cm. [1] Results of fieldwork Afandou beach Average pebble size = 9.6 cm Median (middle) pebble size = 9.0 cm 18 16 14 pebble size 12 (length) (cm) 10 8 6 4 2 0 1 2 3 4 5 6 7 8 9 10 11 12 13 14 15 16 17 18 19 20 21 22 23 24 25 pebble number Fig. 1.5 Archangelos beach Average pebble size = 10.2 cm Median (middle) pebble size = 9.5 cm 18 16 14 pebble size 12 (length) (cm) 10 8 6 4 2 0 1 2 3 4 5 6 7 8 9 10 11 12 13 14 15 16 17 18 19 20 21 22 23 24 25 pebble number Fig. 1.6 (iv) What conclusion would the students make about Hypothesis 2: Beach material is larger at beaches formed by constructive waves? Support your decision with evidence from Figs. 1.5 and 1.6 and Table 1.1 (Insert). ........................................................................................................................................... ........................................................................................................................................... ........................................................................................................................................... ........................................................................................................................................... ........................................................................................................................................... ........................................................................................................................................... ........................................................................................................................................... ..................................................................................................................................... [4] (e) The students planned an additional piece of fieldwork to investigate longshore drift in the area. (i) Describe and explain the process of longshore drift. You may use a diagram in your answer. ........................................................................................................................................... ........................................................................................................................................... ........................................................................................................................................... ........................................................................................................................................... ........................................................................................................................................... ........................................................................................................................................... [3] (ii) Describe a fieldwork method to investigate longshore drift. ........................................................................................................................................... ........................................................................................................................................... ........................................................................................................................................... ........................................................................................................................................... ........................................................................................................................................... ........................................................................................................................................... ........................................................................................................................................... ..................................................................................................................................... [4] [Total: 30]
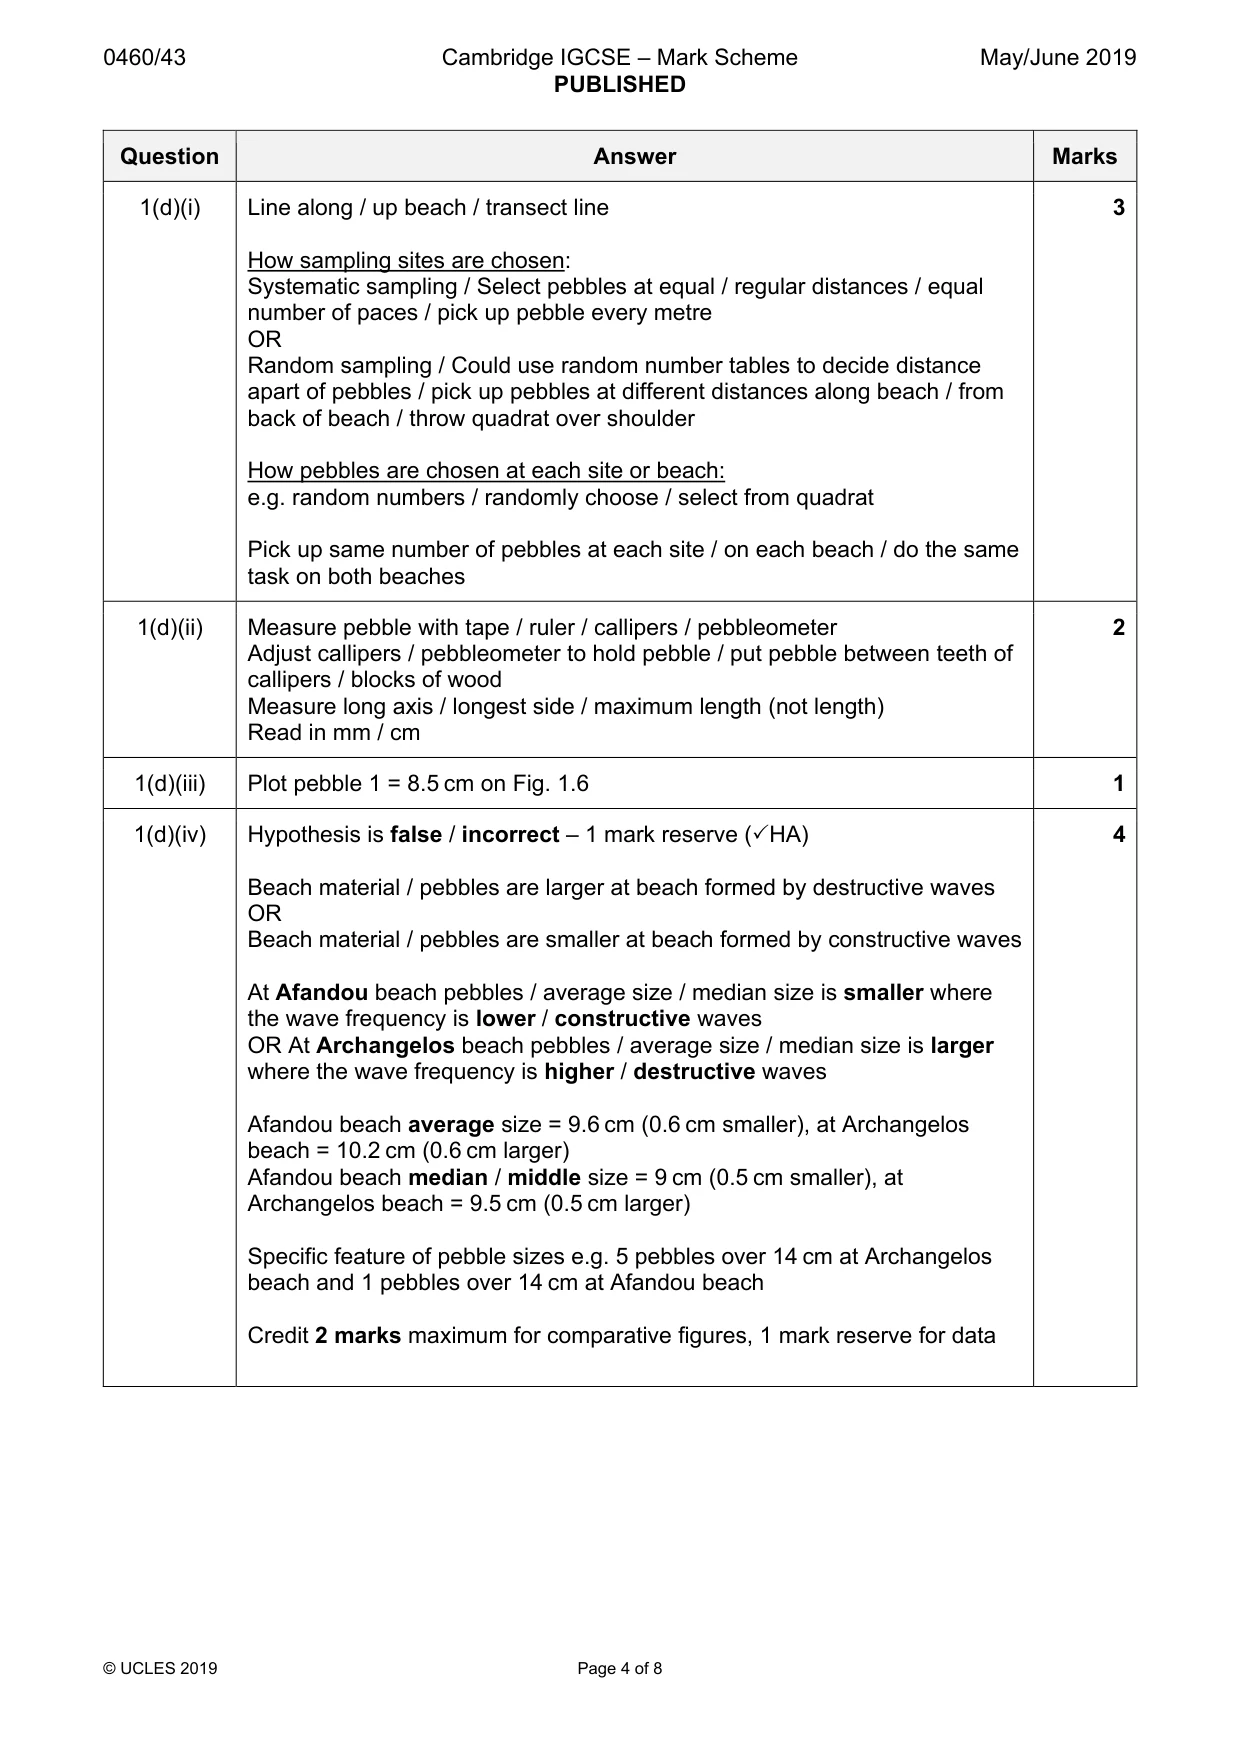
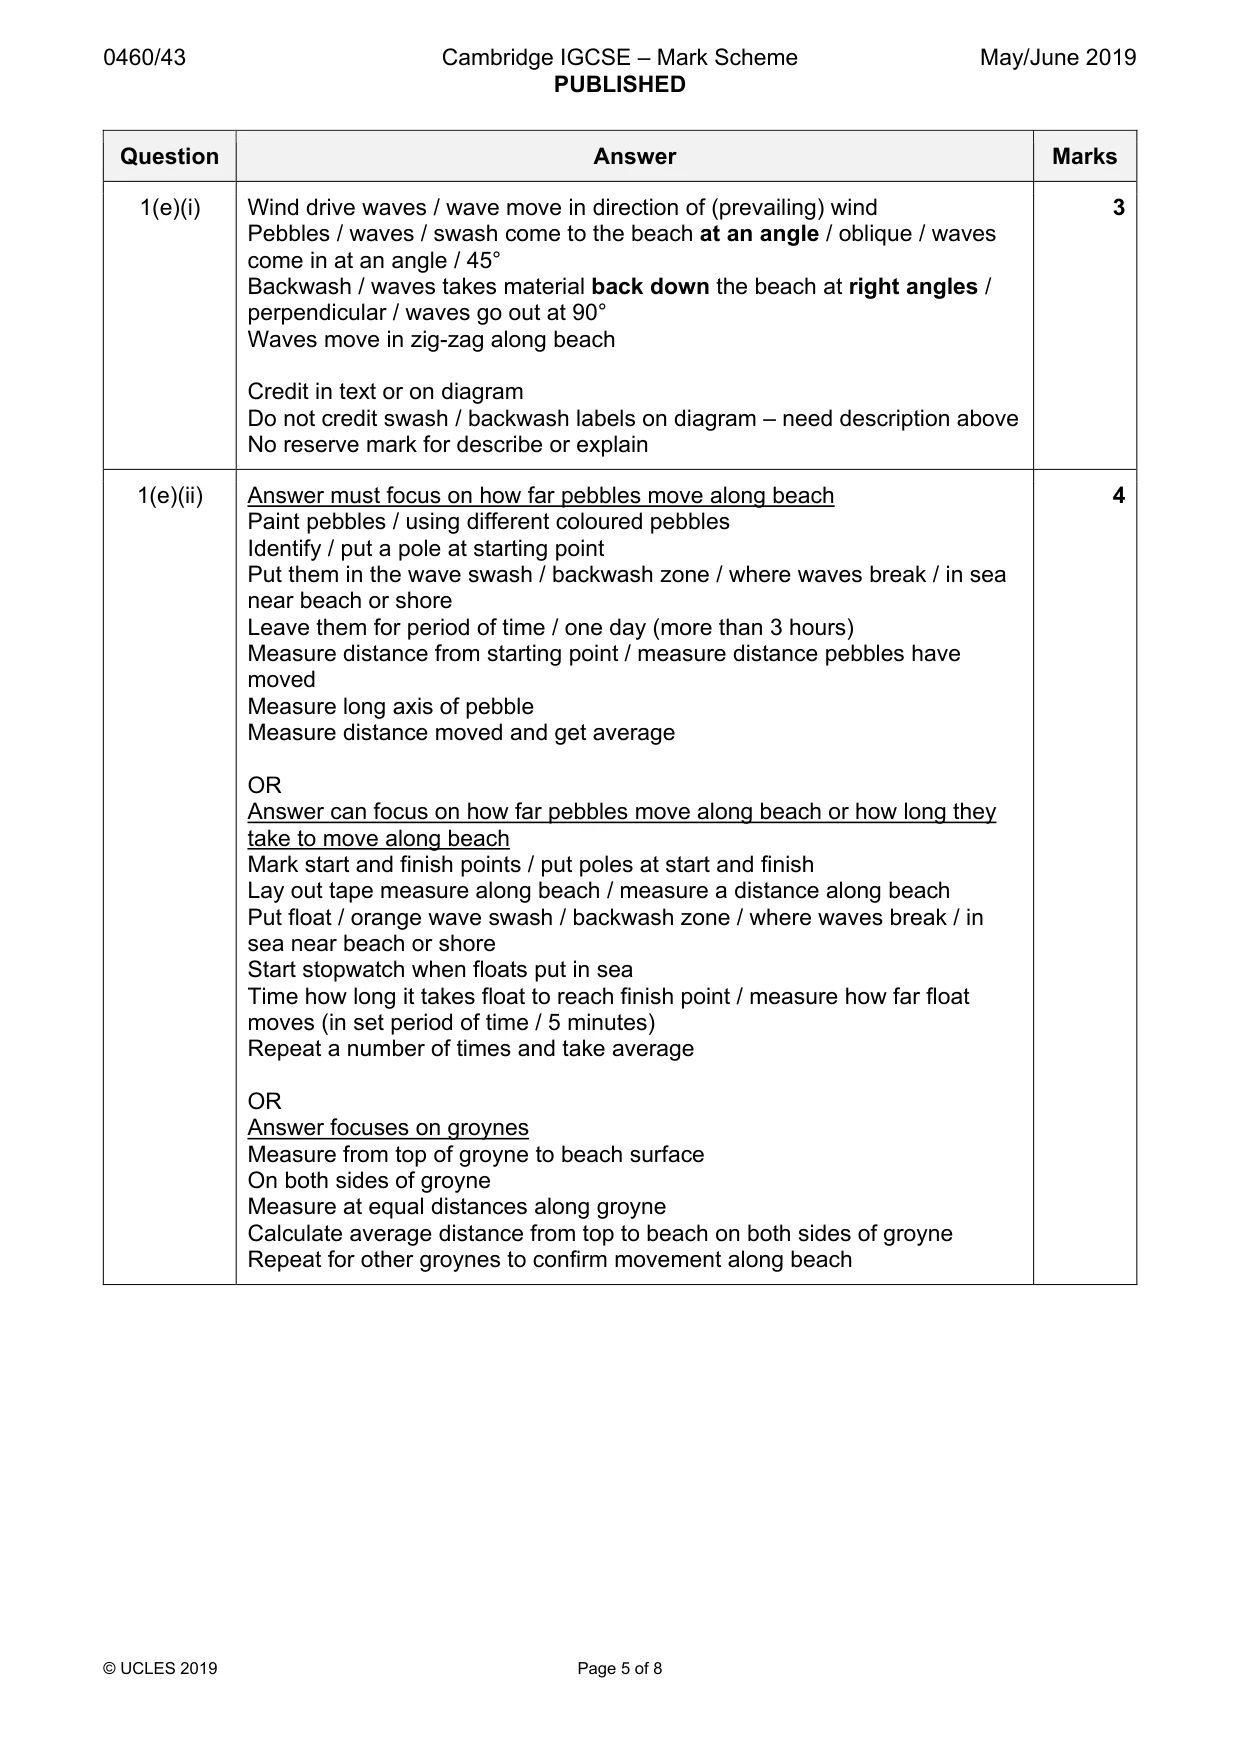
Mark scheme: Question Answer Marks 1(a) Destructive wave: 2 waves are close together wave plunges downwards as it breaks Constructive wave: waves are far apart wave spills forward as it breaks 4 correct = 2 marks 2 or 3 correct = 1 mark 1 correct = 0 marks 1(b) Use stopwatch / timer / clock for 1 minute 3 Count number of waves breaking / going up beach / hitting stick or person or rock in 1 minute ‘1 minute’ is only required once – either with ‘stopwatch’ or ‘count number of waves «.’ Take an average (of their measurements) Do method on both beaches 1(c)(i) Create a transect line / line from sea to back of beach / pole at back of 4 beach and tape to sea / pole at back and pole at sea and tape between poles Put poles at each break of slope OR at equal intervals up beach Measure distance between poles Ensure poles are vertical Same length of pole above surface at each point / resting on surface / same depth in ground Use a clinometer to measure angle / read angle / read degrees Hold clinometer next to top / at agreed height on marker pole / eye level Sight other marker pole at top / agreed height / string connects same height Repeat along transect / different places up beach 1(c)(ii) Hypothesis is true / correct / Afandou beach profile is produced by 4 constructive waves (3HA) Average wave frequency (per minute) is 7.3 In the frequency range for constructive waves / between 6 and 9 per minute Beach profile is similar to profile of constructive beach / beach formed by constructive waves Ripples / undulates near the sea / from 30 m to the sea Increases in height between 0 – 9 m / height decreases after ridge Has a ridge at 8 / 10 m / has a ridge not steep slope Reserve 1 mark for frequency and profile 1(d)(i) Line along / up beach / transect line 3 How sampling sites are chosen: Systematic sampling / Select pebbles at equal / regular distances / equal number of paces / pick up pebble every metre OR Random sampling / Could use random number tables to decide distance apart of pebbles / pick up pebbles at different distances along beach / from back of beach / throw quadrat over shoulder How pebbles are chosen at each site or beach: e.g. random numbers / randomly choose / select from quadrat Pick up same number of pebbles at each site / on each beach / do the same task on both beaches 1(d)(ii) Measure pebble with tape / ruler / callipers / pebbleometer 2 Adjust callipers / pebbleometer to hold pebble / put pebble between teeth of callipers / blocks of wood Measure long axis / longest side / maximum length (not length) Read in mm / cm 1(d)(iii) Plot pebble 1 = 8.5 cm on Fig. 1.6 1 1(d)(iv) Hypothesis is false / incorrect – 1 mark reserve (3HA) 4 Beach material / pebbles are larger at beach formed by destructive waves OR Beach material / pebbles are smaller at beach formed by constructive waves At Afandou beach pebbles / average size / median size is smaller where the wave frequency is lower / constructive waves OR At Archangelos beach pebbles / average size / median size is larger where the wave frequency is higher / destructive waves Afandou beach average size = 9.6 cm (0.6 cm smaller), at Archangelos beach = 10.2 cm (0.6 cm larger) Afandou beach median / middle size = 9 cm (0.5 cm smaller), at Archangelos beach = 9.5 cm (0.5 cm larger) Specific feature of pebble sizes e.g. 5 pebbles over 14 cm at Archangelos beach and 1 pebbles over 14 cm at Afandou beach Credit 2 marks maximum for comparative figures, 1 mark reserve for data 1(e)(i) Wind drive waves / wave move in direction of (prevailing) wind 3 Pebbles / waves / swash come to the beach at an angle / oblique / waves come in at an angle / 45° Backwash / waves takes material back down the beach at right angles / perpendicular / waves go out at 90° Waves move in zig-zag along beach Credit in text or on diagram Do not credit swash / backwash labels on diagram – need description above No reserve mark for describe or explain 1(e)(ii) Answer must focus on how far pebbles move along beach 4 Paint pebbles / using different coloured pebbles Identify / put a pole at starting point Put them in the wave swash / backwash zone / where waves break / in sea near beach or shore Leave them for period of time / one day (more than 3 hours) Measure distance from starting point / measure distance pebbles have moved Measure long axis of pebble Measure distance moved and get average OR Answer can focus on how far pebbles move along beach or how long they take to move along beach Mark start and finish points / put poles at start and finish Lay out tape measure along beach / measure a distance along beach Put float / orange wave swash / backwash zone / where waves break / in sea near beach or shore Start stopwatch when floats put in sea Time how long it takes float to reach finish point / measure how far float moves (in set period of time / 5 minutes) Repeat a number of times and take average OR Answer focuses on groynes Measure from top of groyne to beach surface On both sides of groyne Measure at equal distances along groyne Calculate average distance from top to beach on both sides of groyne Repeat for other groynes to confirm movement along beach
Q2 · Students in the UK did some fieldwork to compare two residential areas of the ‘inner city’
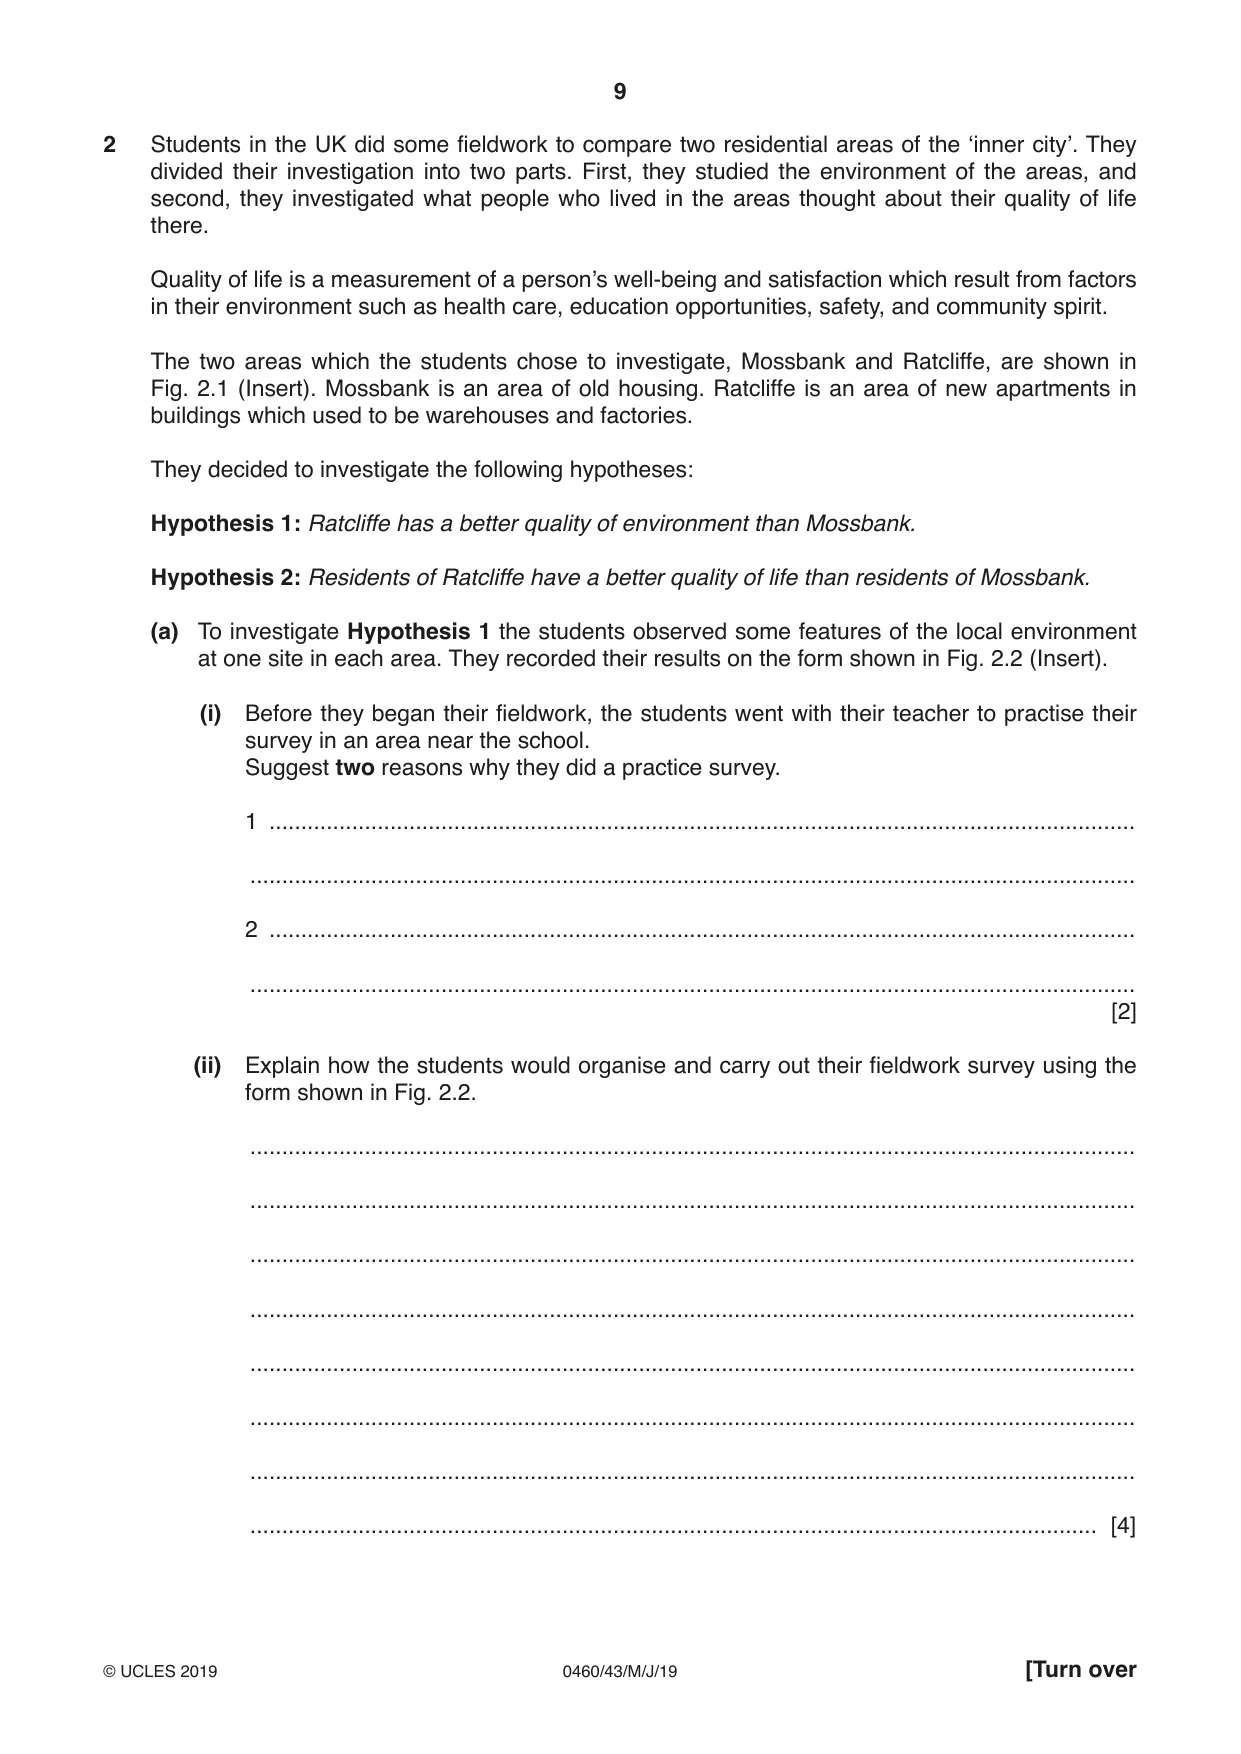
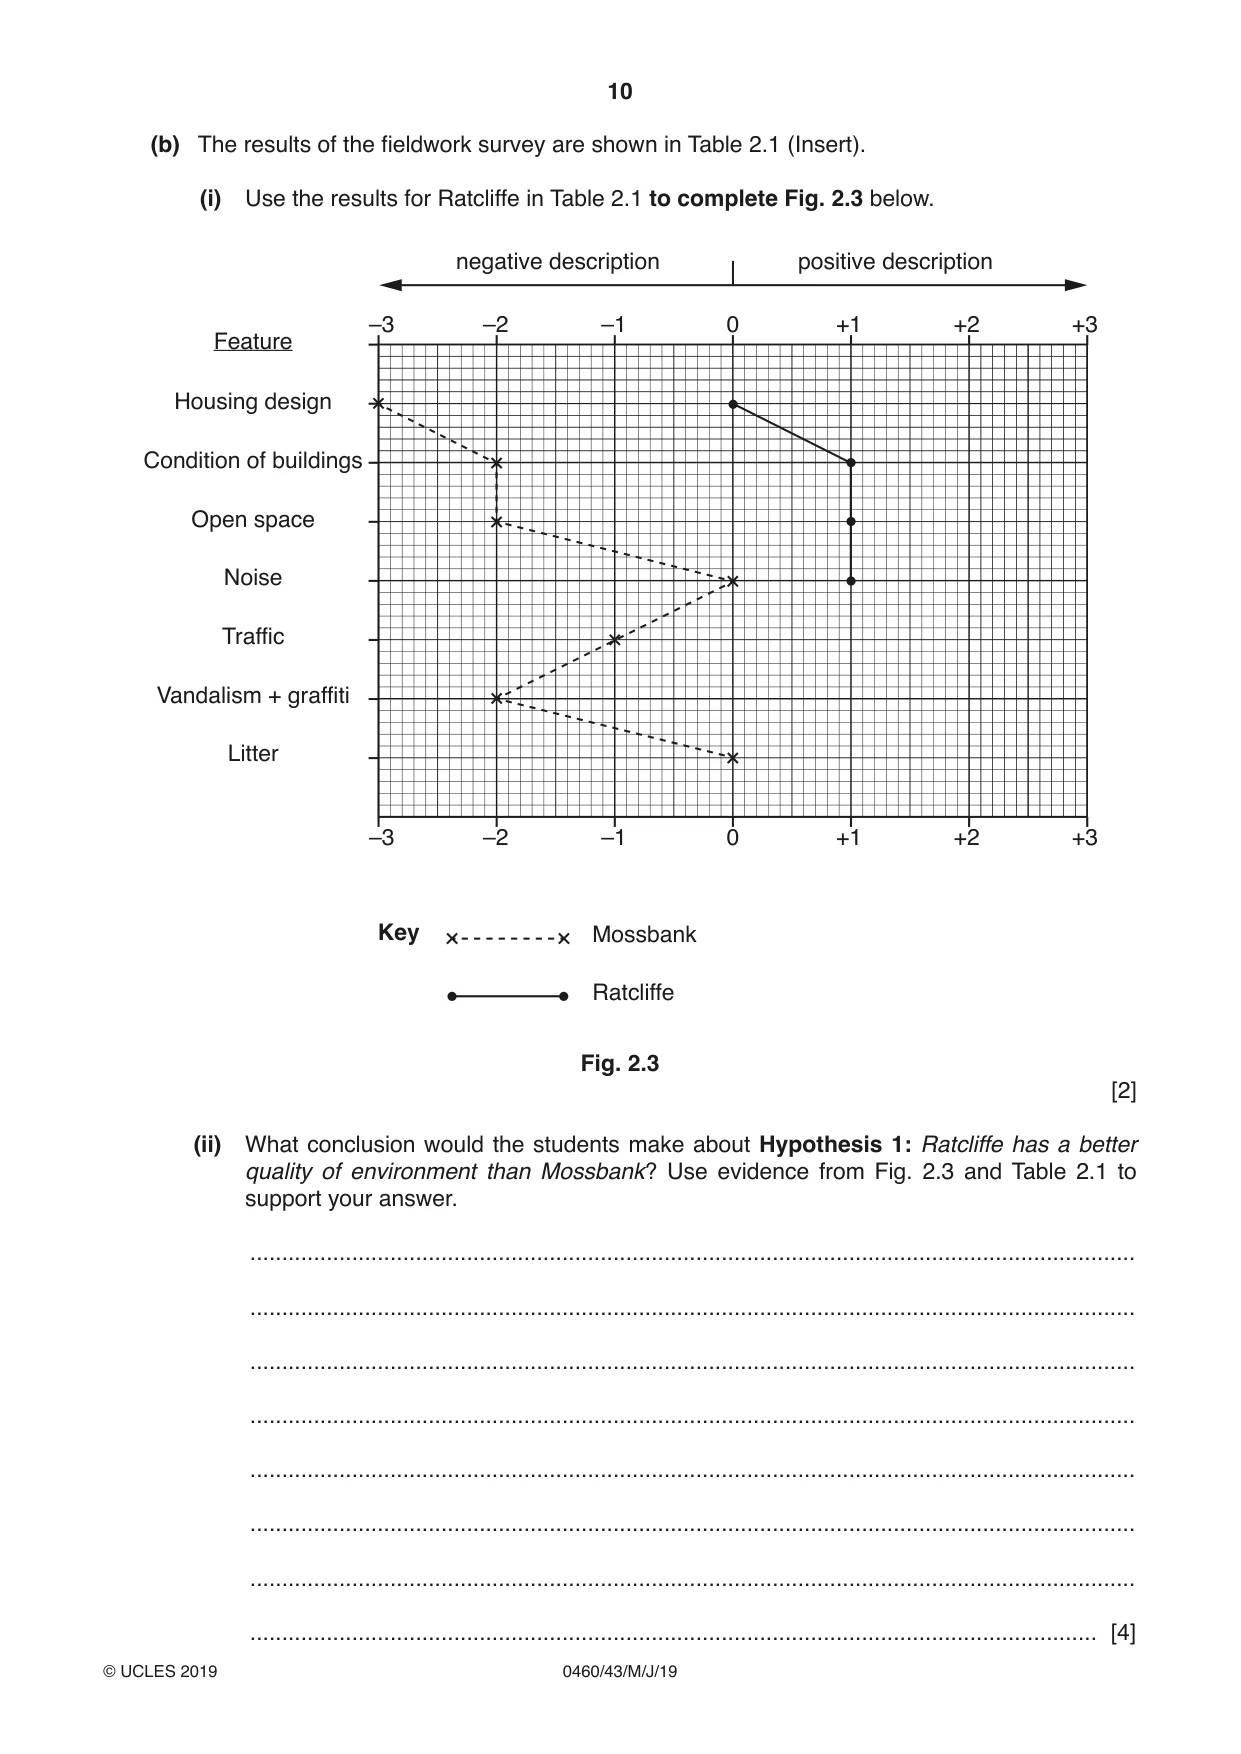
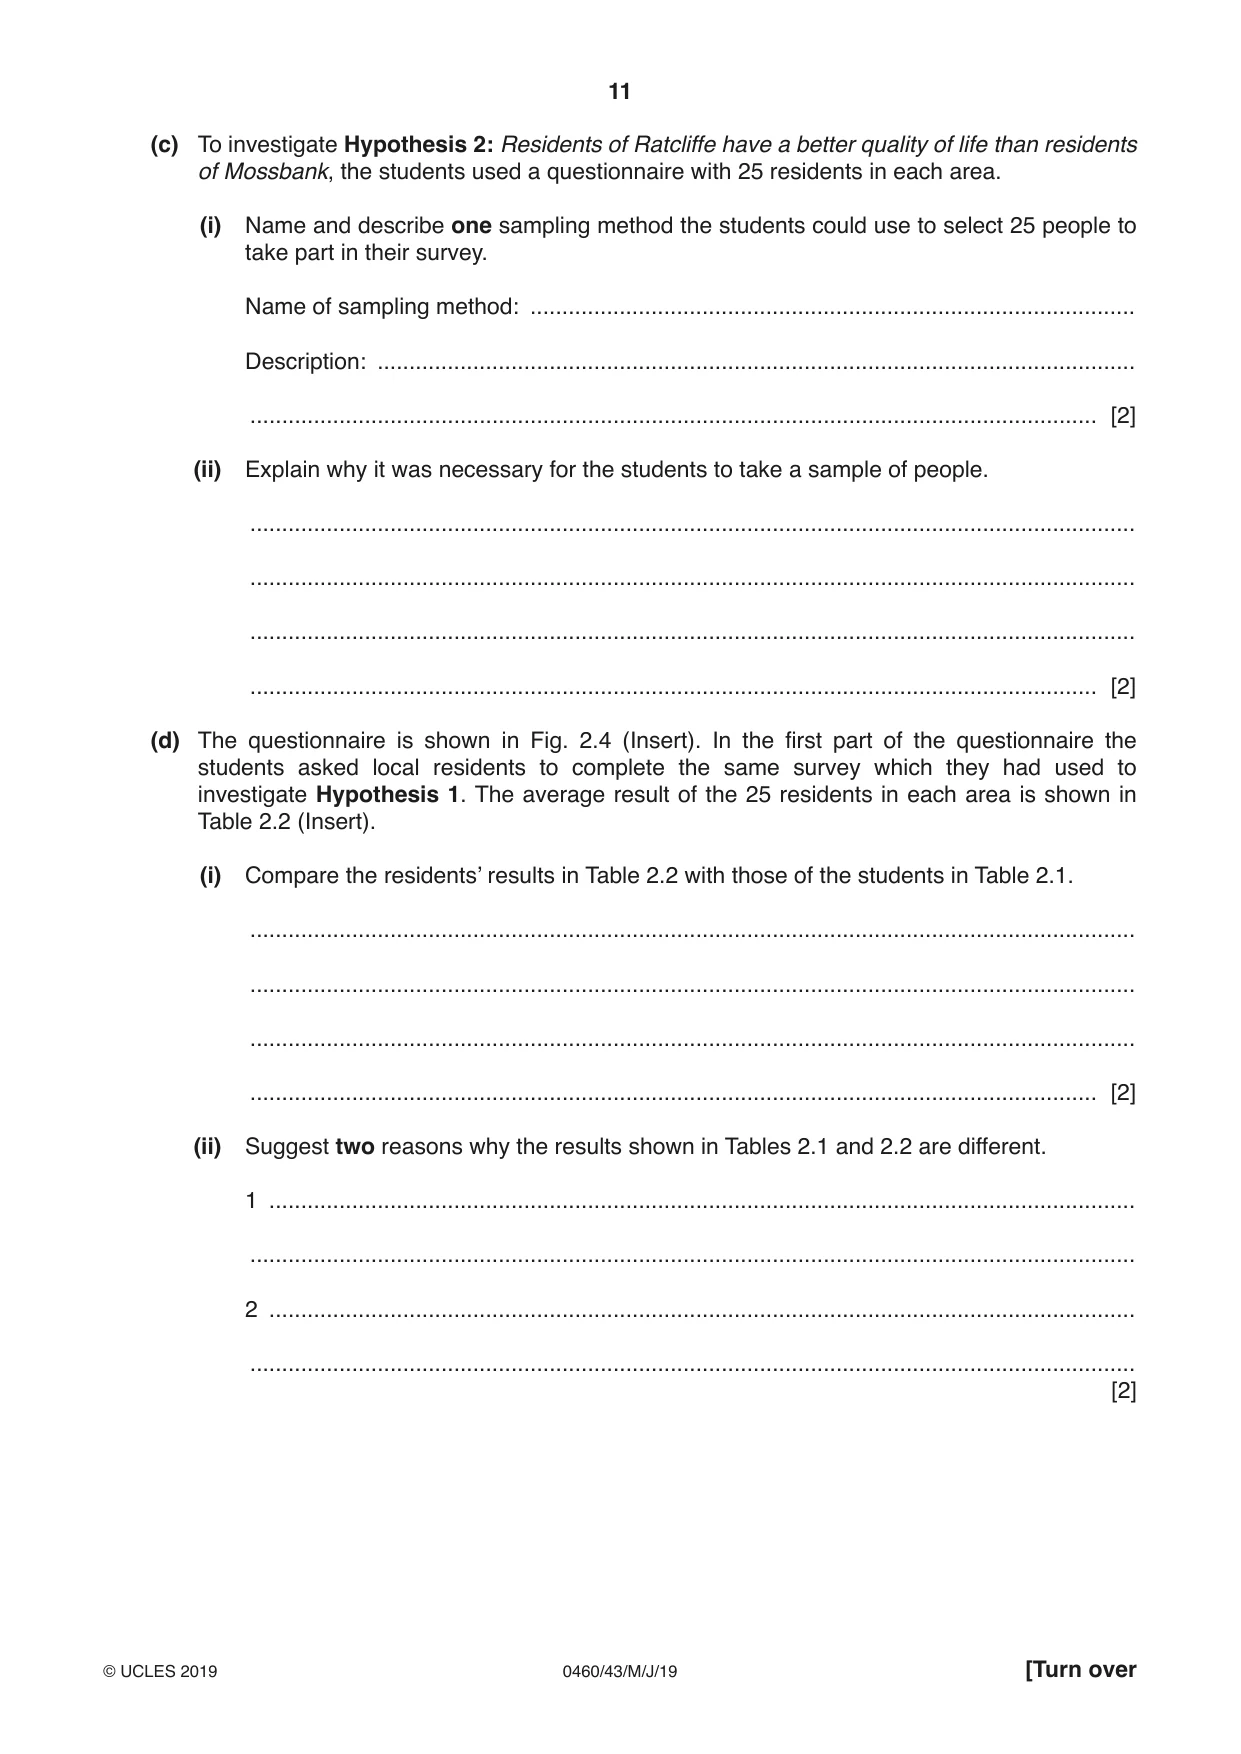
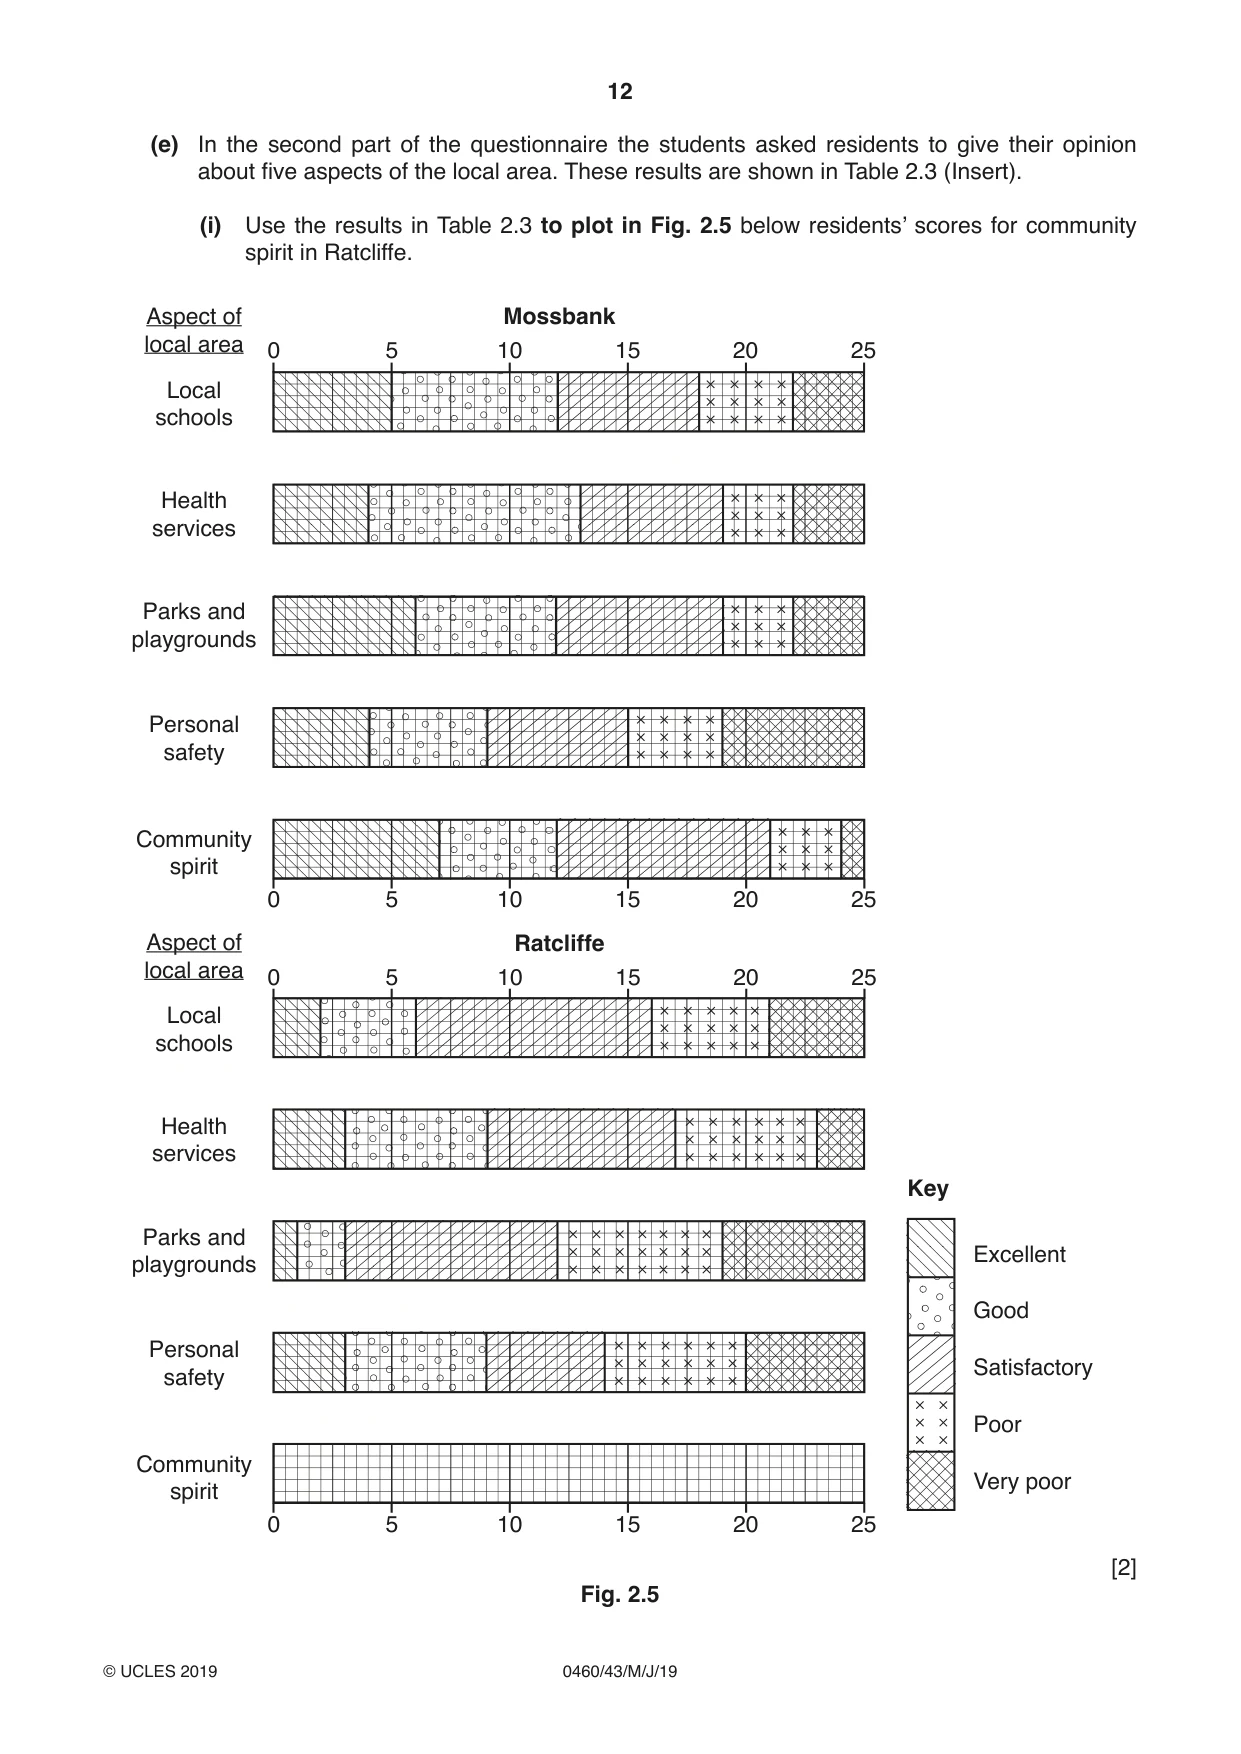
2 Students in the UK did some fieldwork to compare two residential areas of the ‘inner city’. They divided their investigation into two parts. First, they studied the environment of the areas, and second, they investigated what people who lived in the areas thought about their quality of life there. Quality of life is a measurement of a person’s well-being and satisfaction which result from factors in their environment such as health care, education opportunities, safety, and community spirit. The two areas which the students chose to investigate, Mossbank and Ratcliffe, are shown in Fig. 2.1 (Insert). Mossbank is an area of old housing. Ratcliffe is an area of new apartments in buildings which used to be warehouses and factories. They decided to investigate the following hypotheses: Hypothesis 1: Ratcliffe has a better quality of environment than Mossbank. Hypothesis 2: Residents of Ratcliffe have a better quality of life than residents of Mossbank. (a) To investigate Hypothesis 1 the students observed some features of the local environment at one site in each area. They recorded their results on the form shown in Fig. 2.2 (Insert). (i) Before they began their fieldwork, the students went with their teacher to practise their survey in an area near the school. Suggest two reasons why they did a practice survey. 1 ........................................................................................................................................ ........................................................................................................................................... 2 ........................................................................................................................................ ........................................................................................................................................... [2] (ii) Explain how the students would organise and carry out their fieldwork survey using the form shown in Fig. 2.2. ........................................................................................................................................... ........................................................................................................................................... ........................................................................................................................................... ........................................................................................................................................... ........................................................................................................................................... ........................................................................................................................................... ........................................................................................................................................... ..................................................................................................................................... [4] (b) The results of the fieldwork survey are shown in Table 2.1 (Insert). (i) Use the results for Ratcliffe in Table 2.1 to complete Fig. 2.3 below. negative description positive description –3 –2 –1 0 +1 +2 +3 Feature Housing design Condition of buildings Open space Noise Traffic Vandalism + graffiti Litter –3 –2 –1 0 +1 +2 +3 Key Mossbank Ratcliffe Fig. 2.3 [2] (ii) What conclusion would the students make about Hypothesis 1: Ratcliffe has a better quality of environment than Mossbank? Use evidence from Fig. 2.3 and Table 2.1 to support your answer. ........................................................................................................................................... ........................................................................................................................................... ........................................................................................................................................... ........................................................................................................................................... ........................................................................................................................................... ........................................................................................................................................... ........................................................................................................................................... ..................................................................................................................................... [4] (c) To investigate Hypothesis 2: Residents of Ratcliffe have a better quality of life than residents of Mossbank, the students used a questionnaire with 25 residents in each area. (i) Name and describe one sampling method the students could use to select 25 people to take part in their survey. Name of sampling method: ............................................................................................... Description: ....................................................................................................................... ..................................................................................................................................... [2] (ii) Explain why it was necessary for the students to take a sample of people. ........................................................................................................................................... ........................................................................................................................................... ........................................................................................................................................... ..................................................................................................................................... [2] (d) The questionnaire is shown in Fig. 2.4 (Insert). In the first part of the questionnaire the students asked local residents to complete the same survey which they had used to investigate Hypothesis 1. The average result of the 25 residents in each area is shown in Table 2.2 (Insert). (i) Compare the residents’ results in Table 2.2 with those of the students in Table 2.1. ........................................................................................................................................... ........................................................................................................................................... ........................................................................................................................................... ..................................................................................................................................... [2] (ii) Suggest two reasons why the results shown in Tables 2.1 and 2.2 are different. 1 ........................................................................................................................................ ........................................................................................................................................... 2 ........................................................................................................................................ ........................................................................................................................................... [2]
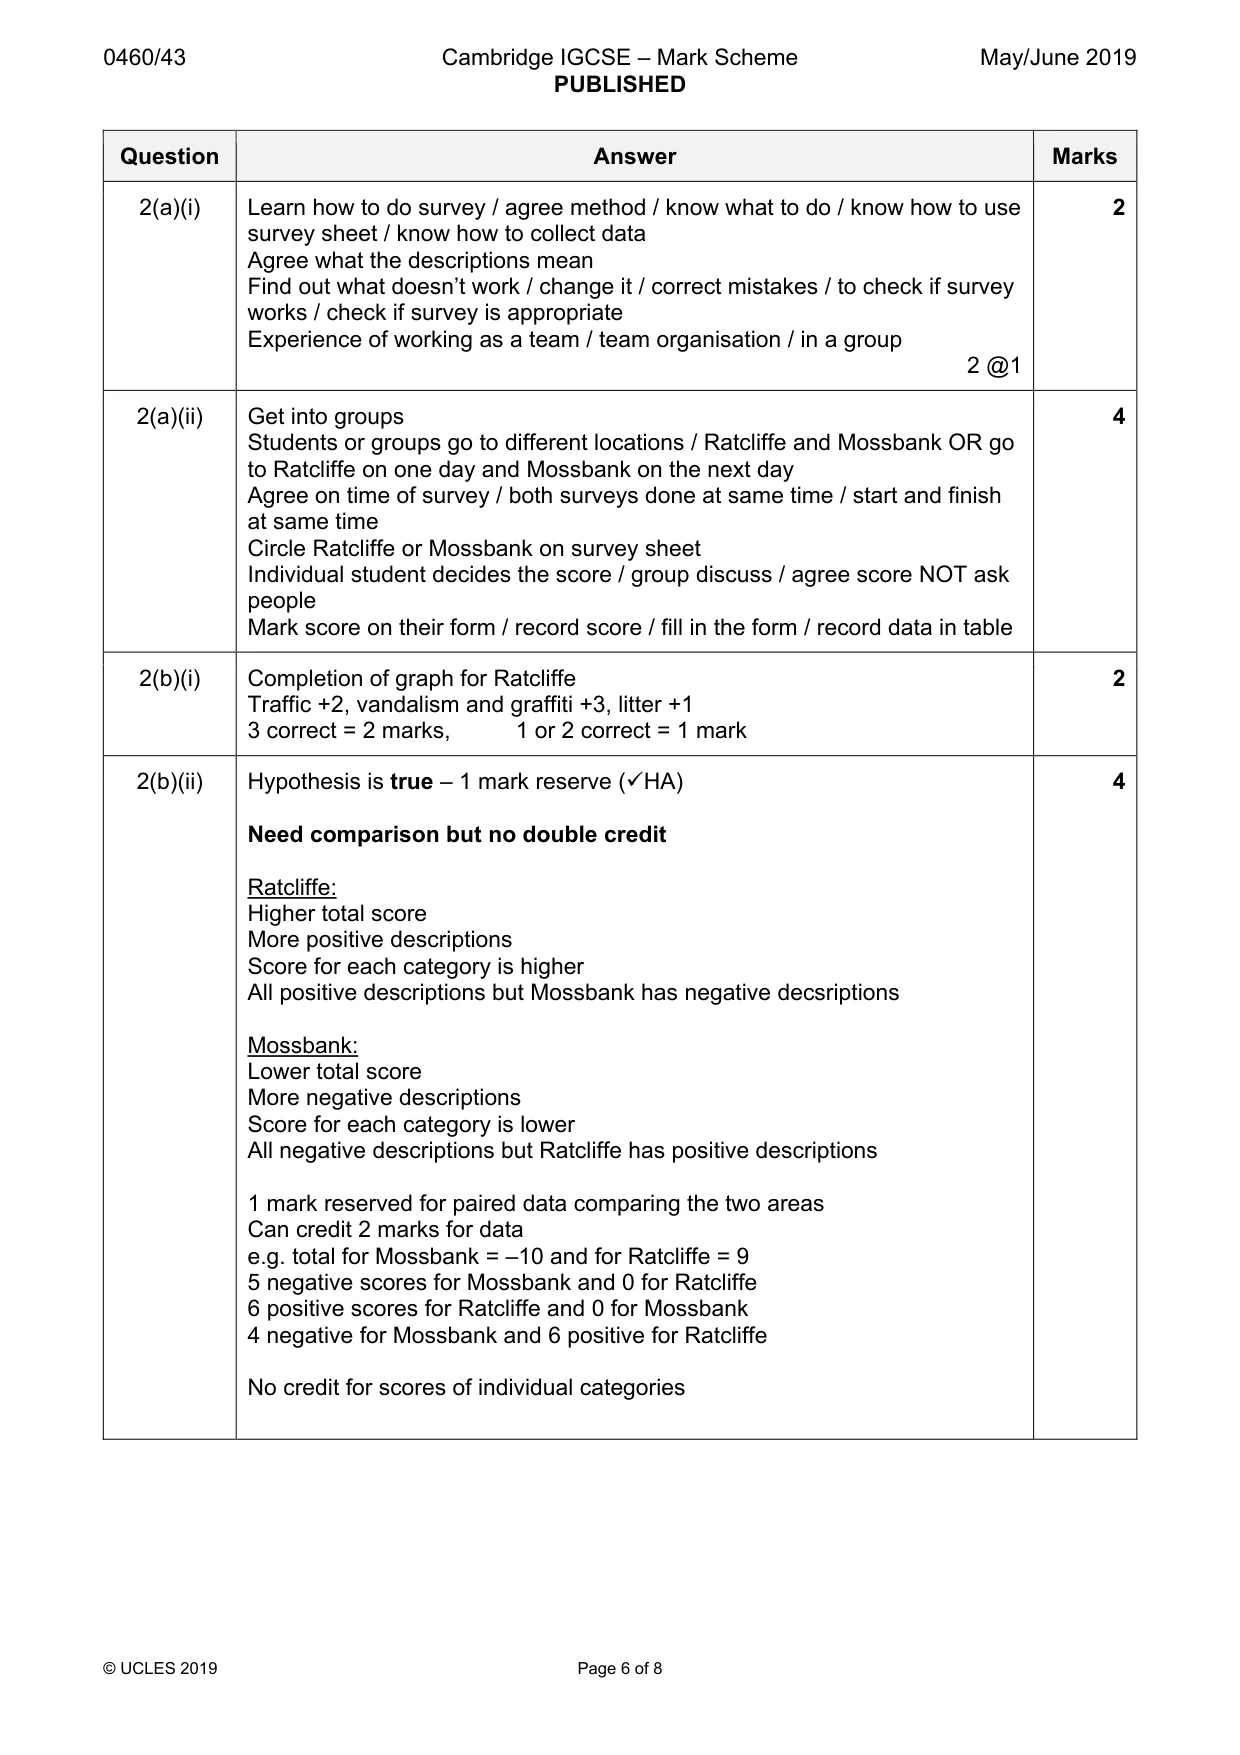
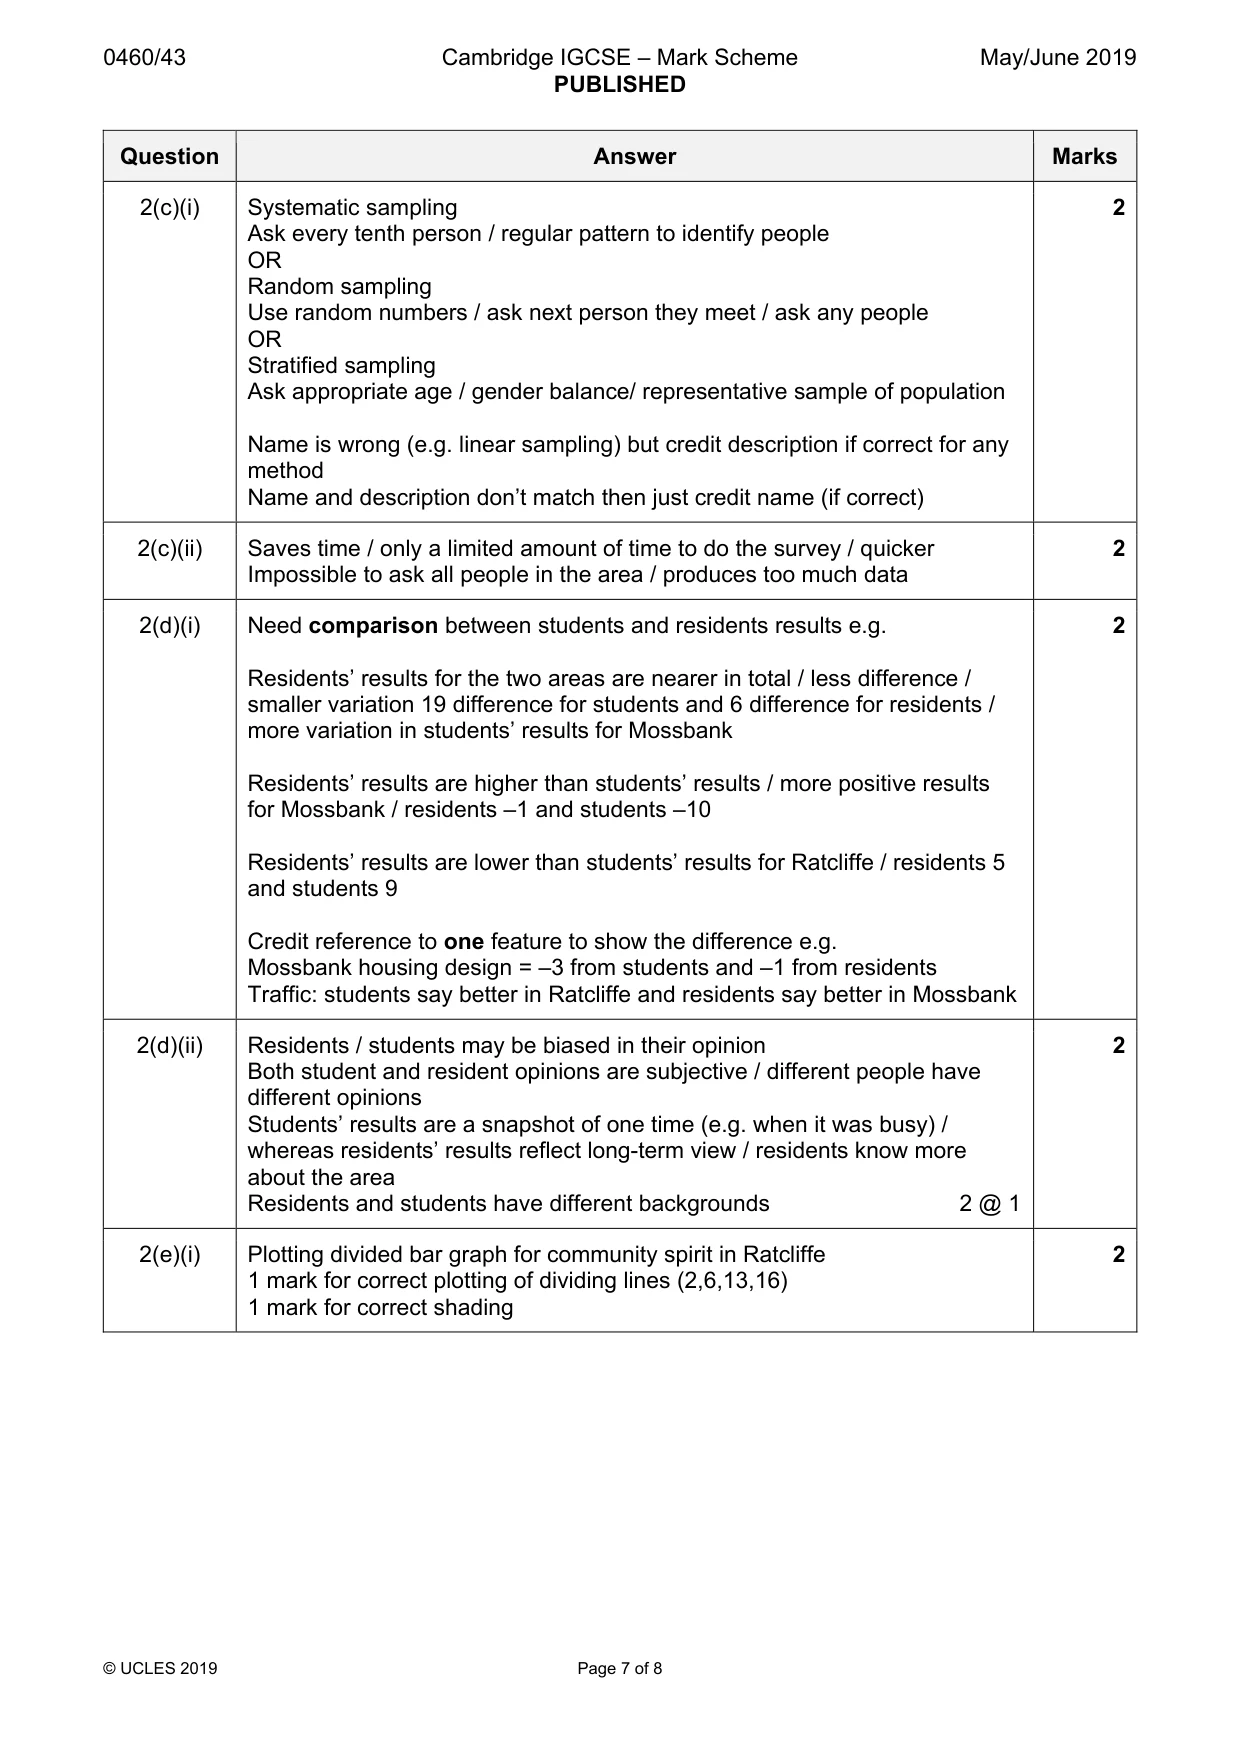
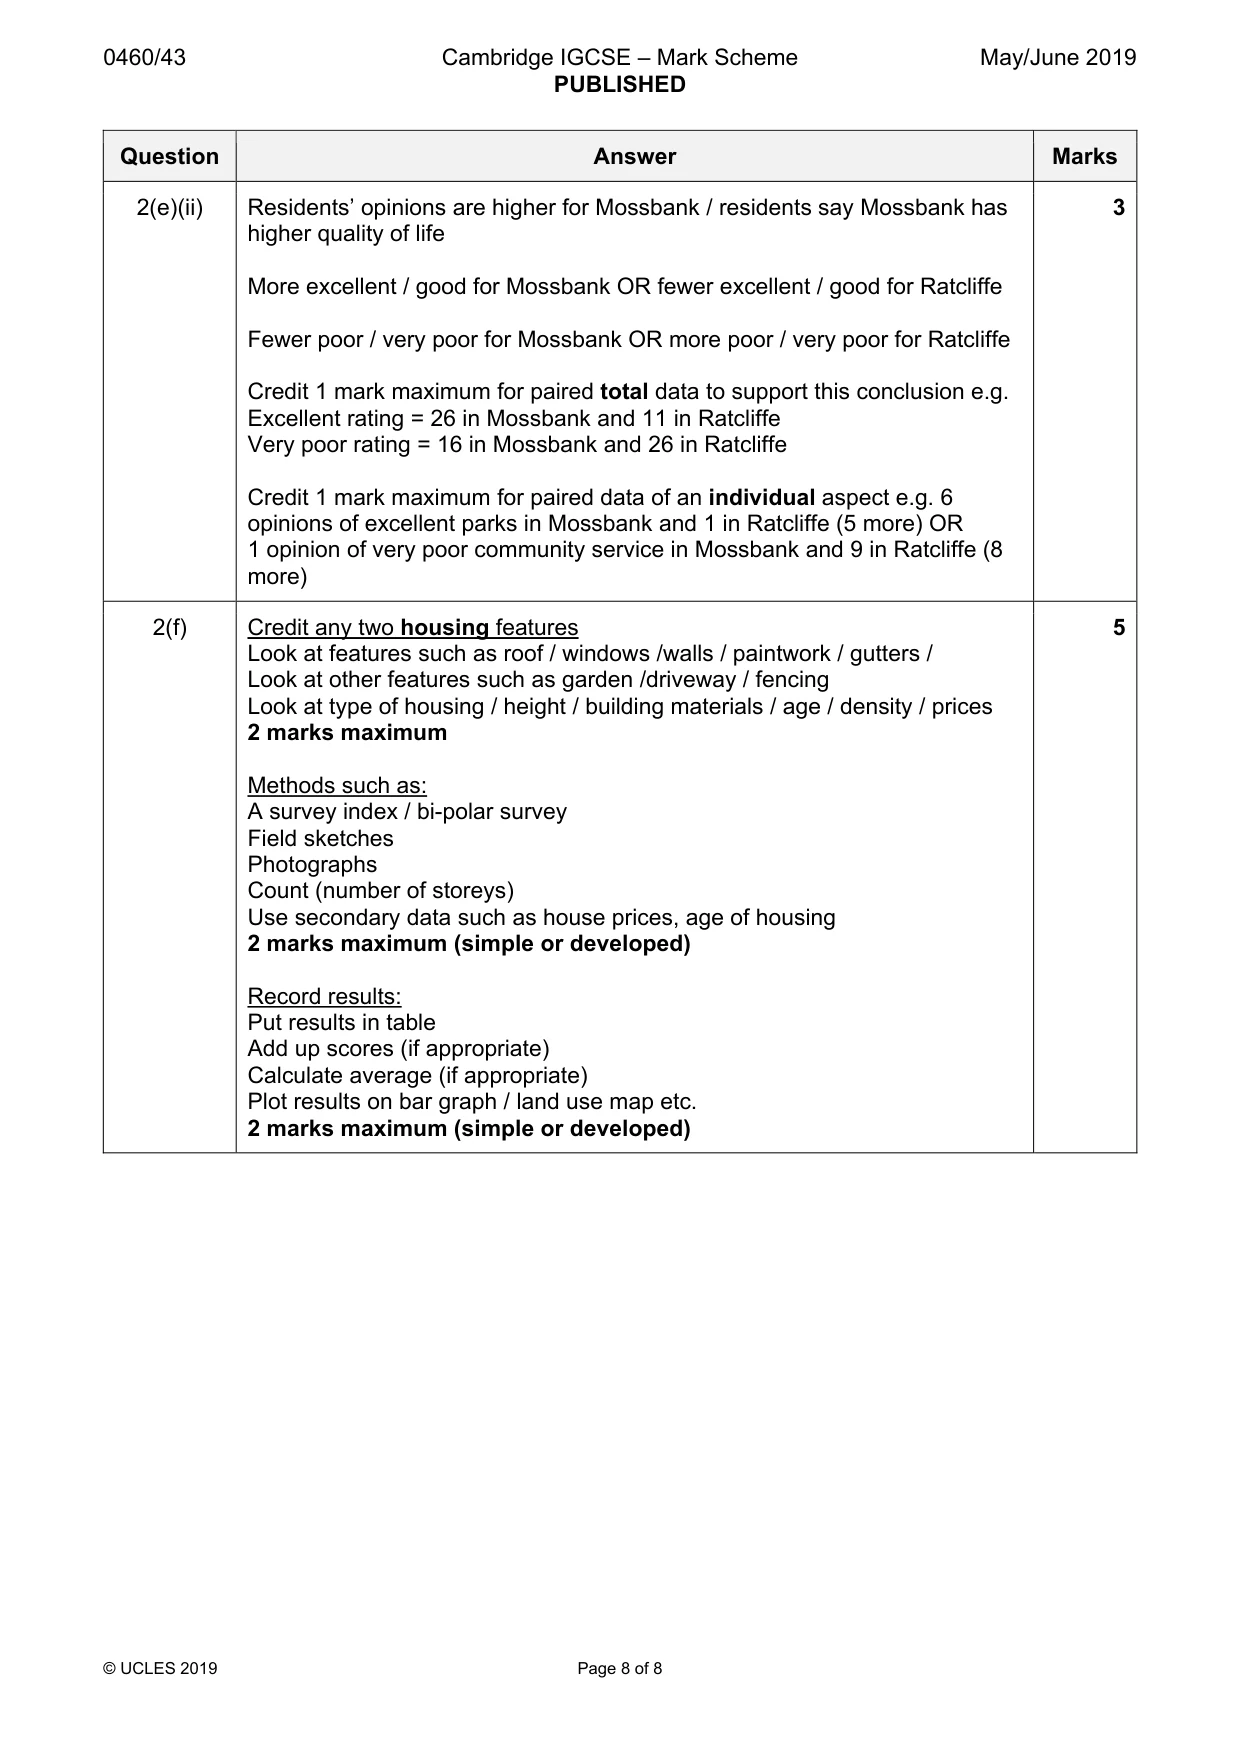
Mark scheme: 2(a)(i) Learn how to do survey / agree method / know what to do / know how to use 2 survey sheet / know how to collect data Agree what the descriptions mean Find out what doesn’t work / change it / correct mistakes / to check if survey works / check if survey is appropriate Experience of working as a team / team organisation / in a group 2 @1 2(a)(ii) Get into groups 4 Students or groups go to different locations / Ratcliffe and Mossbank OR go to Ratcliffe on one day and Mossbank on the next day Agree on time of survey / both surveys done at same time / start and finish at same time Circle Ratcliffe or Mossbank on survey sheet Individual student decides the score / group discuss / agree score NOT ask people Mark score on their form / record score / fill in the form / record data in table 2(b)(i) Completion of graph for Ratcliffe 2 Traffic +2, vandalism and graffiti +3, litter +1 3 correct = 2 marks, 1 or 2 correct = 1 mark 2(b)(ii) Hypothesis is true – 1 mark reserve (9HA) 4 Need comparison but no double credit Ratcliffe: Higher total score More positive descriptions Score for each category is higher All positive descriptions but Mossbank has negative decsriptions Mossbank: Lower total score More negative descriptions Score for each category is lower All negative descriptions but Ratcliffe has positive descriptions 1 mark reserved for paired data comparing the two areas Can credit 2 marks for data e.g. total for Mossbank = –10 and for Ratcliffe = 9 5 negative scores for Mossbank and 0 for Ratcliffe 6 positive scores for Ratcliffe and 0 for Mossbank 4 negative for Mossbank and 6 positive for Ratcliffe No credit for scores of individual categories 2(c)(i) Systematic sampling 2 Ask every tenth person / regular pattern to identify people OR Random sampling Use random numbers / ask next person they meet / ask any people OR Stratified sampling Ask appropriate age / gender balance/ representative sample of population Name is wrong (e.g. linear sampling) but credit description if correct for any method Name and description don’t match then just credit name (if correct) 2(c)(ii) Saves time / only a limited amount of time to do the survey / quicker 2 Impossible to ask all people in the area / produces too much data 2(d)(i) Need comparison between students and residents results e.g. 2 Residents’ results for the two areas are nearer in total / less difference / smaller variation 19 difference for students and 6 difference for residents / more variation in students’ results for Mossbank Residents’ results are higher than students’ results / more positive results for Mossbank / residents –1 and students –10 Residents’ results are lower than students’ results for Ratcliffe / residents 5 and students 9 Credit reference to one feature to show the difference e.g. Mossbank housing design = –3 from students and –1 from residents Traffic: students say better in Ratcliffe and residents say better in Mossbank 2(d)(ii) Residents / students may be biased in their opinion 2 Both student and resident opinions are subjective / different people have different opinions Students’ results are a snapshot of one time (e.g. when it was busy) / whereas residents’ results reflect long-term view / residents know more about the area Residents and students have different backgrounds 2 @ 1 2(e)(i) Plotting divided bar graph for community spirit in Ratcliffe 2 1 mark for correct plotting of dividing lines (2,6,13,16) 1 mark for correct shading 2(e)(ii) Residents’ opinions are higher for Mossbank / residents say Mossbank has 3 higher quality of life More excellent / good for Mossbank OR fewer excellent / good for Ratcliffe Fewer poor / very poor for Mossbank OR more poor / very poor for Ratcliffe Credit 1 mark maximum for paired total data to support this conclusion e.g. Excellent rating = 26 in Mossbank and 11 in Ratcliffe Very poor rating = 16 in Mossbank and 26 in Ratcliffe Credit 1 mark maximum for paired data of an individual aspect e.g. 6 opinions of excellent parks in Mossbank and 1 in Ratcliffe (5 more) OR 1 opinion of very poor community service in Mossbank and 9 in Ratcliffe (8 more) 2(f) Credit any two housing features 5 Look at features such as roof / windows /walls / paintwork / gutters / Look at other features such as garden /driveway / fencing Look at type of housing / height / building materials / age / density / prices 2 marks maximum Methods such as: A survey index / bi-polar survey Field sketches Photographs Count (number of storeys) Use secondary data such as house prices, age of housing 2 marks maximum (simple or developed) Record results: Put results in table Add up scores (if appropriate) Calculate average (if appropriate) Plot results on bar graph / land use map etc. 2 marks maximum (simple or developed)
What was in this paper
The subtopics covered by these 2 questions, and how many questions each got. Open one in a new tab to see every Cambridge question on it.
What you needed in this session
Cambridge’s own grade thresholds for 2019 May/June, Paper 4 · Variant 3. A higher threshold means an easier paper — the bar moves with how the cohort did.