Cambridge IGCSE Geography 0460 — 2019 May/June Paper 4 · Variant 1
0460/41/M/J/19 · 2 questions · 60 marks · ≈68 min
The question paper and its mark scheme, free to read here and free to download. This is Cambridge’s own paper, exactly as it was sat.
Question paper16 pages




Mark scheme8 pages
Answers below. Sit the paper first if you are practising.
Questions as text
Q1 · Students who lived in Campania, a farming region of Italy, did fieldwork to investigate…
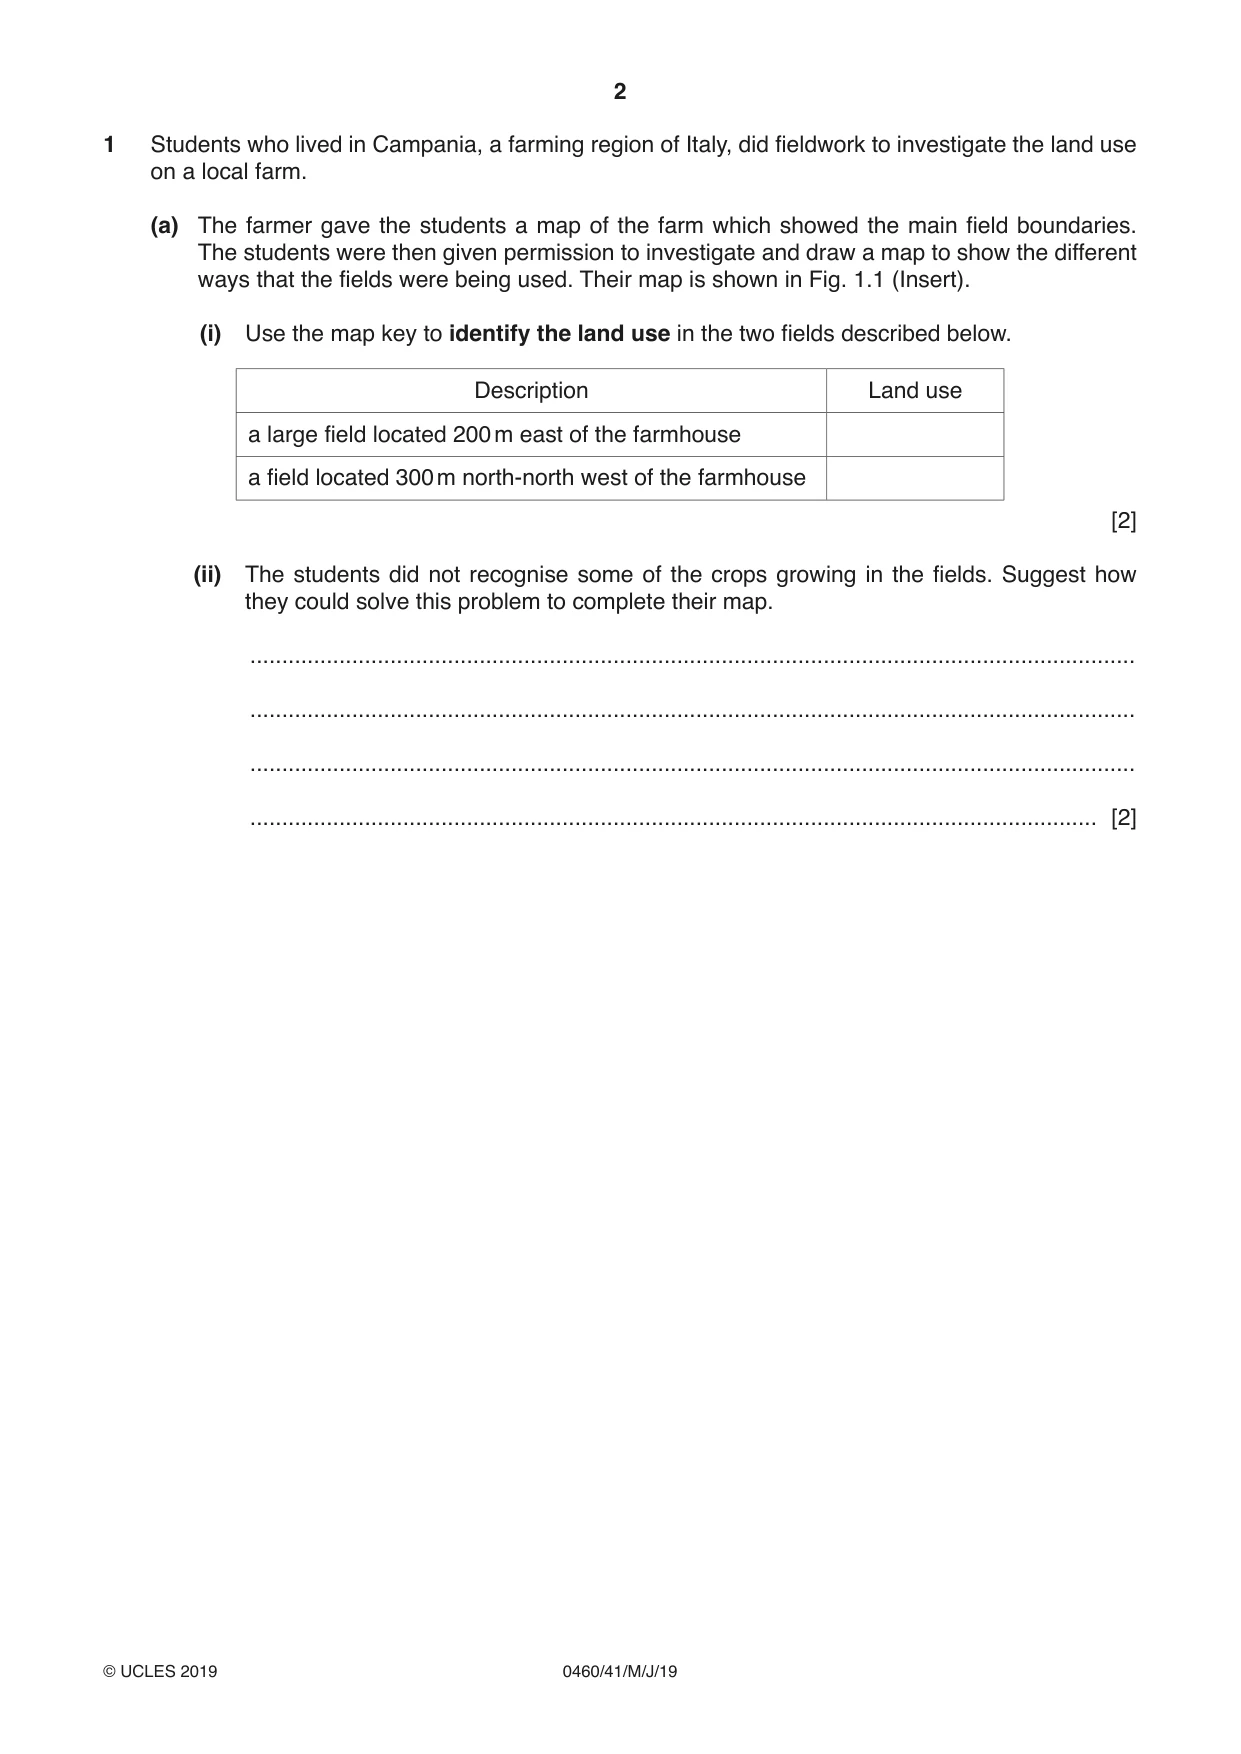
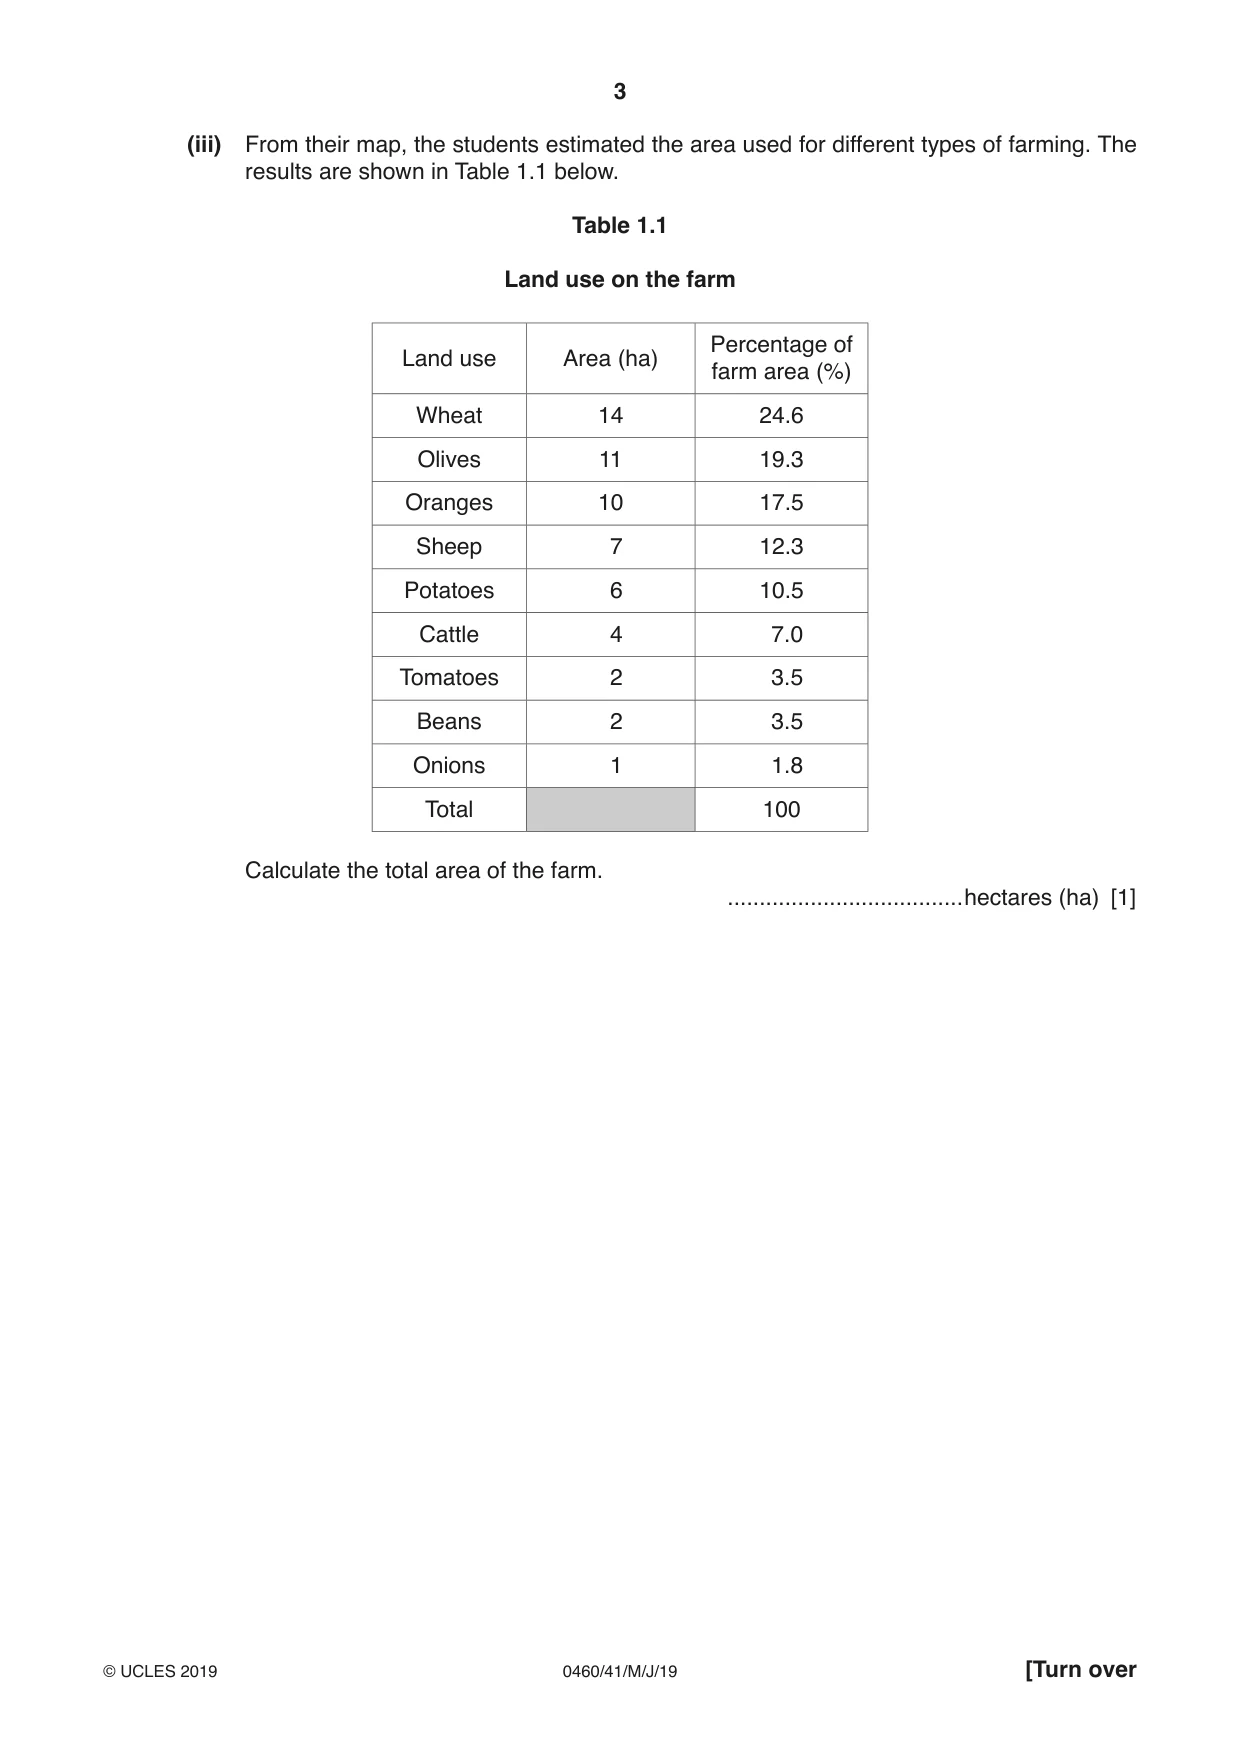
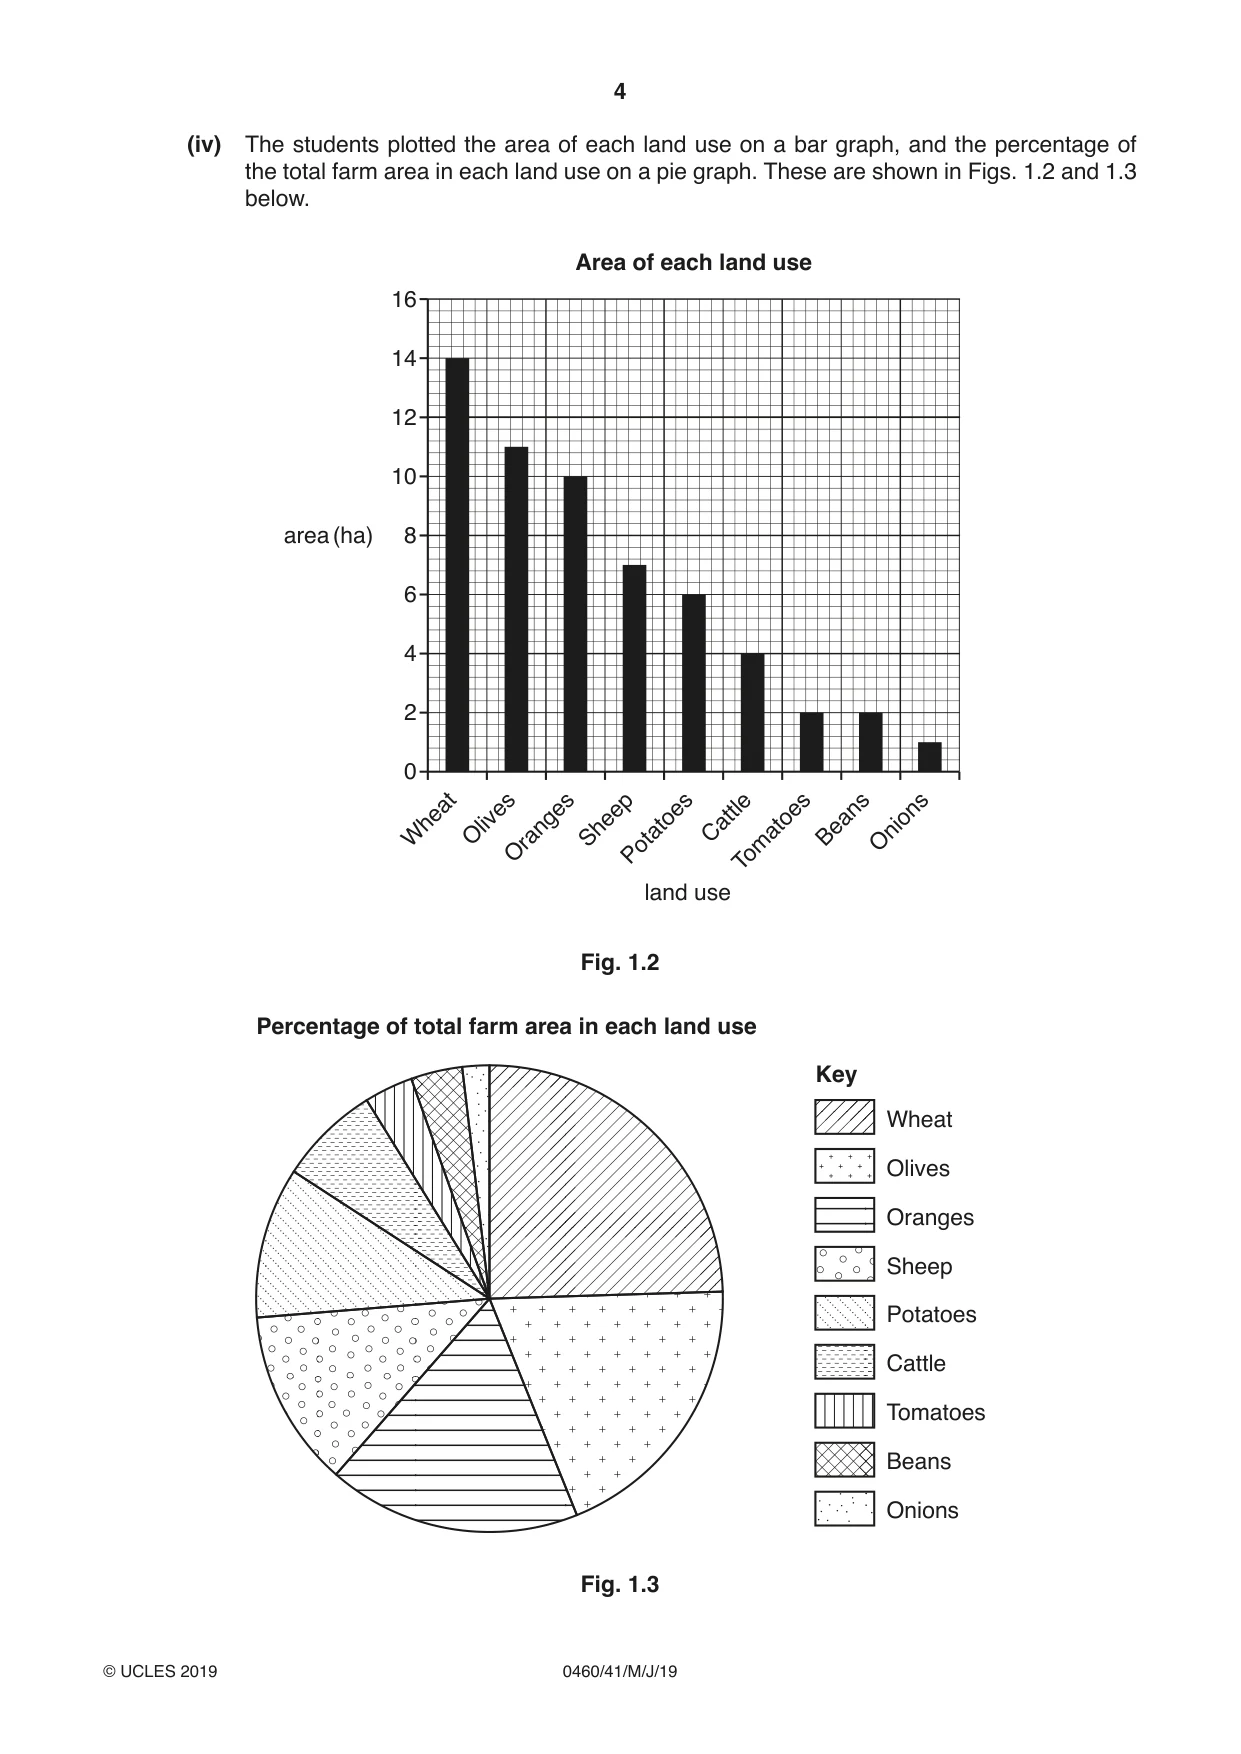
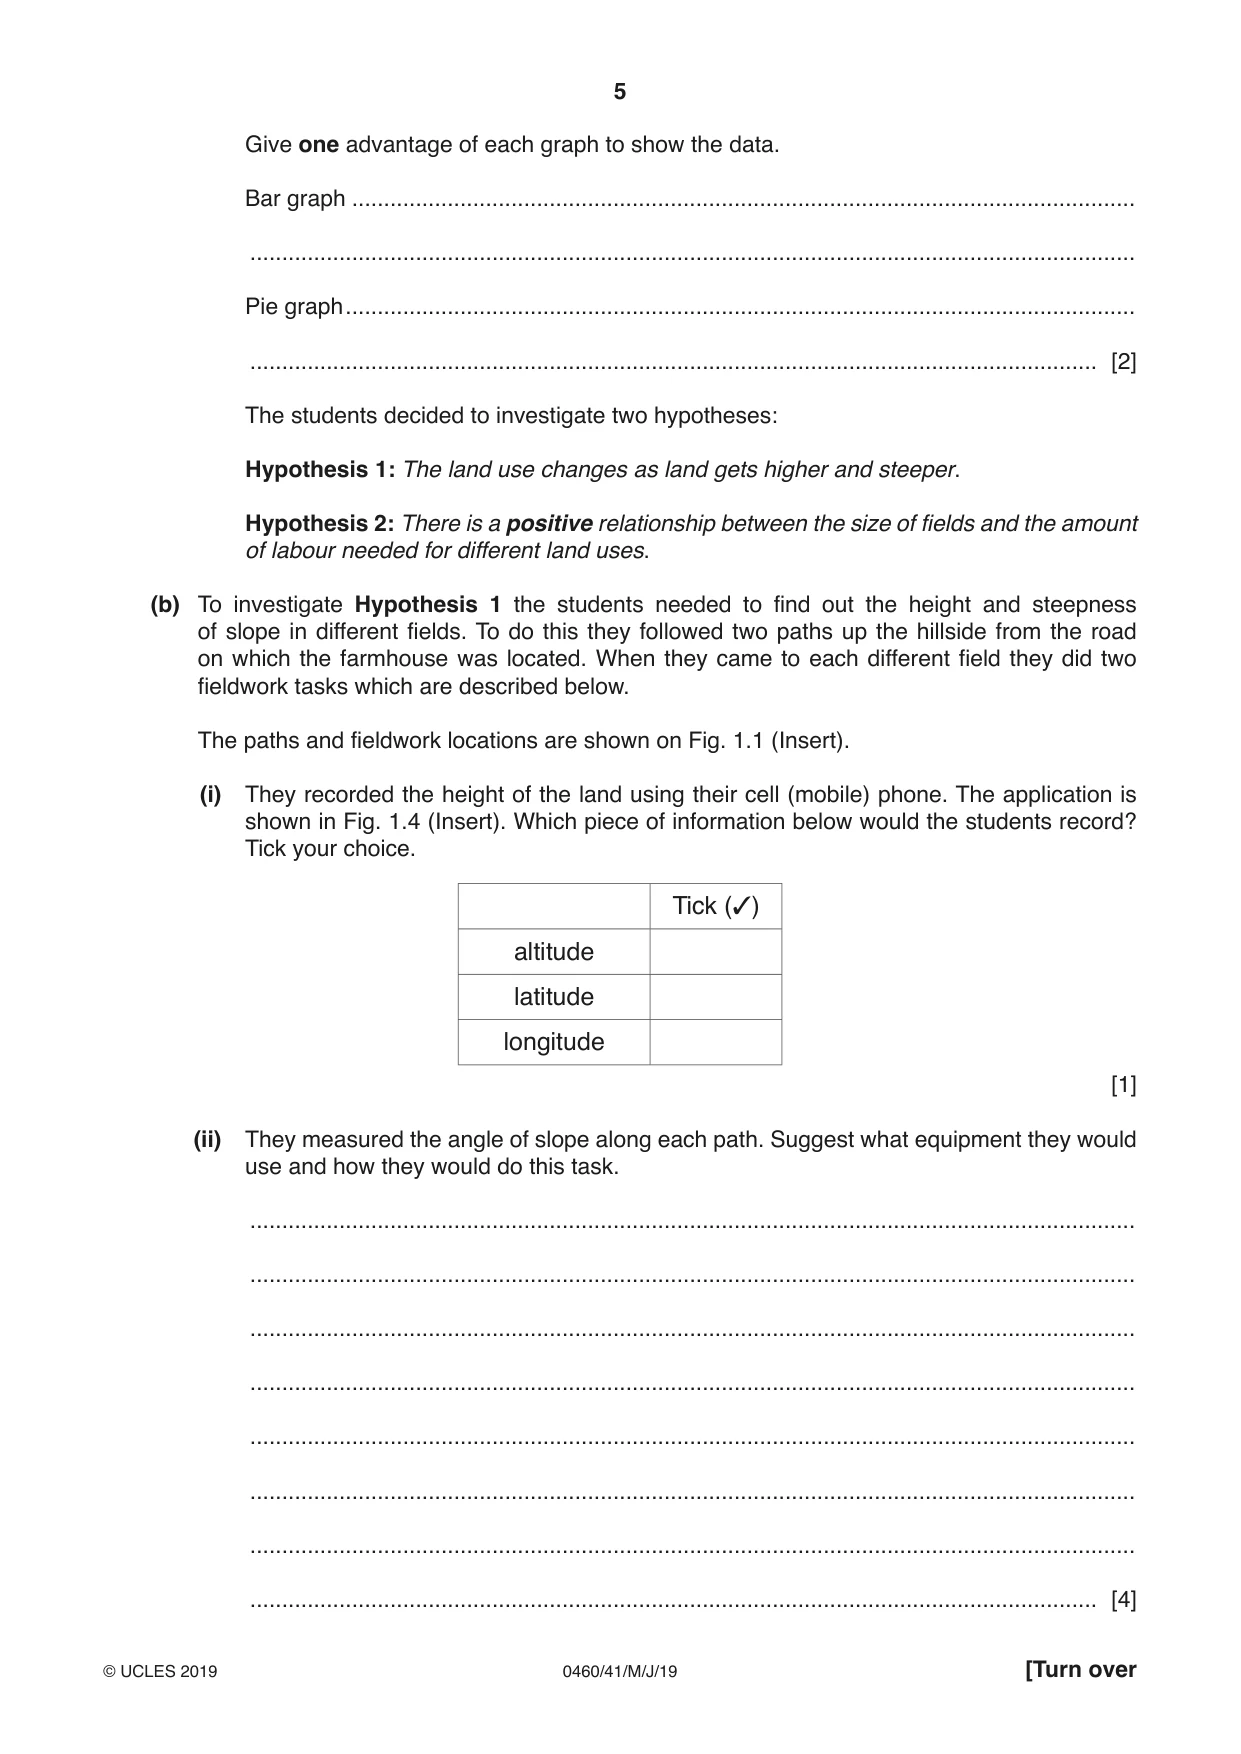
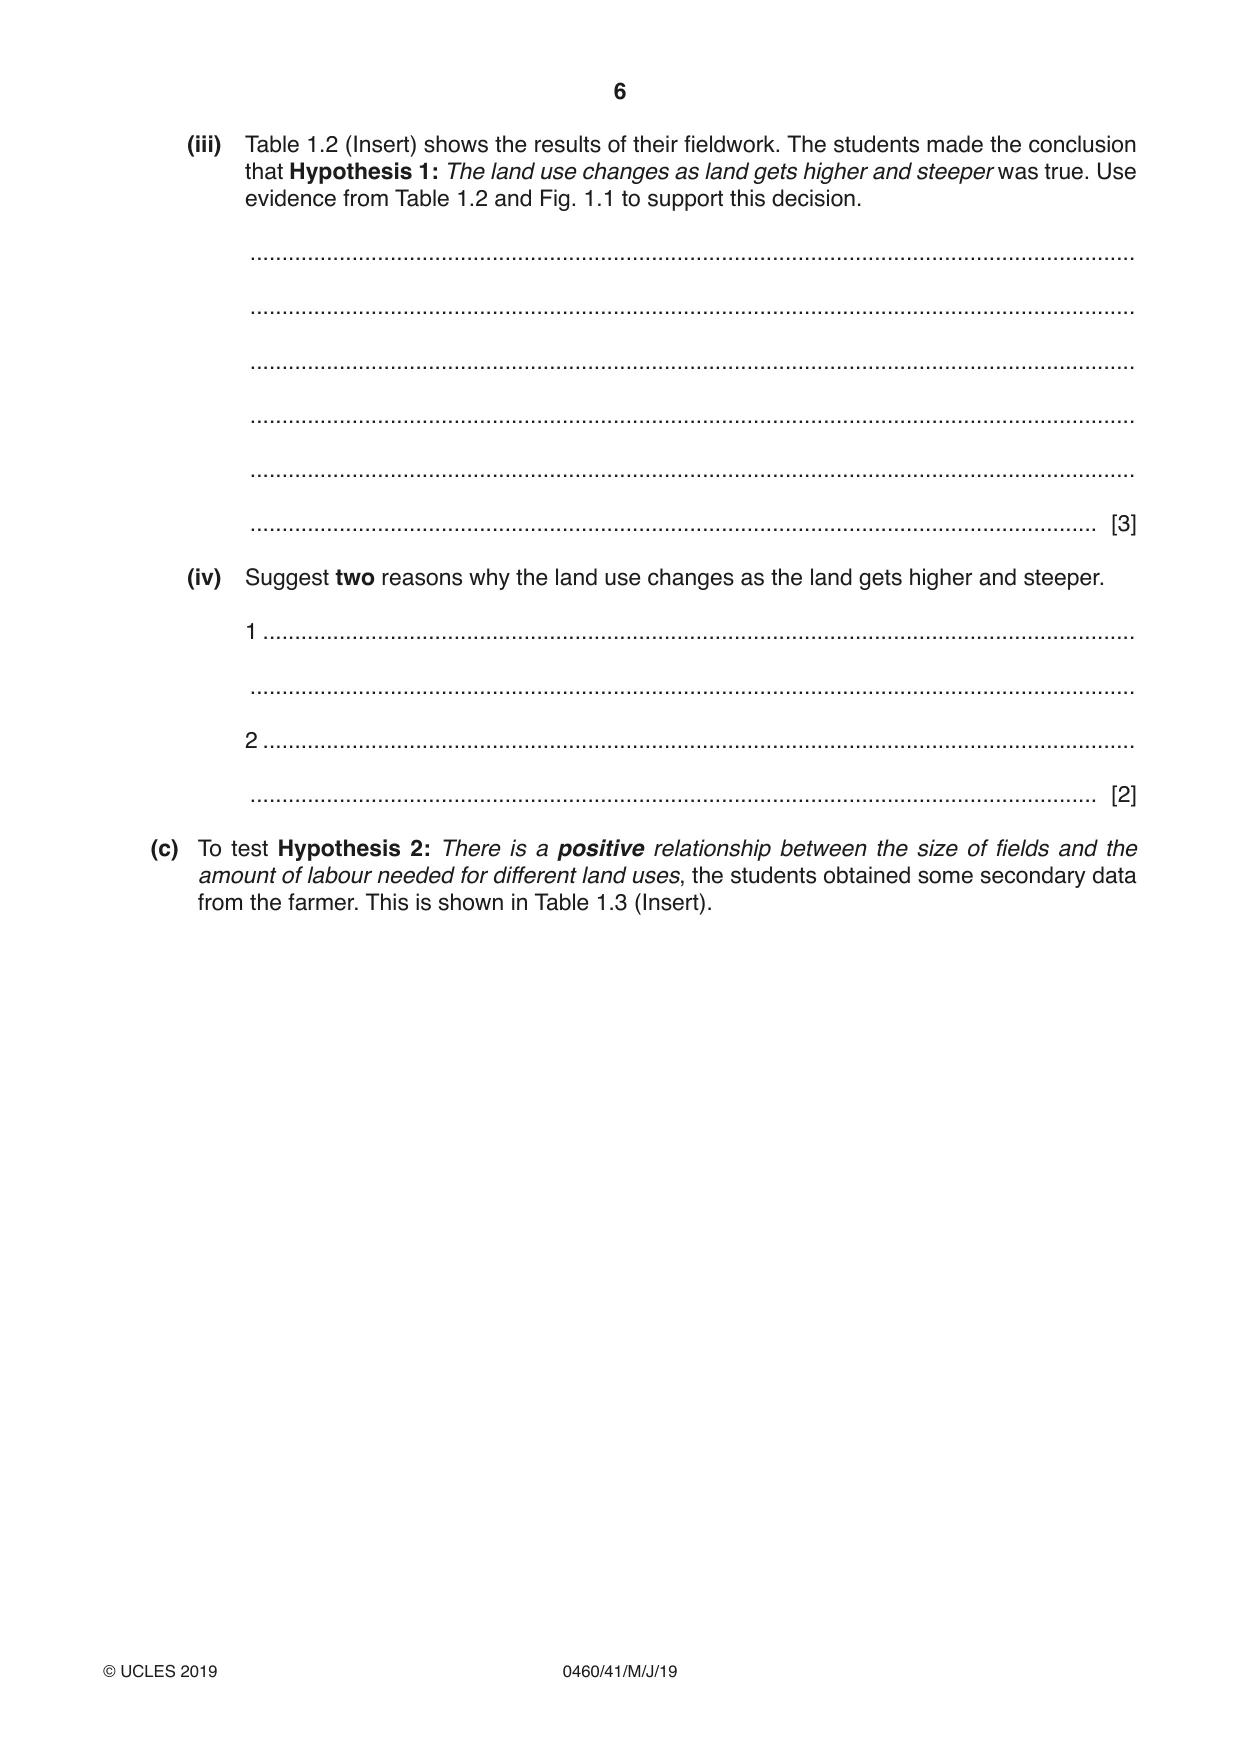
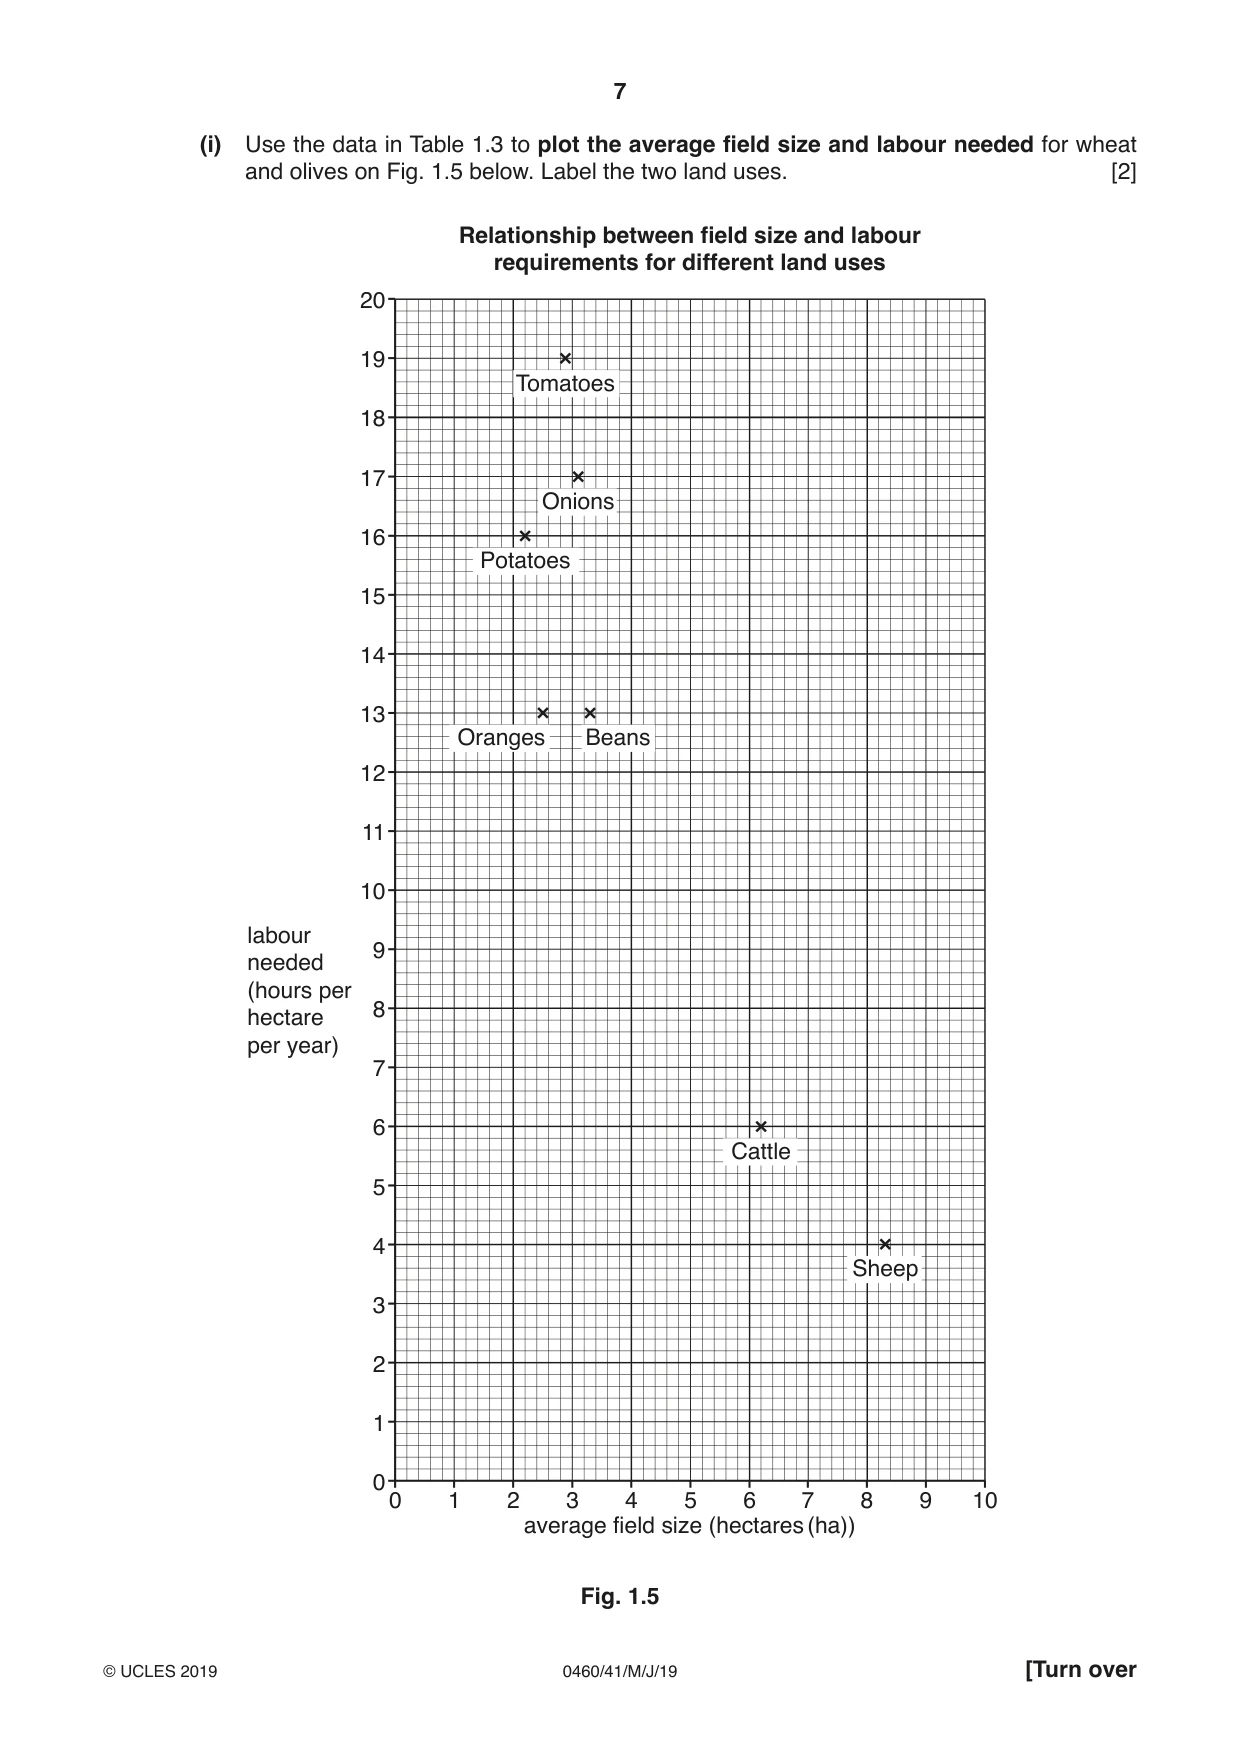
1 Students who lived in Campania, a farming region of Italy, did fieldwork to investigate the land use on a local farm. (a) The farmer gave the students a map of the farm which showed the main field boundaries. The students were then given permission to investigate and draw a map to show the different ways that the fields were being used. Their map is shown in Fig. 1.1 (Insert). (i) Use the map key to identify the land use in the two fields described below. Description Land use a large field located 200 m east of the farmhouse a field located 300 m north-north west of the farmhouse [2] (ii) The students did not recognise some of the crops growing in the fields. Suggest how they could solve this problem to complete their map. ........................................................................................................................................... ........................................................................................................................................... ........................................................................................................................................... ..................................................................................................................................... [2] (iii) From their map, the students estimated the area used for different types of farming. The results are shown in Table 1.1 below. Table 1.1 Land use on the farm Percentage of Land use Area (ha) farm area (%) Wheat 14 24.6 Olives 11 19.3 Oranges 10 17.5 Sheep 7 12.3 Potatoes 6 10.5 Cattle 4 7.0 Tomatoes 2 3.5 Beans 2 3.5 Onions 1 1.8 Total 100 Calculate the total area of the farm. .....................................hectares (ha) [1] (iv) The students plotted the area of each land use on a bar graph, and the percentage of the total farm area in each land use on a pie graph. These are shown in Figs. 1.2 and 1.3 below. Area of each land use 16 14 12 10 area (ha) 8 6 4 2 0 WheatOlivesOrangesSheepPotatoesCattleTomatoesBeansOnions land use Fig. 1.2 Percentage of total farm area in each land use Key Wheat Olives Oranges Sheep Potatoes Cattle Tomatoes Beans Onions Fig. 1.3 Give one advantage of each graph to show the data. Bar graph ........................................................................................................................... ........................................................................................................................................... Pie graph ............................................................................................................................ ..................................................................................................................................... [2] The students decided to investigate two hypotheses: Hypothesis 1: The land use changes as land gets higher and steeper. Hypothesis 2: There is a positive relationship between the size of fields and the amount of labour needed for different land uses. (b) To investigate Hypothesis 1 the students needed to find out the height and steepness of slope in different fields. To do this they followed two paths up the hillside from the road on which the farmhouse was located. When they came to each different field they did two fieldwork tasks which are described below. The paths and fieldwork locations are shown on Fig. 1.1 (Insert). (i) They recorded the height of the land using their cell (mobile) phone. The application is shown in Fig. 1.4 (Insert). Which piece of information below would the students record? Tick your choice. Tick (✓) altitude latitude longitude [1] (ii) They measured the angle of slope along each path. Suggest what equipment they would use and how they would do this task. ........................................................................................................................................... ........................................................................................................................................... ........................................................................................................................................... ........................................................................................................................................... ........................................................................................................................................... ........................................................................................................................................... ........................................................................................................................................... ..................................................................................................................................... [4] (iii) Table 1.2 (Insert) shows the results of their fieldwork. The students made the conclusion that Hypothesis 1: The land use changes as land gets higher and steeper was true. Use evidence from Table 1.2 and Fig. 1.1 to support this decision. ........................................................................................................................................... ........................................................................................................................................... ........................................................................................................................................... ........................................................................................................................................... ........................................................................................................................................... ..................................................................................................................................... [3] (iv) Suggest two reasons why the land use changes as the land gets higher and steeper. 1 ......................................................................................................................................... ........................................................................................................................................... 2 ......................................................................................................................................... ..................................................................................................................................... [2] (c) To test Hypothesis 2: There is a positive relationship between the size of fields and the amount of labour needed for different land uses, the students obtained some secondary data from the farmer. This is shown in Table 1.3 (Insert). (ii) Draw a best-fit line onto Fig. 1.5. [1] (iii) What is your conclusion about Hypothesis 2: There is a positive relationship between the size of fields and the amount of labour needed for different land uses? Support your conclusion with evidence from Table 1.3 and Fig. 1.5. ........................................................................................................................................... ........................................................................................................................................... ........................................................................................................................................... ........................................................................................................................................... ........................................................................................................................................... ........................................................................................................................................... ........................................................................................................................................... ..................................................................................................................................... [4] (d) (i) Labour is a human input of farming. Give two other human (economic and/or social) inputs on a farm such as this. 1 ......................................................................................................................................... 2 ................................................................................................................................... [2] (ii) The steepness and height of the land are natural inputs which affect how the land is used. Give one other natural input which affects land use. ..................................................................................................................................... [1] (e) To extend their investigation the students wanted to find out more about the processes which took place on the farm. Describe ways that they could do this. ................................................................................................................................................... ................................................................................................................................................... ................................................................................................................................................... ................................................................................................................................................... ................................................................................................................................................... ............................................................................................................................................. [3] [Total: 30]
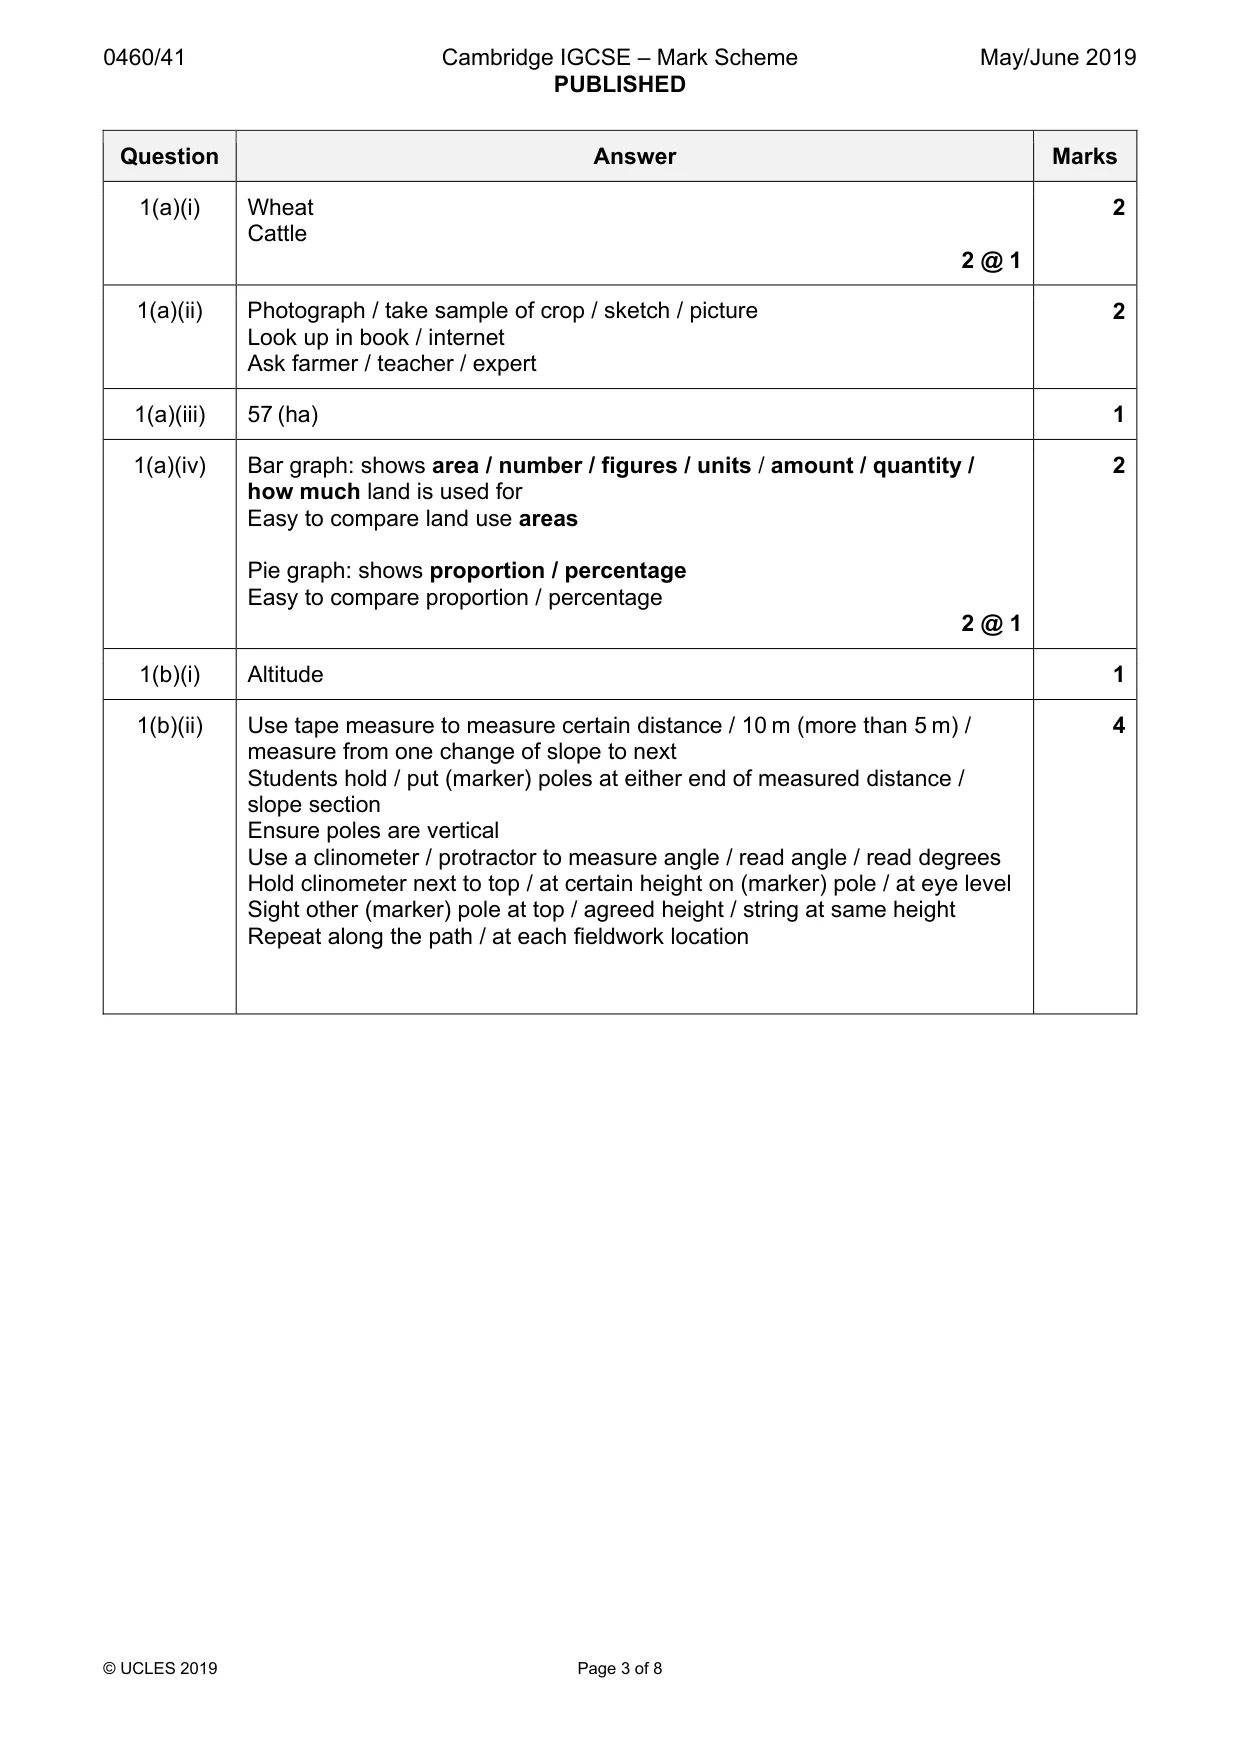
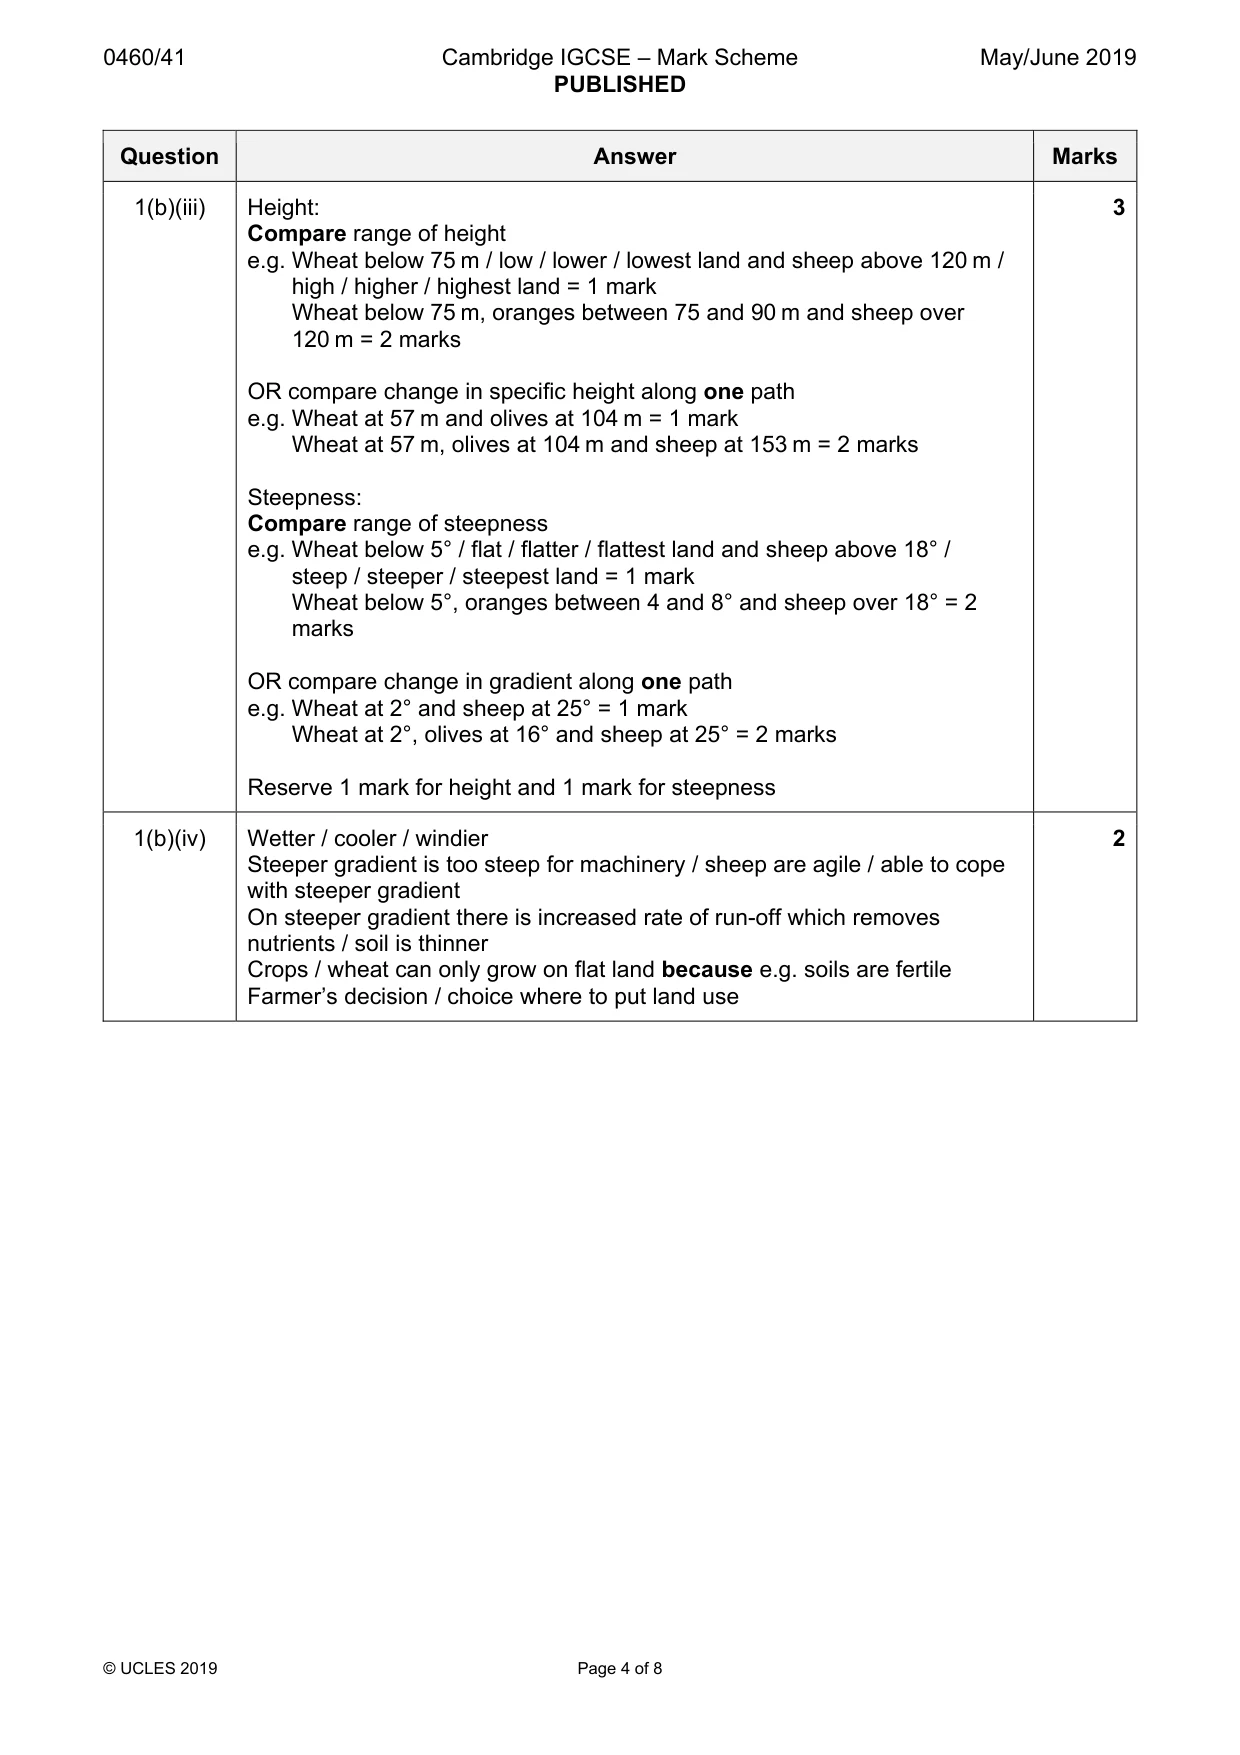
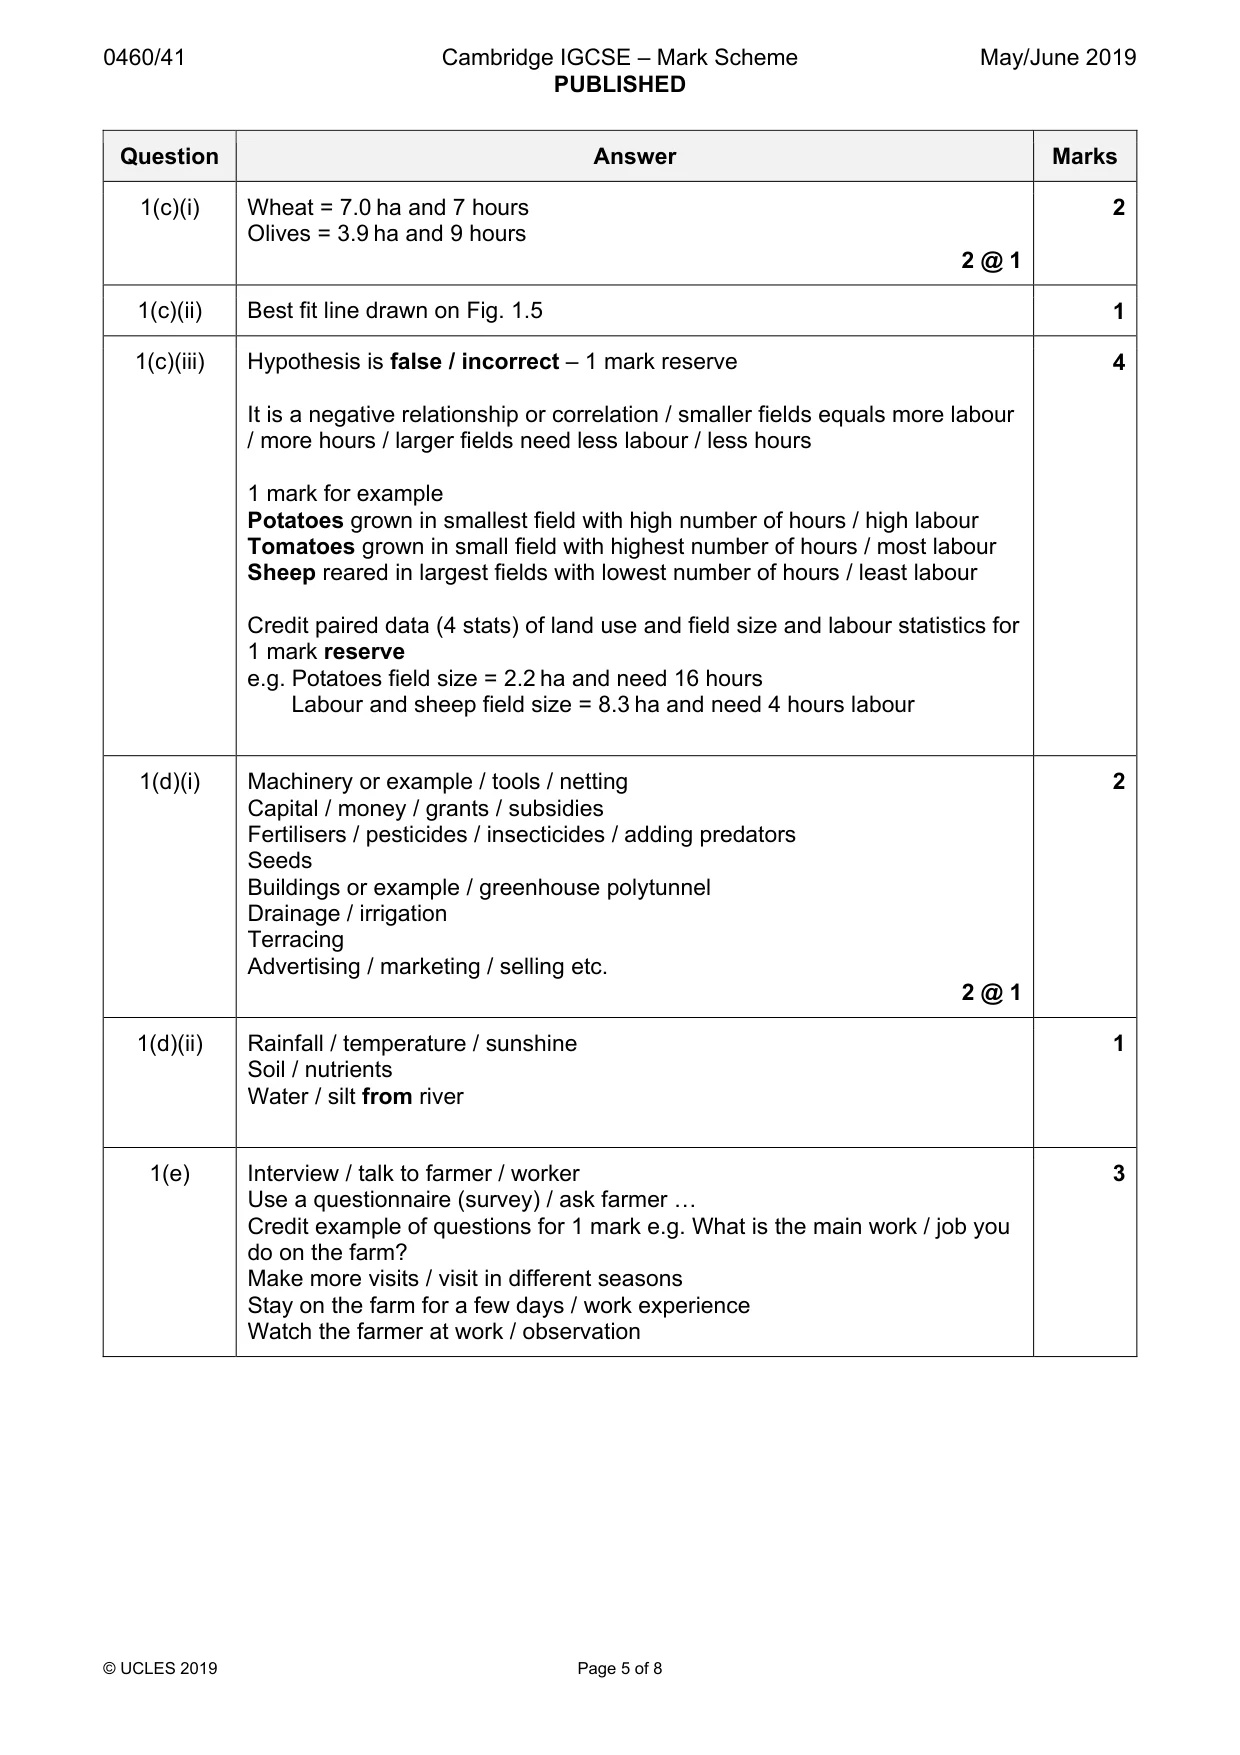
Mark scheme: Question Answer Marks 1(a)(i) Wheat 2 Cattle 2 @ 1 1(a)(ii) Photograph / take sample of crop / sketch / picture 2 Look up in book / internet Ask farmer / teacher / expert 1(a)(iii) 57 (ha) 1 1(a)(iv) Bar graph: shows area / number / figures / units / amount / quantity / 2 how much land is used for Easy to compare land use areas Pie graph: shows proportion / percentage Easy to compare proportion / percentage 2 @ 1 1(b)(i) Altitude 1 1(b)(ii) Use tape measure to measure certain distance / 10 m (more than 5 m) / 4 measure from one change of slope to next Students hold / put (marker) poles at either end of measured distance / slope section Ensure poles are vertical Use a clinometer / protractor to measure angle / read angle / read degrees Hold clinometer next to top / at certain height on (marker) pole / at eye level Sight other (marker) pole at top / agreed height / string at same height Repeat along the path / at each fieldwork location 1(b)(iii) Height: 3 Compare range of height e.g. Wheat below 75 m / low / lower / lowest land and sheep above 120 m / high / higher / highest land = 1 mark Wheat below 75 m, oranges between 75 and 90 m and sheep over 120 m = 2 marks OR compare change in specific height along one path e.g. Wheat at 57 m and olives at 104 m = 1 mark Wheat at 57 m, olives at 104 m and sheep at 153 m = 2 marks Steepness: Compare range of steepness e.g. Wheat below 5° / flat / flatter / flattest land and sheep above 18° / steep / steeper / steepest land = 1 mark Wheat below 5°, oranges between 4 and 8° and sheep over 18° = 2 marks OR compare change in gradient along one path e.g. Wheat at 2° and sheep at 25° = 1 mark Wheat at 2°, olives at 16° and sheep at 25° = 2 marks Reserve 1 mark for height and 1 mark for steepness 1(b)(iv) Wetter / cooler / windier 2 Steeper gradient is too steep for machinery / sheep are agile / able to cope with steeper gradient On steeper gradient there is increased rate of run-off which removes nutrients / soil is thinner Crops / wheat can only grow on flat land because e.g. soils are fertile Farmer’s decision / choice where to put land use 1(c)(i) Wheat = 7.0 ha and 7 hours 2 Olives = 3.9 ha and 9 hours 2 @ 1 1(c)(ii) Best fit line drawn on Fig. 1.5 1 1(c)(iii) Hypothesis is false / incorrect – 1 mark reserve 4 It is a negative relationship or correlation / smaller fields equals more labour / more hours / larger fields need less labour / less hours 1 mark for example Potatoes grown in smallest field with high number of hours / high labour Tomatoes grown in small field with highest number of hours / most labour Sheep reared in largest fields with lowest number of hours / least labour Credit paired data (4 stats) of land use and field size and labour statistics for 1 mark reserve e.g. Potatoes field size = 2.2 ha and need 16 hours Labour and sheep field size = 8.3 ha and need 4 hours labour 1(d)(i) Machinery or example / tools / netting 2 Capital / money / grants / subsidies Fertilisers / pesticides / insecticides / adding predators Seeds Buildings or example / greenhouse polytunnel Drainage / irrigation Terracing Advertising / marketing / selling etc. 2 @ 1 1(d)(ii) Rainfall / temperature / sunshine 1 Soil / nutrients Water / silt from river 1(e) Interview / talk to farmer / worker 3 Use a questionnaire (survey) / ask farmer « Credit example of questions for 1 mark e.g. What is the main work / job you do on the farm? Make more visits / visit in different seasons Stay on the farm for a few days / work experience Watch the farmer at work / observation
Q2 · Students investigated how the cross section and velocity of a local river changed…
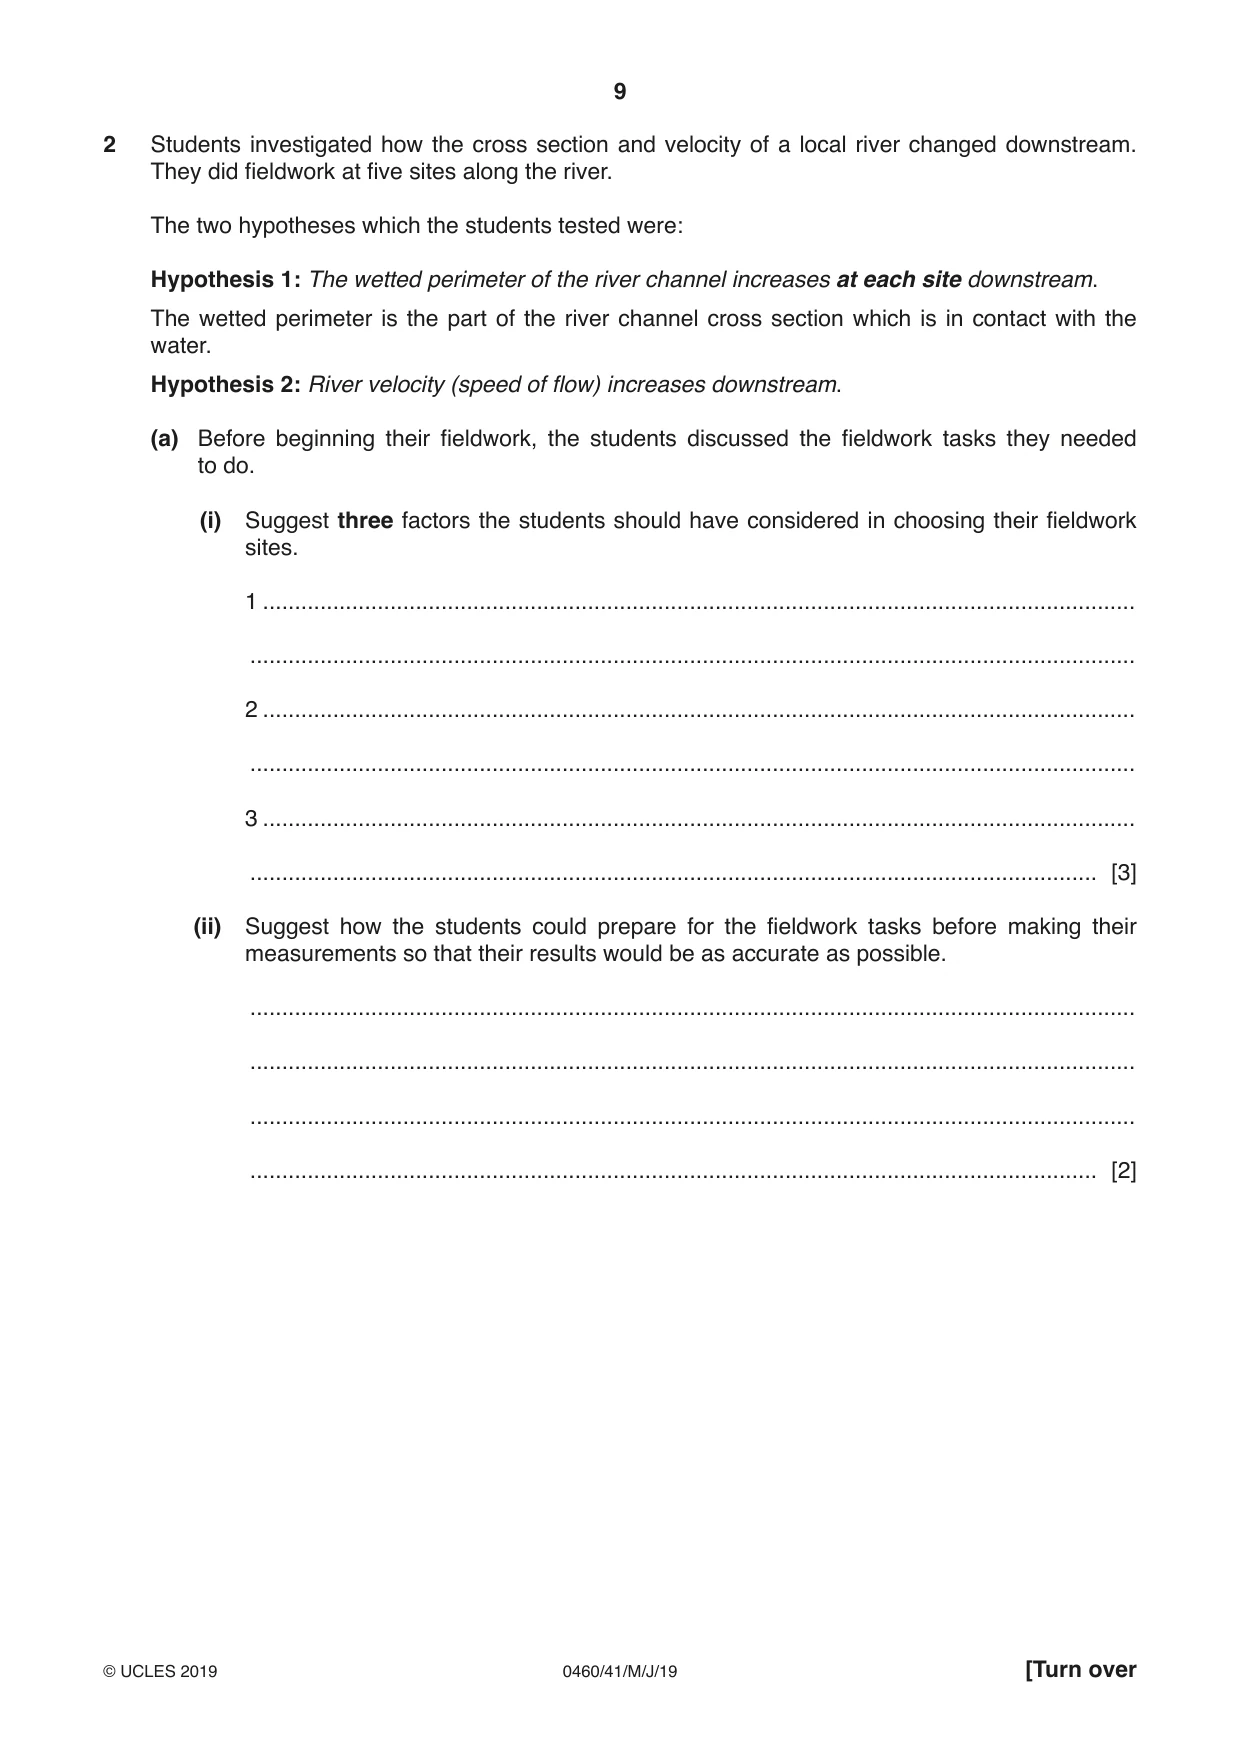
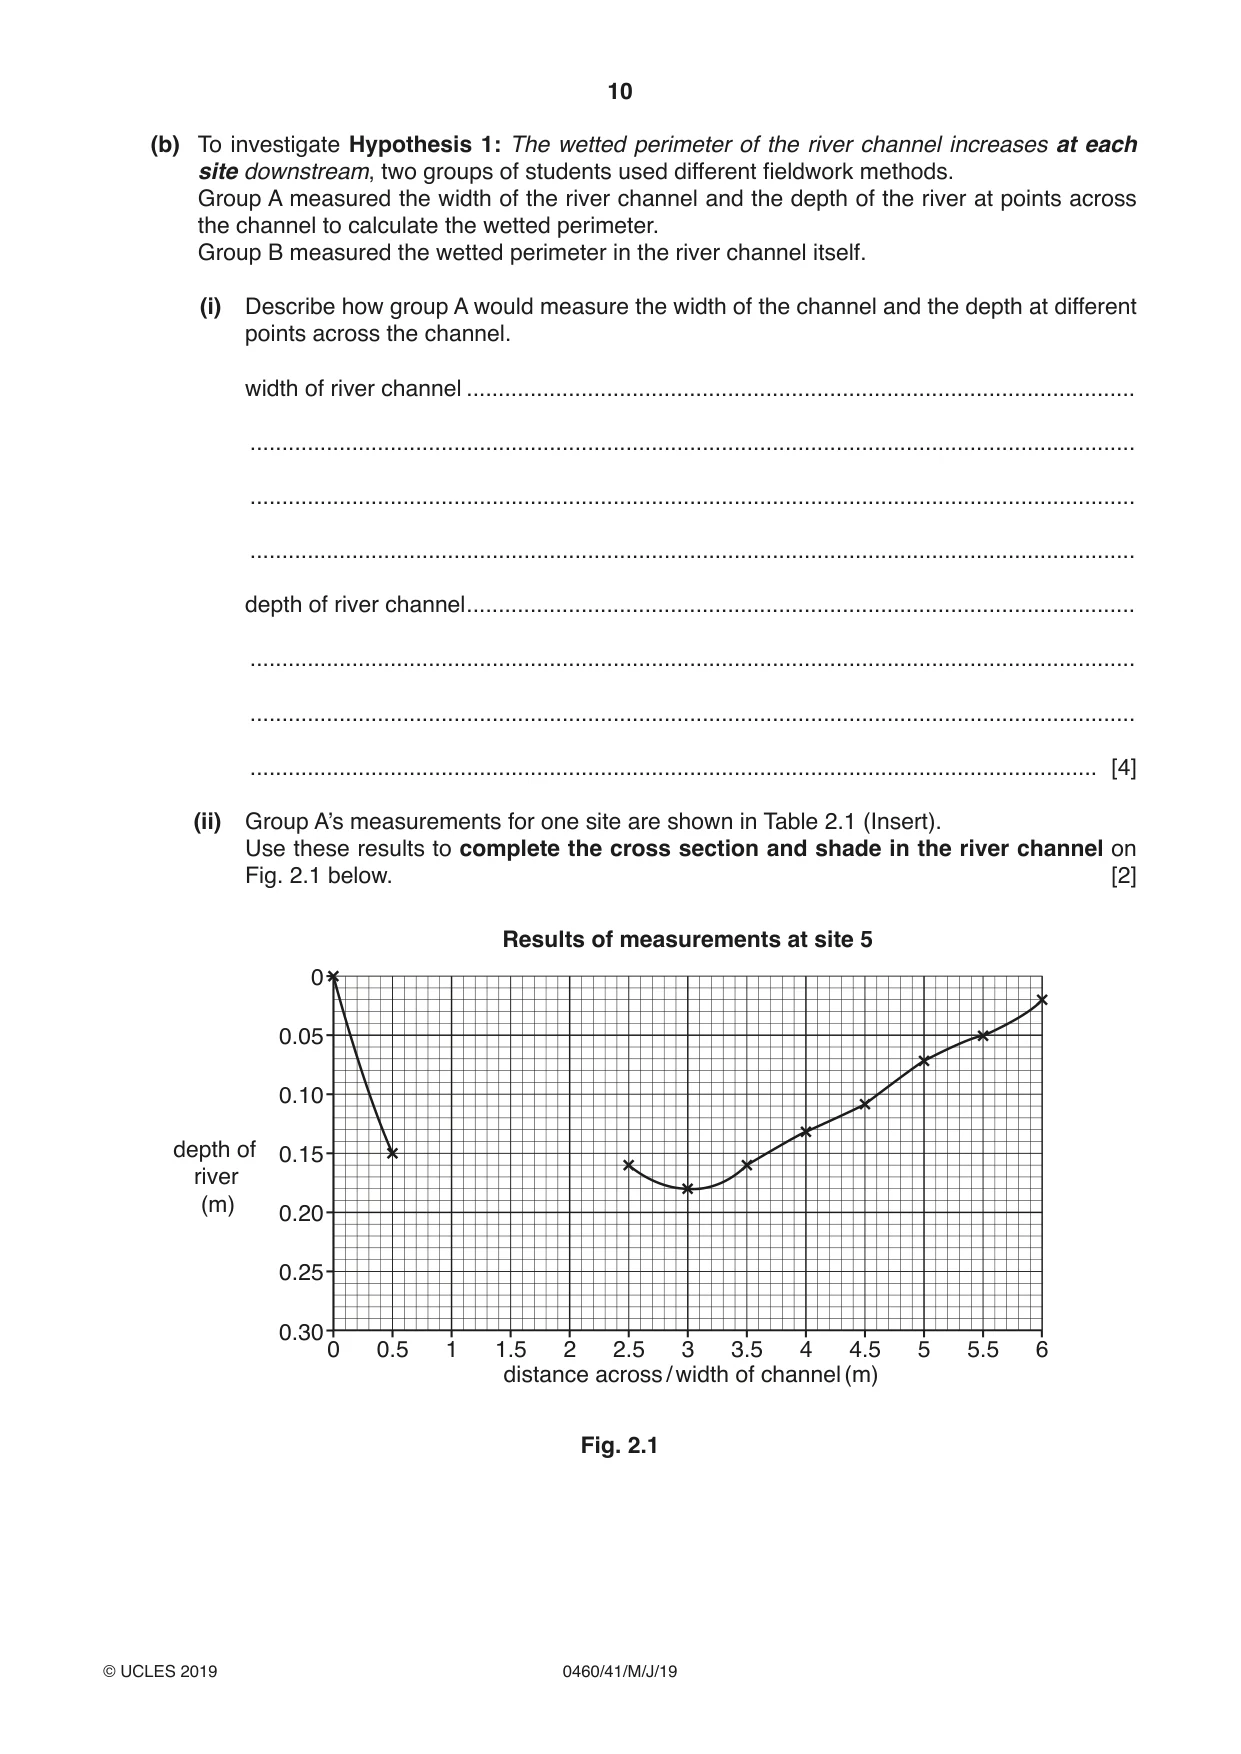
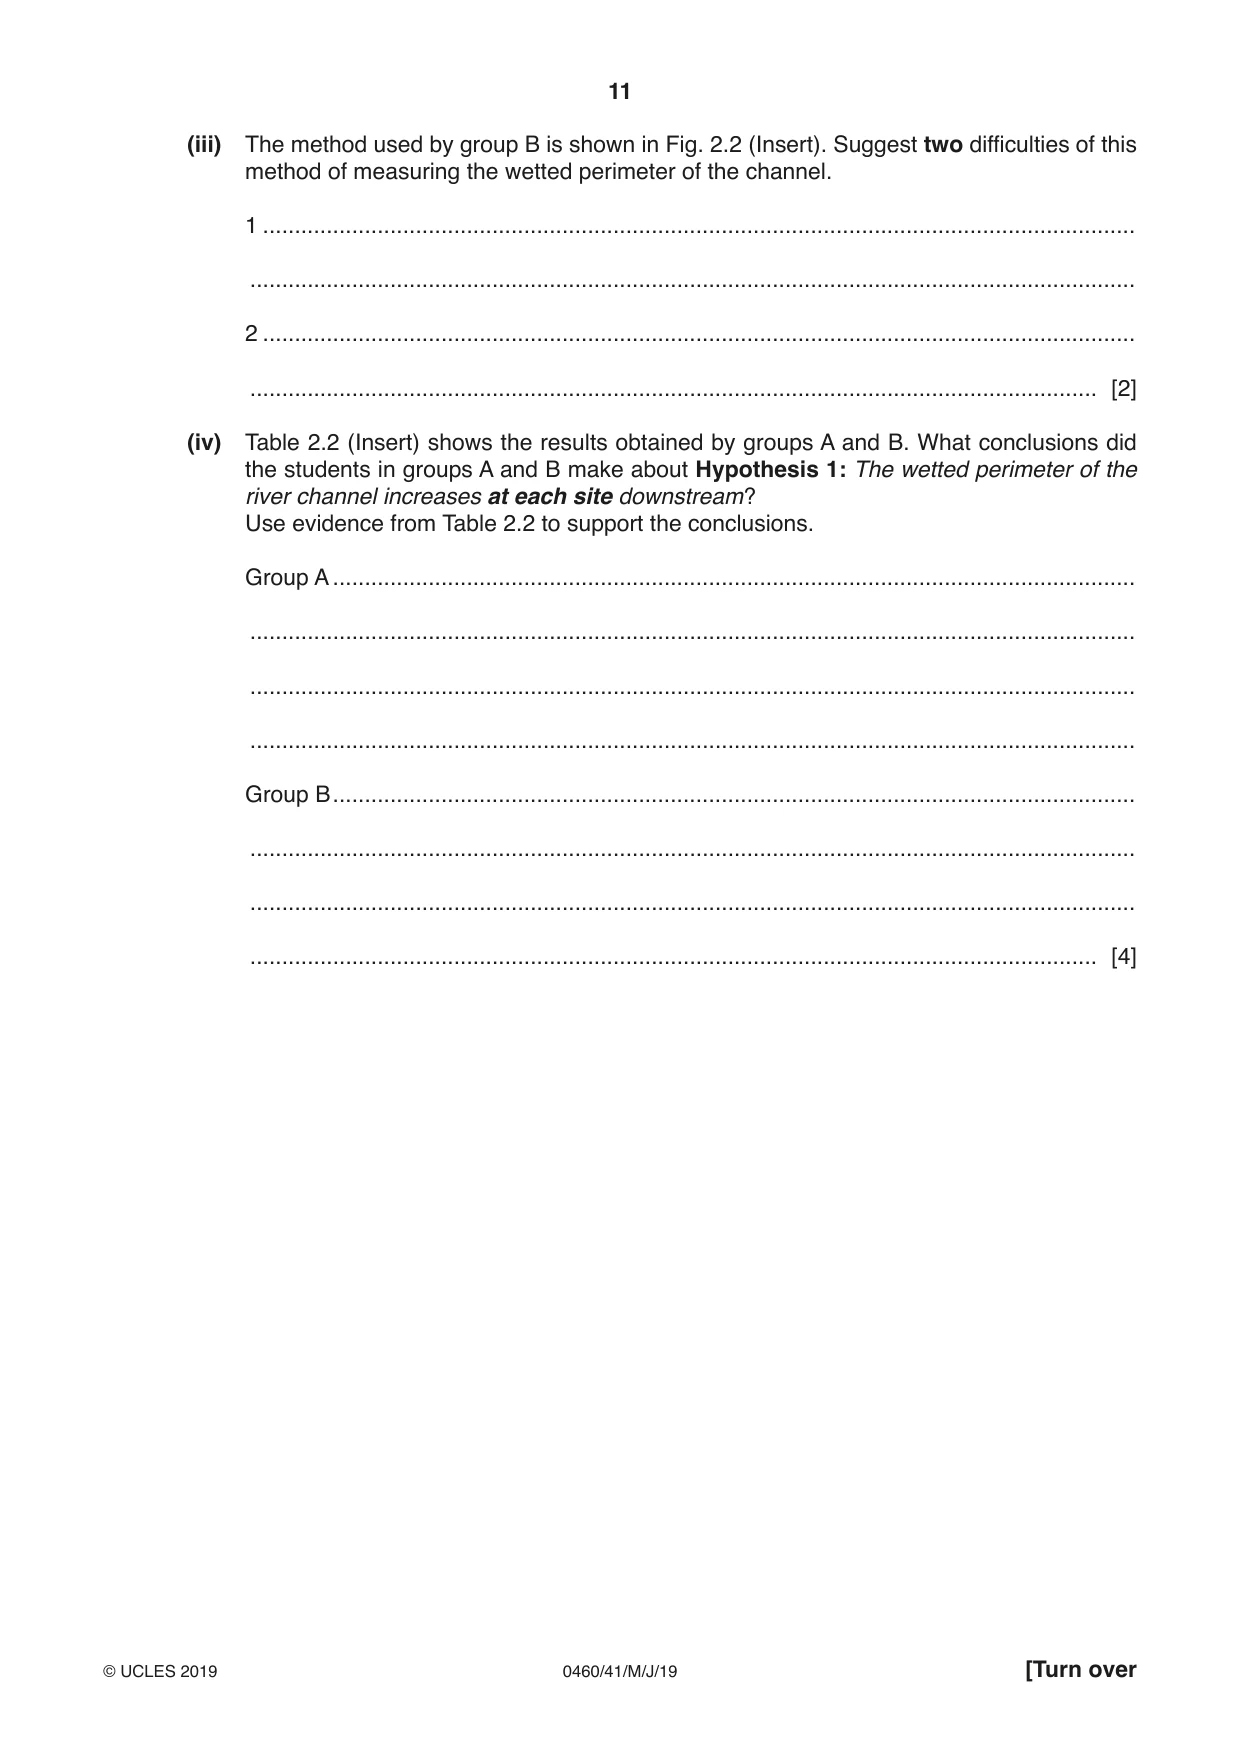
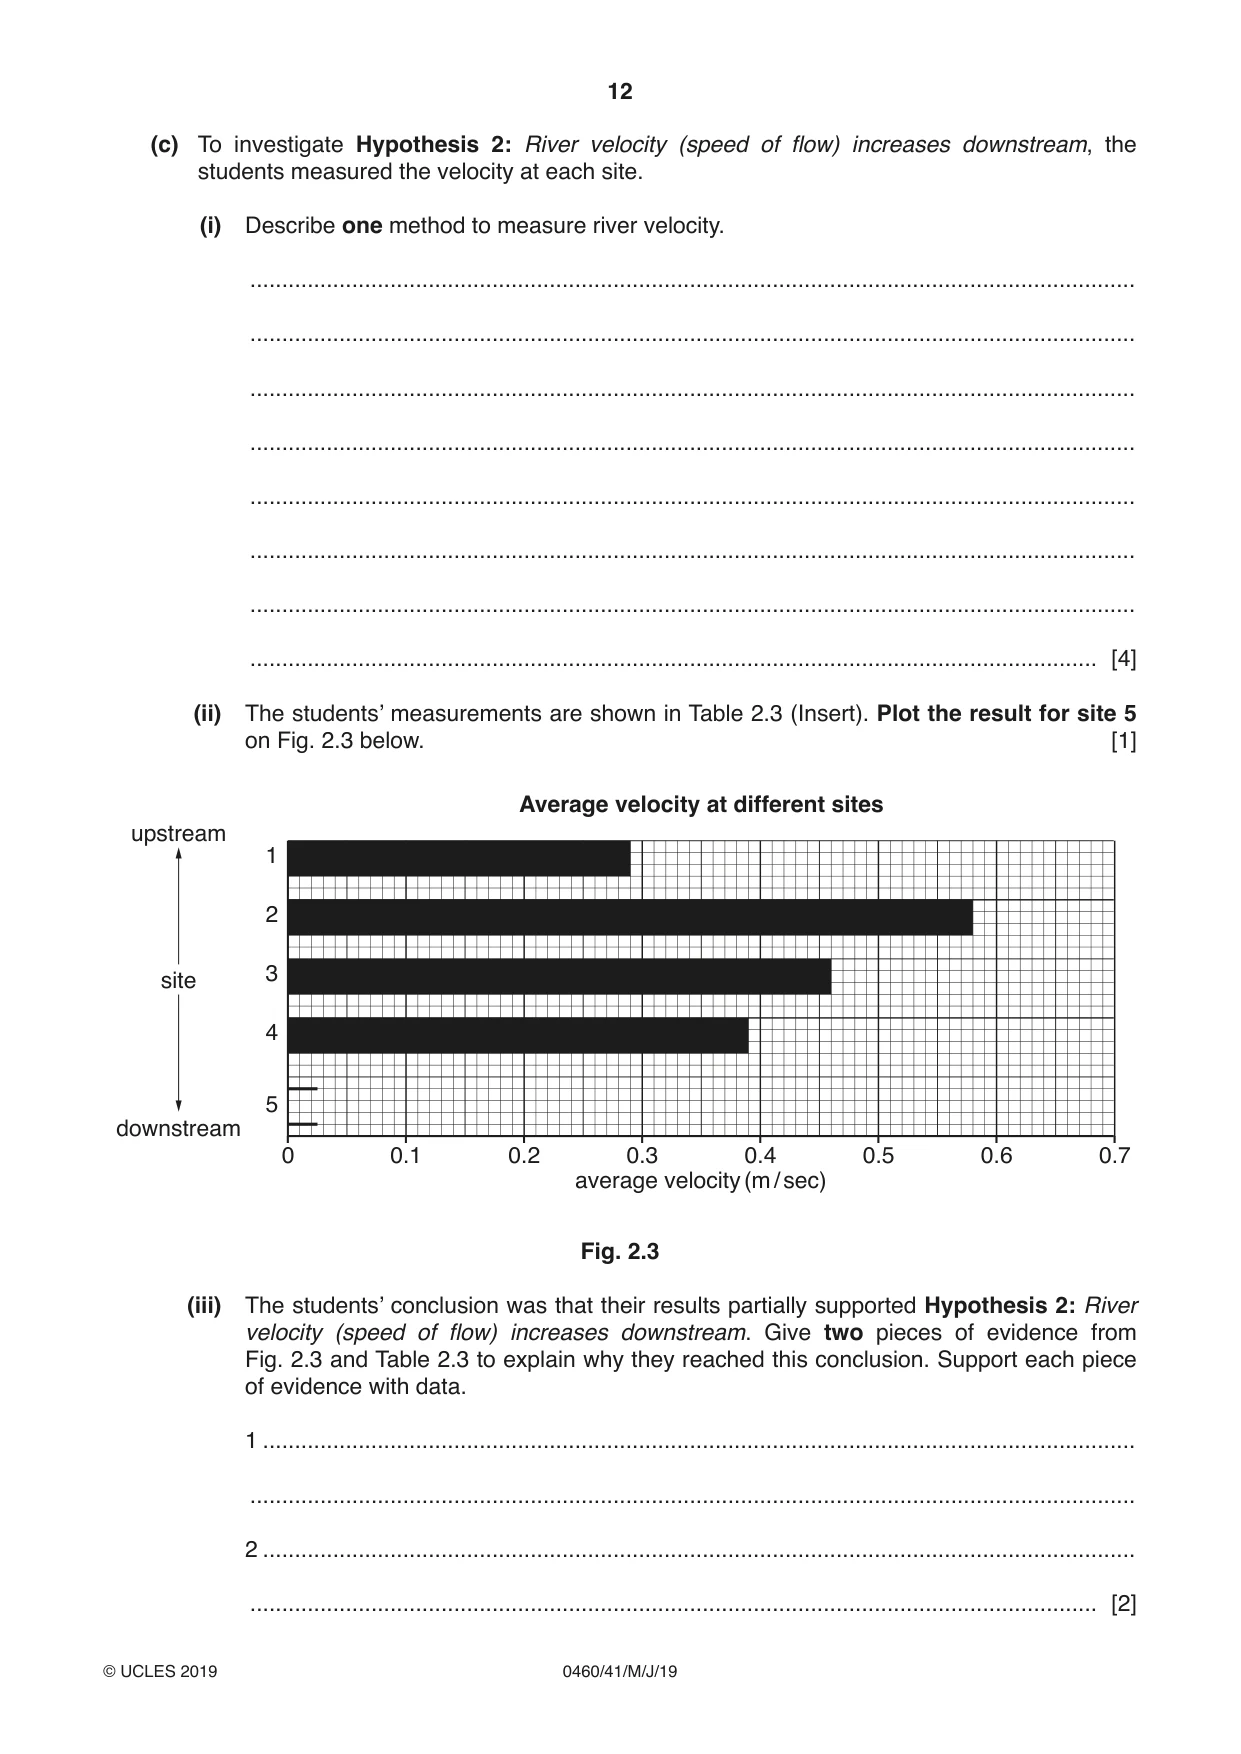
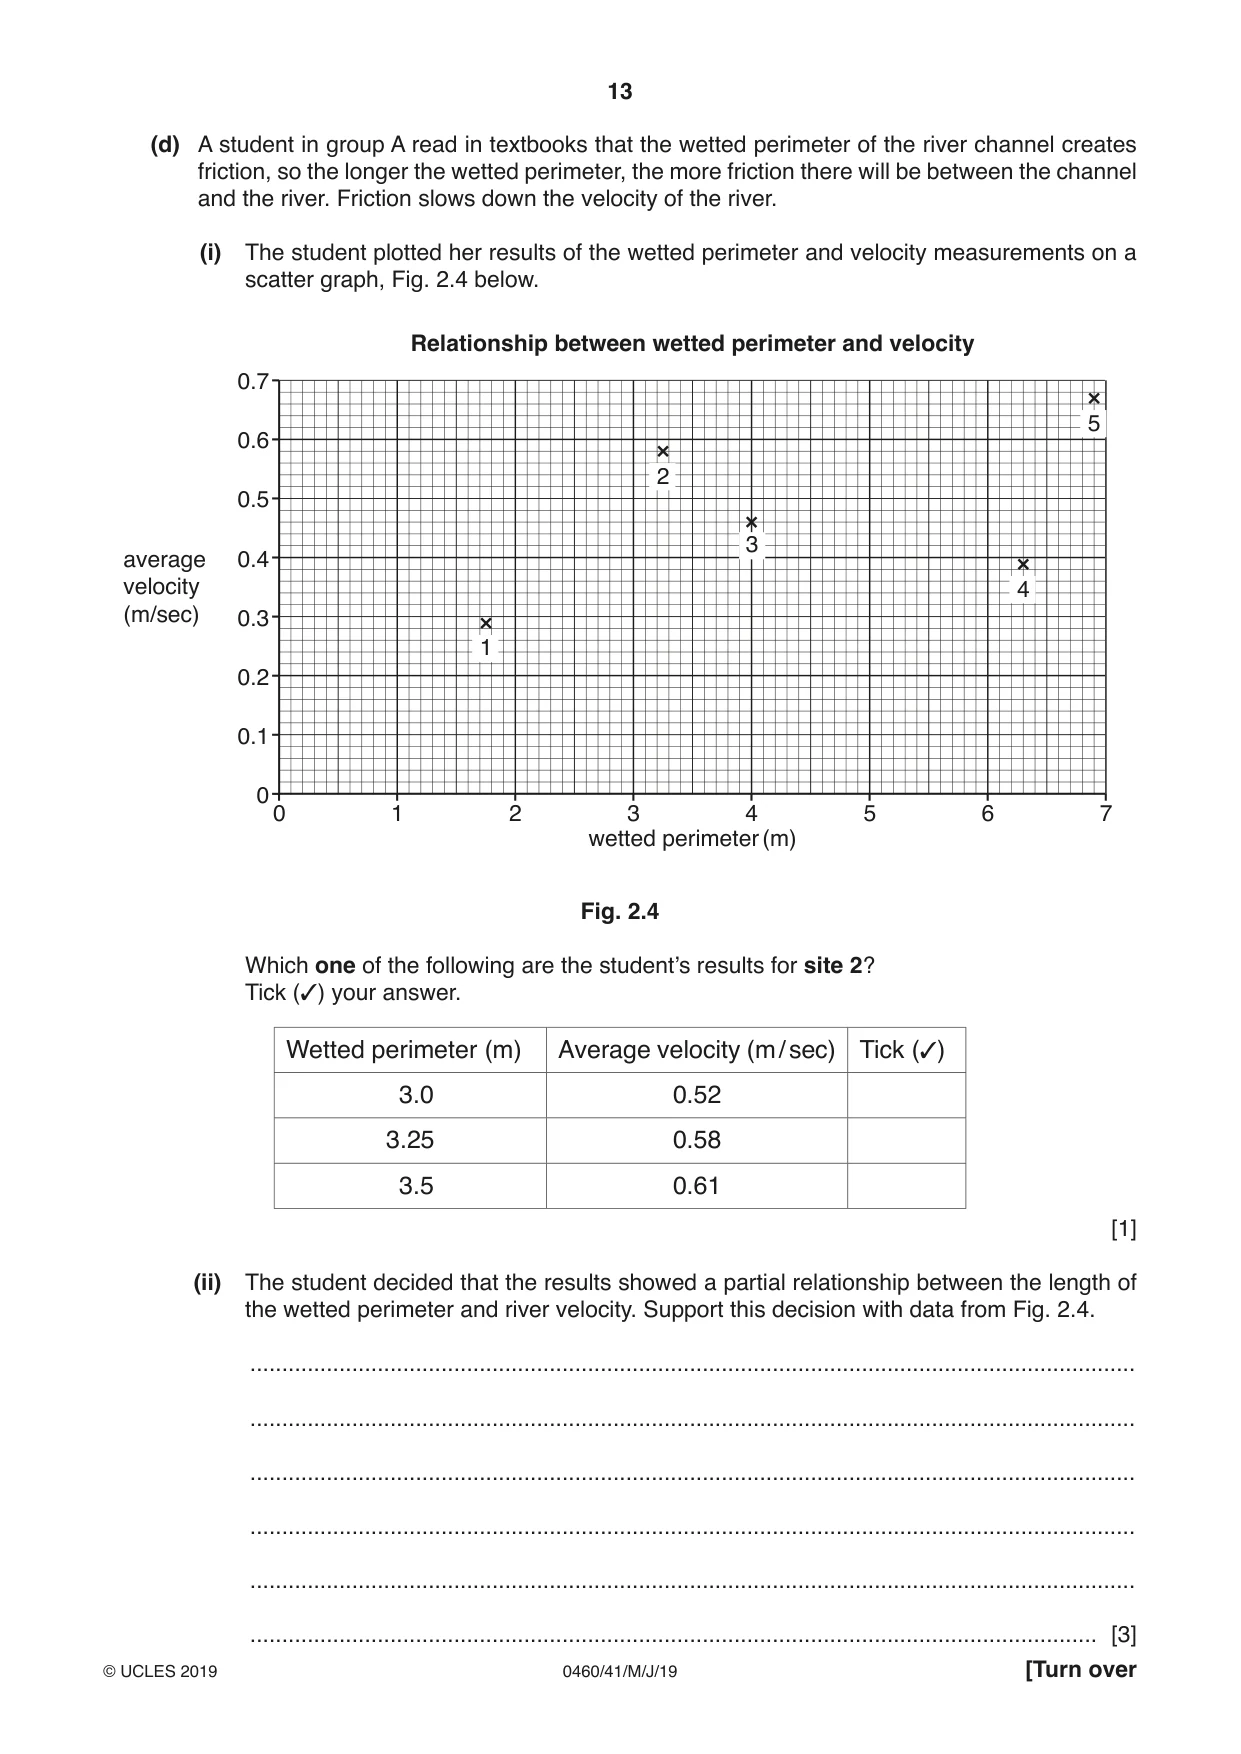
2 Students investigated how the cross section and velocity of a local river changed downstream. They did fieldwork at five sites along the river. The two hypotheses which the students tested were: Hypothesis 1: The wetted perimeter of the river channel increases at each site downstream. The wetted perimeter is the part of the river channel cross section which is in contact with the water. Hypothesis 2: River velocity (speed of flow) increases downstream. (a) Before beginning their fieldwork, the students discussed the fieldwork tasks they needed to do. (i) Suggest three factors the students should have considered in choosing their fieldwork sites. 1 ......................................................................................................................................... ........................................................................................................................................... 2 ......................................................................................................................................... ........................................................................................................................................... 3 ......................................................................................................................................... ..................................................................................................................................... [3] (ii) Suggest how the students could prepare for the fieldwork tasks before making their measurements so that their results would be as accurate as possible. ........................................................................................................................................... ........................................................................................................................................... ........................................................................................................................................... ..................................................................................................................................... [2] (b) To investigate Hypothesis 1: The wetted perimeter of the river channel increases at each site downstream, two groups of students used different fieldwork methods. Group A measured the width of the river channel and the depth of the river at points across the channel to calculate the wetted perimeter. Group B measured the wetted perimeter in the river channel itself. (i) Describe how group A would measure the width of the channel and the depth at different points across the channel. width of river channel ......................................................................................................... ........................................................................................................................................... ........................................................................................................................................... ........................................................................................................................................... depth of river channel ......................................................................................................... ........................................................................................................................................... ........................................................................................................................................... ..................................................................................................................................... [4] (ii) Group A’s measurements for one site are shown in Table 2.1 (Insert). Use these results to complete the cross section and shade in the river channel on Fig. 2.1 below. [2] Results of measurements at site 5 0 0.05 0.10 depth of 0.15 river (m) 0.20 0.25 0.30 0 0.5 1 1.5 2 2.5 3 3.5 4 4.5 5 5.5 6 distance across / width of channel (m) Fig. 2.1 (iii) The method used by group B is shown in Fig. 2.2 (Insert). Suggest two difficulties of this method of measuring the wetted perimeter of the channel. 1 ......................................................................................................................................... ........................................................................................................................................... 2 ......................................................................................................................................... ..................................................................................................................................... [2] (iv) Table 2.2 (Insert) shows the results obtained by groups A and B. What conclusions did the students in groups A and B make about Hypothesis 1: The wetted perimeter of the river channel increases at each site downstream? Use evidence from Table 2.2 to support the conclusions. Group A .............................................................................................................................. ........................................................................................................................................... ........................................................................................................................................... ........................................................................................................................................... Group B .............................................................................................................................. ........................................................................................................................................... ........................................................................................................................................... ..................................................................................................................................... [4]
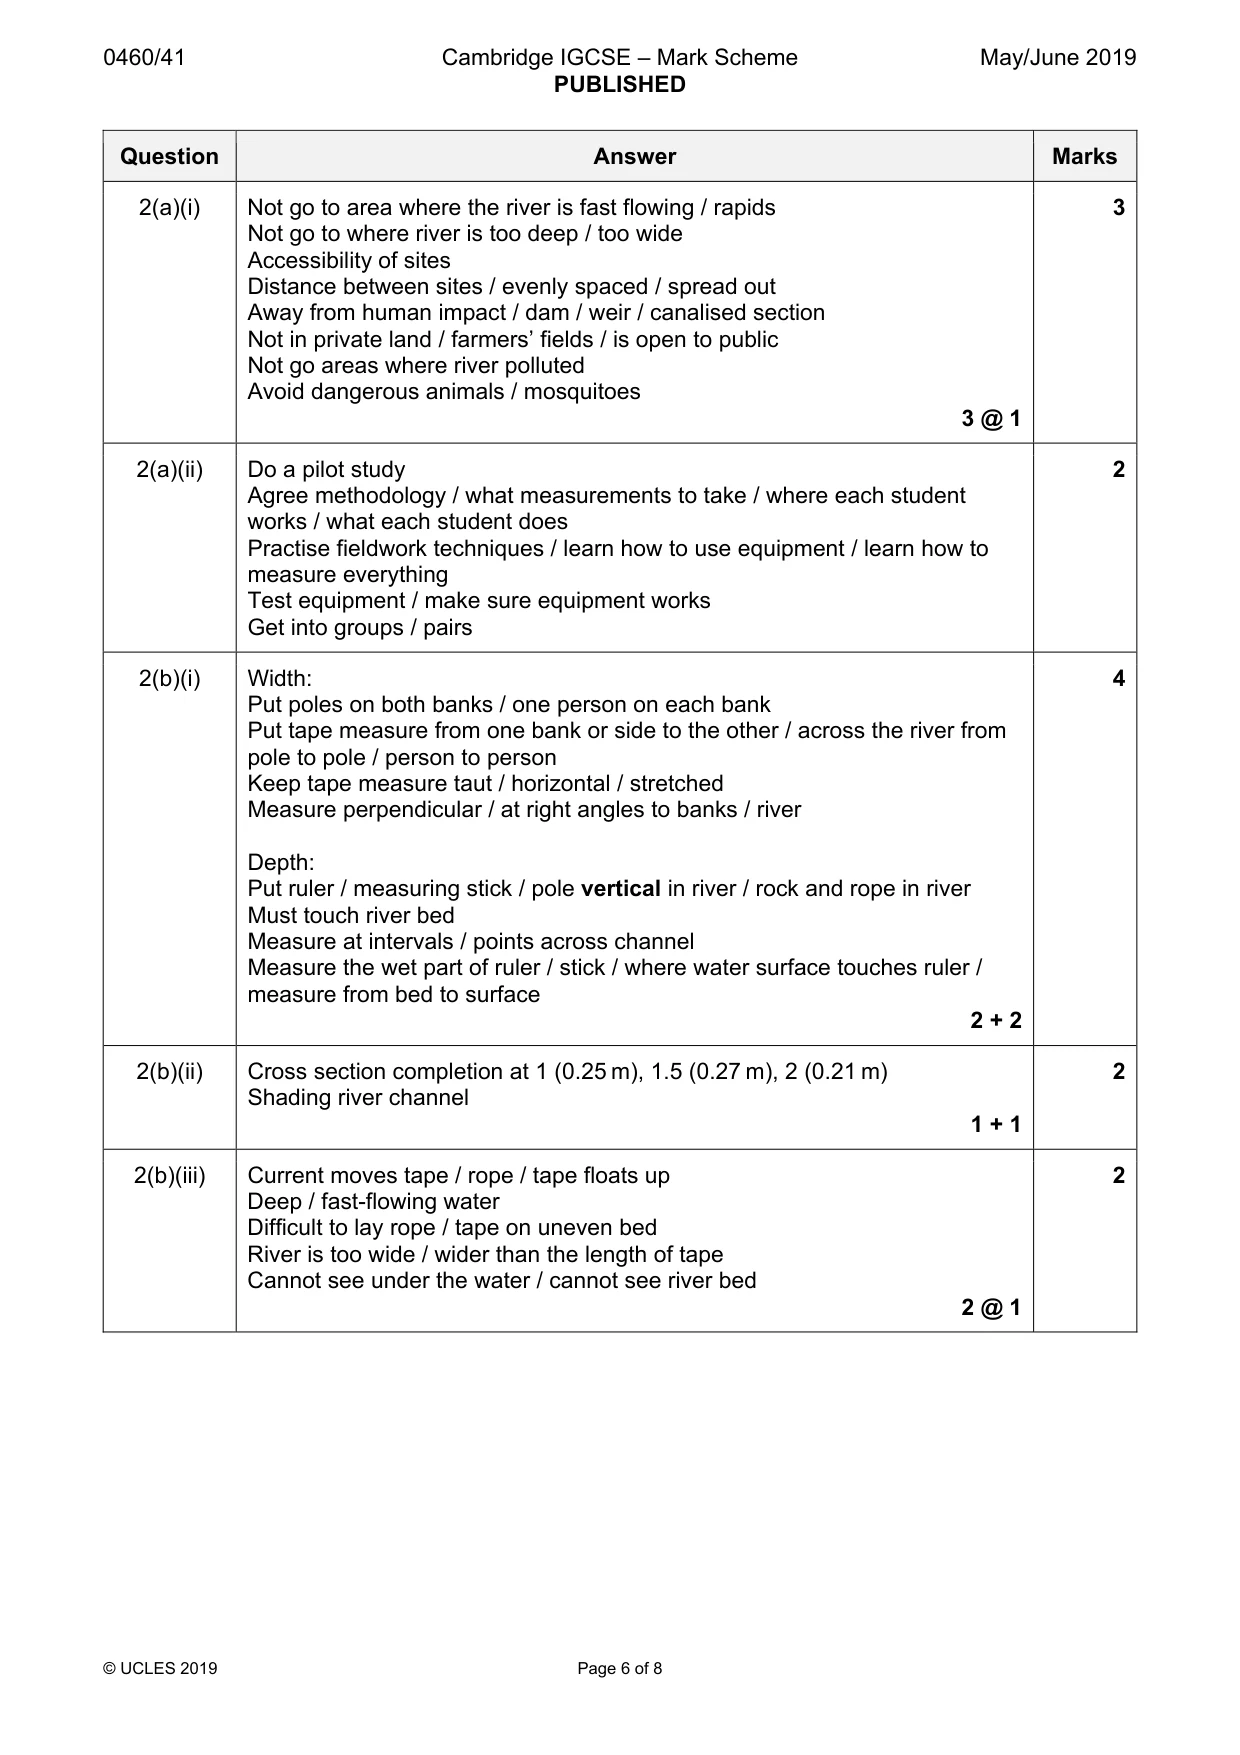
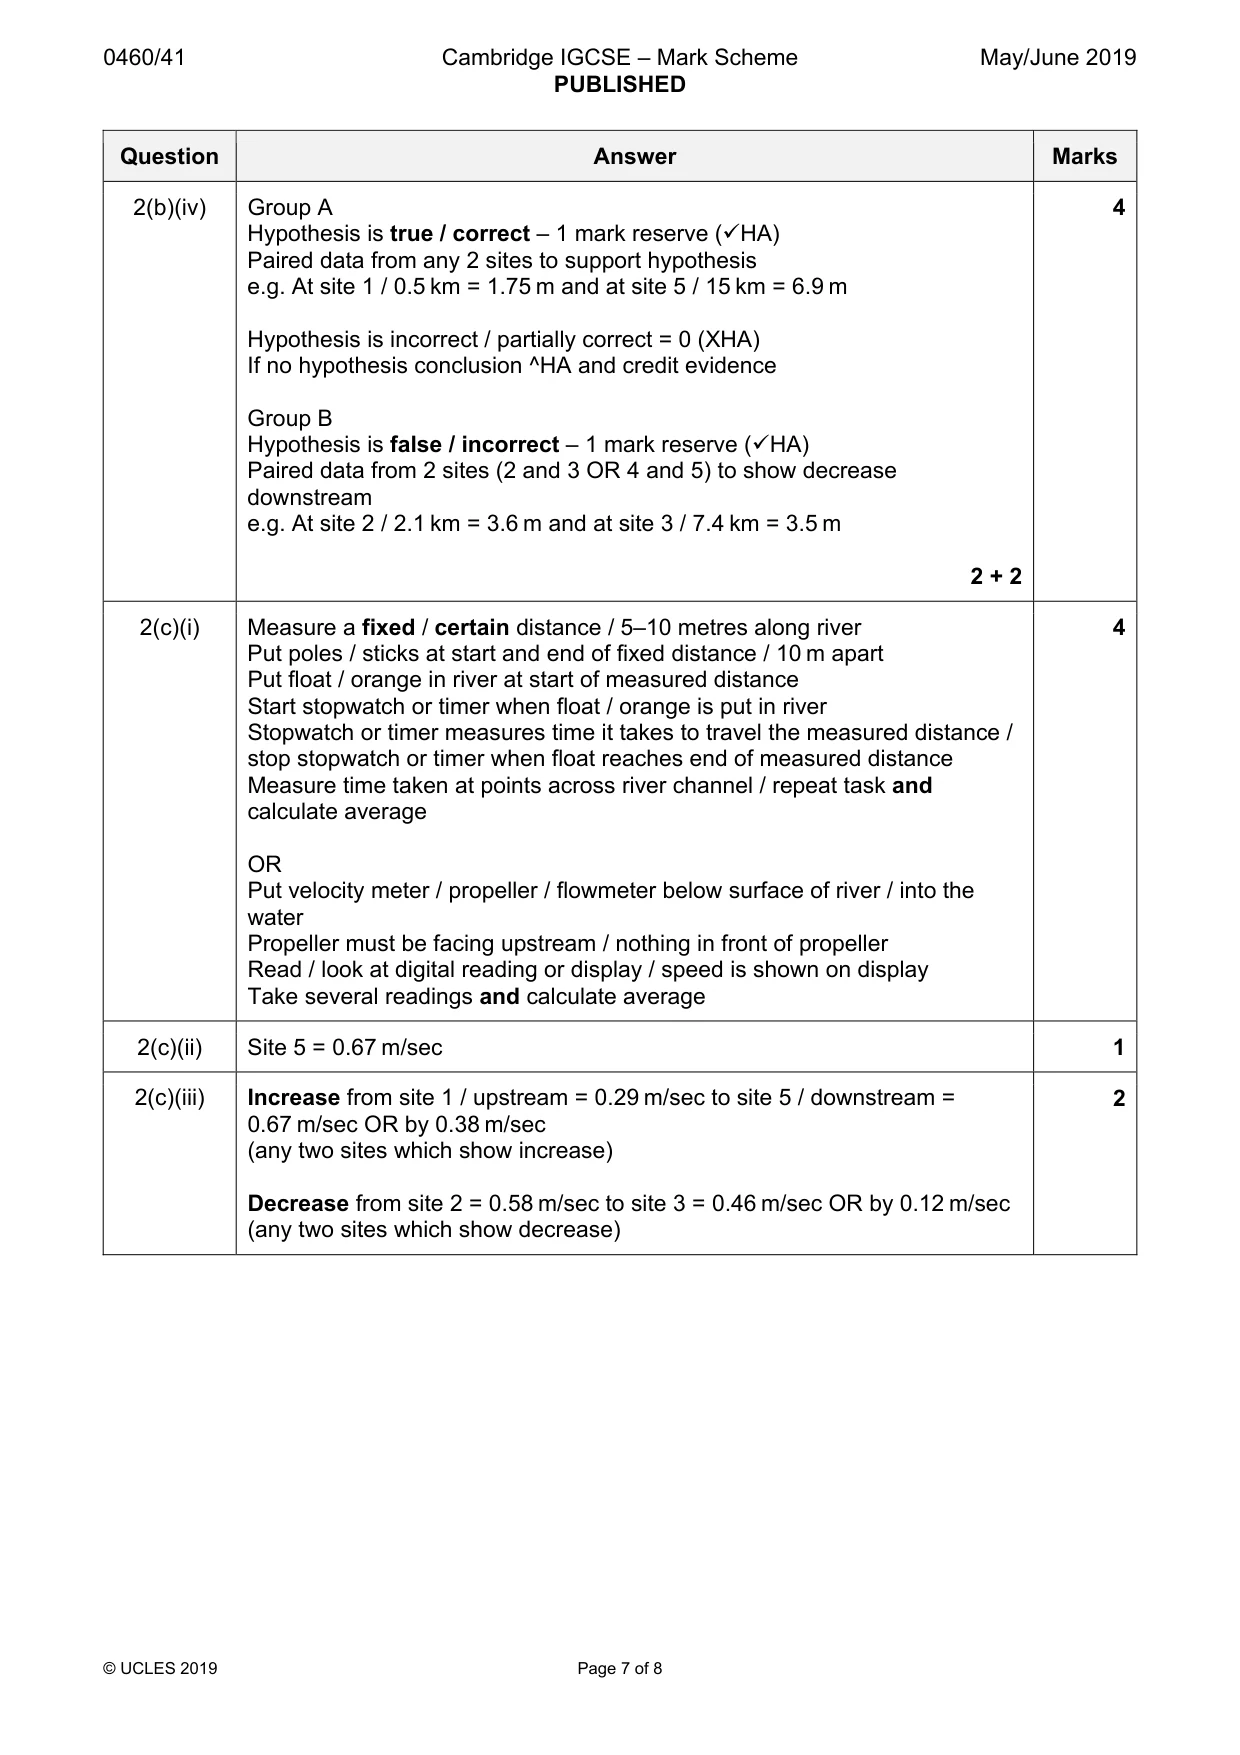
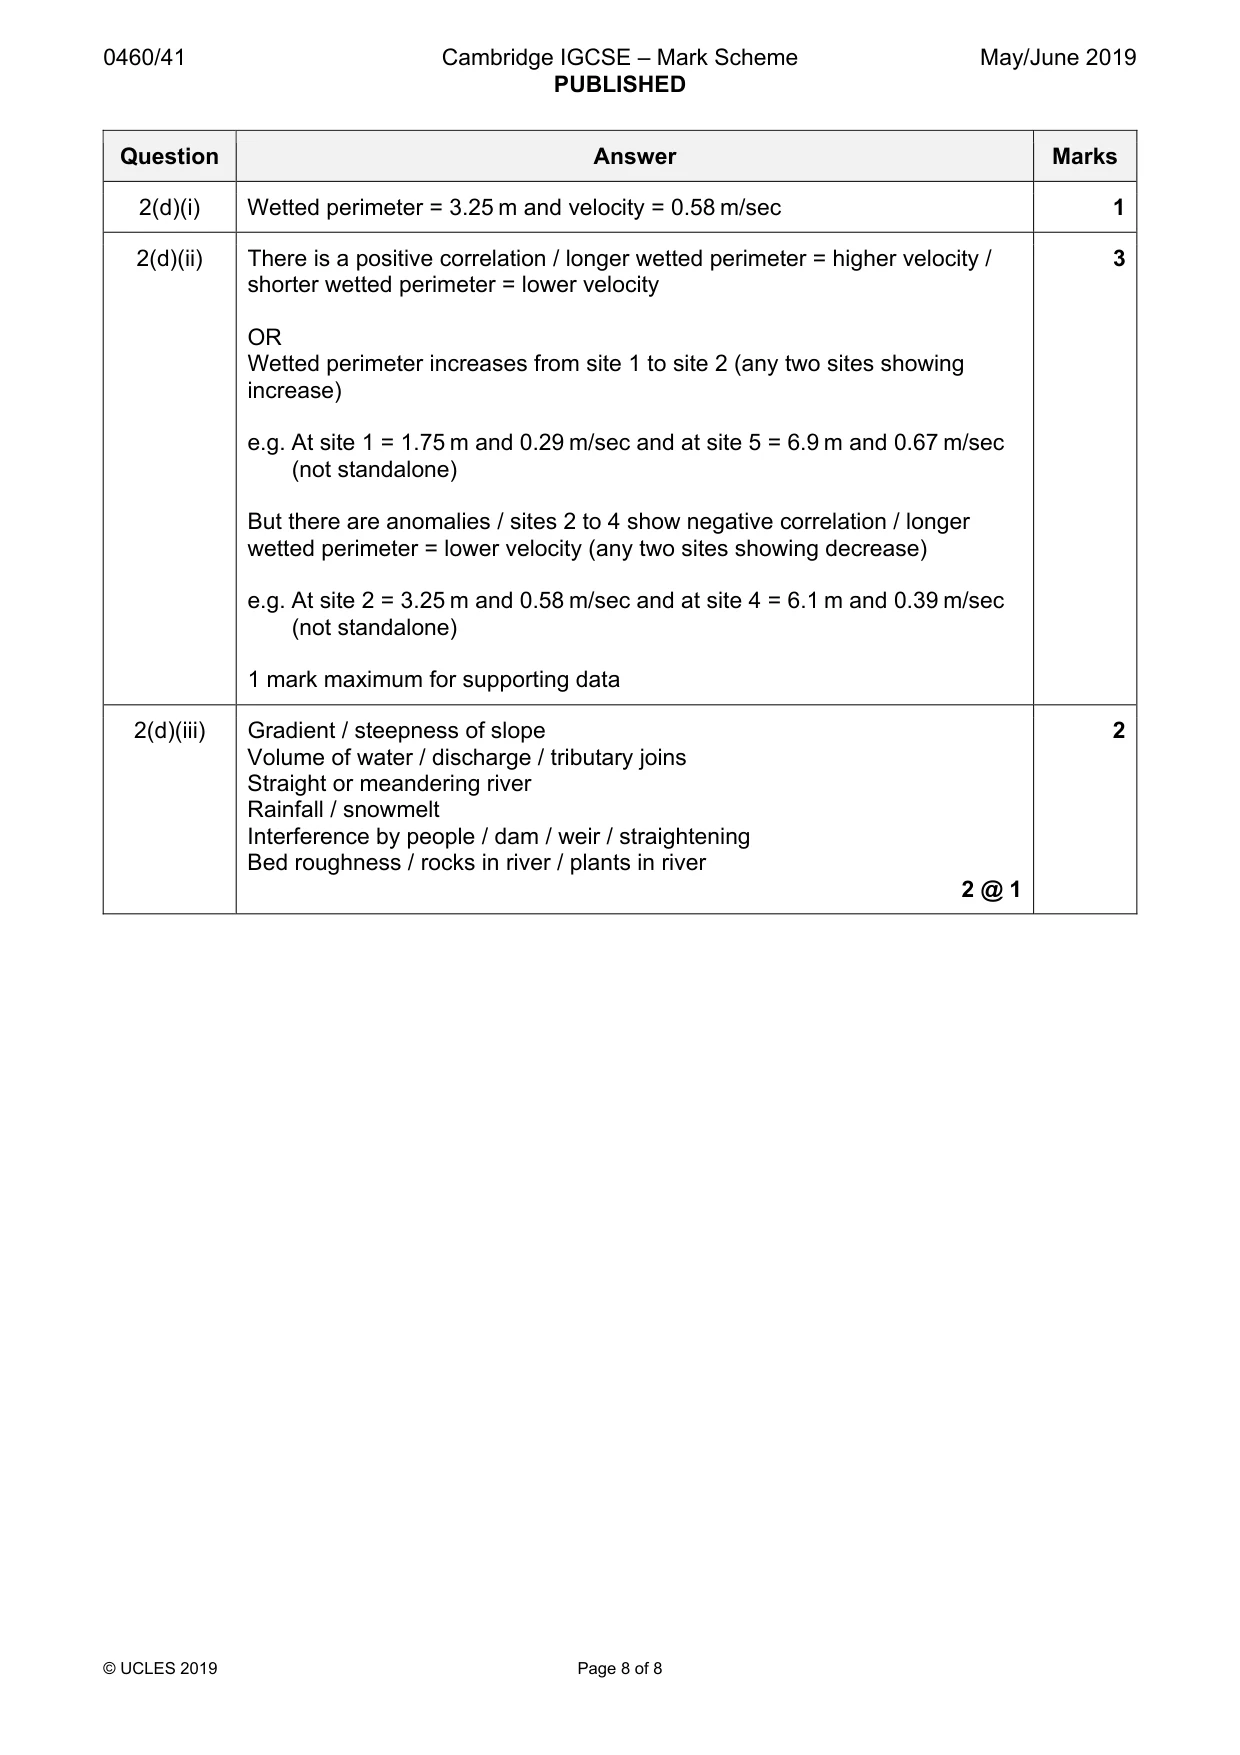
Mark scheme: 2(a)(i) Not go to area where the river is fast flowing / rapids 3 Not go to where river is too deep / too wide Accessibility of sites Distance between sites / evenly spaced / spread out Away from human impact / dam / weir / canalised section Not in private land / farmers’ fields / is open to public Not go areas where river polluted Avoid dangerous animals / mosquitoes 3 @ 1 2(a)(ii) Do a pilot study 2 Agree methodology / what measurements to take / where each student works / what each student does Practise fieldwork techniques / learn how to use equipment / learn how to measure everything Test equipment / make sure equipment works Get into groups / pairs 2(b)(i) Width: 4 Put poles on both banks / one person on each bank Put tape measure from one bank or side to the other / across the river from pole to pole / person to person Keep tape measure taut / horizontal / stretched Measure perpendicular / at right angles to banks / river Depth: Put ruler / measuring stick / pole vertical in river / rock and rope in river Must touch river bed Measure at intervals / points across channel Measure the wet part of ruler / stick / where water surface touches ruler / measure from bed to surface 2 + 2 2(b)(ii) Cross section completion at 1 (0.25 m), 1.5 (0.27 m), 2 (0.21 m) 2 Shading river channel 1 + 1 2(b)(iii) Current moves tape / rope / tape floats up 2 Deep / fast-flowing water Difficult to lay rope / tape on uneven bed River is too wide / wider than the length of tape Cannot see under the water / cannot see river bed 2 @ 1 2(b)(iv) Group A 4 Hypothesis is true / correct – 1 mark reserve (9HA) Paired data from any 2 sites to support hypothesis e.g. At site 1 / 0.5 km = 1.75 m and at site 5 / 15 km = 6.9 m Hypothesis is incorrect / partially correct = 0 (XHA) If no hypothesis conclusion ^HA and credit evidence Group B Hypothesis is false / incorrect – 1 mark reserve (9HA) Paired data from 2 sites (2 and 3 OR 4 and 5) to show decrease downstream e.g. At site 2 / 2.1 km = 3.6 m and at site 3 / 7.4 km = 3.5 m 2 + 2 2(c)(i) Measure a fixed / certain distance / 5–10 metres along river 4 Put poles / sticks at start and end of fixed distance / 10 m apart Put float / orange in river at start of measured distance Start stopwatch or timer when float / orange is put in river Stopwatch or timer measures time it takes to travel the measured distance / stop stopwatch or timer when float reaches end of measured distance Measure time taken at points across river channel / repeat task and calculate average OR Put velocity meter / propeller / flowmeter below surface of river / into the water Propeller must be facing upstream / nothing in front of propeller Read / look at digital reading or display / speed is shown on display Take several readings and calculate average 2(c)(ii) Site 5 = 0.67 m/sec 1 2(c)(iii) Increase from site 1 / upstream = 0.29 m/sec to site 5 / downstream = 2 0.67 m/sec OR by 0.38 m/sec (any two sites which show increase) Decrease from site 2 = 0.58 m/sec to site 3 = 0.46 m/sec OR by 0.12 m/sec (any two sites which show decrease) 2(d)(i) Wetted perimeter = 3.25 m and velocity = 0.58 m/sec 1 2(d)(ii) There is a positive correlation / longer wetted perimeter = higher velocity / 3 shorter wetted perimeter = lower velocity OR Wetted perimeter increases from site 1 to site 2 (any two sites showing increase) e.g. At site 1 = 1.75 m and 0.29 m/sec and at site 5 = 6.9 m and 0.67 m/sec (not standalone) But there are anomalies / sites 2 to 4 show negative correlation / longer wetted perimeter = lower velocity (any two sites showing decrease) e.g. At site 2 = 3.25 m and 0.58 m/sec and at site 4 = 6.1 m and 0.39 m/sec (not standalone) 1 mark maximum for supporting data 2(d)(iii) Gradient / steepness of slope 2 Volume of water / discharge / tributary joins Straight or meandering river Rainfall / snowmelt Interference by people / dam / weir / straightening Bed roughness / rocks in river / plants in river 2 @ 1
What was in this paper
The subtopics covered by these 2 questions, and how many questions each got. Open one in a new tab to see every Cambridge question on it.
What you needed in this session
Cambridge’s own grade thresholds for 2019 May/June, Paper 4 · Variant 1. A higher threshold means an easier paper — the bar moves with how the cohort did.