Cambridge IGCSE Geography 0460 — 2018 Oct/Nov Paper 4 · Variant 3
0460/43/O/N/18 · 2 questions · 60 marks · ≈68 min
The question paper and its mark scheme, free to read here and free to download. This is Cambridge’s own paper, exactly as it was sat.
Question paper20 pages



Mark scheme7 pages
Answers below. Sit the paper first if you are practising.
Questions as text
Q1 · Students in England did fieldwork at twelve sites on a stream called Ashes Hollow
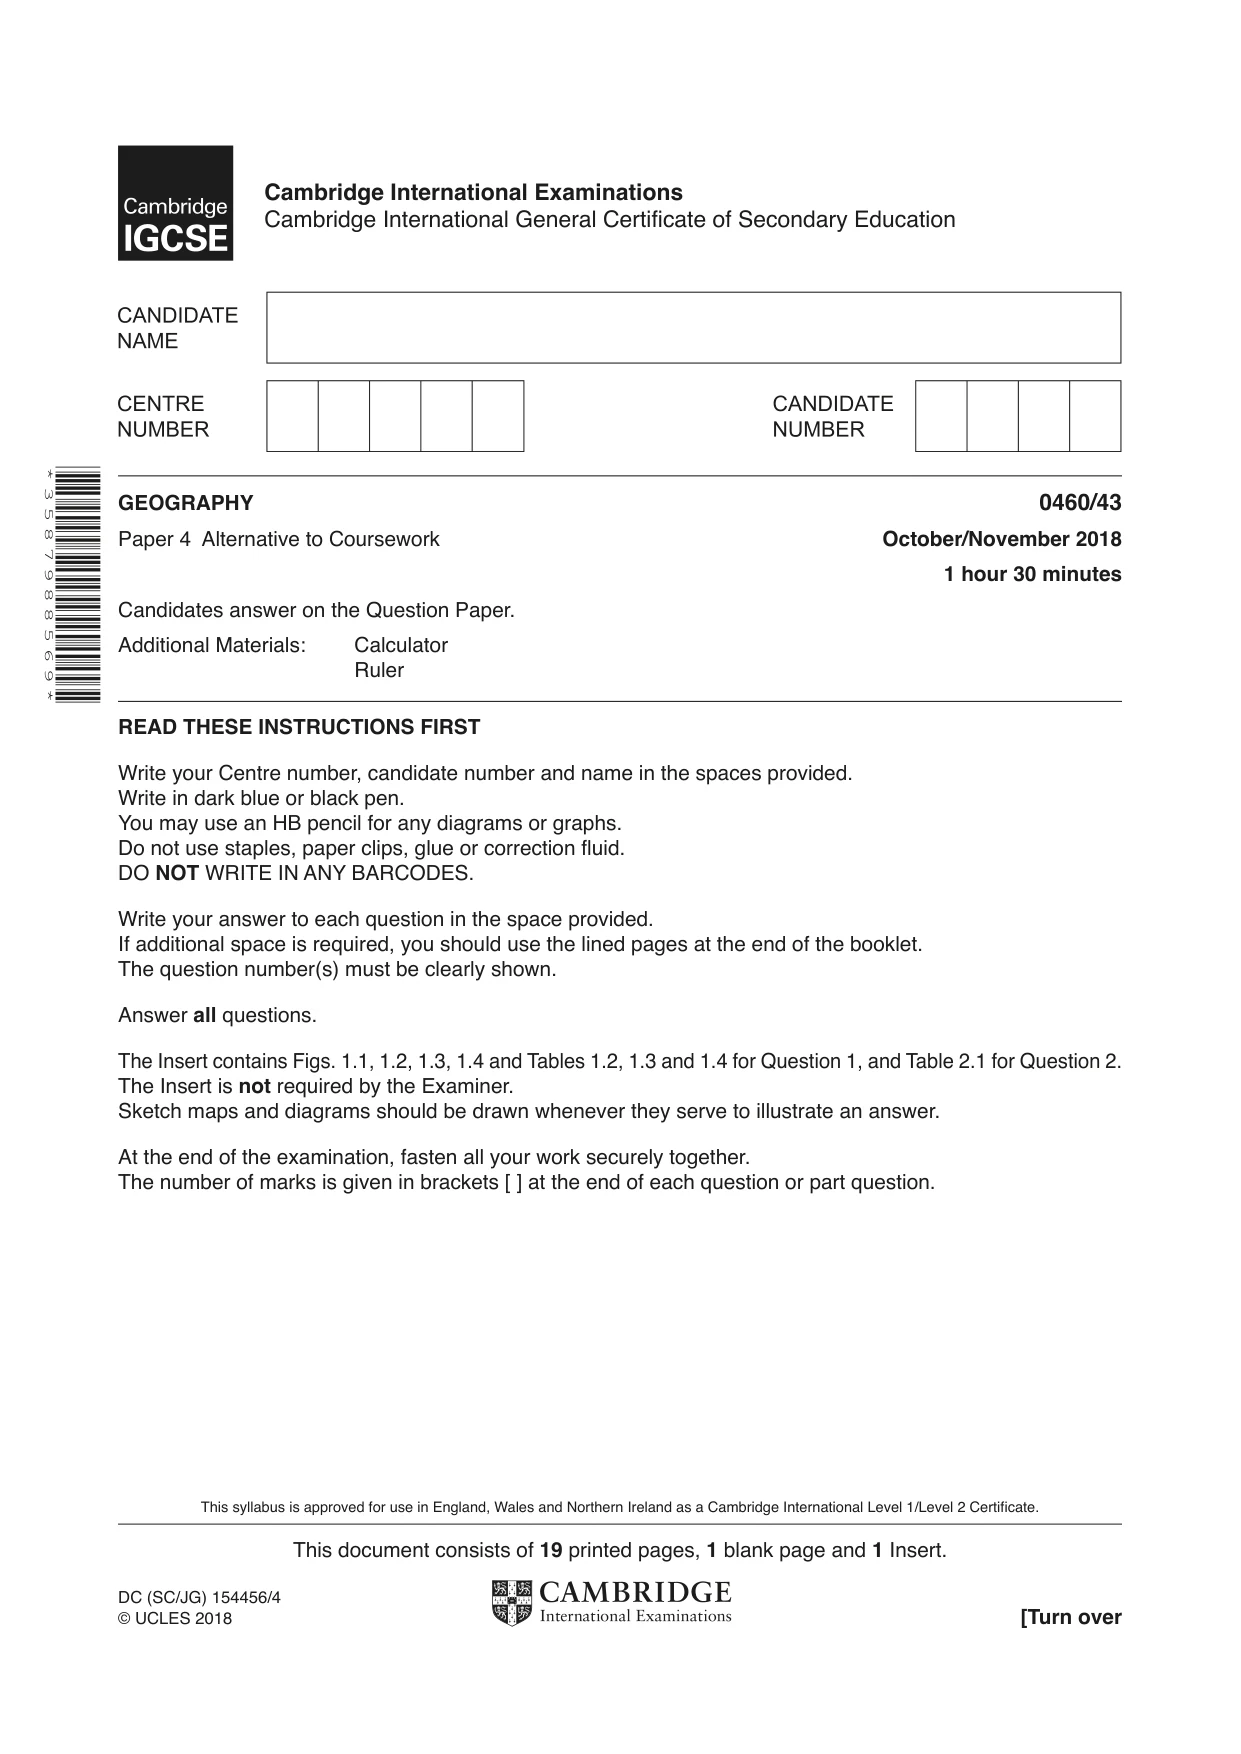
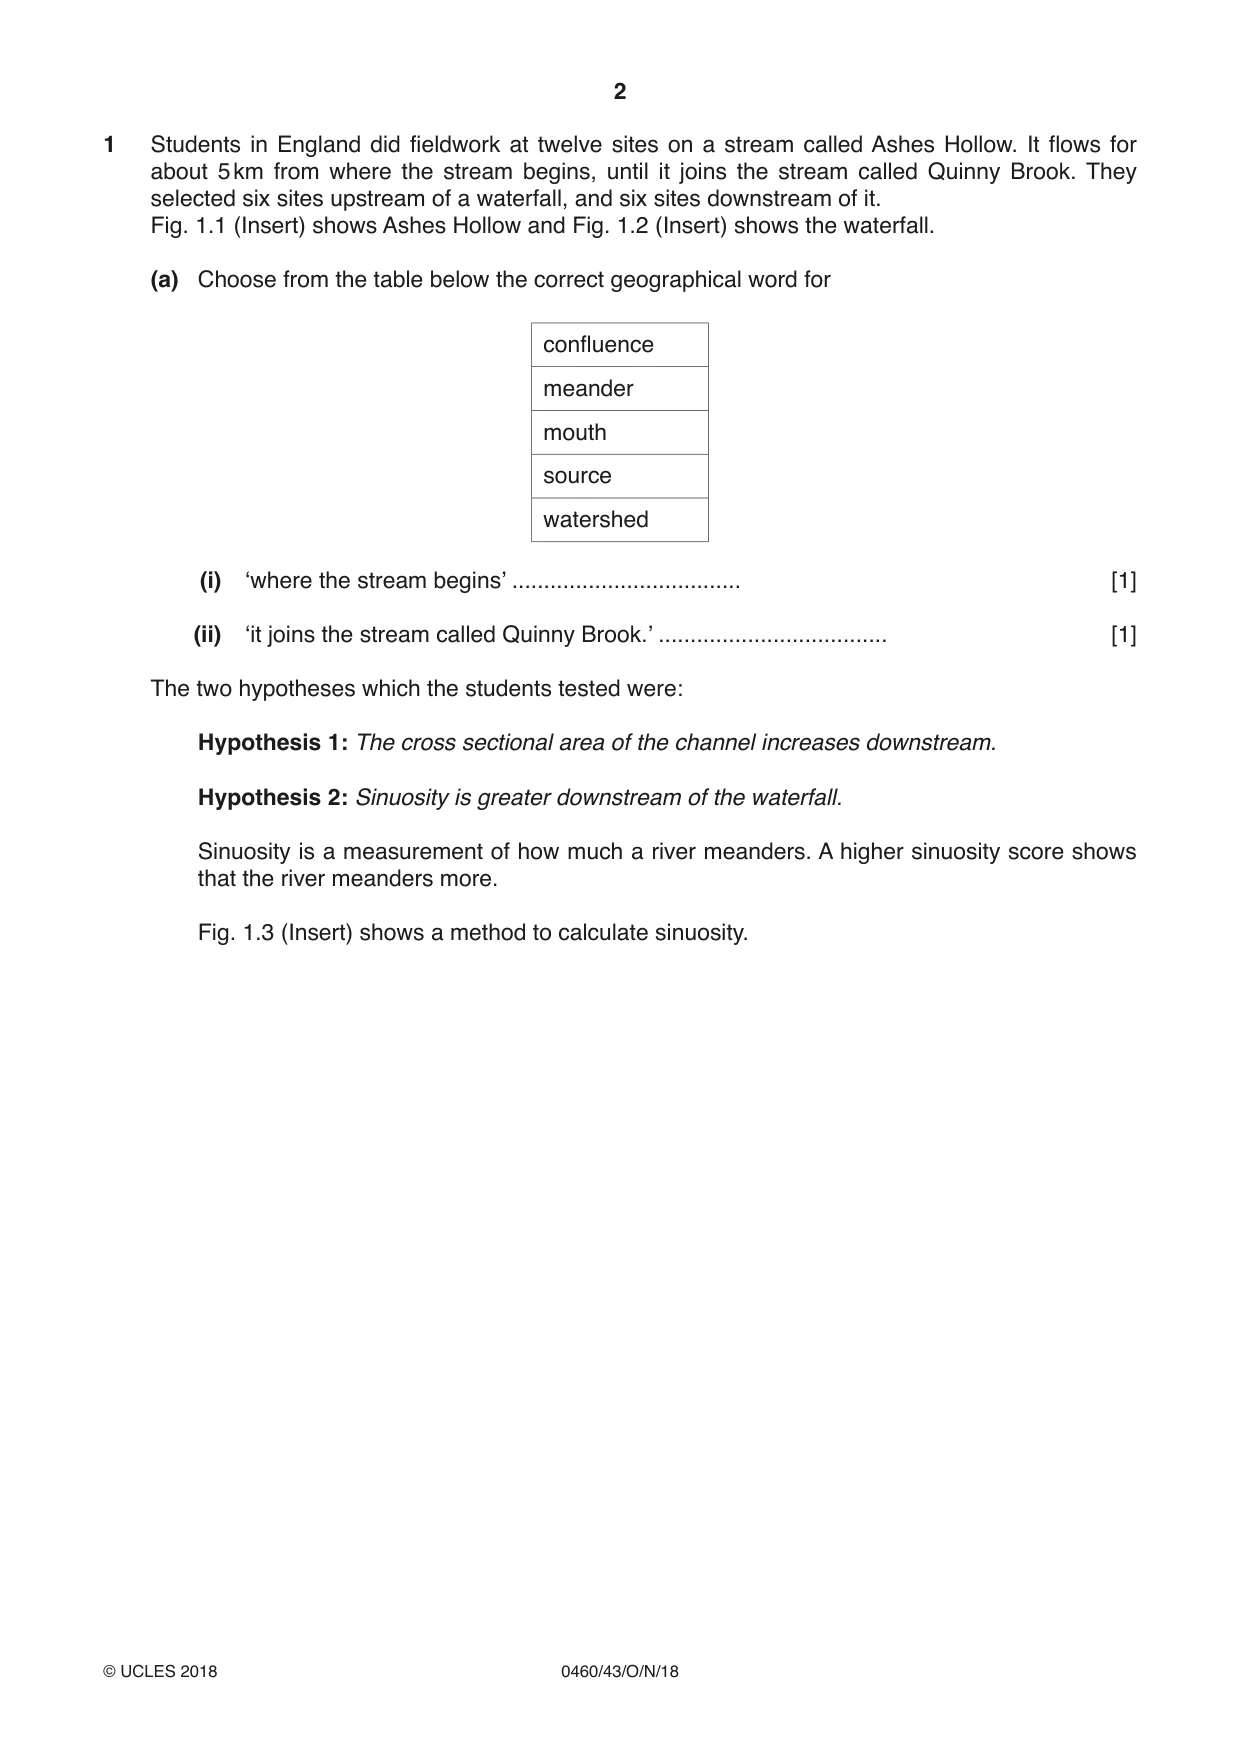
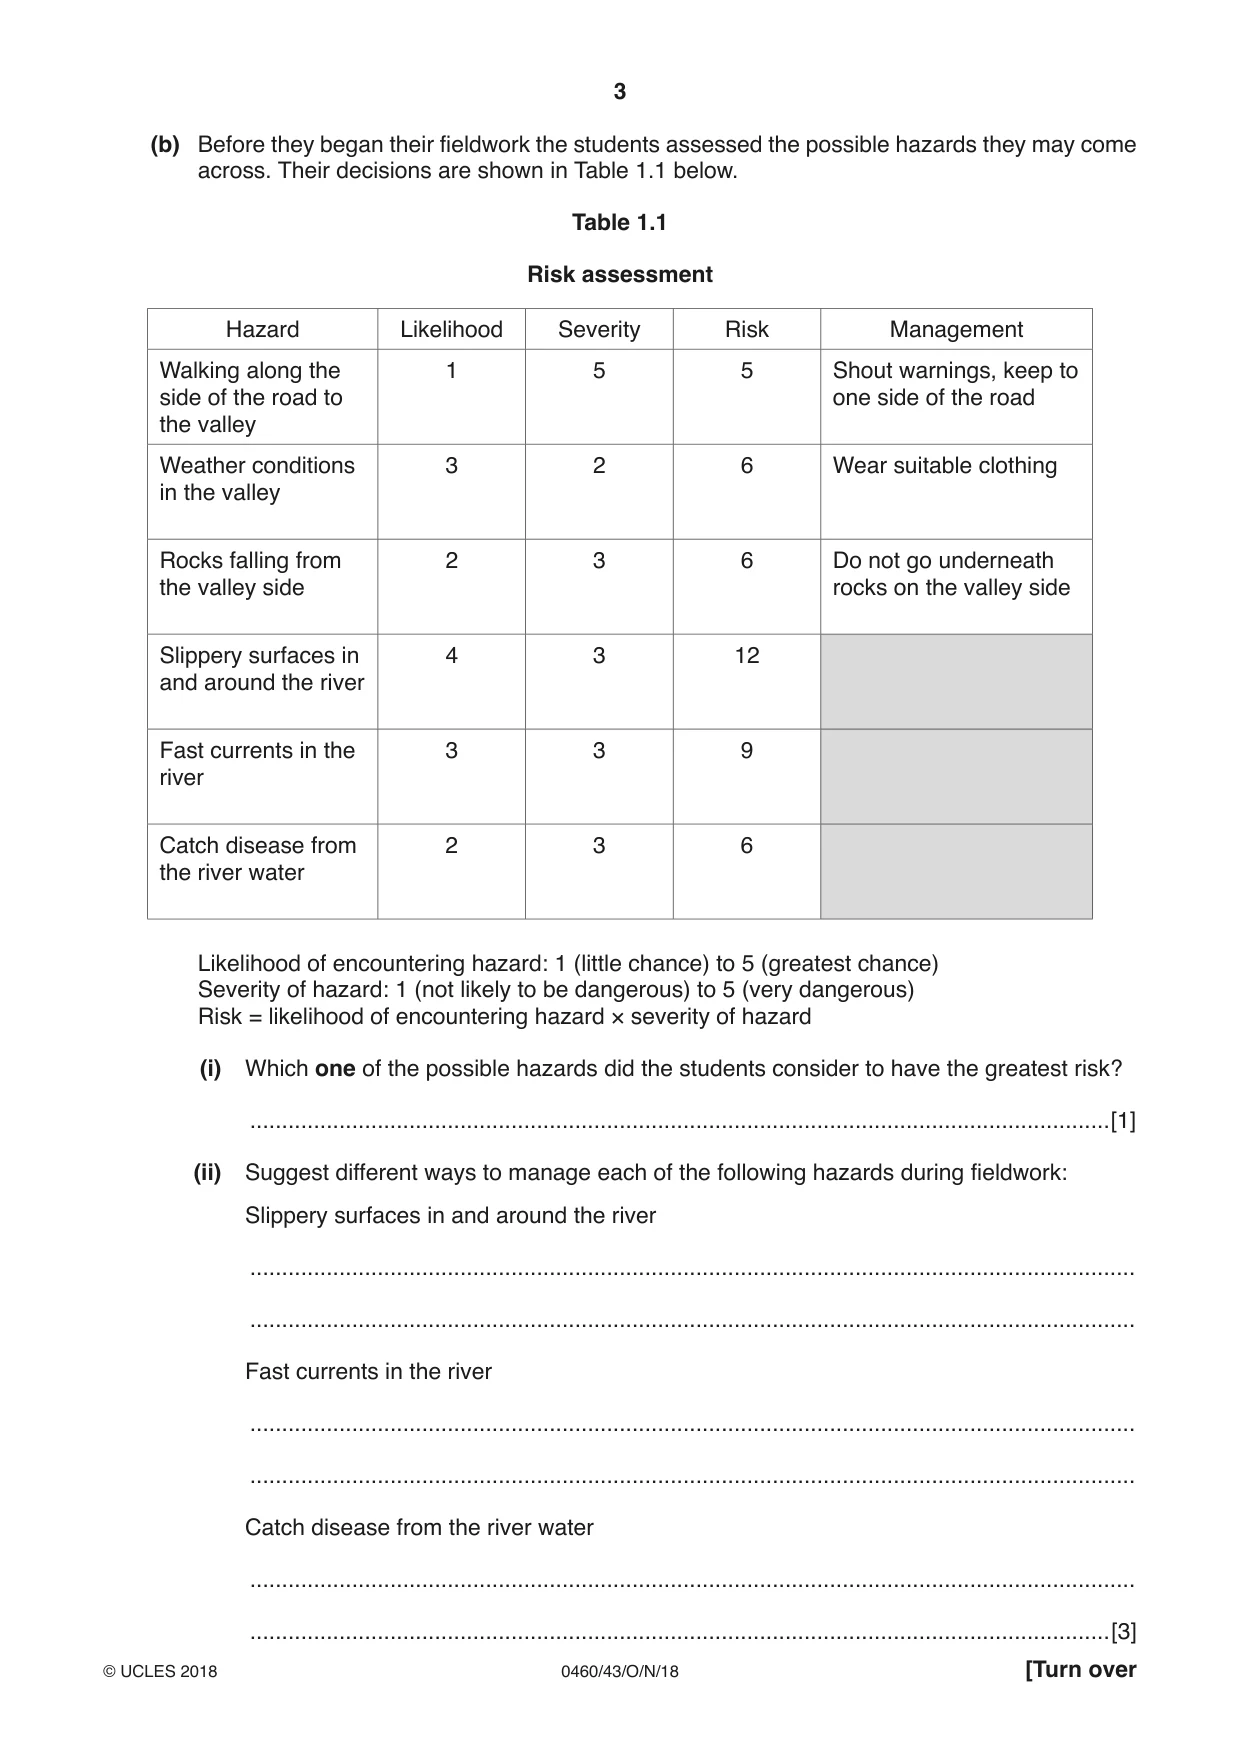
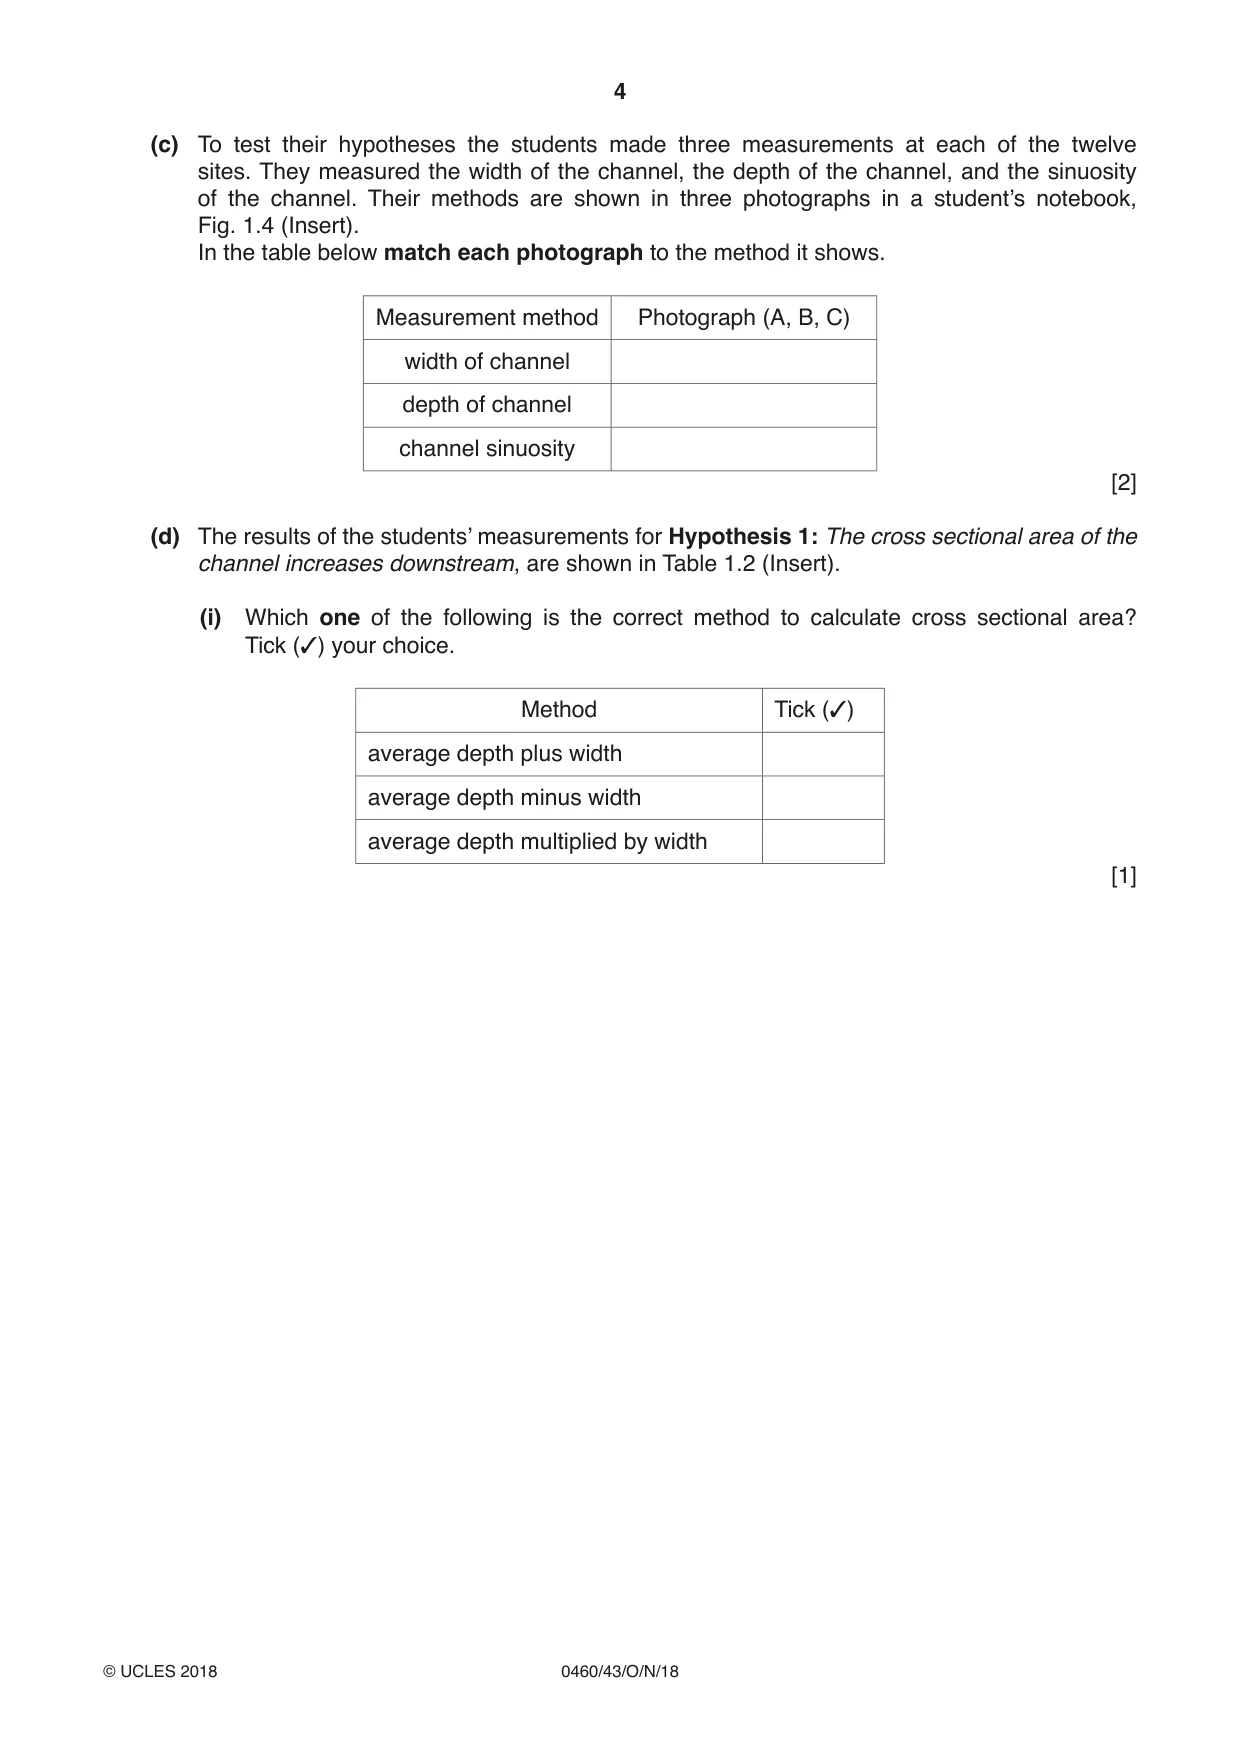
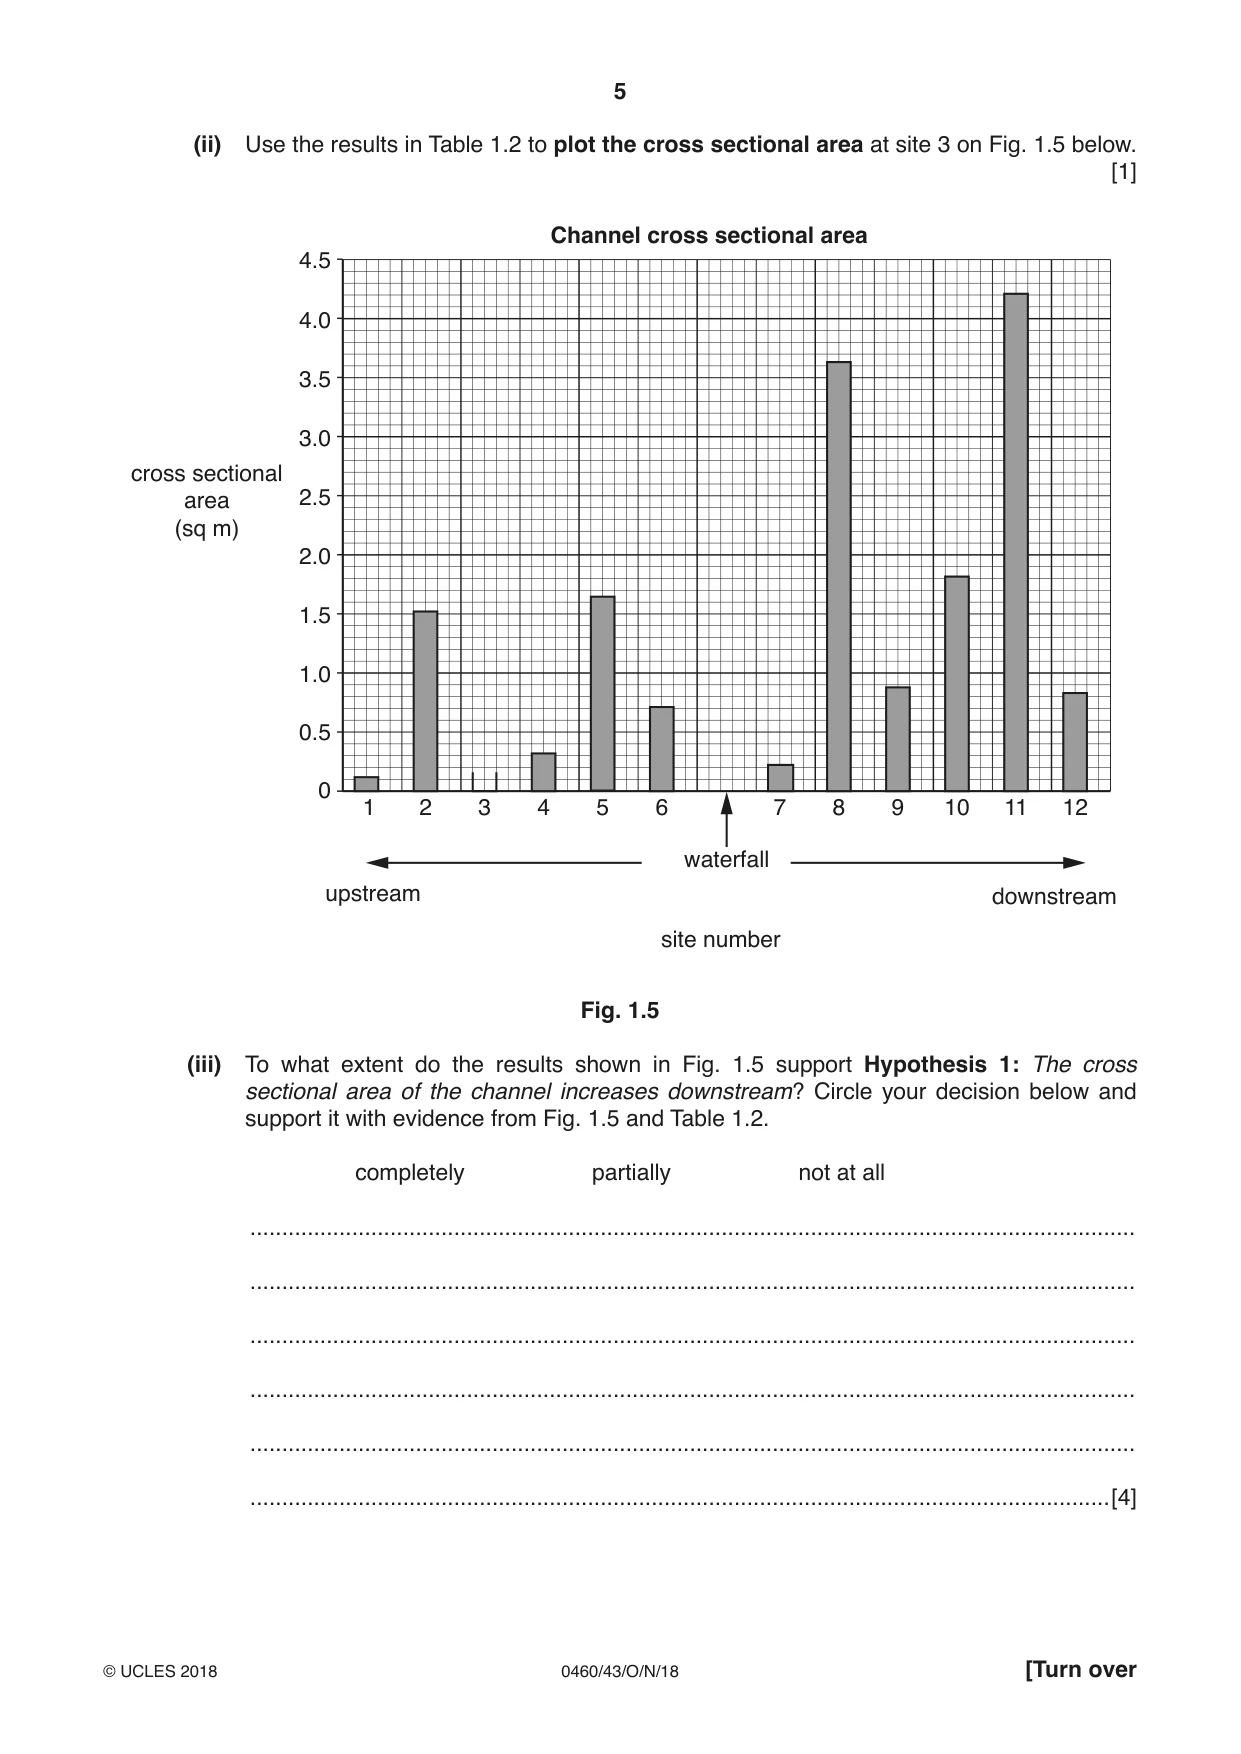
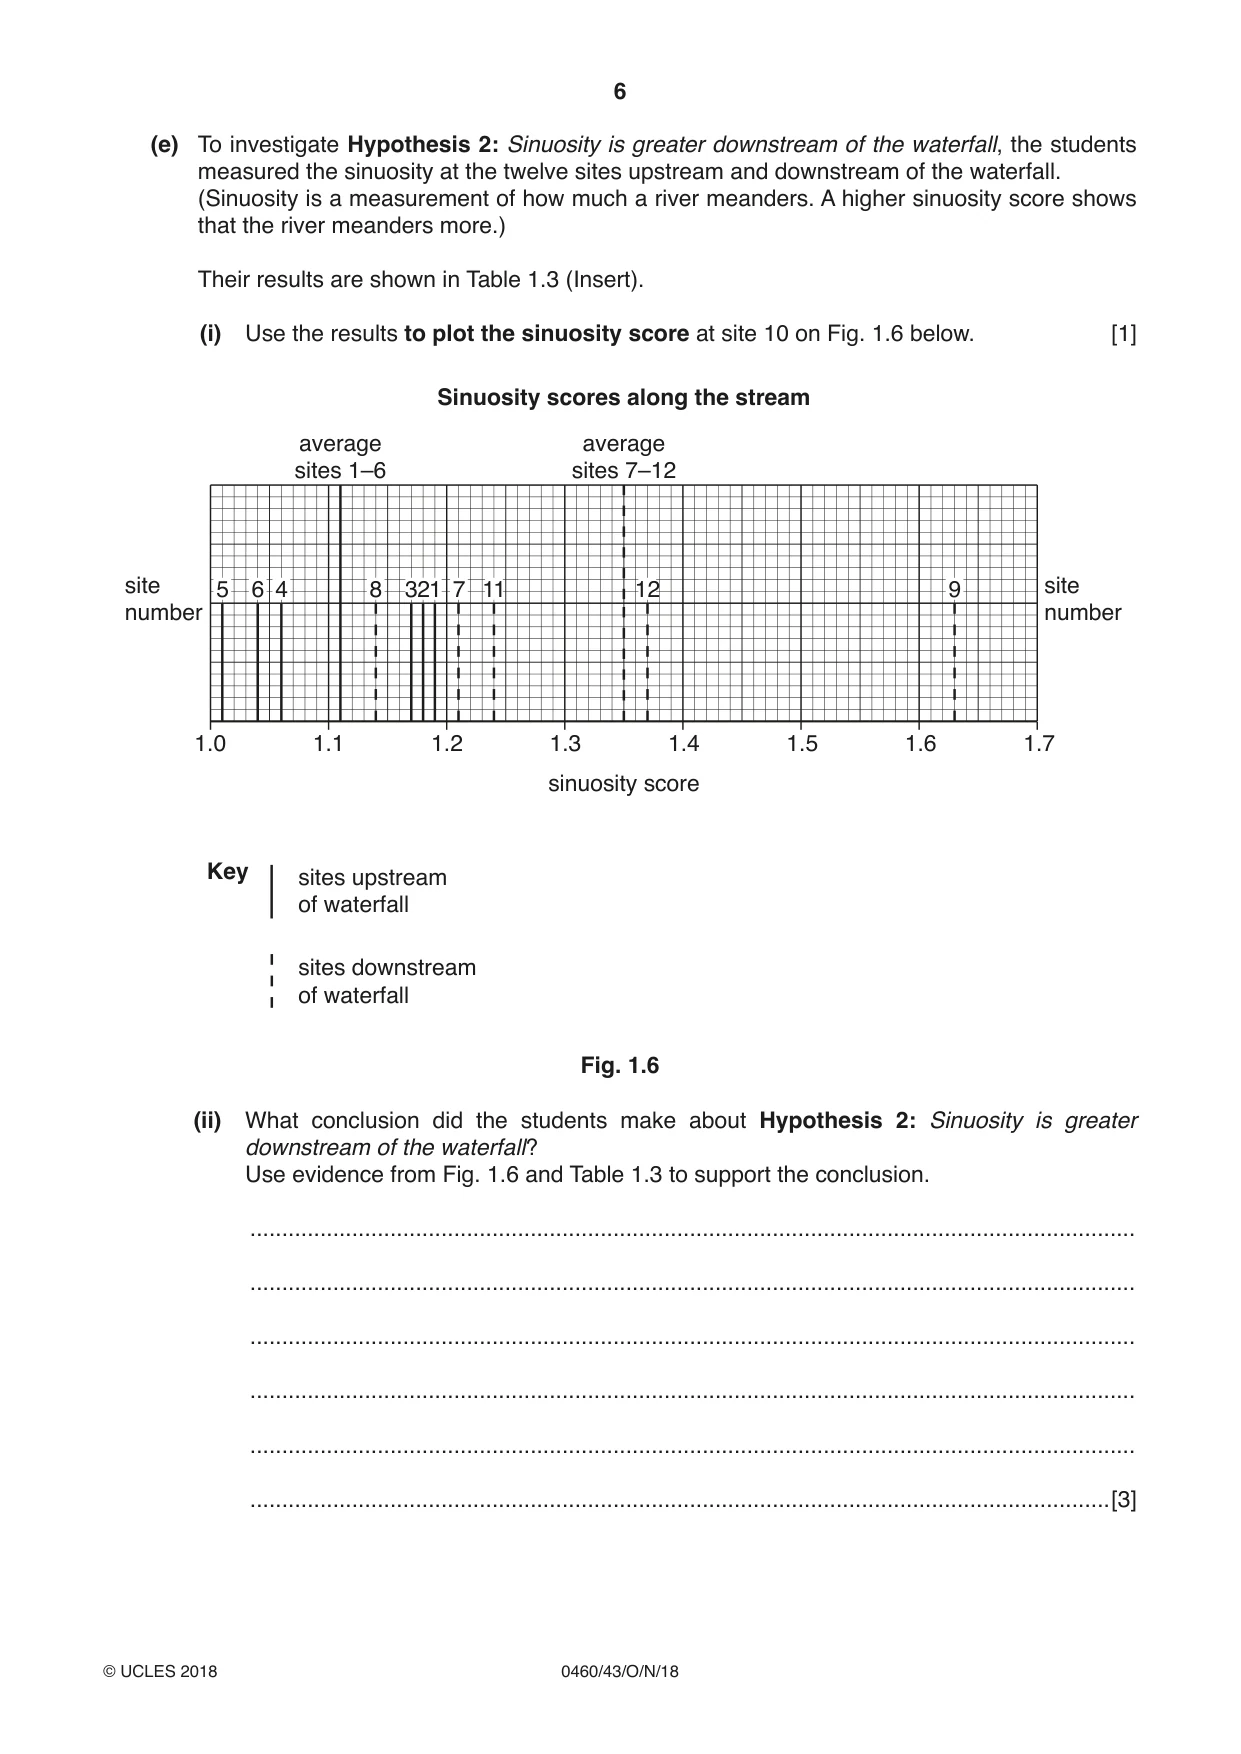
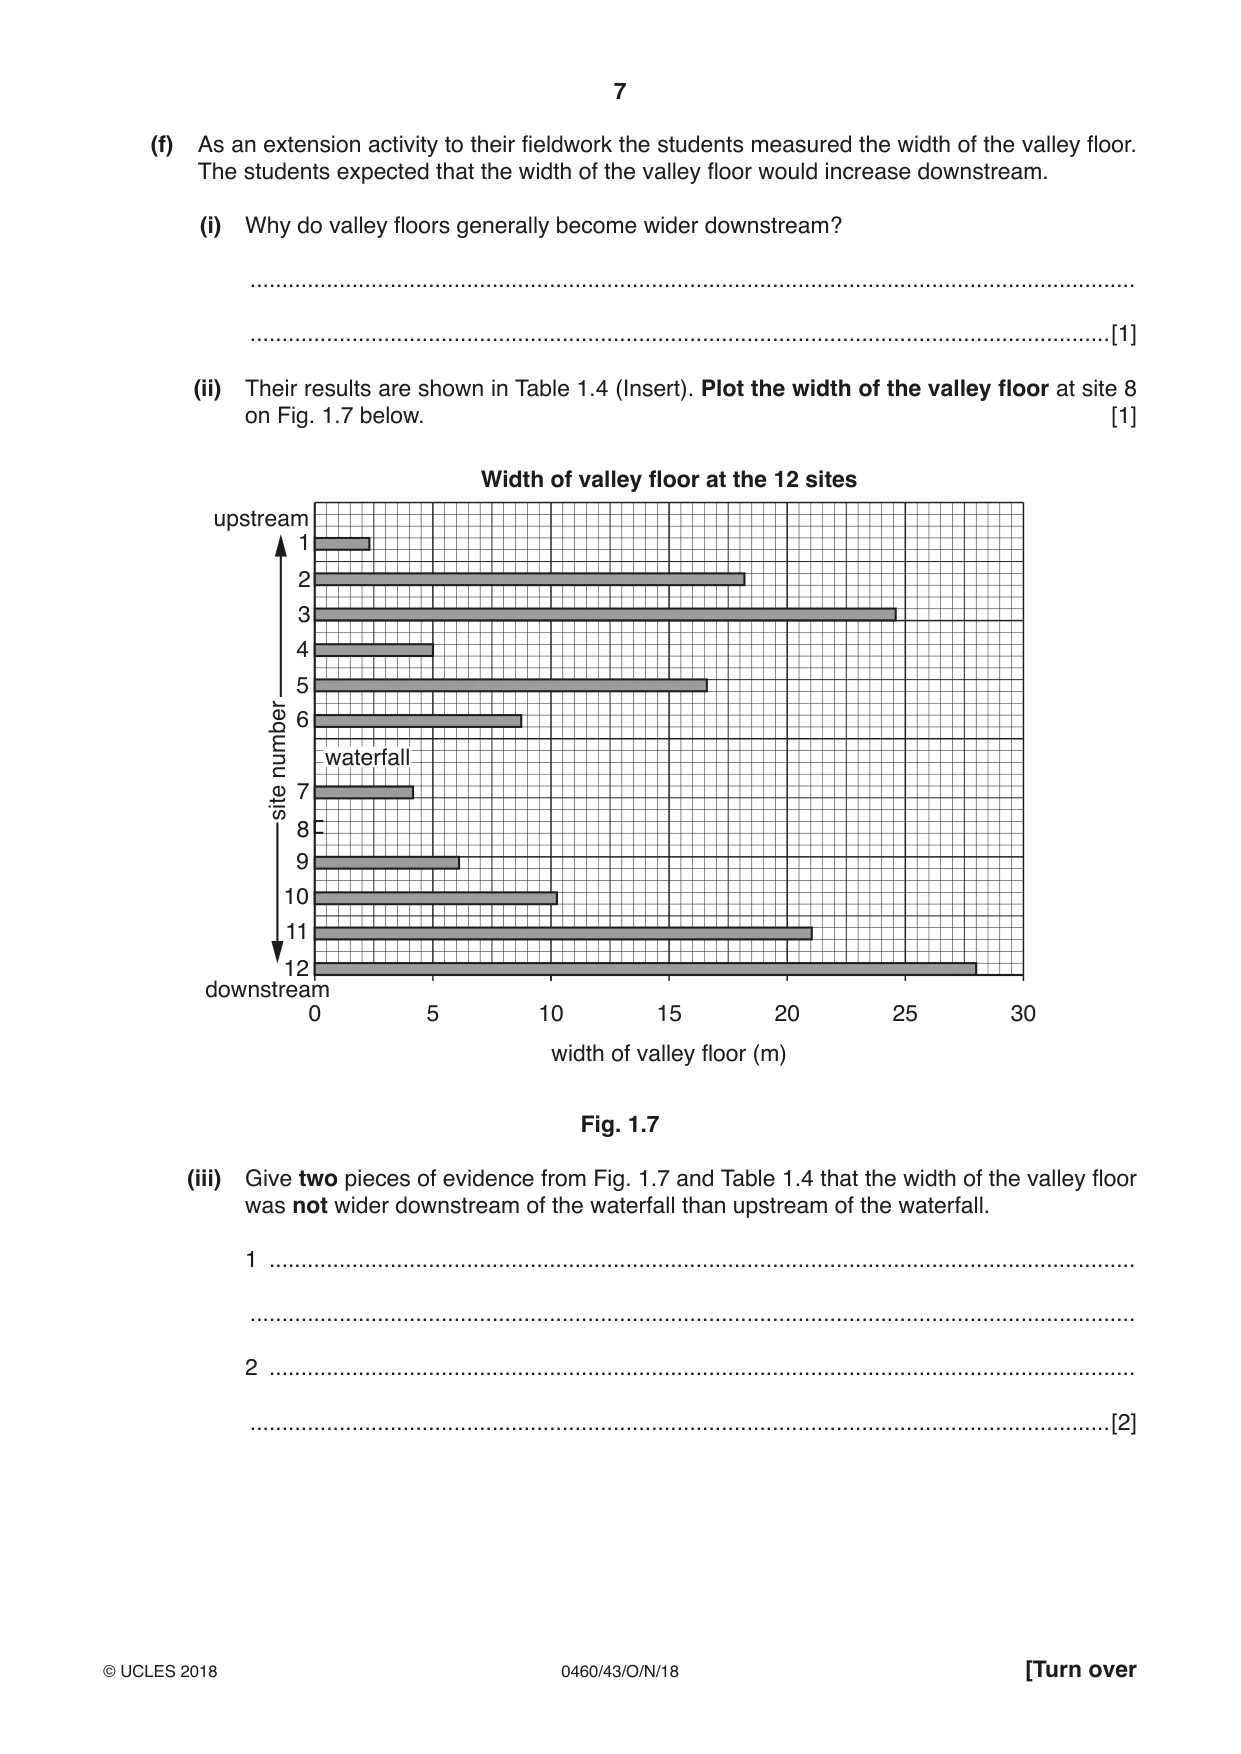
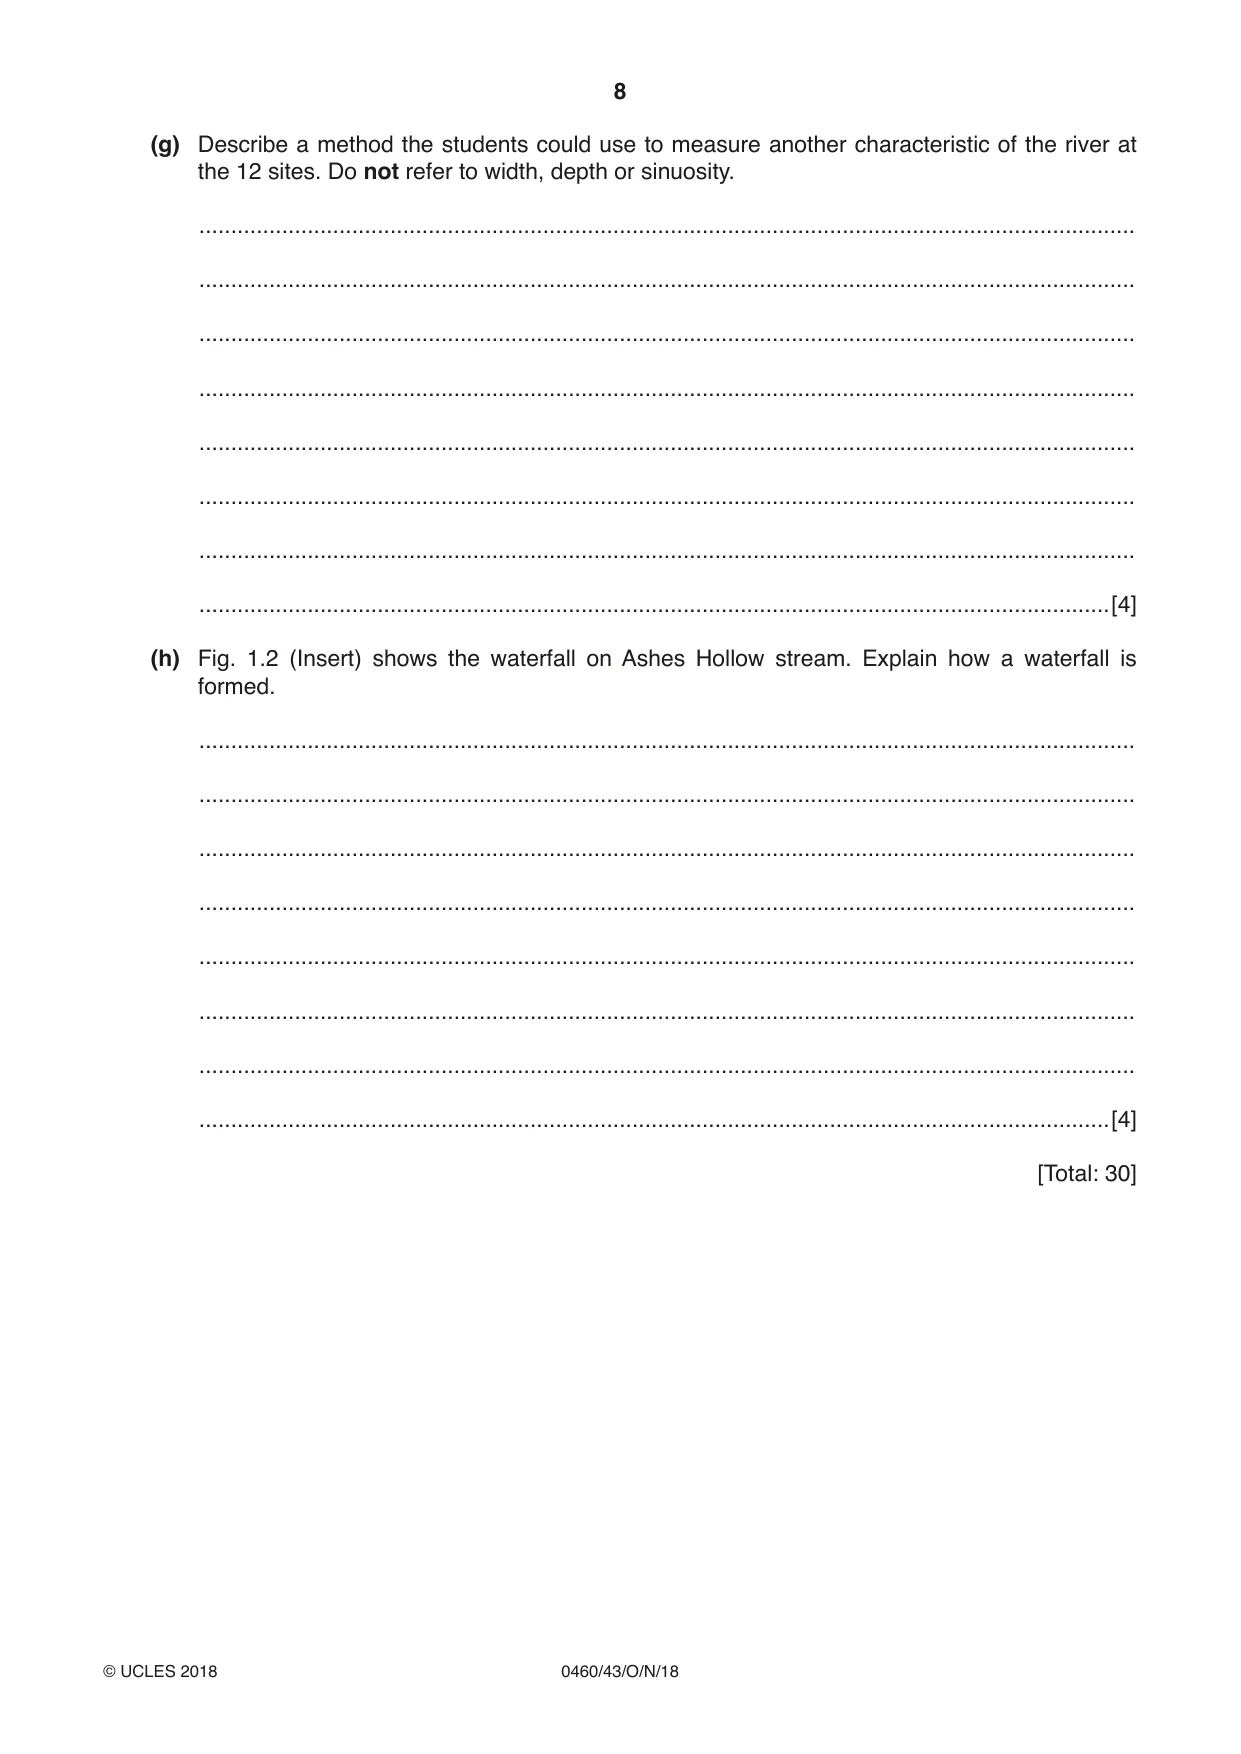
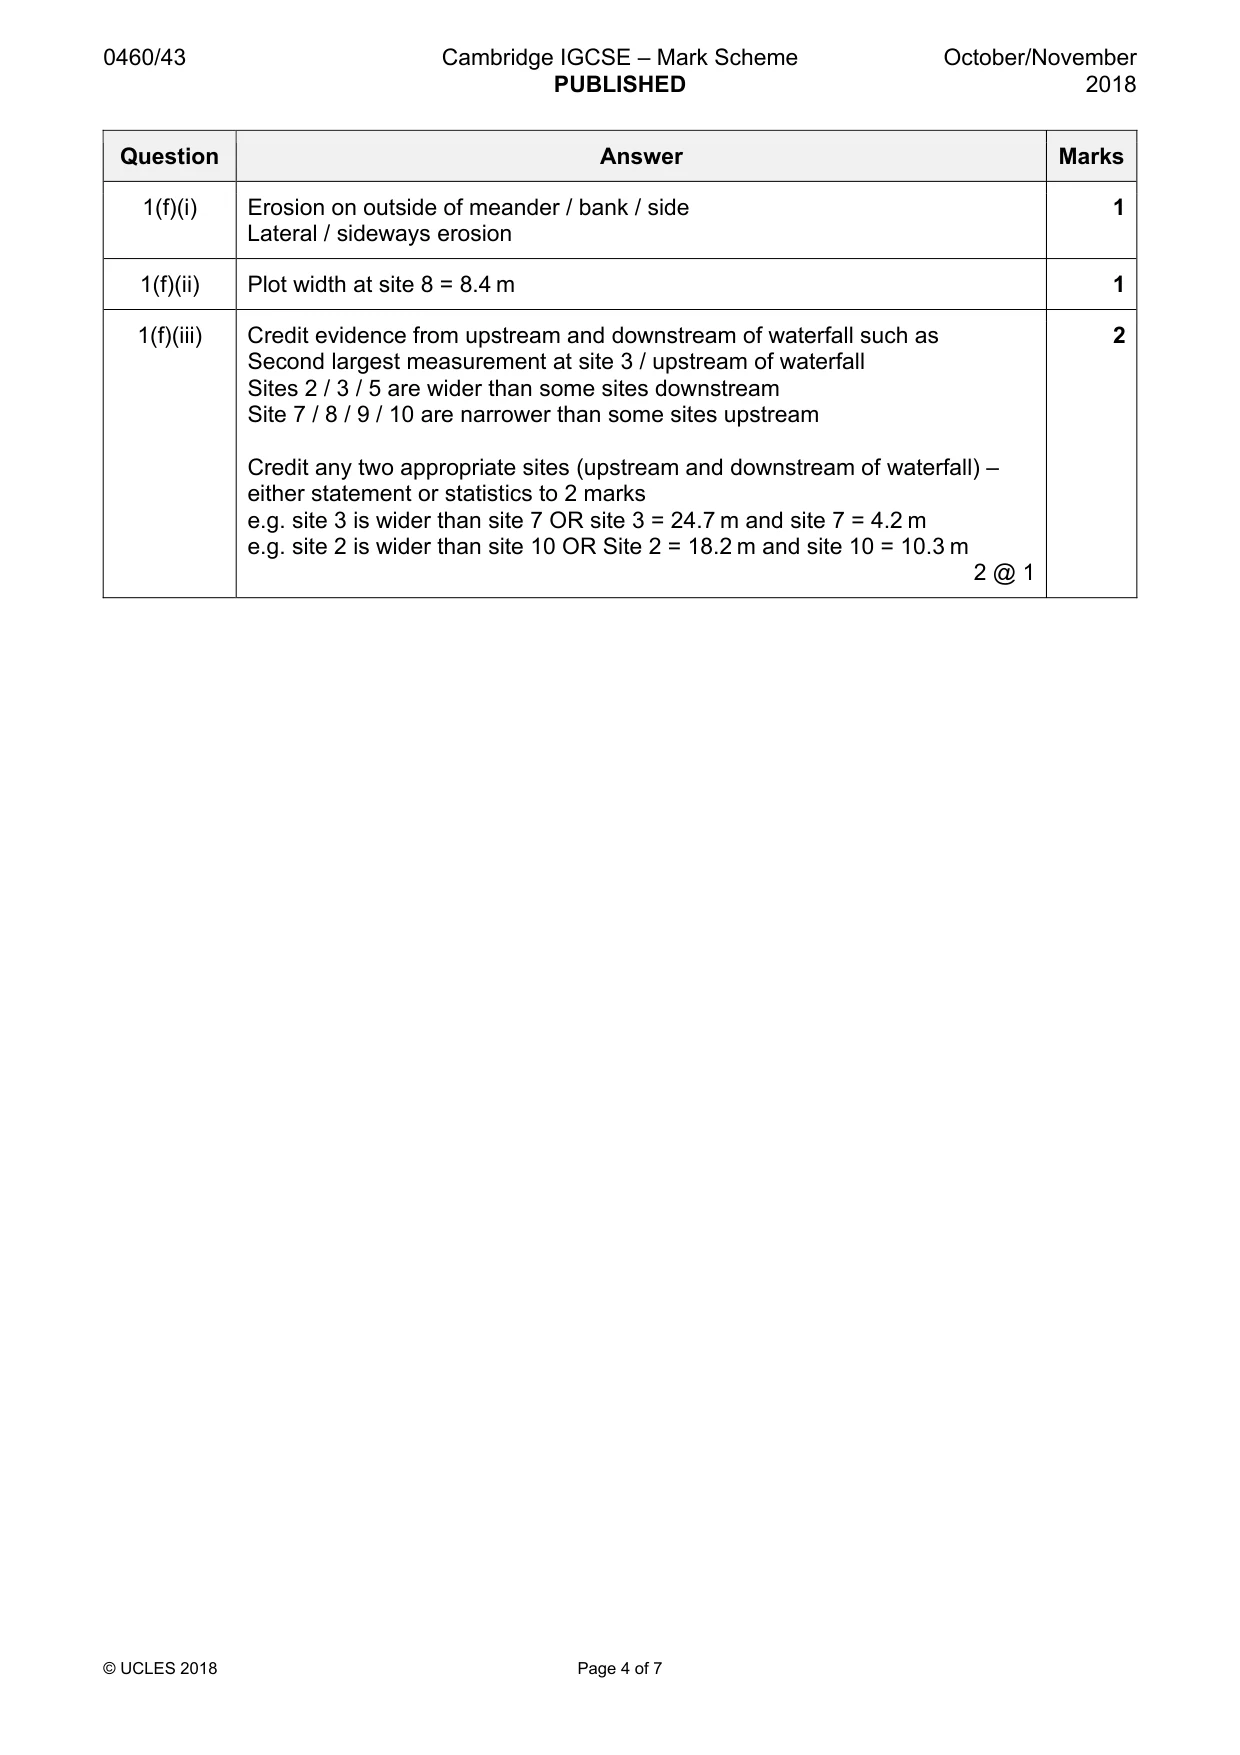
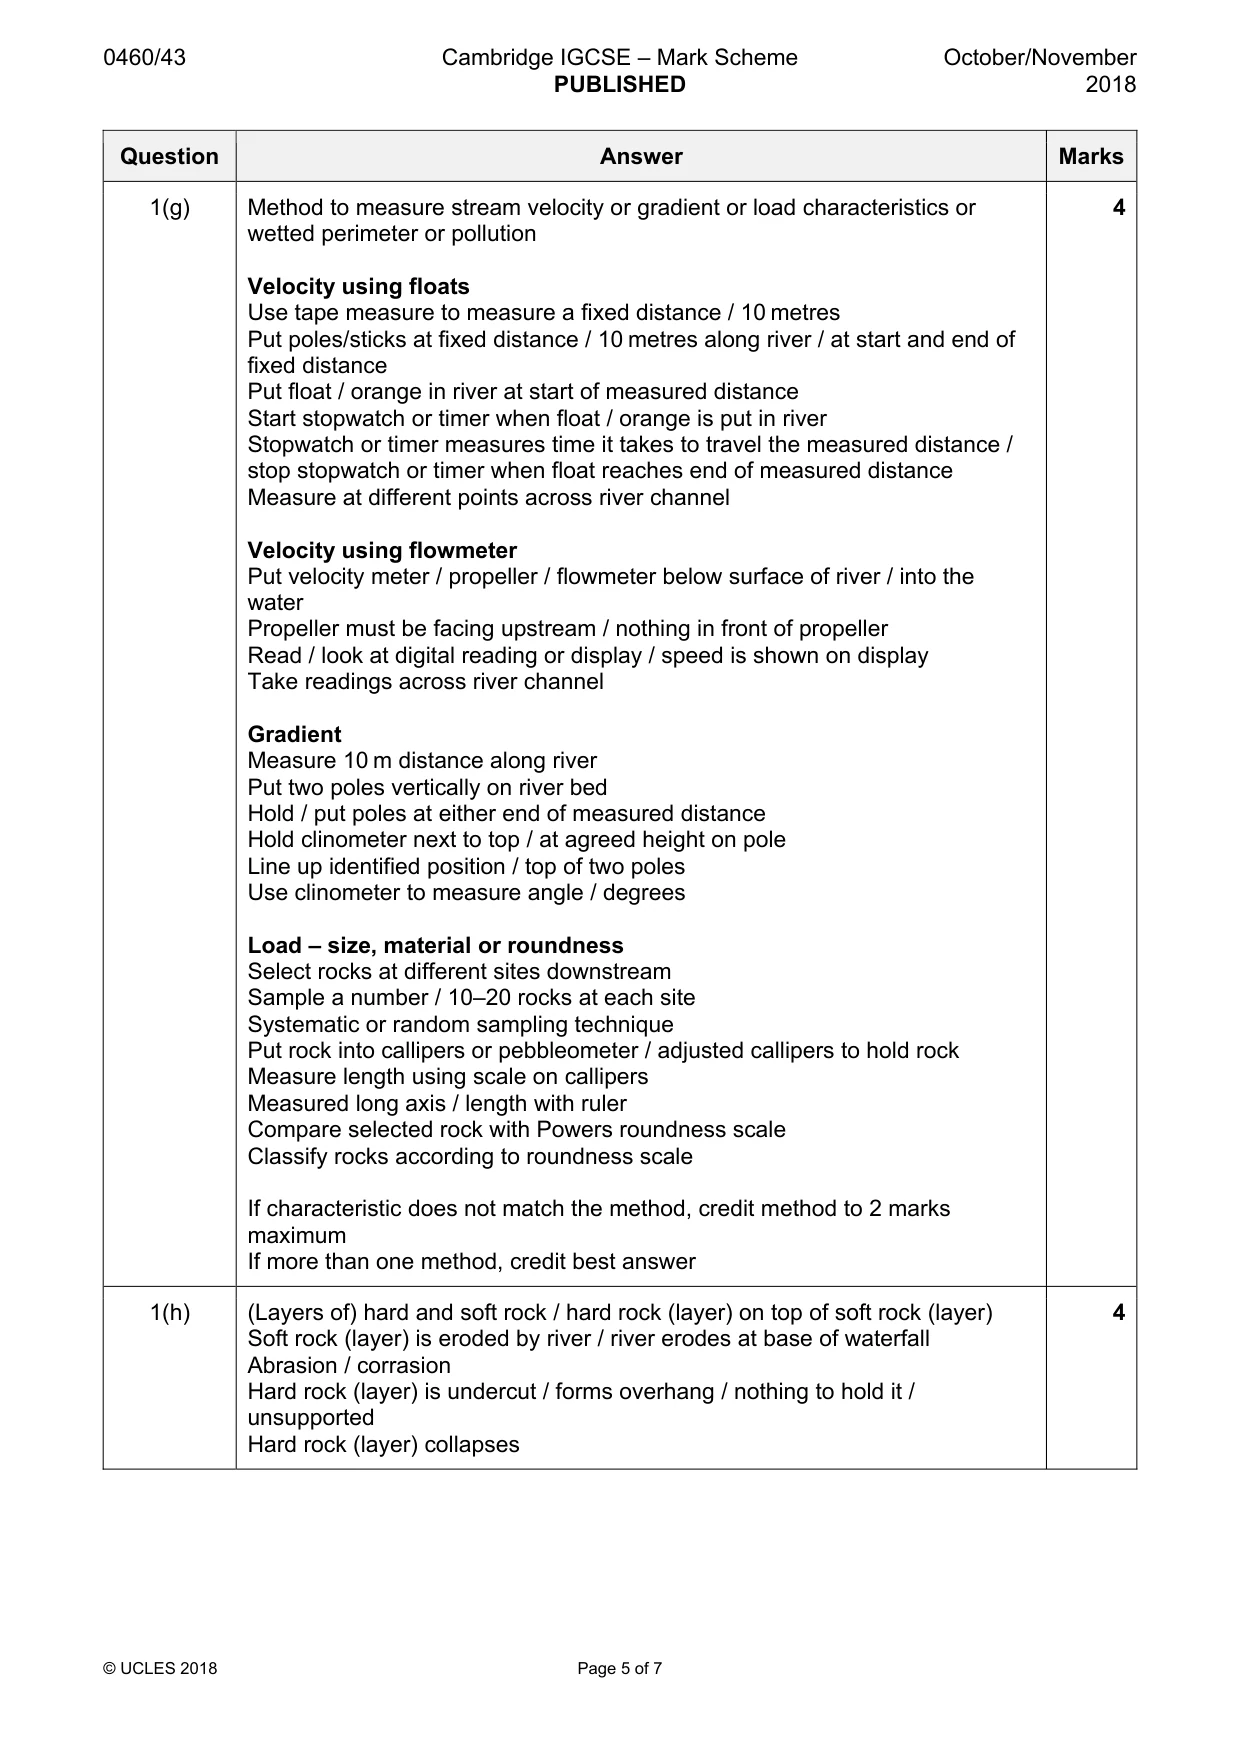
1 Students in England did fieldwork at twelve sites on a stream called Ashes Hollow. It flows for about 5 km from where the stream begins, until it joins the stream called Quinny Brook. They selected six sites upstream of a waterfall, and six sites downstream of it. Fig. 1.1 (Insert) shows Ashes Hollow and Fig. 1.2 (Insert) shows the waterfall. (a) Choose from the table below the correct geographical word for confluence meander mouth source watershed (i) ‘where the stream begins’ .................................... [1] (ii) ‘it joins the stream called Quinny Brook.’ .................................... [1] The two hypotheses which the students tested were: Hypothesis 1: The cross sectional area of the channel increases downstream. Hypothesis 2: Sinuosity is greater downstream of the waterfall. Sinuosity is a measurement of how much a river meanders. A higher sinuosity score shows that the river meanders more. Fig. 1.3 (Insert) shows a method to calculate sinuosity. (b) Before they began their fieldwork the students assessed the possible hazards they may come across. Their decisions are shown in Table 1.1 below. Table 1.1 Risk assessment Hazard Likelihood Severity Risk Management Walking along the 1 5 5 Shout warnings, keep to side of the road to one side of the road the valley Weather conditions 3 2 6 Wear suitable clothing in the valley Rocks falling from 2 3 6 Do not go underneath the valley side rocks on the valley side Slippery surfaces in 4 3 12 and around the river Fast currents in the 3 3 9 river Catch disease from 2 3 6 the river water Likelihood of encountering hazard: 1 (little chance) to 5 (greatest chance) Severity of hazard: 1 (not likely to be dangerous) to 5 (very dangerous) Risk = likelihood of encountering hazard × severity of hazard (i) Which one of the possible hazards did the students consider to have the greatest risk? .......................................................................................................................................[1] (ii) Suggest different ways to manage each of the following hazards during fieldwork: Slippery surfaces in and around the river ........................................................................................................................................... ........................................................................................................................................... Fast currents in the river ........................................................................................................................................... ........................................................................................................................................... Catch disease from the river water ........................................................................................................................................... .......................................................................................................................................[3] (c) To test their hypotheses the students made three measurements at each of the twelve sites. They measured the width of the channel, the depth of the channel, and the sinuosity of the channel. Their methods are shown in three photographs in a student’s notebook, Fig. 1.4 (Insert). In the table below match each photograph to the method it shows. Measurement method Photograph (A, B, C) width of channel depth of channel channel sinuosity [2] (d) The results of the students’ measurements for Hypothesis 1: The cross sectional area of the channel increases downstream, are shown in Table 1.2 (Insert). (i) Which one of the following is the correct method to calculate cross sectional area? Tick (✓) your choice. Method Tick (✓) average depth plus width average depth minus width average depth multiplied by width [1] (ii) Use the results in Table 1.2 to plot the cross sectional area at site 3 on Fig. 1.5 below. [1] Channel cross sectional area 4.5 4.0 3.5 3.0 cross sectional area 2.5 (sq m) 2.0 1.5 1.0 0.5 0 1 2 3 4 5 6 7 8 9 10 11 12 waterfall upstream downstream site number Fig. 1.5 (iii) To what extent do the results shown in Fig. 1.5 support Hypothesis 1: The cross sectional area of the channel increases downstream? Circle your decision below and support it with evidence from Fig. 1.5 and Table 1.2. completely partially not at all ........................................................................................................................................... ........................................................................................................................................... ........................................................................................................................................... ........................................................................................................................................... ........................................................................................................................................... .......................................................................................................................................[4] (e) To investigate Hypothesis 2: Sinuosity is greater downstream of the waterfall, the students measured the sinuosity at the twelve sites upstream and downstream of the waterfall. (Sinuosity is a measurement of how much a river meanders. A higher sinuosity score shows that the river meanders more.) Their results are shown in Table 1.3 (Insert). (i) Use the results to plot the sinuosity score at site 10 on Fig. 1.6 below. [1] Sinuosity scores along the stream average average sites 1–6 sites 7–12 site 5 6 4 8 321 7 11 12 9 site number number 1.0 1.1 1.2 1.3 1.4 1.5 1.6 1.7 sinuosity score Key sites upstream of waterfall sites downstream of waterfall Fig. 1.6 (ii) What conclusion did the students make about Hypothesis 2: Sinuosity is greater downstream of the waterfall? Use evidence from Fig. 1.6 and Table 1.3 to support the conclusion. ........................................................................................................................................... ........................................................................................................................................... ........................................................................................................................................... ........................................................................................................................................... ........................................................................................................................................... .......................................................................................................................................[3] (f) As an extension activity to their fieldwork the students measured the width of the valley floor. The students expected that the width of the valley floor would increase downstream. (i) Why do valley floors generally become wider downstream? ........................................................................................................................................... .......................................................................................................................................[1] (ii) Their results are shown in Table 1.4 (Insert). Plot the width of the valley floor at site 8 on Fig. 1.7 below. [1] Width of valley floor at the 12 sites upstream 1 2 3 4 5 number 6 waterfall 7 site 8 9 10 11 12 downstream 0 5 10 15 20 25 30 width of valley floor (m) Fig. 1.7 (iii) Give two pieces of evidence from Fig. 1.7 and Table 1.4 that the width of the valley floor was not wider downstream of the waterfall than upstream of the waterfall. 1 ........................................................................................................................................ ........................................................................................................................................... 2 ........................................................................................................................................ .......................................................................................................................................[2] (g) Describe a method the students could use to measure another characteristic of the river at the 12 sites. Do not refer to width, depth or sinuosity. ................................................................................................................................................... ................................................................................................................................................... ................................................................................................................................................... ................................................................................................................................................... ................................................................................................................................................... ................................................................................................................................................... ................................................................................................................................................... ...............................................................................................................................................[4] (h) Fig. 1.2 (Insert) shows the waterfall on Ashes Hollow stream. Explain how a waterfall is formed. ................................................................................................................................................... ................................................................................................................................................... ................................................................................................................................................... ................................................................................................................................................... ................................................................................................................................................... ................................................................................................................................................... ................................................................................................................................................... ...............................................................................................................................................[4] [Total: 30]
Mark scheme: Question Answer Marks 1(a)(i) Source 1 1(a)(ii) Confluence 1 1(b)(i) Slippery surfaces in and around the river 1 1(b)(ii) Slippery surfaces: wear suitable shoes / boots / work with a partner / don’t 3 work alone / use a stick for support Fast currents: avoid the area of fast water or deep water / work with partner / don’t work alone / use a rope Waterborne disease: do not drink water / wash hands after being in river / wear gloves / drink bottled water 3 @ 1 1(c) Photo C, A, B 2 3 correct = 2 marks, 1 or 2 correct = 1 mark 1(d)(i) Average depth multiplied by width 1 1(d)(ii) Plotting bar for site 3 = 0.51 sq m 1 1(d)(iii) Partially – 1 mark reserve 4 Sites below waterfall / 7–12 / downstream generally or overall or majority or most or some have a bigger cross section area There are exceptions / anomalies at sites 2 / 5 / 7 / 9 / 12 (any e.g.) e.g. site 7 is smaller cross section and there are larger ones upstream e.g. site 12 is smaller cross section than site 11 Credit 2 marks maximum for data – any 2 sites and cross-section areas (1 mark for supporting hypothesis and 1 mark for exception) Sites must relate to a context above e.g. Site 1 = 0.12 sq m and site 12 = 0.84 sq m (support) e.g. Site 5 = 1.65 sq m and site 7 = 0.23 sq m (exception) e.g. average 1–6 (above) = 0.8 / 0.81 sq m and average 7–12 (below) = 1.94 sq m If no hypothesis conclusion credit evidence 1(e)(i) Plotting score for site 10 = 1.53 1 1(e)(ii) Hypothesis is true – 1 mark reserve 3 (Average) score is higher / increases downstream (of waterfall) Credit 1 mark for paired data – average or sites above and below waterfall or range – which support hypothesis e.g. Sites 1–6 average = 1.11 and sites 7–12 average = 1.35 Site 1 = 1.19 and site 12 = 1.37 Range of sites 1–6 = 1.01 to 1.19 and range of sites 7–12 = 1.14 to 1.63 If no hypothesis conclusion credit evidence 1(f)(i) Erosion on outside of meander / bank / side 1 Lateral / sideways erosion 1(f)(ii) Plot width at site 8 = 8.4 m 1 1(f)(iii) Credit evidence from upstream and downstream of waterfall such as 2 Second largest measurement at site 3 / upstream of waterfall Sites 2 / 3 / 5 are wider than some sites downstream Site 7 / 8 / 9 / 10 are narrower than some sites upstream Credit any two appropriate sites (upstream and downstream of waterfall) – either statement or statistics to 2 marks e.g. site 3 is wider than site 7 OR site 3 = 24.7 m and site 7 = 4.2 m e.g. site 2 is wider than site 10 OR Site 2 = 18.2 m and site 10 = 10.3 m 2 @ 1 1(g) Method to measure stream velocity or gradient or load characteristics or 4 wetted perimeter or pollution Velocity using floats Use tape measure to measure a fixed distance / 10 metres Put poles/sticks at fixed distance / 10 metres along river / at start and end of fixed distance Put float / orange in river at start of measured distance Start stopwatch or timer when float / orange is put in river Stopwatch or timer measures time it takes to travel the measured distance / stop stopwatch or timer when float reaches end of measured distance Measure at different points across river channel Velocity using flowmeter Put velocity meter / propeller / flowmeter below surface of river / into the water Propeller must be facing upstream / nothing in front of propeller Read / look at digital reading or display / speed is shown on display Take readings across river channel Gradient Measure 10 m distance along river Put two poles vertically on river bed Hold / put poles at either end of measured distance Hold clinometer next to top / at agreed height on pole Line up identified position / top of two poles Use clinometer to measure angle / degrees Load – size, material or roundness Select rocks at different sites downstream Sample a number / 10–20 rocks at each site Systematic or random sampling technique Put rock into callipers or pebbleometer / adjusted callipers to hold rock Measure length using scale on callipers Measured long axis / length with ruler Compare selected rock with Powers roundness scale Classify rocks according to roundness scale If characteristic does not match the method, credit method to 2 marks maximum If more than one method, credit best answer 1(h) (Layers of) hard and soft rock / hard rock (layer) on top of soft rock (layer) 4 Soft rock (layer) is eroded by river / river erodes at base of waterfall Abrasion / corrasion Hard rock (layer) is undercut / forms overhang / nothing to hold it / unsupported Hard rock (layer) collapses
Q2 · A class of students in the UK wanted to investigate how the quality of the urban…
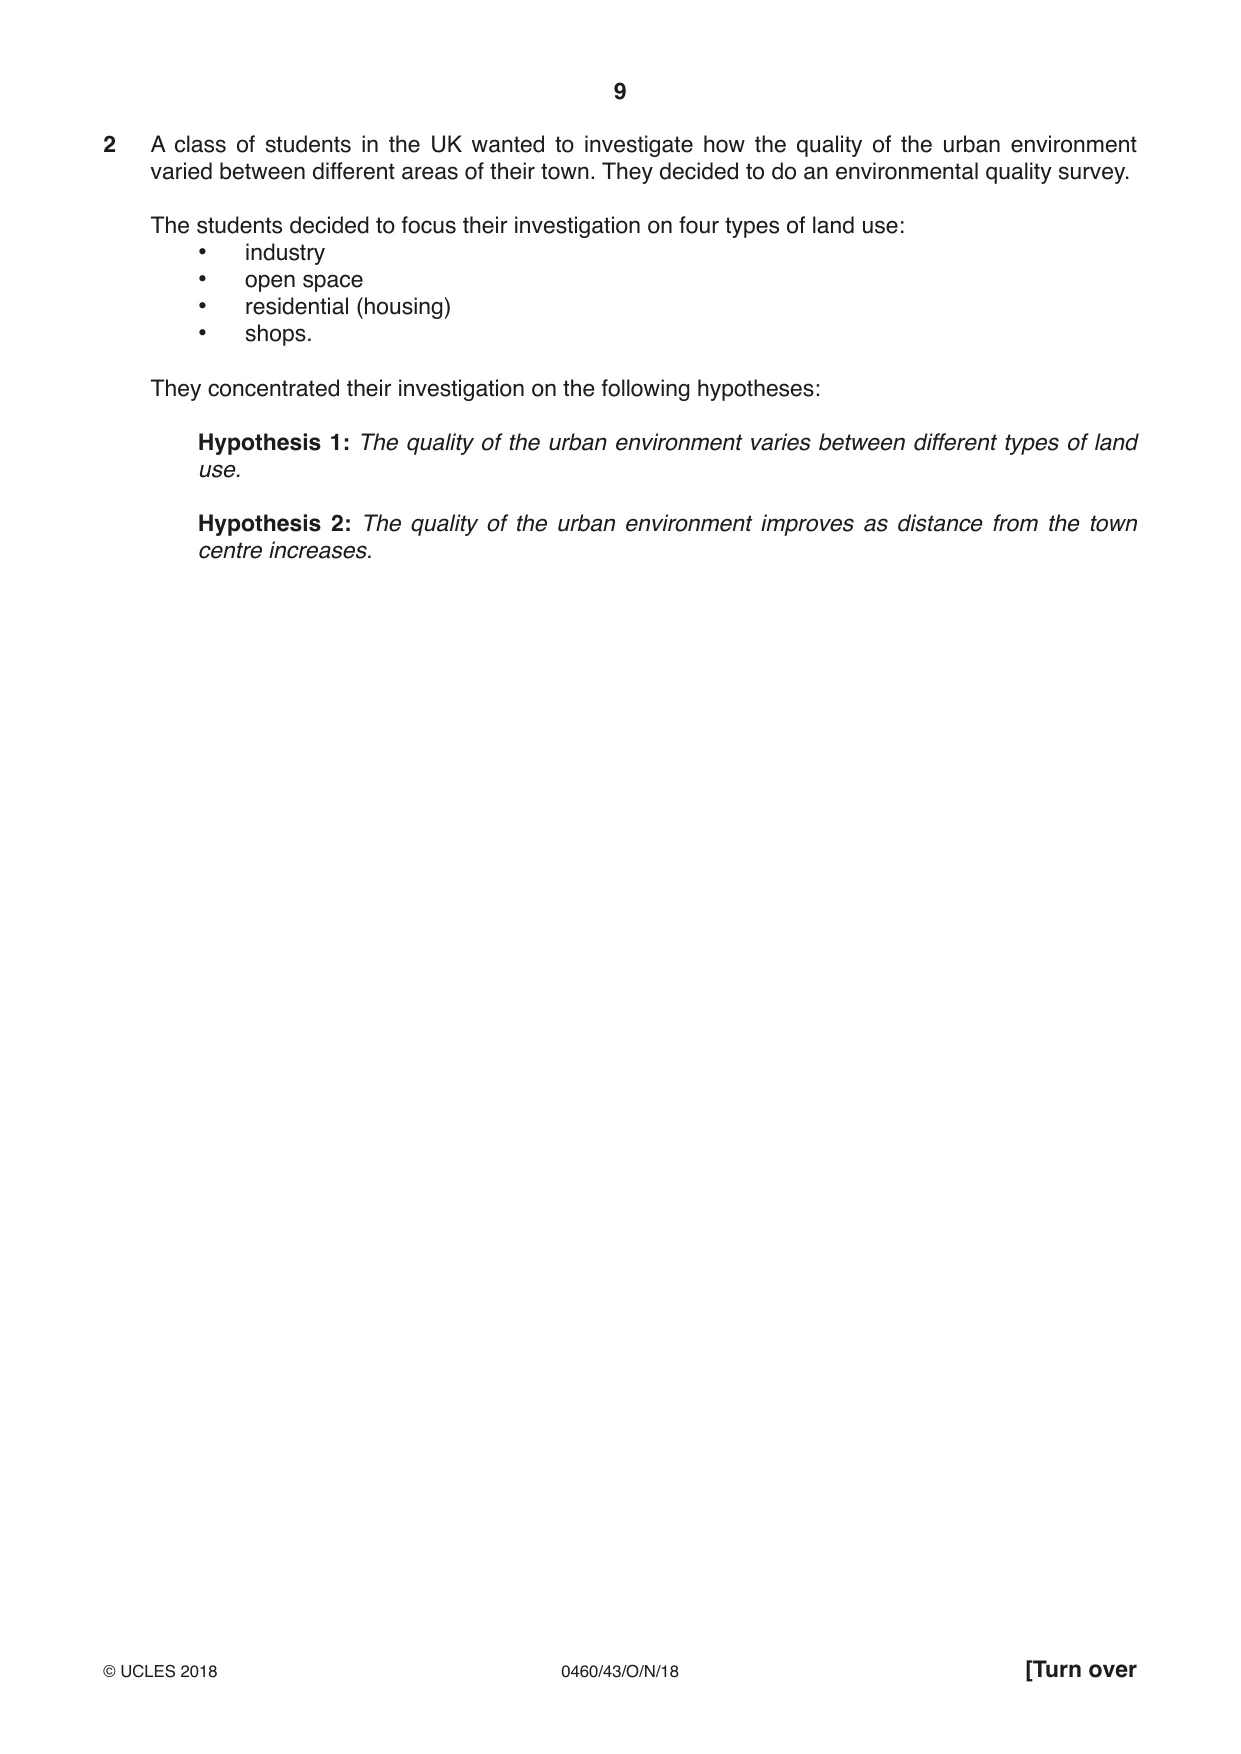
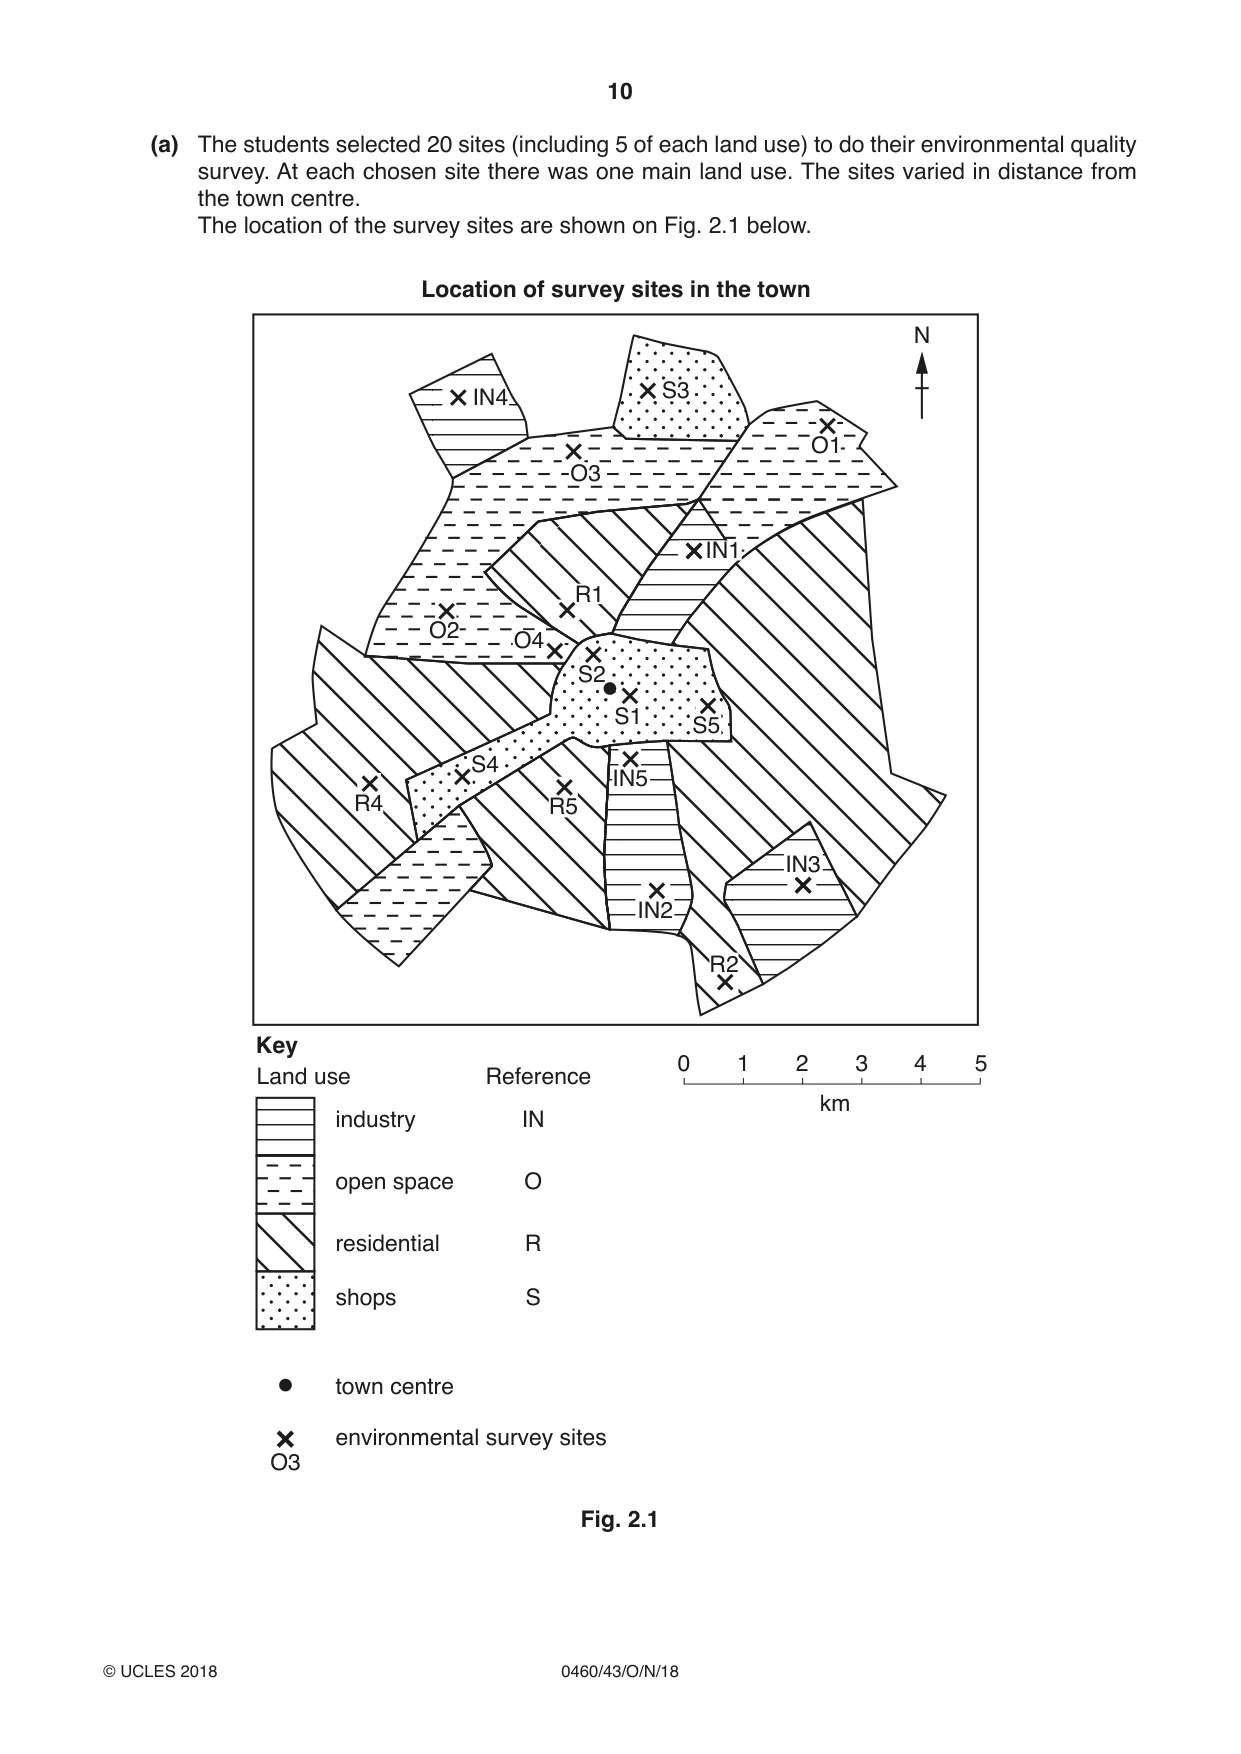
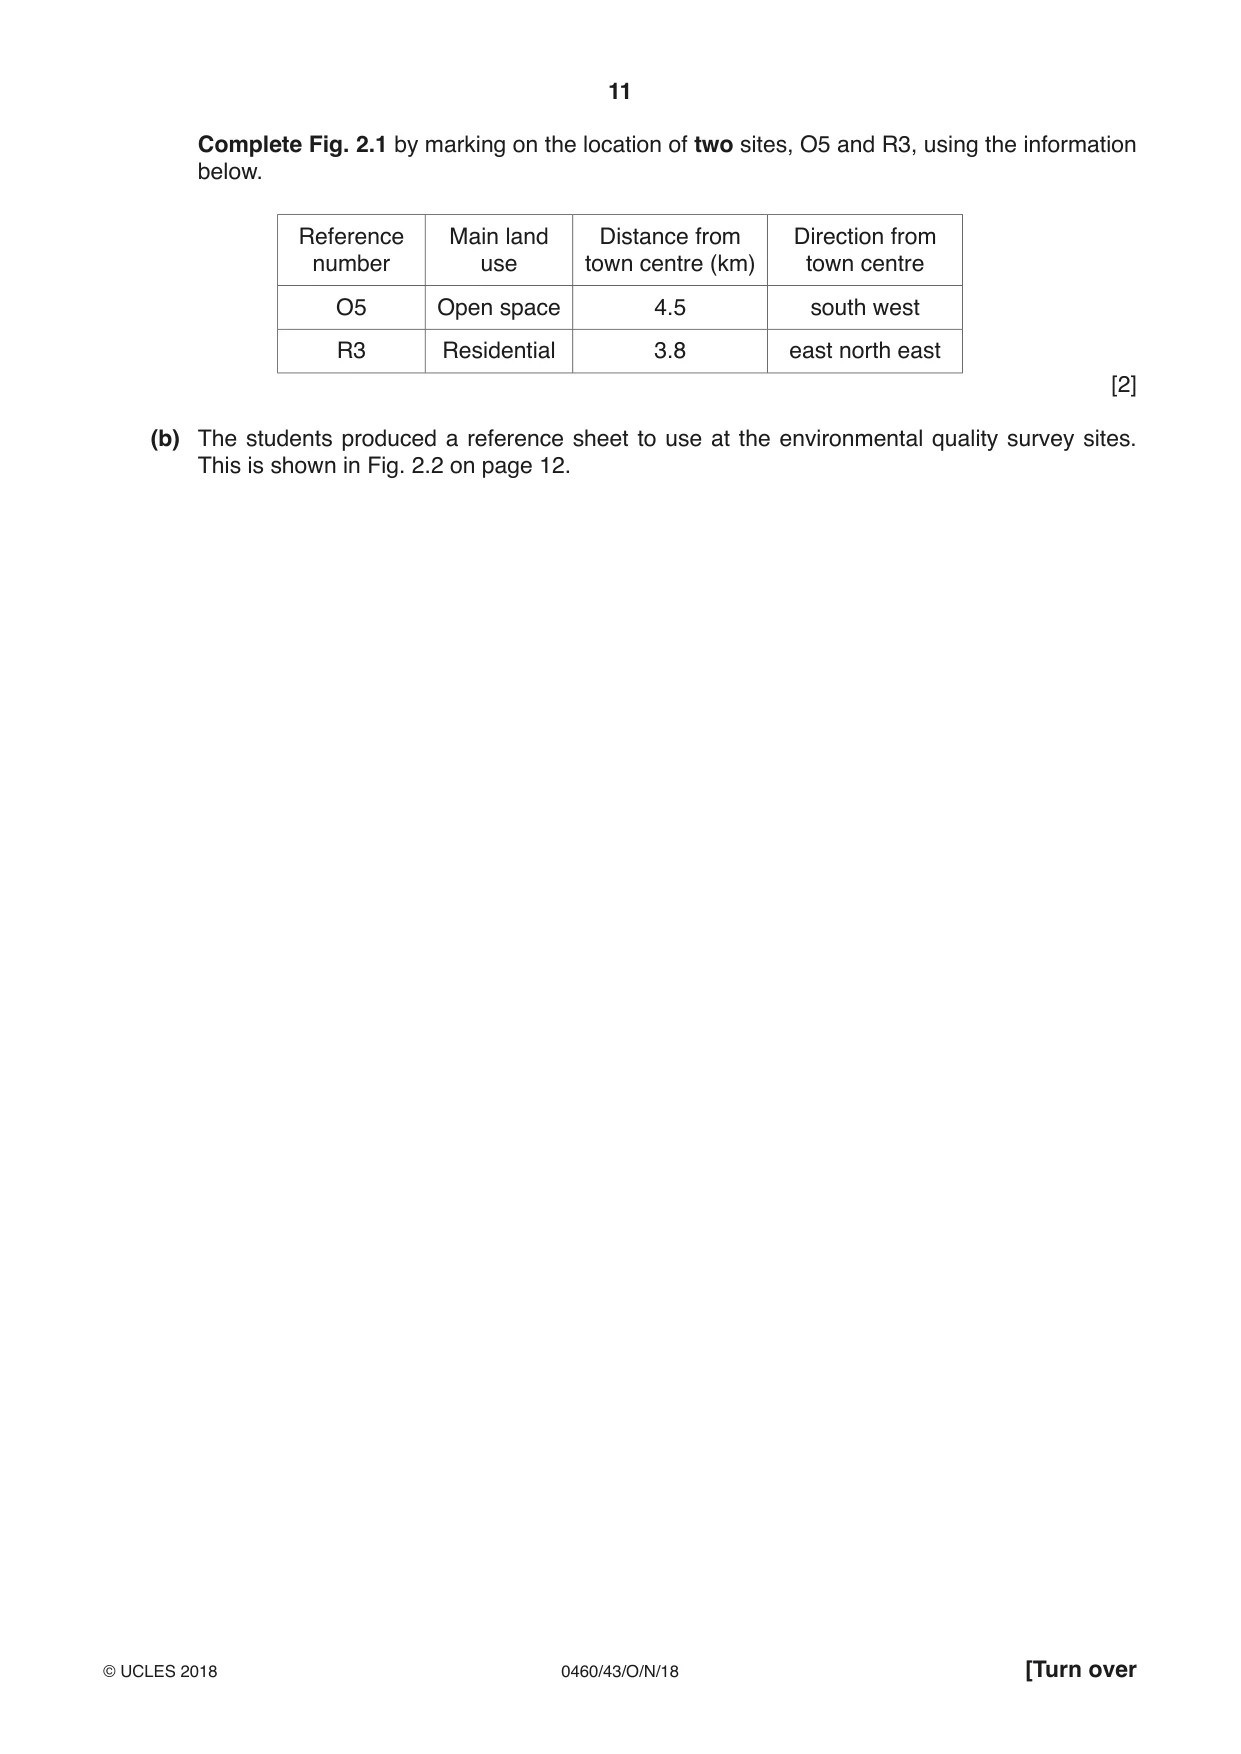
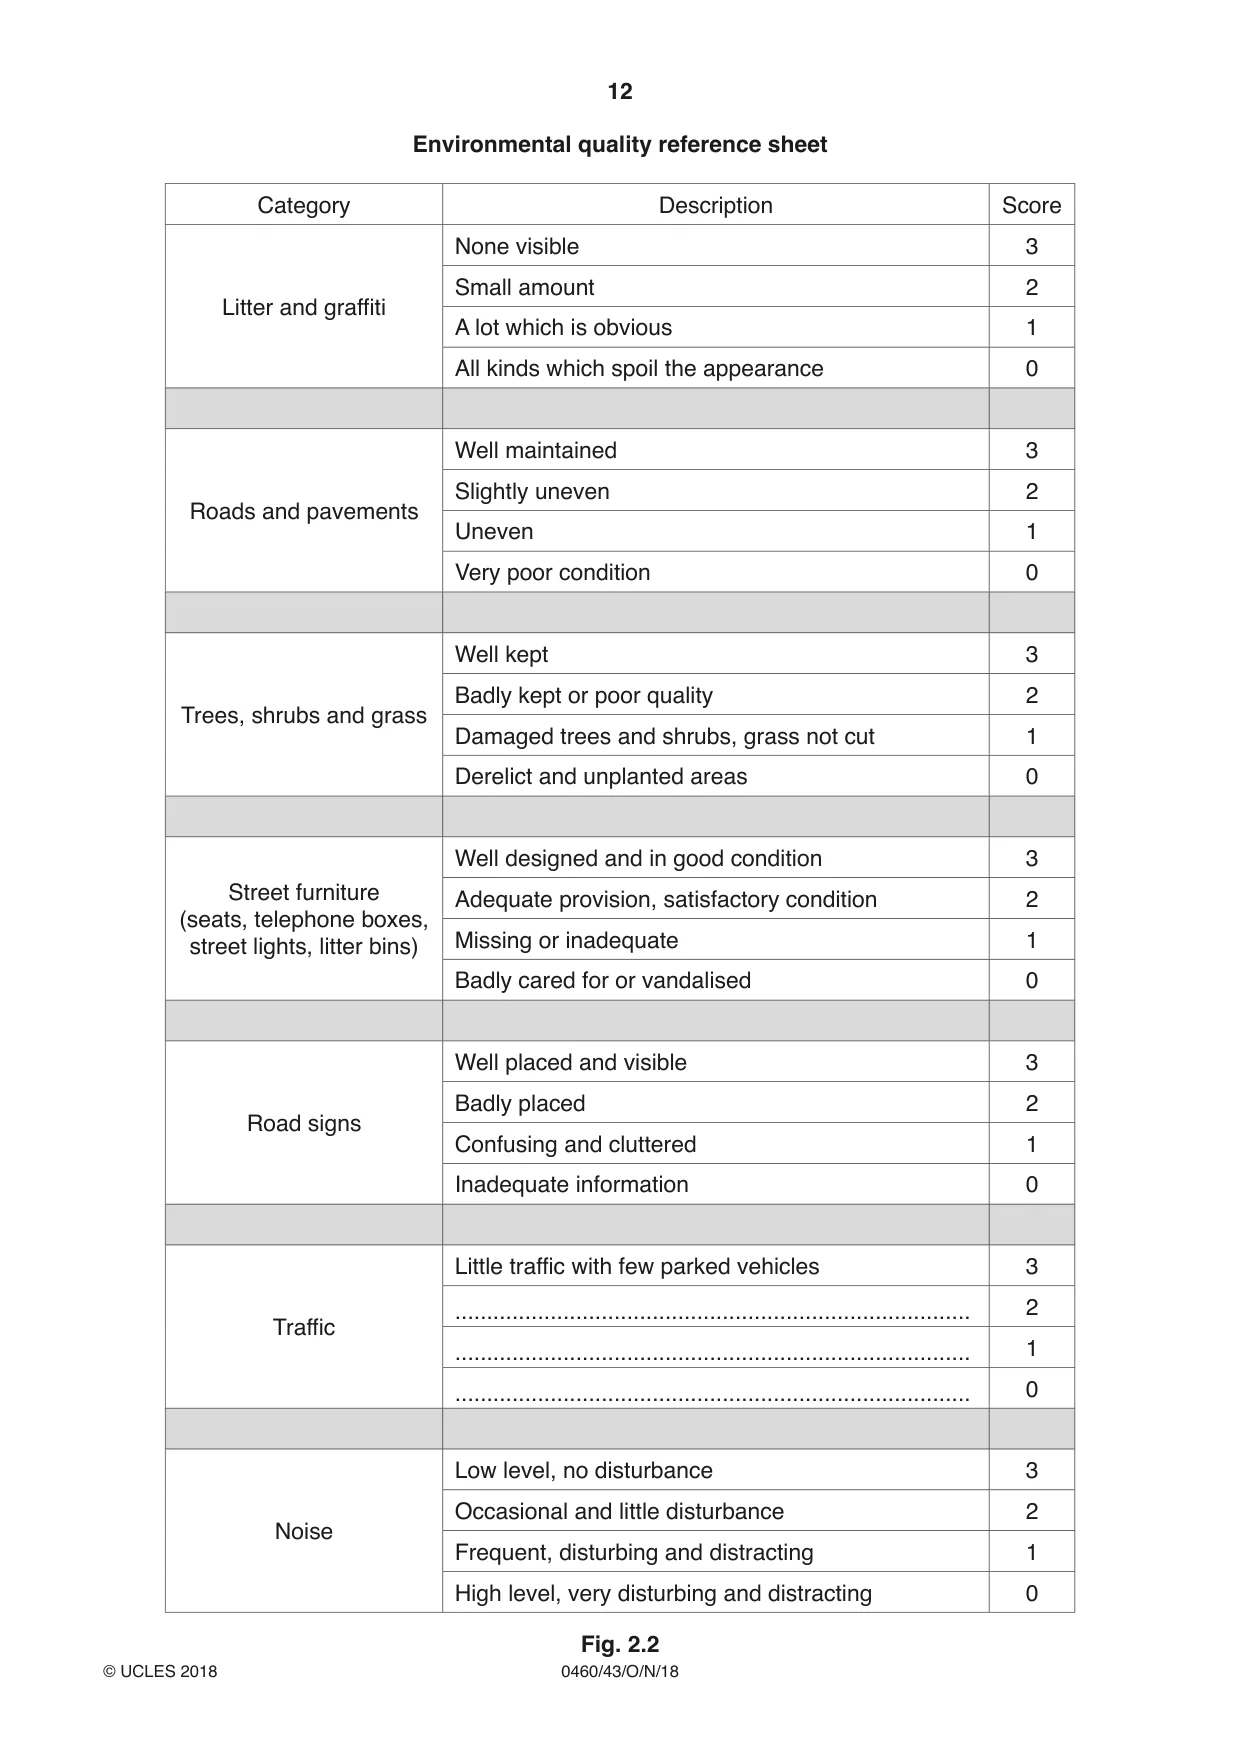
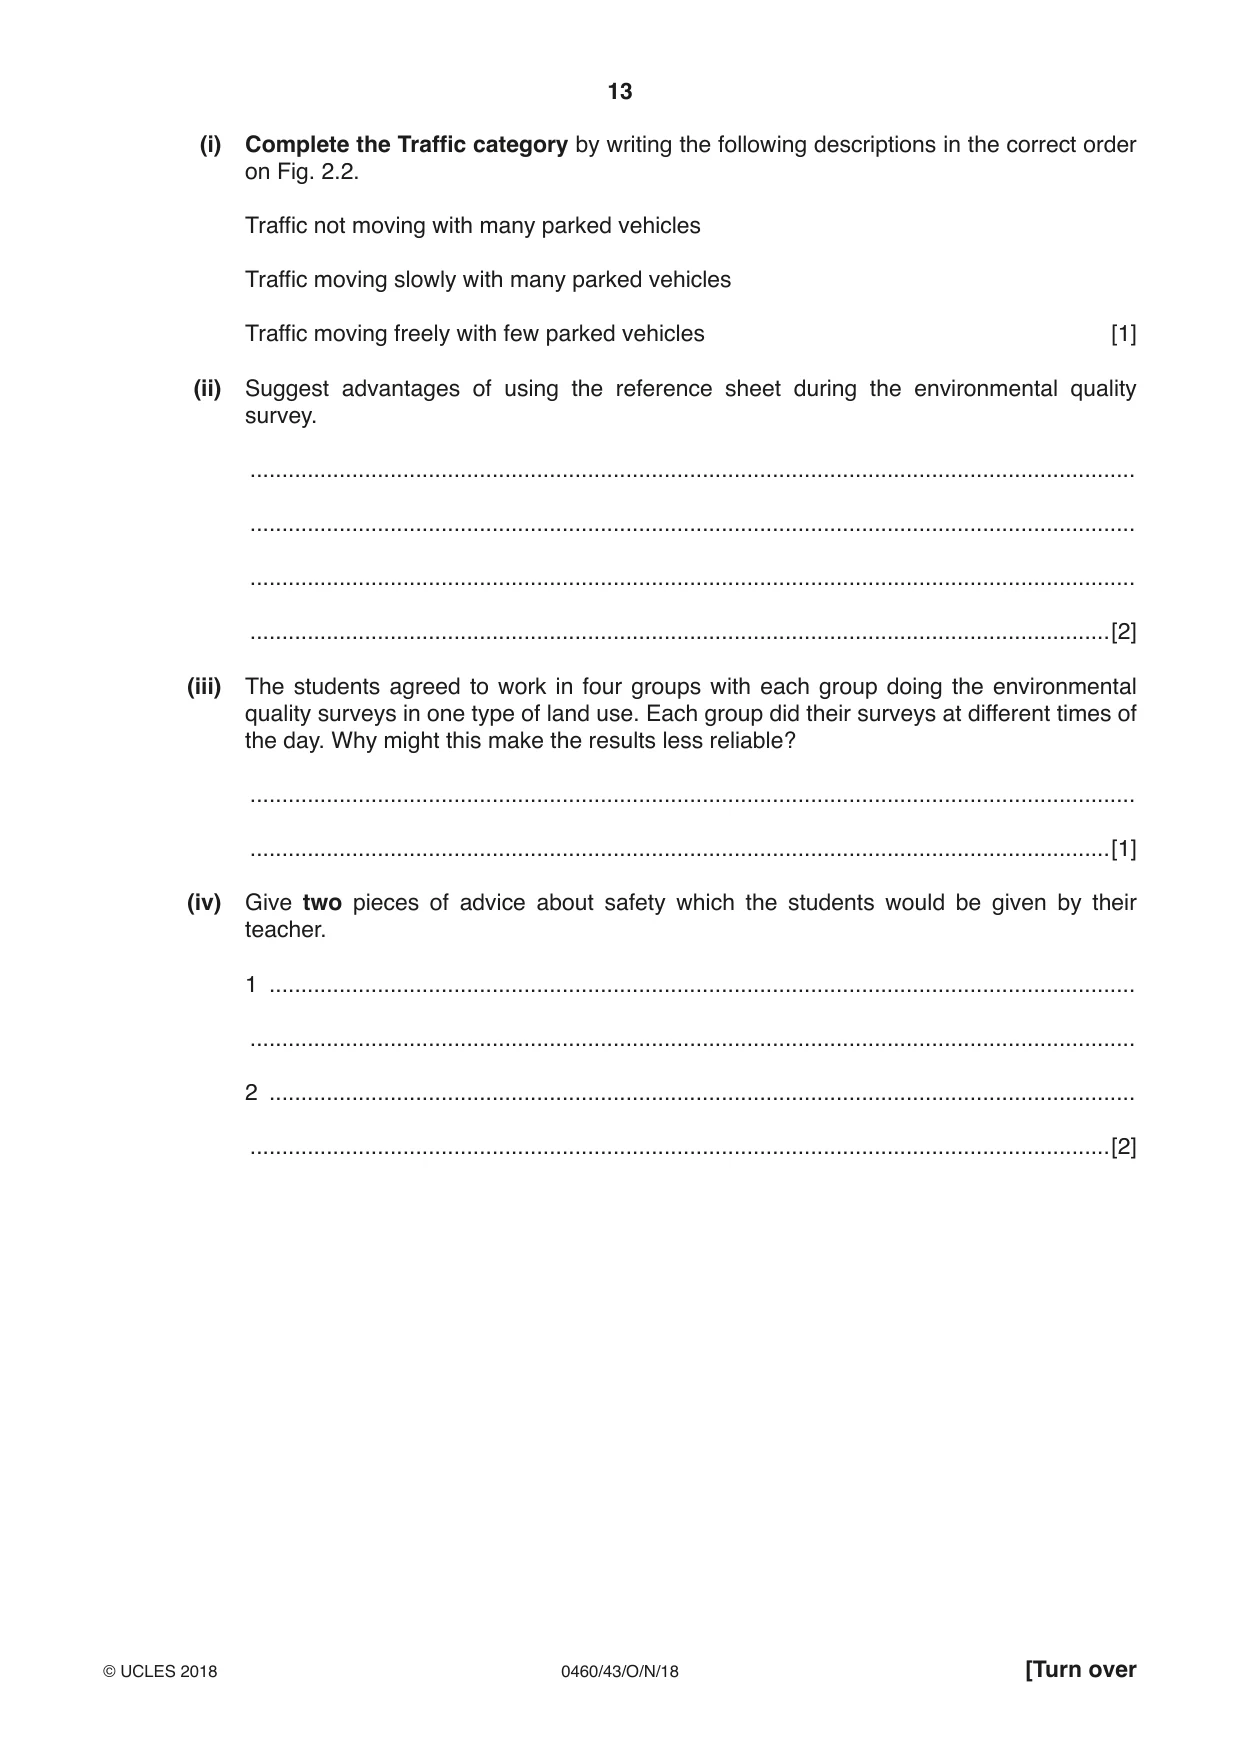
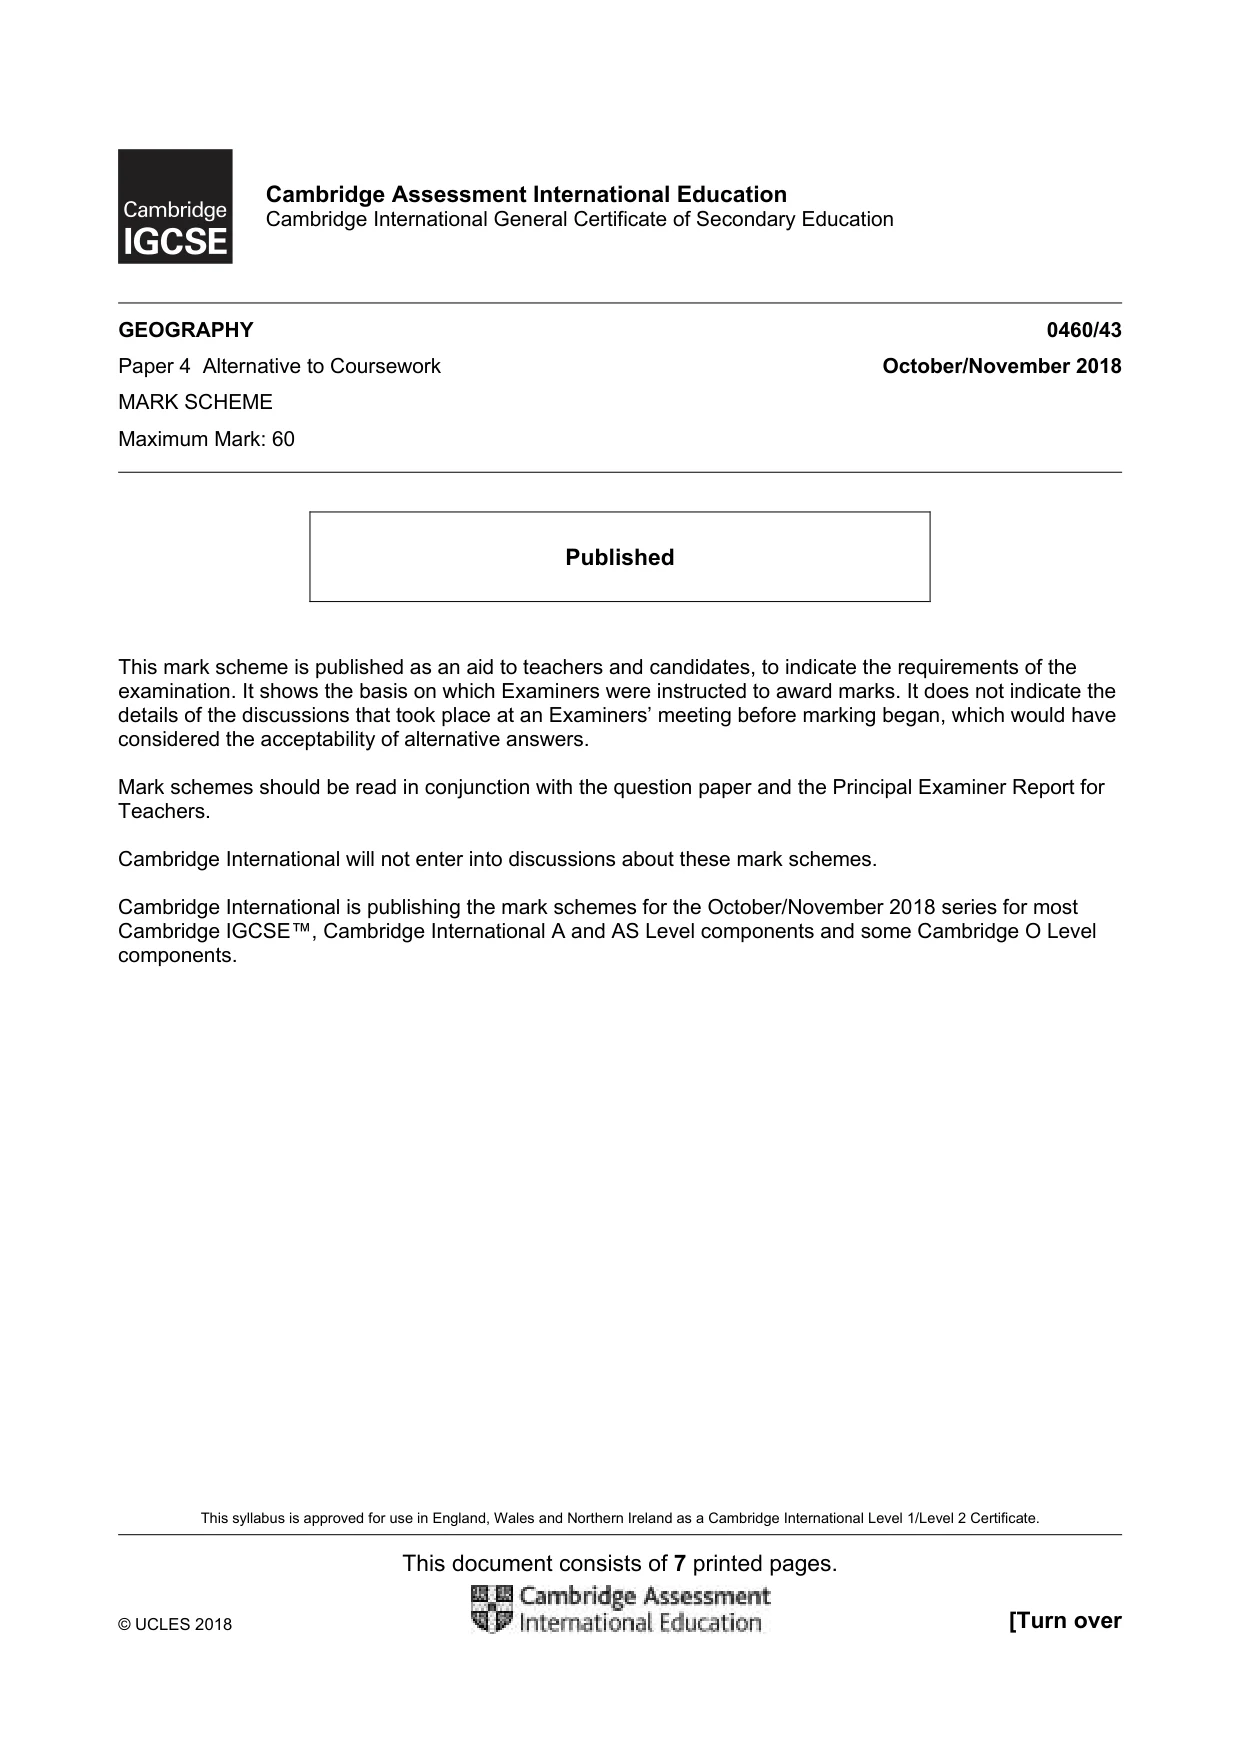
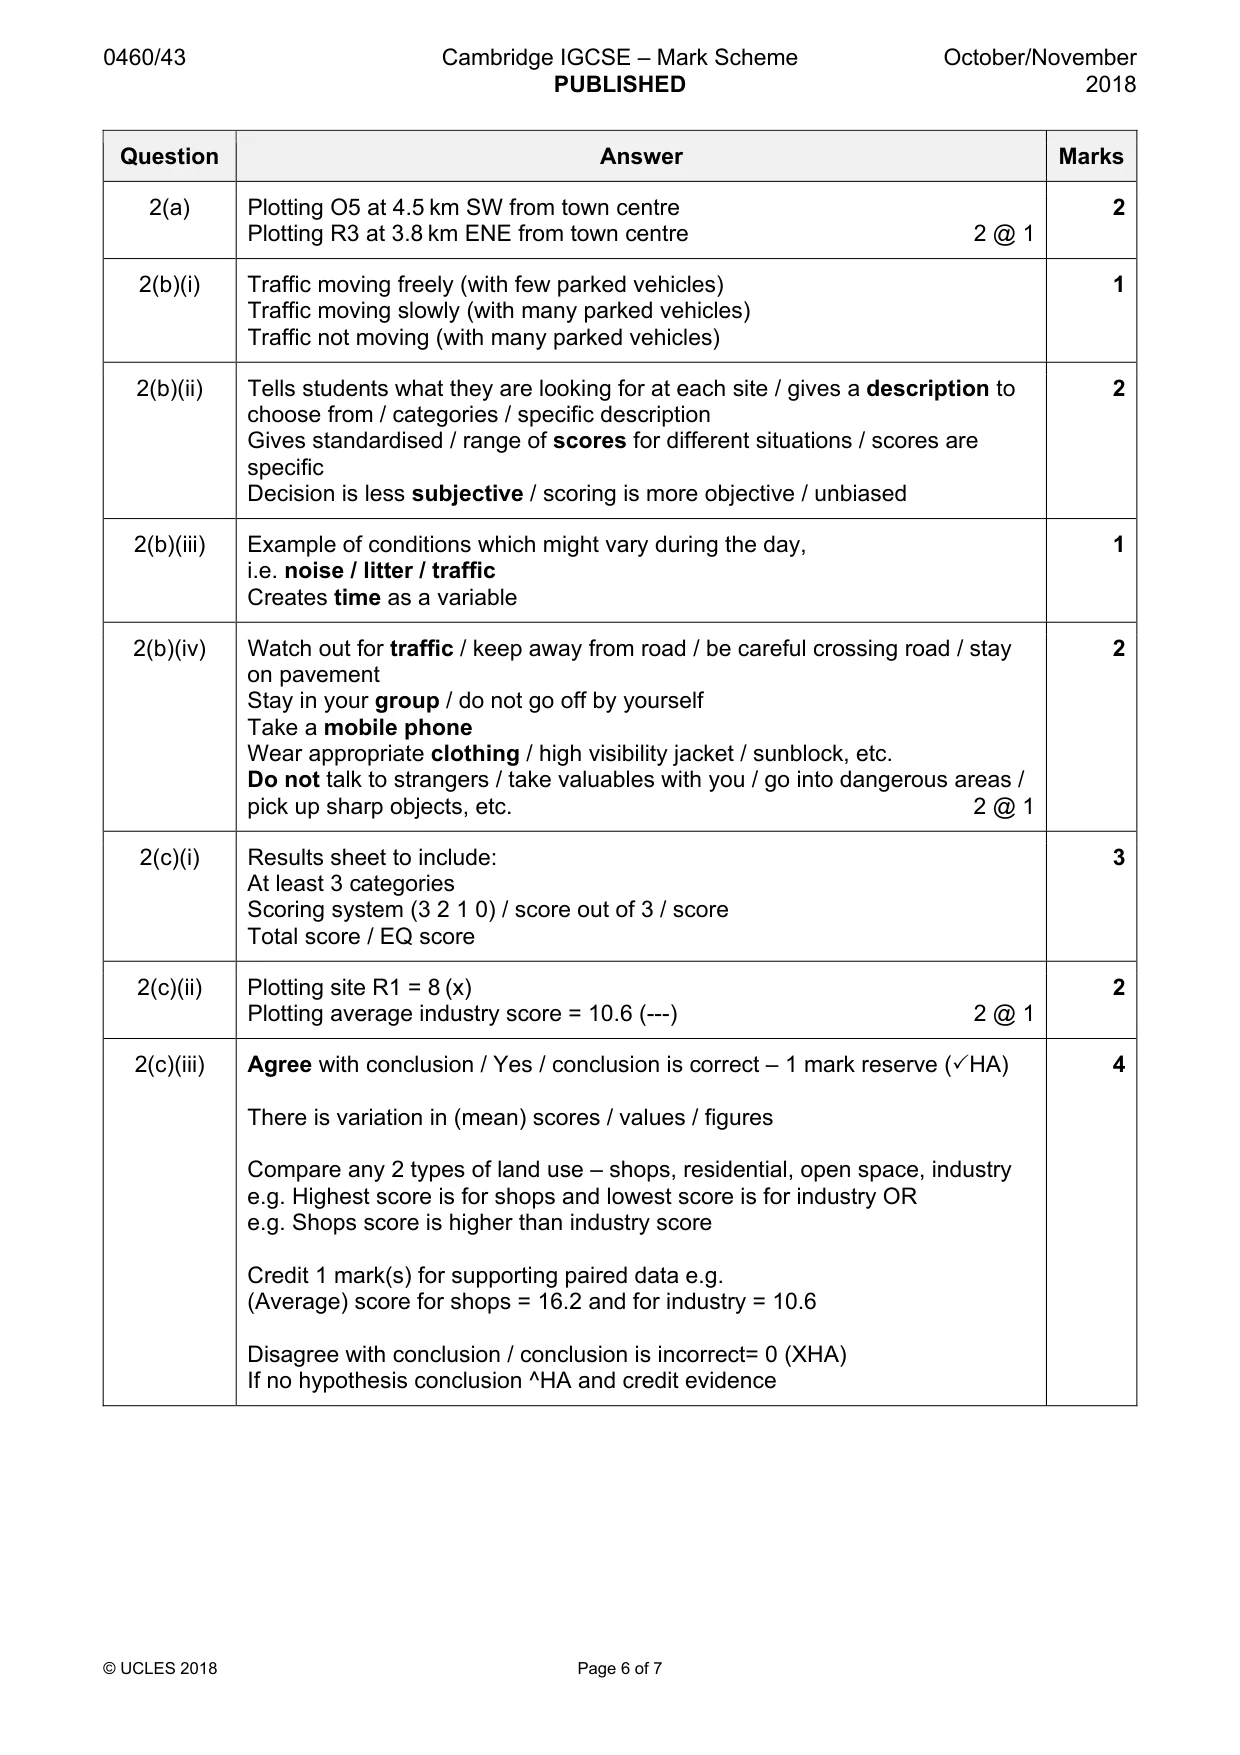
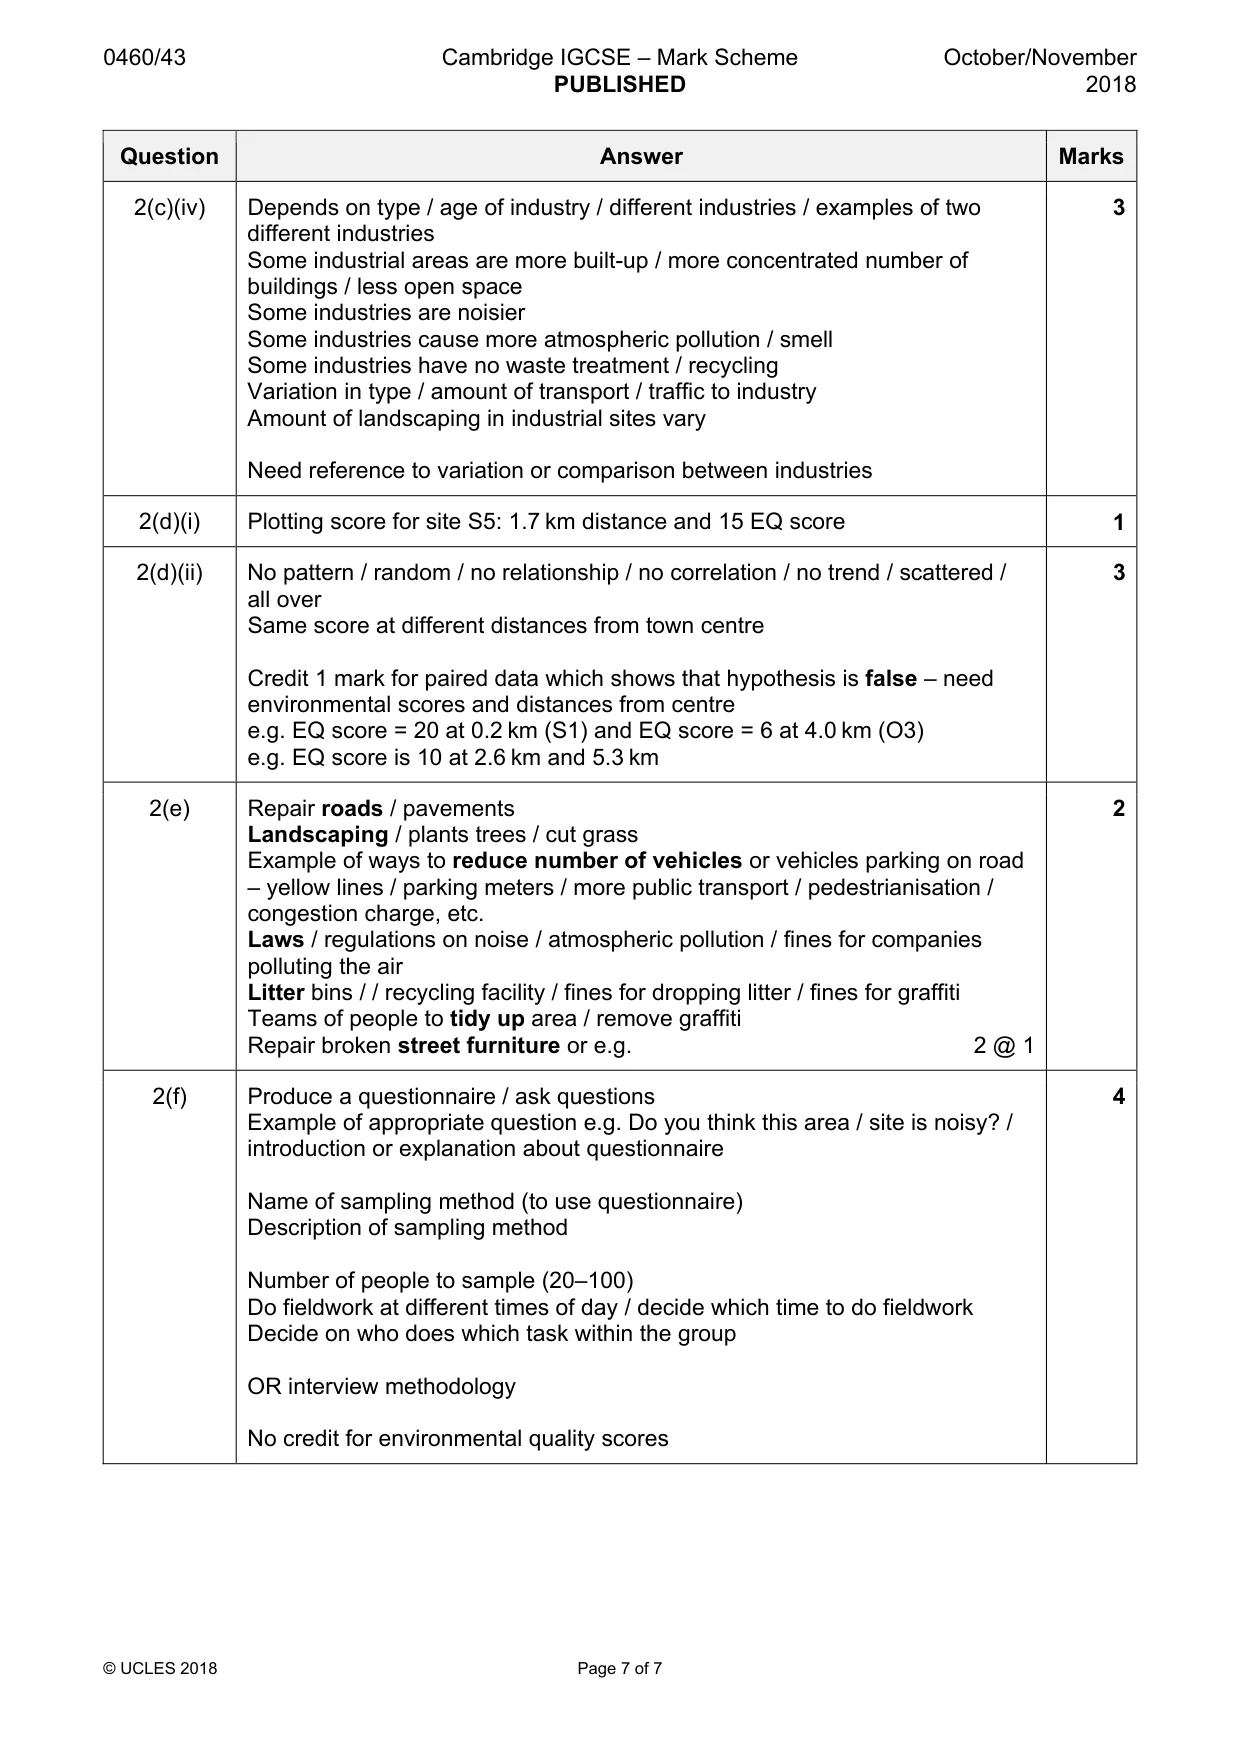
2 A class of students in the UK wanted to investigate how the quality of the urban environment varied between different areas of their town. They decided to do an environmental quality survey. The students decided to focus their investigation on four types of land use: • industry • open space • residential (housing) • shops. They concentrated their investigation on the following hypotheses: Hypothesis 1: The quality of the urban environment varies between different types of land use. Hypothesis 2: The quality of the urban environment improves as distance from the town centre increases. (a) The students selected 20 sites (including 5 of each land use) to do their environmental quality survey. At each chosen site there was one main land use. The sites varied in distance from the town centre. The location of the survey sites are shown on Fig. 2.1 below. Location of survey sites in the town N S3 IN4 O1 O3 IN1 R1 O2 O4 S2 S1 S5 S4 IN5 R4 R5 IN3 IN2 R2 Key 0 1 2 3 4 5 Land use Reference km industry IN open space O residential R shops S town centre environmental survey sites O3 Fig. 2.1 Complete Fig. 2.1 by marking on the location of two sites, O5 and R3, using the information below. Reference Main land Distance from Direction from number use town centre (km) town centre O5 Open space 4.5 south west R3 Residential 3.8 east north east [2] (b) The students produced a reference sheet to use at the environmental quality survey sites. This is shown in Fig. 2.2 on page 12.
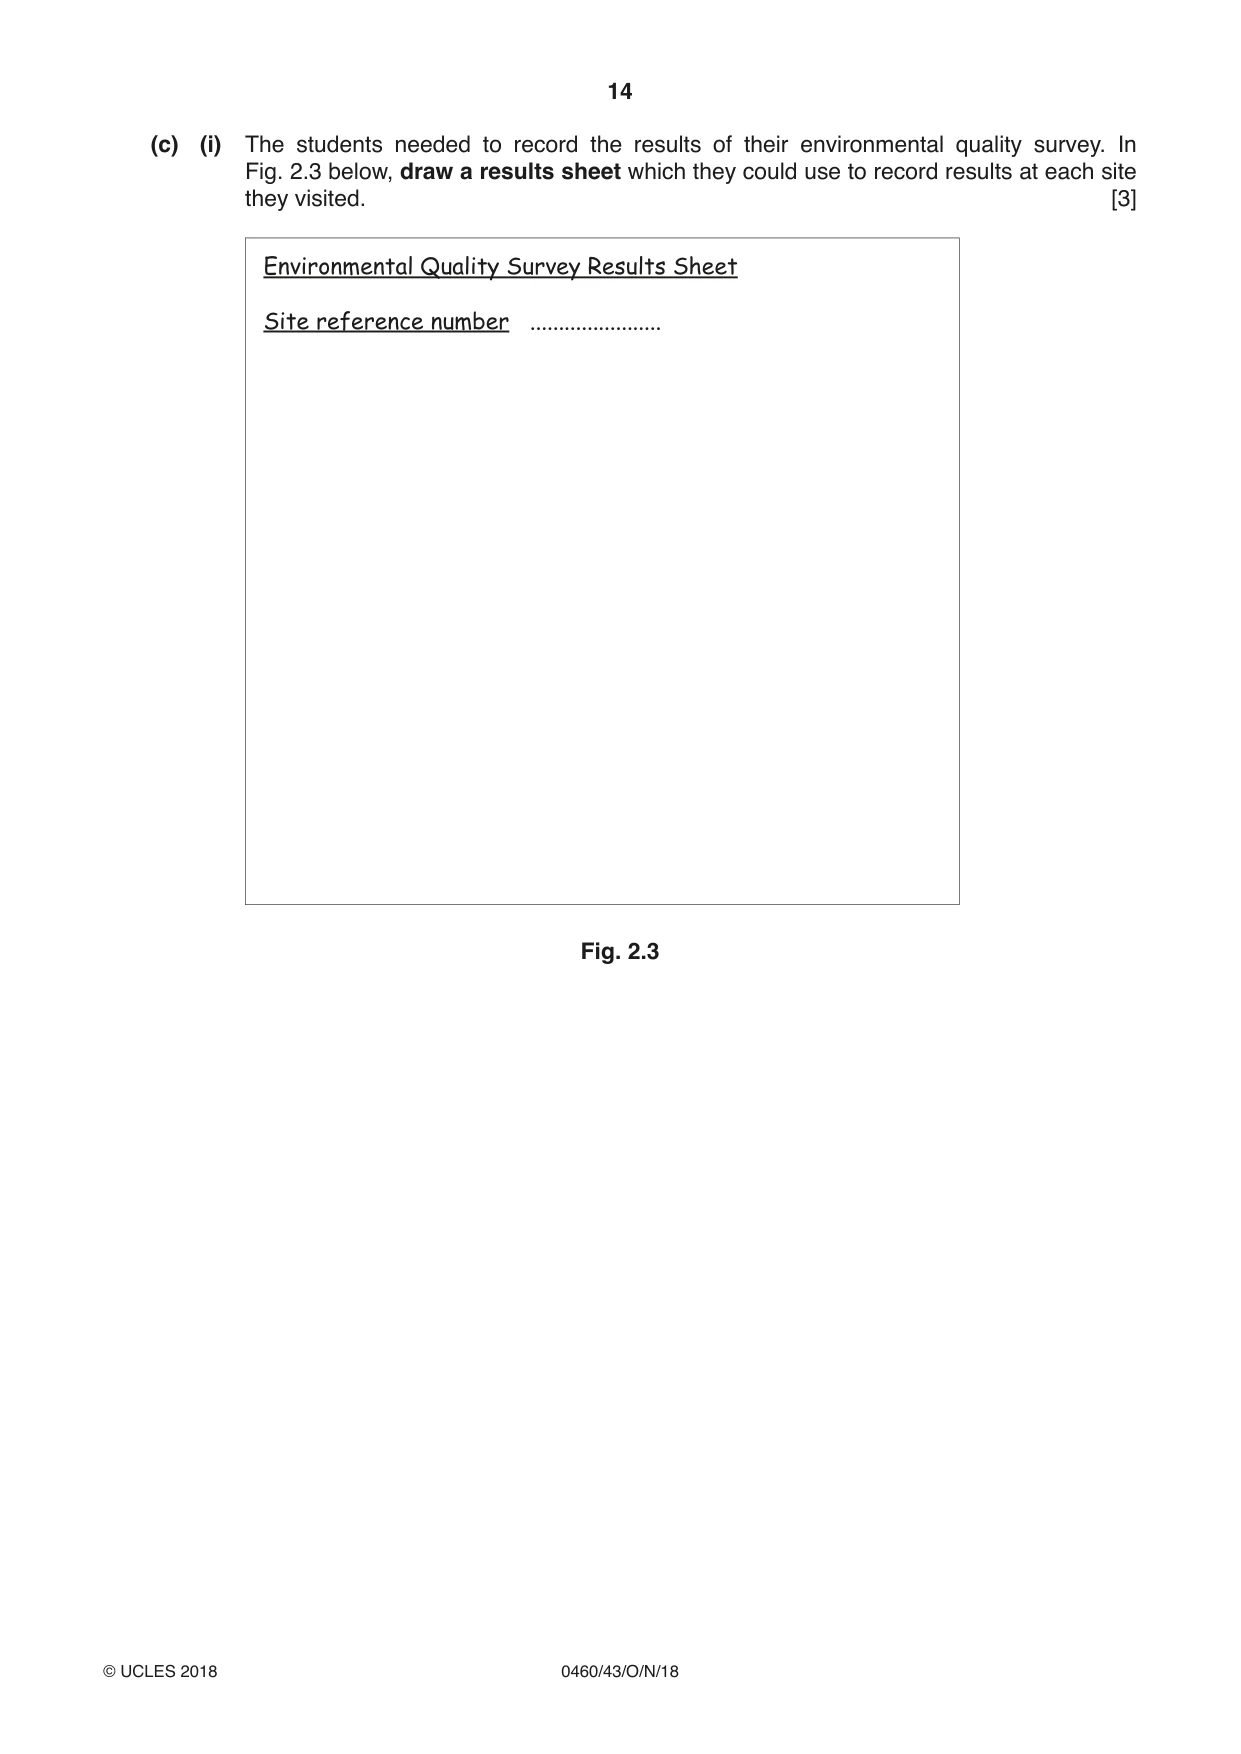
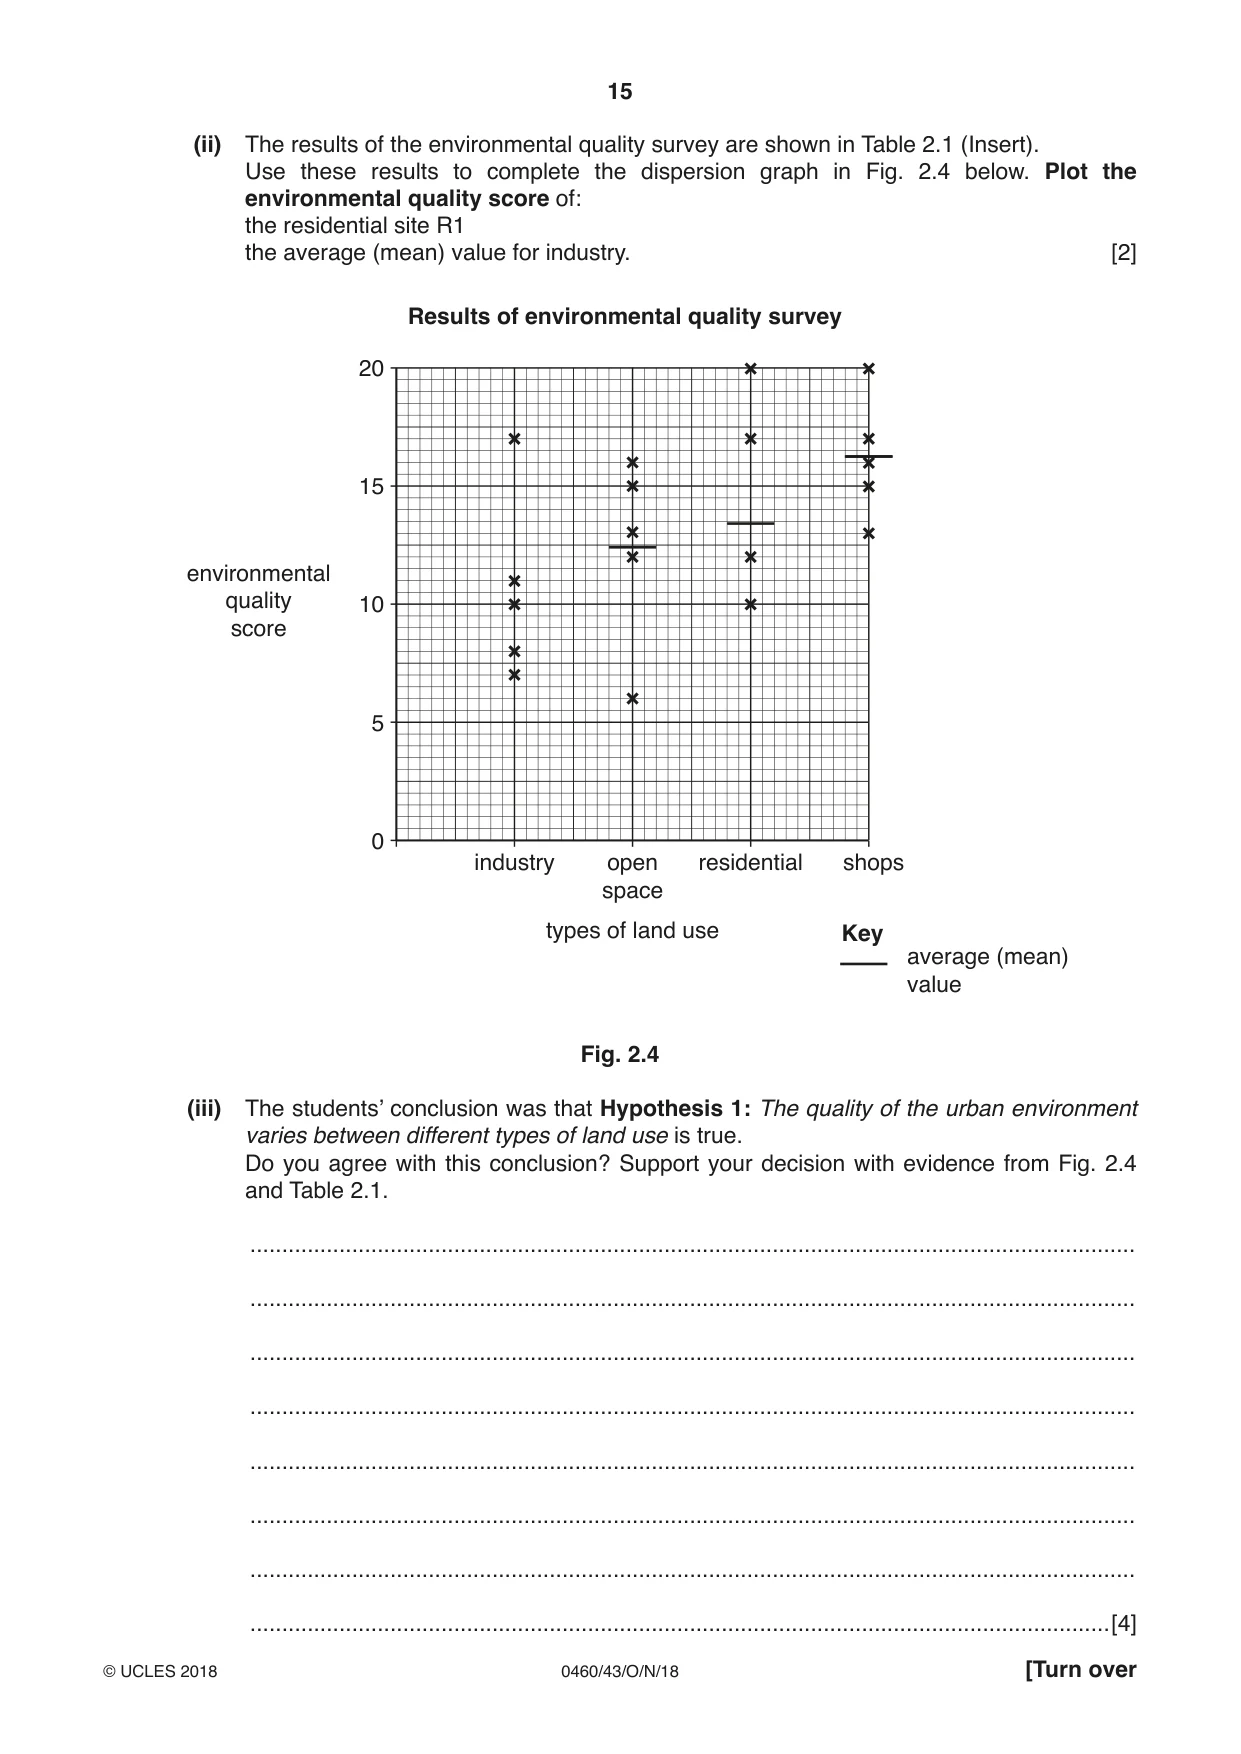
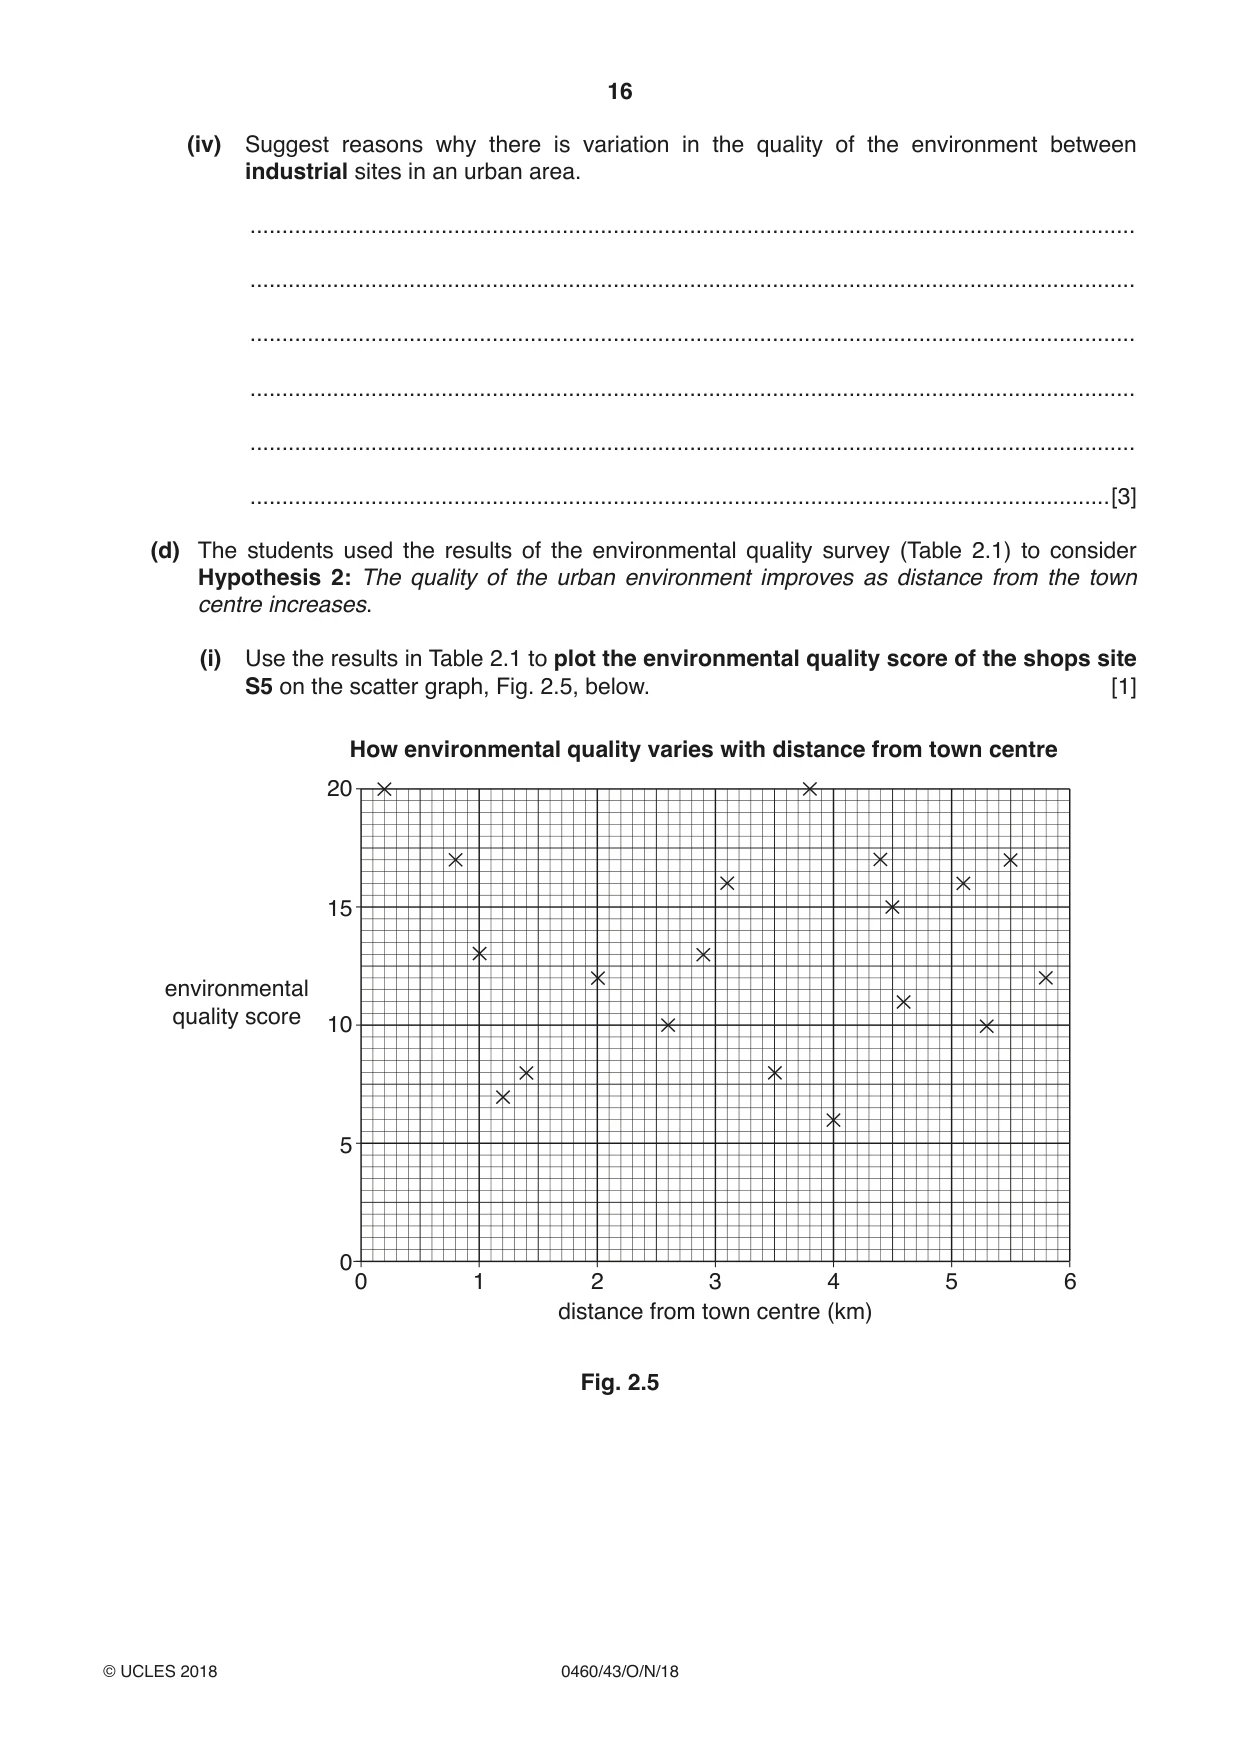
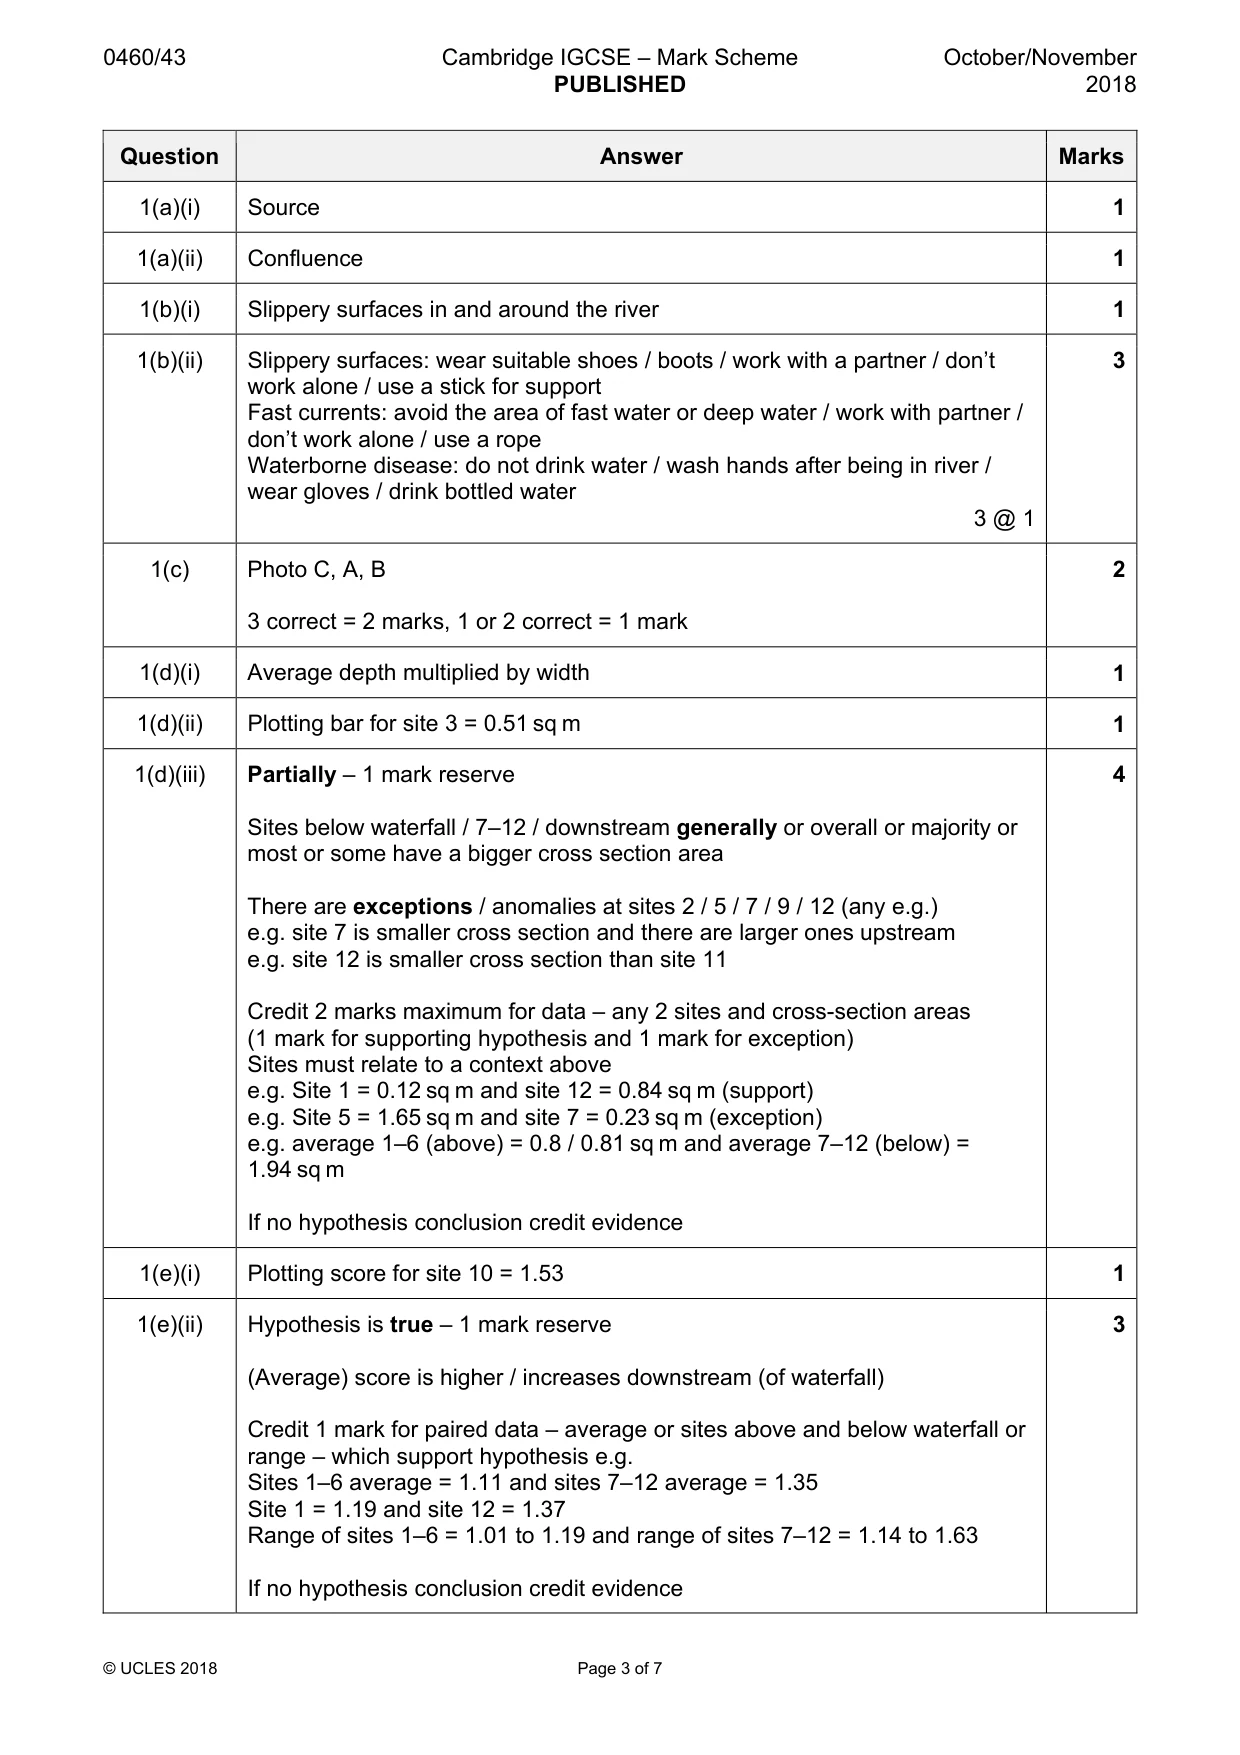
Mark scheme: 2(a) Plotting O5 at 4.5 km SW from town centre 2 Plotting R3 at 3.8 km ENE from town centre 2 @ 1 2(b)(i) Traffic moving freely (with few parked vehicles) 1 Traffic moving slowly (with many parked vehicles) Traffic not moving (with many parked vehicles) 2(b)(ii) Tells students what they are looking for at each site / gives a description to 2 choose from / categories / specific description Gives standardised / range of scores for different situations / scores are specific Decision is less subjective / scoring is more objective / unbiased 2(b)(iii) Example of conditions which might vary during the day, 1 i.e. noise / litter / traffic Creates time as a variable 2(b)(iv) Watch out for traffic / keep away from road / be careful crossing road / stay 2 on pavement Stay in your group / do not go off by yourself Take a mobile phone Wear appropriate clothing / high visibility jacket / sunblock, etc. Do not talk to strangers / take valuables with you / go into dangerous areas / pick up sharp objects, etc. 2 @ 1 2(c)(i) Results sheet to include: 3 At least 3 categories Scoring system (3 2 1 0) / score out of 3 / score Total score / EQ score 2(c)(ii) Plotting site R1 = 8 (x) 2 Plotting average industry score = 10.6 (---) 2 @ 1 2(c)(iii) Agree with conclusion / Yes / conclusion is correct – 1 mark reserve (3HA) 4 There is variation in (mean) scores / values / figures Compare any 2 types of land use – shops, residential, open space, industry e.g. Highest score is for shops and lowest score is for industry OR e.g. Shops score is higher than industry score Credit 1 mark(s) for supporting paired data e.g. (Average) score for shops = 16.2 and for industry = 10.6 Disagree with conclusion / conclusion is incorrect= 0 (XHA) If no hypothesis conclusion ^HA and credit evidence 2(c)(iv) Depends on type / age of industry / different industries / examples of two 3 different industries Some industrial areas are more built-up / more concentrated number of buildings / less open space Some industries are noisier Some industries cause more atmospheric pollution / smell Some industries have no waste treatment / recycling Variation in type / amount of transport / traffic to industry Amount of landscaping in industrial sites vary Need reference to variation or comparison between industries 2(d)(i) Plotting score for site S5: 1.7 km distance and 15 EQ score 1 2(d)(ii) No pattern / random / no relationship / no correlation / no trend / scattered / 3 all over Same score at different distances from town centre Credit 1 mark for paired data which shows that hypothesis is false – need environmental scores and distances from centre e.g. EQ score = 20 at 0.2 km (S1) and EQ score = 6 at 4.0 km (O3) e.g. EQ score is 10 at 2.6 km and 5.3 km 2(e) Repair roads / pavements 2 Landscaping / plants trees / cut grass Example of ways to reduce number of vehicles or vehicles parking on road – yellow lines / parking meters / more public transport / pedestrianisation / congestion charge, etc. Laws / regulations on noise / atmospheric pollution / fines for companies polluting the air Litter bins / / recycling facility / fines for dropping litter / fines for graffiti Teams of people to tidy up area / remove graffiti Repair broken street furniture or e.g. 2 @ 1 2(f) Produce a questionnaire / ask questions 4 Example of appropriate question e.g. Do you think this area / site is noisy? / introduction or explanation about questionnaire Name of sampling method (to use questionnaire) Description of sampling method Number of people to sample (20–100) Do fieldwork at different times of day / decide which time to do fieldwork Decide on who does which task within the group OR interview methodology No credit for environmental quality scores
What was in this paper
The subtopics covered by these 2 questions, and how many questions each got. Open one in a new tab to see every Cambridge question on it.
What you needed in this session
Cambridge’s own grade thresholds for 2018 Oct/Nov, Paper 4 · Variant 3. A higher threshold means an easier paper — the bar moves with how the cohort did.