Cambridge IGCSE Geography 0460 — 2018 Oct/Nov Paper 4 · Variant 2
0460/42/O/N/18 · 2 questions · 60 marks · ≈68 min
The question paper and its mark scheme, free to read here and free to download. This is Cambridge’s own paper, exactly as it was sat.
Question paper20 pages

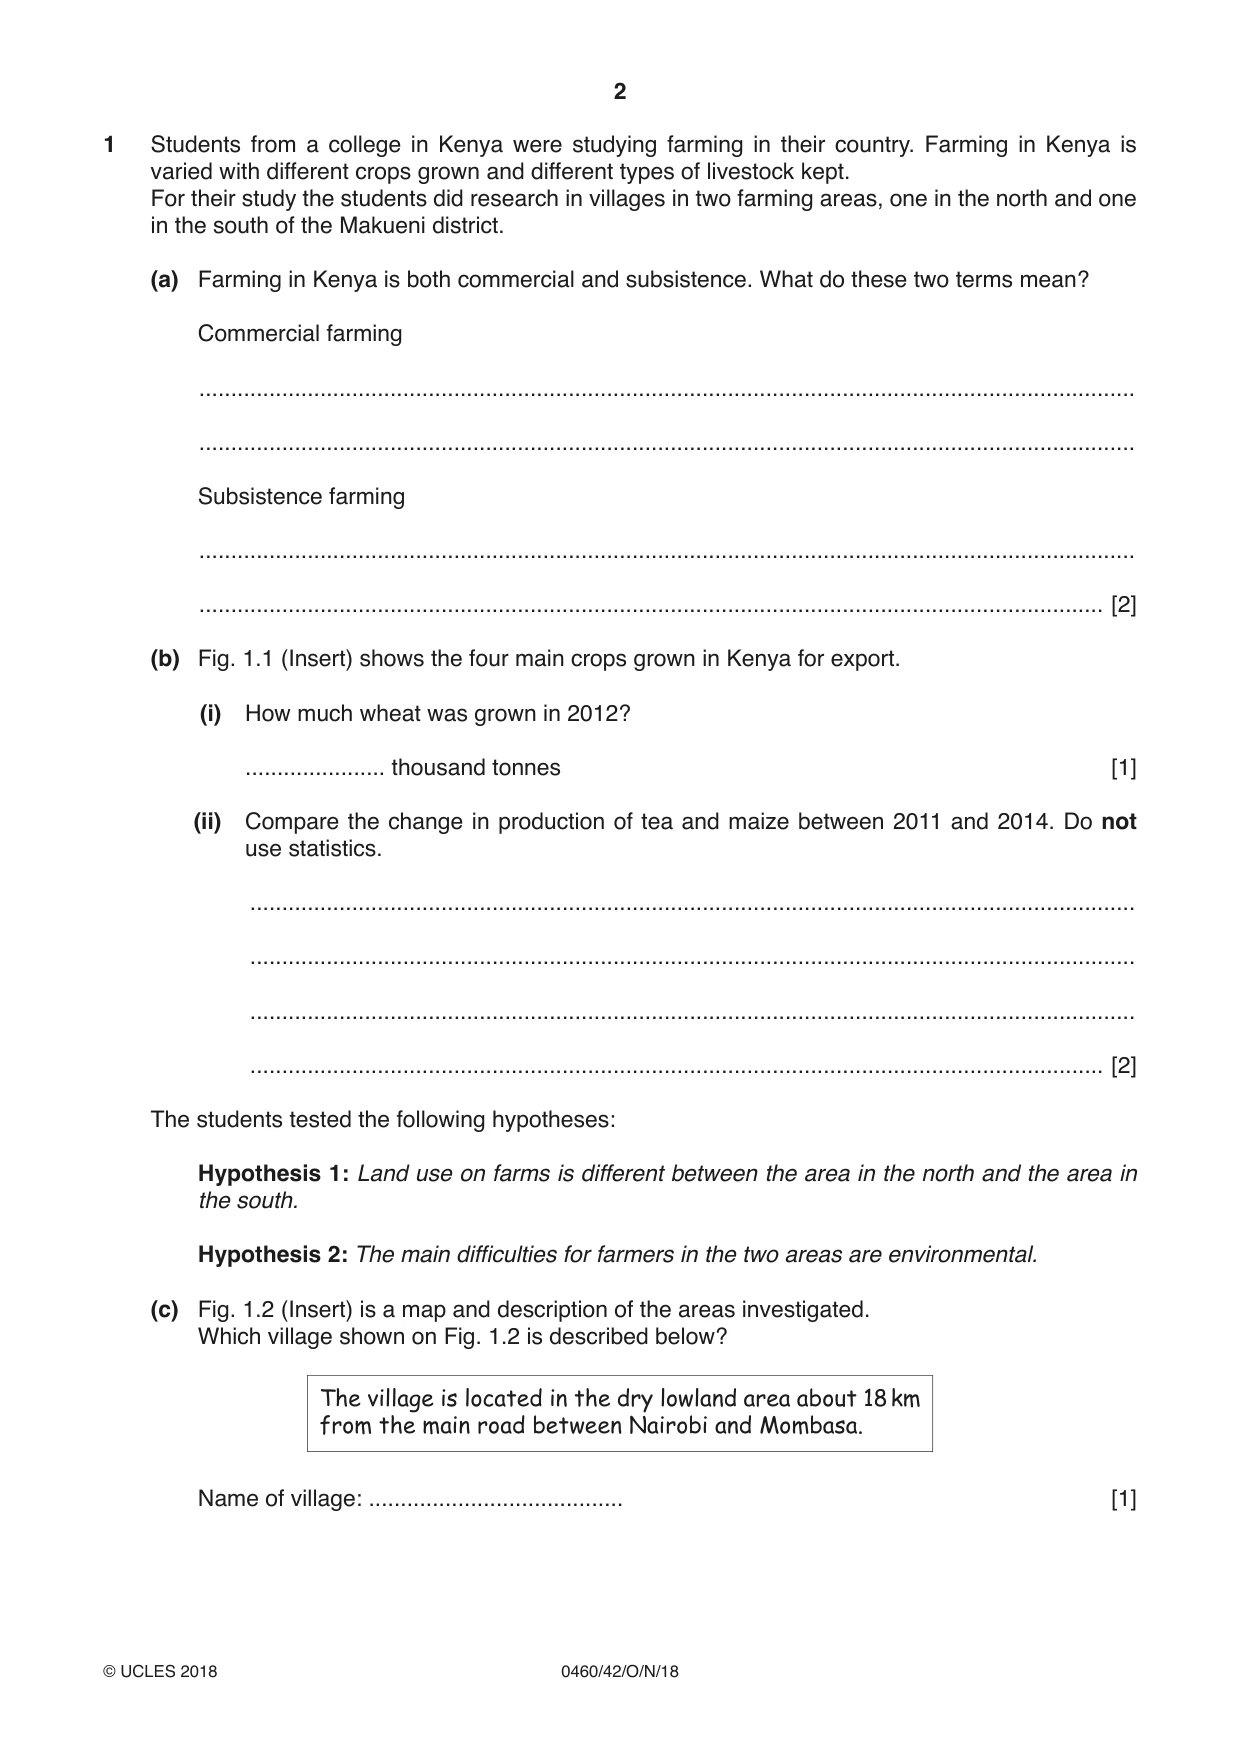
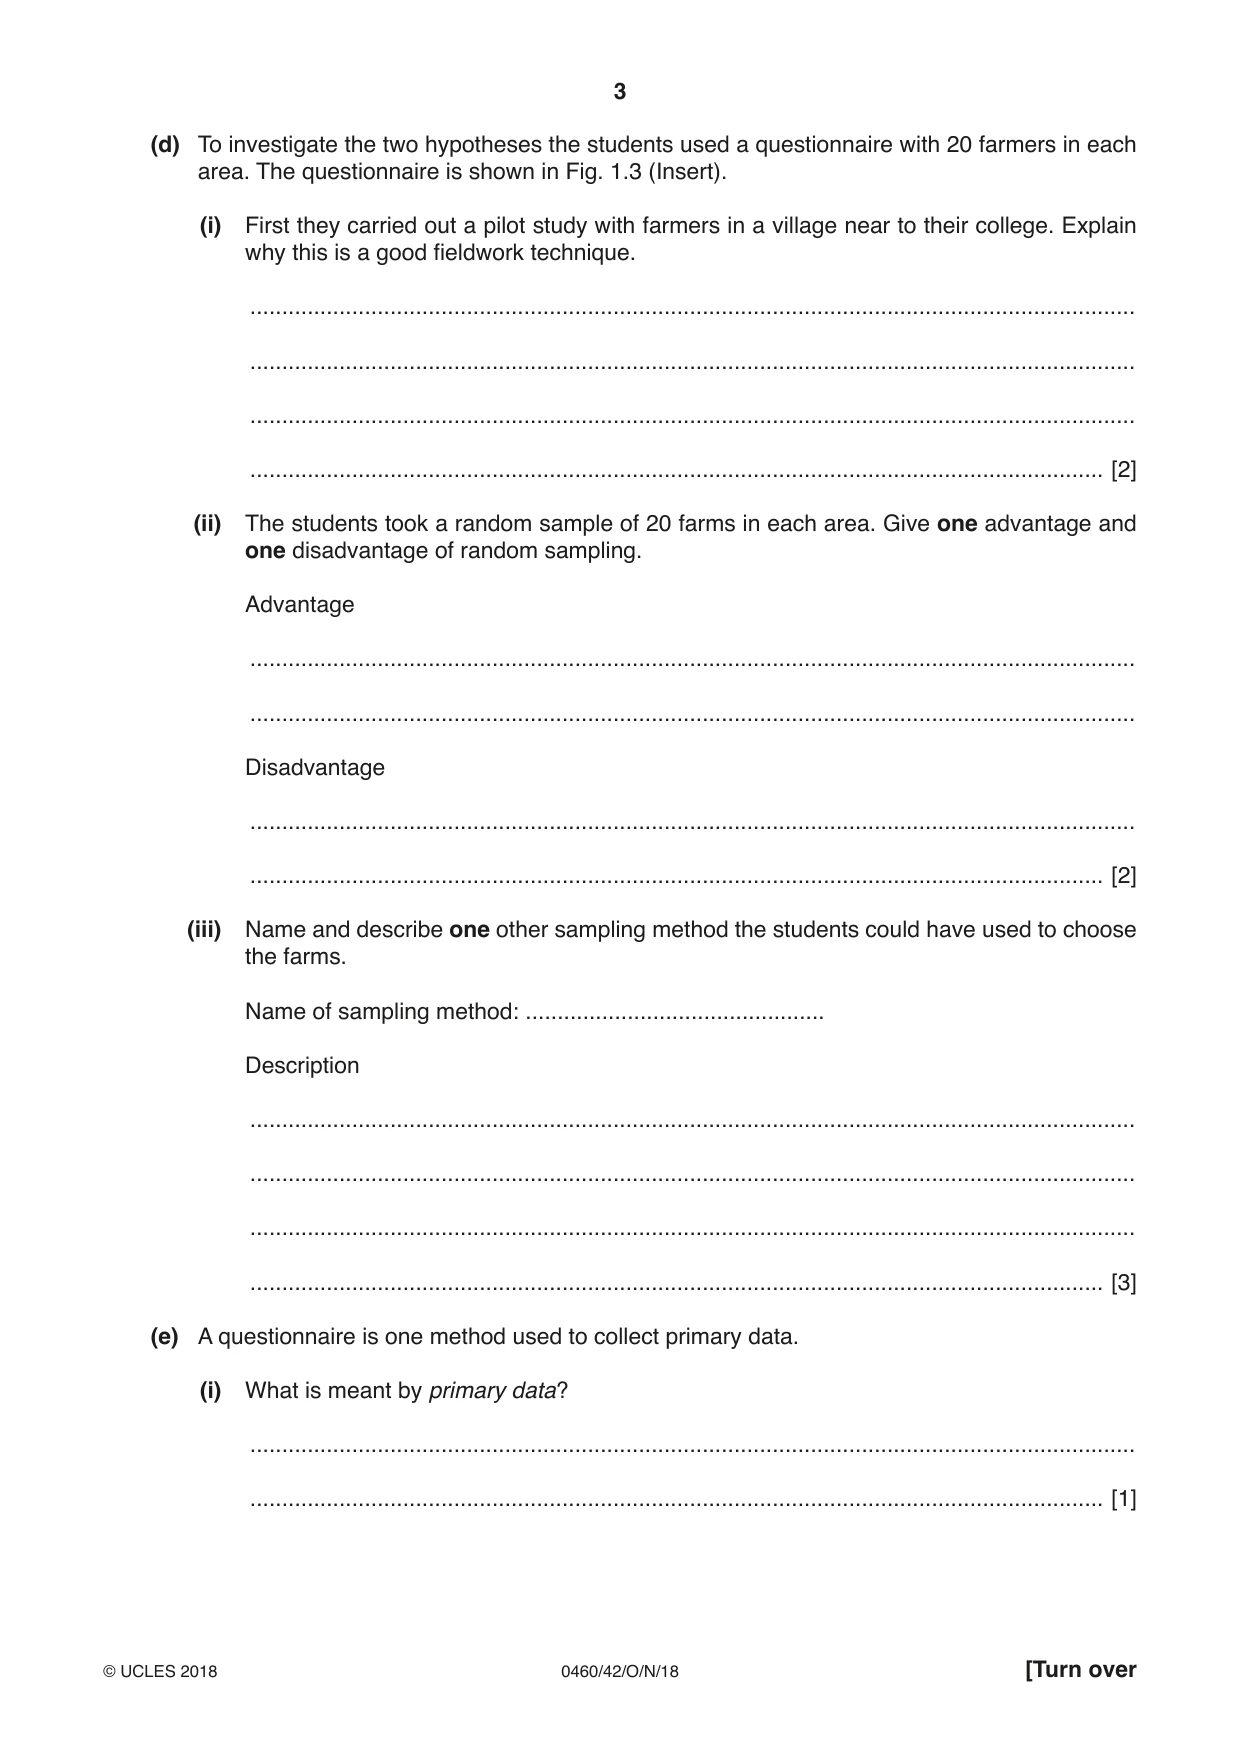

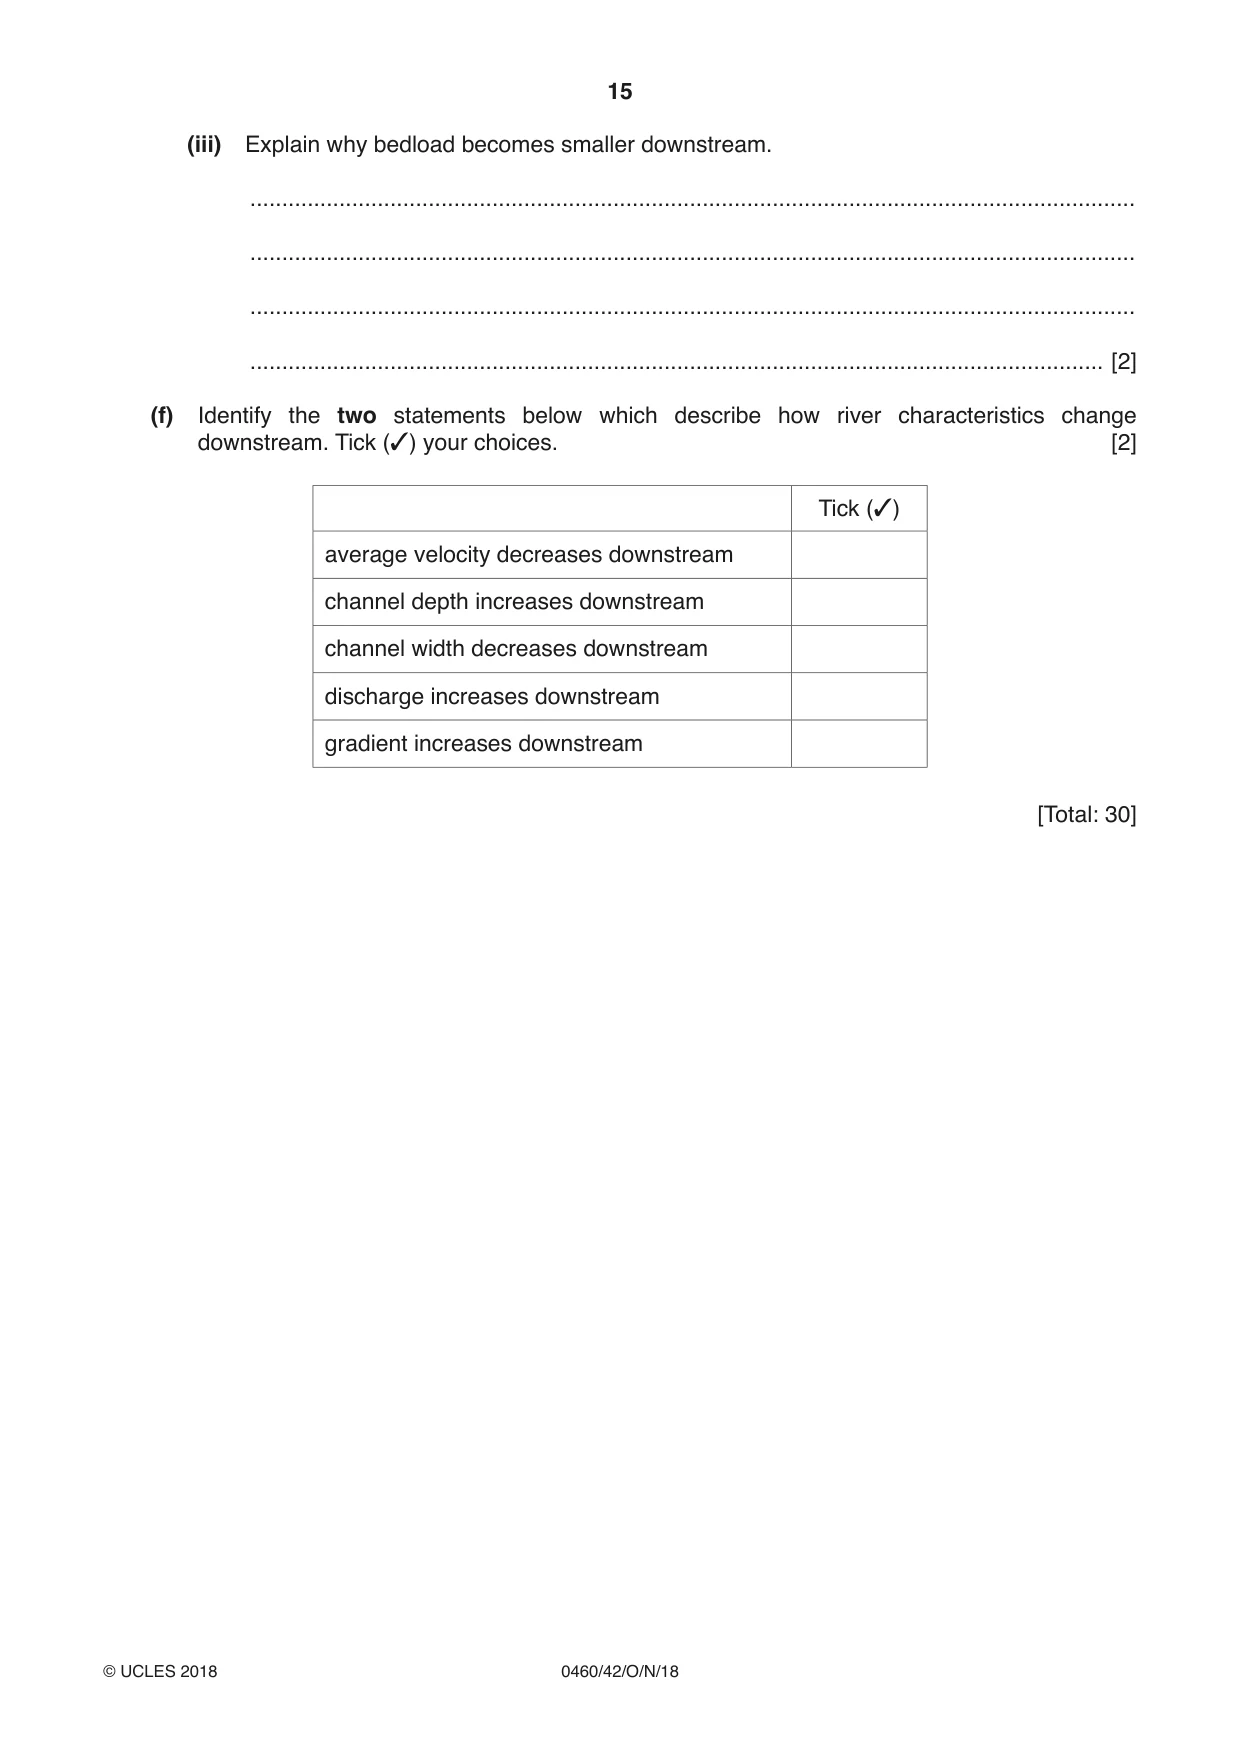





Mark scheme10 pages
Answers below. Sit the paper first if you are practising.
Questions as text
Q1 · Students from a college in Kenya were studying farming in their country
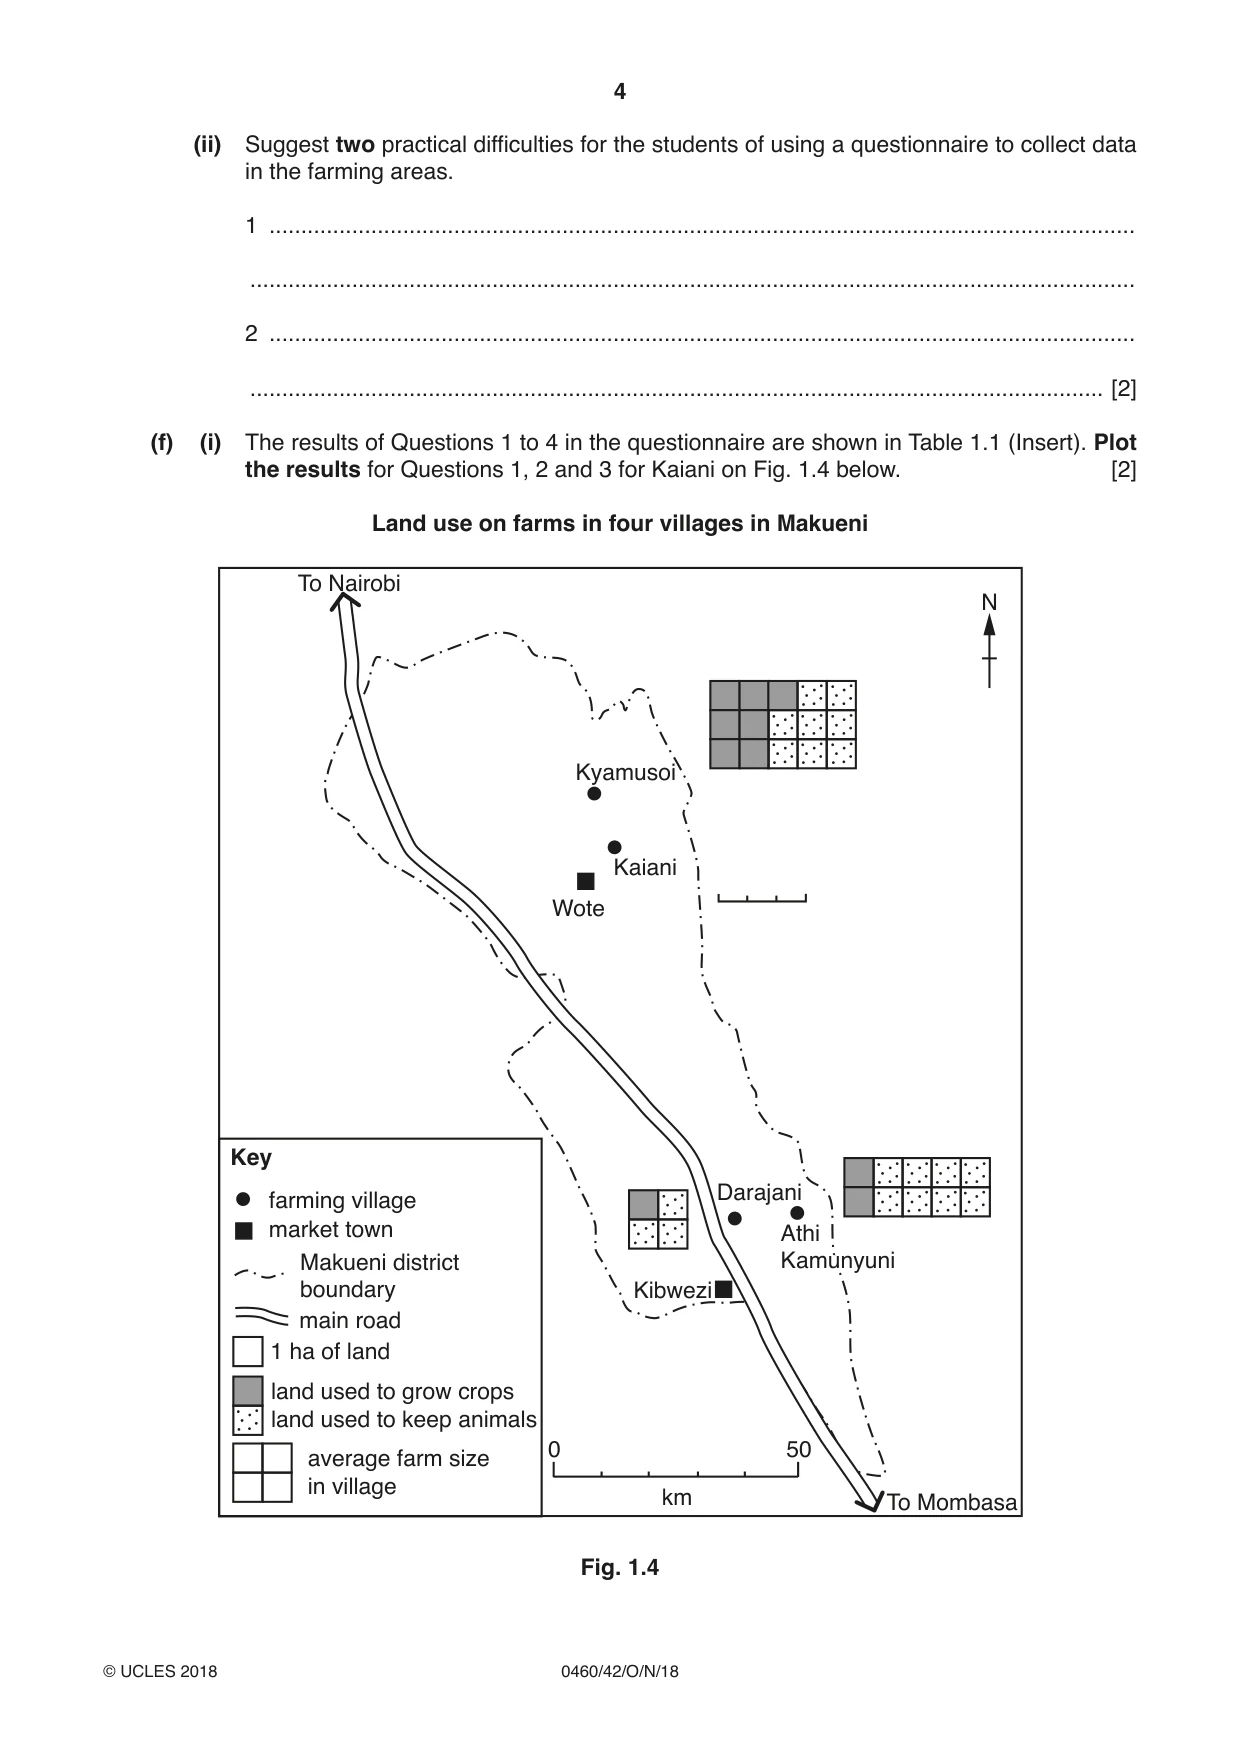
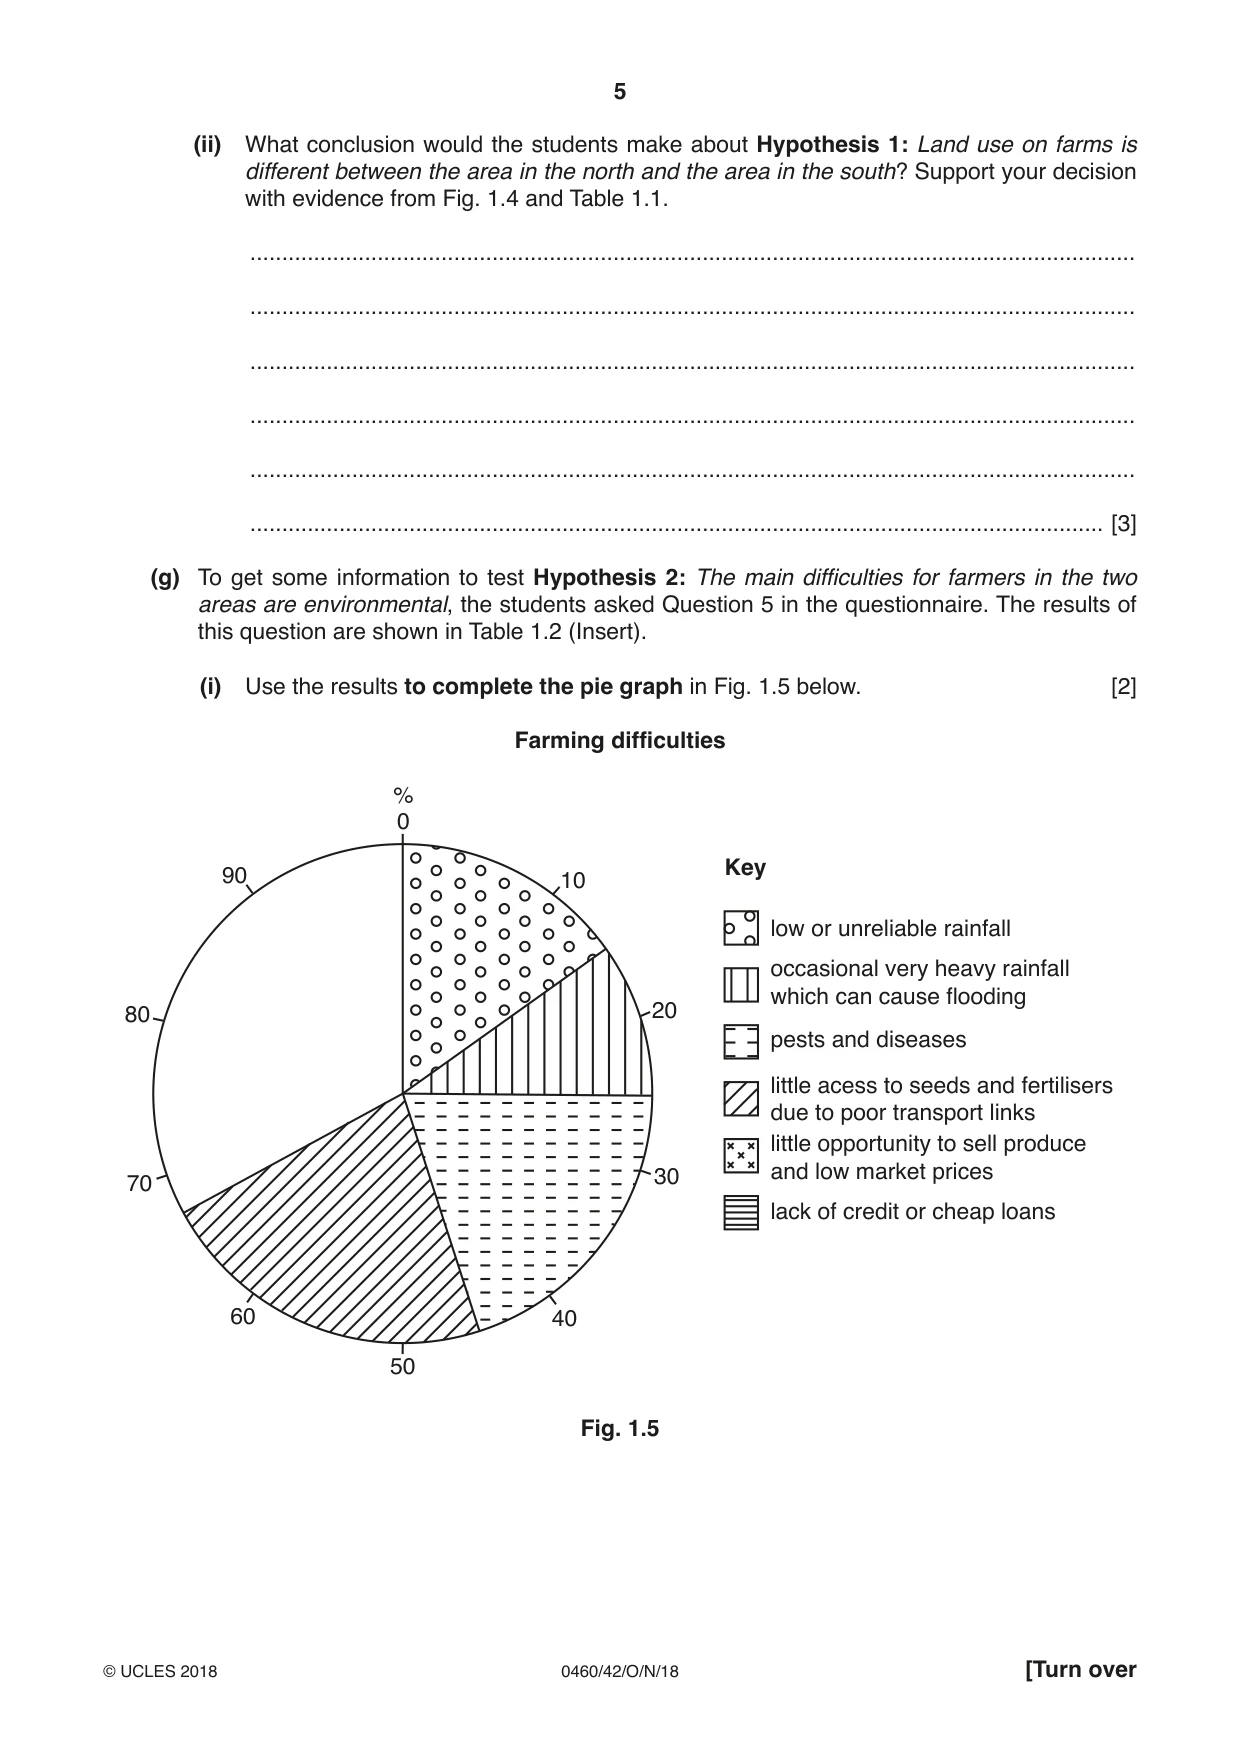
1 Students from a college in Kenya were studying farming in their country. Farming in Kenya is varied with different crops grown and different types of livestock kept. For their study the students did research in villages in two farming areas, one in the north and one in the south of the Makueni district. (a) Farming in Kenya is both commercial and subsistence. What do these two terms mean? Commercial farming ................................................................................................................................................... ................................................................................................................................................... Subsistence farming ................................................................................................................................................... .............................................................................................................................................. [2] (b) Fig. 1.1 (Insert) shows the four main crops grown in Kenya for export. (i) How much wheat was grown in 2012? ...................... thousand tonnes [1] (ii) Compare the change in production of tea and maize between 2011 and 2014. Do not use statistics. ........................................................................................................................................... ........................................................................................................................................... ........................................................................................................................................... ...................................................................................................................................... [2] The students tested the following hypotheses: Hypothesis 1: Land use on farms is different between the area in the north and the area in the south. Hypothesis 2: The main difficulties for farmers in the two areas are environmental. (c) Fig. 1.2 (Insert) is a map and description of the areas investigated. Which village shown on Fig. 1.2 is described below? The village is located in the dry lowland area about 18 km from the main road between Nairobi and Mombasa. Name of village: ........................................ [1] (d) To investigate the two hypotheses the students used a questionnaire with 20 farmers in each area. The questionnaire is shown in Fig. 1.3 (Insert). (i) First they carried out a pilot study with farmers in a village near to their college. Explain why this is a good fieldwork technique. ........................................................................................................................................... ........................................................................................................................................... ........................................................................................................................................... ...................................................................................................................................... [2] (ii) The students took a random sample of 20 farms in each area. Give one advantage and one disadvantage of random sampling. Advantage ........................................................................................................................................... ........................................................................................................................................... Disadvantage ........................................................................................................................................... ...................................................................................................................................... [2] (iii) Name and describe one other sampling method the students could have used to choose the farms. Name of sampling method: ............................................... Description ........................................................................................................................................... ........................................................................................................................................... ........................................................................................................................................... ...................................................................................................................................... [3] (e) A questionnaire is one method used to collect primary data. (i) What is meant by primary data? ........................................................................................................................................... ...................................................................................................................................... [1] (ii) Suggest two practical difficulties for the students of using a questionnaire to collect data in the farming areas. 1 ........................................................................................................................................ ........................................................................................................................................... 2 ........................................................................................................................................ ...................................................................................................................................... [2] (f) (i) The results of Questions 1 to 4 in the questionnaire are shown in Table 1.1 (Insert). Plot the results for Questions 1, 2 and 3 for Kaiani on Fig. 1.4 below. [2] Land use on farms in four villages in Makueni To Nairobi N Kyamusoi Kaiani Wote Key Darajani farming village market town AthiAthi Makueni district KamunyuniKamunyuni boundary Kibwezi main road 1 ha of land land used to grow crops land used to keep animals 0 50 average farm size in village km To Mombasa Fig. 1.4 (ii) What conclusion would the students make about Hypothesis 1: Land use on farms is different between the area in the north and the area in the south? Support your decision with evidence from Fig. 1.4 and Table 1.1. ........................................................................................................................................... ........................................................................................................................................... ........................................................................................................................................... ........................................................................................................................................... ........................................................................................................................................... ...................................................................................................................................... [3] (g) To get some information to test Hypothesis 2: The main difficulties for farmers in the two areas are environmental, the students asked Question 5 in the questionnaire. The results of this question are shown in Table 1.2 (Insert). (i) Use the results to complete the pie graph in Fig. 1.5 below. [2] Farming difficulties % 0 Key 90 10 low or unreliable rainfall occasional very heavy rainfall which can cause flooding80 20 pests and diseases little acess to seeds and fertilisers due to poor transport links little opportunity to sell produce 30 and low market prices70 lack of credit or cheap loans 60 40 50 Fig. 1.5 (ii) Do the results support Hypothesis 2: The main difficulties for farmers in the two areas are environmental? Support your decision with evidence from Fig. 1.5 and Table 1.2. ........................................................................................................................................... ........................................................................................................................................... ........................................................................................................................................... ........................................................................................................................................... ........................................................................................................................................... ........................................................................................................................................... ........................................................................................................................................... ...................................................................................................................................... [4] (h) Suggest how farmers in the village of Darajani could overcome the problem of water shortage caused by low or unreliable rainfall. ................................................................................................................................................... ................................................................................................................................................... ................................................................................................................................................... ................................................................................................................................................... ................................................................................................................................................... .............................................................................................................................................. [3] [Total: 30]
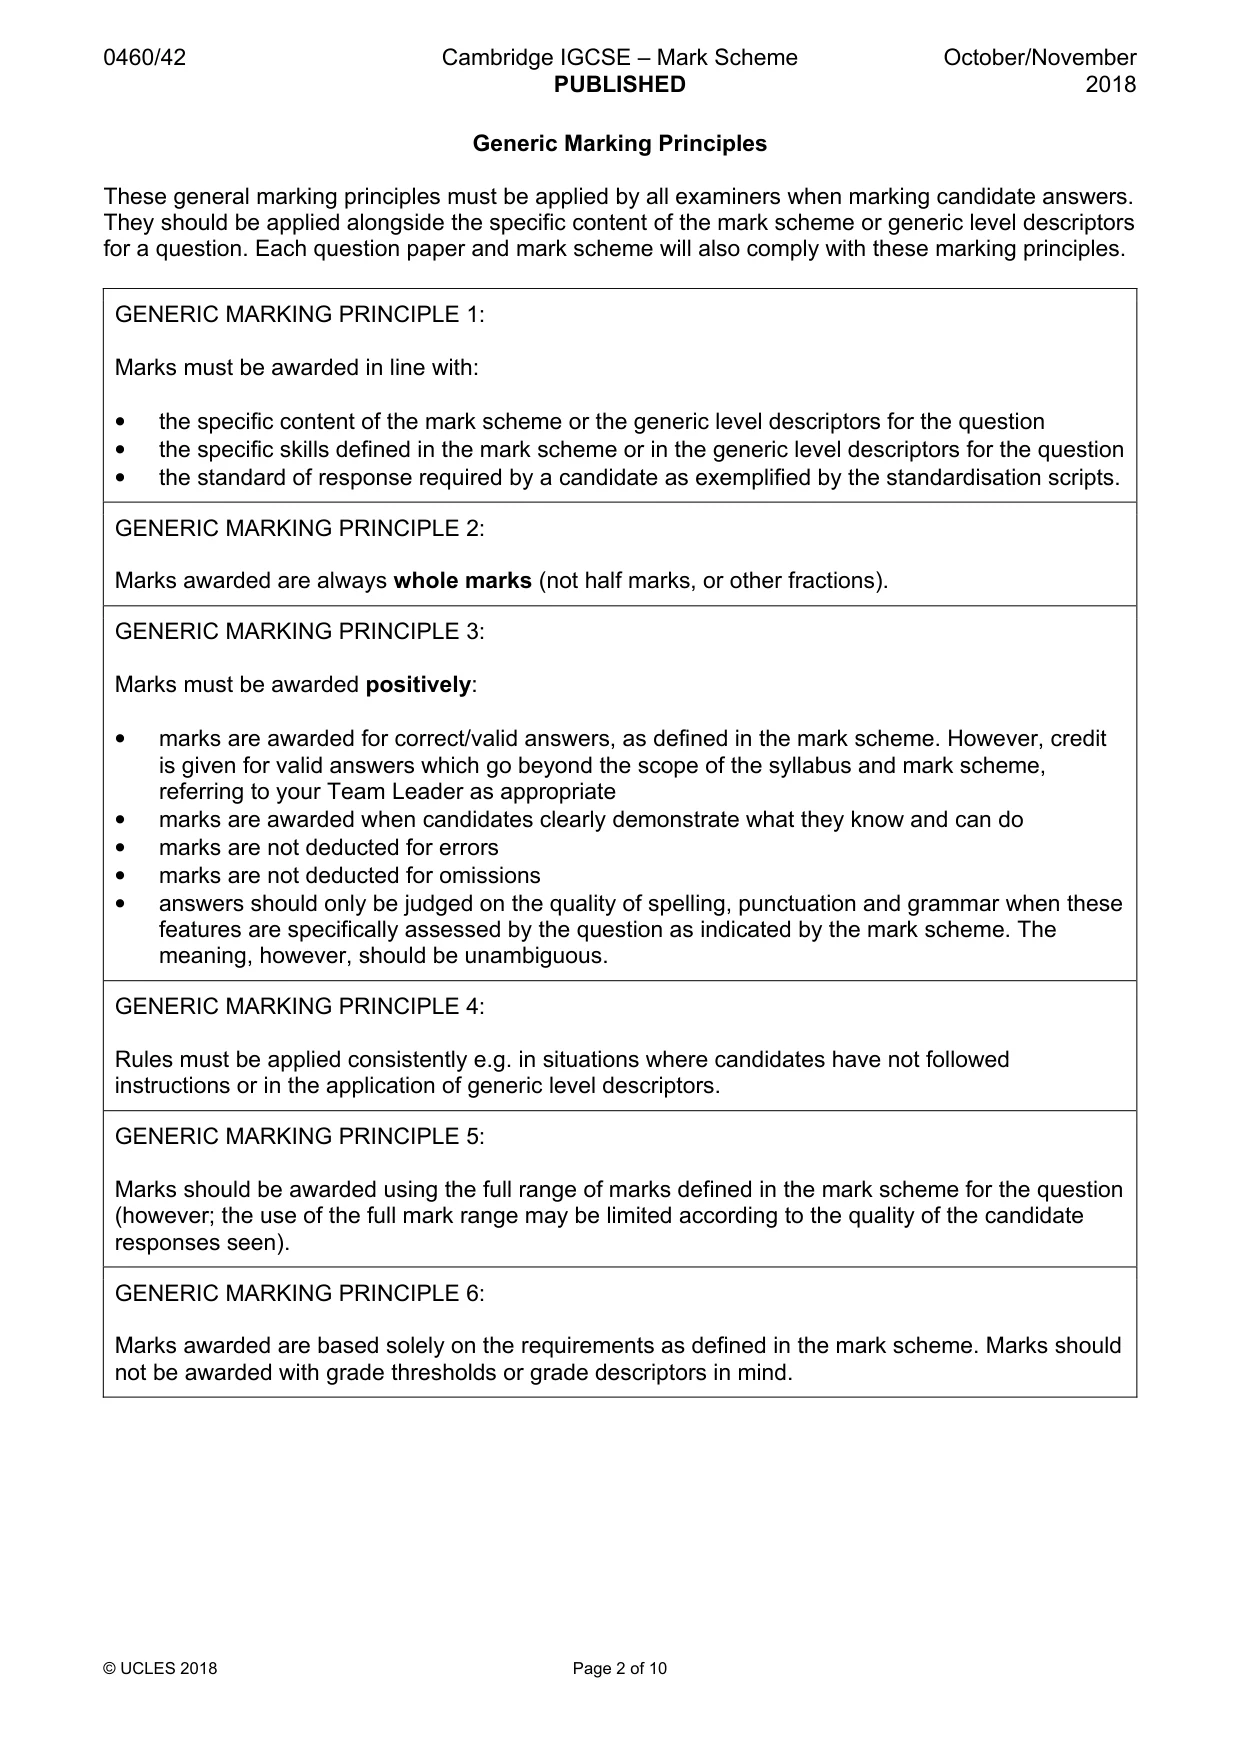
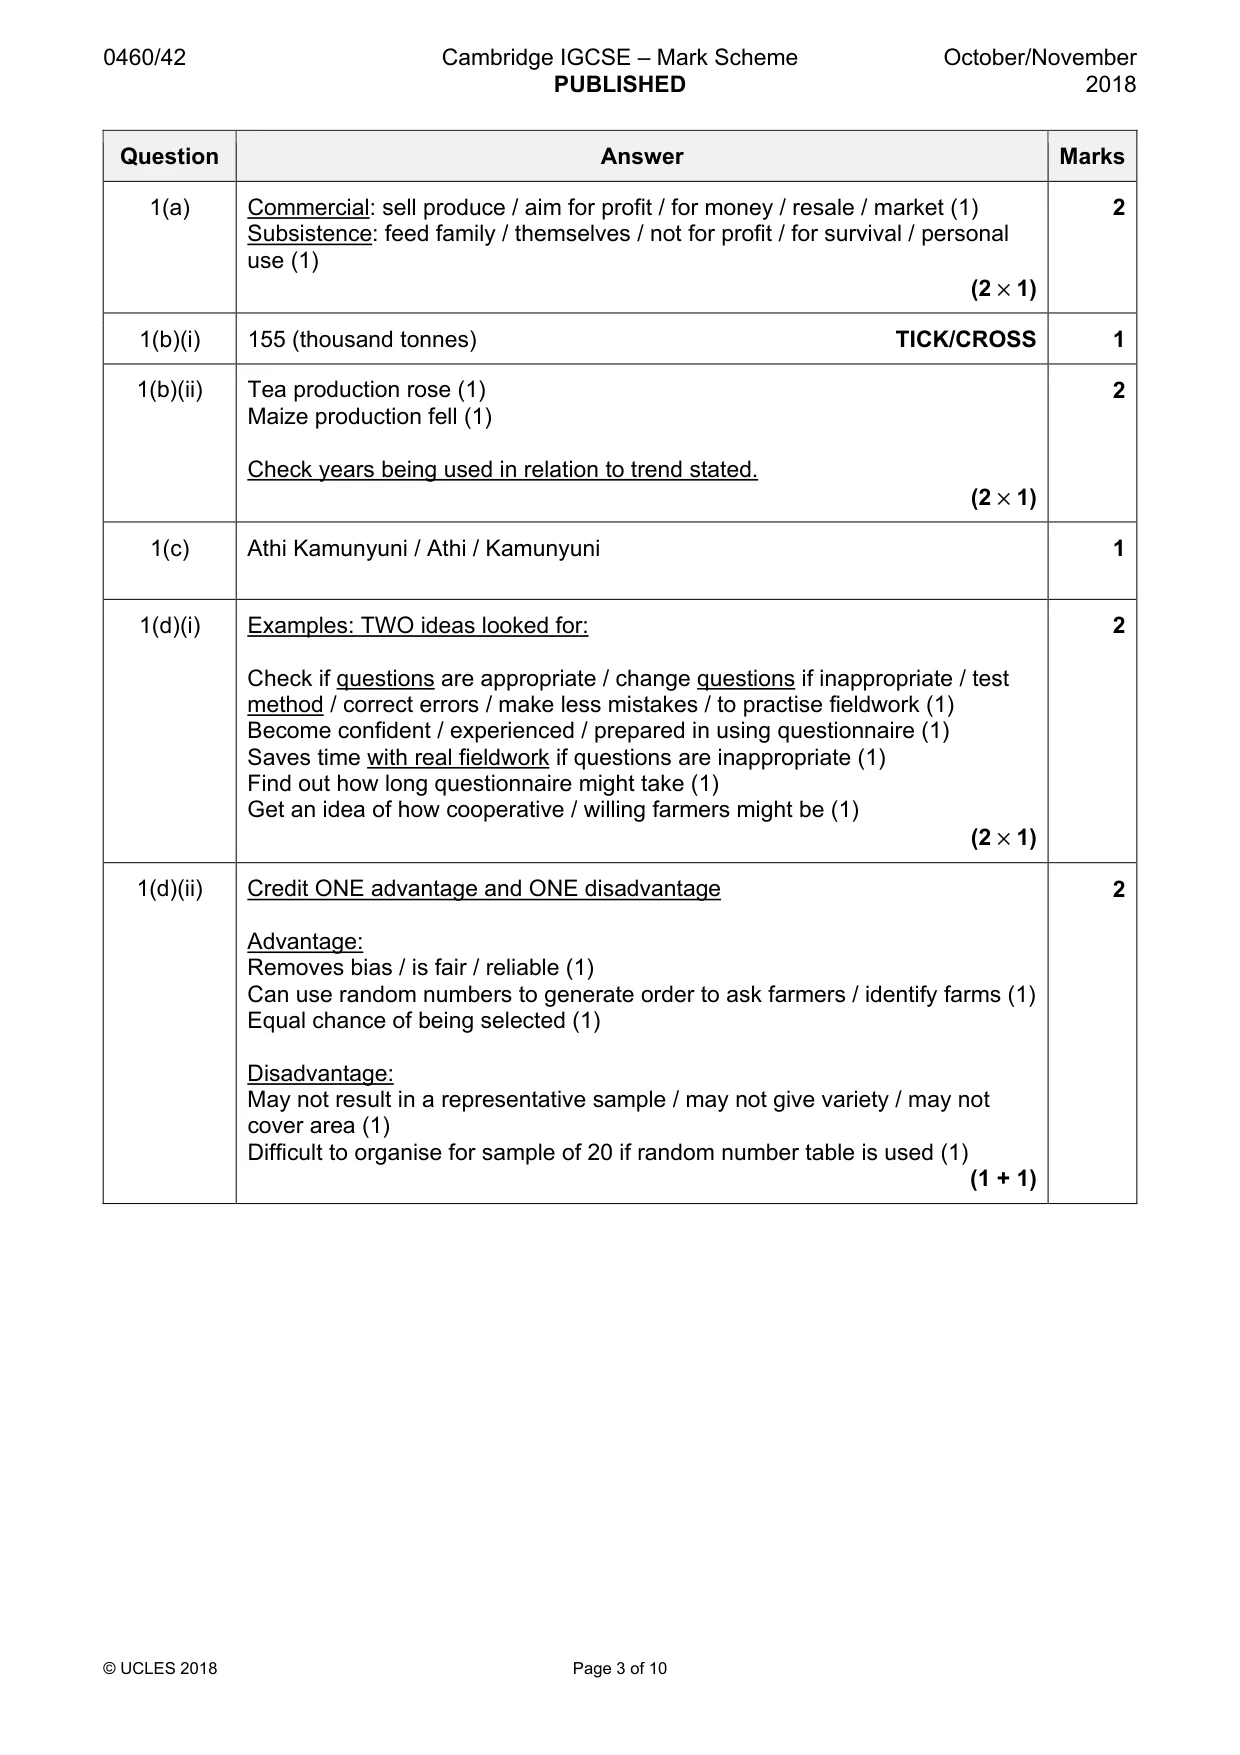
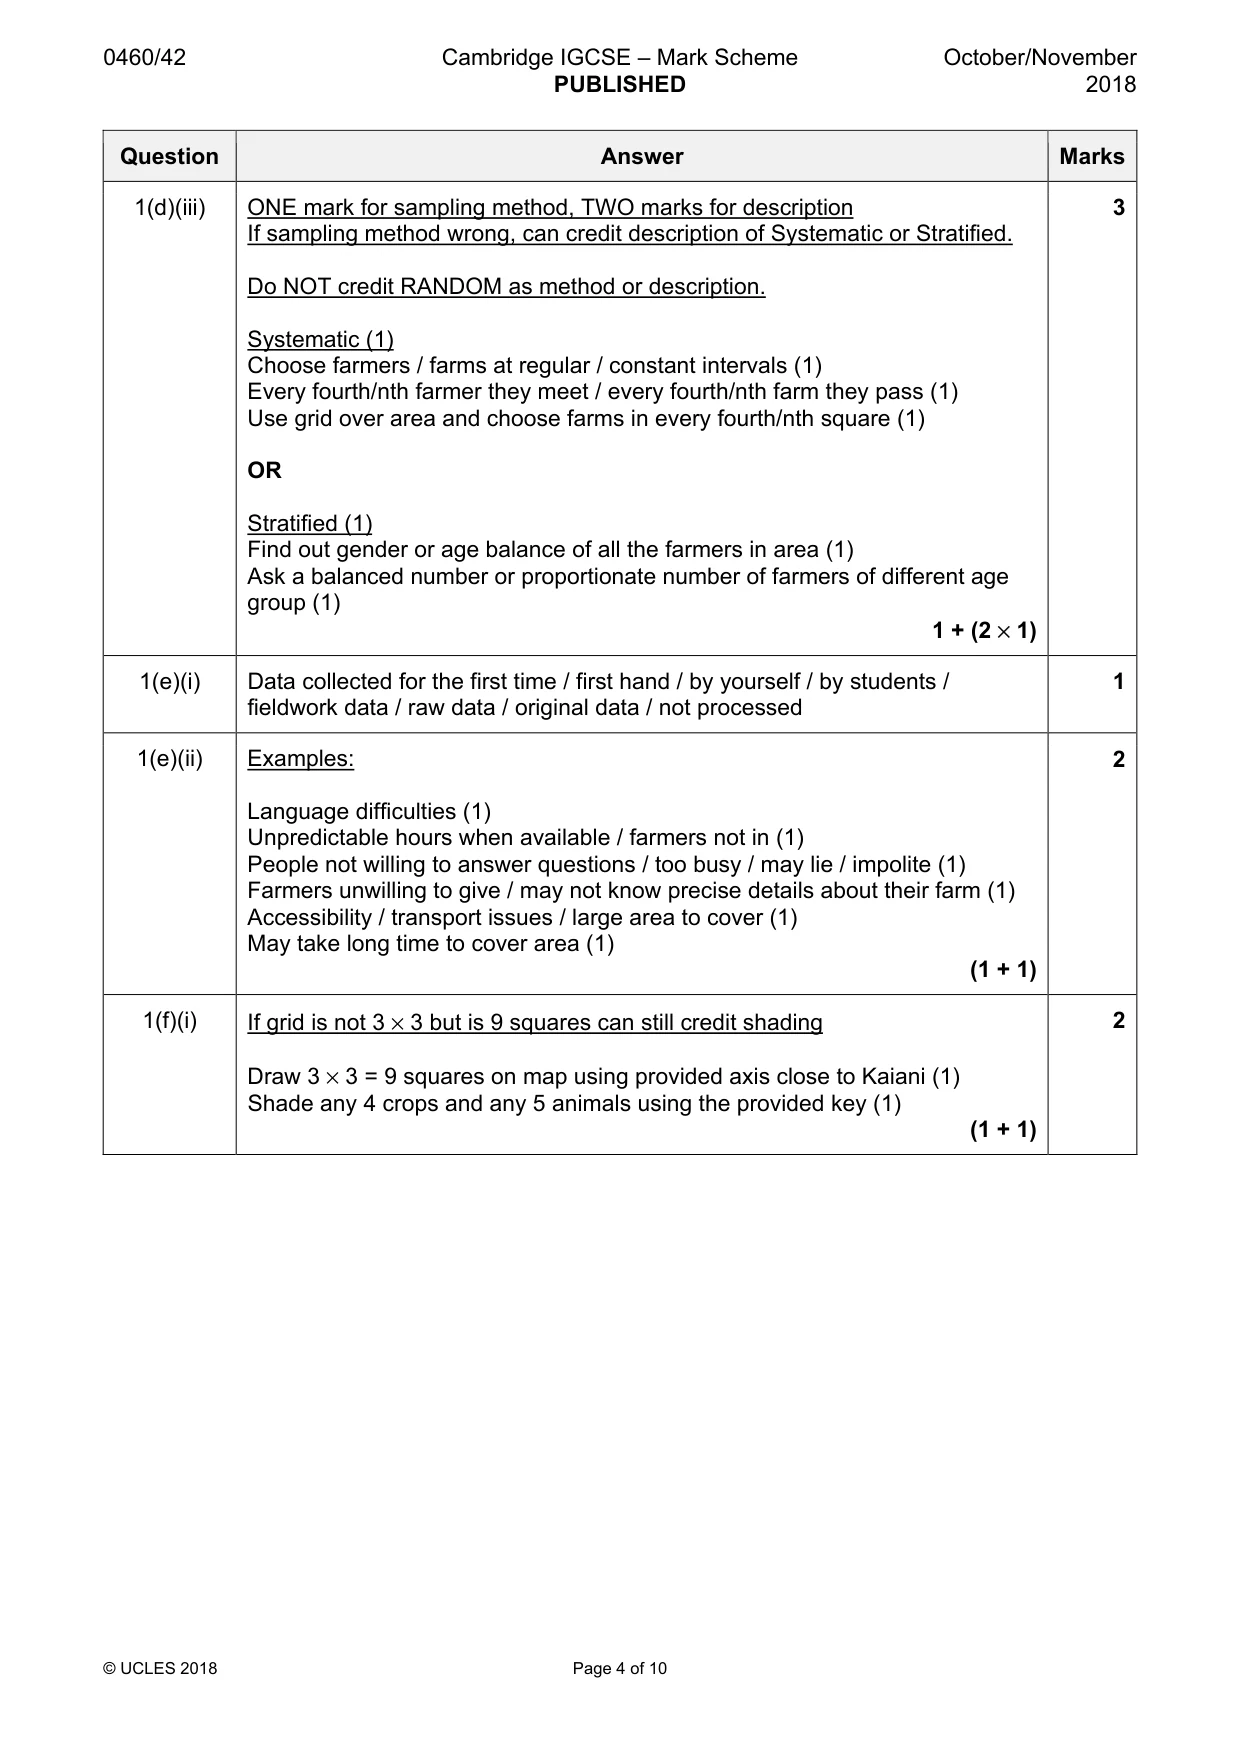
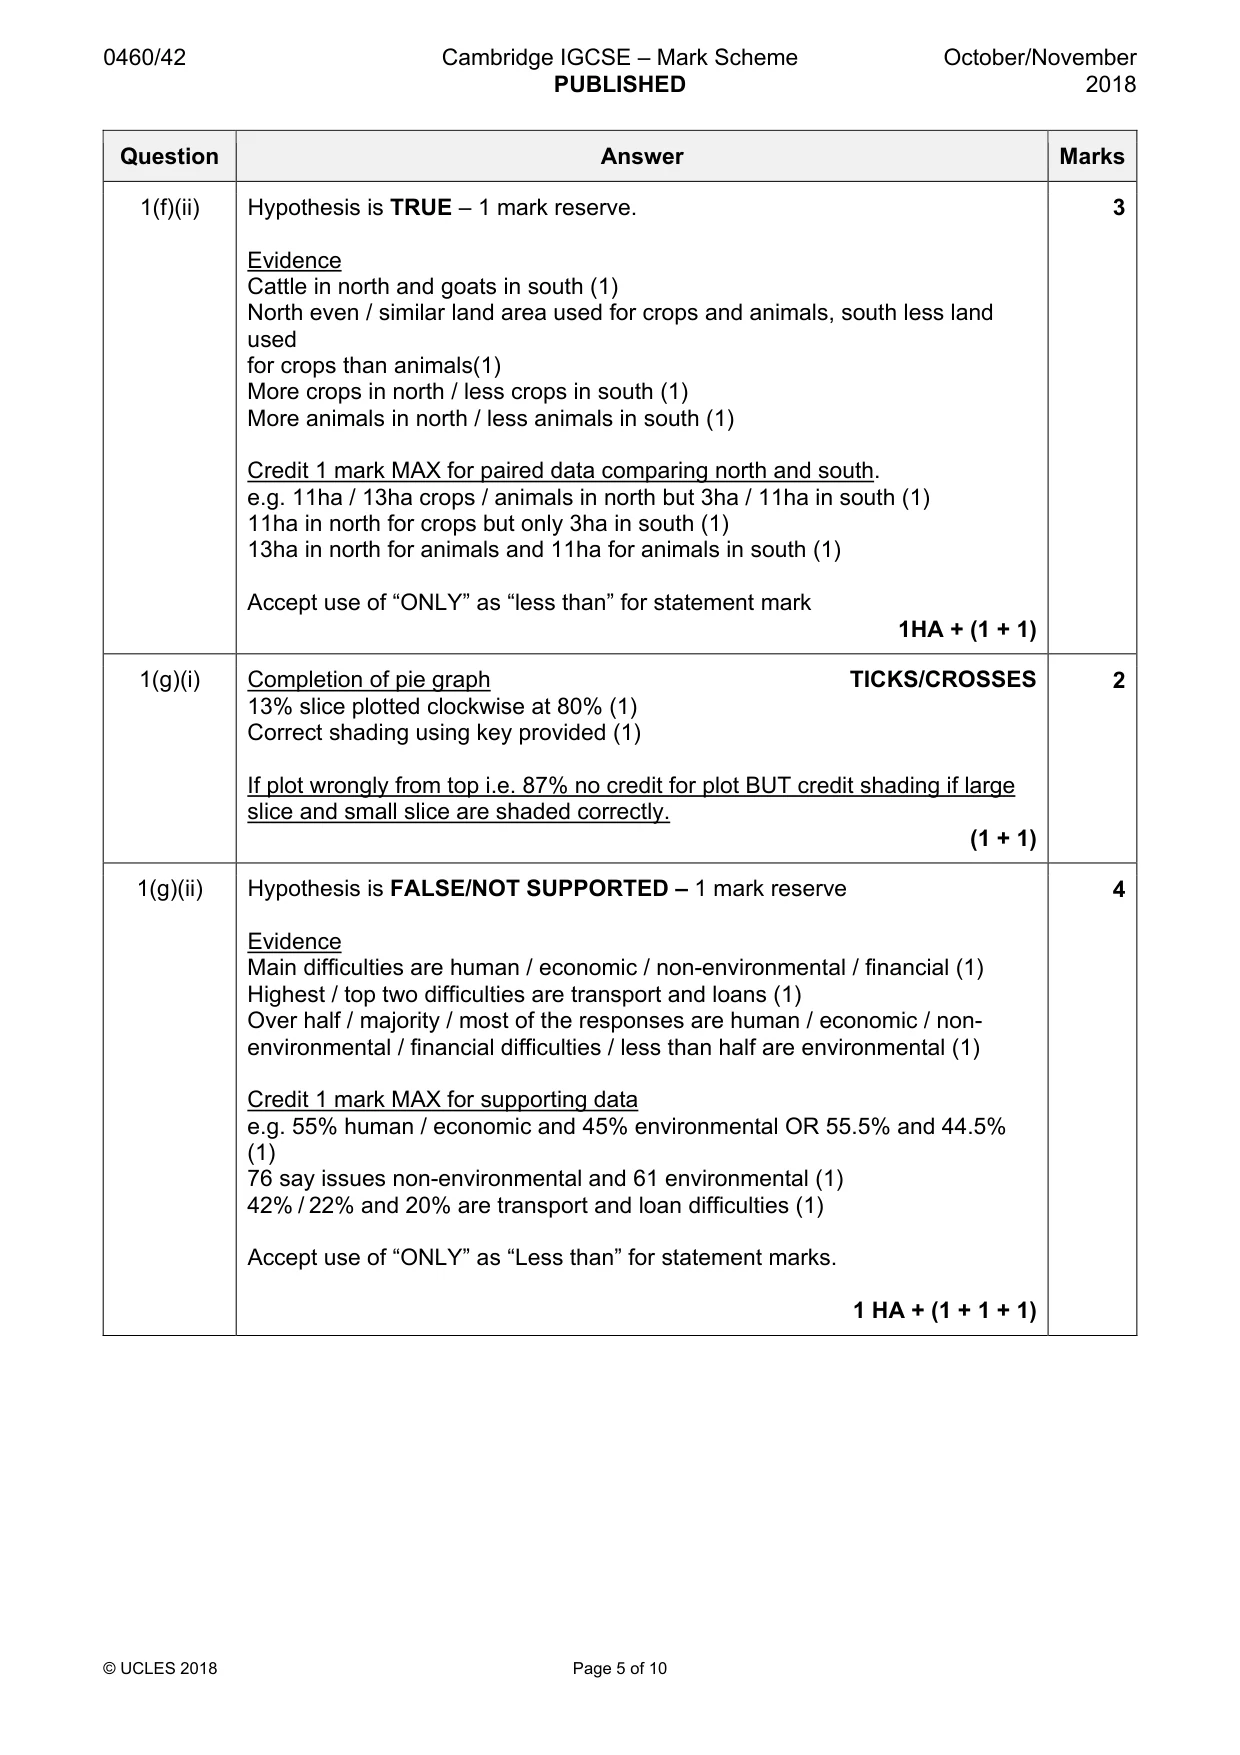
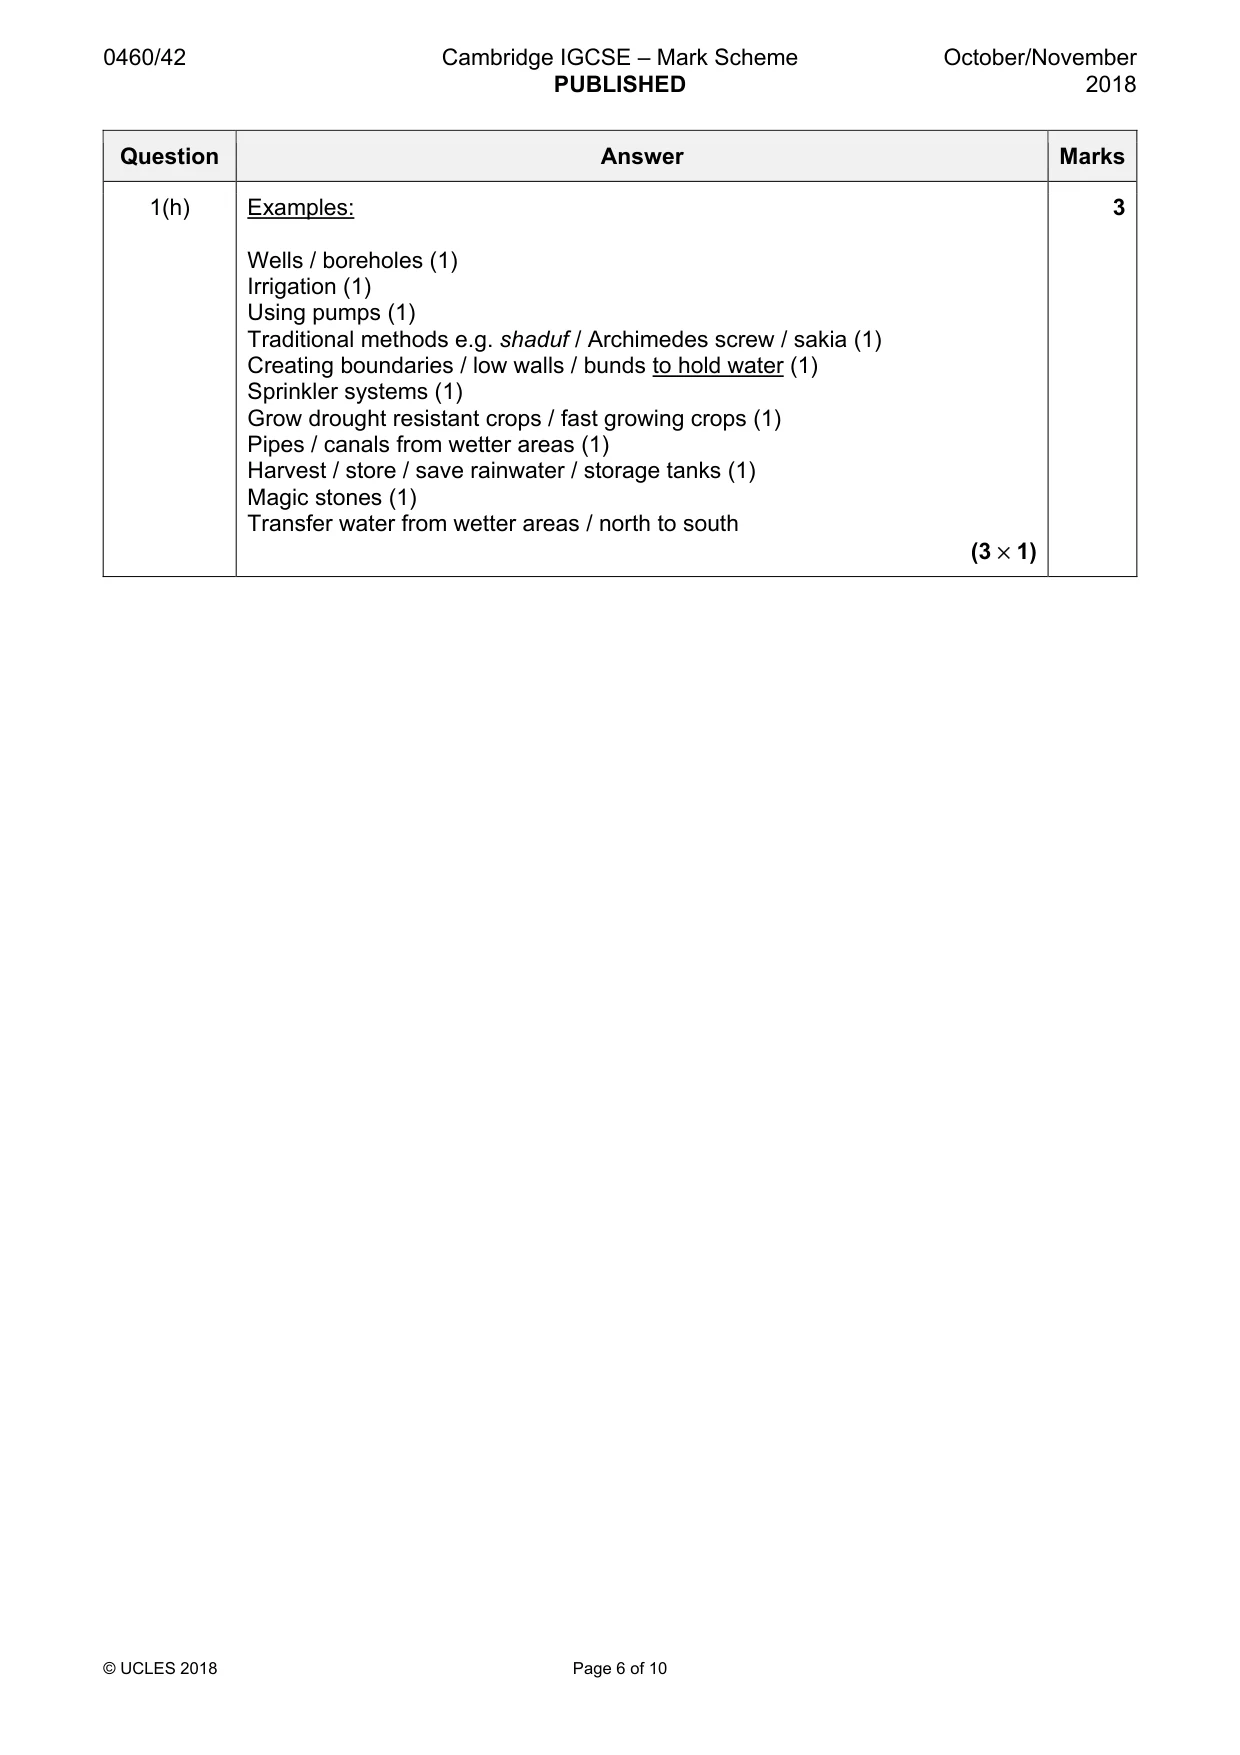
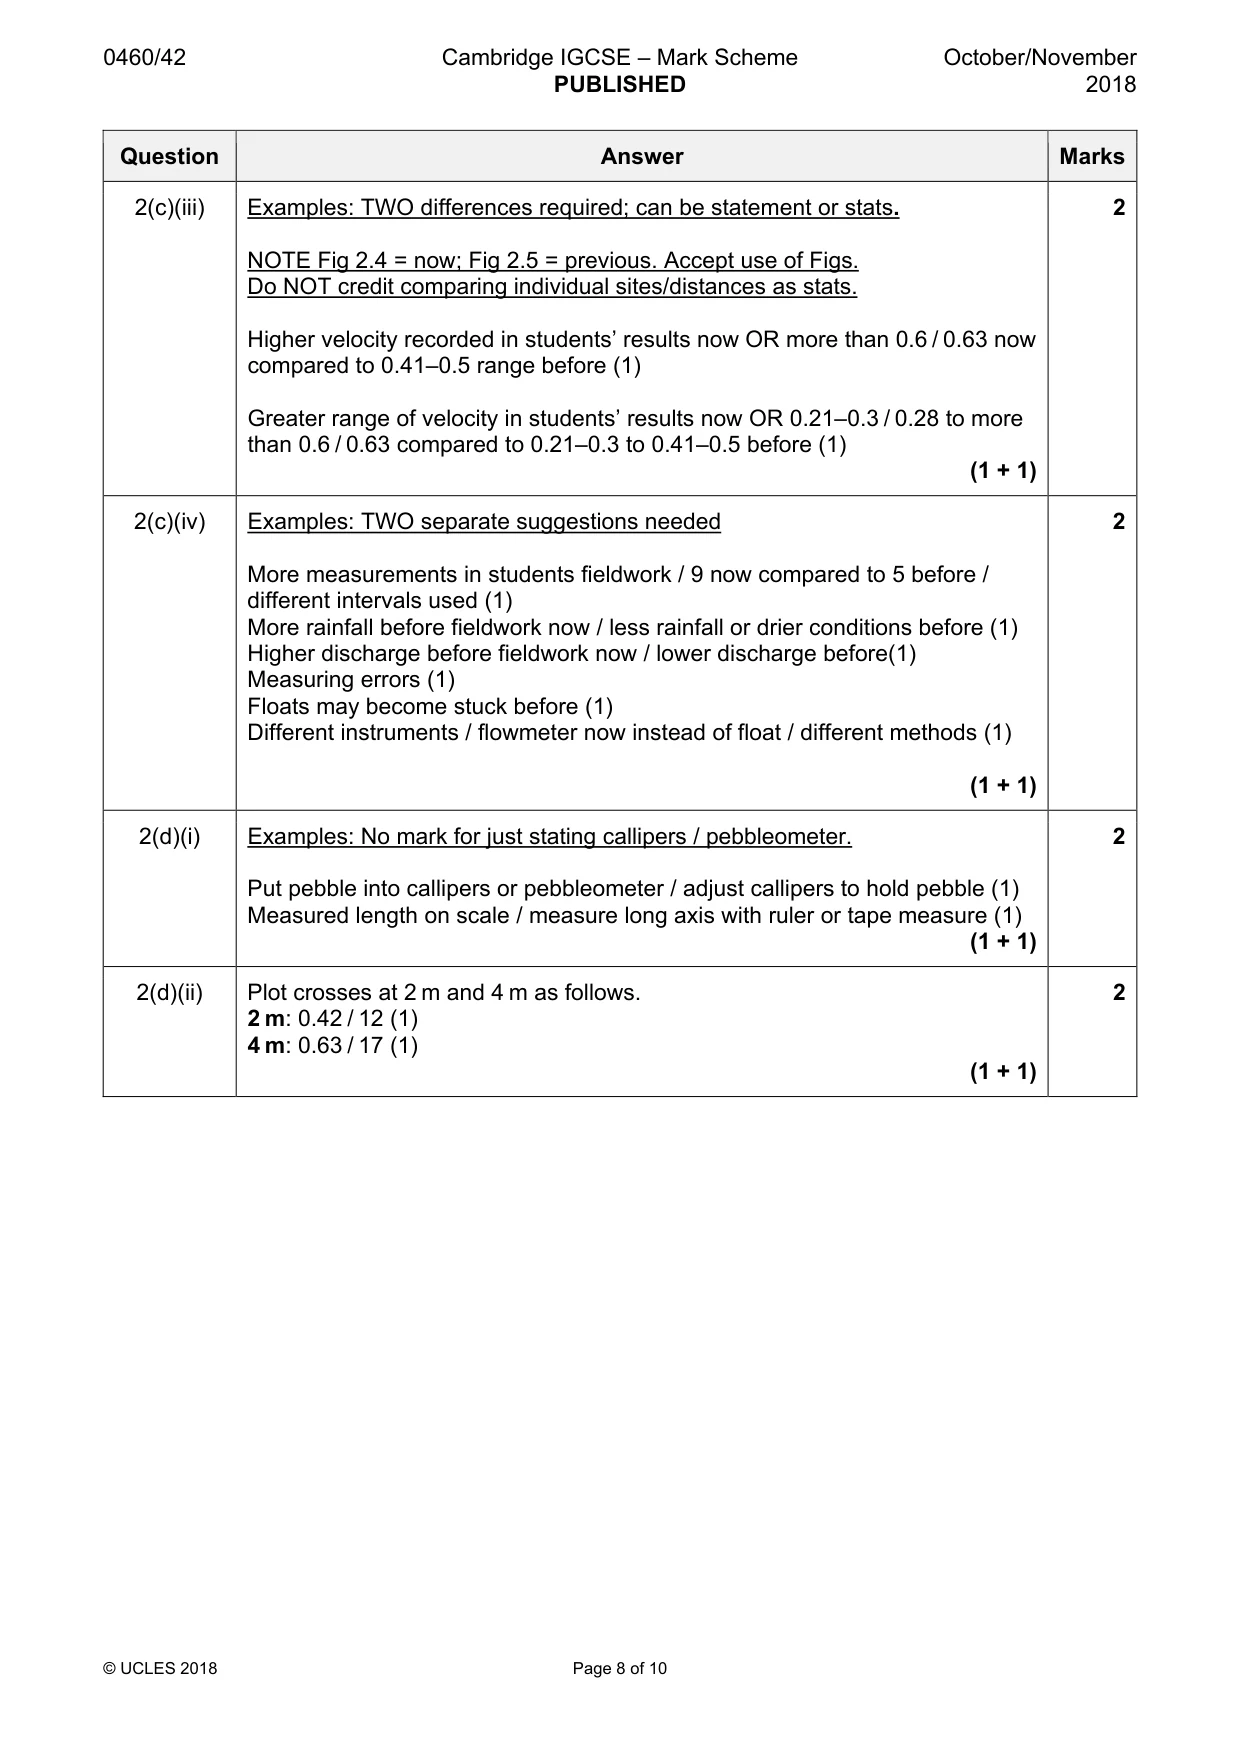
Mark scheme: Question Answer Marks 1(a) Commercial: sell produce / aim for profit / for money / resale / market (1) 2 Subsistence: feed family / themselves / not for profit / for survival / personal use (1) (2 × 1) 1(b)(i) 155 (thousand tonnes) TICK/CROSS 1 1(b)(ii) Tea production rose (1) 2 Maize production fell (1) Check years being used in relation to trend stated. (2 × 1) 1(c) Athi Kamunyuni / Athi / Kamunyuni 1 1(d)(i) Examples: TWO ideas looked for: 2 Check if questions are appropriate / change questions if inappropriate / test method / correct errors / make less mistakes / to practise fieldwork (1) Become confident / experienced / prepared in using questionnaire (1) Saves time with real fieldwork if questions are inappropriate (1) Find out how long questionnaire might take (1) Get an idea of how cooperative / willing farmers might be (1) (2 × 1) 1(d)(ii) Credit ONE advantage and ONE disadvantage 2 Advantage: Removes bias / is fair / reliable (1) Can use random numbers to generate order to ask farmers / identify farms (1) Equal chance of being selected (1) Disadvantage: May not result in a representative sample / may not give variety / may not cover area (1) Difficult to organise for sample of 20 if random number table is used (1) (1 + 1) 1(d)(iii) ONE mark for sampling method, TWO marks for description 3 If sampling method wrong, can credit description of Systematic or Stratified. Do NOT credit RANDOM as method or description. Systematic (1) Choose farmers / farms at regular / constant intervals (1) Every fourth/nth farmer they meet / every fourth/nth farm they pass (1) Use grid over area and choose farms in every fourth/nth square (1) OR Stratified (1) Find out gender or age balance of all the farmers in area (1) Ask a balanced number or proportionate number of farmers of different age group (1) 1 + (2 × 1) 1(e)(i) Data collected for the first time / first hand / by yourself / by students / 1 fieldwork data / raw data / original data / not processed 1(e)(ii) Examples: 2 Language difficulties (1) Unpredictable hours when available / farmers not in (1) People not willing to answer questions / too busy / may lie / impolite (1) Farmers unwilling to give / may not know precise details about their farm (1) Accessibility / transport issues / large area to cover (1) May take long time to cover area (1) (1 + 1) 1(f)(i) If grid is not 3 × 3 but is 9 squares can still credit shading 2 Draw 3 × 3 = 9 squares on map using provided axis close to Kaiani (1) Shade any 4 crops and any 5 animals using the provided key (1) (1 + 1) 1(f)(ii) Hypothesis is TRUE – 1 mark reserve. 3 Evidence Cattle in north and goats in south (1) North even / similar land area used for crops and animals, south less land used for crops than animals(1) More crops in north / less crops in south (1) More animals in north / less animals in south (1) Credit 1 mark MAX for paired data comparing north and south. e.g. 11ha / 13ha crops / animals in north but 3ha / 11ha in south (1) 11ha in north for crops but only 3ha in south (1) 13ha in north for animals and 11ha for animals in south (1) Accept use of “ONLY” as “less than” for statement mark 1HA + (1 + 1) 1(g)(i) Completion of pie graph TICKS/CROSSES 2 13% slice plotted clockwise at 80% (1) Correct shading using key provided (1) If plot wrongly from top i.e. 87% no credit for plot BUT credit shading if large slice and small slice are shaded correctly. (1 + 1) 1(g)(ii) Hypothesis is FALSE/NOT SUPPORTED – 1 mark reserve 4 Evidence Main difficulties are human / economic / non-environmental / financial (1) Highest / top two difficulties are transport and loans (1) Over half / majority / most of the responses are human / economic / non- environmental / financial difficulties / less than half are environmental (1) Credit 1 mark MAX for supporting data e.g. 55% human / economic and 45% environmental OR 55.5% and 44.5% (1) 76 say issues non-environmental and 61 environmental (1) 42% / 22% and 20% are transport and loan difficulties (1) Accept use of “ONLY” as “Less than” for statement marks. 1 HA + (1 + 1 + 1) 1(h) Examples: 3 Wells / boreholes (1) Irrigation (1) Using pumps (1) Traditional methods e.g. shaduf / Archimedes screw / sakia (1) Creating boundaries / low walls / bunds to hold water (1) Sprinkler systems (1) Grow drought resistant crops / fast growing crops (1) Pipes / canals from wetter areas (1) Harvest / store / save rainwater / storage tanks (1) Magic stones (1) Transfer water from wetter areas / north to south (3 × 1)
Q2 · Students were planning fieldwork on a local river
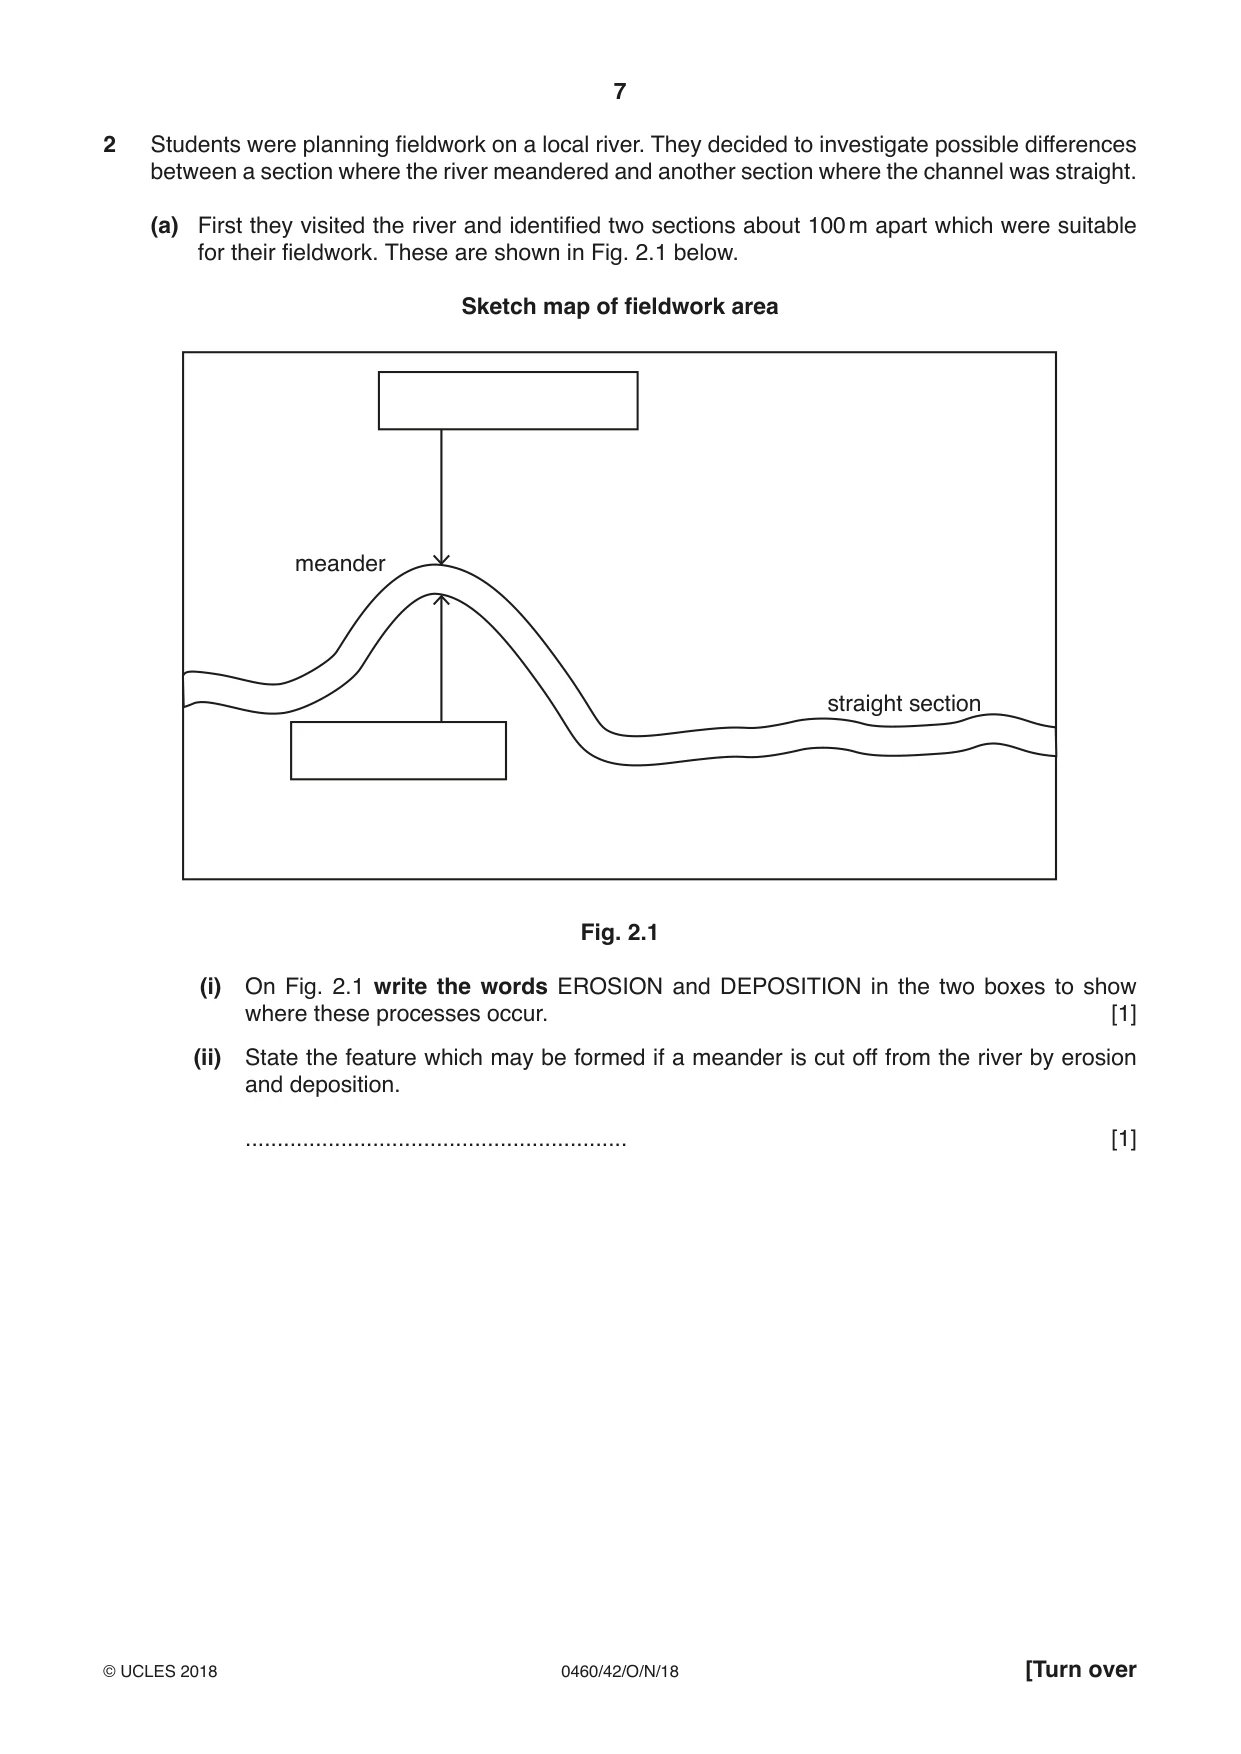
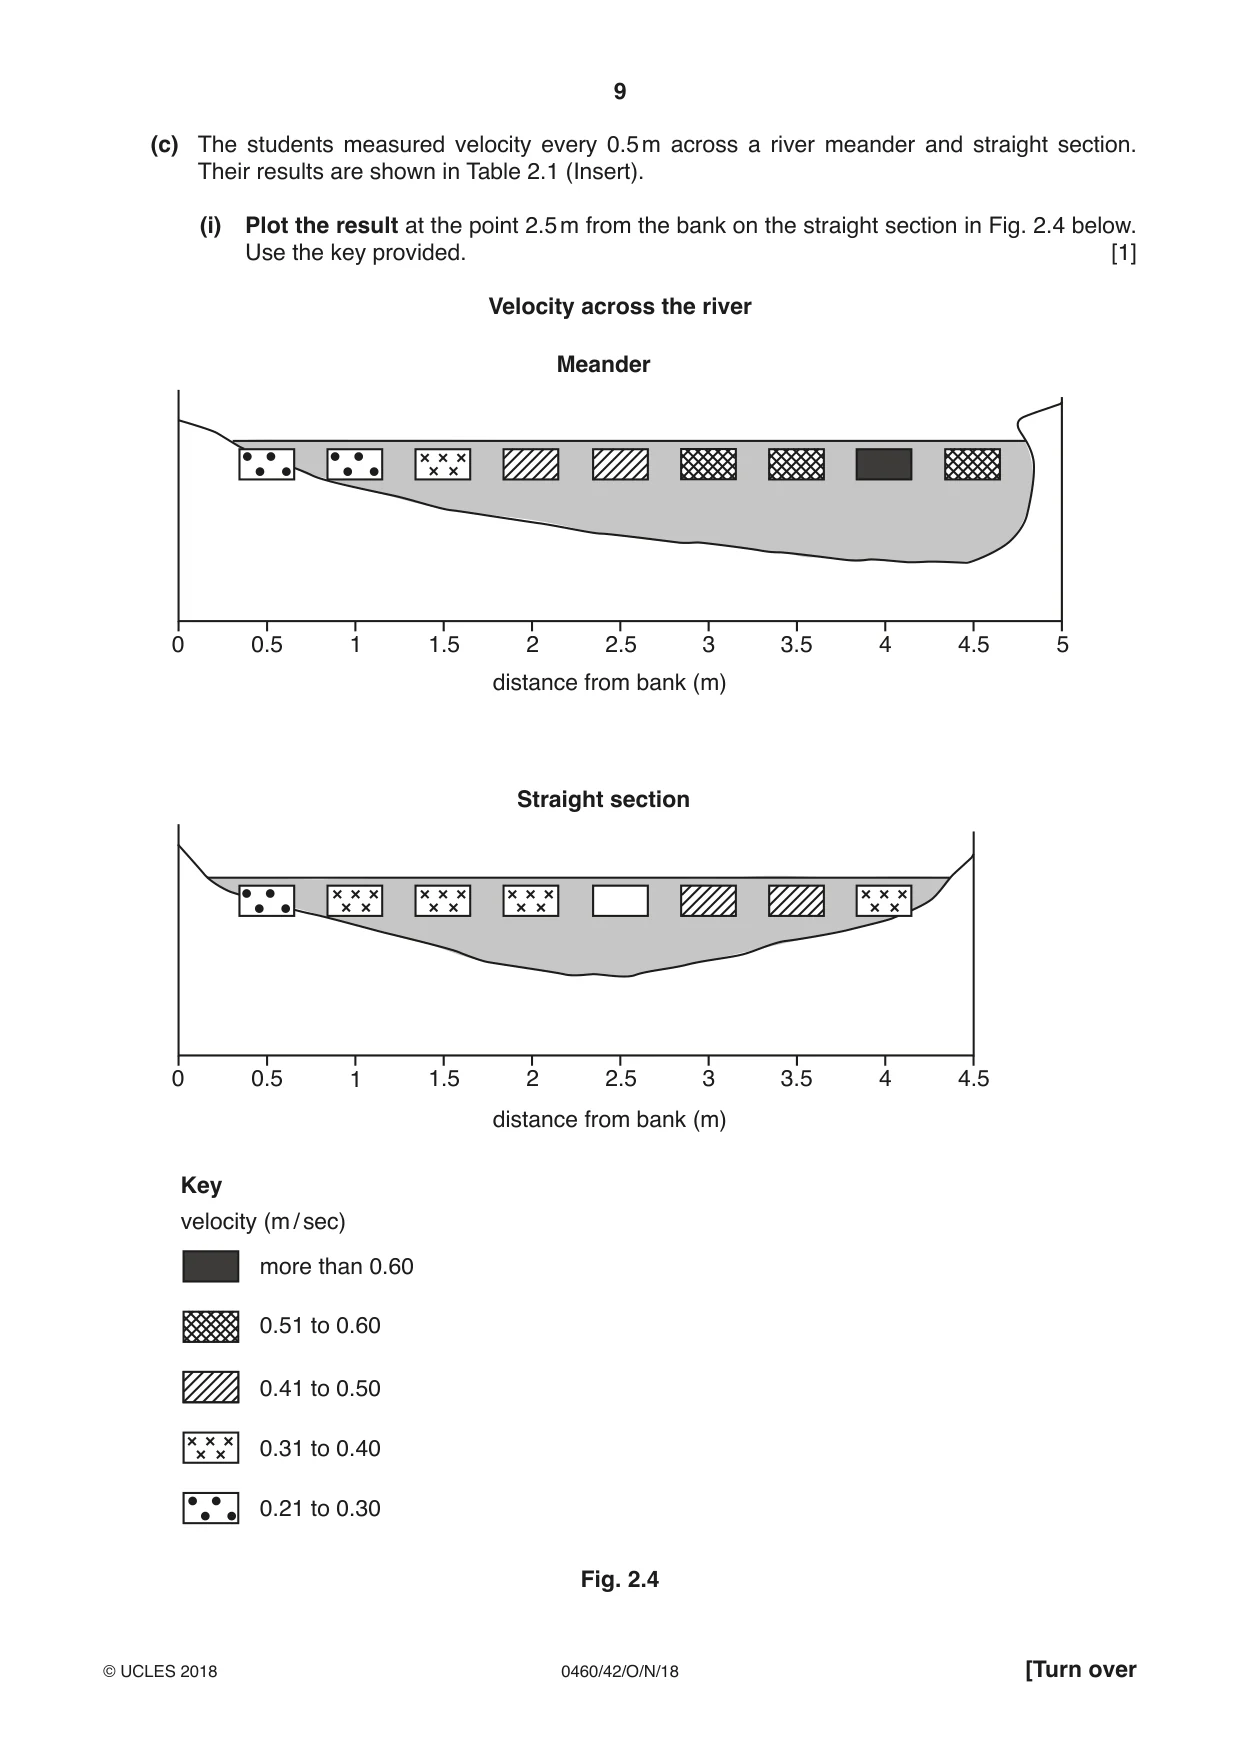
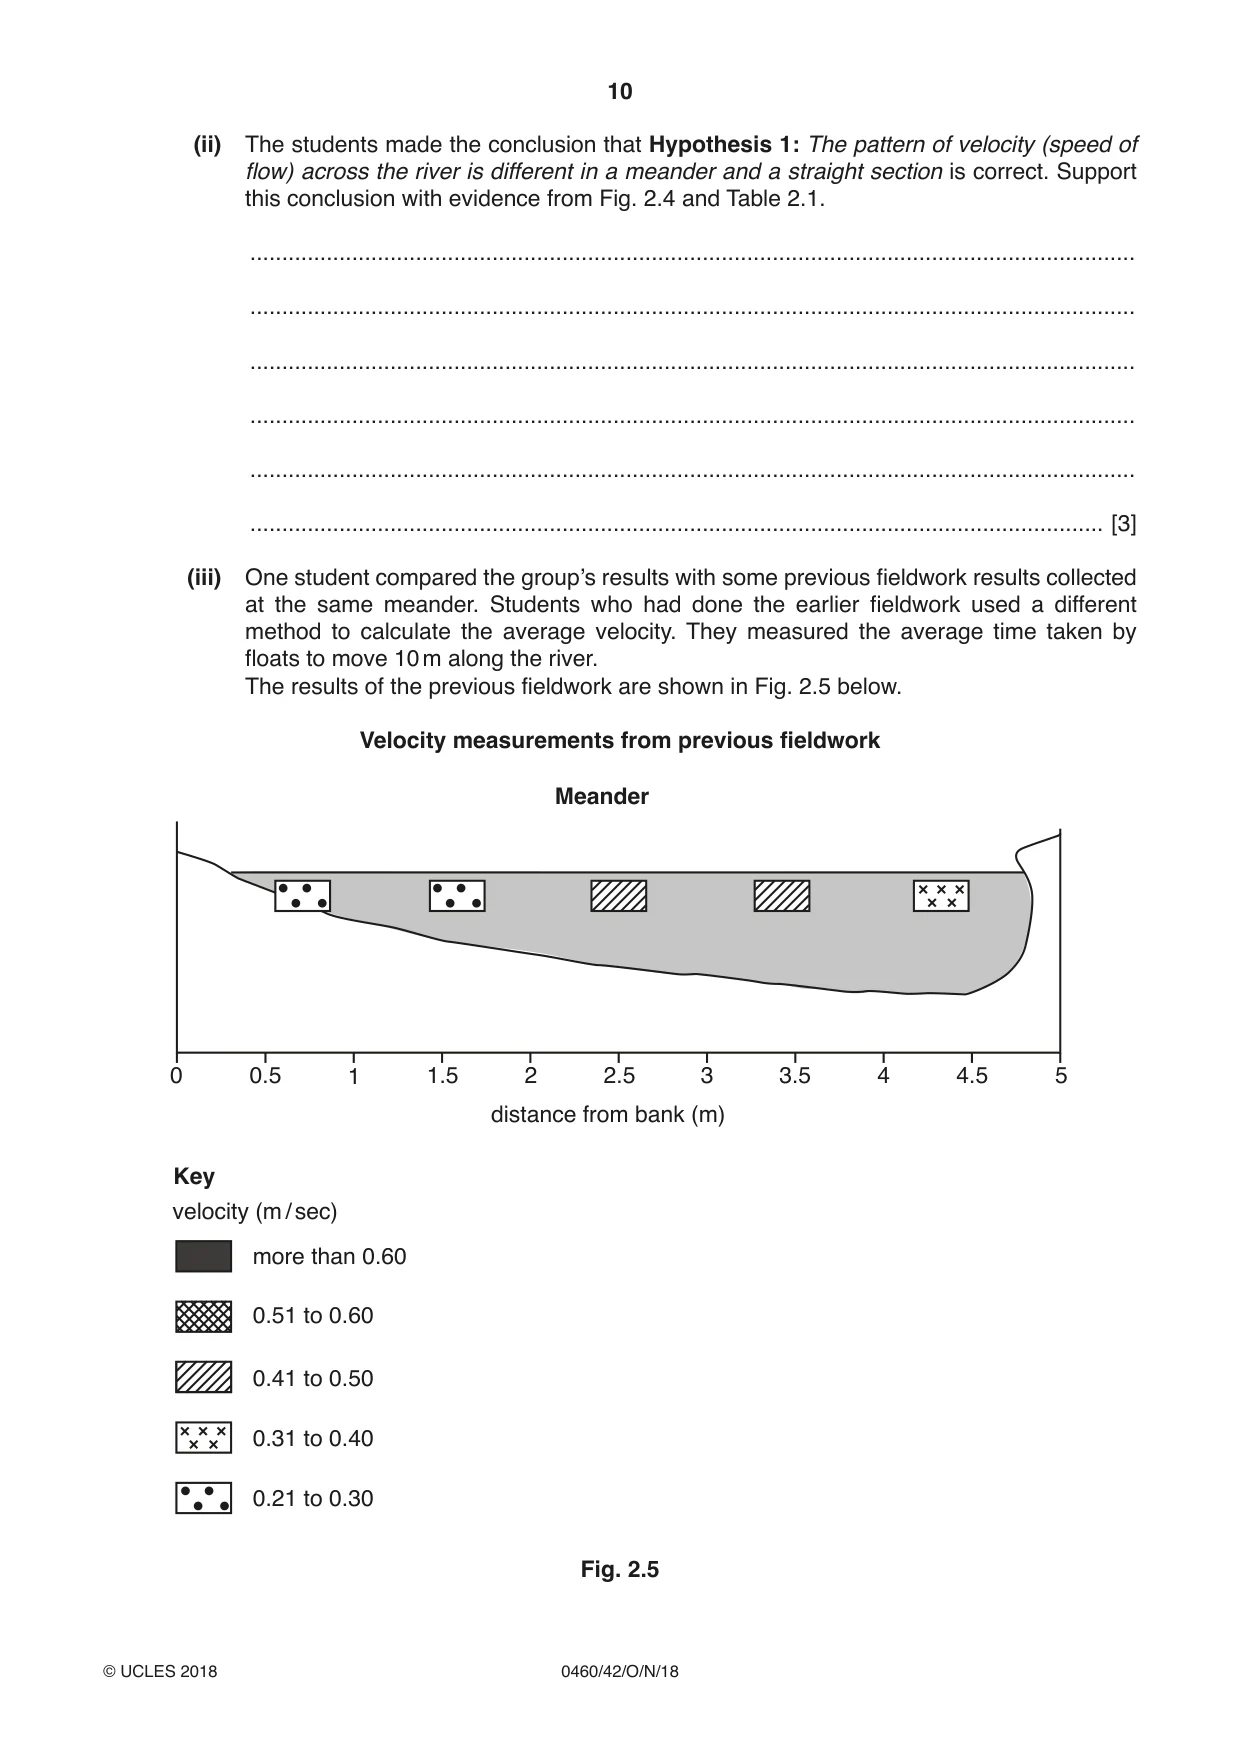
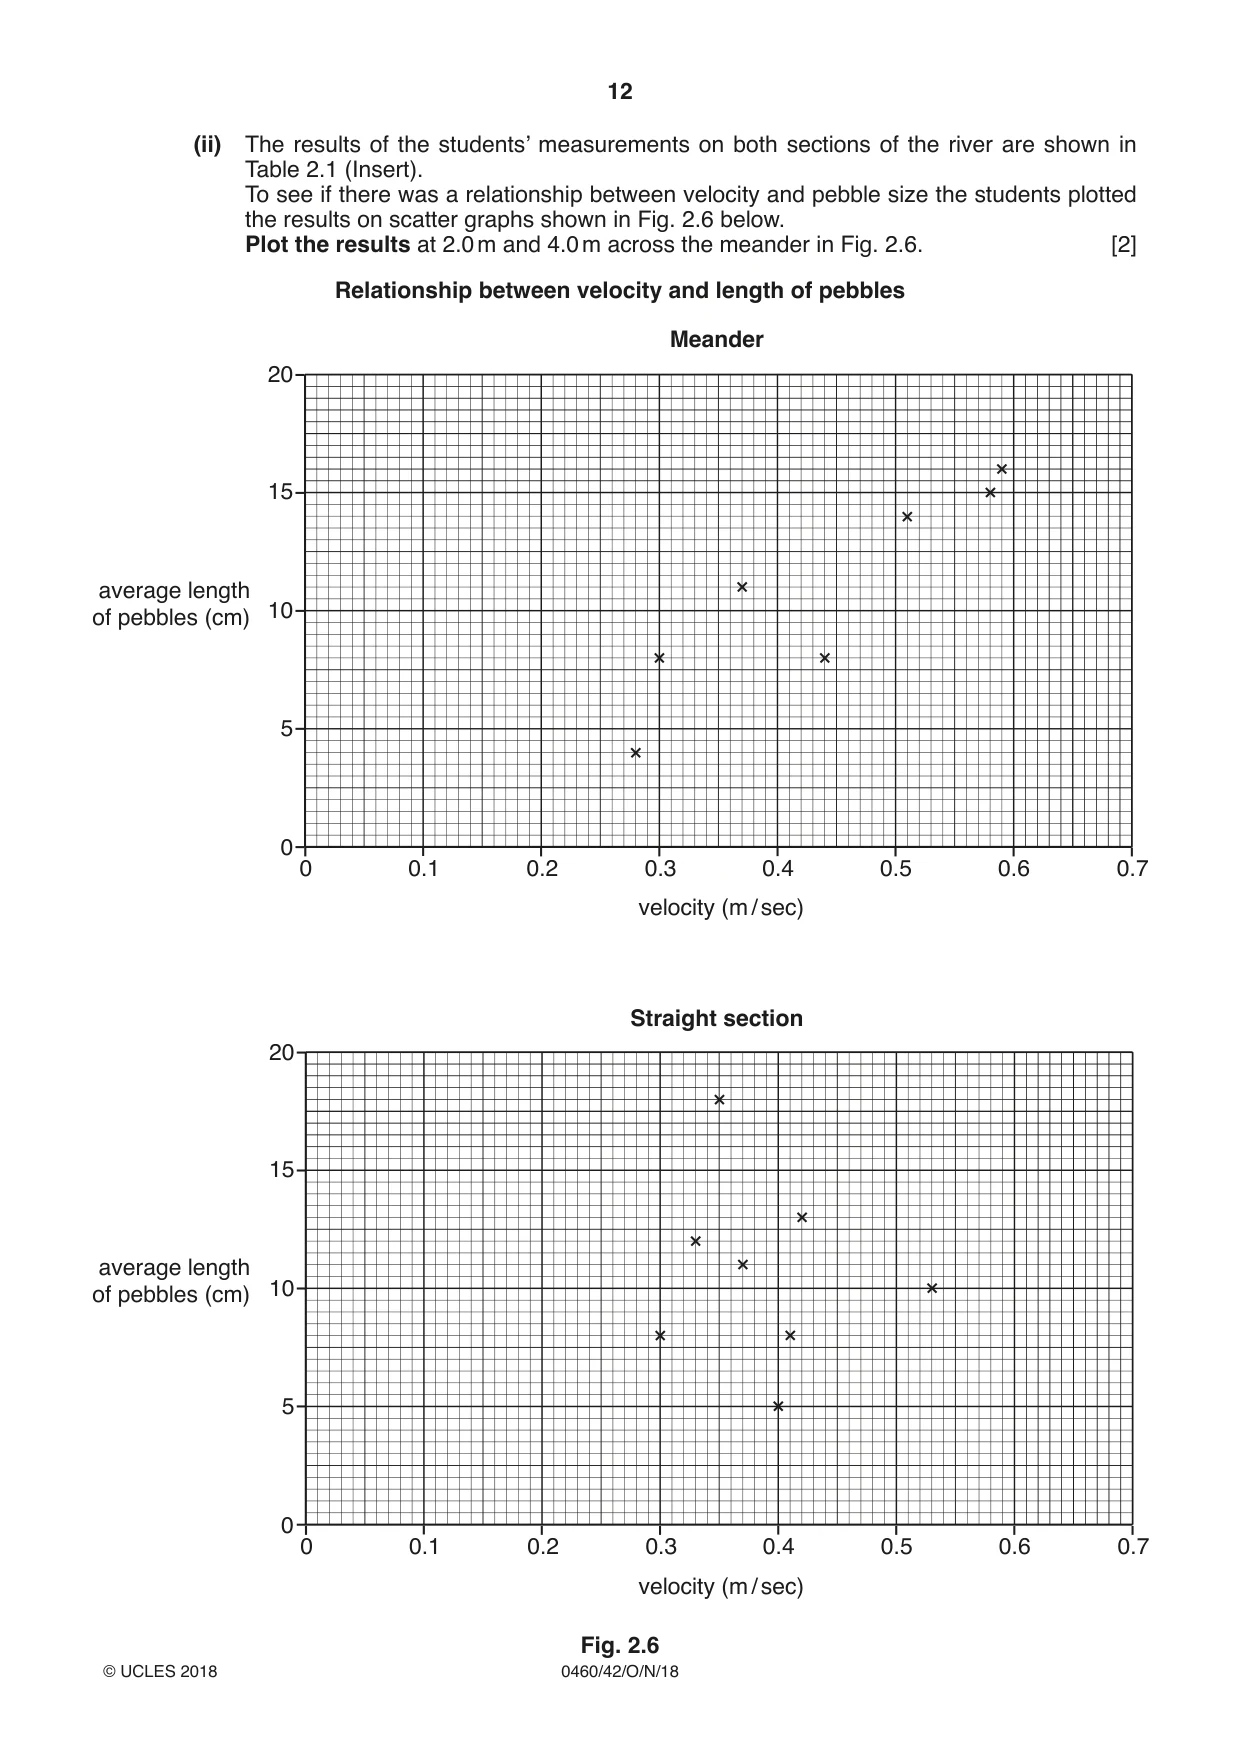
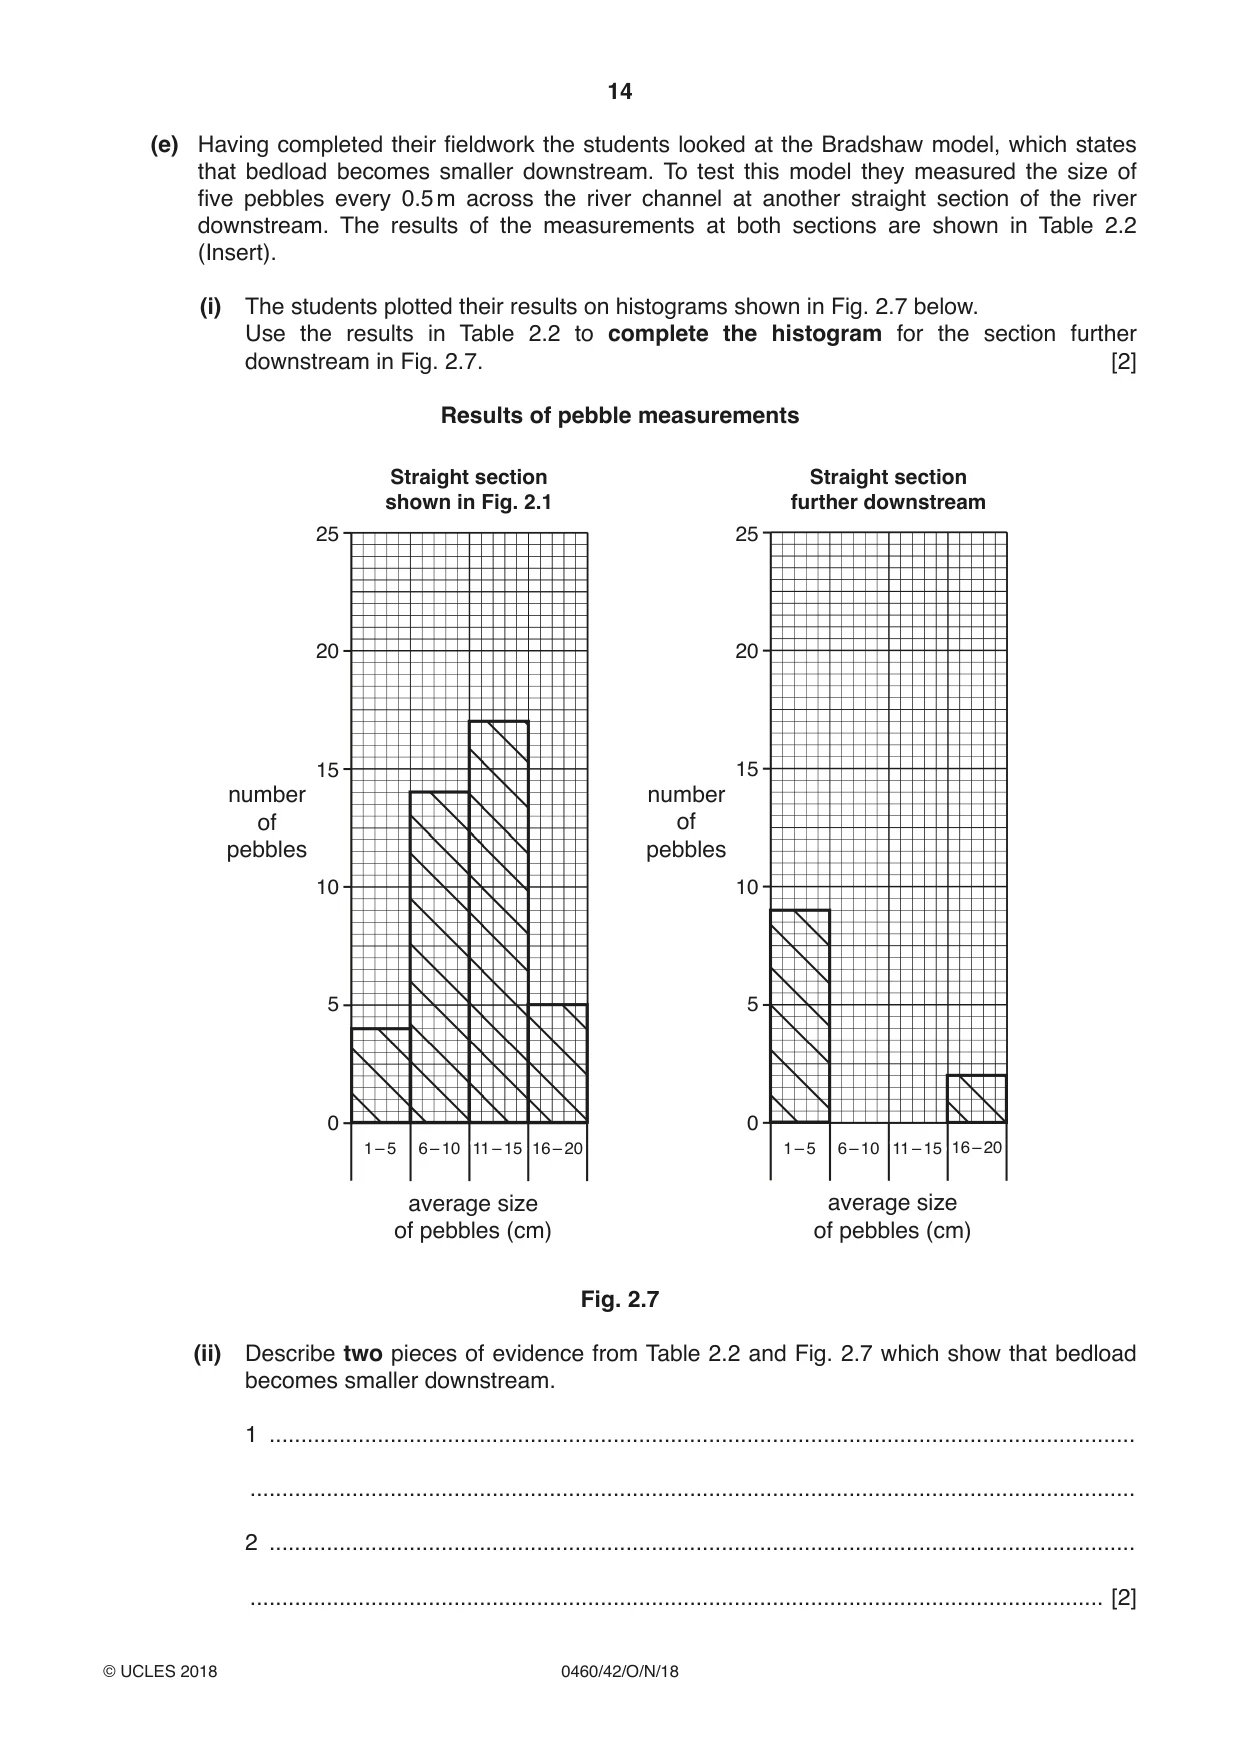
2 Students were planning fieldwork on a local river. They decided to investigate possible differences between a section where the river meandered and another section where the channel was straight. (a) First they visited the river and identified two sections about 100 m apart which were suitable for their fieldwork. These are shown in Fig. 2.1 below. Sketch map of fieldwork area meander straight section Fig. 2.1 (i) On Fig. 2.1 write the words EROSION and DEPOSITION in the two boxes to show where these processes occur. [1] (ii) State the feature which may be formed if a meander is cut off from the river by erosion and deposition. ............................................................ [1] The students investigated the following hypotheses: Hypothesis 1: The pattern of velocity (speed of flow) across the river is different in a meander and a straight section. Hypothesis 2: Pebbles on the river bed (bedload) are larger where velocity is faster. (b) To investigate Hypothesis 1 the students measured velocity using a flowmeter, as shown in Figs. 2.2 and 2.3 (Insert). (i) Describe how the students used a flowmeter to measure velocity. ........................................................................................................................................... ........................................................................................................................................... ........................................................................................................................................... ...................................................................................................................................... [2] (ii) Give one advantage and one disadvantage of this method. Advantage ........................................................................................................................................... ........................................................................................................................................... Disadvantage ........................................................................................................................................... ...................................................................................................................................... [2] (c) The students measured velocity every 0.5 m across a river meander and straight section. Their results are shown in Table 2.1 (Insert). (i) Plot the result at the point 2.5 m from the bank on the straight section in Fig. 2.4 below. Use the key provided. [1] Velocity across the river Meander 0 0.5 1 1.5 2 2.5 3 3.5 4 4.5 5 distance from bank (m) Straight section 0 0.5 1 1.5 2 2.5 3 3.5 4 4.5 distance from bank (m) Key velocity (m / sec) more than 0.60 0.51 to 0.60 0.41 to 0.50 0.31 to 0.40 0.21 to 0.30 Fig. 2.4
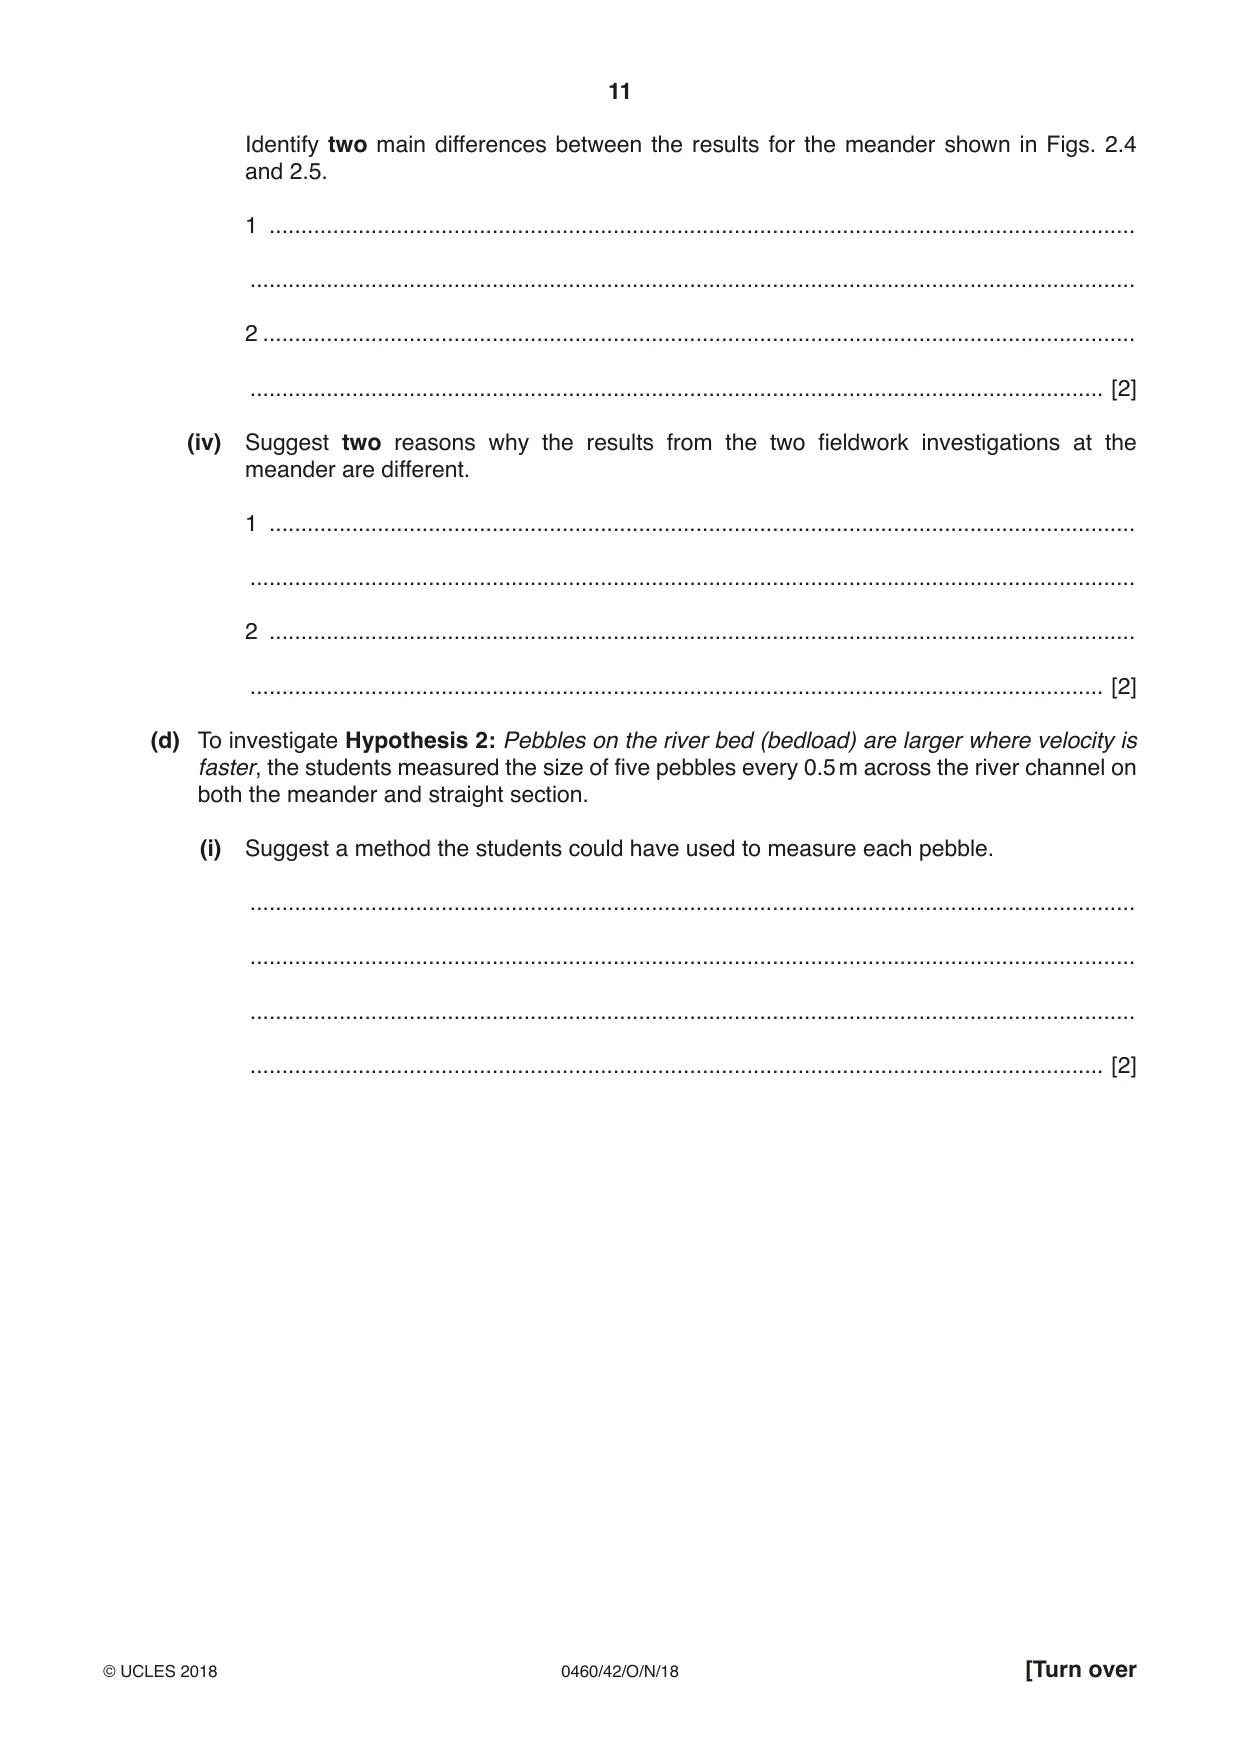
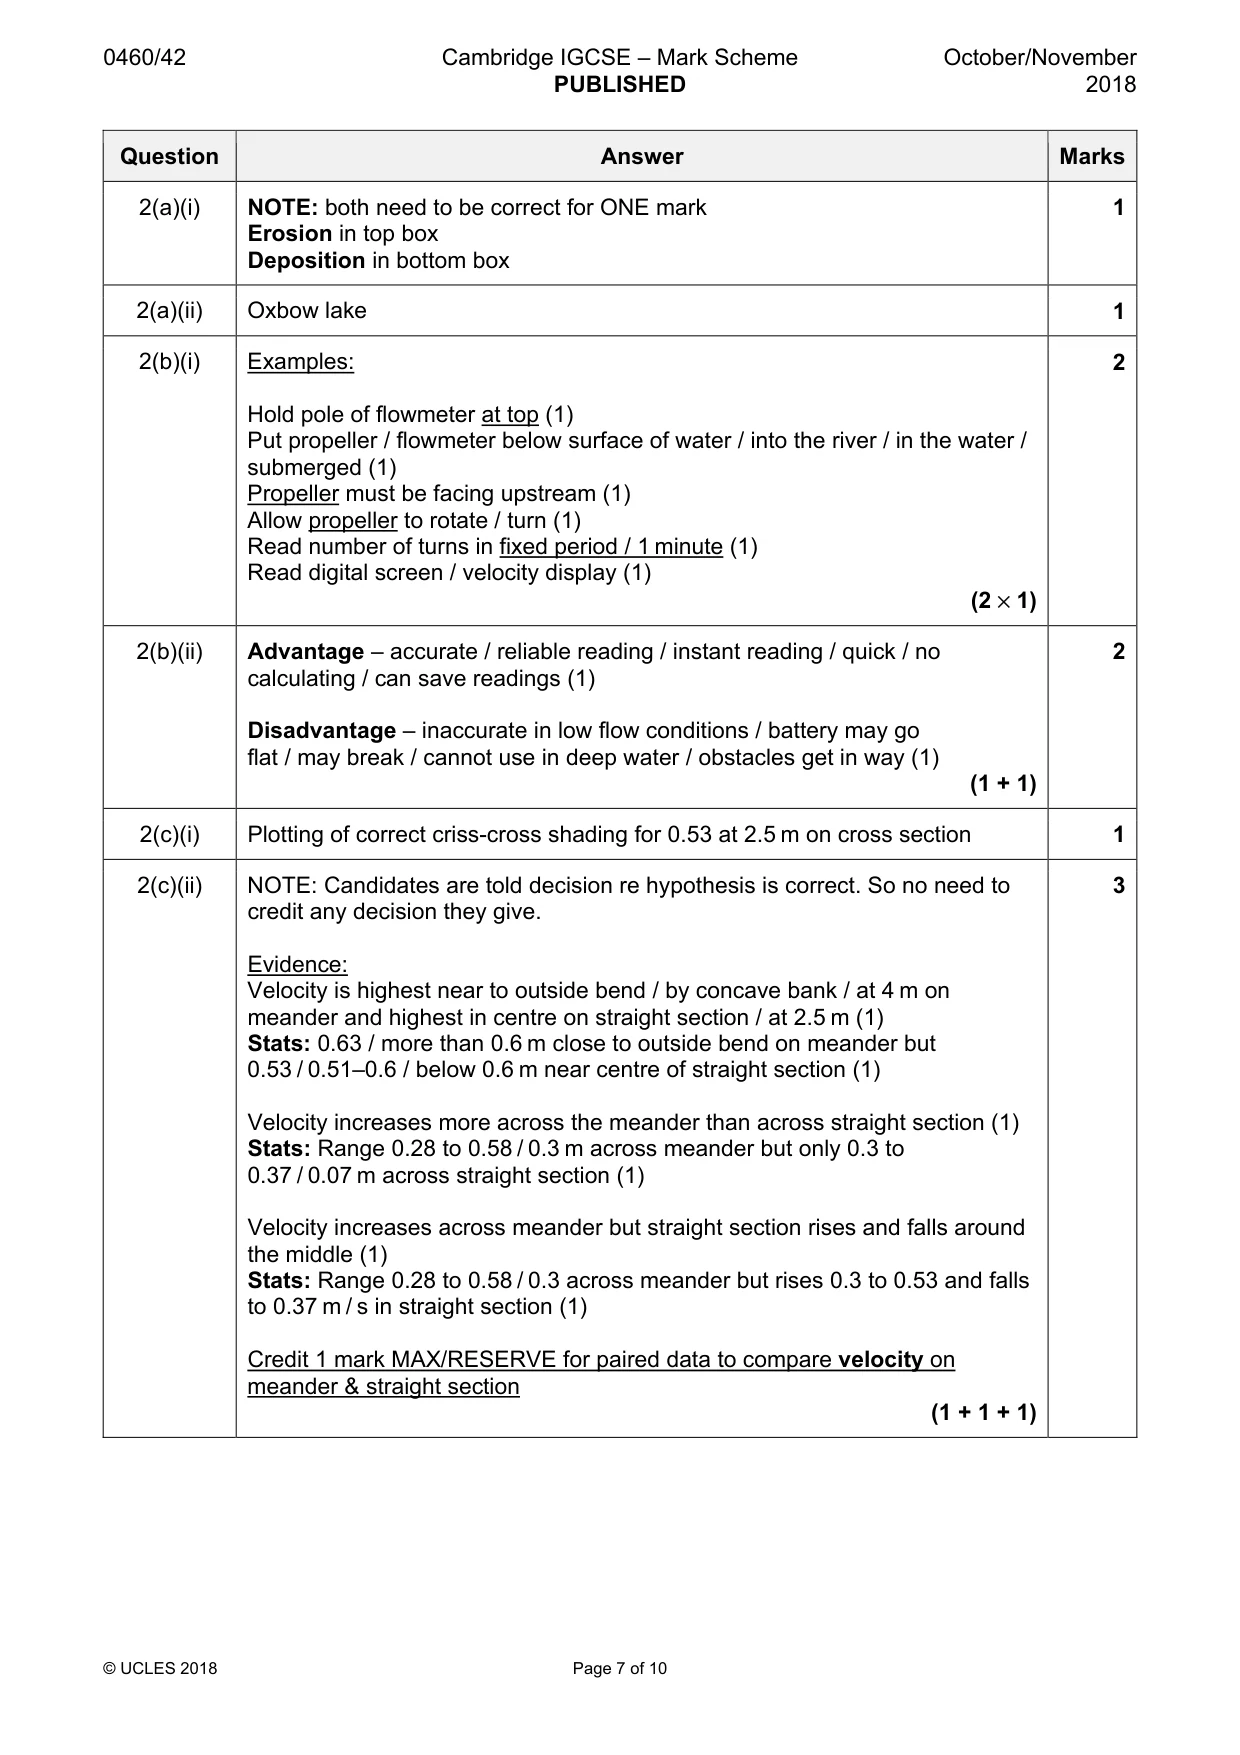
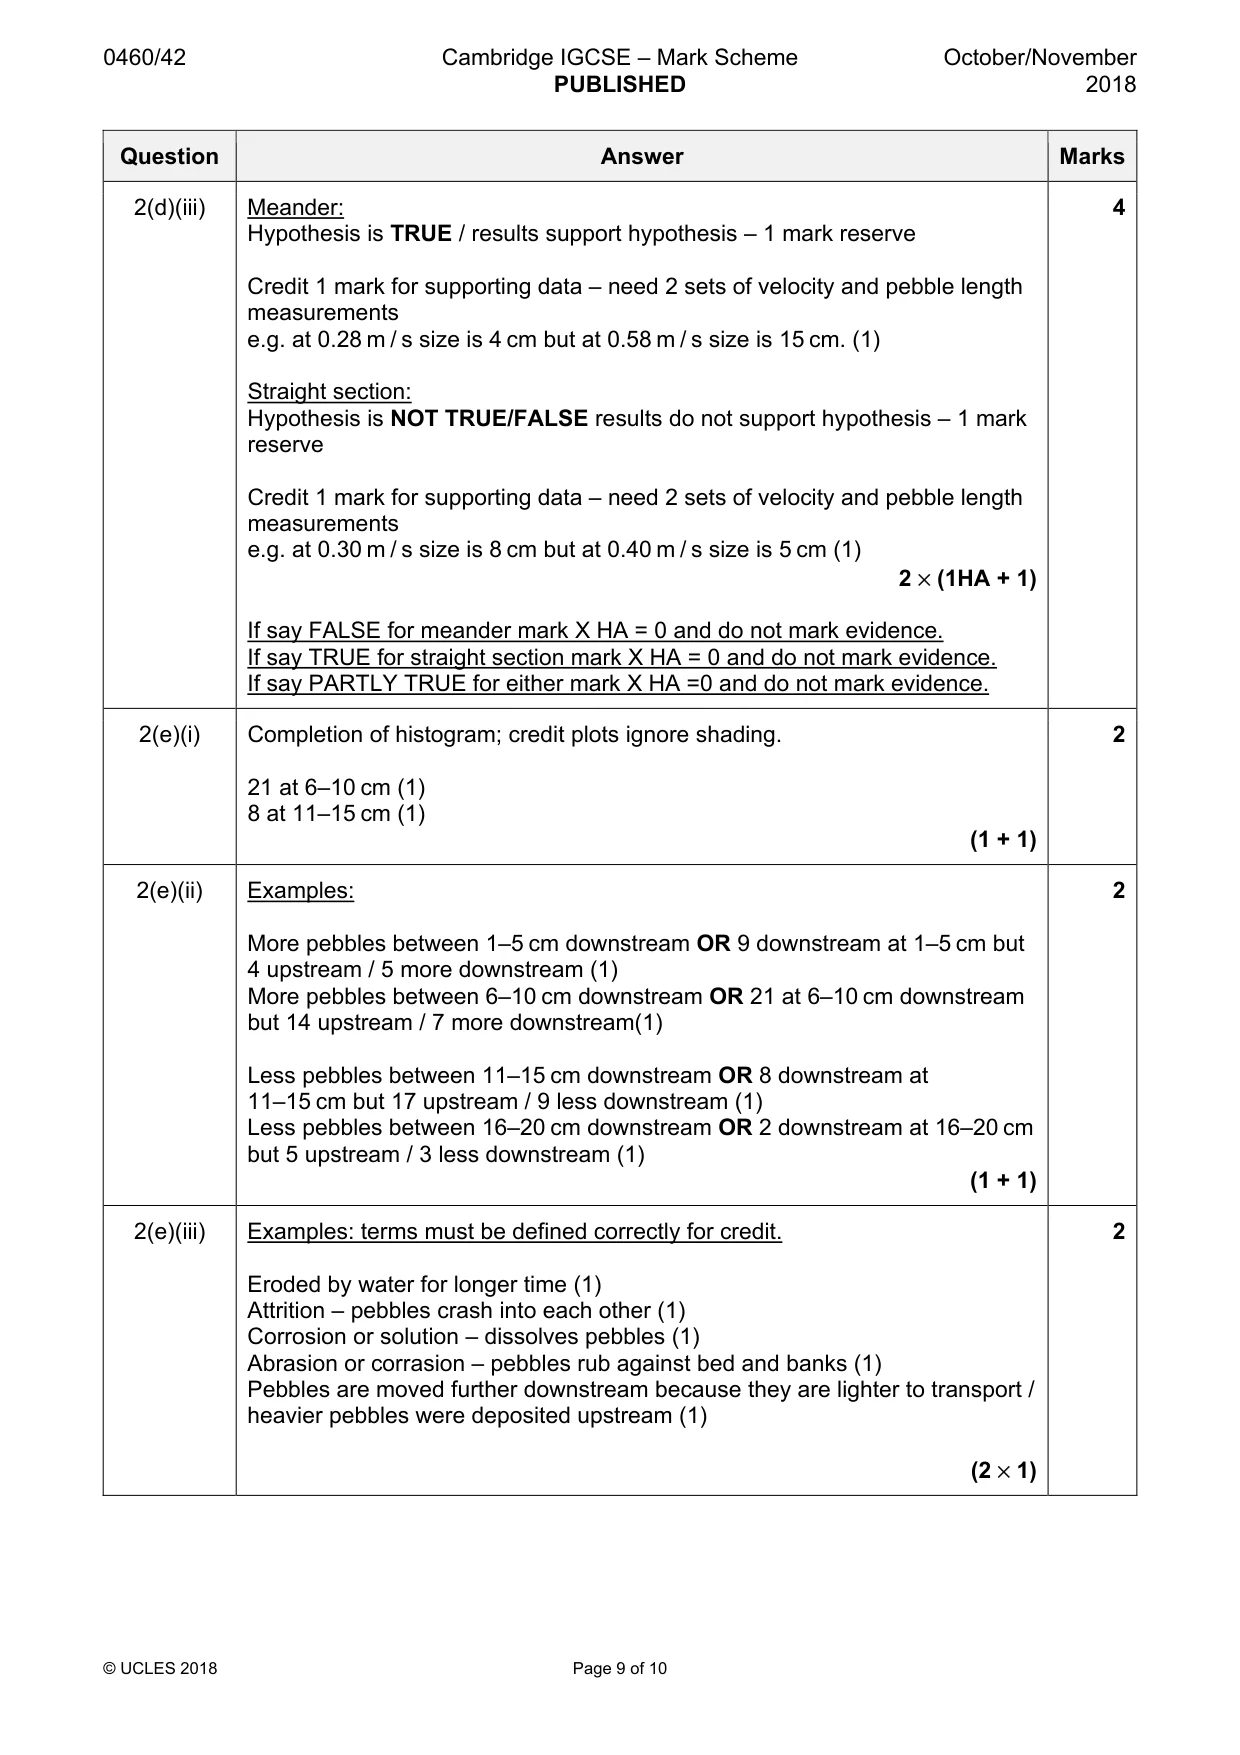
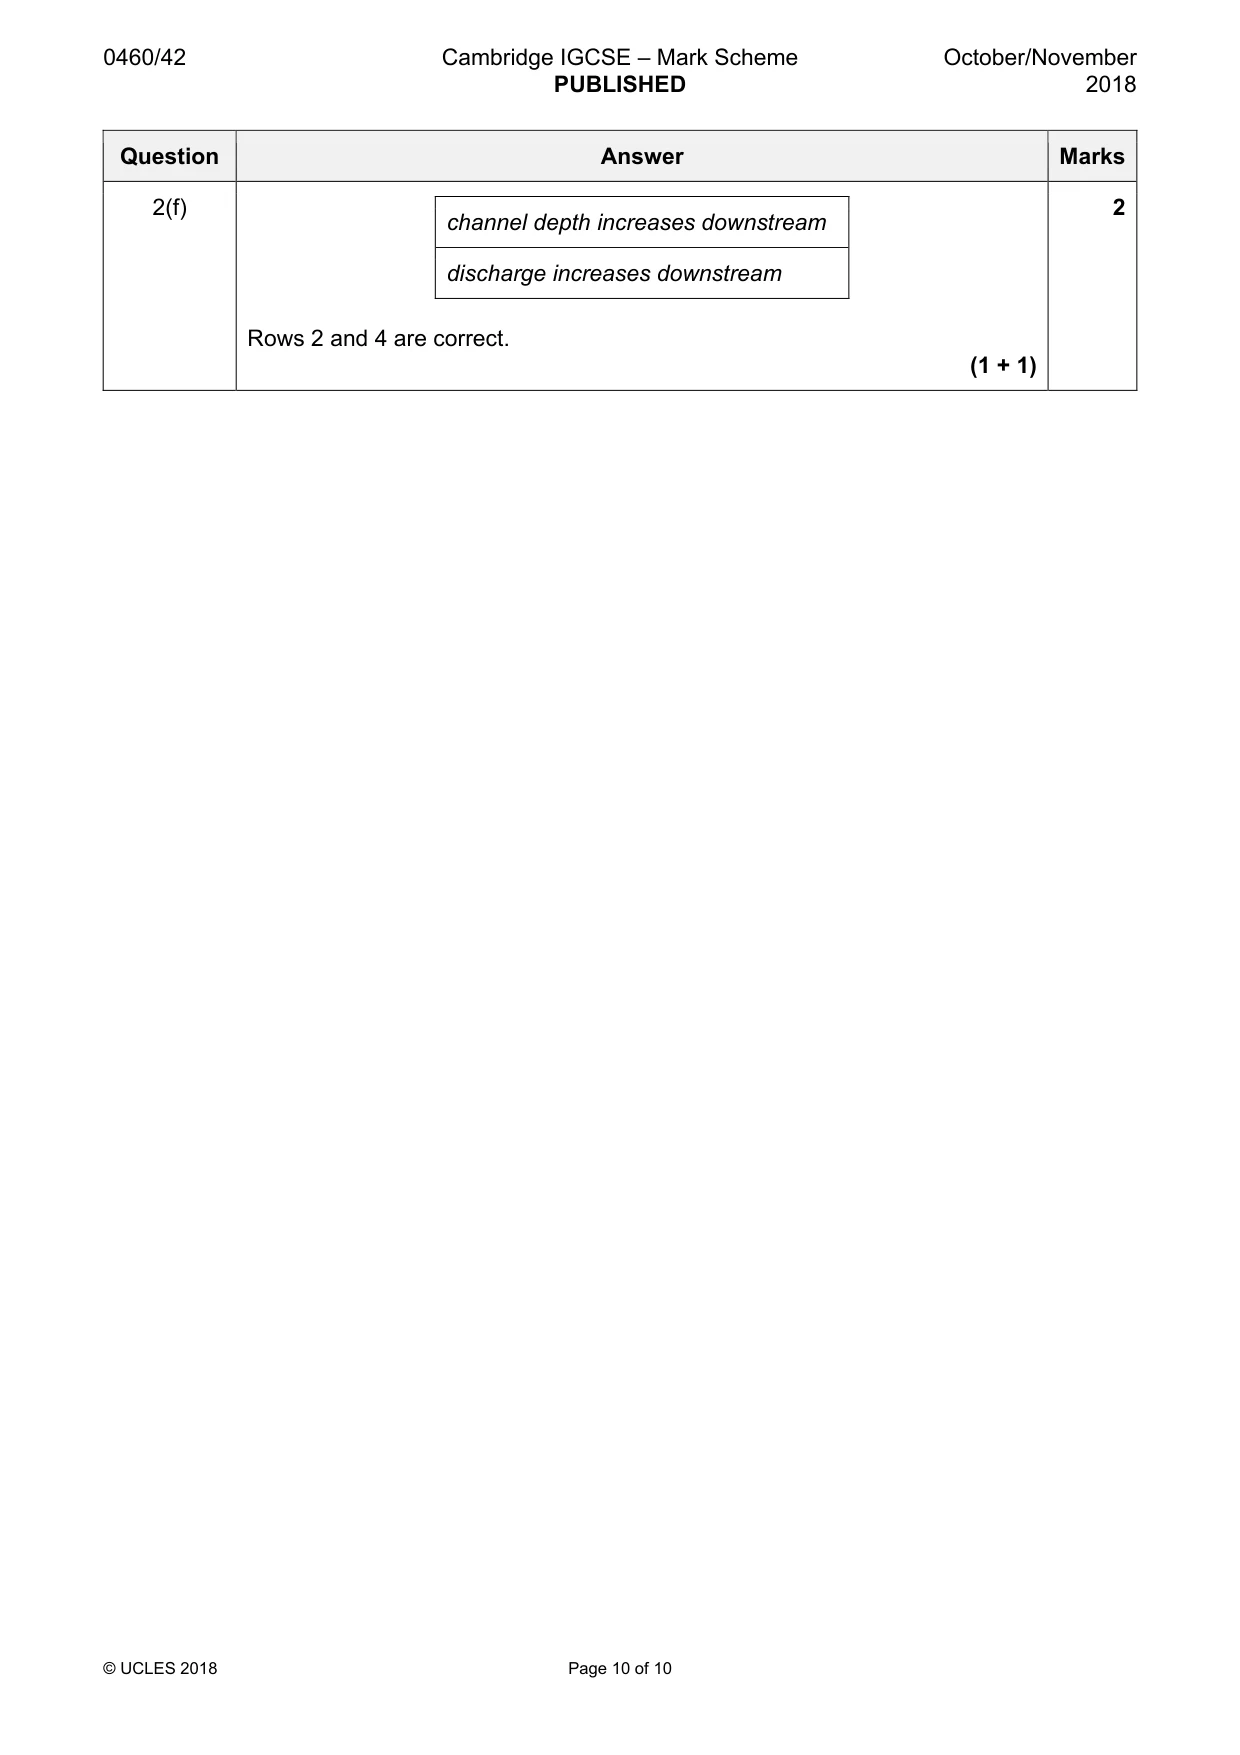
Mark scheme: 2(a)(i) NOTE: both need to be correct for ONE mark 1 Erosion in top box Deposition in bottom box 2(a)(ii) Oxbow lake 1 2(b)(i) Examples: 2 Hold pole of flowmeter at top (1) Put propeller / flowmeter below surface of water / into the river / in the water / submerged (1) Propeller must be facing upstream (1) Allow propeller to rotate / turn (1) Read number of turns in fixed period / 1 minute (1) Read digital screen / velocity display (1) (2 × 1) 2(b)(ii) Advantage – accurate / reliable reading / instant reading / quick / no 2 calculating / can save readings (1) Disadvantage – inaccurate in low flow conditions / battery may go flat / may break / cannot use in deep water / obstacles get in way (1) (1 + 1) 2(c)(i) Plotting of correct criss-cross shading for 0.53 at 2.5 m on cross section 1 2(c)(ii) NOTE: Candidates are told decision re hypothesis is correct. So no need to 3 credit any decision they give. Evidence: Velocity is highest near to outside bend / by concave bank / at 4 m on meander and highest in centre on straight section / at 2.5 m (1) Stats: 0.63 / more than 0.6 m close to outside bend on meander but 0.53 / 0.51–0.6 / below 0.6 m near centre of straight section (1) Velocity increases more across the meander than across straight section (1) Stats: Range 0.28 to 0.58 / 0.3 m across meander but only 0.3 to 0.37 / 0.07 m across straight section (1) Velocity increases across meander but straight section rises and falls around the middle (1) Stats: Range 0.28 to 0.58 / 0.3 across meander but rises 0.3 to 0.53 and falls to 0.37 m / s in straight section (1) Credit 1 mark MAX/RESERVE for paired data to compare velocity on meander & straight section (1 + 1 + 1) 2(c)(iii) Examples: TWO differences required; can be statement or stats. 2 NOTE Fig 2.4 = now; Fig 2.5 = previous. Accept use of Figs. Do NOT credit comparing individual sites/distances as stats. Higher velocity recorded in students’ results now OR more than 0.6 / 0.63 now compared to 0.41–0.5 range before (1) Greater range of velocity in students’ results now OR 0.21–0.3 / 0.28 to more than 0.6 / 0.63 compared to 0.21–0.3 to 0.41–0.5 before (1) (1 + 1) 2(c)(iv) Examples: TWO separate suggestions needed 2 More measurements in students fieldwork / 9 now compared to 5 before / different intervals used (1) More rainfall before fieldwork now / less rainfall or drier conditions before (1) Higher discharge before fieldwork now / lower discharge before(1) Measuring errors (1) Floats may become stuck before (1) Different instruments / flowmeter now instead of float / different methods (1) (1 + 1) 2(d)(i) Examples: No mark for just stating callipers / pebbleometer. 2 Put pebble into callipers or pebbleometer / adjust callipers to hold pebble (1) Measured length on scale / measure long axis with ruler or tape measure (1) (1 + 1) 2(d)(ii) Plot crosses at 2 m and 4 m as follows. 2 2 m: 0.42 / 12 (1) 4 m: 0.63 / 17 (1) (1 + 1) 2(d)(iii) Meander: 4 Hypothesis is TRUE / results support hypothesis – 1 mark reserve Credit 1 mark for supporting data – need 2 sets of velocity and pebble length measurements e.g. at 0.28 m / s size is 4 cm but at 0.58 m / s size is 15 cm. (1) Straight section: Hypothesis is NOT TRUE/FALSE results do not support hypothesis – 1 mark reserve Credit 1 mark for supporting data – need 2 sets of velocity and pebble length measurements e.g. at 0.30 m / s size is 8 cm but at 0.40 m / s size is 5 cm (1) 2 × (1HA + 1) If say FALSE for meander mark X HA = 0 and do not mark evidence. If say TRUE for straight section mark X HA = 0 and do not mark evidence. If say PARTLY TRUE for either mark X HA =0 and do not mark evidence. 2(e)(i) Completion of histogram; credit plots ignore shading. 2 21 at 6–10 cm (1) 8 at 11–15 cm (1) (1 + 1) 2(e)(ii) Examples: 2 More pebbles between 1–5 cm downstream OR 9 downstream at 1–5 cm but 4 upstream / 5 more downstream (1) More pebbles between 6–10 cm downstream OR 21 at 6–10 cm downstream but 14 upstream / 7 more downstream(1) Less pebbles between 11–15 cm downstream OR 8 downstream at 11–15 cm but 17 upstream / 9 less downstream (1) Less pebbles between 16–20 cm downstream OR 2 downstream at 16–20 cm but 5 upstream / 3 less downstream (1) (1 + 1) 2(e)(iii) Examples: terms must be defined correctly for credit. 2 Eroded by water for longer time (1) Attrition – pebbles crash into each other (1) Corrosion or solution – dissolves pebbles (1) Abrasion or corrasion – pebbles rub against bed and banks (1) Pebbles are moved further downstream because they are lighter to transport / heavier pebbles were deposited upstream (1) (2 × 1) 2(f) 2 channel depth increases downstream discharge increases downstream Rows 2 and 4 are correct. (1 + 1)
What was in this paper
The subtopics covered by these 2 questions, and how many questions each got. Open one in a new tab to see every Cambridge question on it.
What you needed in this session
Cambridge’s own grade thresholds for 2018 Oct/Nov, Paper 4 · Variant 2. A higher threshold means an easier paper — the bar moves with how the cohort did.