Cambridge IGCSE Geography 0460 — 2018 Oct/Nov Paper 4 · Variant 1
0460/41/O/N/18 · 2 questions · 60 marks · ≈68 min
The question paper and its mark scheme, free to read here and free to download. This is Cambridge’s own paper, exactly as it was sat.
Question paper20 pages











Mark scheme6 pages
Answers below. Sit the paper first if you are practising.



Questions as text
Q1 · Students were learning about problems in urban settlements
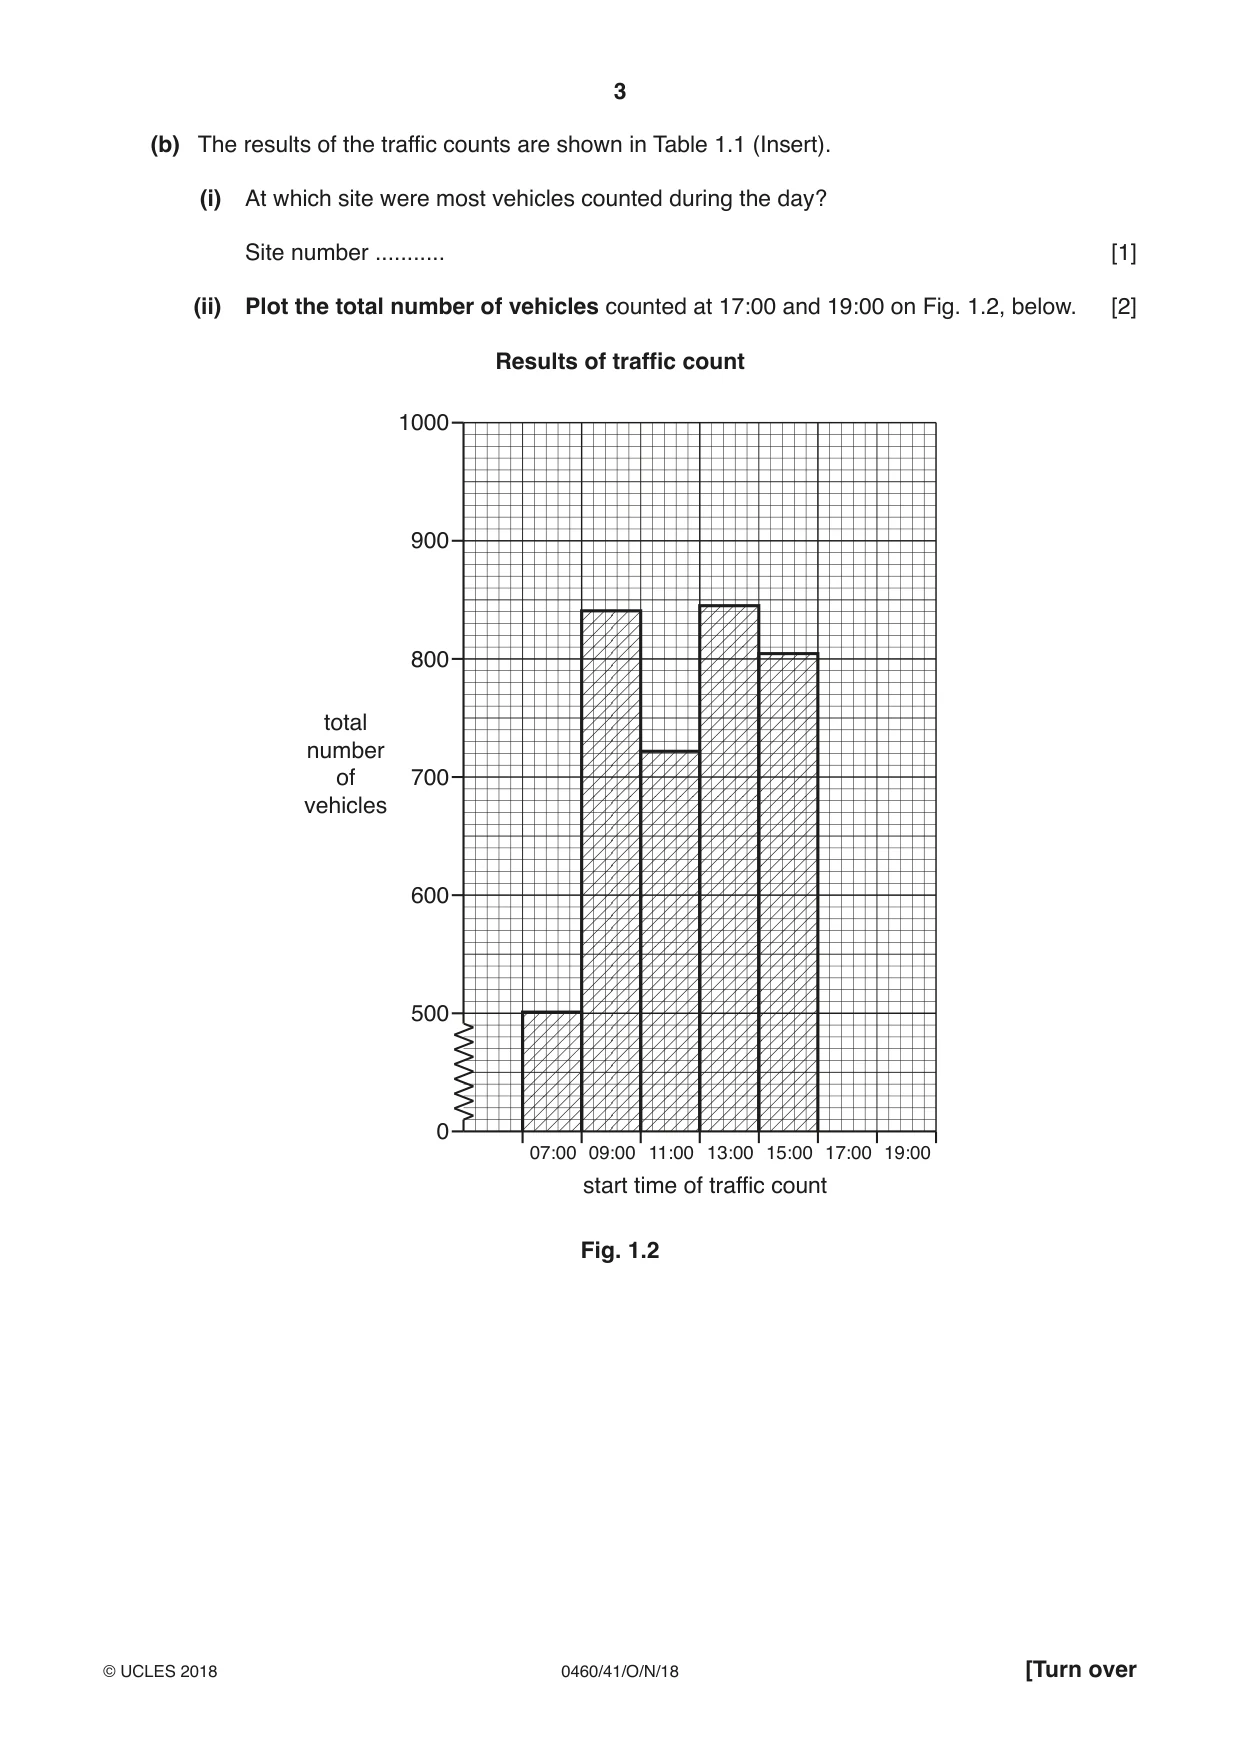
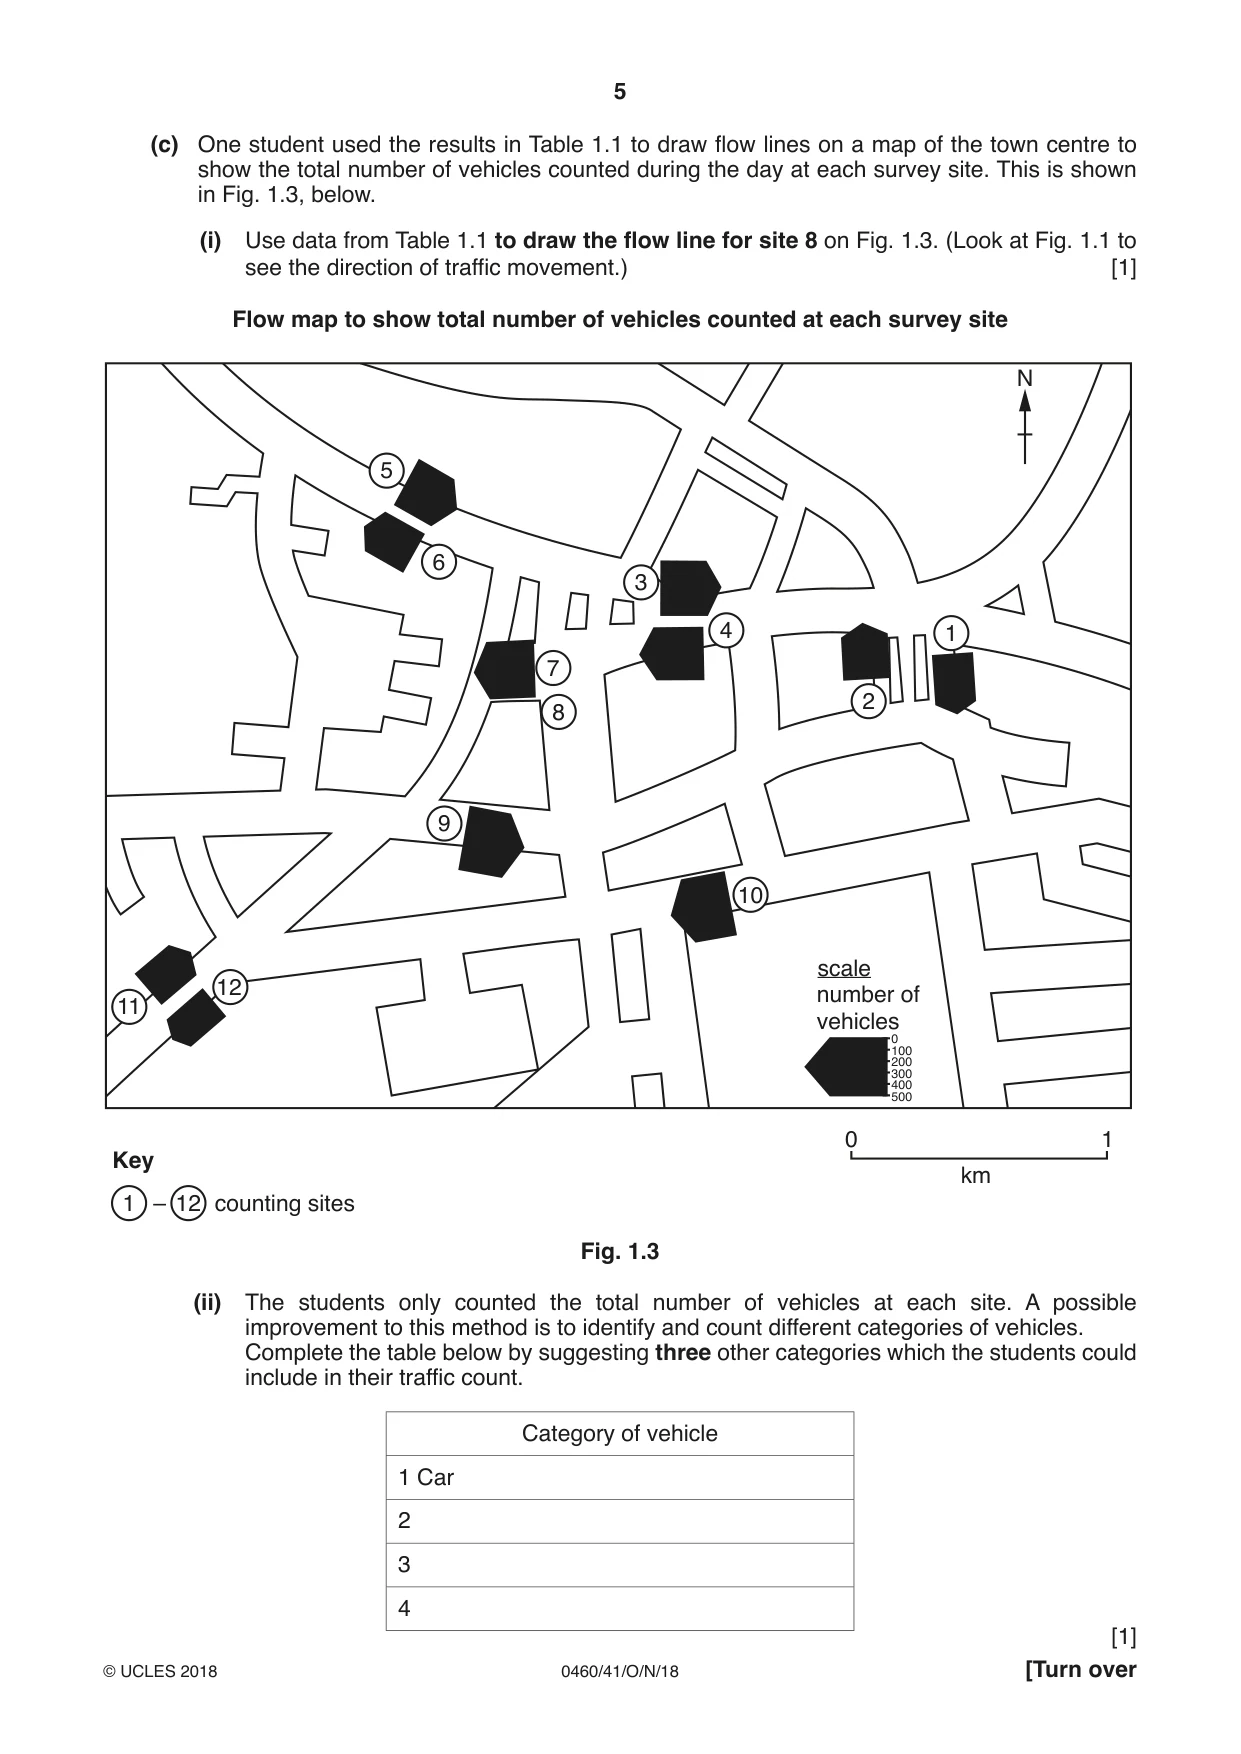
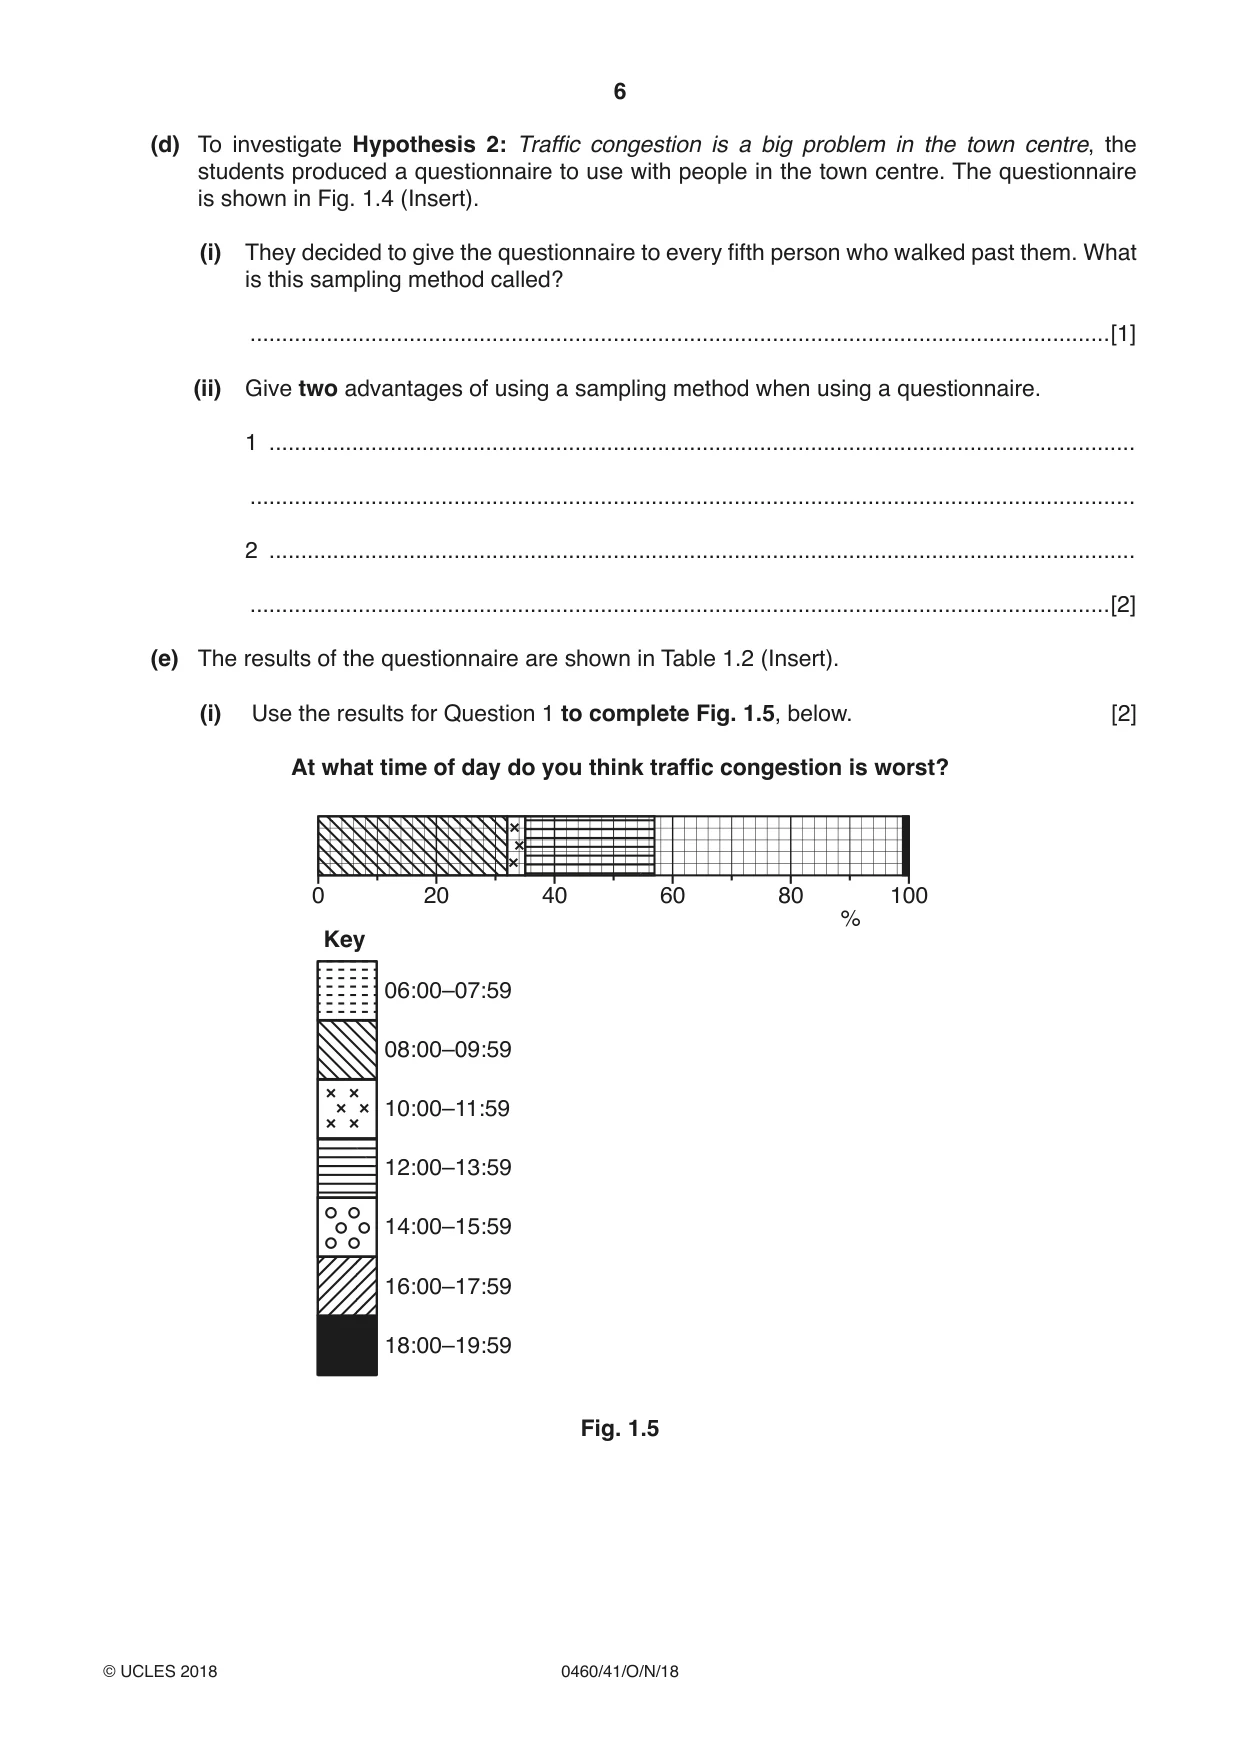
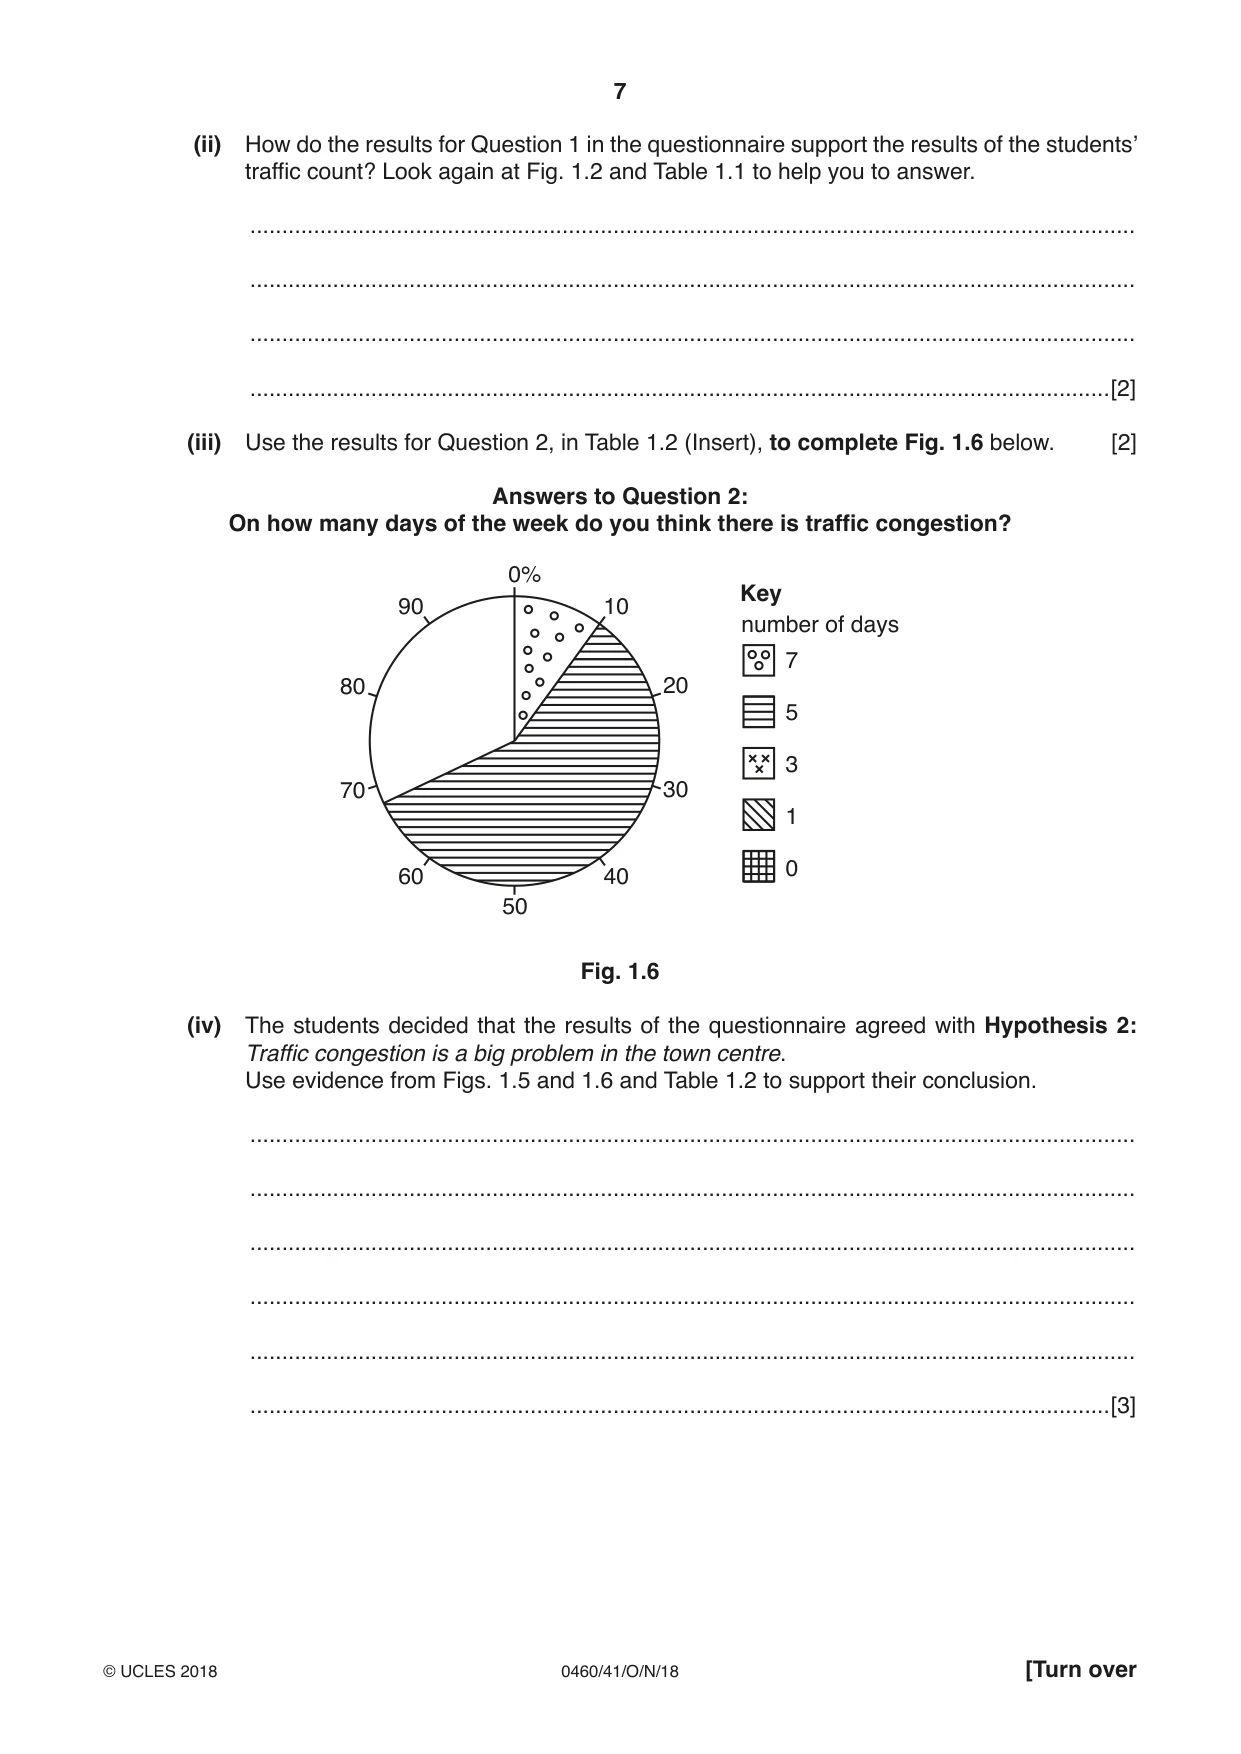
1 Students were learning about problems in urban settlements. They agreed with their teacher that traffic was a problem in the centre of their local town. They decided to do fieldwork to investigate the issue. The students tested the following hypotheses: Hypothesis 1: The number of vehicles in the town centre varies throughout the day. Hypothesis 2: Traffic congestion is a big problem in the town centre. (a) To investigate Hypothesis 1 the students did a traffic count at different sites in the town centre. These sites are shown on Fig. 1.1 (Insert). (i) Which two of the following are important features of a traffic count? Tick (3) your choices below. Feature Tick (3) Pedestrians who walk past the counting site and then return must be counted twice. Counting must start and finish at the same time at all counting sites. Students should work by themselves so they are not distracted by others. The speed of each vehicle must be recorded using a stop watch. A tally method must count and record vehicles in groups of five. Identify every fifth vehicle which passes the counting site by make and model of vehicle. [2] (ii) The students agreed to count the number of vehicles for 10 minutes at two hour intervals between 07:00 and 19:00. Suggest why the students decided to make the counts last for 10 minutes. ........................................................................................................................................... ........................................................................................................................................... ........................................................................................................................................... .......................................................................................................................................[2] (b) The results of the traffic counts are shown in Table 1.1 (Insert). (i) At which site were most vehicles counted during the day? Site number ........... [1] (ii) Plot the total number of vehicles counted at 17:00 and 19:00 on Fig. 1.2, below. [2] Results of traffic count 1000 900 800 total number of 700 vehicles 600 500 0 07:00 09:00 11:00 13:00 15:00 17:00 19:00 start time of traffic count Fig. 1.2 (iii) What conclusion did the students make about Hypothesis 1: The number of vehicles in the town centre varies throughout the day? Support your decision by only referring to data for the total number of vehicles and the number of vehicles counted at sites 5 and 6 at different times. This data is shown in Fig. 1.2 and highlighted in Table 1.1. ........................................................................................................................................... ........................................................................................................................................... ........................................................................................................................................... ........................................................................................................................................... ........................................................................................................................................... ........................................................................................................................................... ........................................................................................................................................... .......................................................................................................................................[4] (iv) Suggest two factors which might influence the amount of traffic in a town centre during the day. 1 ........................................................................................................................................ ........................................................................................................................................... 2 ........................................................................................................................................ .......................................................................................................................................[2] (c) One student used the results in Table 1.1 to draw flow lines on a map of the town centre to show the total number of vehicles counted during the day at each survey site. This is shown in Fig. 1.3, below. (i) Use data from Table 1.1 to draw the flow line for site 8 on Fig. 1.3. (Look at Fig. 1.1 to see the direction of traffic movement.) [1] Flow map to show total number of vehicles counted at each survey site N 5 6 3 4 1 7 2 8 9 10 scale 12 number of11 vehicles 0 100 200 300 400 500 0 1 Key km 1 – 12 counting sites Fig. 1.3 (ii) The students only counted the total number of vehicles at each site. A possible improvement to this method is to identify and count different categories of vehicles. Complete the table below by suggesting three other categories which the students could include in their traffic count. Category of vehicle 1 Car 2 3 4 [1] (d) To investigate Hypothesis 2: Traffic congestion is a big problem in the town centre, the students produced a questionnaire to use with people in the town centre. The questionnaire is shown in Fig. 1.4 (Insert). (i) They decided to give the questionnaire to every fifth person who walked past them. What is this sampling method called? .......................................................................................................................................[1] (ii) Give two advantages of using a sampling method when using a questionnaire. 1 ........................................................................................................................................ ........................................................................................................................................... 2 ........................................................................................................................................ .......................................................................................................................................[2] (e) The results of the questionnaire are shown in Table 1.2 (Insert). (i) Use the results for Question 1 to complete Fig. 1.5, below. [2] At what time of day do you think traffic congestion is worst? 0 20 40 60 80 100 % Key 06:00–07:59 08:00–09:59 10:00–11:59 12:00–13:59 14:00–15:59 16:00–17:59 18:00–19:59 Fig. 1.5 (ii) How do the results for Question 1 in the questionnaire support the results of the students’ traffic count? Look again at Fig. 1.2 and Table 1.1 to help you to answer. ........................................................................................................................................... ........................................................................................................................................... ........................................................................................................................................... .......................................................................................................................................[2] (iii) Use the results for Question 2, in Table 1.2 (Insert), to complete Fig. 1.6 below. [2] Answers to Question 2: On how many days of the week do you think there is traffic congestion? 0% Key 90 10 number of days 7 80 20 5 3 70 30 1 0 60 40 50 Fig. 1.6 (iv) The students decided that the results of the questionnaire agreed with Hypothesis 2: Traffic congestion is a big problem in the town centre. Use evidence from Figs. 1.5 and 1.6 and Table 1.2 to support their conclusion. ........................................................................................................................................... ........................................................................................................................................... ........................................................................................................................................... ........................................................................................................................................... ........................................................................................................................................... .......................................................................................................................................[3] (f) Traffic congestion in the centre of towns and cities is caused by large numbers of vehicles. Suggest three ways to reduce traffic congestion in a town or city centre. 1 ................................................................................................................................................ ................................................................................................................................................... 2 ................................................................................................................................................ ................................................................................................................................................... 3 ................................................................................................................................................ ...............................................................................................................................................[3] [Total: 30]
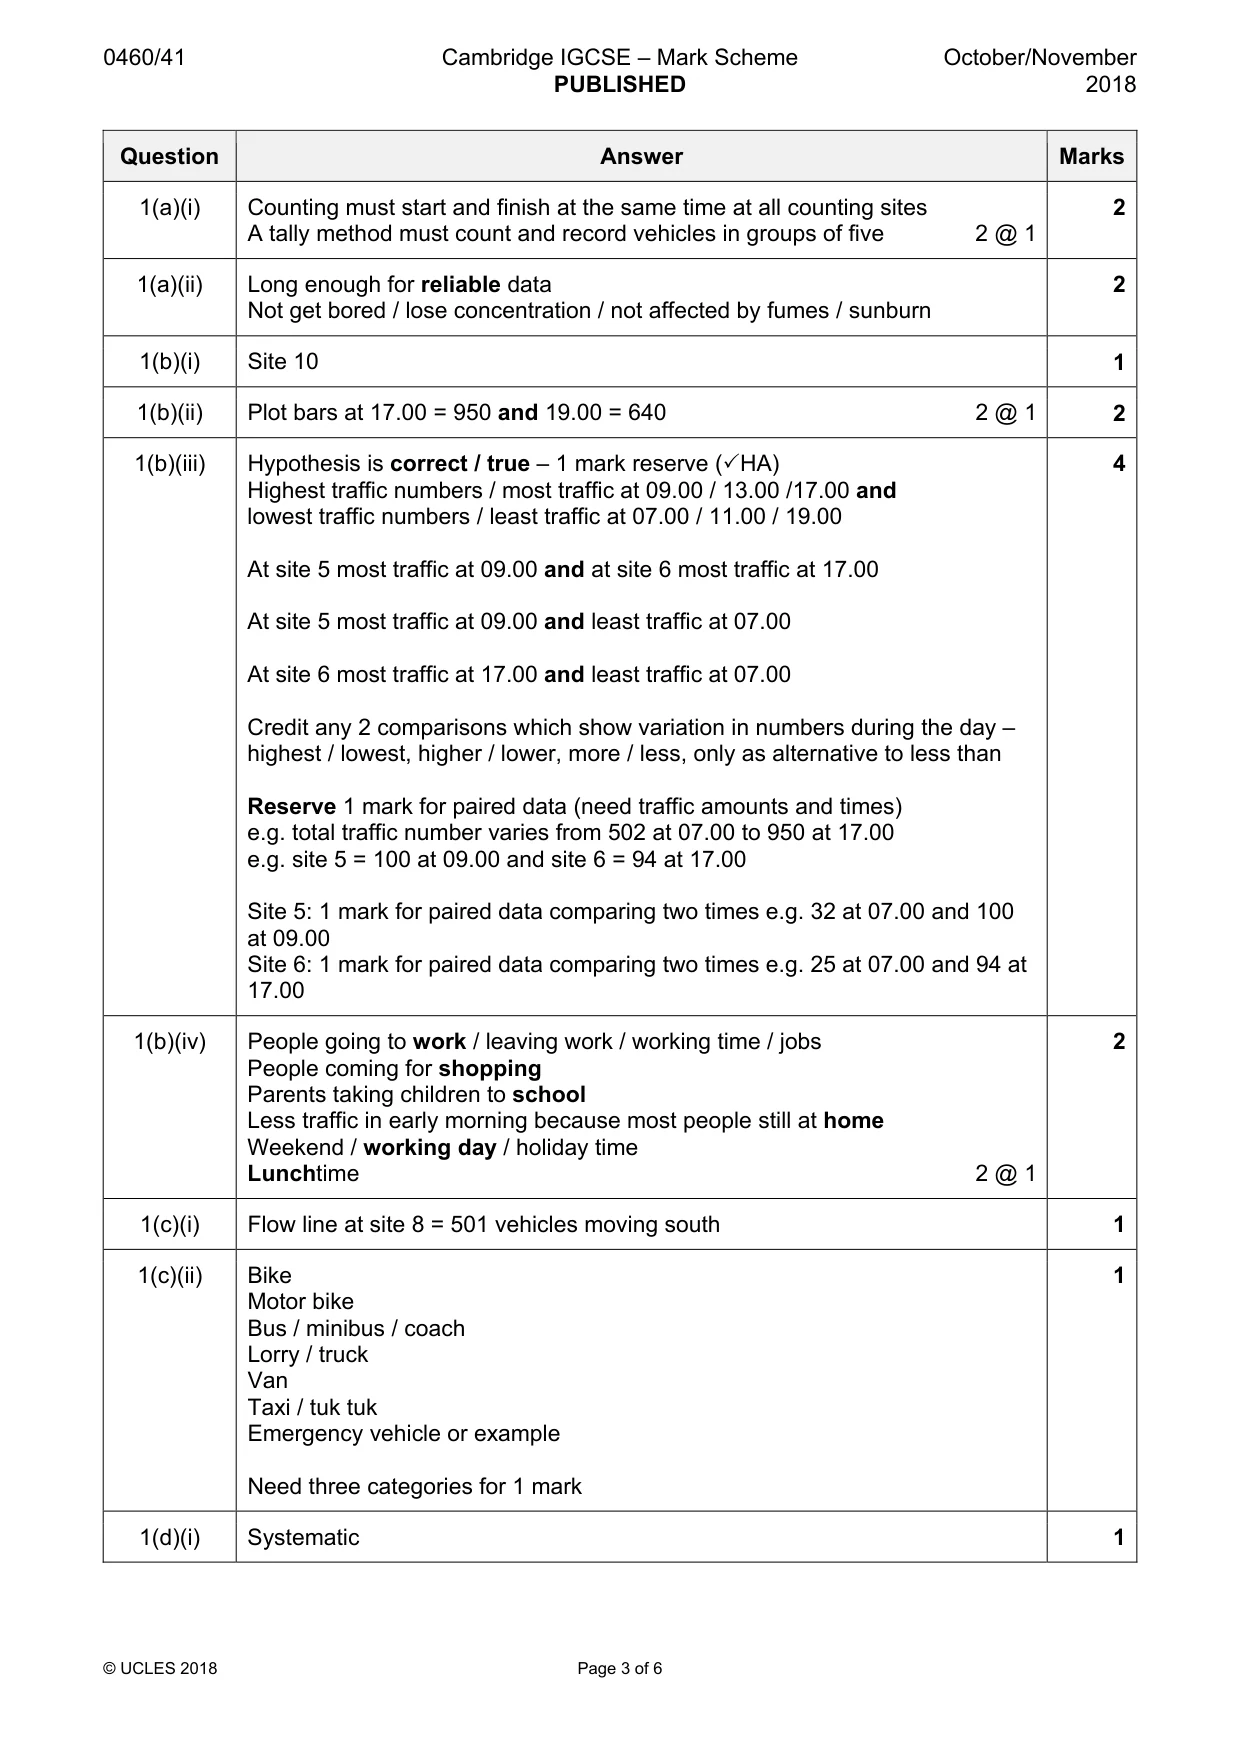
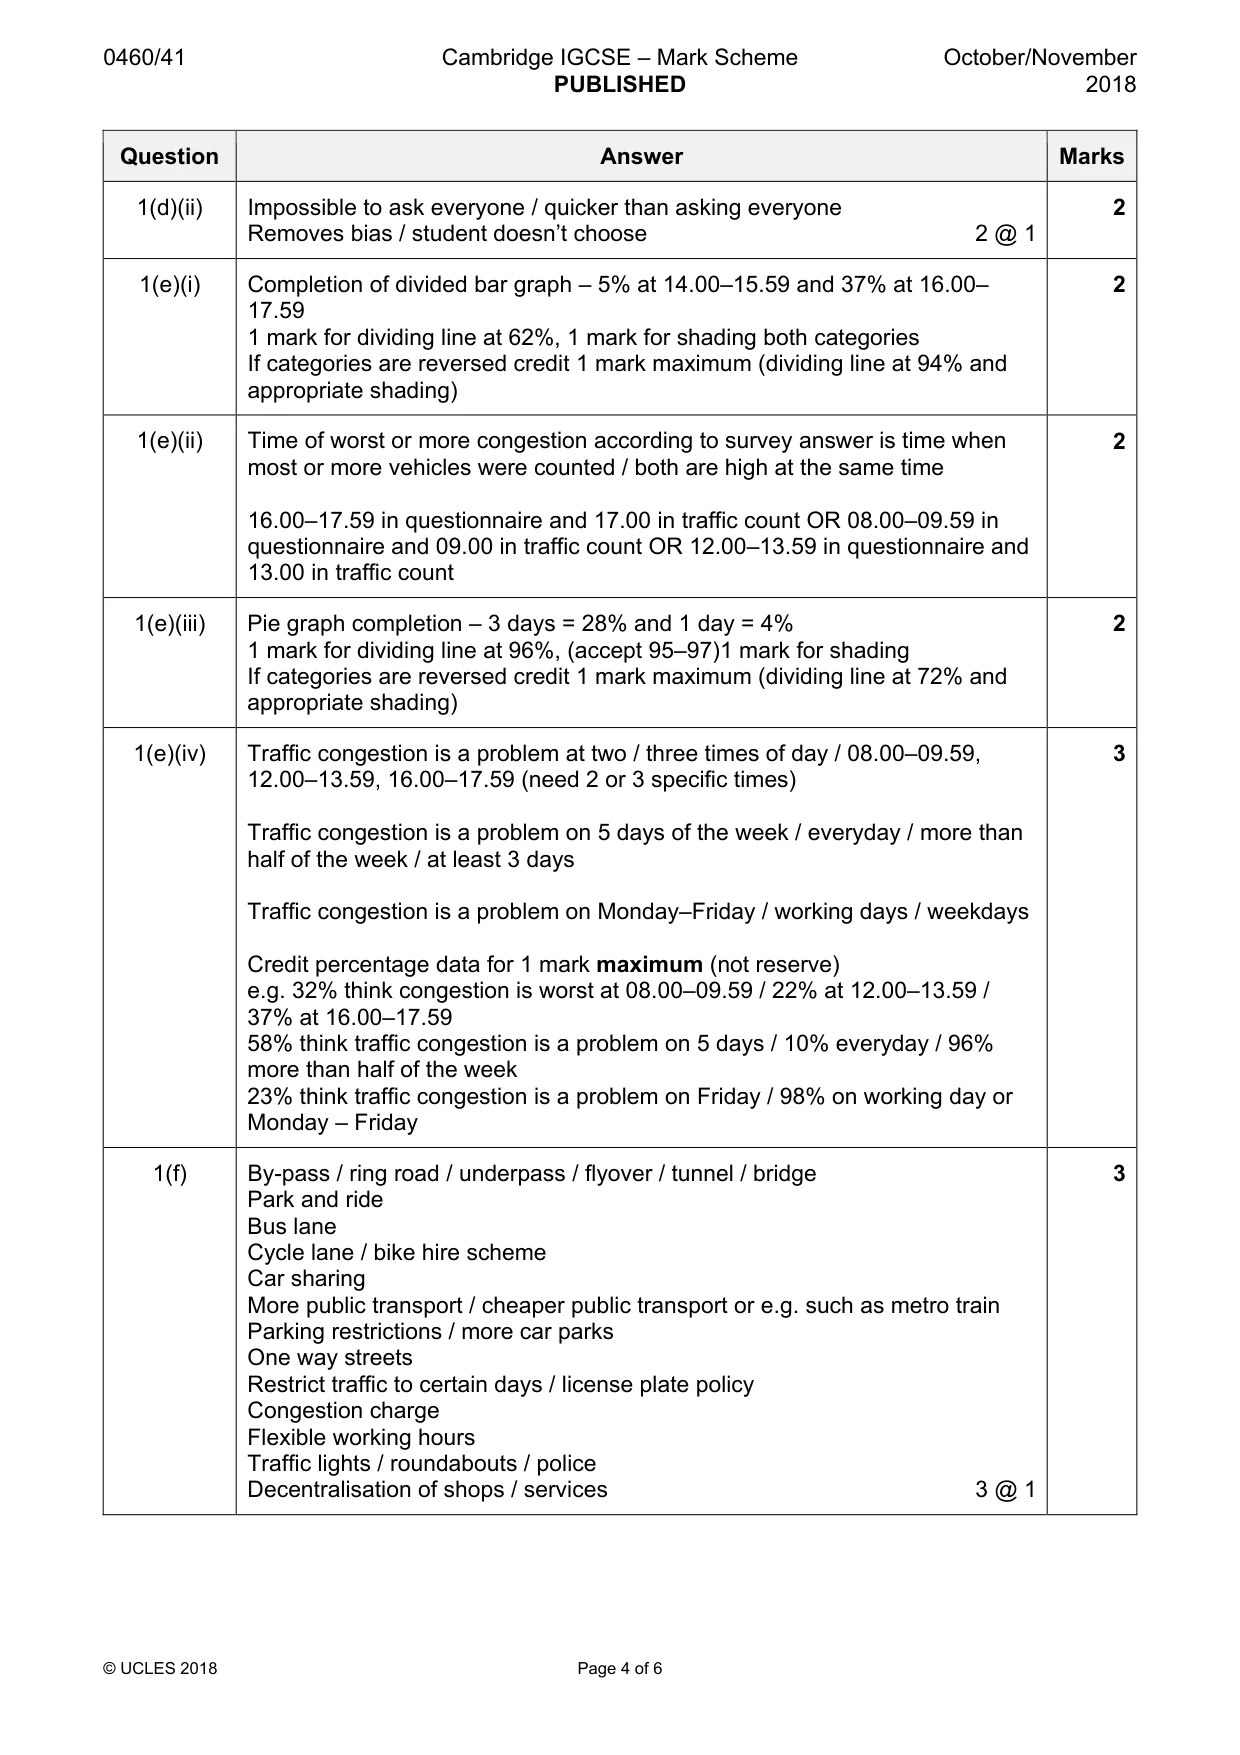
Mark scheme: Question Answer Marks 1(a)(i) Counting must start and finish at the same time at all counting sites 2 A tally method must count and record vehicles in groups of five 2 @ 1 1(a)(ii) Long enough for reliable data 2 Not get bored / lose concentration / not affected by fumes / sunburn 1(b)(i) Site 10 1 1(b)(ii) Plot bars at 17.00 = 950 and 19.00 = 640 2 @ 1 2 1(b)(iii) Hypothesis is correct / true – 1 mark reserve (3HA) 4 Highest traffic numbers / most traffic at 09.00 / 13.00 /17.00 and lowest traffic numbers / least traffic at 07.00 / 11.00 / 19.00 At site 5 most traffic at 09.00 and at site 6 most traffic at 17.00 At site 5 most traffic at 09.00 and least traffic at 07.00 At site 6 most traffic at 17.00 and least traffic at 07.00 Credit any 2 comparisons which show variation in numbers during the day – highest / lowest, higher / lower, more / less, only as alternative to less than Reserve 1 mark for paired data (need traffic amounts and times) e.g. total traffic number varies from 502 at 07.00 to 950 at 17.00 e.g. site 5 = 100 at 09.00 and site 6 = 94 at 17.00 Site 5: 1 mark for paired data comparing two times e.g. 32 at 07.00 and 100 at 09.00 Site 6: 1 mark for paired data comparing two times e.g. 25 at 07.00 and 94 at 17.00 1(b)(iv) People going to work / leaving work / working time / jobs 2 People coming for shopping Parents taking children to school Less traffic in early morning because most people still at home Weekend / working day / holiday time Lunchtime 2 @ 1 1(c)(i) Flow line at site 8 = 501 vehicles moving south 1 1(c)(ii) Bike 1 Motor bike Bus / minibus / coach Lorry / truck Van Taxi / tuk tuk Emergency vehicle or example Need three categories for 1 mark 1(d)(i) Systematic 1 1(d)(ii) Impossible to ask everyone / quicker than asking everyone 2 Removes bias / student doesn’t choose 2 @ 1 1(e)(i) Completion of divided bar graph – 5% at 14.00–15.59 and 37% at 16.00– 2 17.59 1 mark for dividing line at 62%, 1 mark for shading both categories If categories are reversed credit 1 mark maximum (dividing line at 94% and appropriate shading) 1(e)(ii) Time of worst or more congestion according to survey answer is time when 2 most or more vehicles were counted / both are high at the same time 16.00–17.59 in questionnaire and 17.00 in traffic count OR 08.00–09.59 in questionnaire and 09.00 in traffic count OR 12.00–13.59 in questionnaire and 13.00 in traffic count 1(e)(iii) Pie graph completion – 3 days = 28% and 1 day = 4% 2 1 mark for dividing line at 96%, (accept 95–97)1 mark for shading If categories are reversed credit 1 mark maximum (dividing line at 72% and appropriate shading) 1(e)(iv) Traffic congestion is a problem at two / three times of day / 08.00–09.59, 3 12.00–13.59, 16.00–17.59 (need 2 or 3 specific times) Traffic congestion is a problem on 5 days of the week / everyday / more than half of the week / at least 3 days Traffic congestion is a problem on Monday–Friday / working days / weekdays Credit percentage data for 1 mark maximum (not reserve) e.g. 32% think congestion is worst at 08.00–09.59 / 22% at 12.00–13.59 / 37% at 16.00–17.59 58% think traffic congestion is a problem on 5 days / 10% everyday / 96% more than half of the week 23% think traffic congestion is a problem on Friday / 98% on working day or Monday – Friday 1(f) By-pass / ring road / underpass / flyover / tunnel / bridge 3 Park and ride Bus lane Cycle lane / bike hire scheme Car sharing More public transport / cheaper public transport or e.g. such as metro train Parking restrictions / more car parks One way streets Restrict traffic to certain days / license plate policy Congestion charge Flexible working hours Traffic lights / roundabouts / police Decentralisation of shops / services 3 @ 1
Q2 · A group of students went to do fieldwork at Bawdsey on the east coast of England
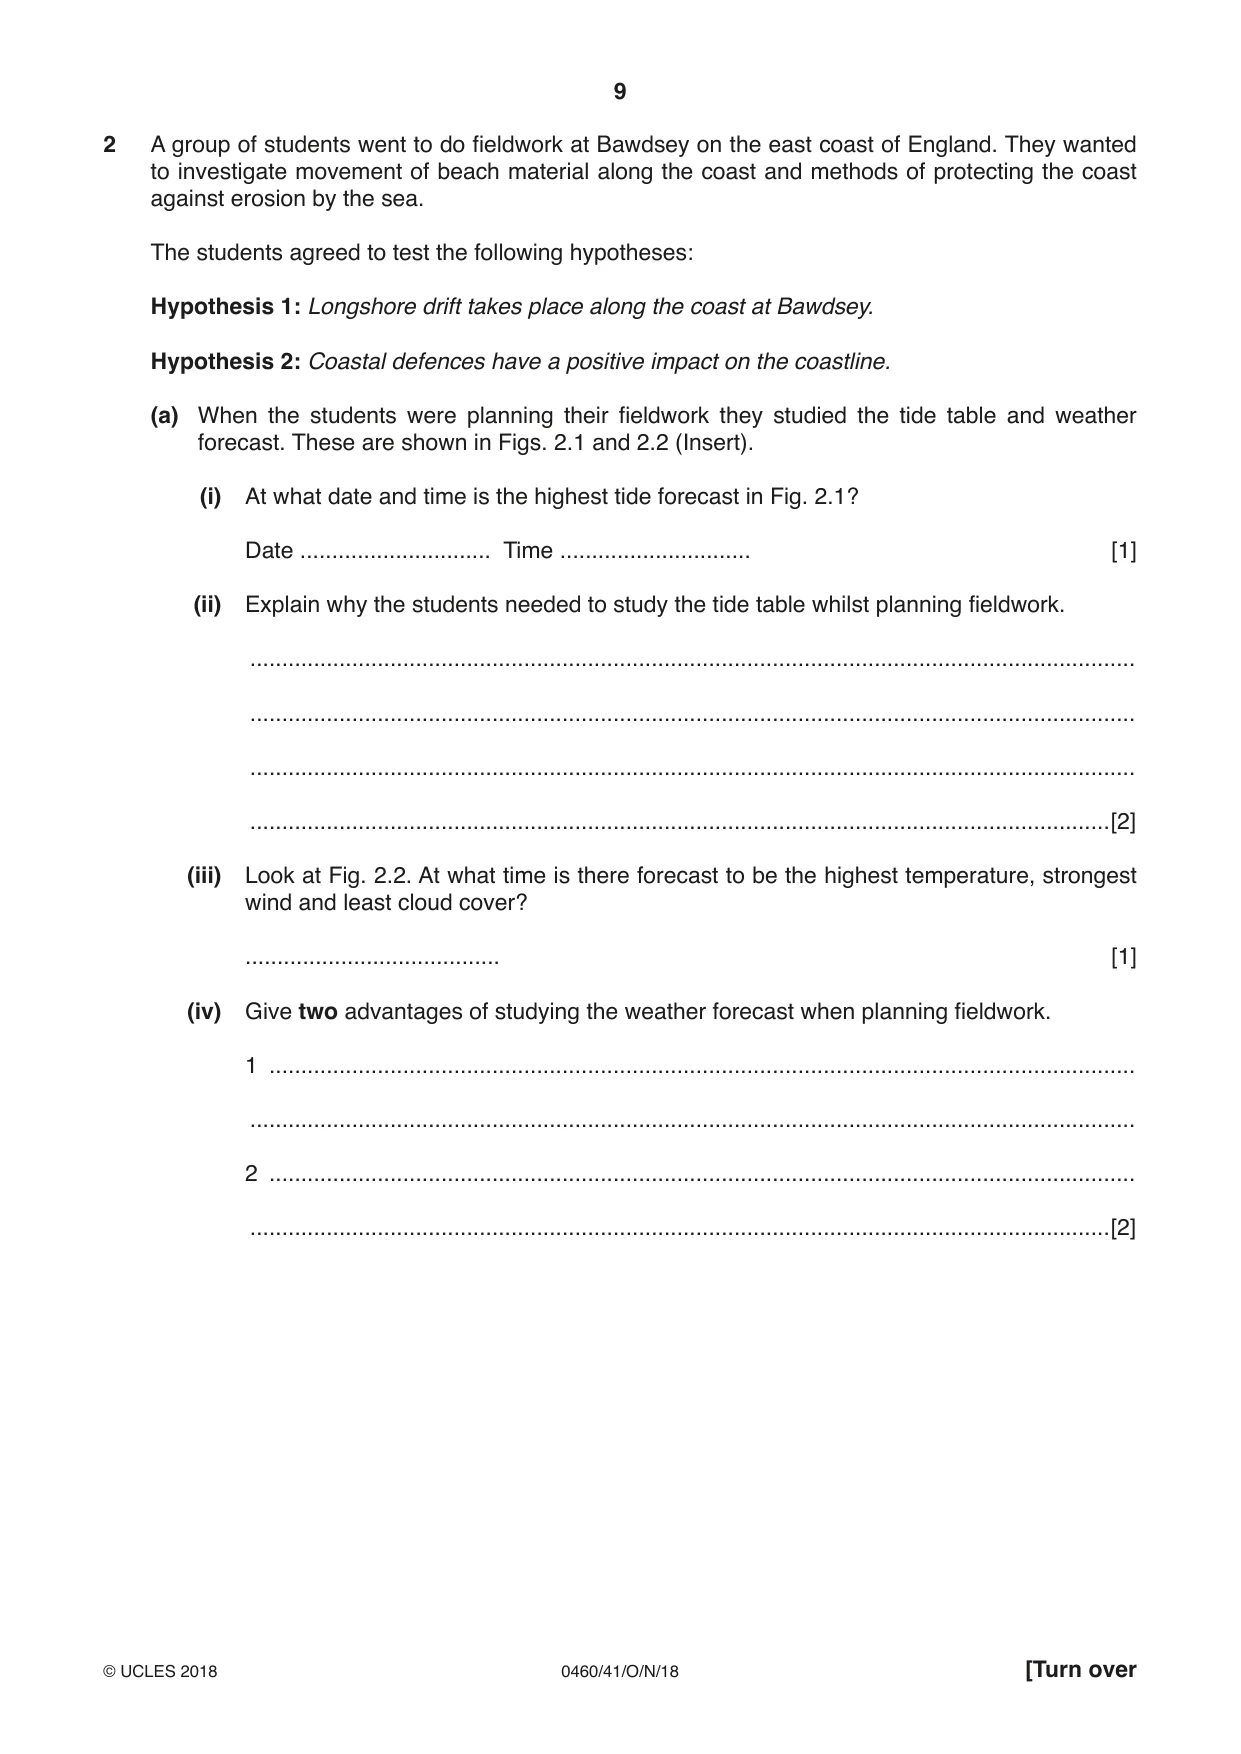
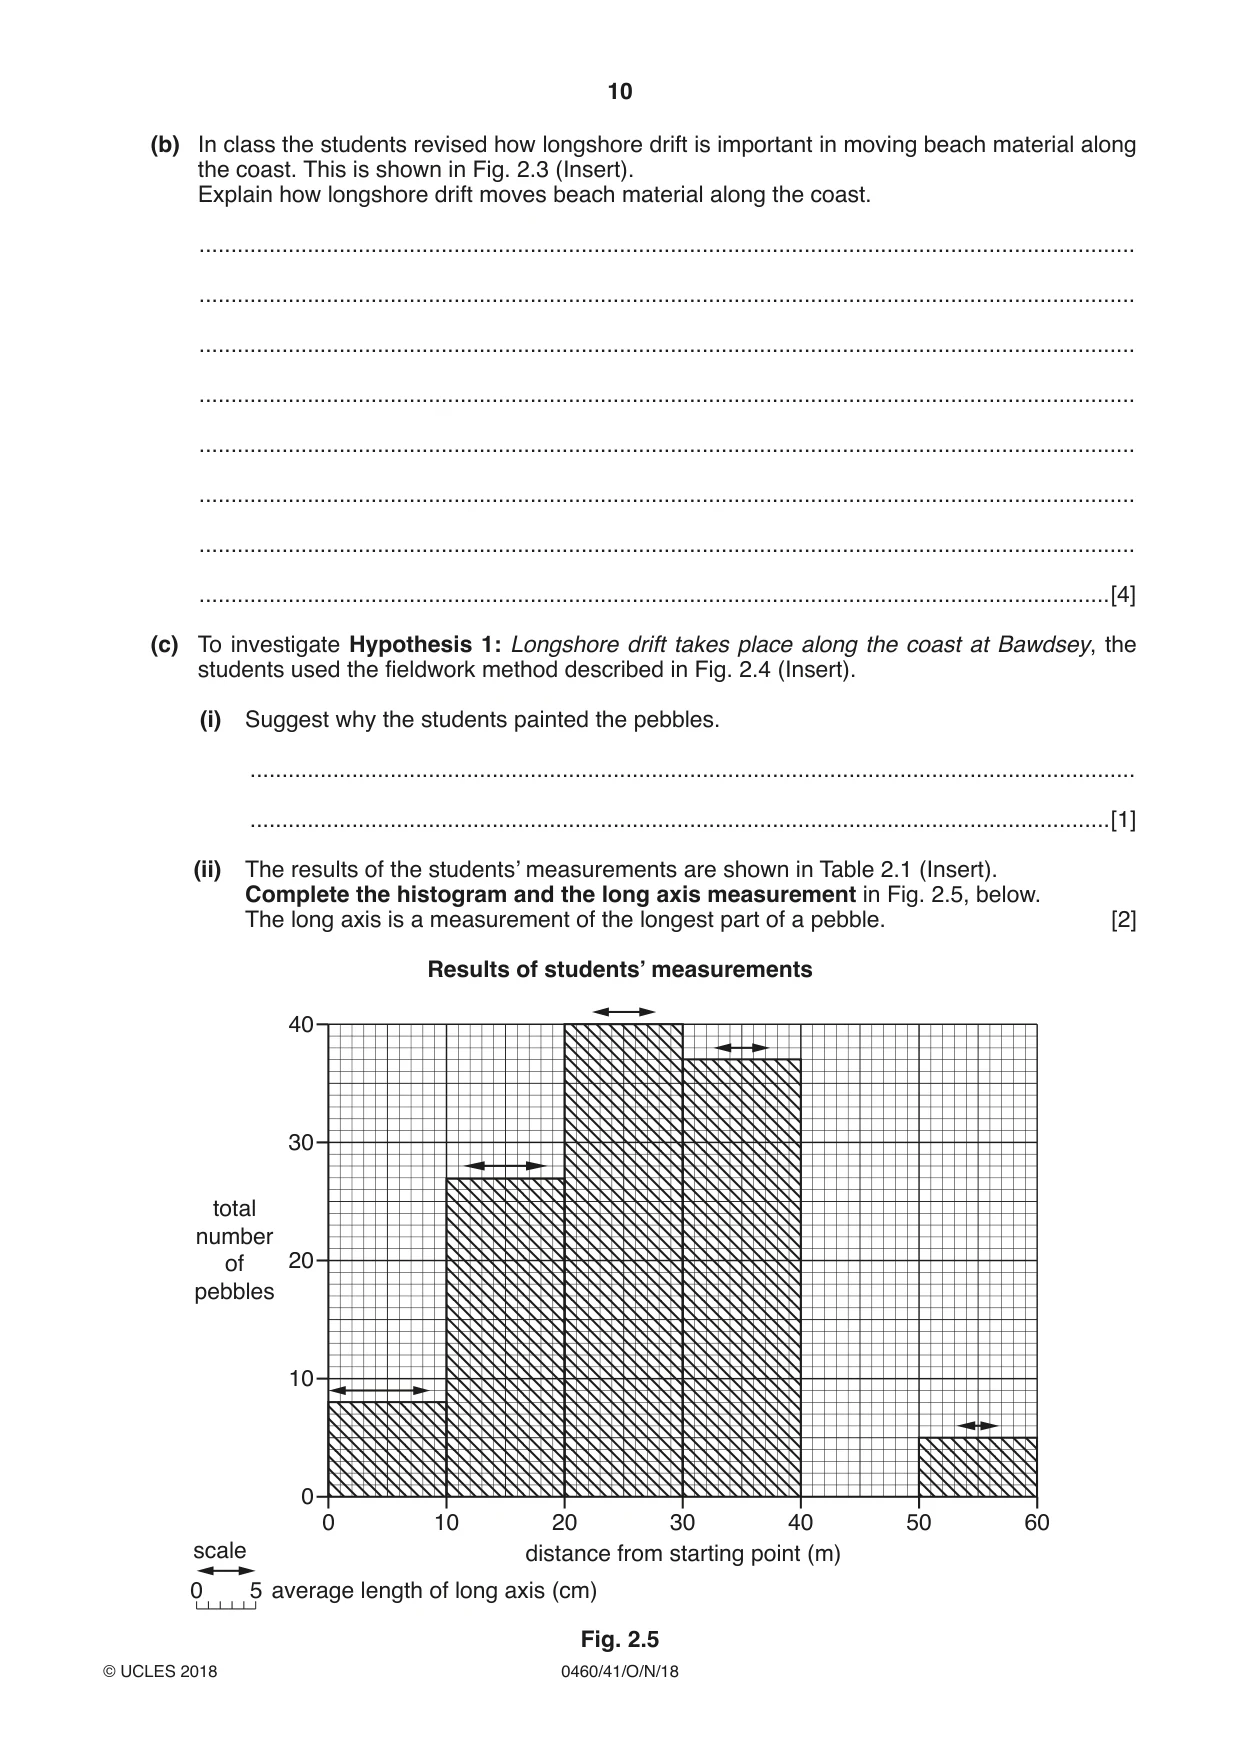
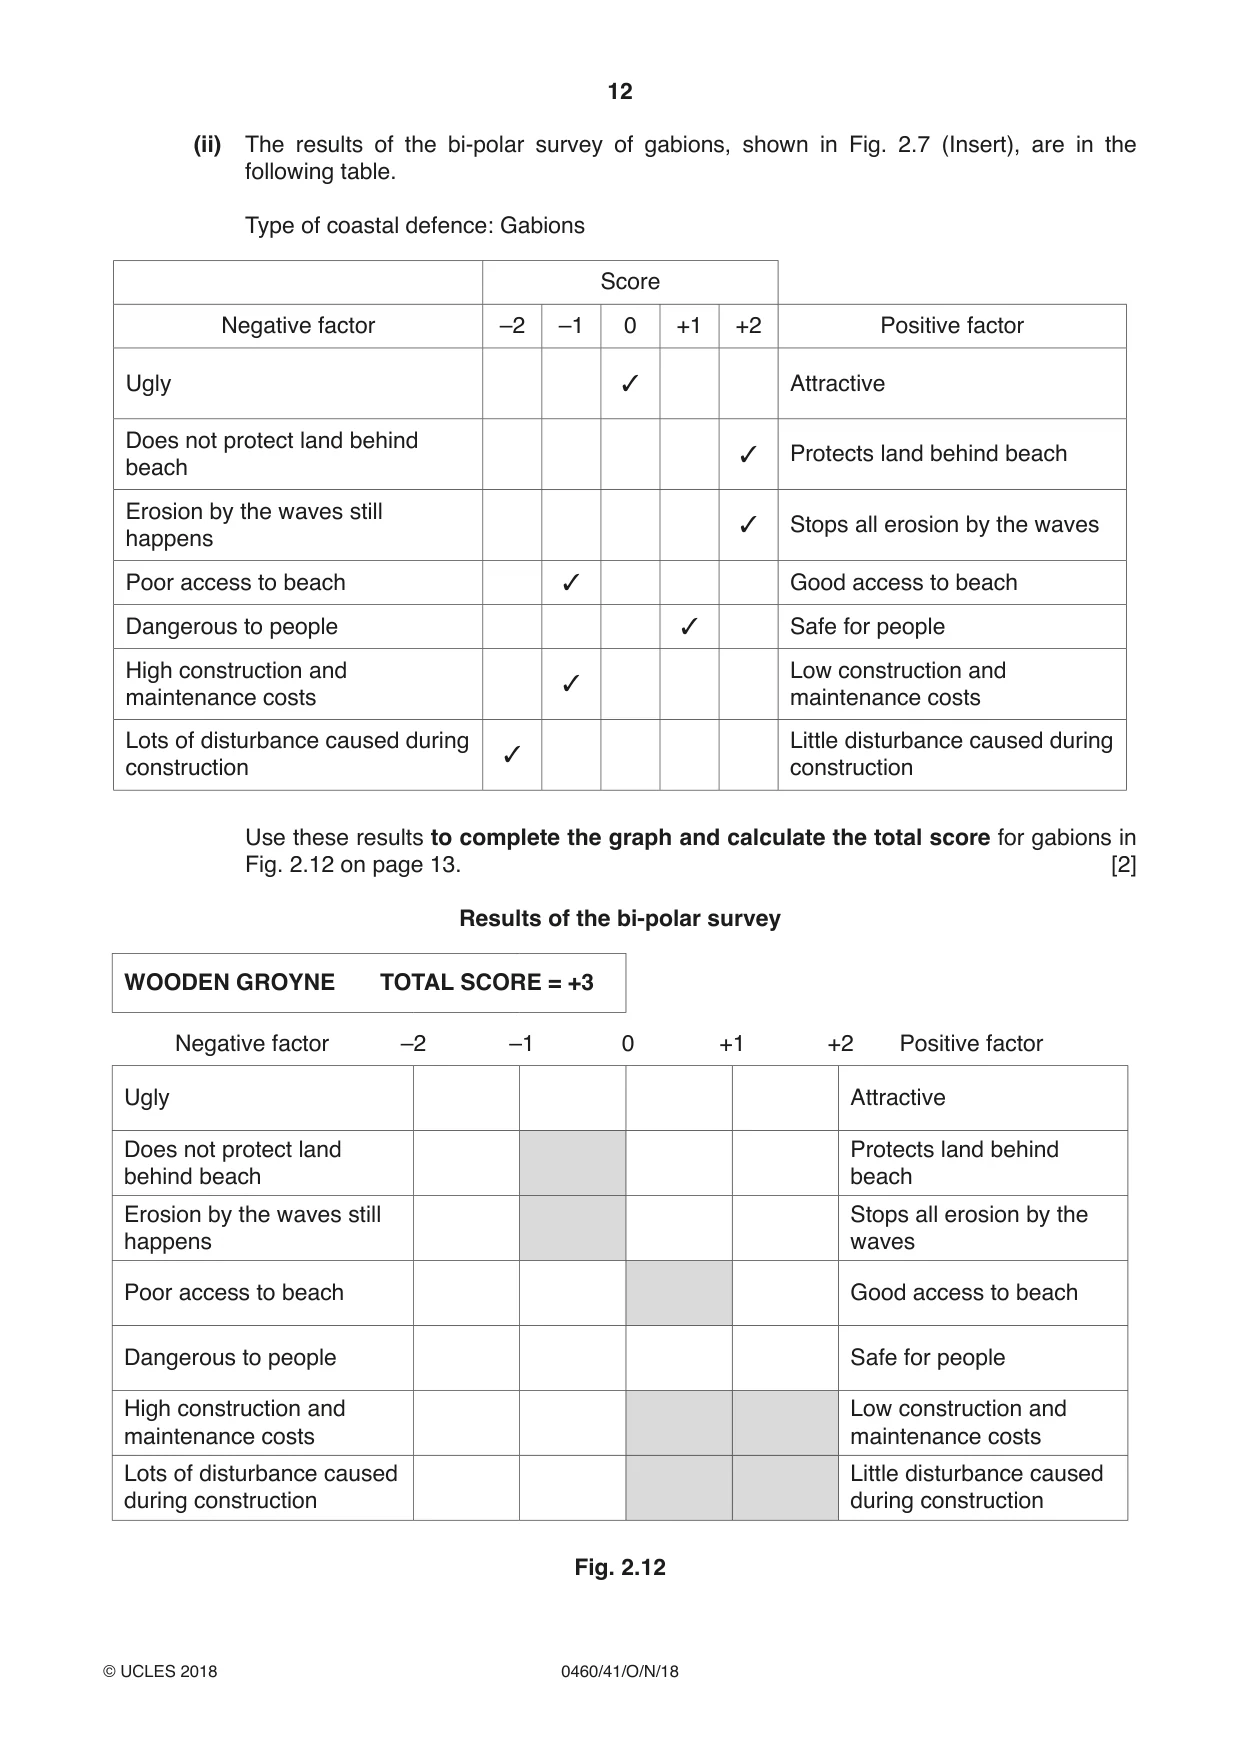
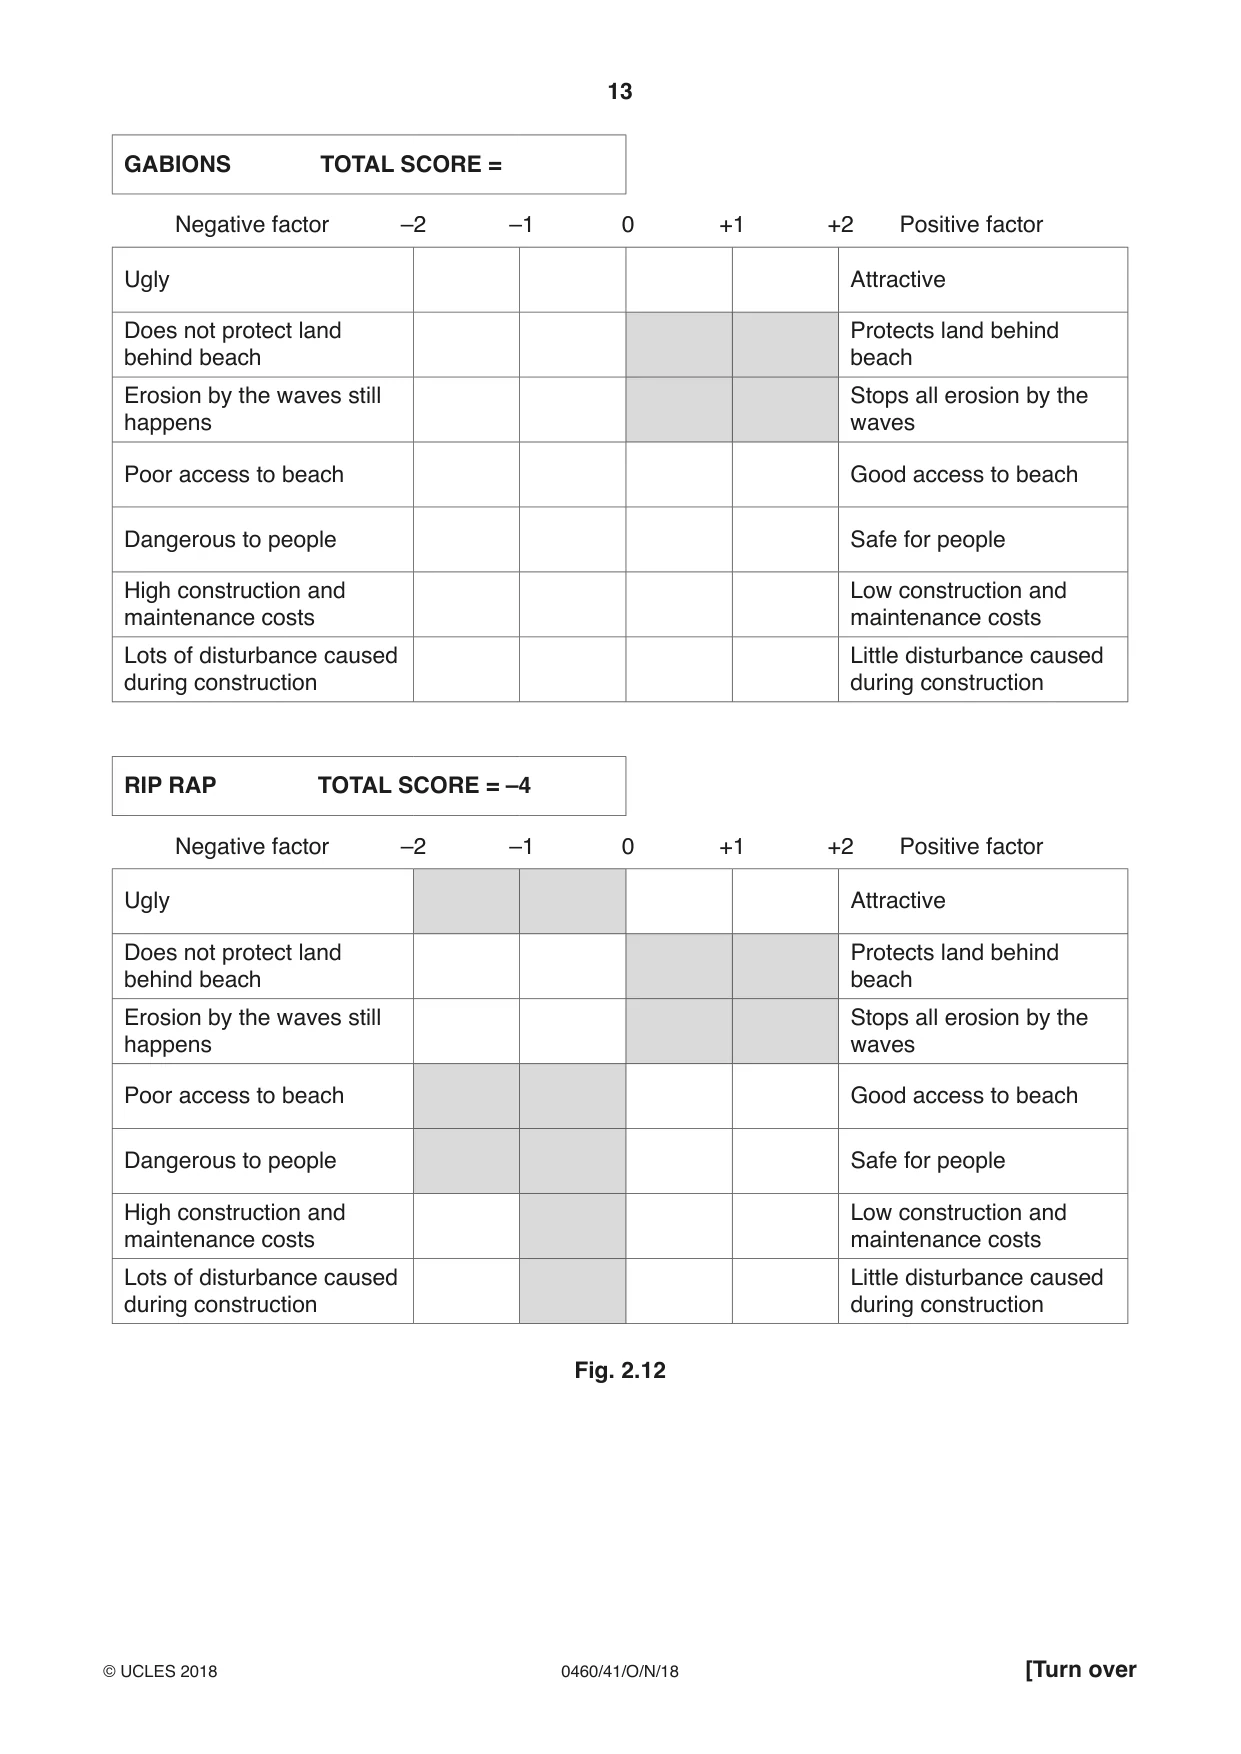
2 A group of students went to do fieldwork at Bawdsey on the east coast of England. They wanted to investigate movement of beach material along the coast and methods of protecting the coast against erosion by the sea. The students agreed to test the following hypotheses: Hypothesis 1: Longshore drift takes place along the coast at Bawdsey. Hypothesis 2: Coastal defences have a positive impact on the coastline. (a) When the students were planning their fieldwork they studied the tide table and weather forecast. These are shown in Figs. 2.1 and 2.2 (Insert). (i) At what date and time is the highest tide forecast in Fig. 2.1? Date .............................. Time .............................. [1] (ii) Explain why the students needed to study the tide table whilst planning fieldwork. ........................................................................................................................................... ........................................................................................................................................... ........................................................................................................................................... .......................................................................................................................................[2] (iii) Look at Fig. 2.2. At what time is there forecast to be the highest temperature, strongest wind and least cloud cover? ........................................ [1] (iv) Give two advantages of studying the weather forecast when planning fieldwork. 1 ........................................................................................................................................ ........................................................................................................................................... 2 ........................................................................................................................................ .......................................................................................................................................[2] (b) In class the students revised how longshore drift is important in moving beach material along the coast. This is shown in Fig. 2.3 (Insert). Explain how longshore drift moves beach material along the coast. ................................................................................................................................................... ................................................................................................................................................... ................................................................................................................................................... ................................................................................................................................................... ................................................................................................................................................... ................................................................................................................................................... ................................................................................................................................................... ...............................................................................................................................................[4] (c) To investigate Hypothesis 1: Longshore drift takes place along the coast at Bawdsey, the students used the fieldwork method described in Fig. 2.4 (Insert). (i) Suggest why the students painted the pebbles. ........................................................................................................................................... .......................................................................................................................................[1] (ii) The results of the students’ measurements are shown in Table 2.1 (Insert). Complete the histogram and the long axis measurement in Fig. 2.5, below. The long axis is a measurement of the longest part of a pebble. [2] Results of students’ measurements 40 30 total number of 20 pebbles 10 0 0 10 20 30 40 50 60 scale distance from starting point (m) 0 5 average length of long axis (cm) Fig. 2.5 (iii) The students’ conclusion was that Hypothesis 1: Longshore drift takes place along the coast at Bawdsey was true. Use evidence from Fig. 2.5 and Table 2.1 to support this conclusion. Refer to different pebble sizes in your answer. ........................................................................................................................................... ........................................................................................................................................... ........................................................................................................................................... ........................................................................................................................................... ........................................................................................................................................... ........................................................................................................................................... ........................................................................................................................................... .......................................................................................................................................[4] (d) In an area further along the coast the students noted some groynes like the one shown in Fig. 2.6 (Insert). Describe the groyne and explain how it can reduce the effect of longshore drift. ................................................................................................................................................... ................................................................................................................................................... ................................................................................................................................................... ...............................................................................................................................................[2] (e) The students also looked at other ways of reducing coastal erosion. These are shown in Figs. 2.7, 2.8, 2.9 and 2.10 (Insert). To investigate Hypothesis 2: Coastal defences have a positive impact on the coastline, the students did a bi-polar survey of the different defences. Their bi-polar survey sheet is shown in Fig. 2.11 (Insert). (i) Describe how the students could make sure their results of the bi-polar survey were reliable. ........................................................................................................................................... ........................................................................................................................................... ........................................................................................................................................... .......................................................................................................................................[2]
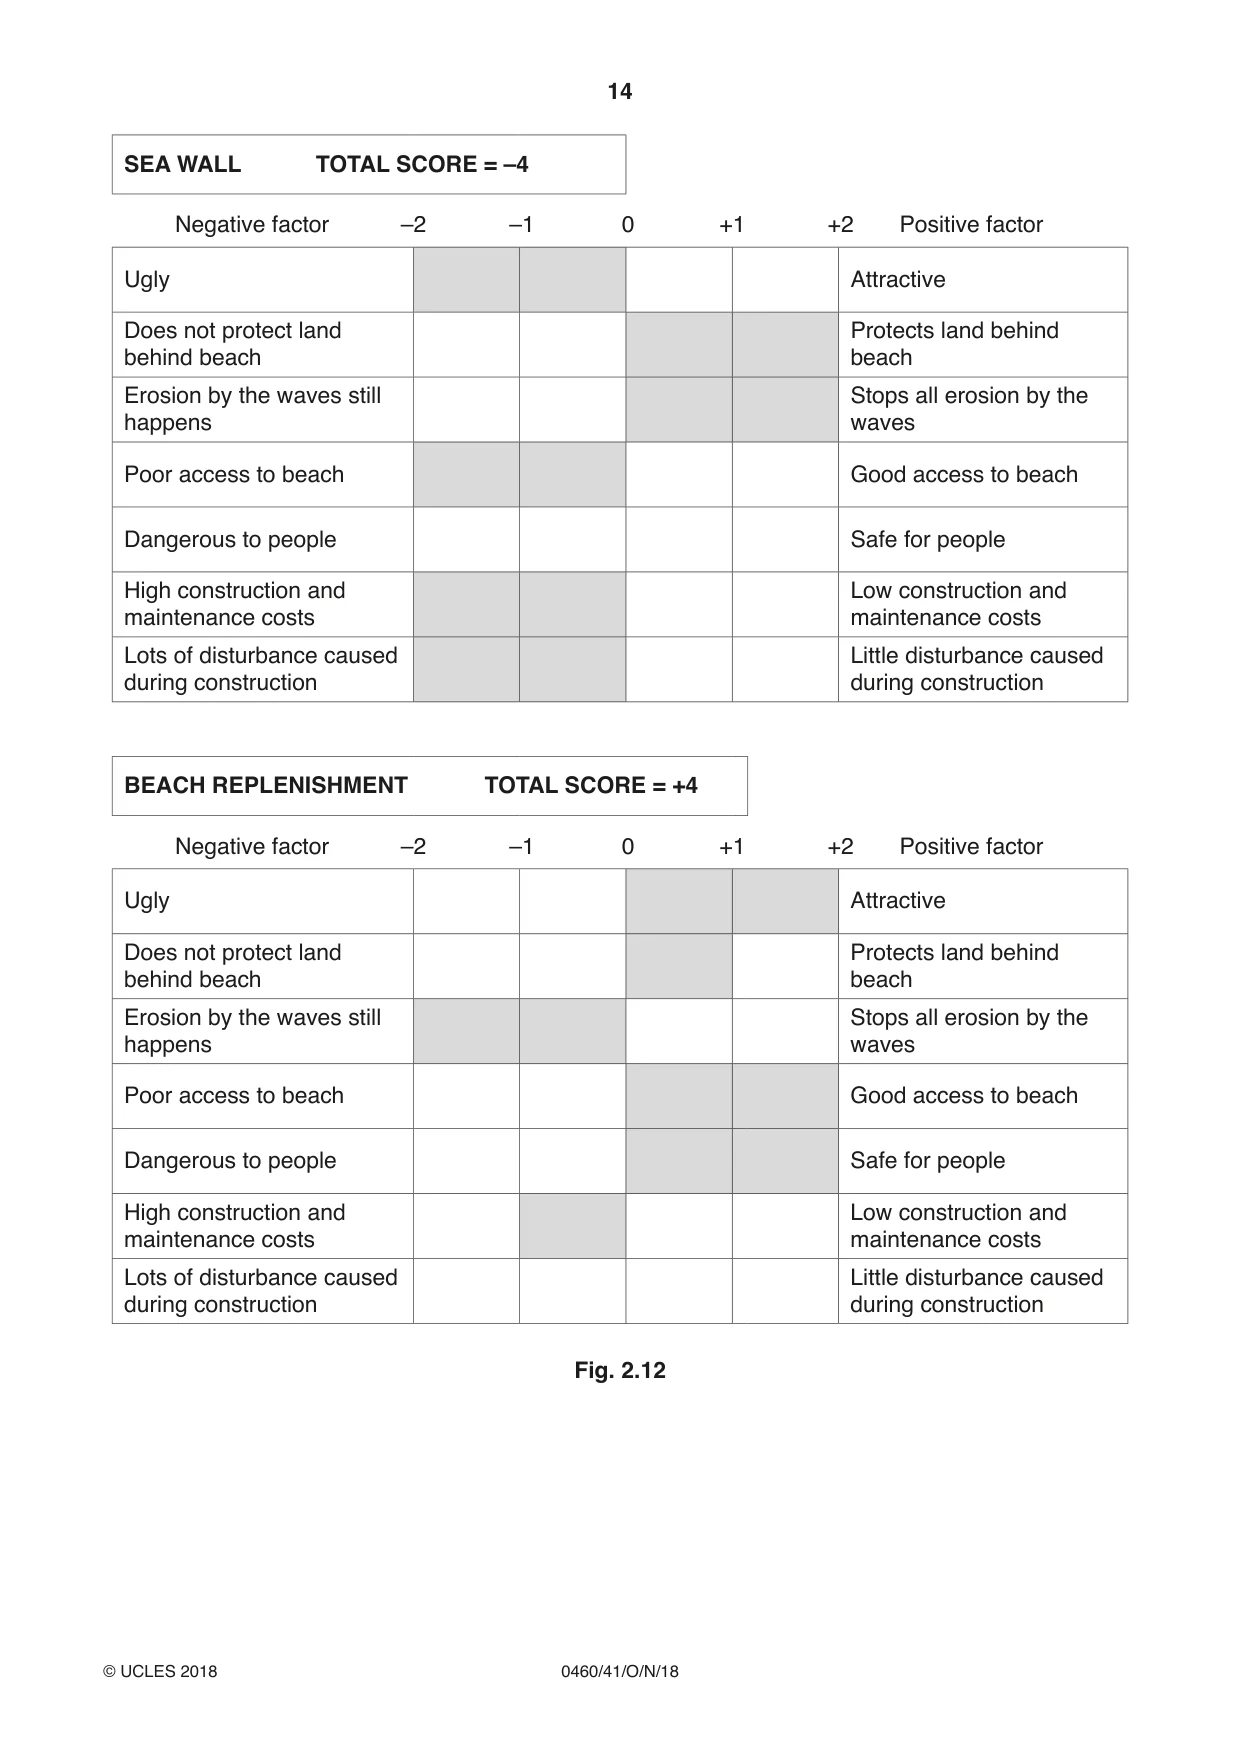
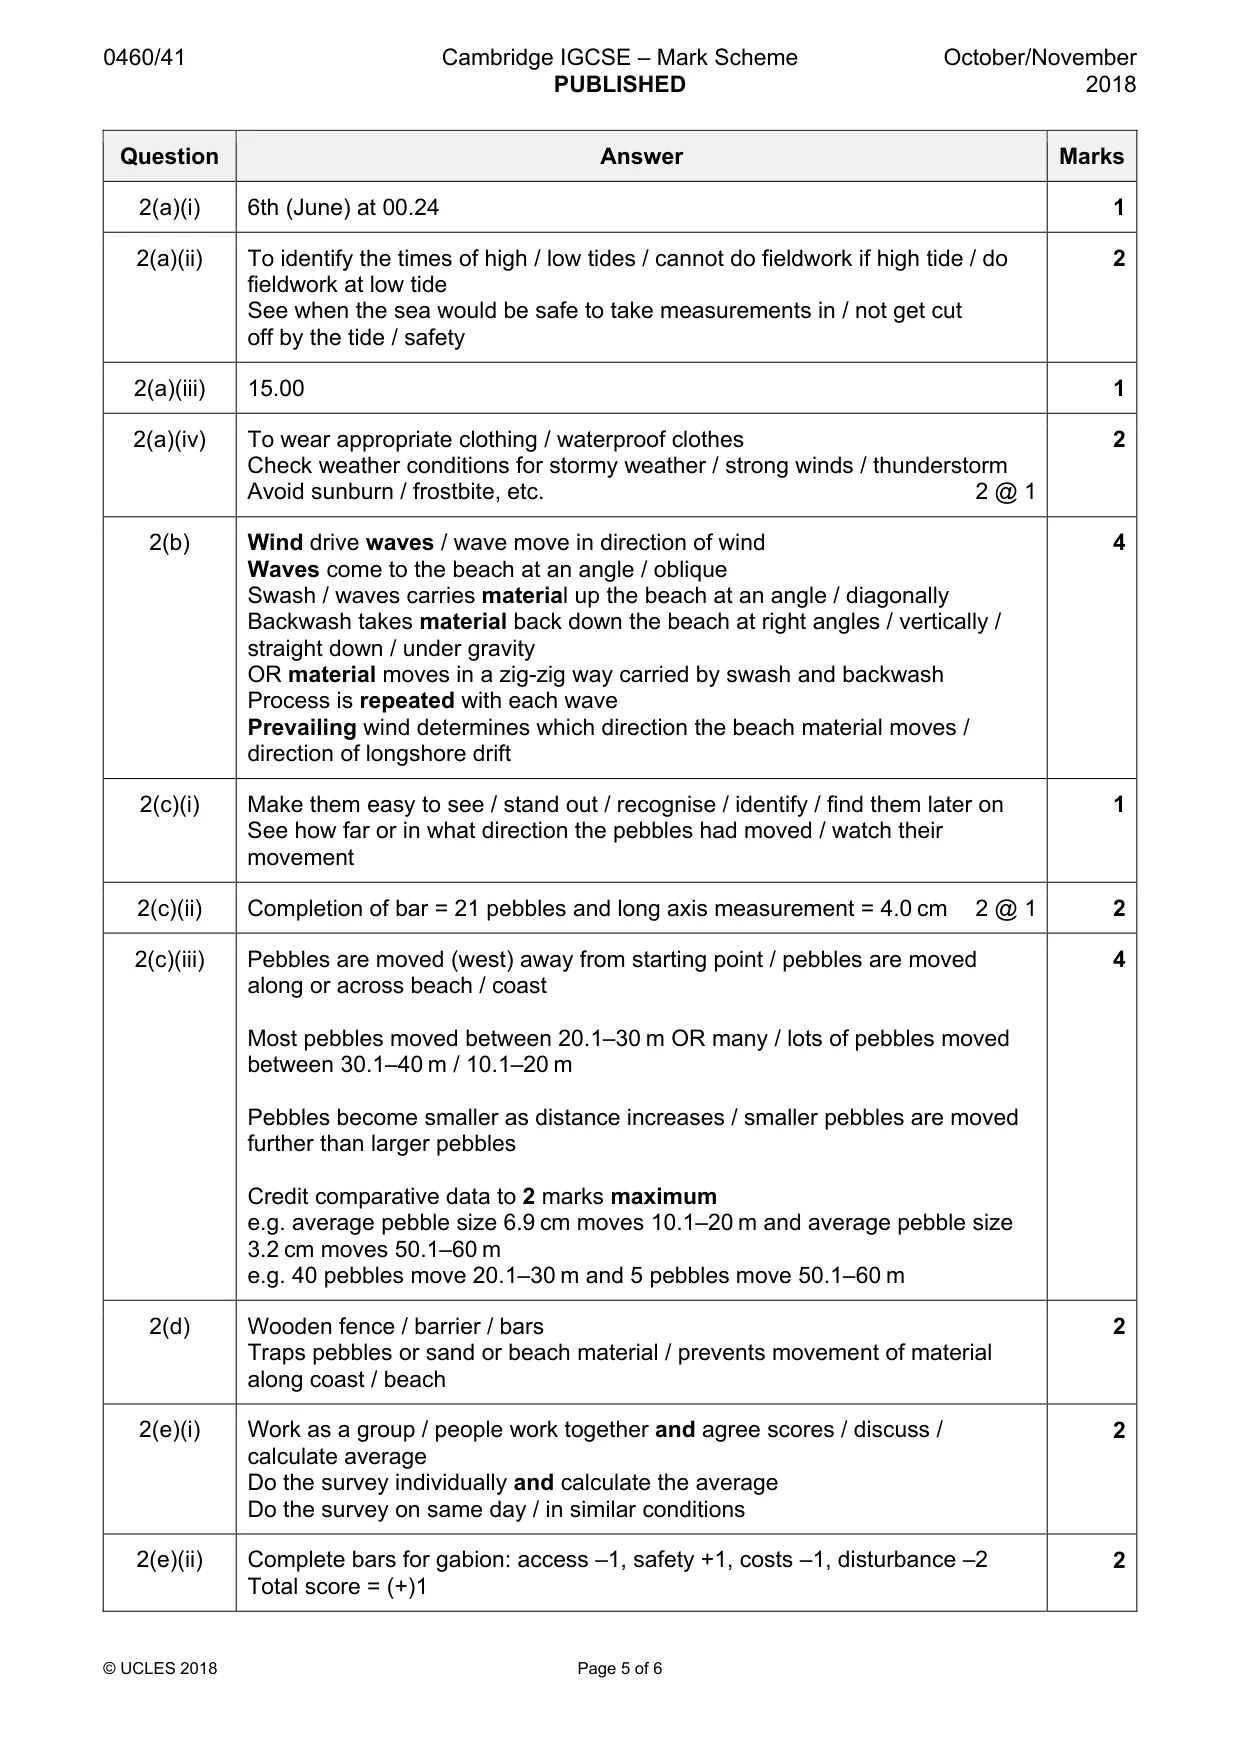
Mark scheme: 2(a)(i) 6th (June) at 00.24 1 2(a)(ii) To identify the times of high / low tides / cannot do fieldwork if high tide / do 2 fieldwork at low tide See when the sea would be safe to take measurements in / not get cut off by the tide / safety 2(a)(iii) 15.00 1 2(a)(iv) To wear appropriate clothing / waterproof clothes 2 Check weather conditions for stormy weather / strong winds / thunderstorm Avoid sunburn / frostbite, etc. 2 @ 1 2(b) Wind drive waves / wave move in direction of wind 4 Waves come to the beach at an angle / oblique Swash / waves carries material up the beach at an angle / diagonally Backwash takes material back down the beach at right angles / vertically / straight down / under gravity OR material moves in a zig-zig way carried by swash and backwash Process is repeated with each wave Prevailing wind determines which direction the beach material moves / direction of longshore drift 2(c)(i) Make them easy to see / stand out / recognise / identify / find them later on 1 See how far or in what direction the pebbles had moved / watch their movement 2(c)(ii) Completion of bar = 21 pebbles and long axis measurement = 4.0 cm 2 @ 1 2 2(c)(iii) Pebbles are moved (west) away from starting point / pebbles are moved 4 along or across beach / coast Most pebbles moved between 20.1–30 m OR many / lots of pebbles moved between 30.1–40 m / 10.1–20 m Pebbles become smaller as distance increases / smaller pebbles are moved further than larger pebbles Credit comparative data to 2 marks maximum e.g. average pebble size 6.9 cm moves 10.1–20 m and average pebble size 3.2 cm moves 50.1–60 m e.g. 40 pebbles move 20.1–30 m and 5 pebbles move 50.1–60 m 2(d) Wooden fence / barrier / bars 2 Traps pebbles or sand or beach material / prevents movement of material along coast / beach 2(e)(i) Work as a group / people work together and agree scores / discuss / 2 calculate average Do the survey individually and calculate the average Do the survey on same day / in similar conditions 2(e)(ii) Complete bars for gabion: access –1, safety +1, costs –1, disturbance –2 2 Total score = (+)1 2(e)(iii) Partially support / for some defences / in some cases / on one hand ...on the 4 other hand / mainly / some positive and some negative / 3 positive and 2 negative / to some extent – 1 mark reserve Positive bi-polar scores for groyne, gabions and beach replenishment Negative scores for rip rap and sea wall Defences with negative scores or e.g. still provide some benefits e.g. protects land / stops erosion OR Defences with positive scores or e.g. are not as effective in protecting land / stopping erosion OR Focus on two defences e.g. sea wall has more negative scores than positive scores whereas beach replenishment has more positive scores than negative scores Reserve 1 mark for paired total data – 1 positive and 1 negative score e.g. groyne = (+)3 and rip rap = –4 2(f) Count number of waves breaking / going up beach / hitting object or person / 3 float rises and falls Count for specified time period / 1–10 minutes Use a stopwatch to measure time / clicker / tally chart to count waves Take an average of a number of counts
What was in this paper
The subtopics covered by these 2 questions, and how many questions each got. Open one in a new tab to see every Cambridge question on it.
What you needed in this session
Cambridge’s own grade thresholds for 2018 Oct/Nov, Paper 4 · Variant 1. A higher threshold means an easier paper — the bar moves with how the cohort did.