Cambridge IGCSE Geography 0460 — 2018 May/June Paper 4 · Variant 3
0460/43/M/J/18 · 2 questions · 60 marks · ≈68 min
The question paper and its mark scheme, free to read here and free to download. This is Cambridge’s own paper, exactly as it was sat.
Question paper20 pages

Mark scheme7 pages
Answers below. Sit the paper first if you are practising.


Questions as text
Q1 · Students at a college in southern England were studying how to collect weather data and…
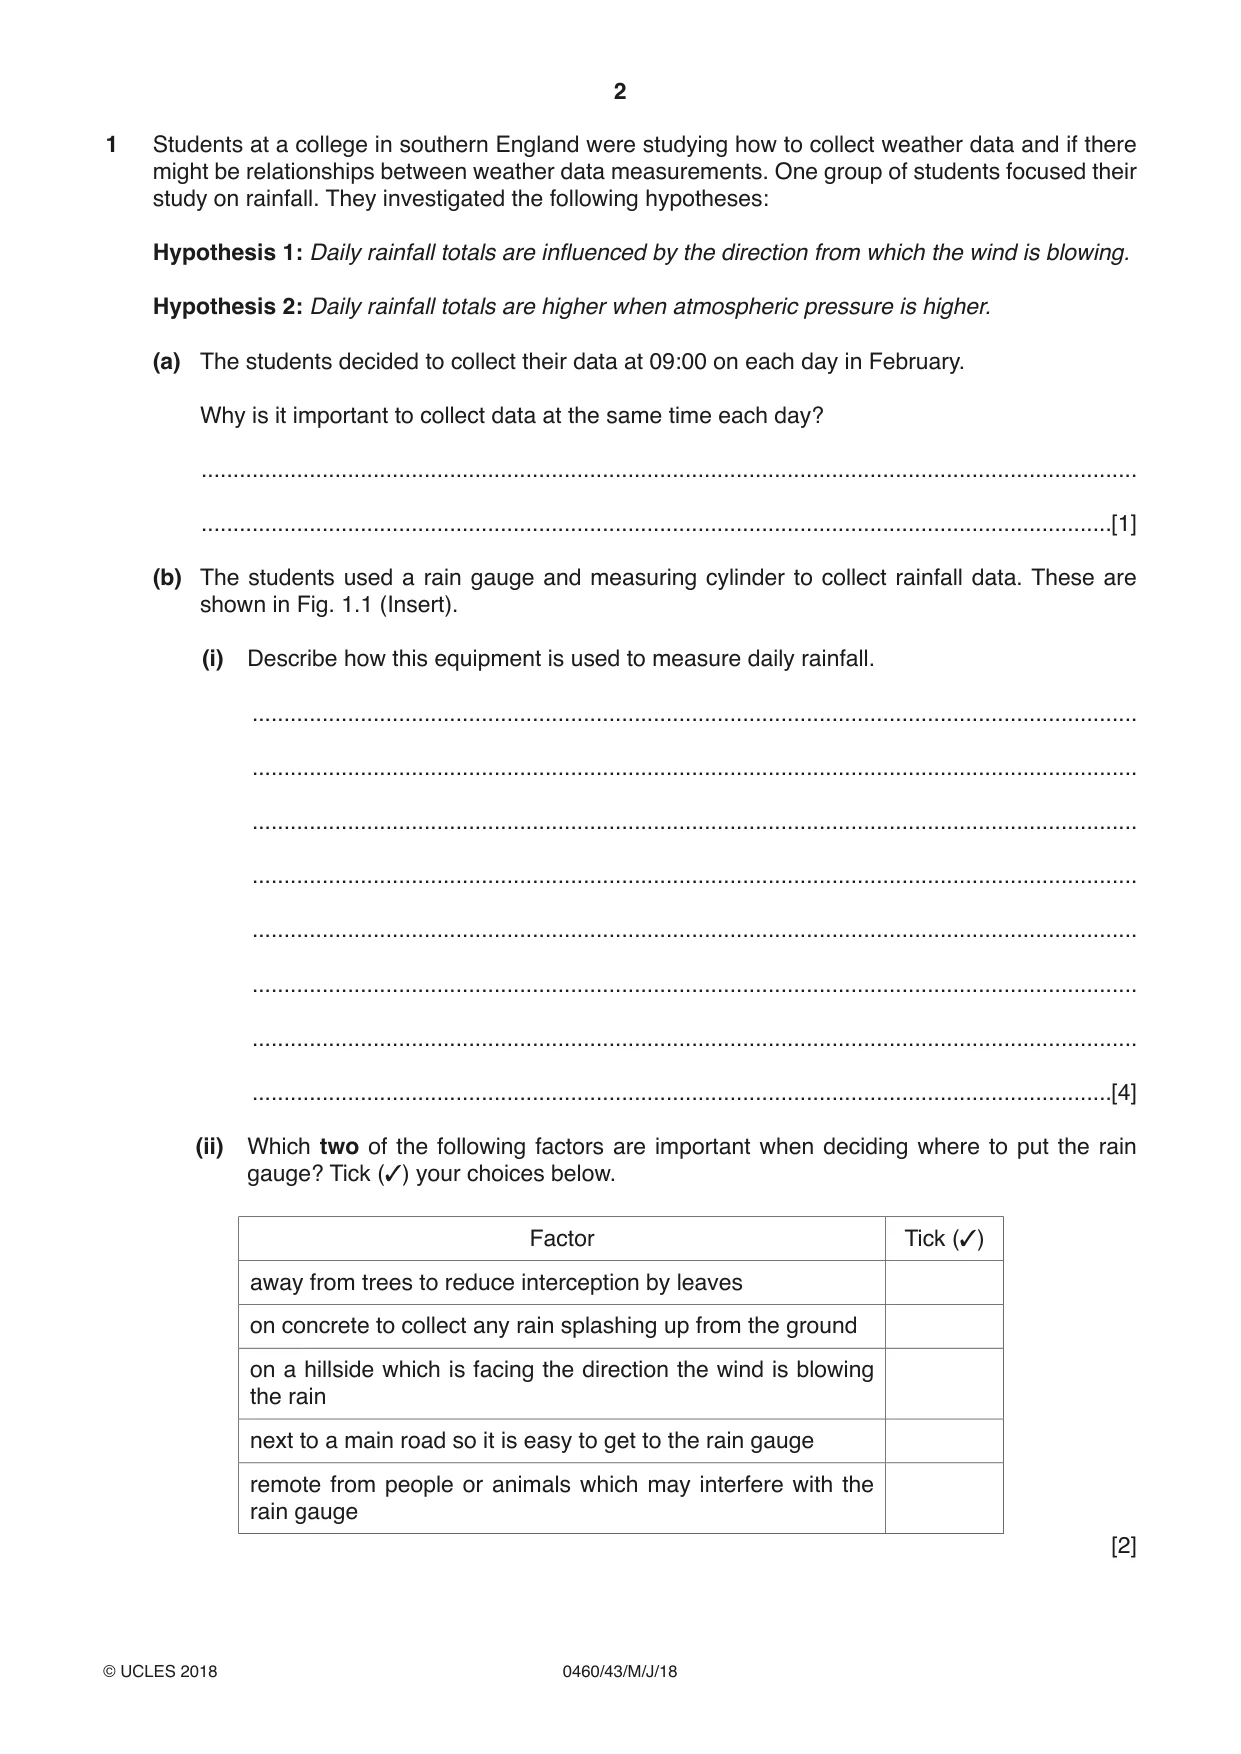
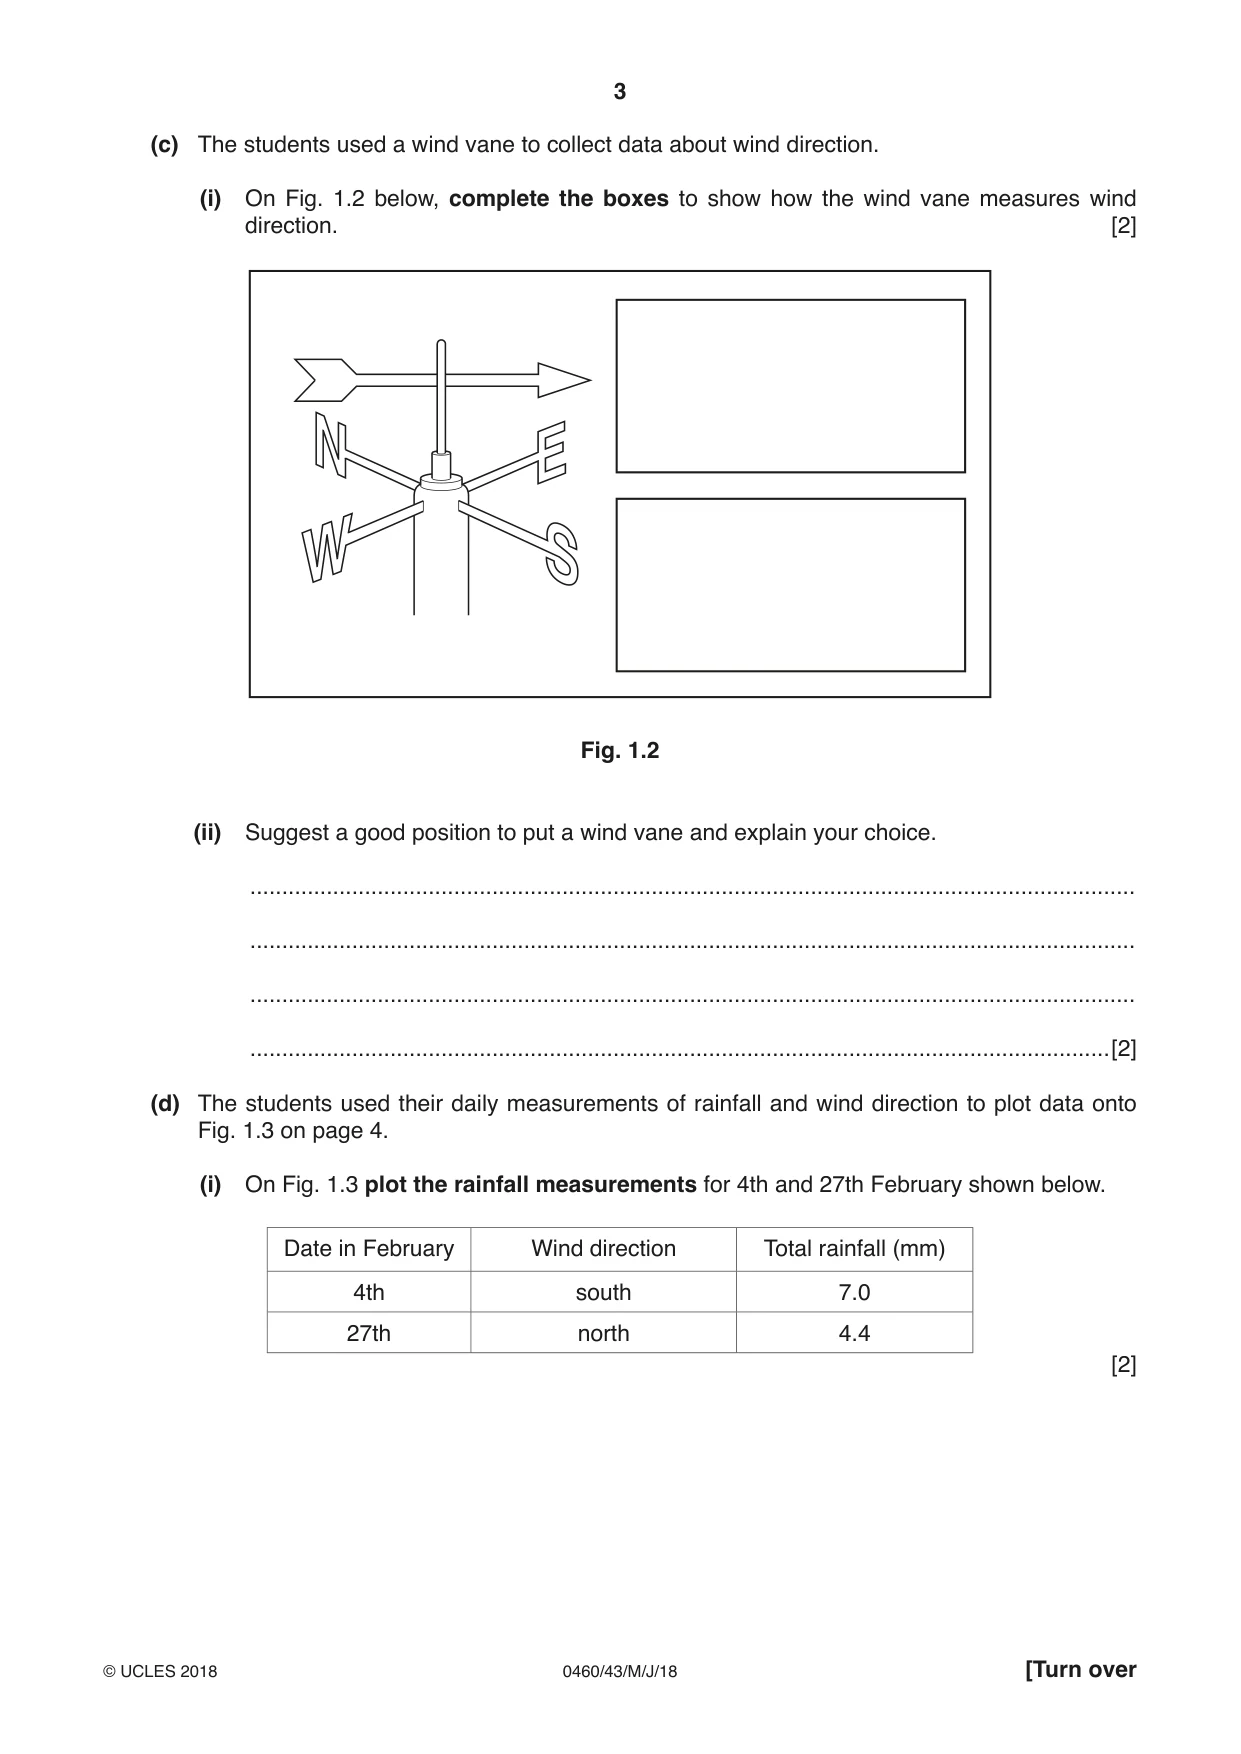
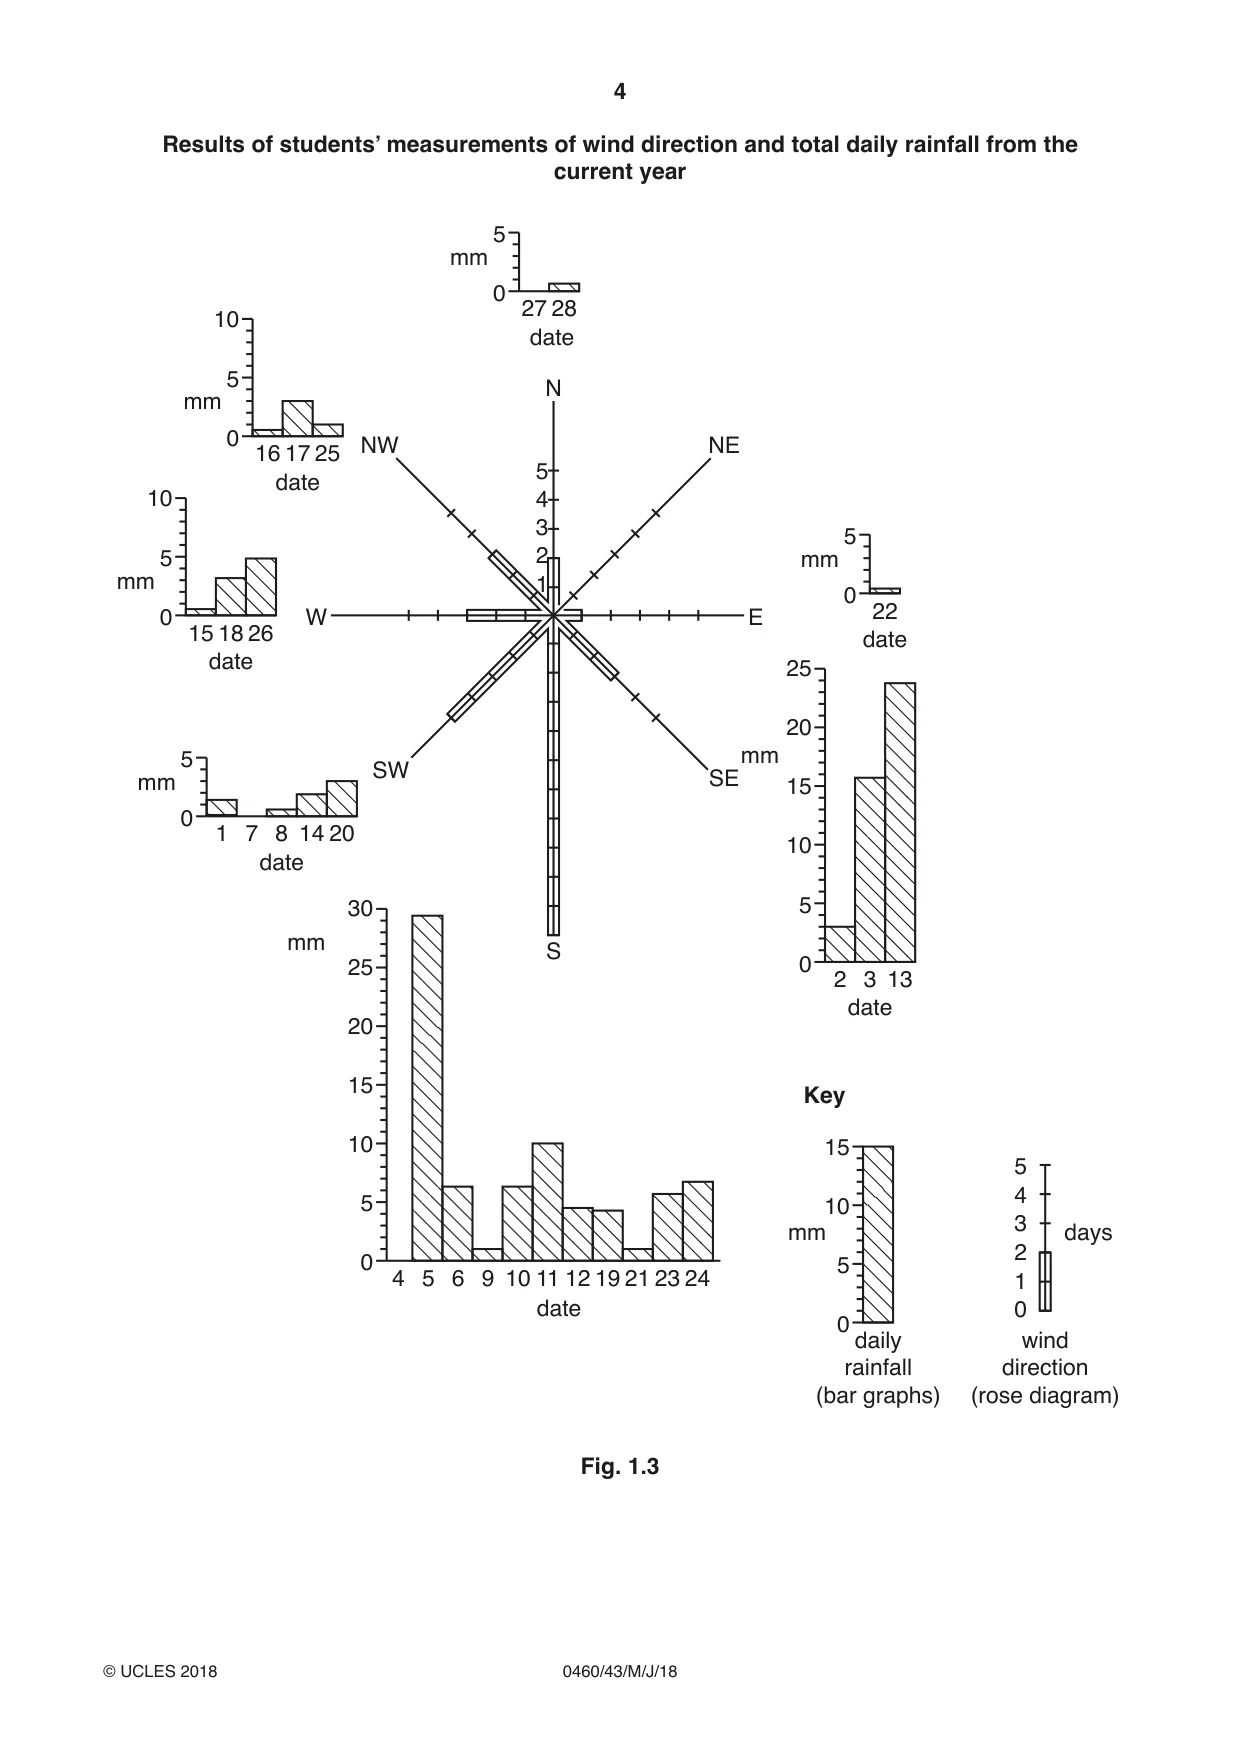
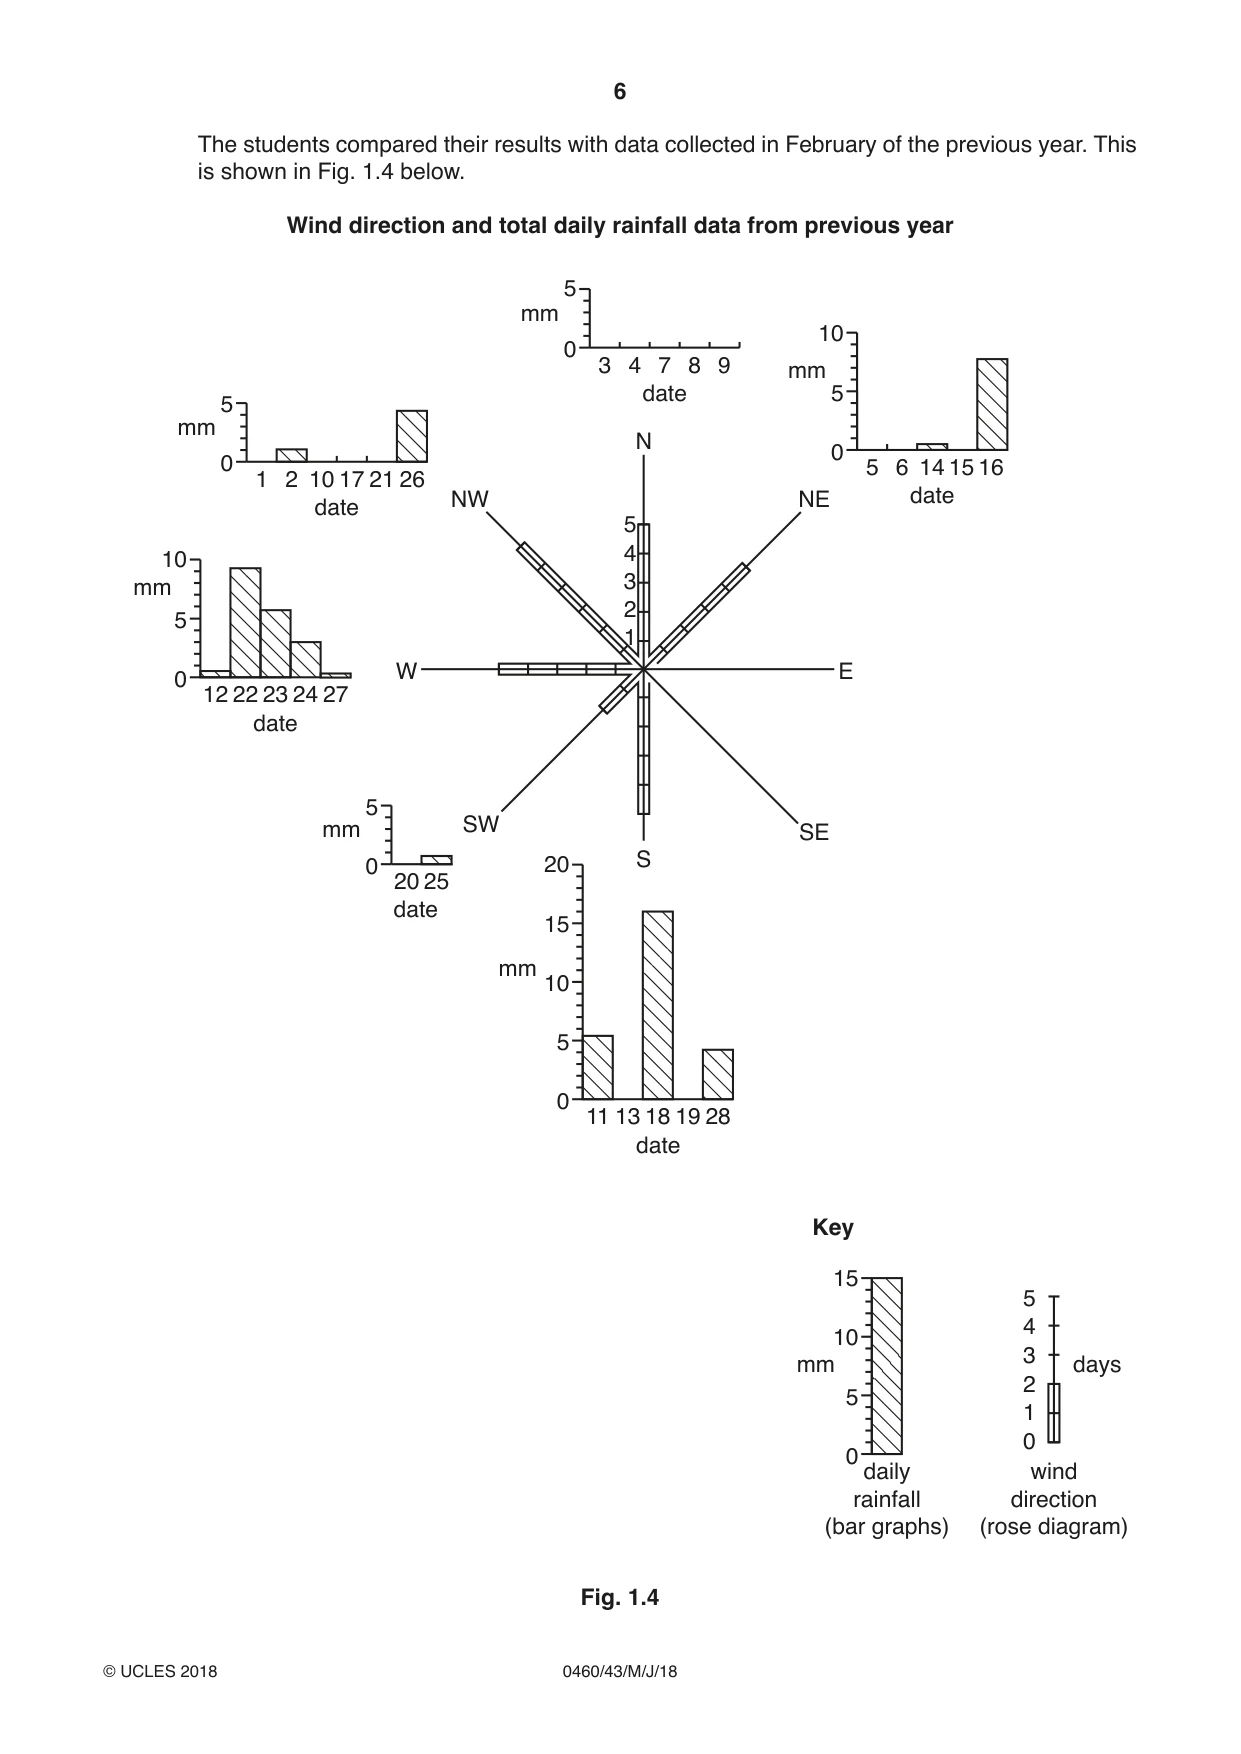
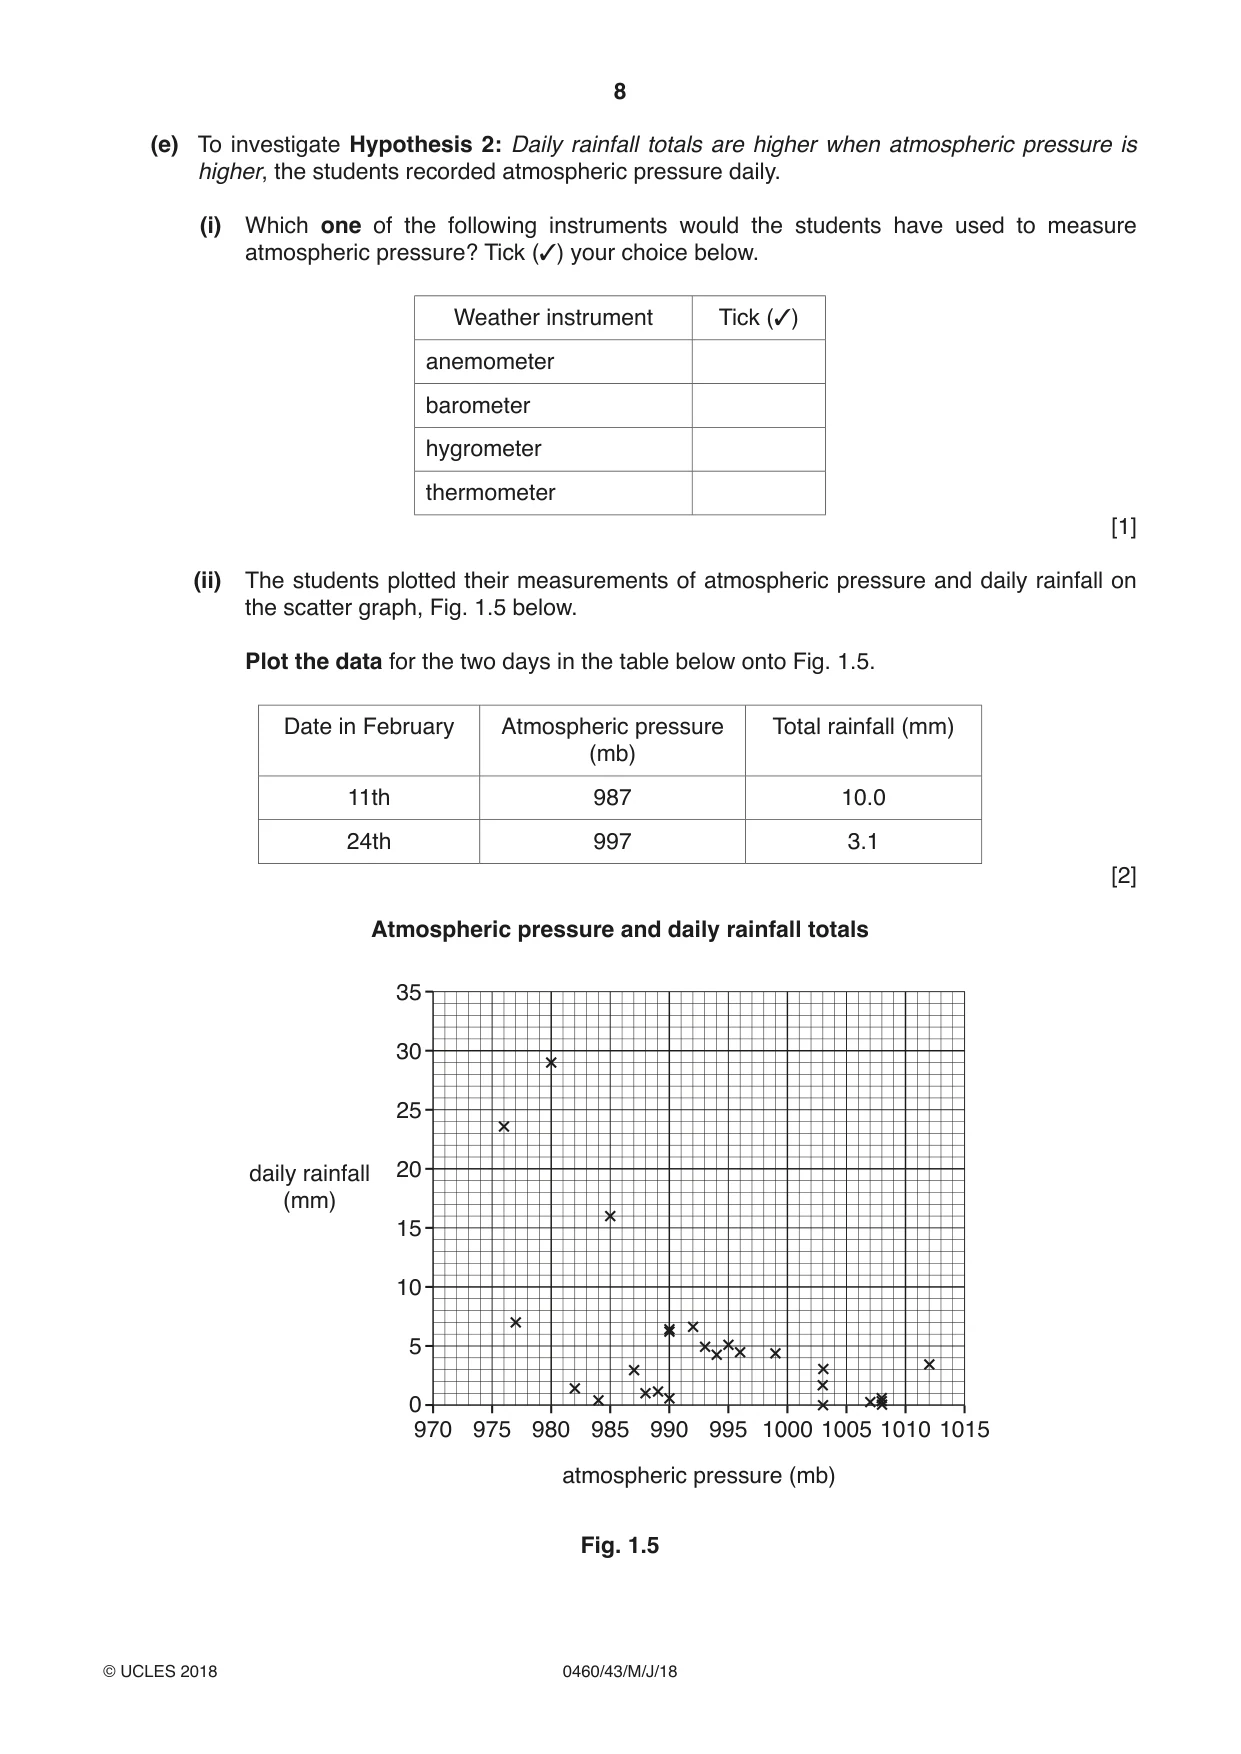
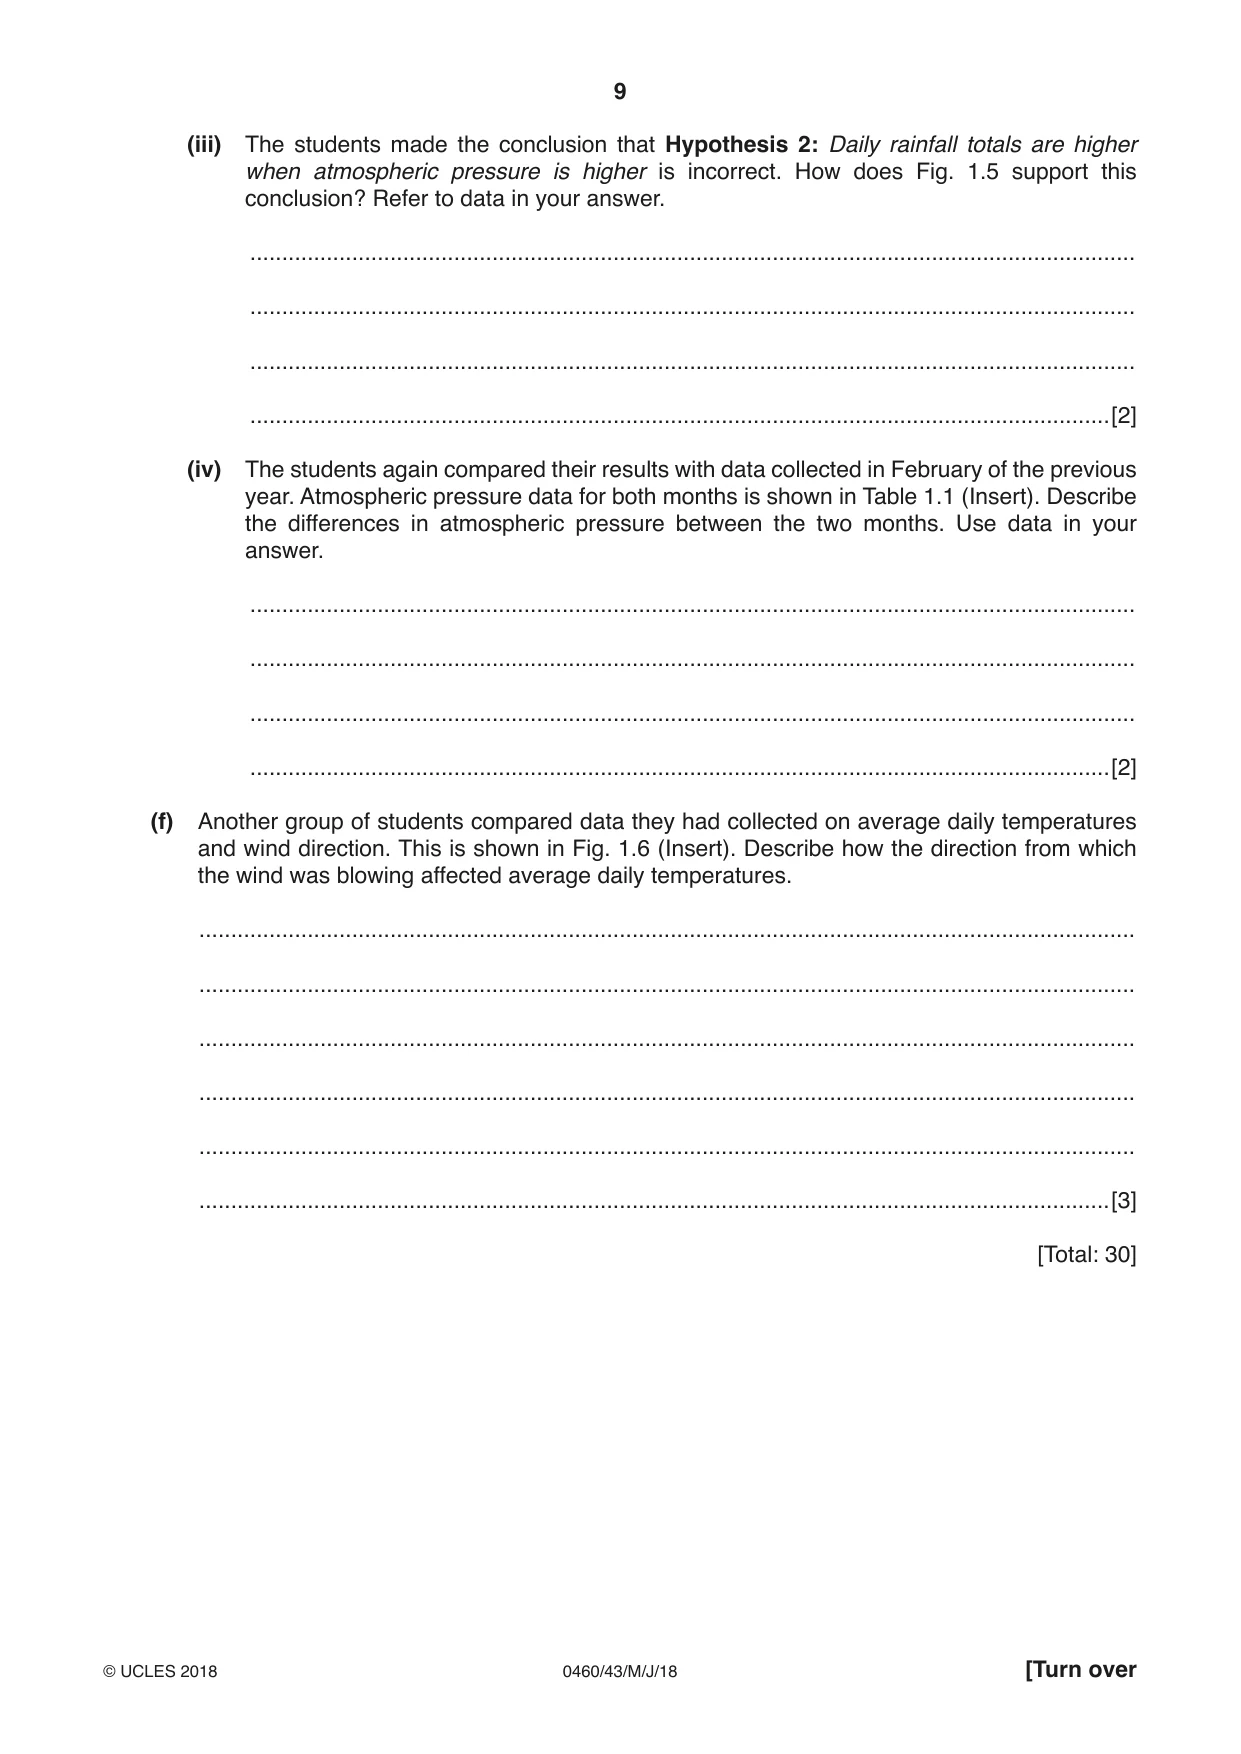
1 Students at a college in southern England were studying how to collect weather data and if there might be relationships between weather data measurements. One group of students focused their study on rainfall. They investigated the following hypotheses: Hypothesis 1: Daily rainfall totals are influenced by the direction from which the wind is blowing. Hypothesis 2: Daily rainfall totals are higher when atmospheric pressure is higher. (a) The students decided to collect their data at 09:00 on each day in February. Why is it important to collect data at the same time each day? ................................................................................................................................................... ...............................................................................................................................................[1] (b) The students used a rain gauge and measuring cylinder to collect rainfall data. These are shown in Fig. 1.1 (Insert). (i) Describe how this equipment is used to measure daily rainfall. ........................................................................................................................................... ........................................................................................................................................... ........................................................................................................................................... ........................................................................................................................................... ........................................................................................................................................... ........................................................................................................................................... ........................................................................................................................................... .......................................................................................................................................[4] (ii) Which two of the following factors are important when deciding where to put the rain gauge? Tick (3) your choices below. Factor Tick (3) away from trees to reduce interception by leaves on concrete to collect any rain splashing up from the ground on a hillside which is facing the direction the wind is blowing the rain next to a main road so it is easy to get to the rain gauge remote from people or animals which may interfere with the rain gauge [2] (c) The students used a wind vane to collect data about wind direction. (i) On Fig. 1.2 below, complete the boxes to show how the wind vane measures wind direction. [2] Fig. 1.2 (ii) Suggest a good position to put a wind vane and explain your choice. ........................................................................................................................................... ........................................................................................................................................... ........................................................................................................................................... .......................................................................................................................................[2] (d) The students used their daily measurements of rainfall and wind direction to plot data onto Fig. 1.3 on page 4. (i) On Fig. 1.3 plot the rainfall measurements for 4th and 27th February shown below. Date in February Wind direction Total rainfall (mm) 4th south 7.0 27th north 4.4 [2] Results of students’ measurements of wind direction and total daily rainfall from the current year 5 mm 0 27 28 10 date 5 N mm 0 NW NE 16 17 25 5 date 10 4 3 5 5 2 mm mm 1 0 22 0 W E 15 18 26 date date 25 20 5 mm SW mm SE 15 0 1 7 8 14 20 10 date 30 5 mm S 25 0 2 3 13 date 20 15 Key 10 15 5 4 5 10 3 mm days 2 0 5 4 5 6 9 10 11 12 19 21 23 24 1 date 0 0 daily wind rainfall direction (bar graphs) (rose diagram) Fig. 1.3 (ii) What conclusion would the students make about Hypothesis 1: Daily rainfall totals are influenced by the direction from which the wind is blowing? Support your answer with evidence from Fig. 1.3. ........................................................................................................................................... ........................................................................................................................................... ........................................................................................................................................... ........................................................................................................................................... ........................................................................................................................................... ........................................................................................................................................... ........................................................................................................................................... .......................................................................................................................................[4] The students compared their results with data collected in February of the previous year. This is shown in Fig. 1.4 below. Wind direction and total daily rainfall data from previous year 5 mm 10 0 3 4 7 8 9 mm date 5 5 mm N 0 0 5 6 14 15 16 1 2 10 17 21 26 NW NE date date 5 10 4 mm 3 2 5 1 W E 0 12 22 23 24 27 date 5 mm SW SE 0 20 S 20 25 date 15 mm 10 5 0 11 13 18 19 28 date Key 15 5 4 10 3 mm days 2 5 1 0 0 daily wind rainfall direction (bar graphs) (rose diagram) Fig. 1.4 (iii) Describe how wind direction in February varied between the two years shown in Figs. 1.3 and 1.4. Use data in your answer. ........................................................................................................................................... ........................................................................................................................................... ........................................................................................................................................... .......................................................................................................................................[2] (iv) What effect did the difference in wind direction have on daily amounts of rainfall in February in the two years? ........................................................................................................................................... .......................................................................................................................................[1] (e) To investigate Hypothesis 2: Daily rainfall totals are higher when atmospheric pressure is higher, the students recorded atmospheric pressure daily. (i) Which one of the following instruments would the students have used to measure atmospheric pressure? Tick (3) your choice below. Weather instrument Tick (3) anemometer barometer hygrometer thermometer [1] (ii) The students plotted their measurements of atmospheric pressure and daily rainfall on the scatter graph, Fig. 1.5 below. Plot the data for the two days in the table below onto Fig. 1.5. Date in February Atmospheric pressure Total rainfall (mm) (mb) 11th 987 10.0 24th 997 3.1 [2] Atmospheric pressure and daily rainfall totals 35 30 25 daily rainfall 20 (mm) 15 10 5 0 970 975 980 985 990 995 1000 1005 1010 1015 atmospheric pressure (mb) Fig. 1.5 (iii) The students made the conclusion that Hypothesis 2: Daily rainfall totals are higher when atmospheric pressure is higher is incorrect. How does Fig. 1.5 support this conclusion? Refer to data in your answer. ........................................................................................................................................... ........................................................................................................................................... ........................................................................................................................................... .......................................................................................................................................[2] (iv) The students again compared their results with data collected in February of the previous year. Atmospheric pressure data for both months is shown in Table 1.1 (Insert). Describe the differences in atmospheric pressure between the two months. Use data in your answer. ........................................................................................................................................... ........................................................................................................................................... ........................................................................................................................................... .......................................................................................................................................[2] (f) Another group of students compared data they had collected on average daily temperatures and wind direction. This is shown in Fig. 1.6 (Insert). Describe how the direction from which the wind was blowing affected average daily temperatures. ................................................................................................................................................... ................................................................................................................................................... ................................................................................................................................................... ................................................................................................................................................... ................................................................................................................................................... ...............................................................................................................................................[3] [Total: 30]
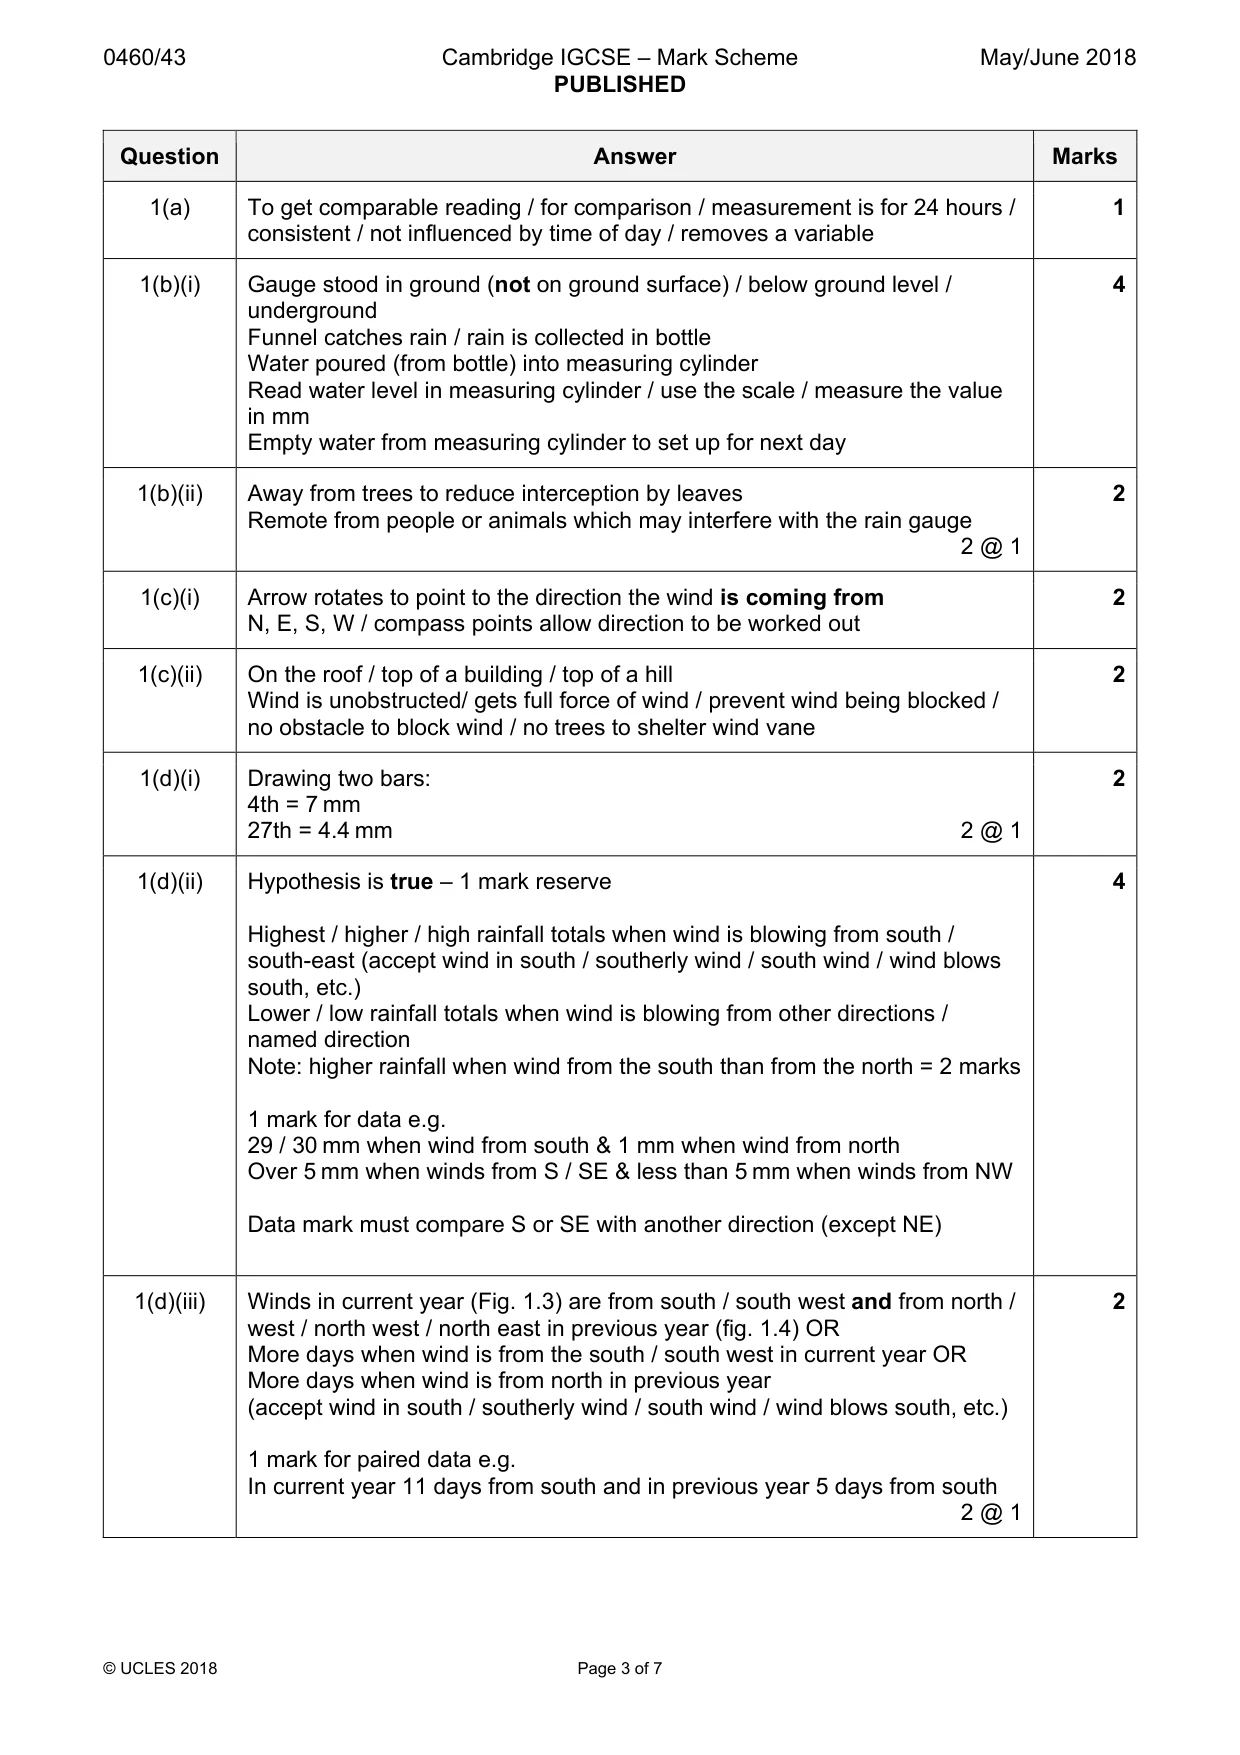
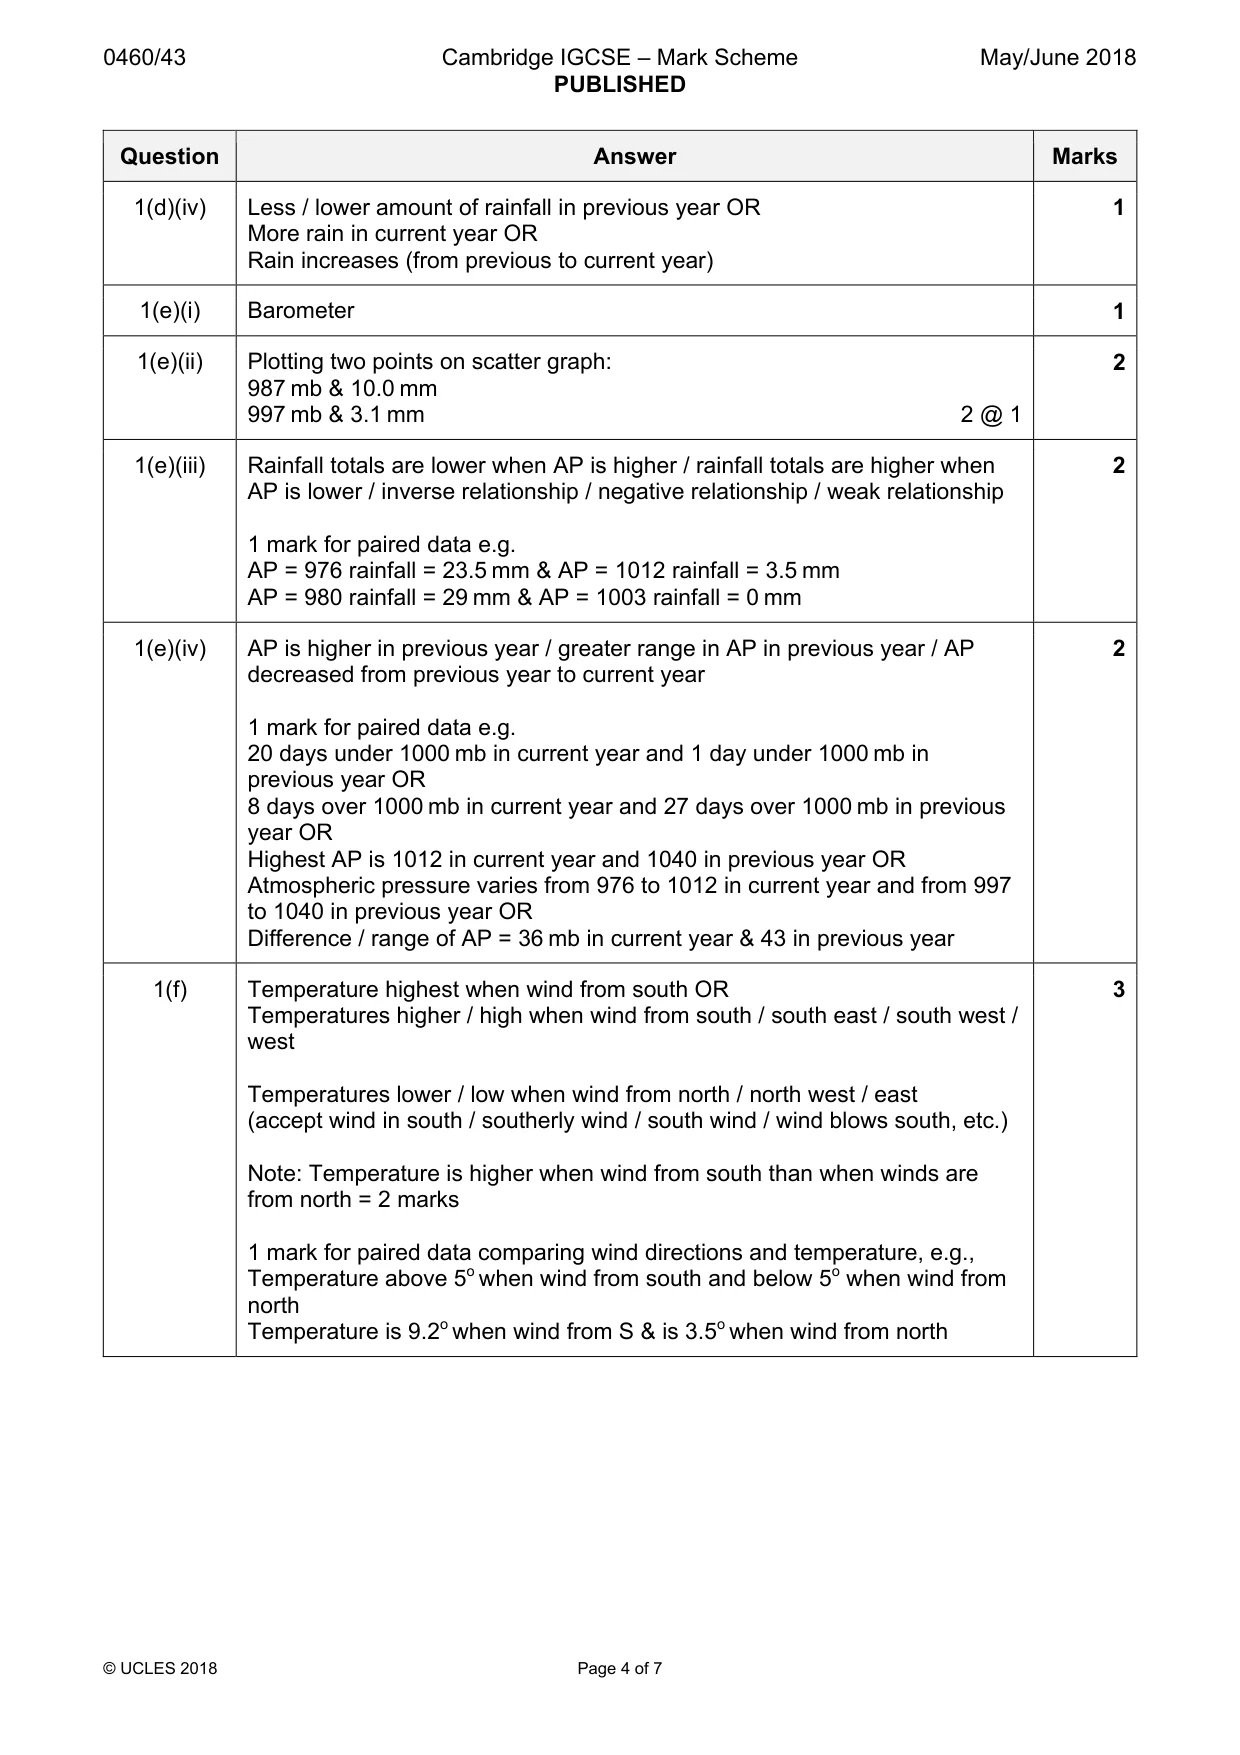
Mark scheme: Question Answer Marks 1(a) To get comparable reading / for comparison / measurement is for 24 hours / 1 consistent / not influenced by time of day / removes a variable 1(b)(i) Gauge stood in ground (not on ground surface) / below ground level / 4 underground Funnel catches rain / rain is collected in bottle Water poured (from bottle) into measuring cylinder Read water level in measuring cylinder / use the scale / measure the value in mm Empty water from measuring cylinder to set up for next day 1(b)(ii) Away from trees to reduce interception by leaves 2 Remote from people or animals which may interfere with the rain gauge 2 @ 1 1(c)(i) Arrow rotates to point to the direction the wind is coming from 2 N, E, S, W / compass points allow direction to be worked out 1(c)(ii) On the roof / top of a building / top of a hill 2 Wind is unobstructed/ gets full force of wind / prevent wind being blocked / no obstacle to block wind / no trees to shelter wind vane 1(d)(i) Drawing two bars: 2 4th = 7 mm 27th = 4.4 mm 2 @ 1 1(d)(ii) Hypothesis is true – 1 mark reserve 4 Highest / higher / high rainfall totals when wind is blowing from south / south-east (accept wind in south / southerly wind / south wind / wind blows south, etc.) Lower / low rainfall totals when wind is blowing from other directions / named direction Note: higher rainfall when wind from the south than from the north = 2 marks 1 mark for data e.g. 29 / 30 mm when wind from south & 1 mm when wind from north Over 5 mm when winds from S / SE & less than 5 mm when winds from NW Data mark must compare S or SE with another direction (except NE) 1(d)(iii) Winds in current year (Fig. 1.3) are from south / south west and from north / 2 west / north west / north east in previous year (fig. 1.4) OR More days when wind is from the south / south west in current year OR More days when wind is from north in previous year (accept wind in south / southerly wind / south wind / wind blows south, etc.) 1 mark for paired data e.g. In current year 11 days from south and in previous year 5 days from south 2 @ 1 1(d)(iv) Less / lower amount of rainfall in previous year OR 1 More rain in current year OR Rain increases (from previous to current year) 1(e)(i) Barometer 1 1(e)(ii) Plotting two points on scatter graph: 2 987 mb & 10.0 mm 997 mb & 3.1 mm 2 @ 1 1(e)(iii) Rainfall totals are lower when AP is higher / rainfall totals are higher when 2 AP is lower / inverse relationship / negative relationship / weak relationship 1 mark for paired data e.g. AP = 976 rainfall = 23.5 mm & AP = 1012 rainfall = 3.5 mm AP = 980 rainfall = 29 mm & AP = 1003 rainfall = 0 mm 1(e)(iv) AP is higher in previous year / greater range in AP in previous year / AP 2 decreased from previous year to current year 1 mark for paired data e.g. 20 days under 1000 mb in current year and 1 day under 1000 mb in previous year OR 8 days over 1000 mb in current year and 27 days over 1000 mb in previous year OR Highest AP is 1012 in current year and 1040 in previous year OR Atmospheric pressure varies from 976 to 1012 in current year and from 997 to 1040 in previous year OR Difference / range of AP = 36 mb in current year & 43 in previous year 1(f) Temperature highest when wind from south OR 3 Temperatures higher / high when wind from south / south east / south west / west Temperatures lower / low when wind from north / north west / east (accept wind in south / southerly wind / south wind / wind blows south, etc.) Note: Temperature is higher when wind from south than when winds are from north = 2 marks 1 mark for paired data comparing wind directions and temperature, e.g., Temperature above 5o when wind from south and below 5o when wind from north Temperature is 9.2o when wind from S & is 3.5o when wind from north
Q2 · Students in Thailand did fieldwork to investigate the effects of urban sprawl taking…
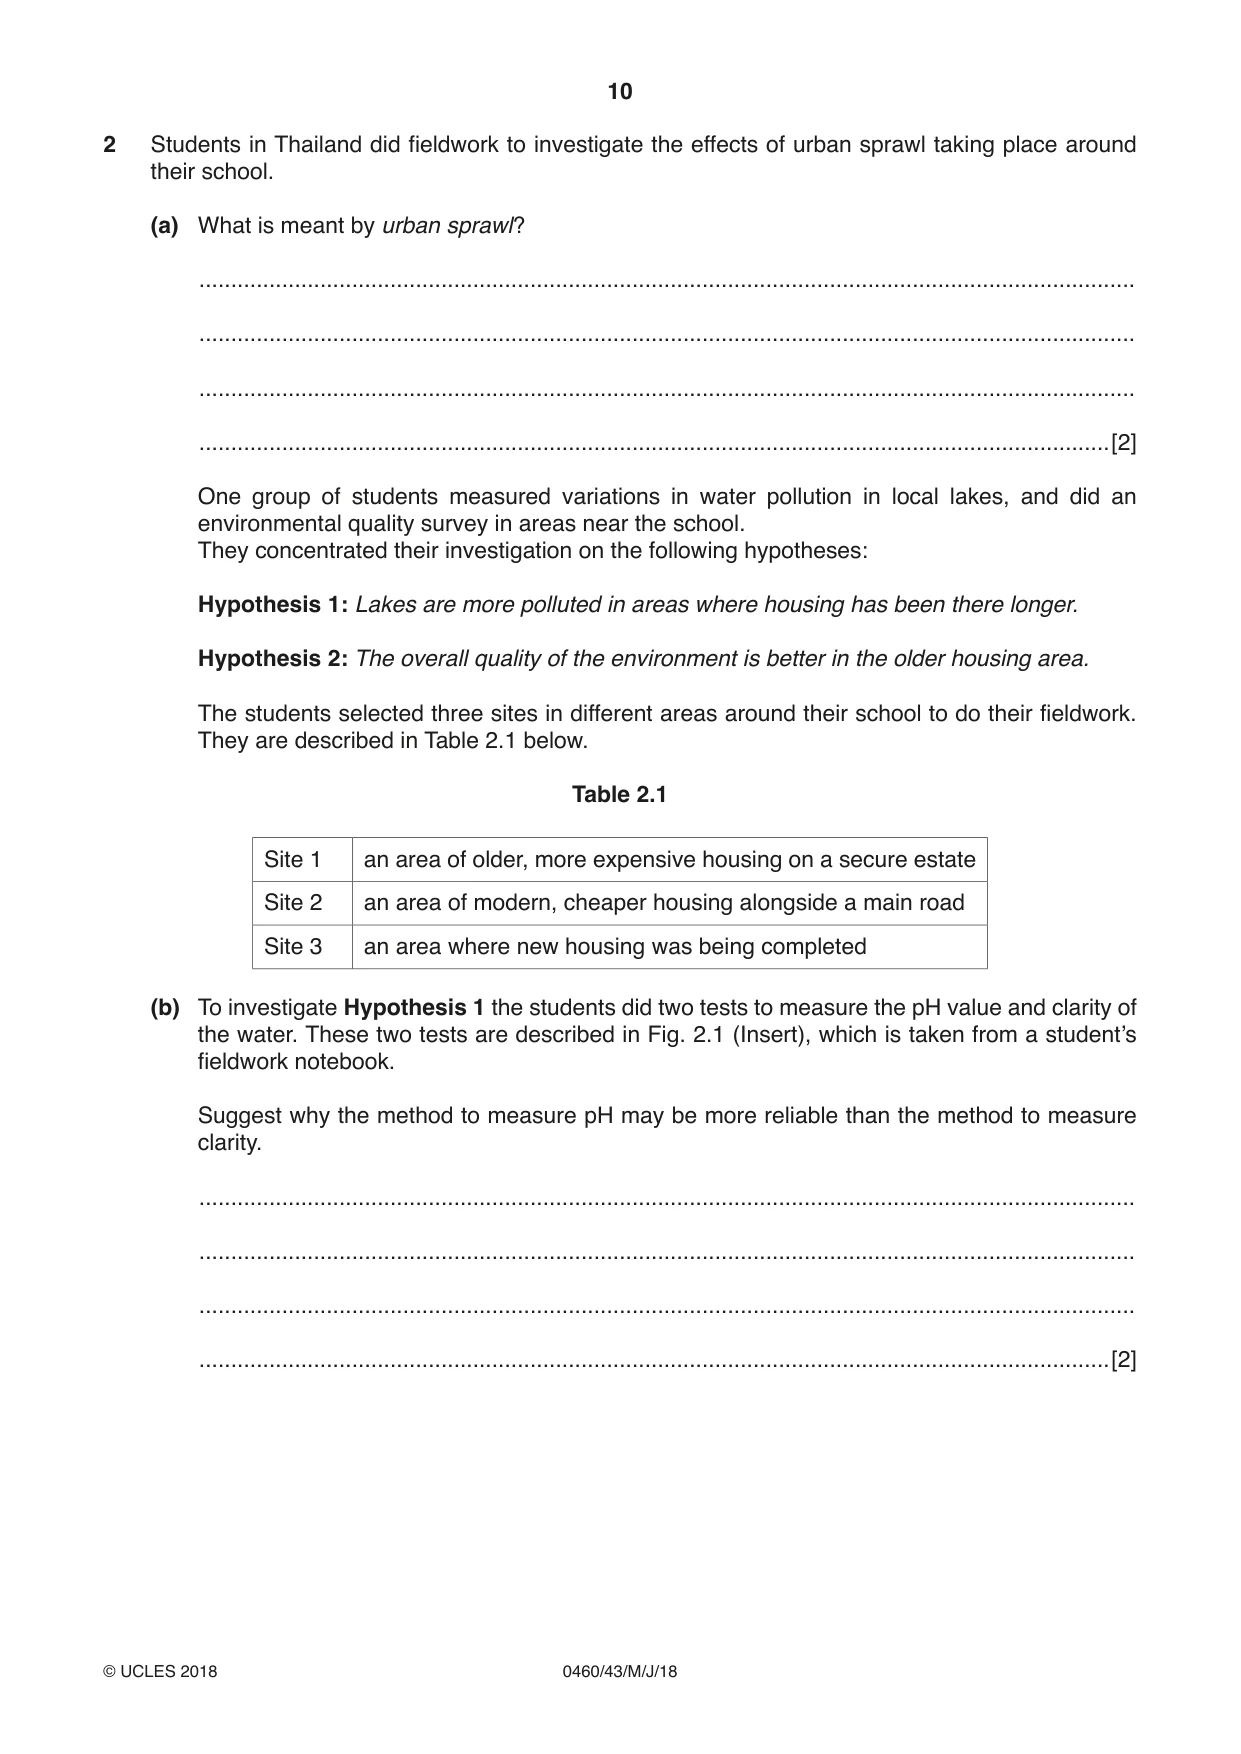
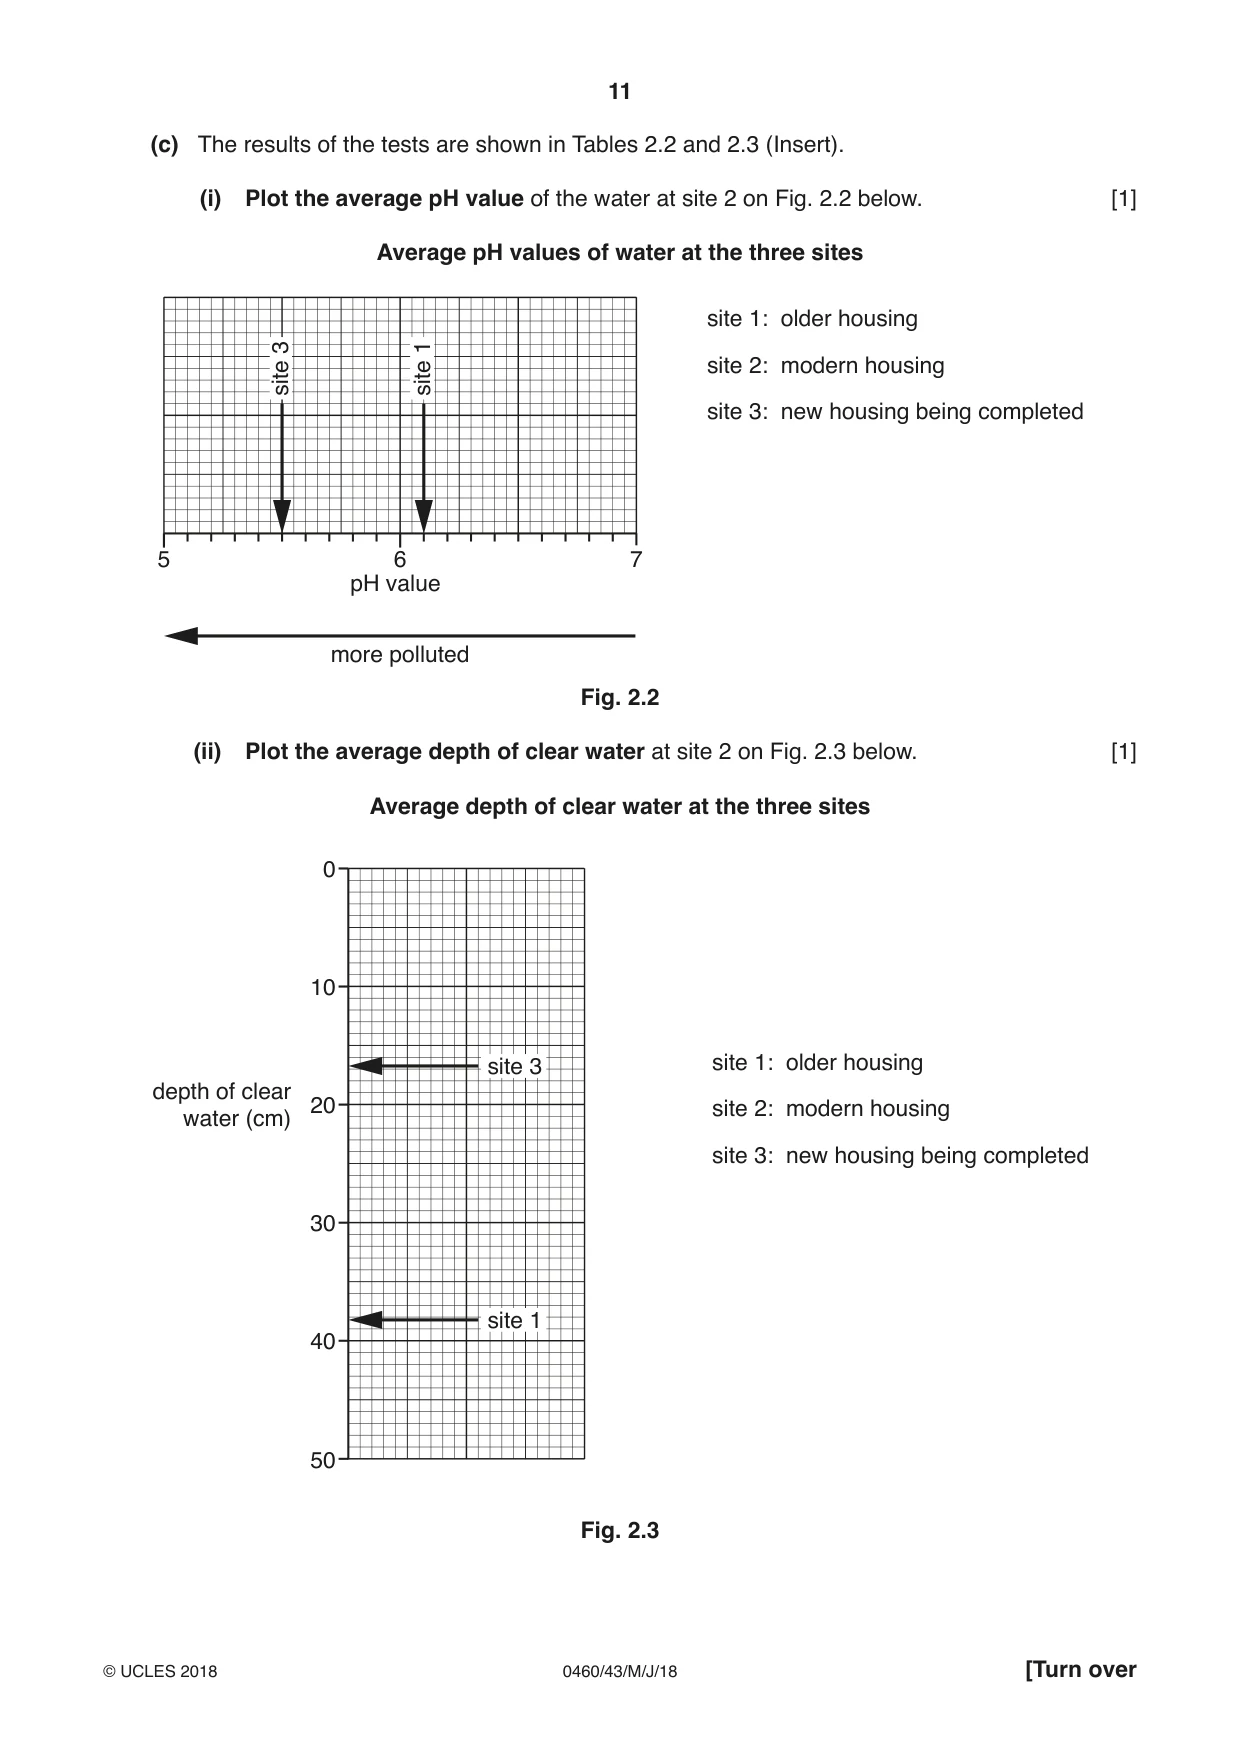
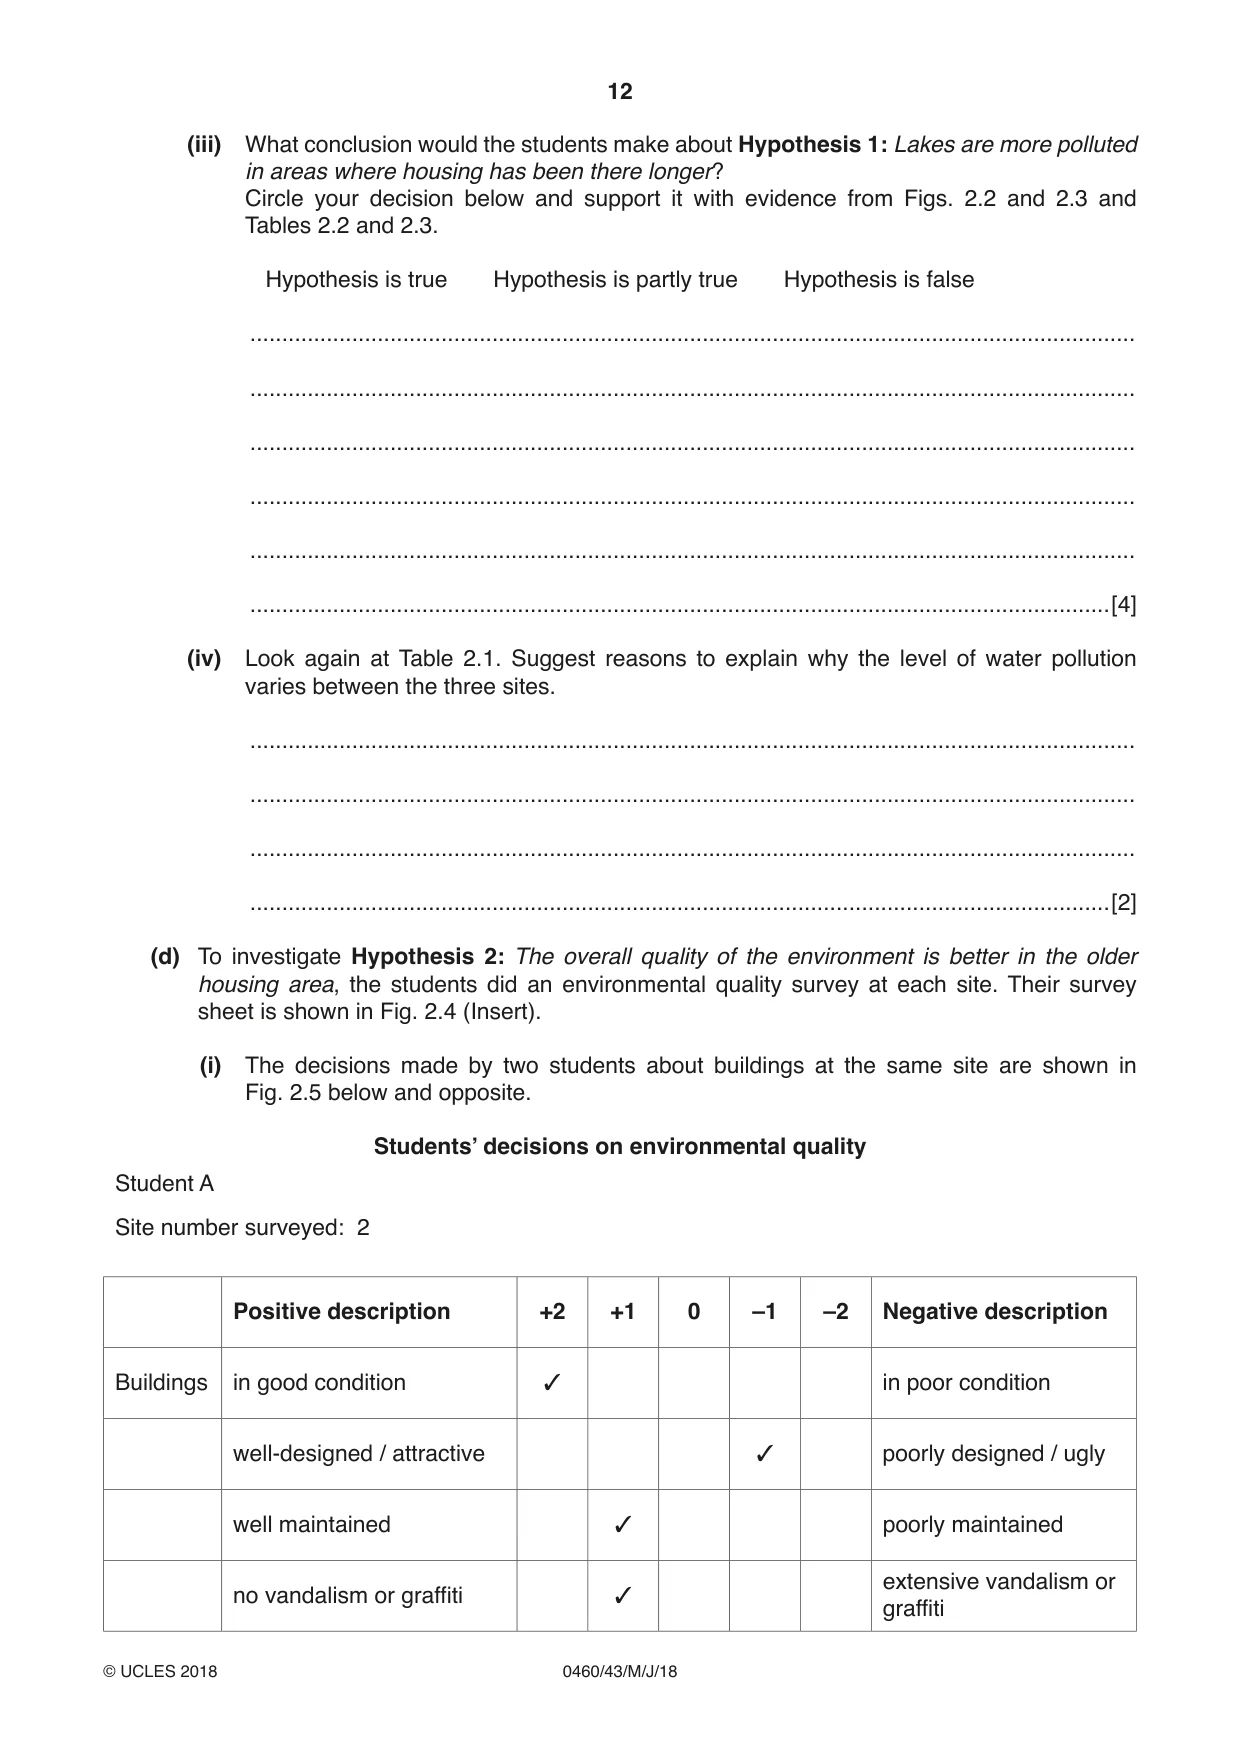
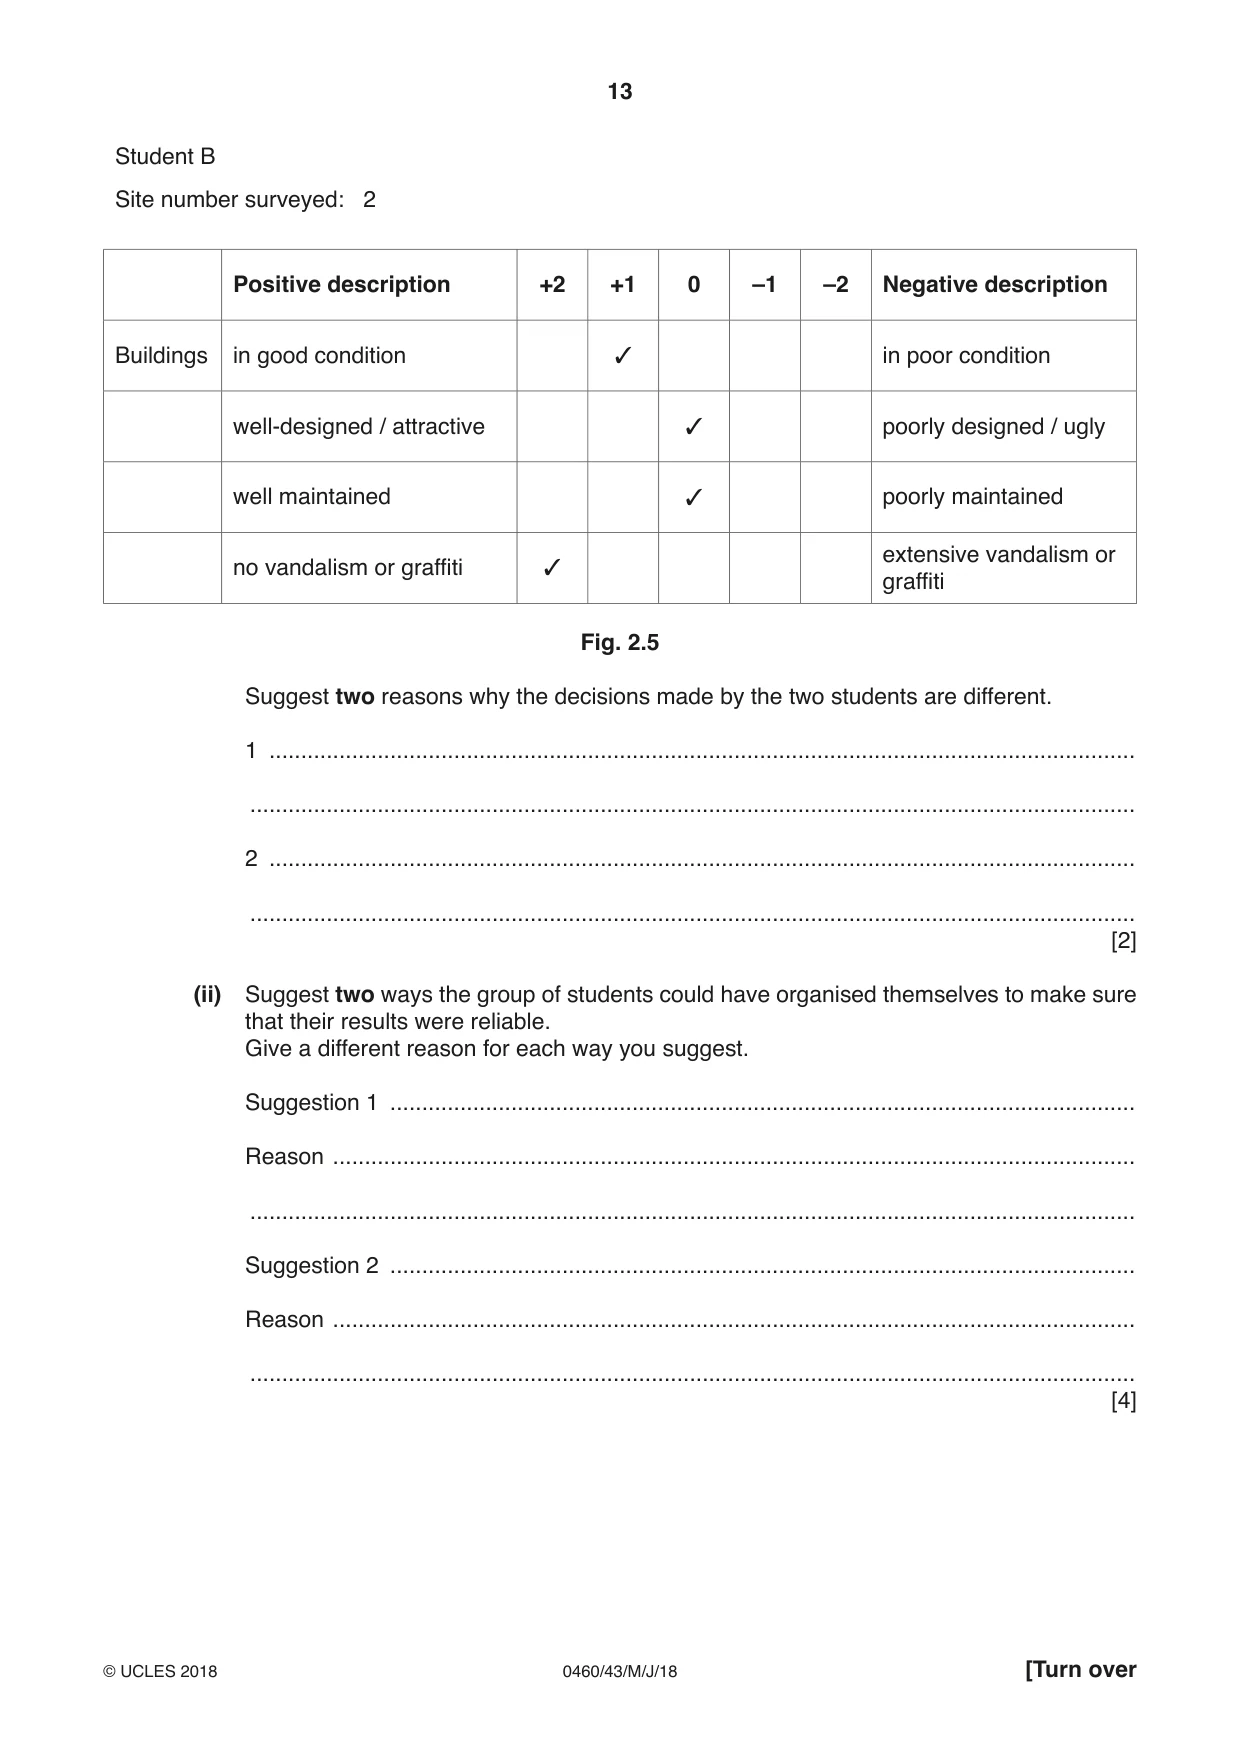
2 Students in Thailand did fieldwork to investigate the effects of urban sprawl taking place around their school. (a) What is meant by urban sprawl? ................................................................................................................................................... ................................................................................................................................................... ................................................................................................................................................... ...............................................................................................................................................[2] One group of students measured variations in water pollution in local lakes, and did an environmental quality survey in areas near the school. They concentrated their investigation on the following hypotheses: Hypothesis 1: Lakes are more polluted in areas where housing has been there longer. Hypothesis 2: The overall quality of the environment is better in the older housing area. The students selected three sites in different areas around their school to do their fieldwork. They are described in Table 2.1 below. Table 2.1 Site 1 an area of older, more expensive housing on a secure estate Site 2 an area of modern, cheaper housing alongside a main road Site 3 an area where new housing was being completed (b) To investigate Hypothesis 1 the students did two tests to measure the pH value and clarity of the water. These two tests are described in Fig. 2.1 (Insert), which is taken from a student’s fieldwork notebook. Suggest why the method to measure pH may be more reliable than the method to measure clarity. ................................................................................................................................................... ................................................................................................................................................... ................................................................................................................................................... ...............................................................................................................................................[2] (c) The results of the tests are shown in Tables 2.2 and 2.3 (Insert). (i) Plot the average pH value of the water at site 2 on Fig. 2.2 below. [1] Average pH values of water at the three sites site 1: older housing 3 1 site 2: modern housing site site site 3: new housing being completed 5 6 7 pH value more polluted Fig. 2.2 (ii) Plot the average depth of clear water at site 2 on Fig. 2.3 below. [1] Average depth of clear water at the three sites 0 10 site 3 site 1: older housing depth of clear 20 site 2: modern housing water (cm) site 3: new housing being completed 30 site 1 40 50 Fig. 2.3 (iii) What conclusion would the students make about Hypothesis 1: Lakes are more polluted in areas where housing has been there longer? Circle your decision below and support it with evidence from Figs. 2.2 and 2.3 and Tables 2.2 and 2.3. Hypothesis is true Hypothesis is partly true Hypothesis is false ........................................................................................................................................... ........................................................................................................................................... ........................................................................................................................................... ........................................................................................................................................... ........................................................................................................................................... .......................................................................................................................................[4] (iv) Look again at Table 2.1. Suggest reasons to explain why the level of water pollution varies between the three sites. ........................................................................................................................................... ........................................................................................................................................... ........................................................................................................................................... .......................................................................................................................................[2] (d) To investigate Hypothesis 2: The overall quality of the environment is better in the older housing area, the students did an environmental quality survey at each site. Their survey sheet is shown in Fig. 2.4 (Insert). (i) The decisions made by two students about buildings at the same site are shown in Fig. 2.5 below and opposite. Students’ decisions on environmental quality Student A Site number surveyed: 2 Positive description +2 +1 0 –1 –2 Negative description 3Buildings in good condition in poor condition 3 well-designed / attractive poorly designed / ugly 3 well maintained poorly maintained 3 extensive vandalism or no vandalism or graffiti graffiti
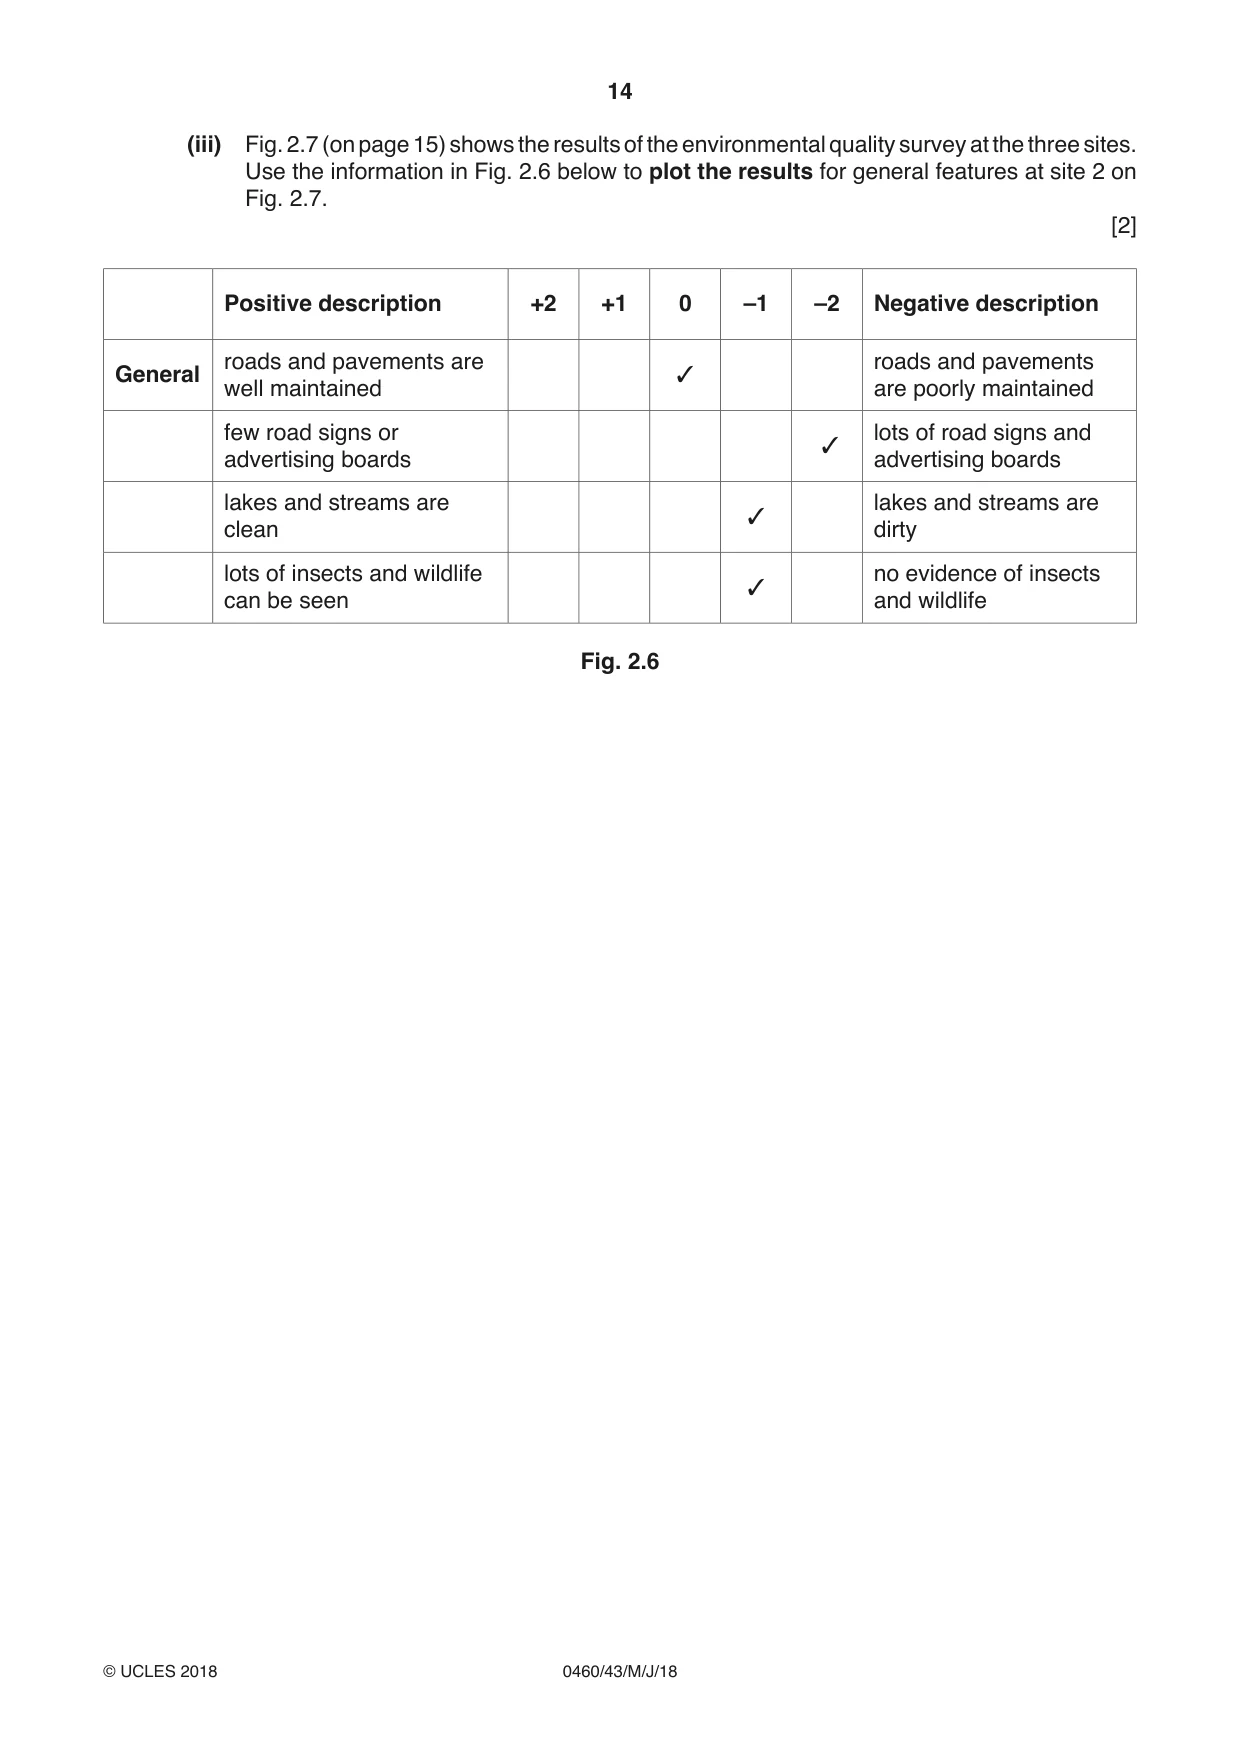
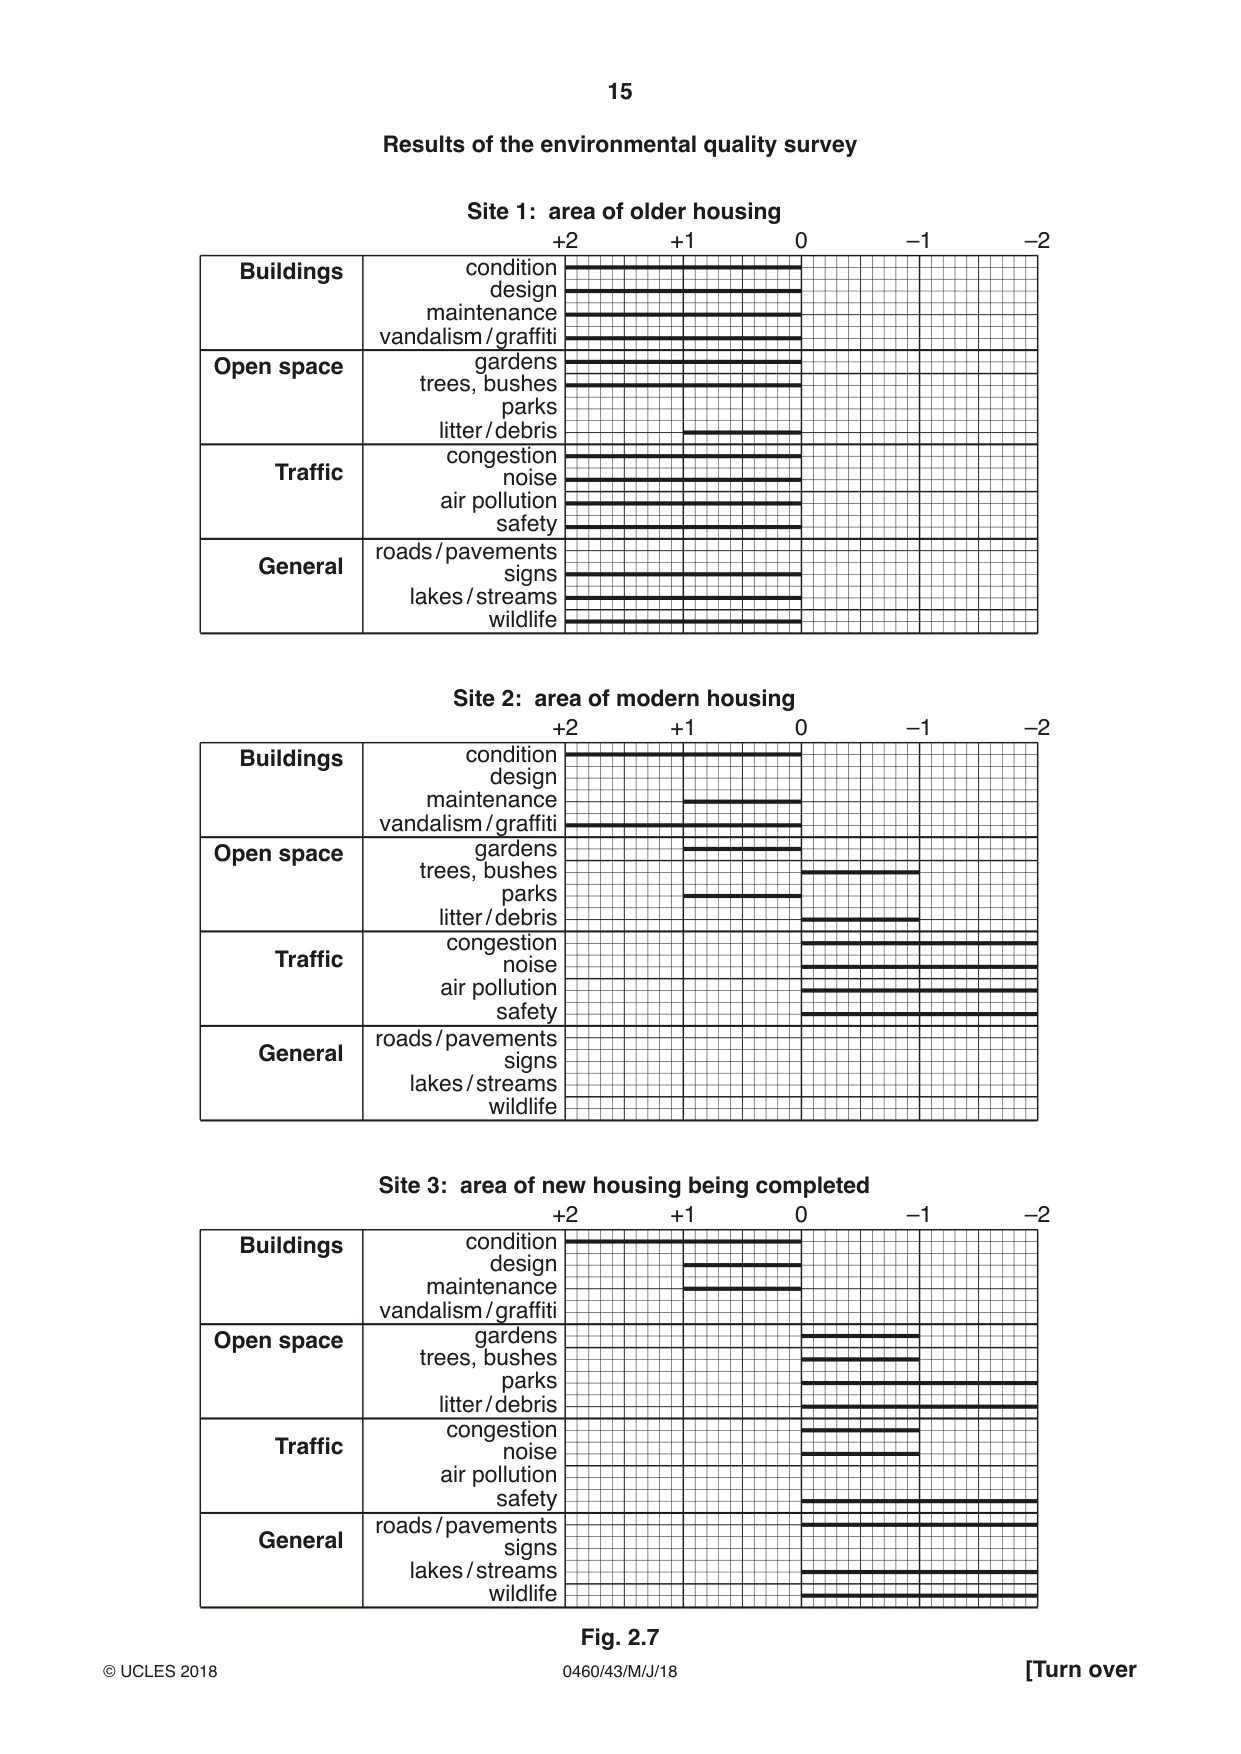
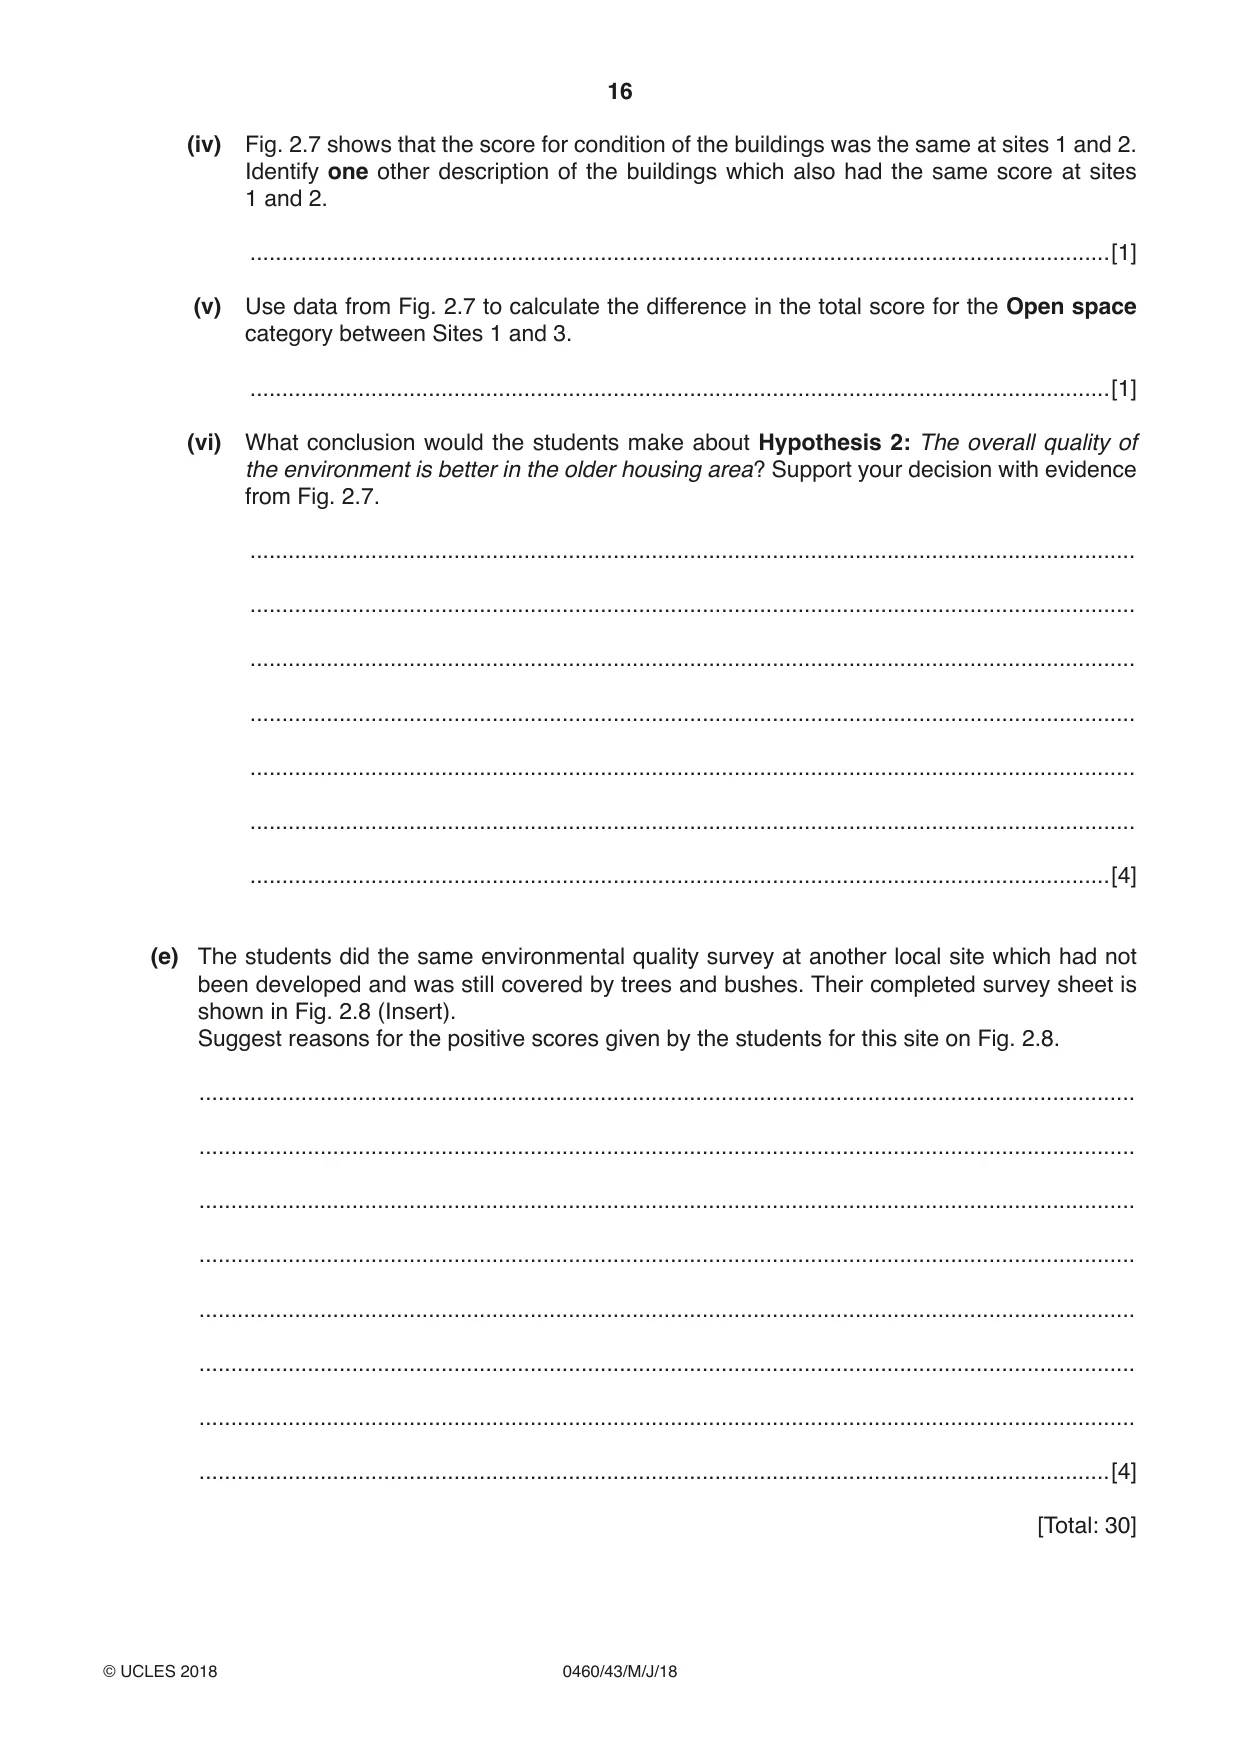
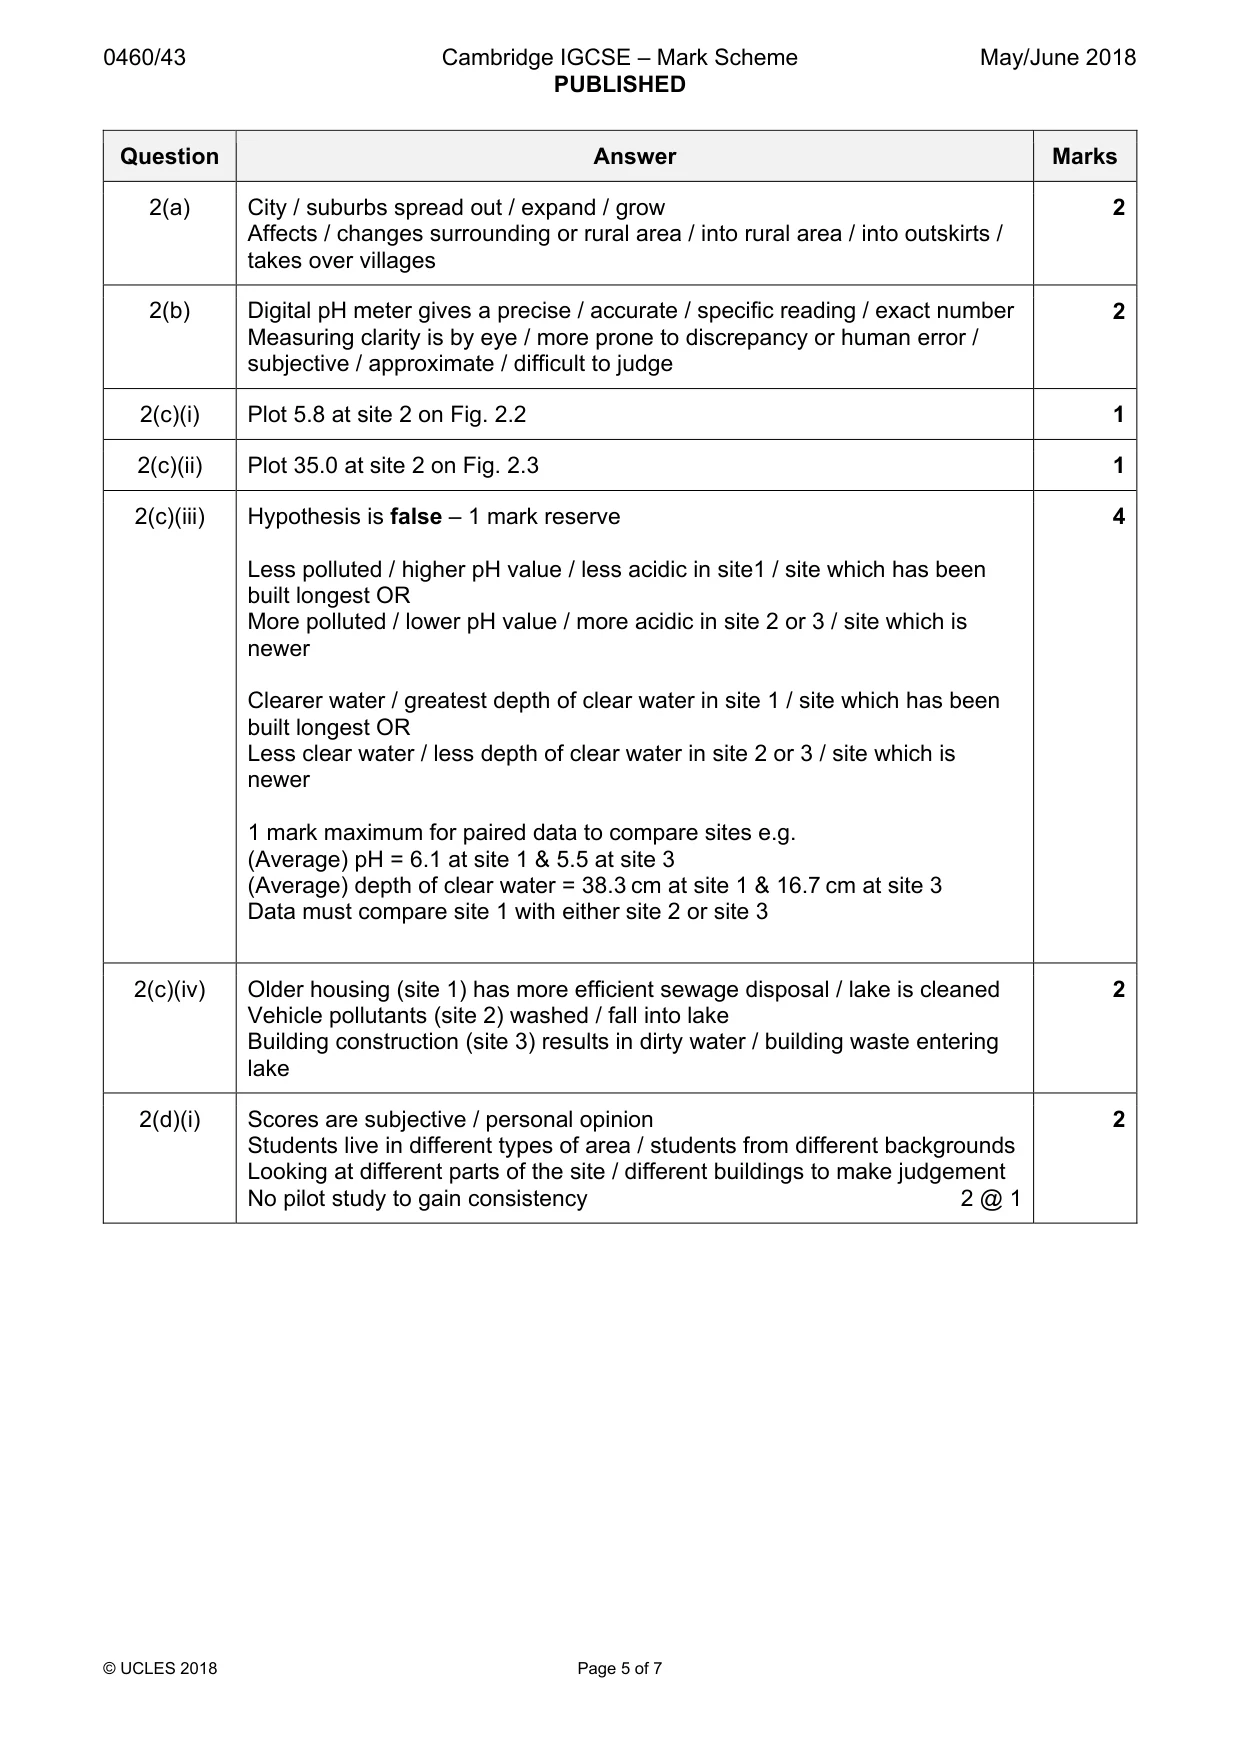
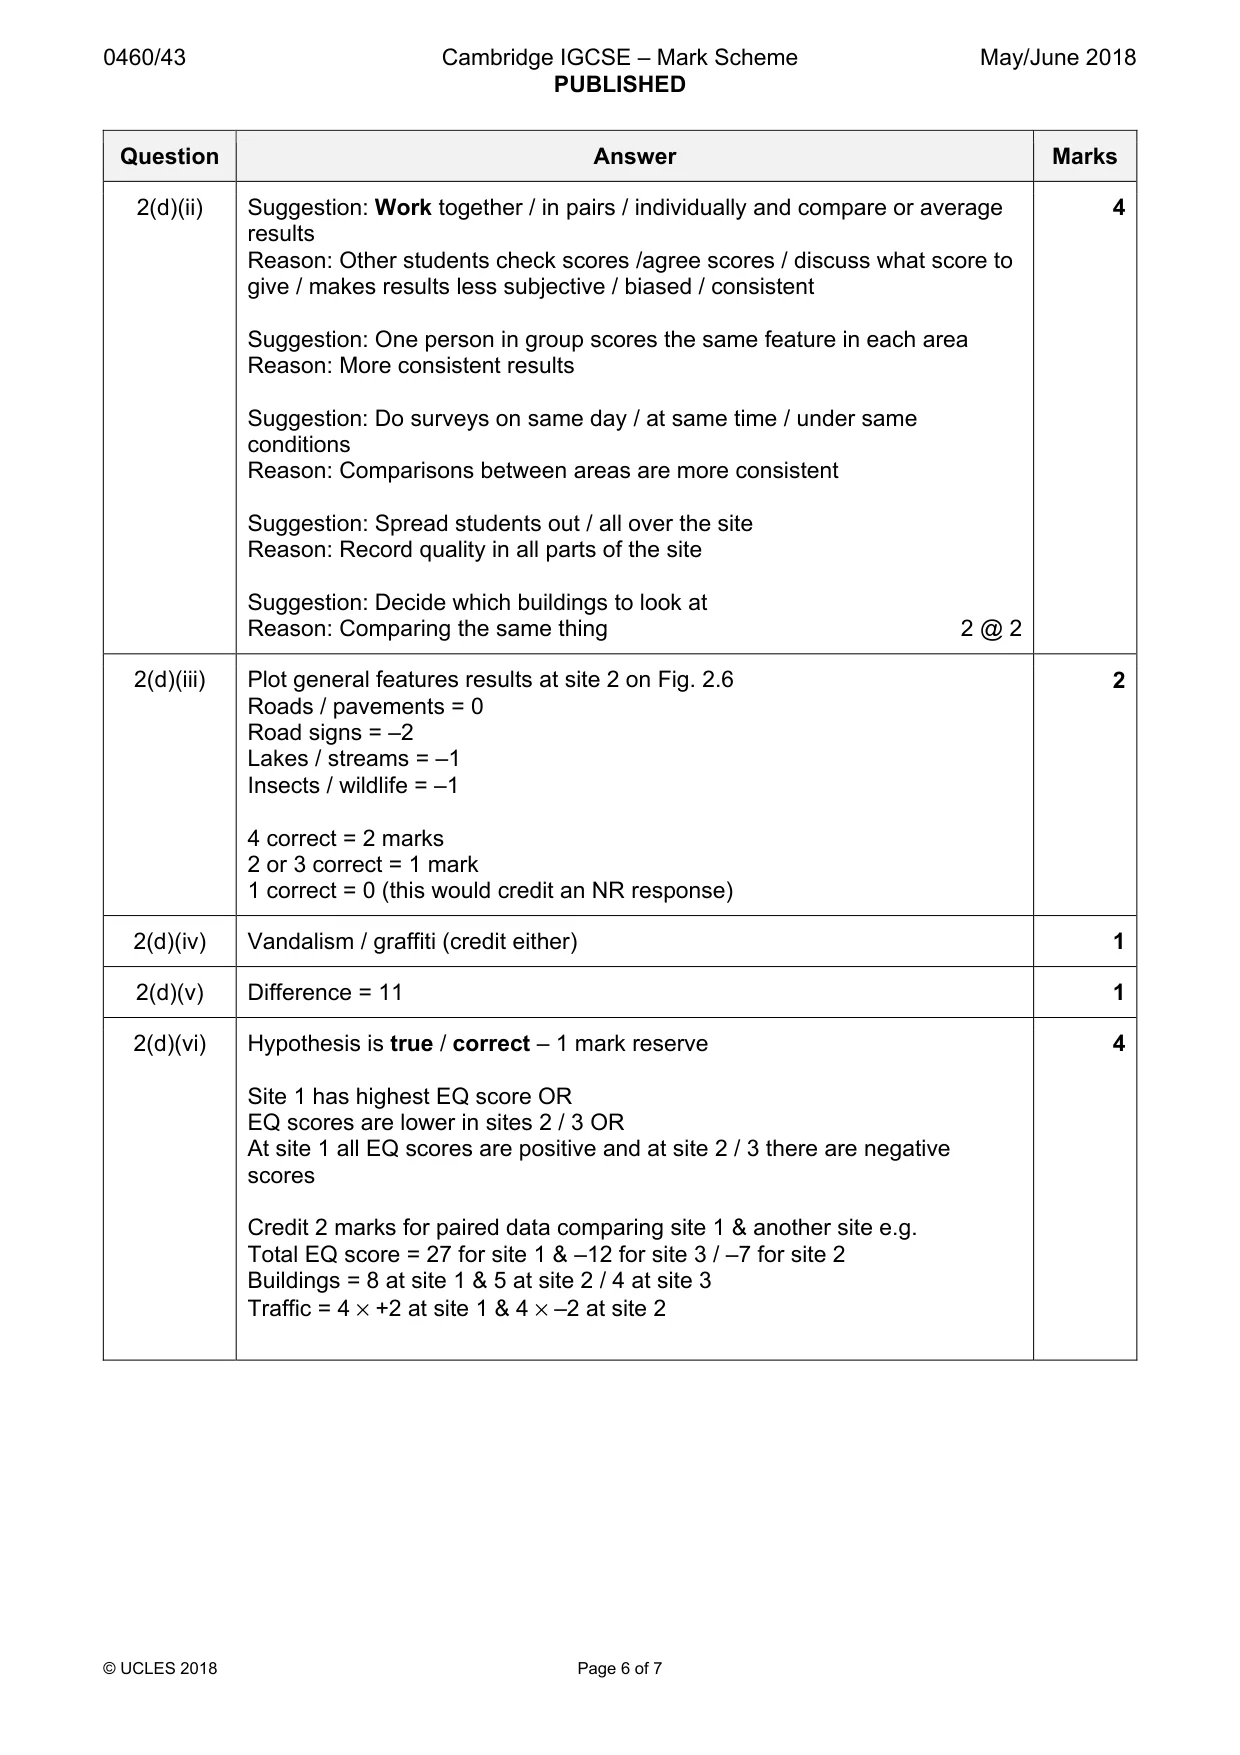
Mark scheme: 2(a) City / suburbs spread out / expand / grow 2 Affects / changes surrounding or rural area / into rural area / into outskirts / takes over villages 2(b) Digital pH meter gives a precise / accurate / specific reading / exact number 2 Measuring clarity is by eye / more prone to discrepancy or human error / subjective / approximate / difficult to judge 2(c)(i) Plot 5.8 at site 2 on Fig. 2.2 1 2(c)(ii) Plot 35.0 at site 2 on Fig. 2.3 1 2(c)(iii) Hypothesis is false – 1 mark reserve 4 Less polluted / higher pH value / less acidic in site1 / site which has been built longest OR More polluted / lower pH value / more acidic in site 2 or 3 / site which is newer Clearer water / greatest depth of clear water in site 1 / site which has been built longest OR Less clear water / less depth of clear water in site 2 or 3 / site which is newer 1 mark maximum for paired data to compare sites e.g. (Average) pH = 6.1 at site 1 & 5.5 at site 3 (Average) depth of clear water = 38.3 cm at site 1 & 16.7 cm at site 3 Data must compare site 1 with either site 2 or site 3 2(c)(iv) Older housing (site 1) has more efficient sewage disposal / lake is cleaned 2 Vehicle pollutants (site 2) washed / fall into lake Building construction (site 3) results in dirty water / building waste entering lake 2(d)(i) Scores are subjective / personal opinion 2 Students live in different types of area / students from different backgrounds Looking at different parts of the site / different buildings to make judgement No pilot study to gain consistency 2 @ 1 2(d)(ii) Suggestion: Work together / in pairs / individually and compare or average 4 results Reason: Other students check scores /agree scores / discuss what score to give / makes results less subjective / biased / consistent Suggestion: One person in group scores the same feature in each area Reason: More consistent results Suggestion: Do surveys on same day / at same time / under same conditions Reason: Comparisons between areas are more consistent Suggestion: Spread students out / all over the site Reason: Record quality in all parts of the site Suggestion: Decide which buildings to look at Reason: Comparing the same thing 2 @ 2 2(d)(iii) Plot general features results at site 2 on Fig. 2.6 2 Roads / pavements = 0 Road signs = –2 Lakes / streams = –1 Insects / wildlife = –1 4 correct = 2 marks 2 or 3 correct = 1 mark 1 correct = 0 (this would credit an NR response) 2(d)(iv) Vandalism / graffiti (credit either) 1 2(d)(v) Difference = 11 1 2(d)(vi) Hypothesis is true / correct – 1 mark reserve 4 Site 1 has highest EQ score OR EQ scores are lower in sites 2 / 3 OR At site 1 all EQ scores are positive and at site 2 / 3 there are negative scores Credit 2 marks for paired data comparing site 1 & another site e.g. Total EQ score = 27 for site 1 & –12 for site 3 / –7 for site 2 Buildings = 8 at site 1 & 5 at site 2 / 4 at site 3 Traffic = 4 × +2 at site 1 & 4 × –2 at site 2 2(e) Vegetation has not been cleared / lot of vegetation 4 Plenty of litter bins / notices to take litter home Little / no traffic in the area / roads are not busy / no roads Few people in the area / no one lives there / no human activity No pollution of lakes / streams Insects / wildlife are not disturbed / habitats are undisturbed No houses / offices / shops No credit for reference to buildings No credit for copying positive descriptions from Fig. 2.7
More questions on Environmental risks of economic development
What was in this paper
The subtopics covered by these 2 questions, and how many questions each got. Open one in a new tab to see every Cambridge question on it.
What you needed in this session
Cambridge’s own grade thresholds for 2018 May/June, Paper 4 · Variant 3. A higher threshold means an easier paper — the bar moves with how the cohort did.