Cambridge IGCSE Geography 0460 — 2018 May/June Paper 4 · Variant 1
0460/41/M/J/18 · 2 questions · 60 marks · ≈68 min
The question paper and its mark scheme, free to read here and free to download. This is Cambridge’s own paper, exactly as it was sat.
Question paper16 pages







Mark scheme6 pages
Answers below. Sit the paper first if you are practising.

Questions as text
Q1 · Students carried out fieldwork at two beaches in eastern Scotland
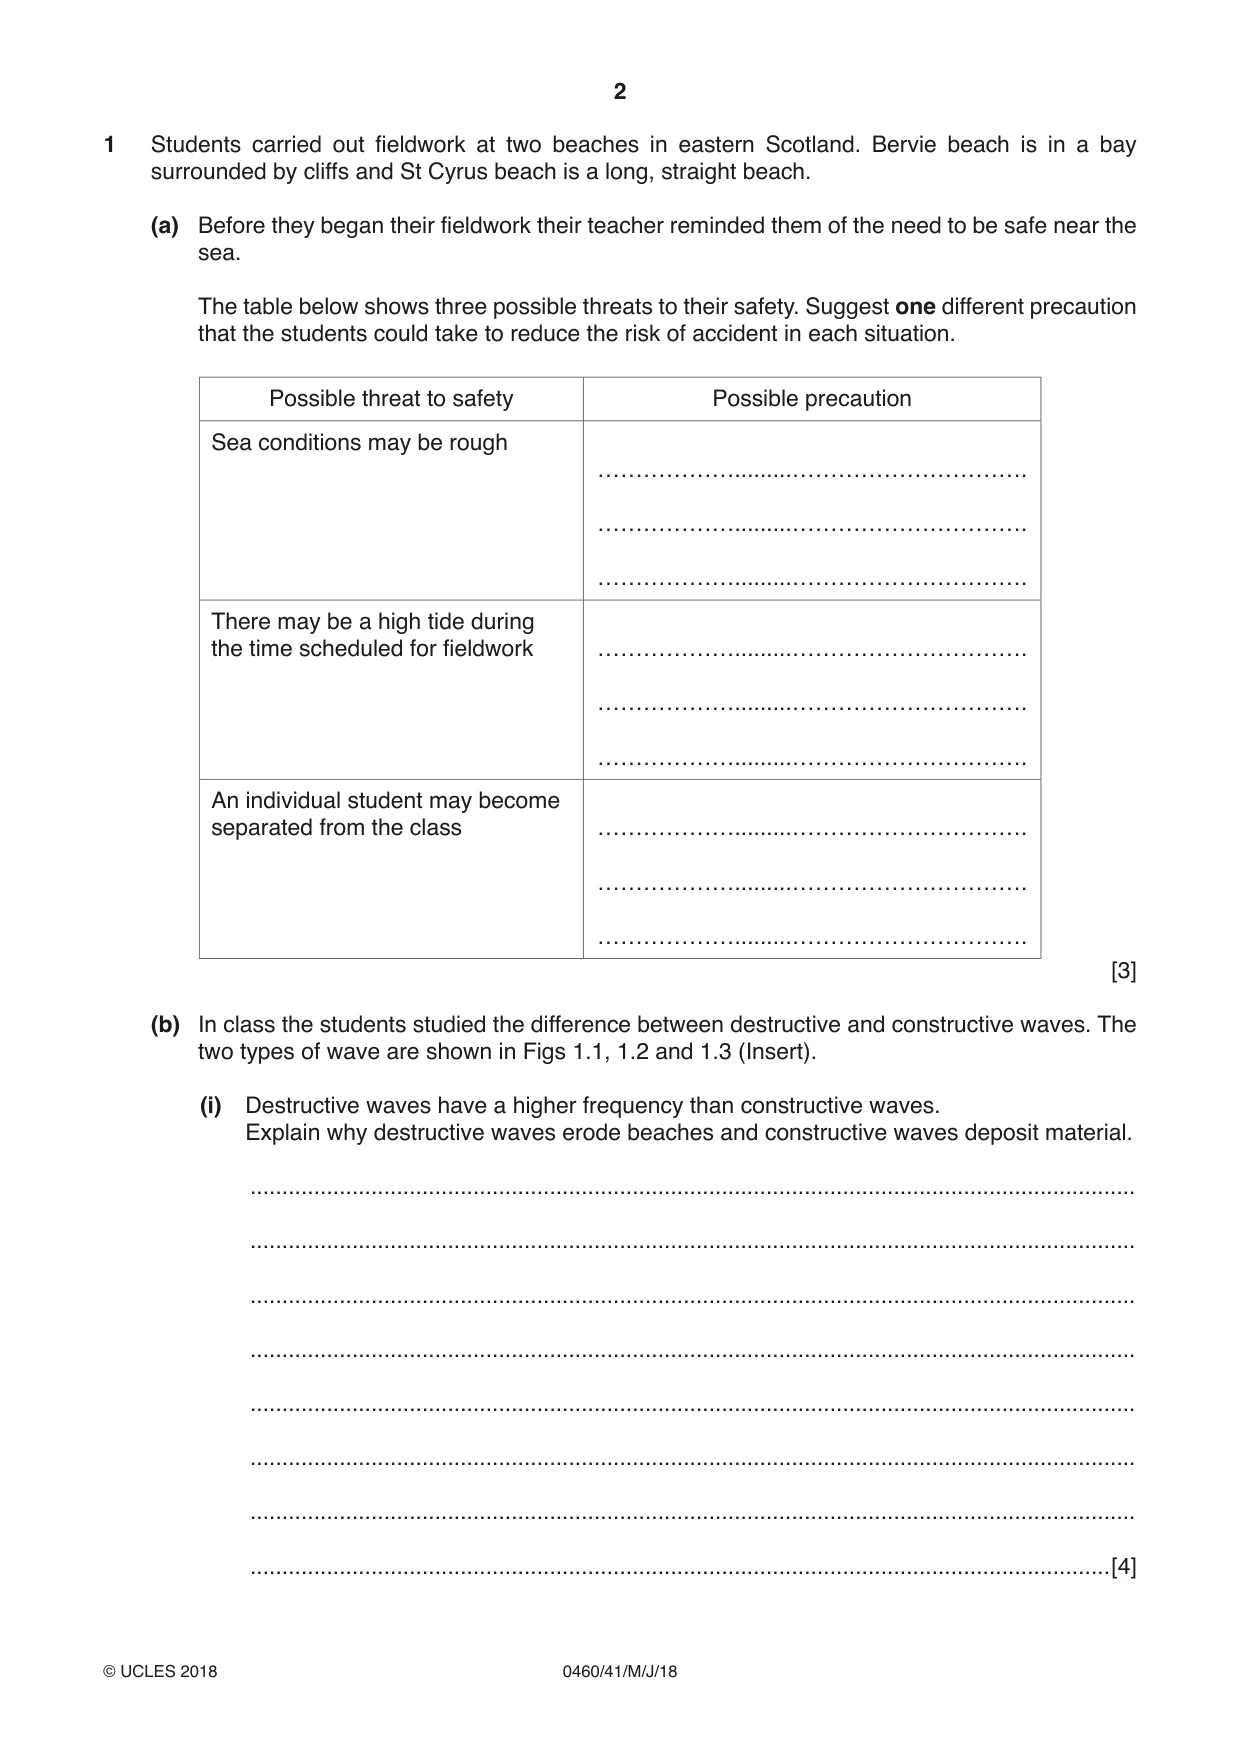
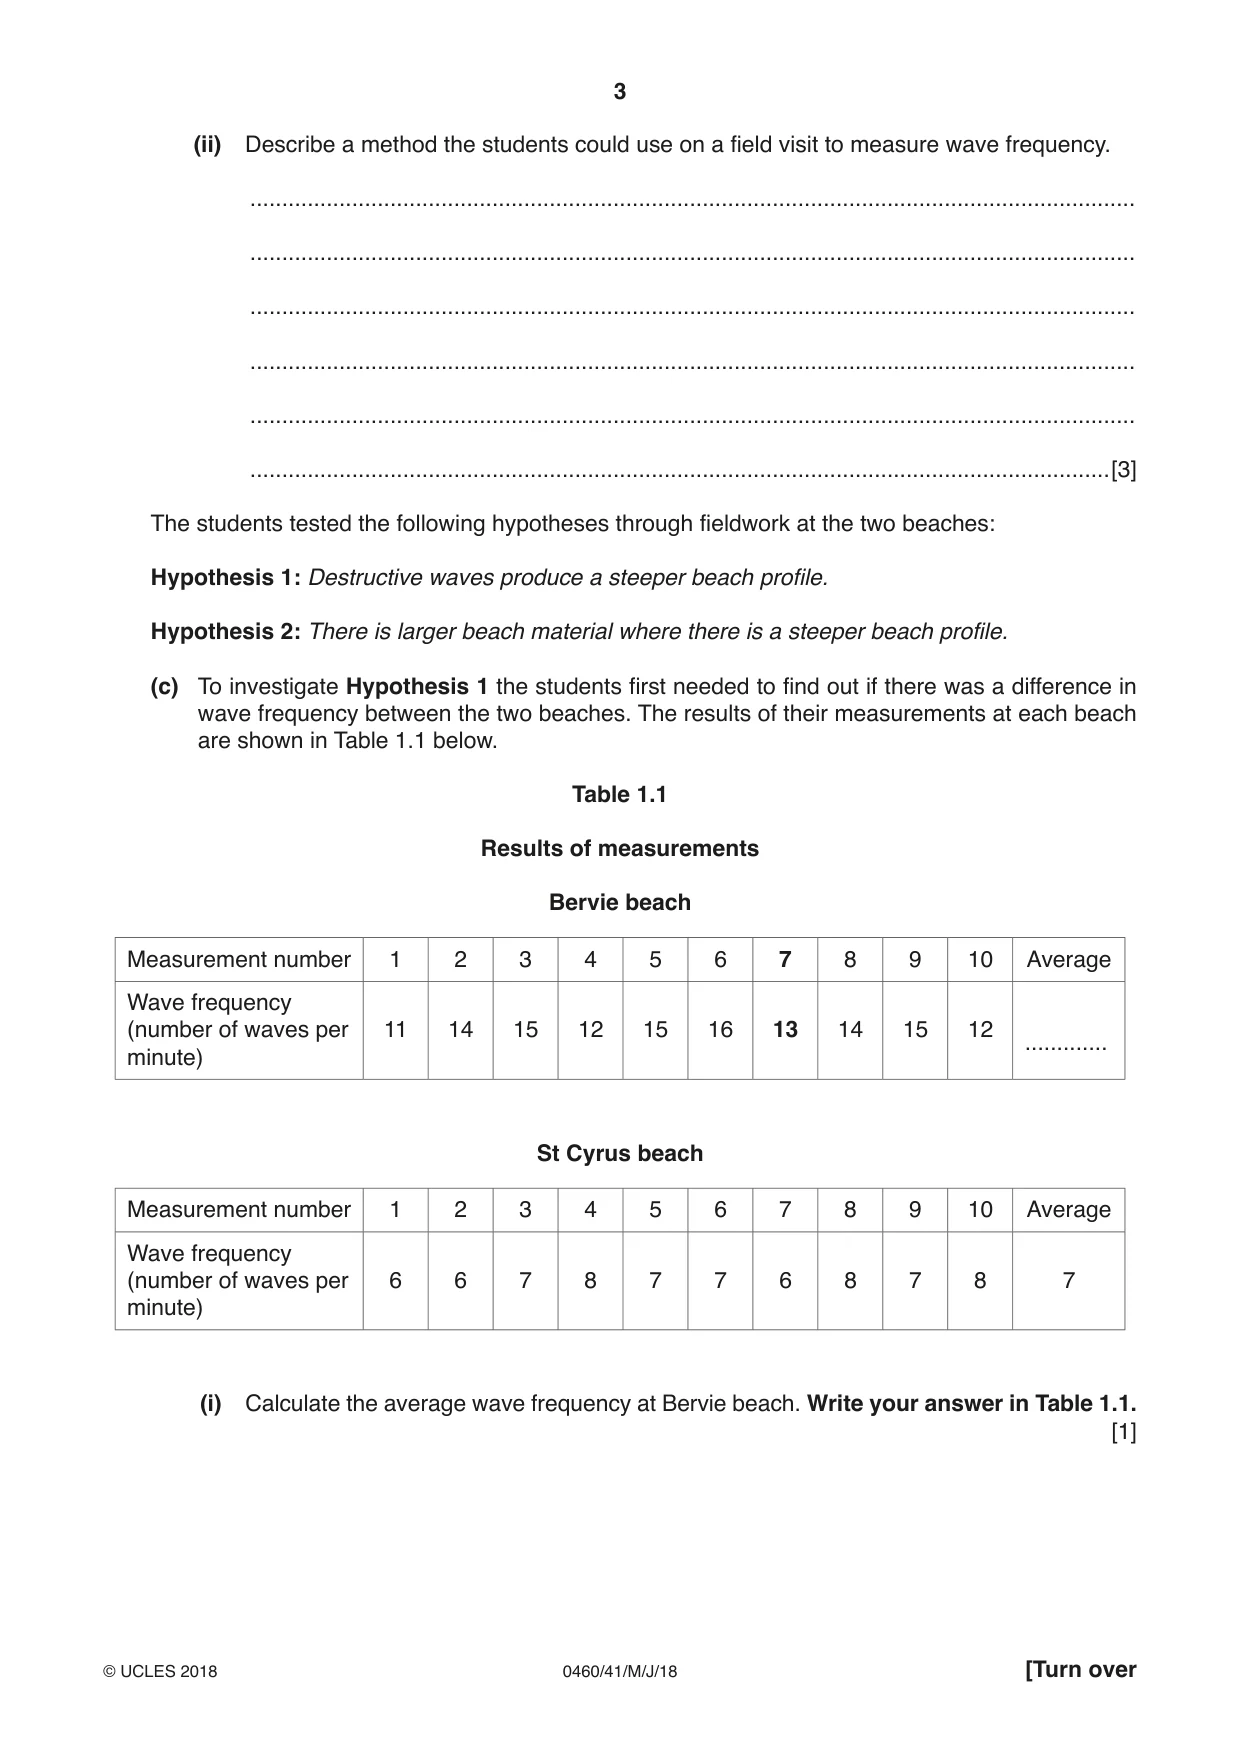
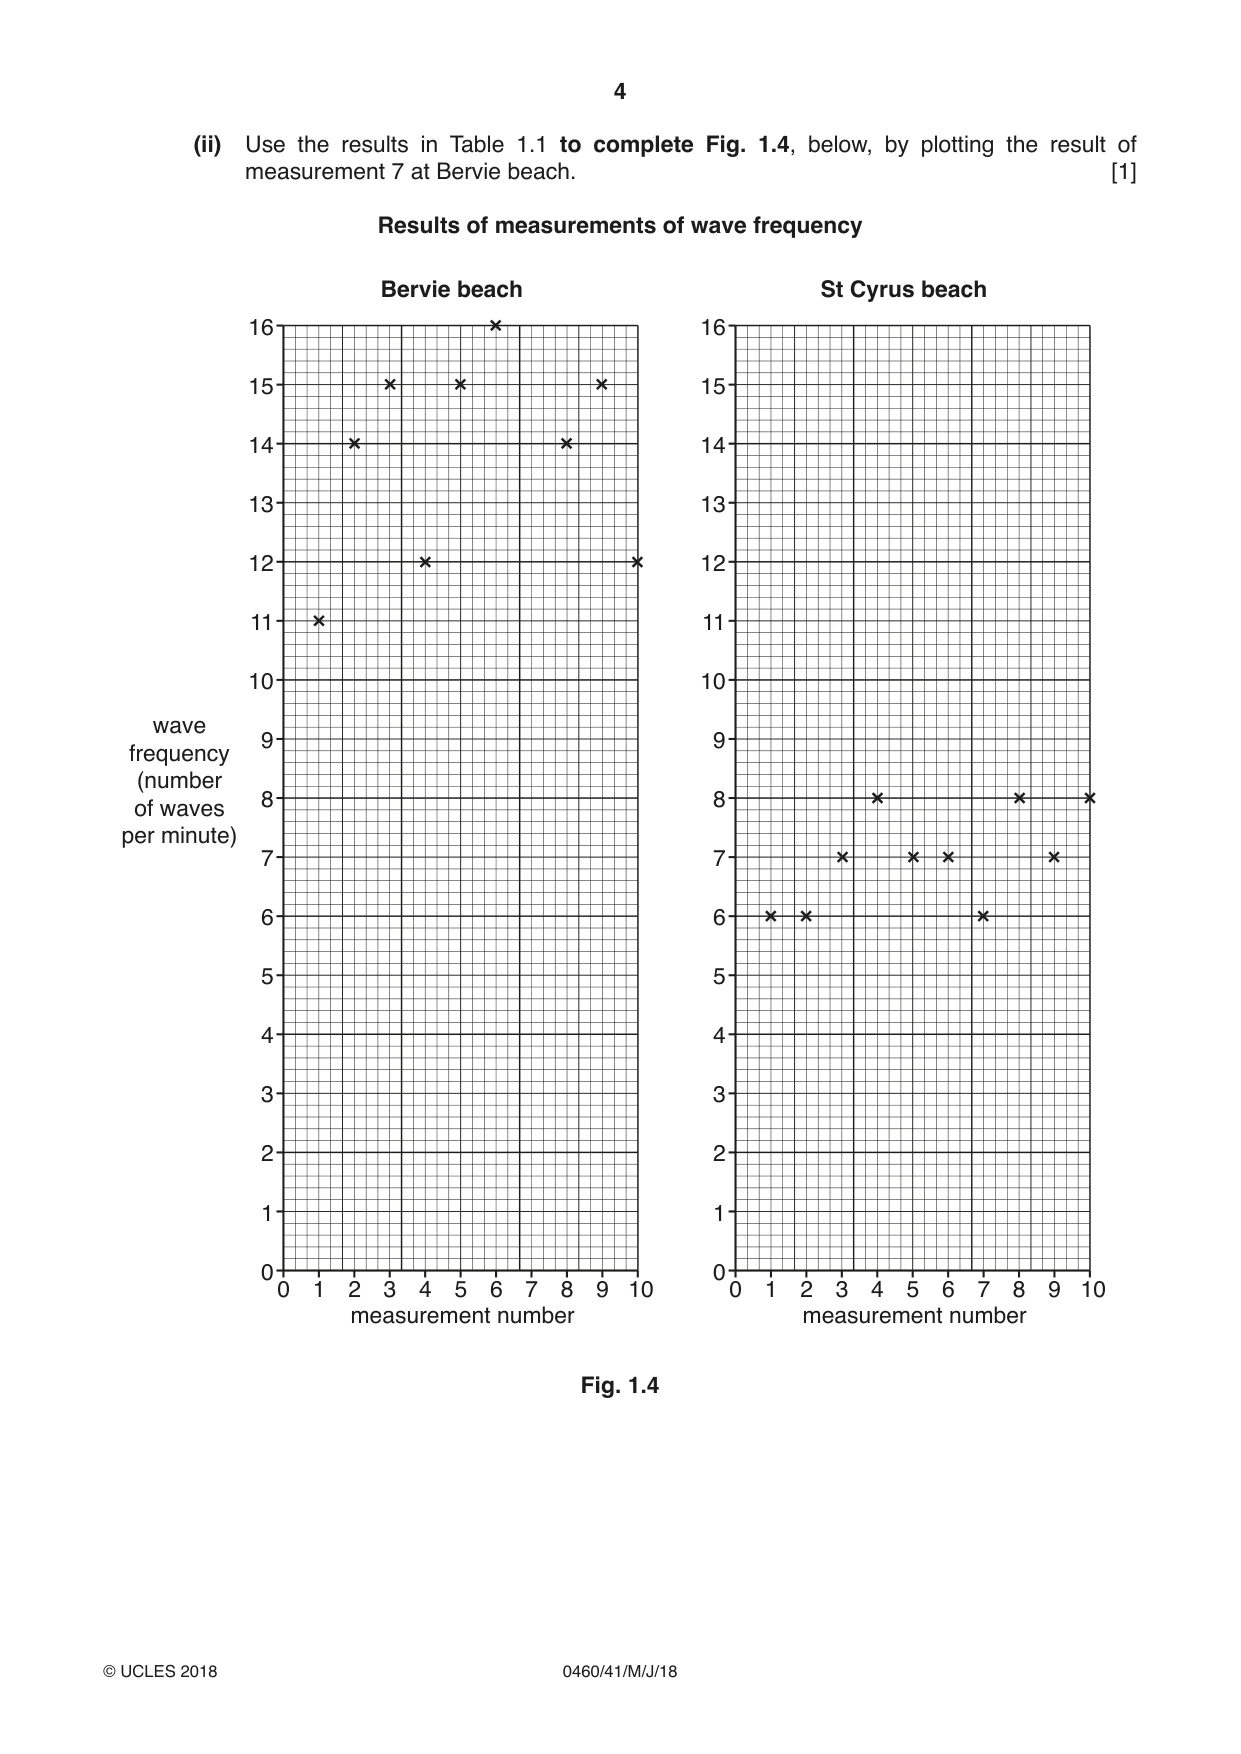
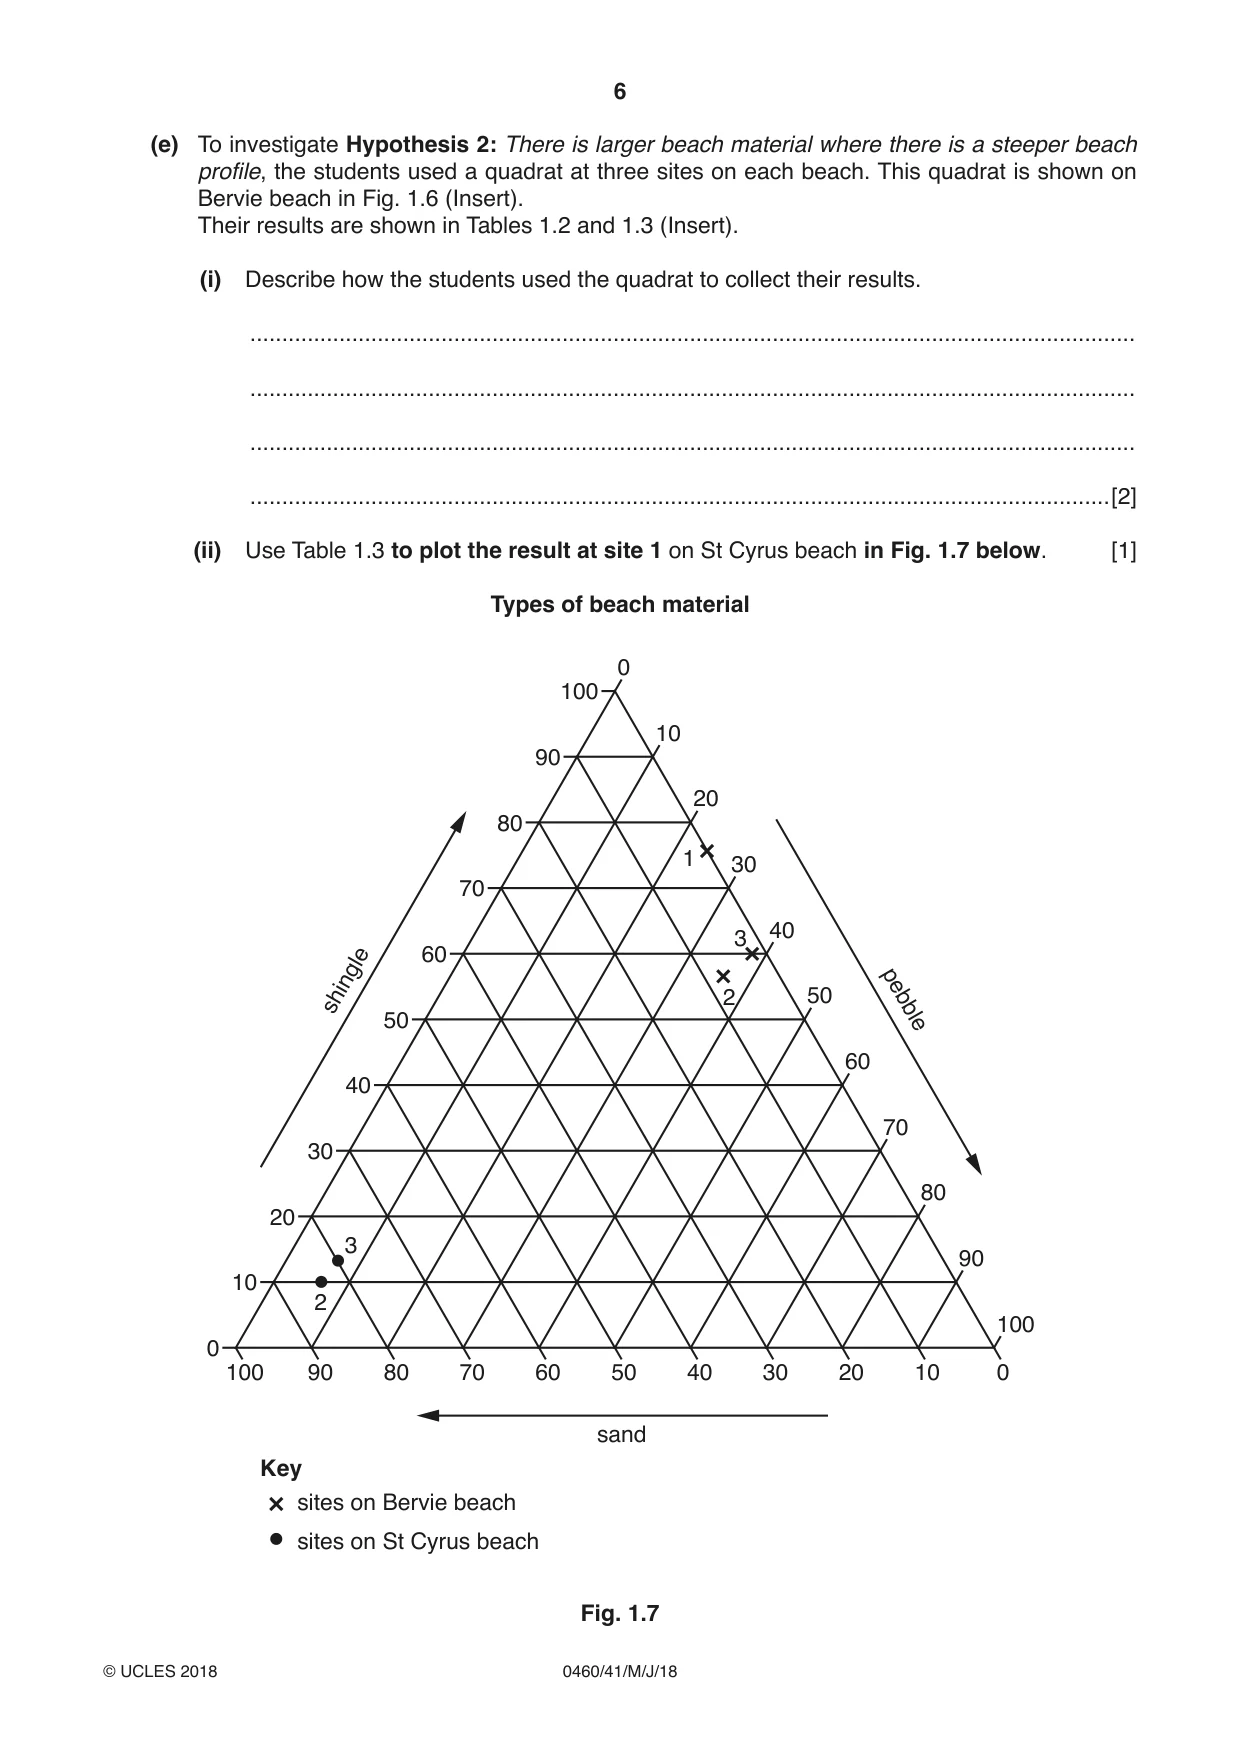
1 Students carried out fieldwork at two beaches in eastern Scotland. Bervie beach is in a bay surrounded by cliffs and St Cyrus beach is a long, straight beach. (a) Before they began their fieldwork their teacher reminded them of the need to be safe near the sea. The table below shows three possible threats to their safety. Suggest one different precaution that the students could take to reduce the risk of accident in each situation. Possible threat to safety Possible precaution Sea conditions may be rough ……………….........…………………………. ……………….........…………………………. ……………….........…………………………. There may be a high tide during the time scheduled for fieldwork ……………….........…………………………. ……………….........…………………………. ……………….........…………………………. An individual student may become separated from the class ……………….........…………………………. ……………….........…………………………. ……………….........…………………………. [3] (b) In class the students studied the difference between destructive and constructive waves. The two types of wave are shown in Figs 1.1, 1.2 and 1.3 (Insert). (i) Destructive waves have a higher frequency than constructive waves. Explain why destructive waves erode beaches and constructive waves deposit material. ........................................................................................................................................... ........................................................................................................................................... ........................................................................................................................................... ........................................................................................................................................... ........................................................................................................................................... ........................................................................................................................................... ........................................................................................................................................... .......................................................................................................................................[4] (ii) Describe a method the students could use on a field visit to measure wave frequency. ........................................................................................................................................... ........................................................................................................................................... ........................................................................................................................................... ........................................................................................................................................... ........................................................................................................................................... .......................................................................................................................................[3] The students tested the following hypotheses through fieldwork at the two beaches: Hypothesis 1: Destructive waves produce a steeper beach profile. Hypothesis 2: There is larger beach material where there is a steeper beach profile. (c) To investigate Hypothesis 1 the students first needed to find out if there was a difference in wave frequency between the two beaches. The results of their measurements at each beach are shown in Table 1.1 below. Table 1.1 Results of measurements Bervie beach Measurement number 1 2 3 4 5 6 7 8 9 10 Average Wave frequency (number of waves per 11 14 15 12 15 16 13 14 15 12 .............minute) St Cyrus beach Measurement number 1 2 3 4 5 6 7 8 9 10 Average Wave frequency (number of waves per 6 6 7 8 7 7 6 8 7 8 7 minute) (i) Calculate the average wave frequency at Bervie beach. Write your answer in Table 1.1. [1] (ii) Use the results in Table 1.1 to complete Fig. 1.4, below, by plotting the result of measurement 7 at Bervie beach. [1] Results of measurements of wave frequency Bervie beach St Cyrus beach 16 16 15 15 14 14 13 13 12 12 11 11 10 10 wave 9 9 frequency (number 8 8 of waves per minute) 7 7 6 6 5 5 4 4 3 3 2 2 1 1 0 0 0 1 2 3 4 5 6 7 8 9 10 0 1 2 3 4 5 6 7 8 9 10 measurement number measurement number Fig. 1.4 (d) Next the students measured the angles of slope at the two beaches and used their results to draw the two profiles shown in Fig. 1.5 (Insert). (i) Describe a method to measure the beach profiles. ........................................................................................................................................... ........................................................................................................................................... ........................................................................................................................................... ........................................................................................................................................... ........................................................................................................................................... ........................................................................................................................................... ........................................................................................................................................... .......................................................................................................................................[4] (ii) What conclusion would the students make about Hypothesis 1: Destructive waves produce a steeper beach profile? Support the conclusion with evidence from Table 1.1, and Figs 1.4 and 1.5. ........................................................................................................................................... ........................................................................................................................................... ........................................................................................................................................... ........................................................................................................................................... ........................................................................................................................................... ........................................................................................................................................... ........................................................................................................................................... .......................................................................................................................................[4] (e) To investigate Hypothesis 2: There is larger beach material where there is a steeper beach profile, the students used a quadrat at three sites on each beach. This quadrat is shown on Bervie beach in Fig. 1.6 (Insert). Their results are shown in Tables 1.2 and 1.3 (Insert). (i) Describe how the students used the quadrat to collect their results. ........................................................................................................................................... ........................................................................................................................................... ........................................................................................................................................... .......................................................................................................................................[2] (ii) Use Table 1.3 to plot the result at site 1 on St Cyrus beach in Fig. 1.7 below. [1] Types of beach material 0 100 10 90 20 80 1 30 70 40 3 shingle 60 2 50 50 pebble 60 40 70 30 80 20 3 90 10 2 100 0 100 90 80 70 60 50 40 30 20 10 0 sand Key sites on Bervie beach sites on St Cyrus beach Fig. 1.7 (iii) Do the results of the fieldwork support Hypothesis 2: There is larger beach material where there is a steeper beach profile? Support your decision with data from Tables 1.2 and 1.3 and Figs. 1.5 and 1.7. ........................................................................................................................................... ........................................................................................................................................... ........................................................................................................................................... ........................................................................................................................................... ........................................................................................................................................... .......................................................................................................................................[3] (f) Bervie beach and St Cyrus beach are popular for tourism. Describe a fieldwork method to compare how tourists may have polluted the two beaches. ................................................................................................................................................... ................................................................................................................................................... ................................................................................................................................................... ................................................................................................................................................... ................................................................................................................................................... ................................................................................................................................................... ................................................................................................................................................... ...............................................................................................................................................[4] [Total: 30]
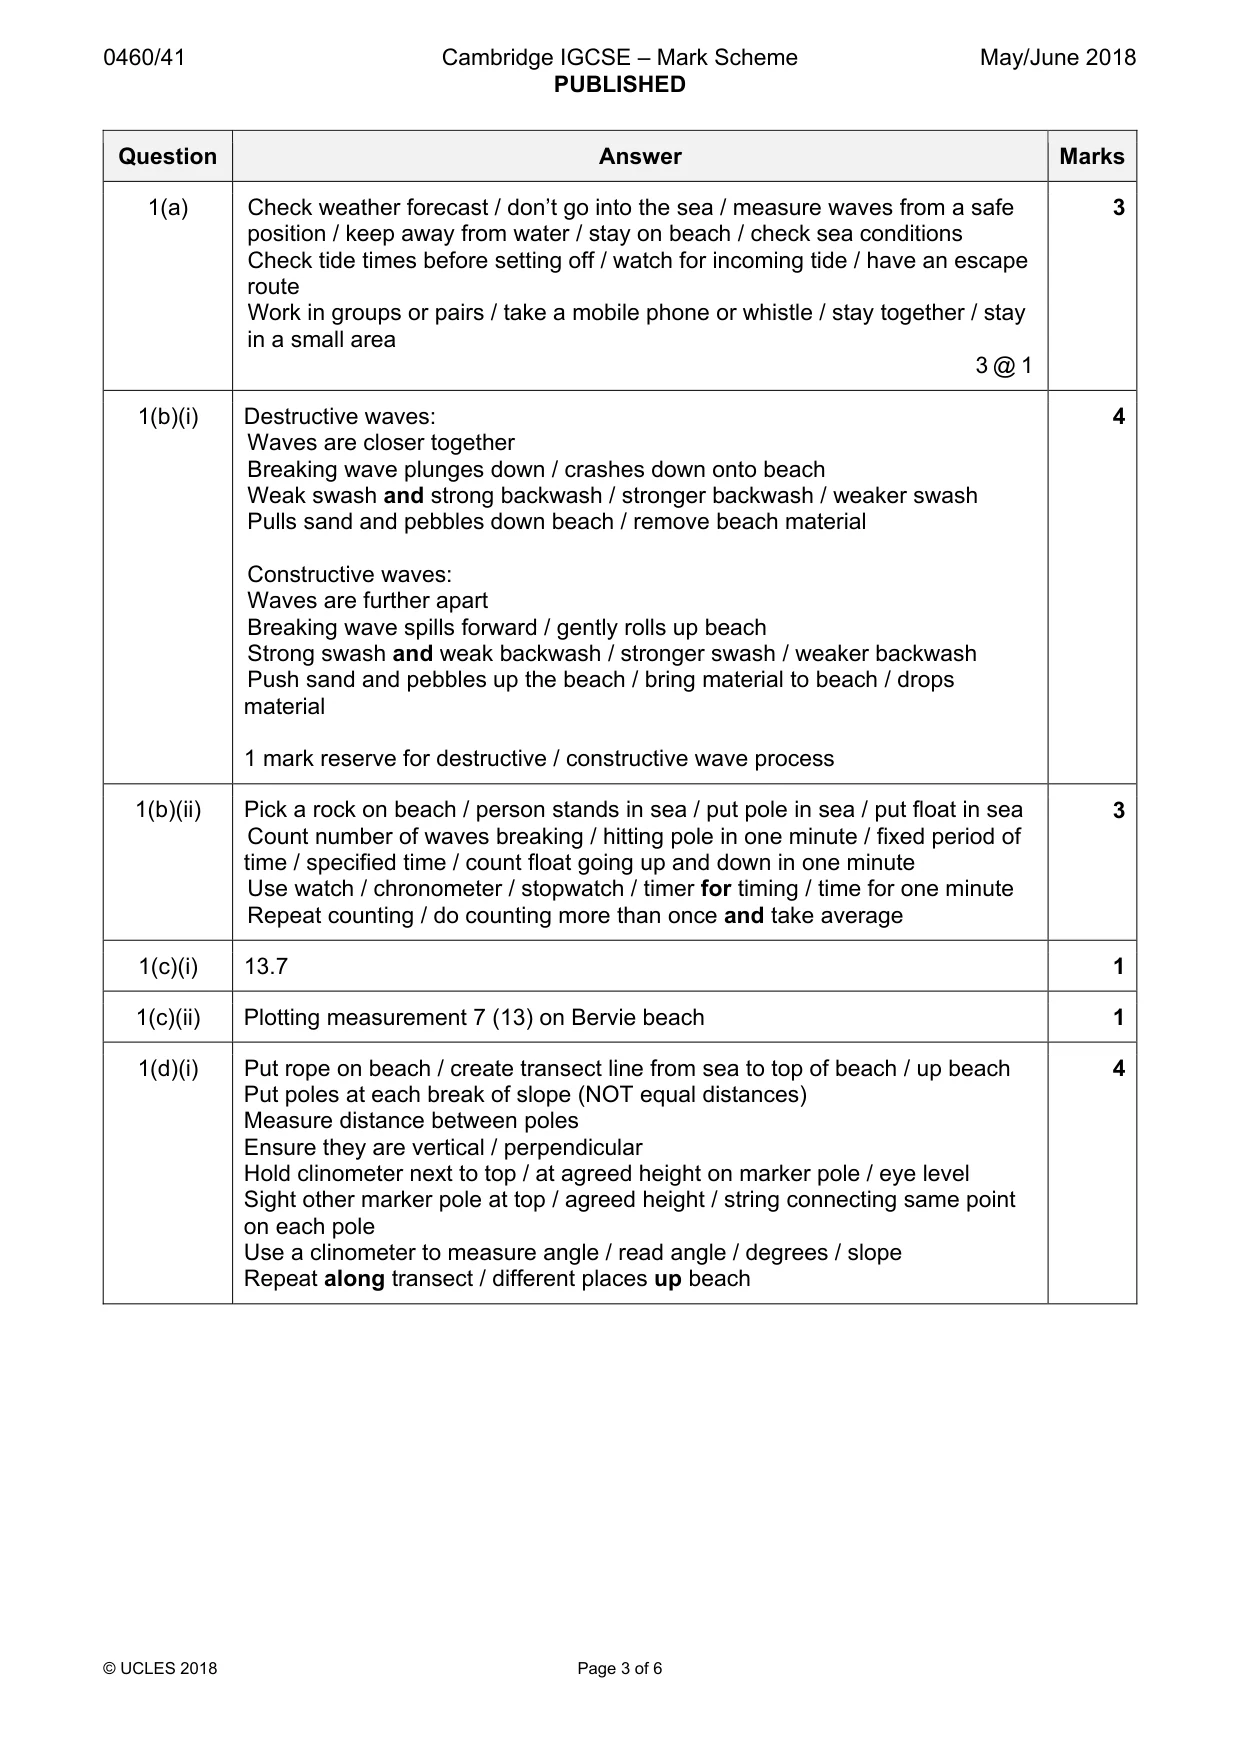
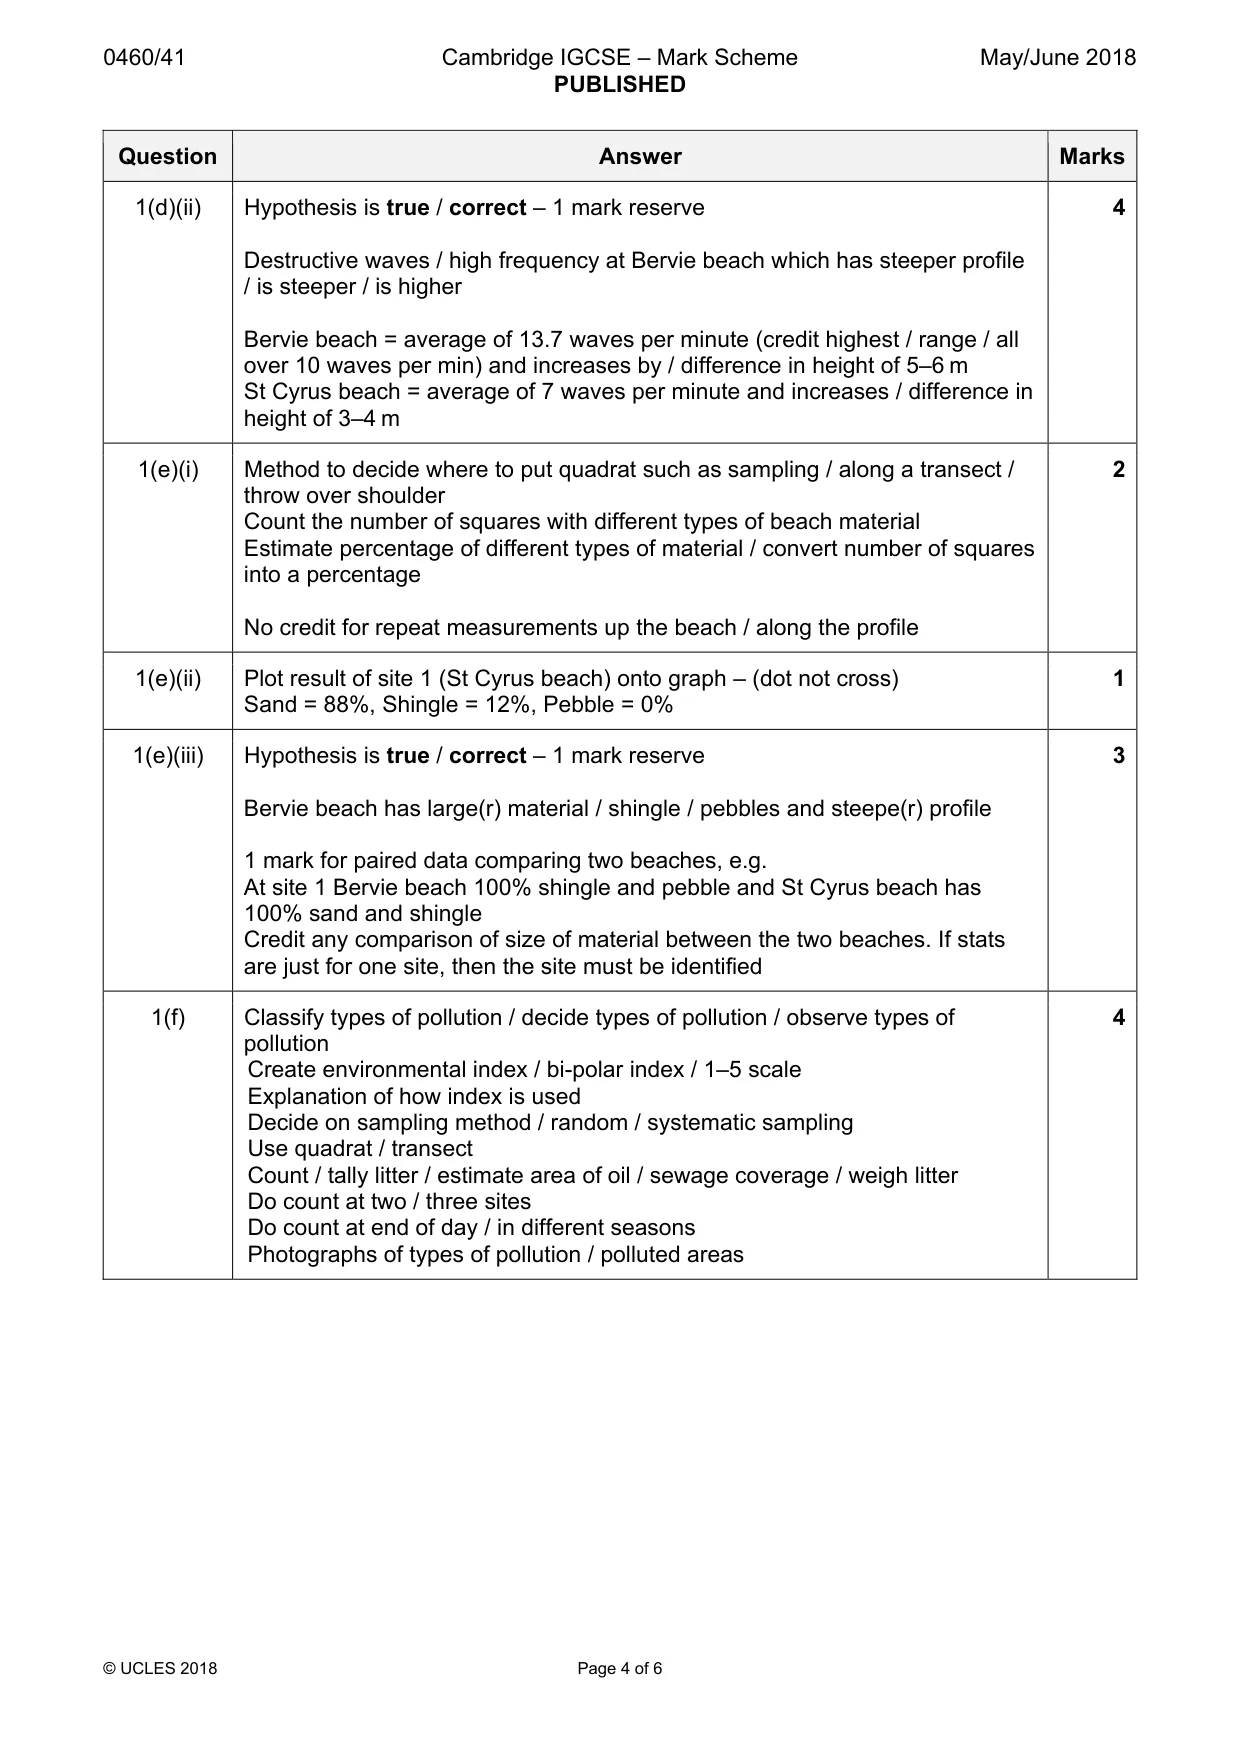
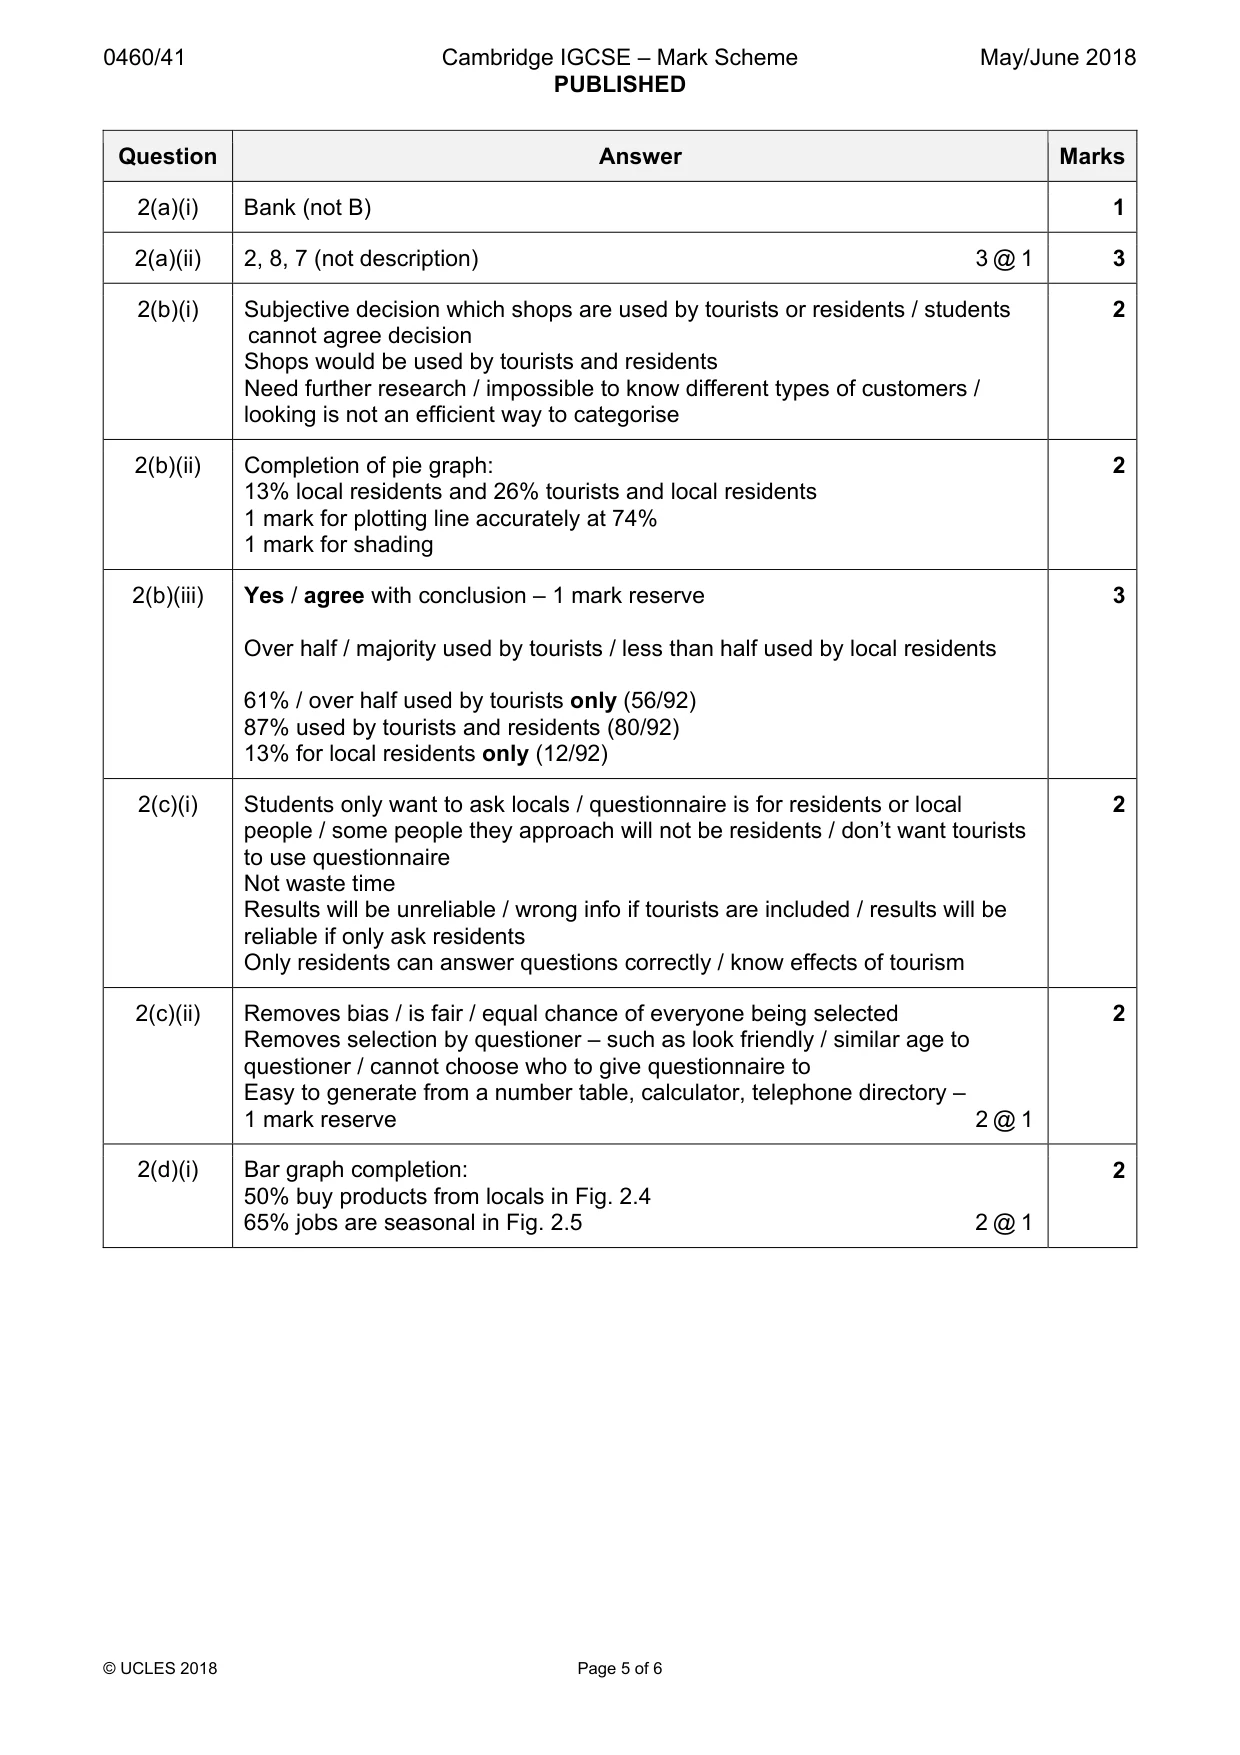
Mark scheme: Question Answer Marks 1(a) Check weather forecast / don’t go into the sea / measure waves from a safe 3 position / keep away from water / stay on beach / check sea conditions Check tide times before setting off / watch for incoming tide / have an escape route Work in groups or pairs / take a mobile phone or whistle / stay together / stay in a small area 3 @ 1 1(b)(i) Destructive waves: 4 Waves are closer together Breaking wave plunges down / crashes down onto beach Weak swash and strong backwash / stronger backwash / weaker swash Pulls sand and pebbles down beach / remove beach material Constructive waves: Waves are further apart Breaking wave spills forward / gently rolls up beach Strong swash and weak backwash / stronger swash / weaker backwash Push sand and pebbles up the beach / bring material to beach / drops material 1 mark reserve for destructive / constructive wave process 1(b)(ii) Pick a rock on beach / person stands in sea / put pole in sea / put float in sea 3 Count number of waves breaking / hitting pole in one minute / fixed period of time / specified time / count float going up and down in one minute Use watch / chronometer / stopwatch / timer for timing / time for one minute Repeat counting / do counting more than once and take average 1(c)(i) 13.7 1 1(c)(ii) Plotting measurement 7 (13) on Bervie beach 1 1(d)(i) Put rope on beach / create transect line from sea to top of beach / up beach 4 Put poles at each break of slope (NOT equal distances) Measure distance between poles Ensure they are vertical / perpendicular Hold clinometer next to top / at agreed height on marker pole / eye level Sight other marker pole at top / agreed height / string connecting same point on each pole Use a clinometer to measure angle / read angle / degrees / slope Repeat along transect / different places up beach 1(d)(ii) Hypothesis is true / correct – 1 mark reserve 4 Destructive waves / high frequency at Bervie beach which has steeper profile / is steeper / is higher Bervie beach = average of 13.7 waves per minute (credit highest / range / all over 10 waves per min) and increases by / difference in height of 5–6 m St Cyrus beach = average of 7 waves per minute and increases / difference in height of 3–4 m 1(e)(i) Method to decide where to put quadrat such as sampling / along a transect / 2 throw over shoulder Count the number of squares with different types of beach material Estimate percentage of different types of material / convert number of squares into a percentage No credit for repeat measurements up the beach / along the profile 1(e)(ii) Plot result of site 1 (St Cyrus beach) onto graph – (dot not cross) 1 Sand = 88%, Shingle = 12%, Pebble = 0% 1(e)(iii) Hypothesis is true / correct – 1 mark reserve 3 Bervie beach has large(r) material / shingle / pebbles and steepe(r) profile 1 mark for paired data comparing two beaches, e.g. At site 1 Bervie beach 100% shingle and pebble and St Cyrus beach has 100% sand and shingle Credit any comparison of size of material between the two beaches. If stats are just for one site, then the site must be identified 1(f) Classify types of pollution / decide types of pollution / observe types of 4 pollution Create environmental index / bi-polar index / 1–5 scale Explanation of how index is used Decide on sampling method / random / systematic sampling Use quadrat / transect Count / tally litter / estimate area of oil / sewage coverage / weigh litter Do count at two / three sites Do count at end of day / in different seasons Photographs of types of pollution / polluted areas
Q2 · Students in the UK wanted to investigate the impact of tourism on a town in the Lake…
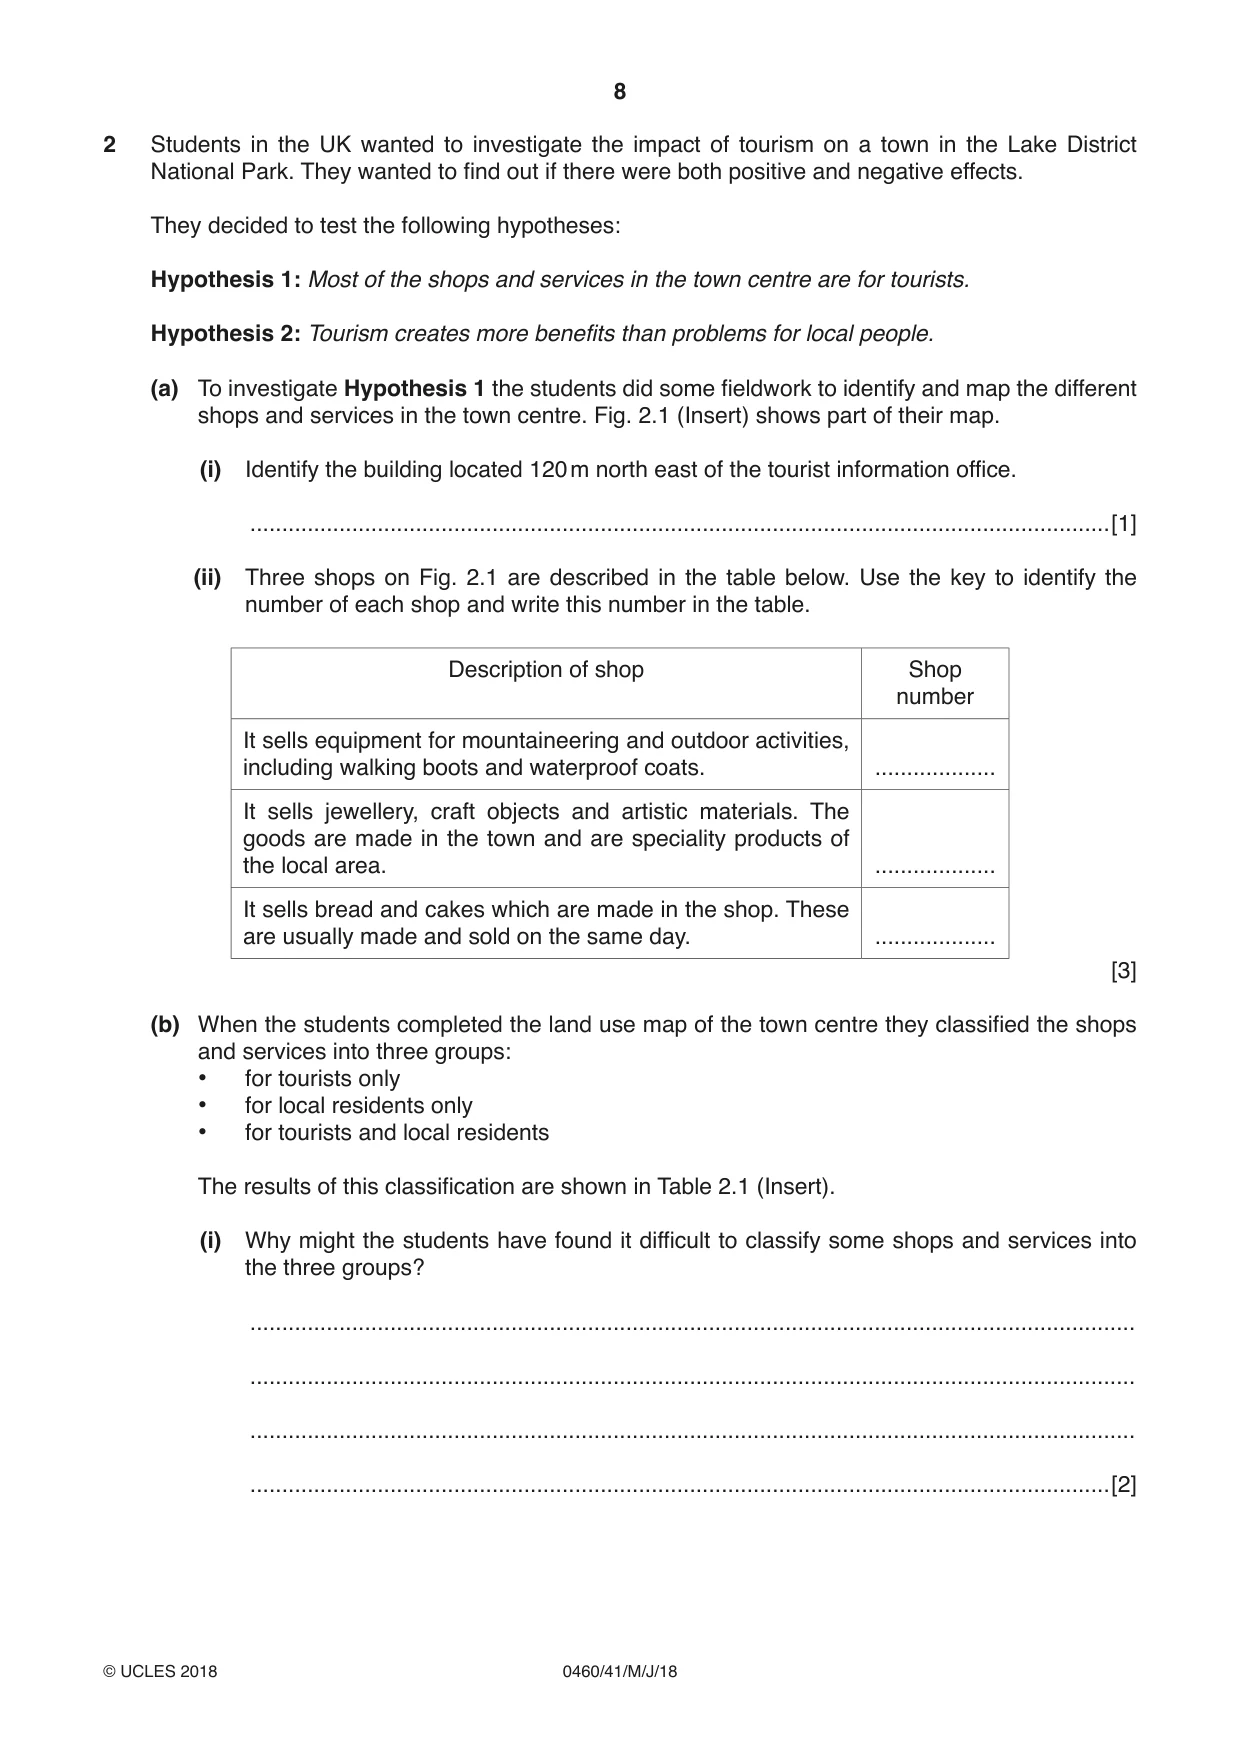
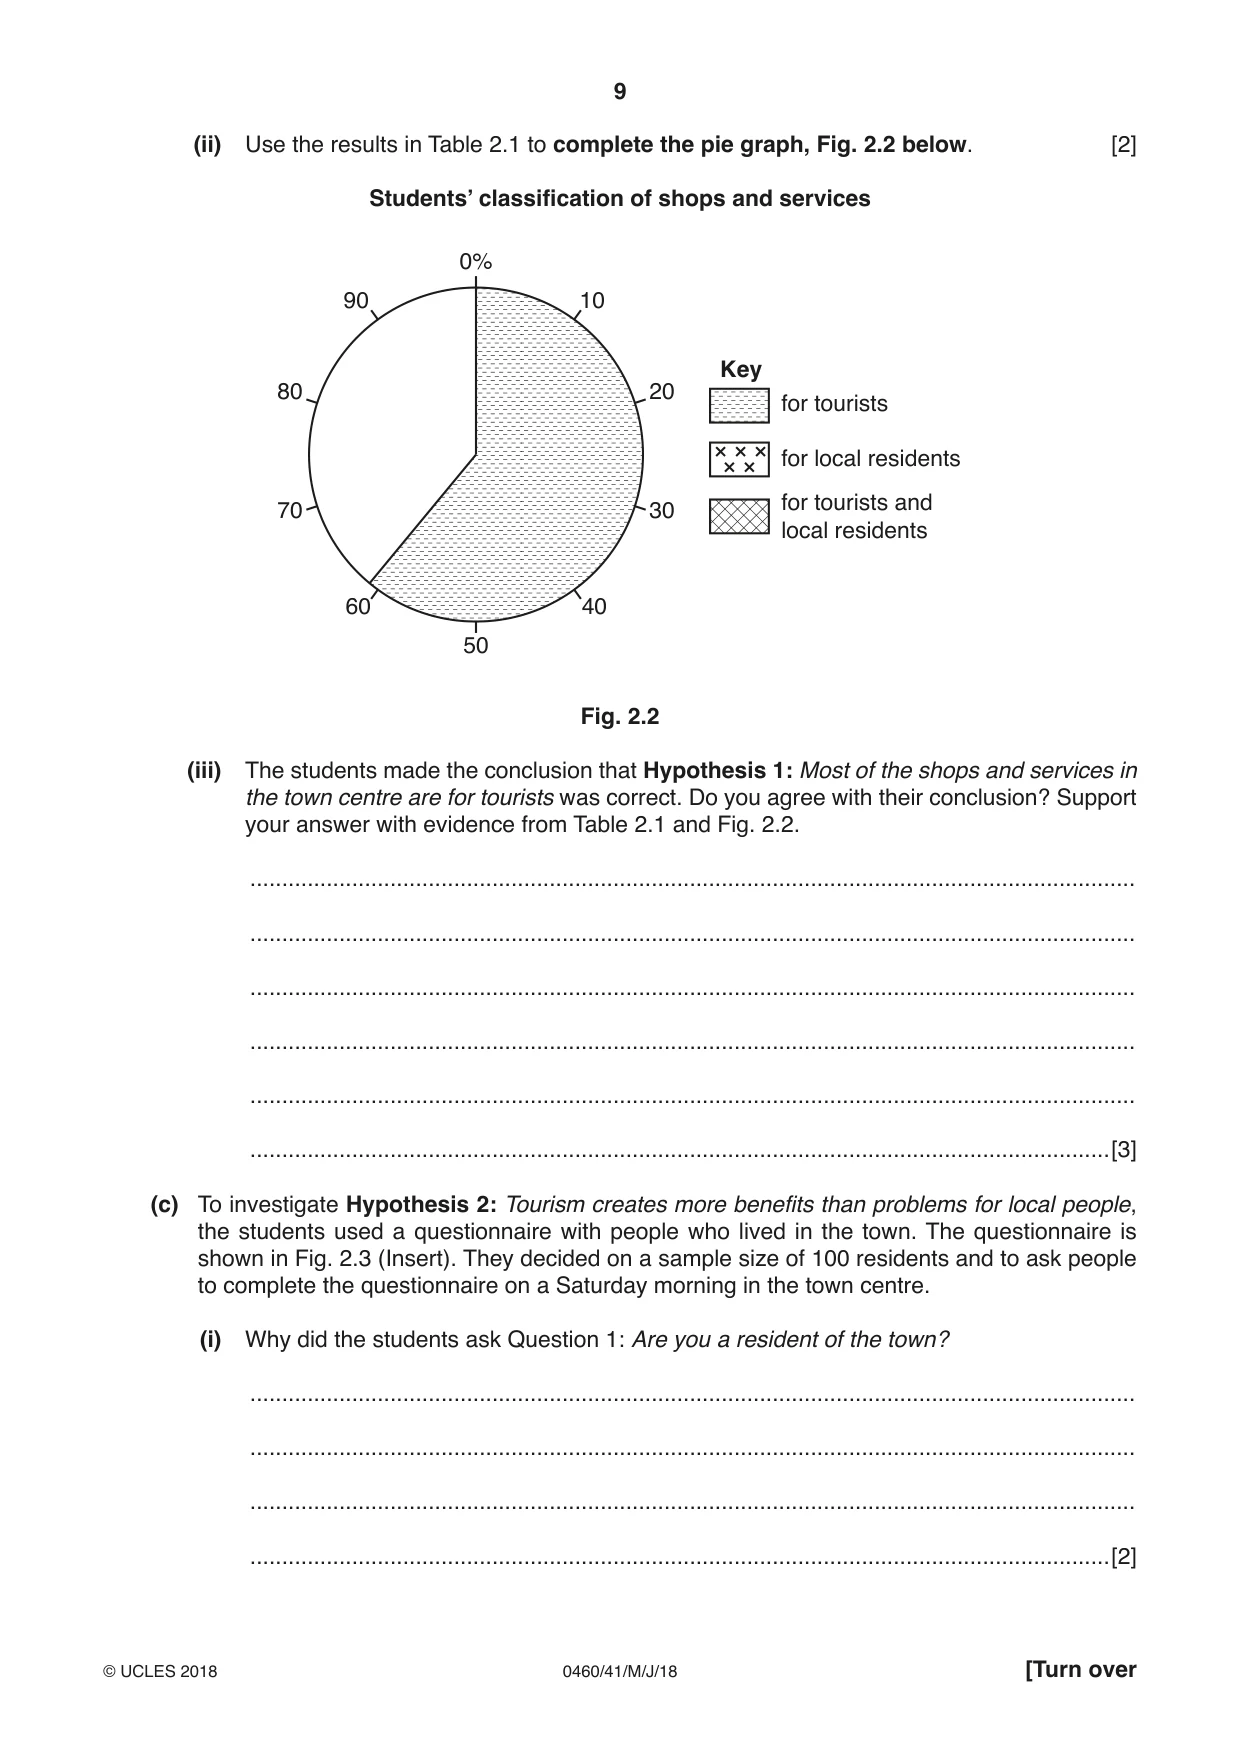
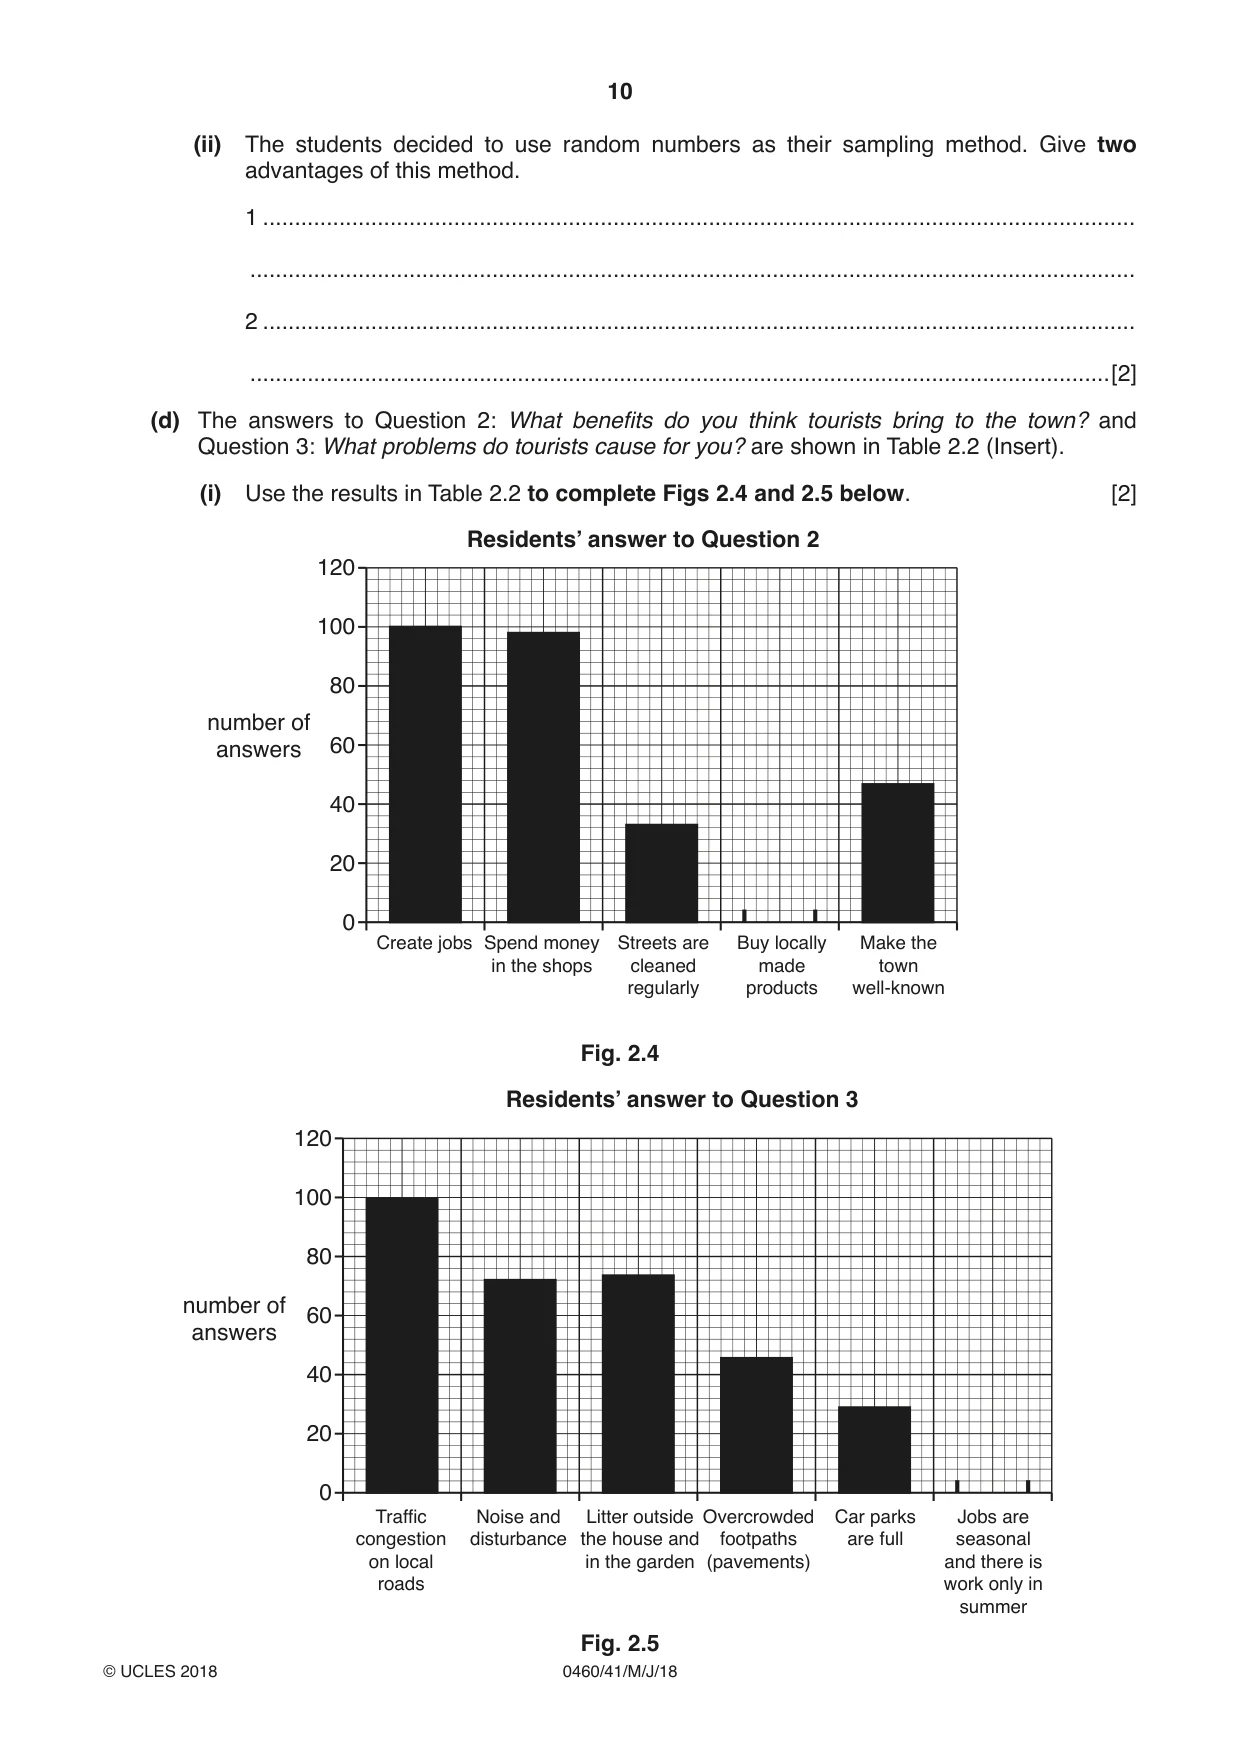
2 Students in the UK wanted to investigate the impact of tourism on a town in the Lake District National Park. They wanted to find out if there were both positive and negative effects. They decided to test the following hypotheses: Hypothesis 1: Most of the shops and services in the town centre are for tourists. Hypothesis 2: Tourism creates more benefits than problems for local people. (a) To investigate Hypothesis 1 the students did some fieldwork to identify and map the different shops and services in the town centre. Fig. 2.1 (Insert) shows part of their map. (i) Identify the building located 120 m north east of the tourist information office. .......................................................................................................................................[1] (ii) Three shops on Fig. 2.1 are described in the table below. Use the key to identify the number of each shop and write this number in the table. Description of shop Shop number It sells equipment for mountaineering and outdoor activities, including walking boots and waterproof coats. ................... It sells jewellery, craft objects and artistic materials. The goods are made in the town and are speciality products of the local area. ................... It sells bread and cakes which are made in the shop. These are usually made and sold on the same day. ................... [3] (b) When the students completed the land use map of the town centre they classified the shops and services into three groups: • for tourists only • for local residents only • for tourists and local residents The results of this classification are shown in Table 2.1 (Insert). (i) Why might the students have found it difficult to classify some shops and services into the three groups? ........................................................................................................................................... ........................................................................................................................................... ........................................................................................................................................... .......................................................................................................................................[2] (ii) Use the results in Table 2.1 to complete the pie graph, Fig. 2.2 below. [2] Students’ classification of shops and services 0% 90 10 Key 80 20 for tourists for local residents for tourists and 70 30 local residents 60 40 50 Fig. 2.2 (iii) The students made the conclusion that Hypothesis 1: Most of the shops and services in the town centre are for tourists was correct. Do you agree with their conclusion? Support your answer with evidence from Table 2.1 and Fig. 2.2. ........................................................................................................................................... ........................................................................................................................................... ........................................................................................................................................... ........................................................................................................................................... ........................................................................................................................................... .......................................................................................................................................[3] (c) To investigate Hypothesis 2: Tourism creates more benefits than problems for local people, the students used a questionnaire with people who lived in the town. The questionnaire is shown in Fig. 2.3 (Insert). They decided on a sample size of 100 residents and to ask people to complete the questionnaire on a Saturday morning in the town centre. (i) Why did the students ask Question 1: Are you a resident of the town? ........................................................................................................................................... ........................................................................................................................................... ........................................................................................................................................... .......................................................................................................................................[2] (ii) The students decided to use random numbers as their sampling method. Give two advantages of this method. 1 ......................................................................................................................................... ........................................................................................................................................... 2 ......................................................................................................................................... .......................................................................................................................................[2] (d) The answers to Question 2: What benefits do you think tourists bring to the town? and Question 3: What problems do tourists cause for you? are shown in Table 2.2 (Insert). (i) Use the results in Table 2.2 to complete Figs 2.4 and 2.5 below. [2] Residents’ answer to Question 2 120 100 80 number of answers 60 40 20 0 Create jobs Spend money Streets are Buy locally Make the in the shops cleaned made town regularly products well-known Fig. 2.4 Residents’ answer to Question 3 120 100 80 number of 60 answers 40 20 0 Traffic Noise and Litter outside Overcrowded Car parks Jobs are congestion disturbance the house and footpaths are full seasonal on local in the garden (pavements) and there is roads work only in summer
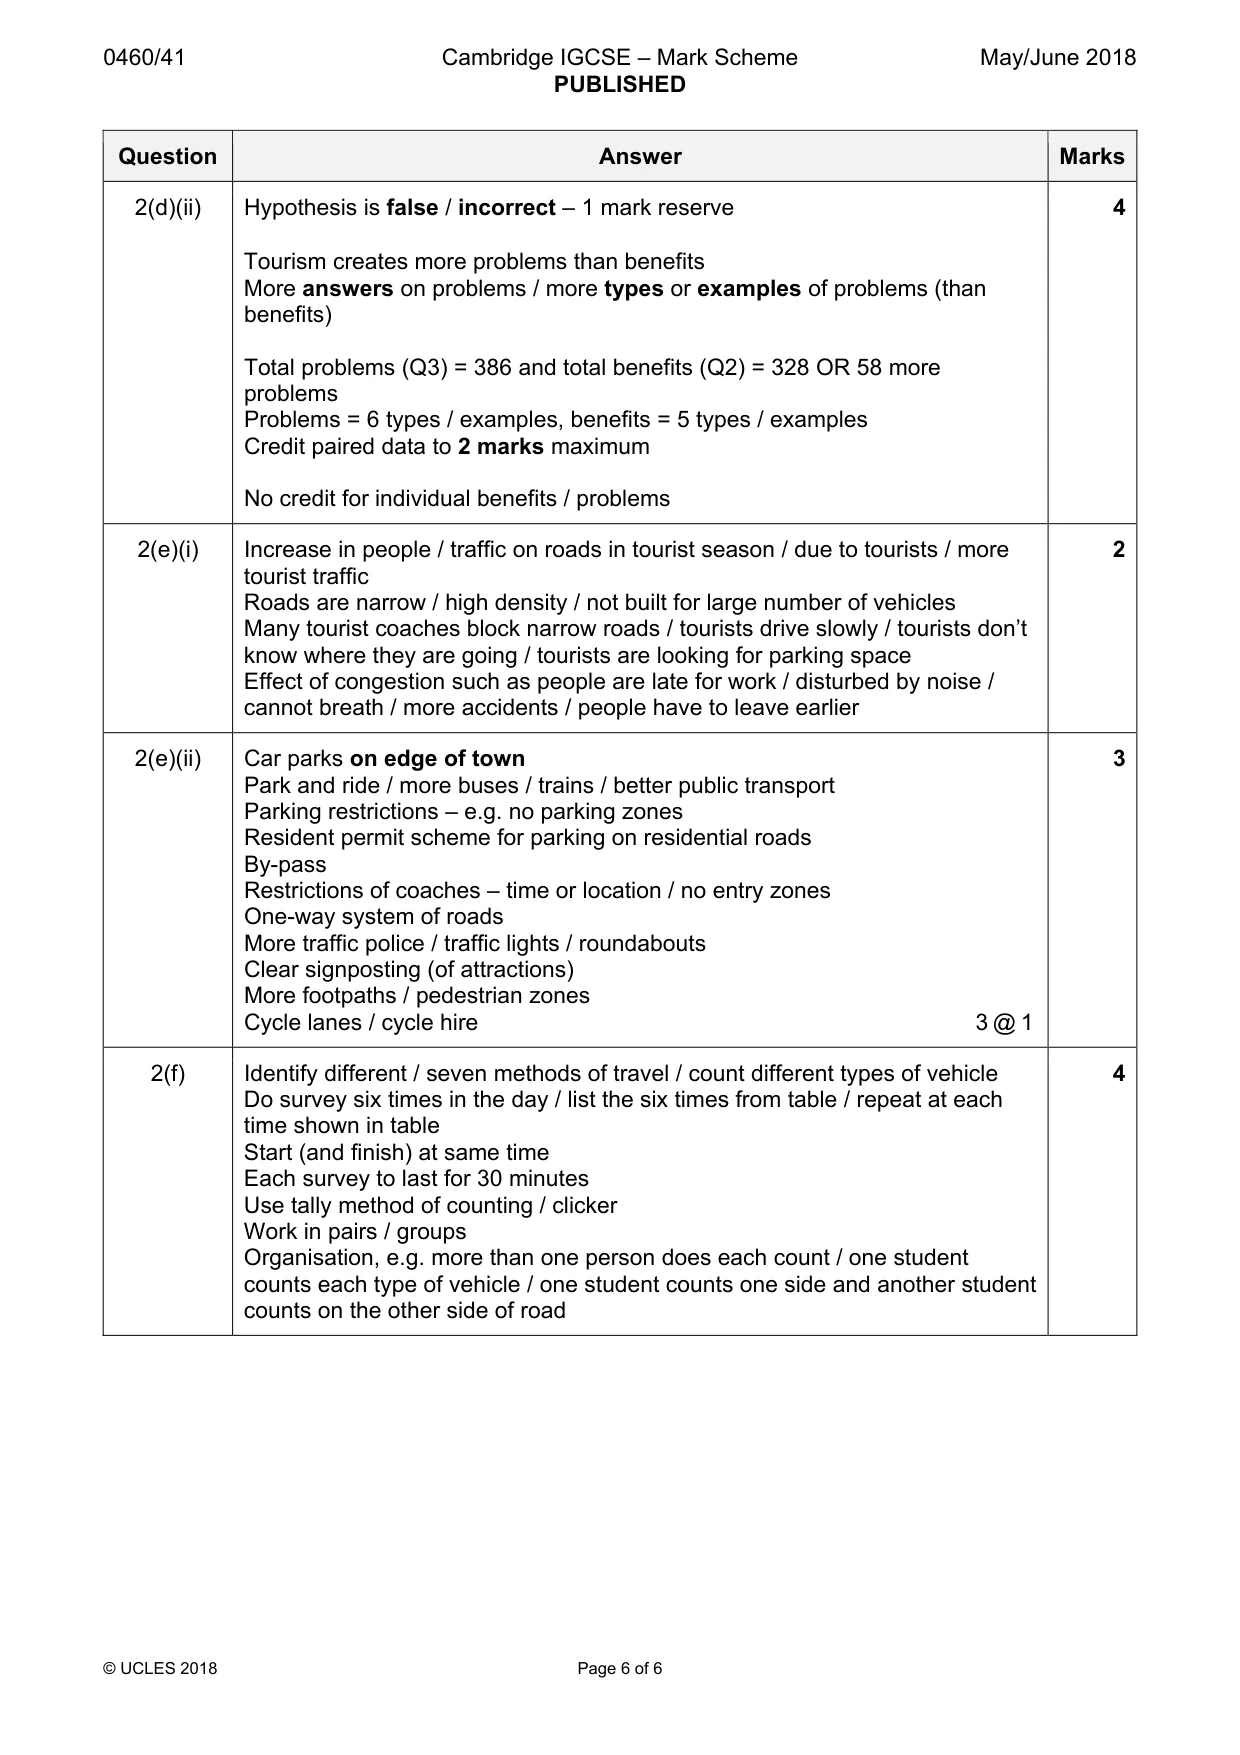
Mark scheme: 2(a)(i) Bank (not B) 1 2(a)(ii) 2, 8, 7 (not description) 3 @ 1 3 2(b)(i) Subjective decision which shops are used by tourists or residents / students 2 cannot agree decision Shops would be used by tourists and residents Need further research / impossible to know different types of customers / looking is not an efficient way to categorise 2(b)(ii) Completion of pie graph: 2 13% local residents and 26% tourists and local residents 1 mark for plotting line accurately at 74% 1 mark for shading 2(b)(iii) Yes / agree with conclusion – 1 mark reserve 3 Over half / majority used by tourists / less than half used by local residents 61% / over half used by tourists only (56/92) 87% used by tourists and residents (80/92) 13% for local residents only (12/92) 2(c)(i) Students only want to ask locals / questionnaire is for residents or local 2 people / some people they approach will not be residents / don’t want tourists to use questionnaire Not waste time Results will be unreliable / wrong info if tourists are included / results will be reliable if only ask residents Only residents can answer questions correctly / know effects of tourism 2(c)(ii) Removes bias / is fair / equal chance of everyone being selected 2 Removes selection by questioner – such as look friendly / similar age to questioner / cannot choose who to give questionnaire to Easy to generate from a number table, calculator, telephone directory – 1 mark reserve 2 @ 1 2(d)(i) Bar graph completion: 2 50% buy products from locals in Fig. 2.4 65% jobs are seasonal in Fig. 2.5 2 @ 1 2(d)(ii) Hypothesis is false / incorrect – 1 mark reserve 4 Tourism creates more problems than benefits More answers on problems / more types or examples of problems (than benefits) Total problems (Q3) = 386 and total benefits (Q2) = 328 OR 58 more problems Problems = 6 types / examples, benefits = 5 types / examples Credit paired data to 2 marks maximum No credit for individual benefits / problems 2(e)(i) Increase in people / traffic on roads in tourist season / due to tourists / more 2 tourist traffic Roads are narrow / high density / not built for large number of vehicles Many tourist coaches block narrow roads / tourists drive slowly / tourists don’t know where they are going / tourists are looking for parking space Effect of congestion such as people are late for work / disturbed by noise / cannot breath / more accidents / people have to leave earlier 2(e)(ii) Car parks on edge of town 3 Park and ride / more buses / trains / better public transport Parking restrictions – e.g. no parking zones Resident permit scheme for parking on residential roads By-pass Restrictions of coaches – time or location / no entry zones One-way system of roads More traffic police / traffic lights / roundabouts Clear signposting (of attractions) More footpaths / pedestrian zones Cycle lanes / cycle hire 3 @ 1 2(f) Identify different / seven methods of travel / count different types of vehicle 4 Do survey six times in the day / list the six times from table / repeat at each time shown in table Start (and finish) at same time Each survey to last for 30 minutes Use tally method of counting / clicker Work in pairs / groups Organisation, e.g. more than one person does each count / one student counts each type of vehicle / one student counts one side and another student counts on the other side of road
More questions on Settlements (rural and urban) and service provision
What was in this paper
The subtopics covered by these 2 questions, and how many questions each got. Open one in a new tab to see every Cambridge question on it.
What you needed in this session
Cambridge’s own grade thresholds for 2018 May/June, Paper 4 · Variant 1. A higher threshold means an easier paper — the bar moves with how the cohort did.