Cambridge IGCSE Geography 0460 — 2018 May/June Paper 4 · Variant 2
0460/42/M/J/18 · 2 questions · 60 marks · ≈68 min
The question paper and its mark scheme, free to read here and free to download. This is Cambridge’s own paper, exactly as it was sat.
Question paper20 pages






Mark scheme8 pages
Answers below. Sit the paper first if you are practising.
Questions as text
Q1 · Students in Bangkok, Thailand investigated differences between two shopping centres in…
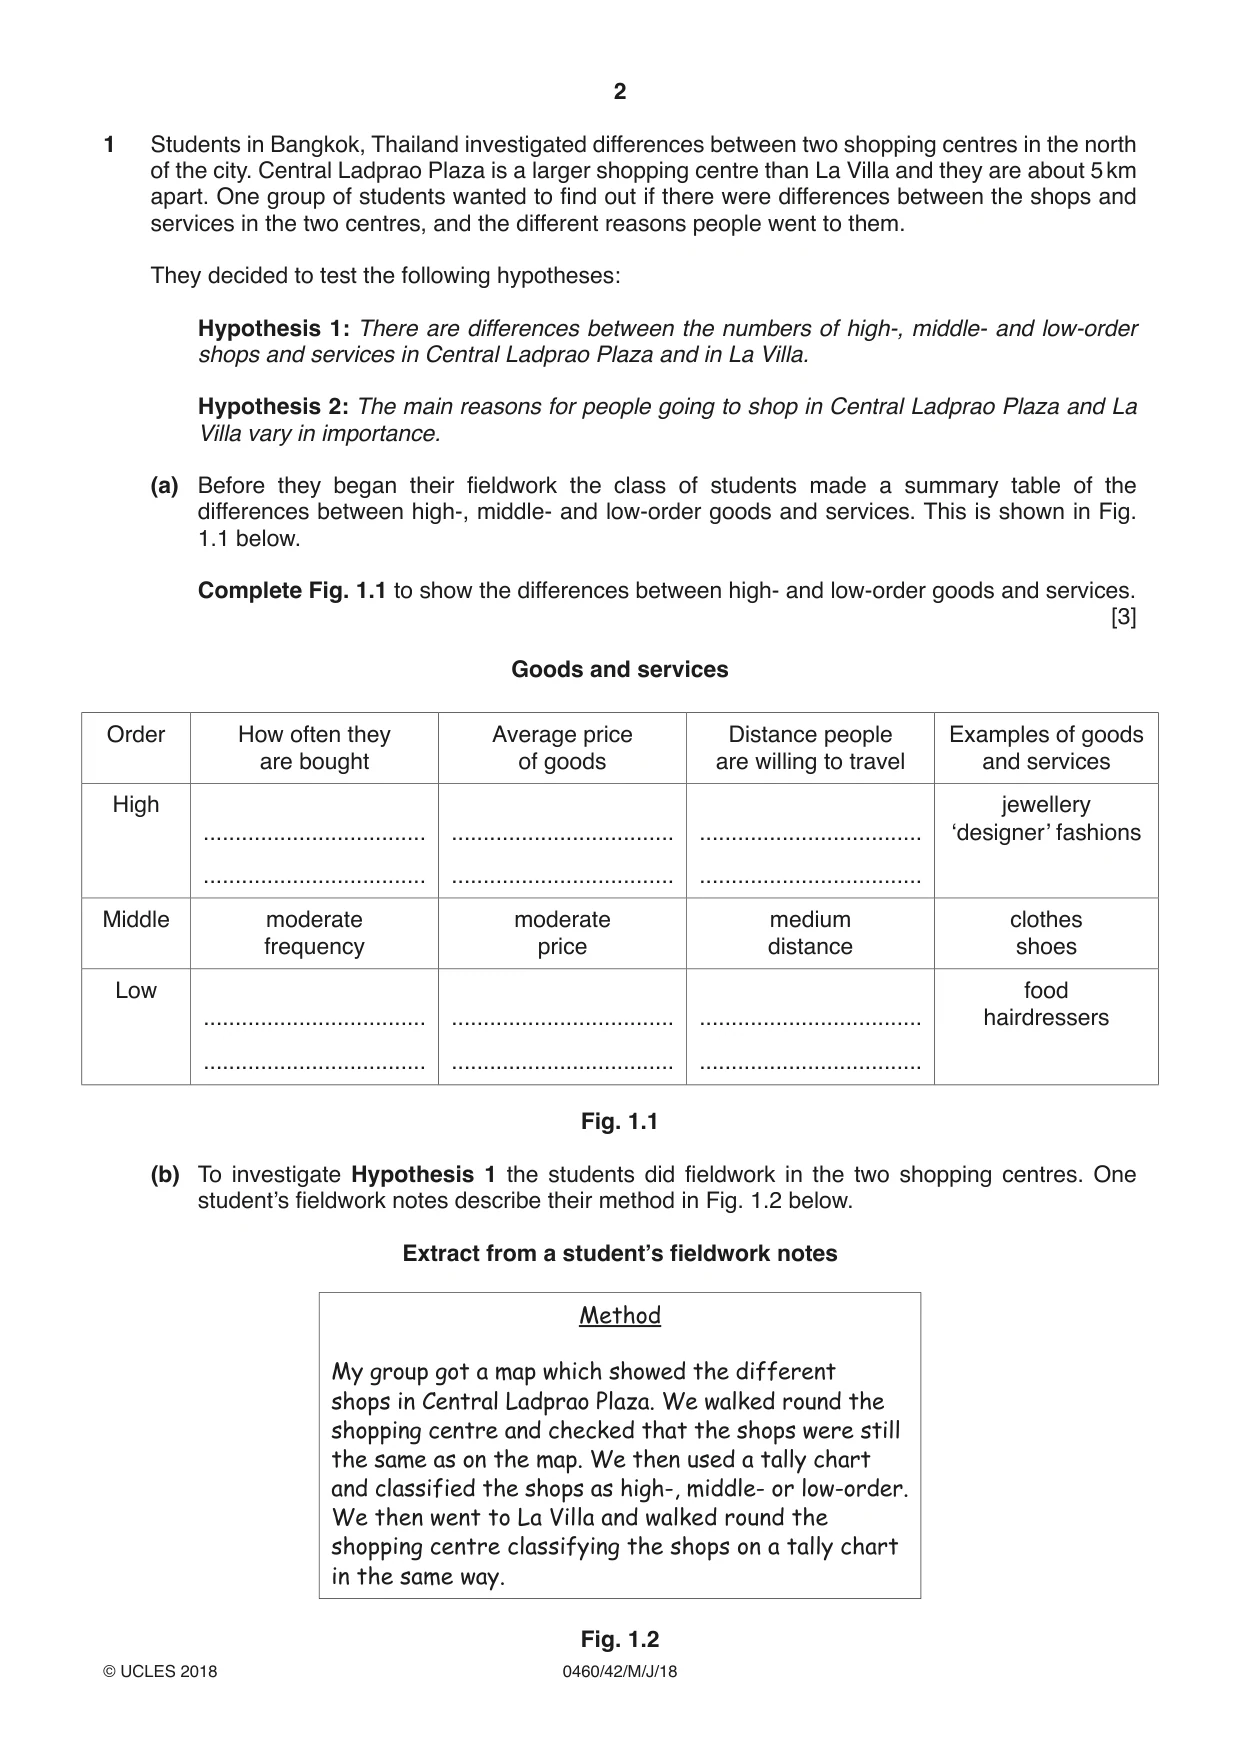
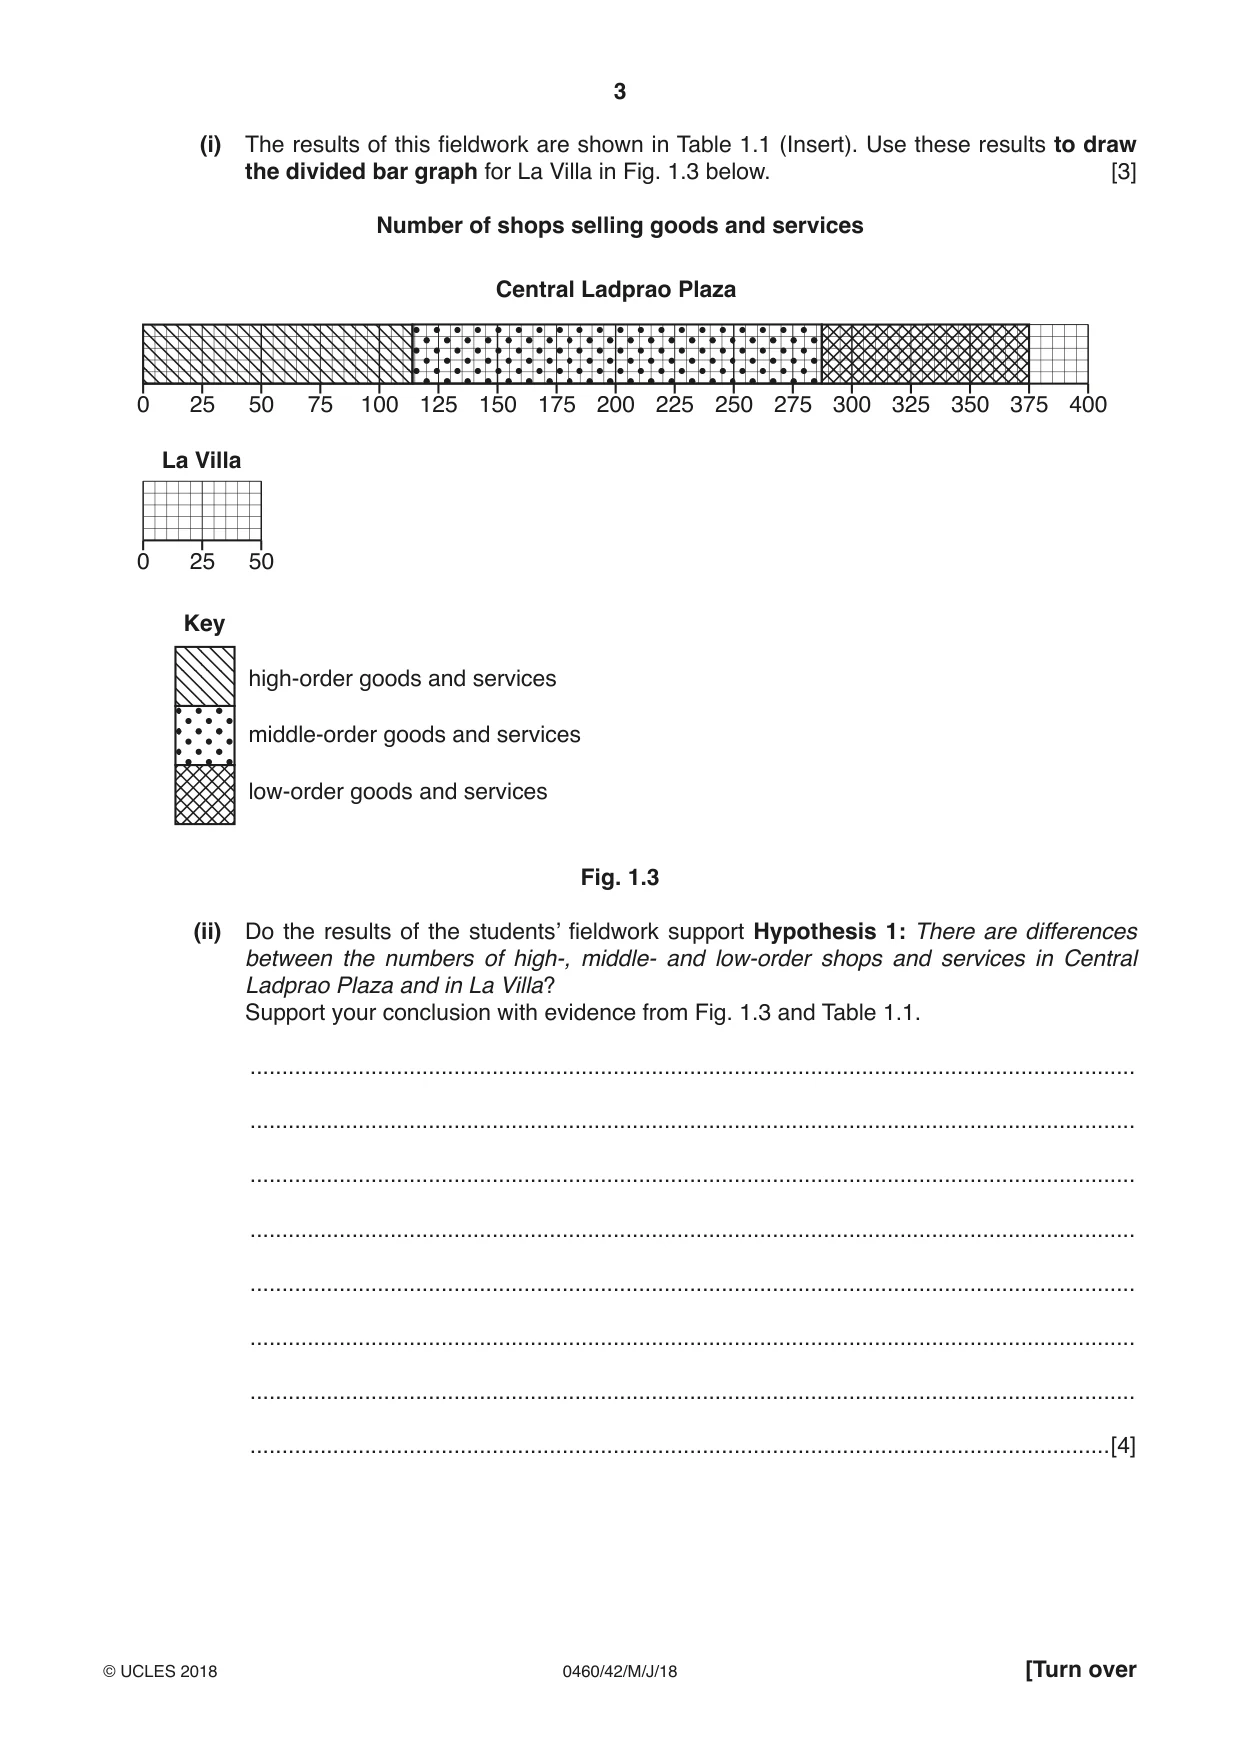
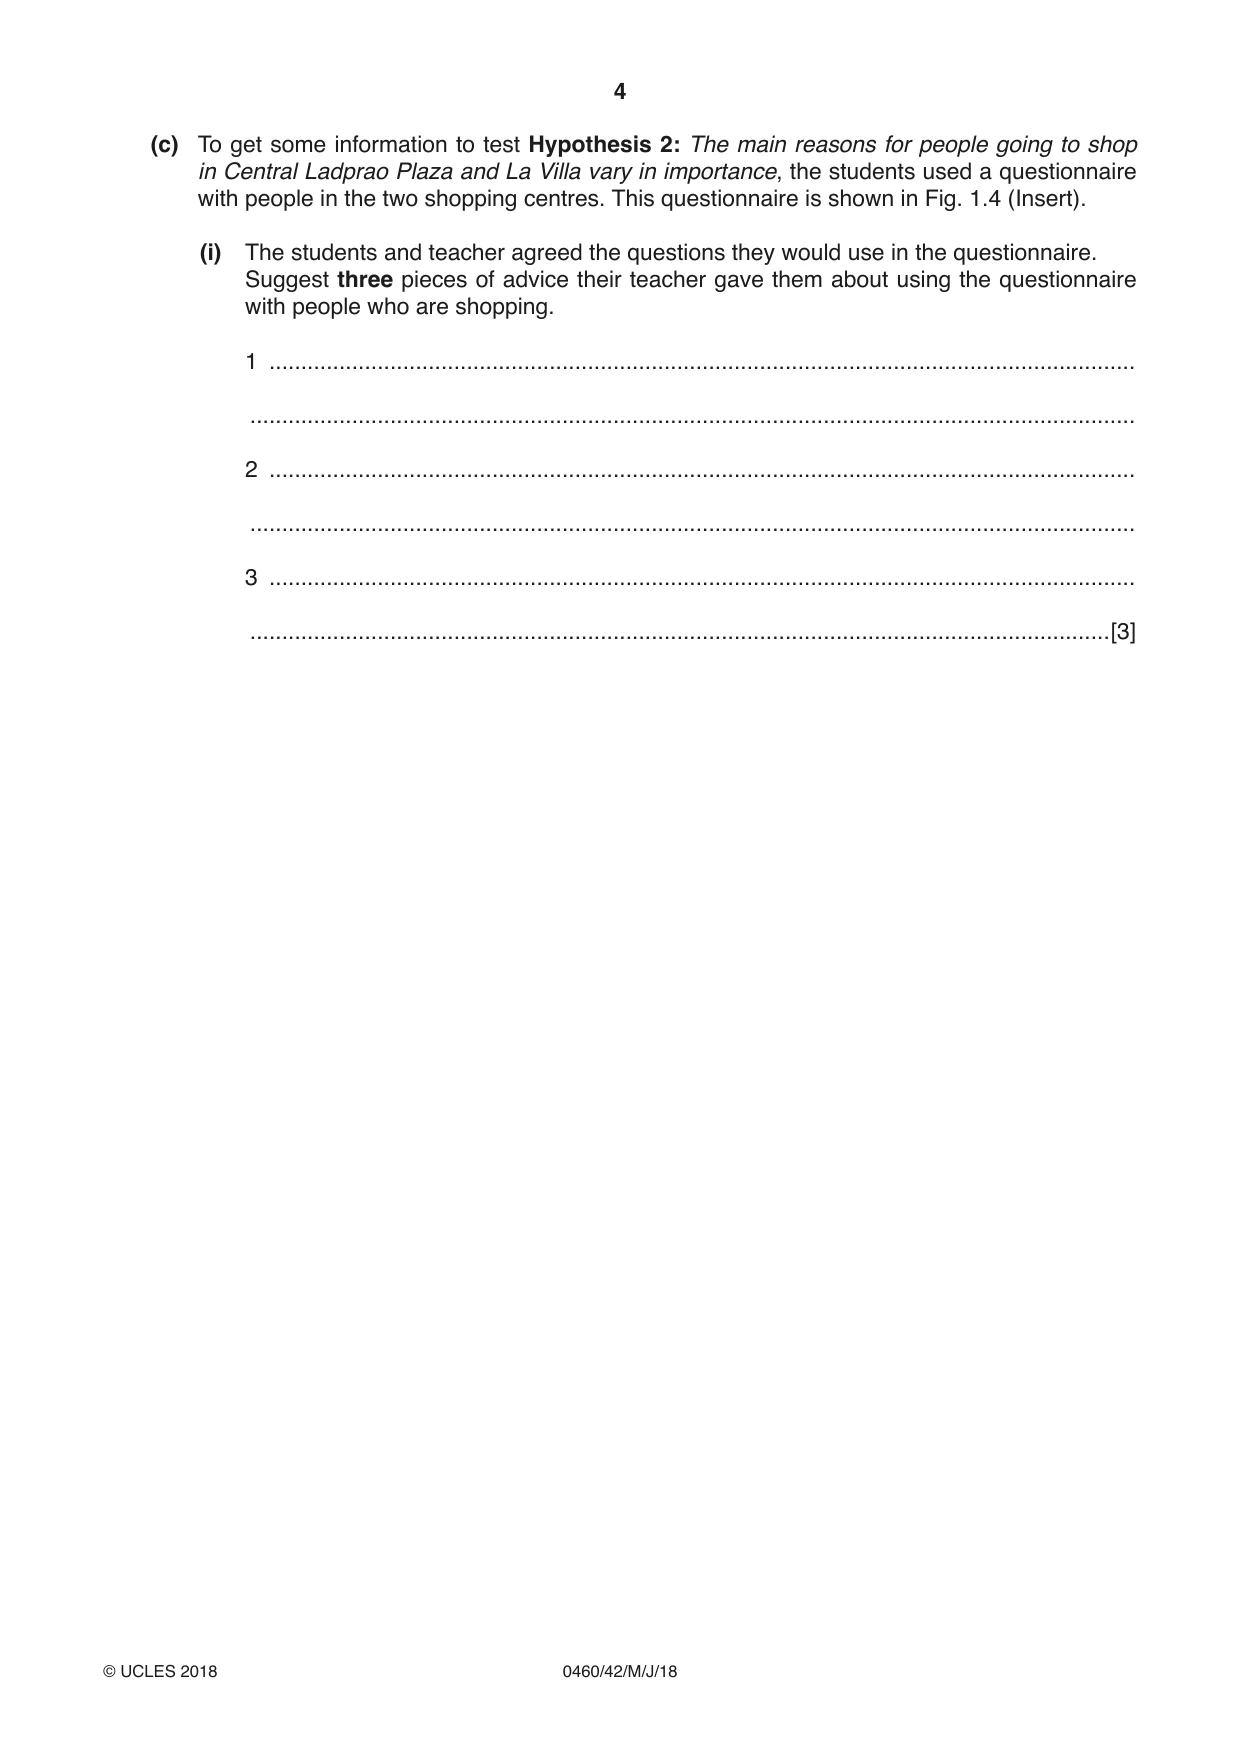
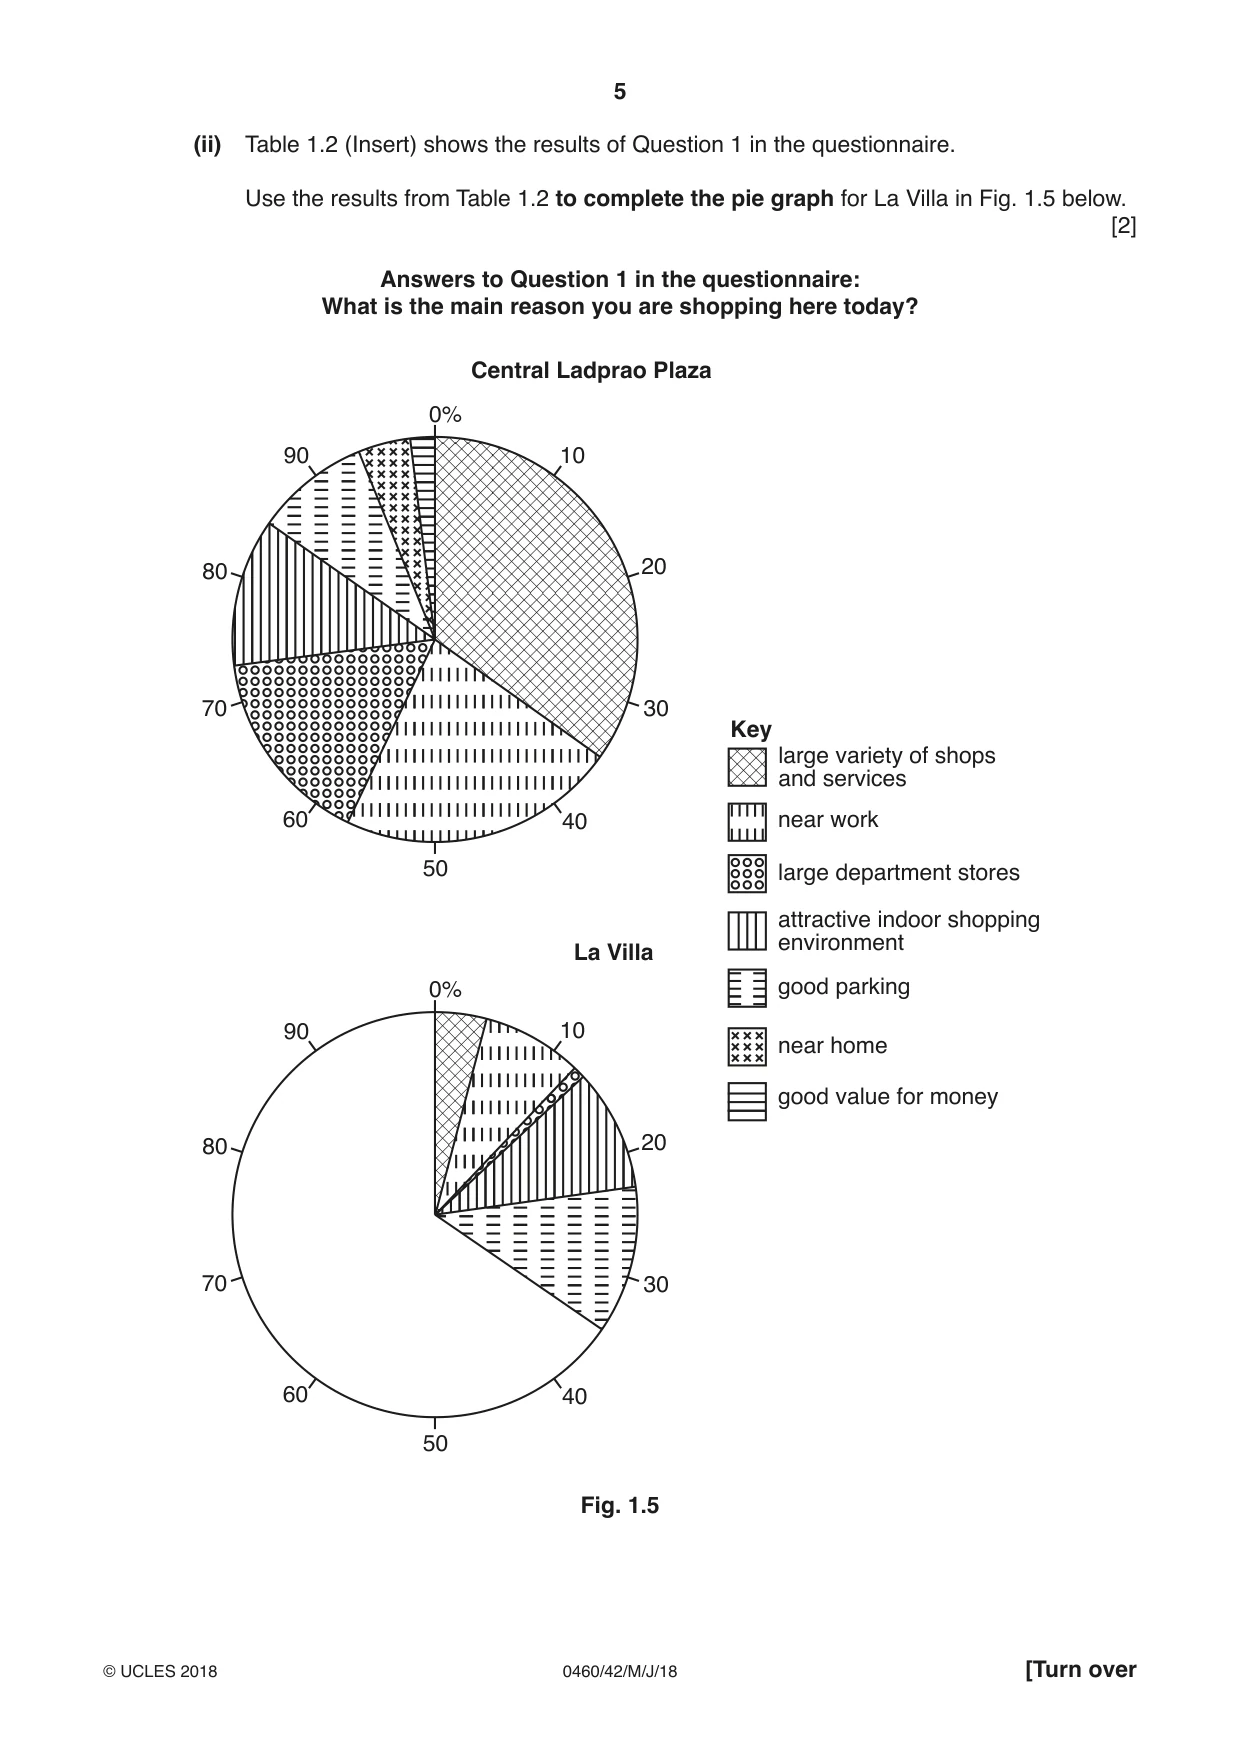
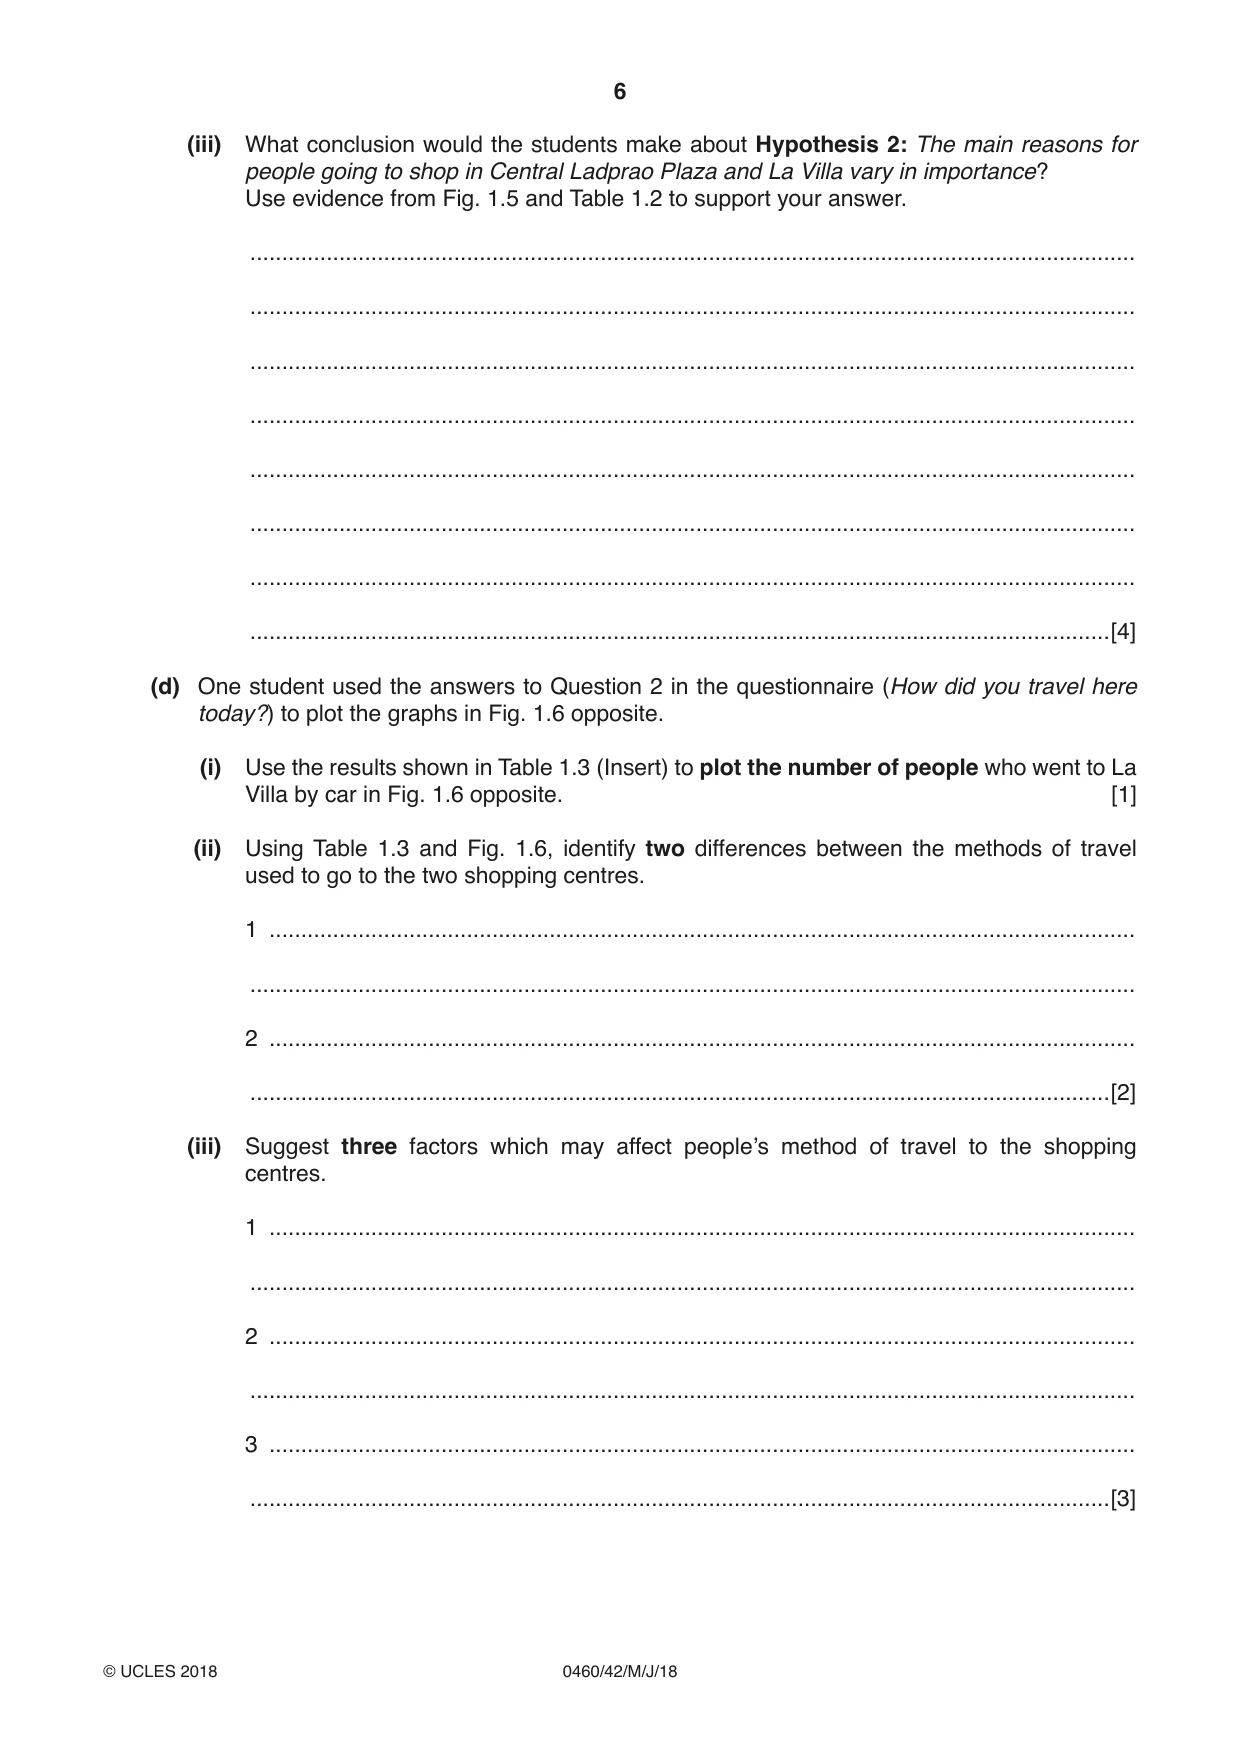
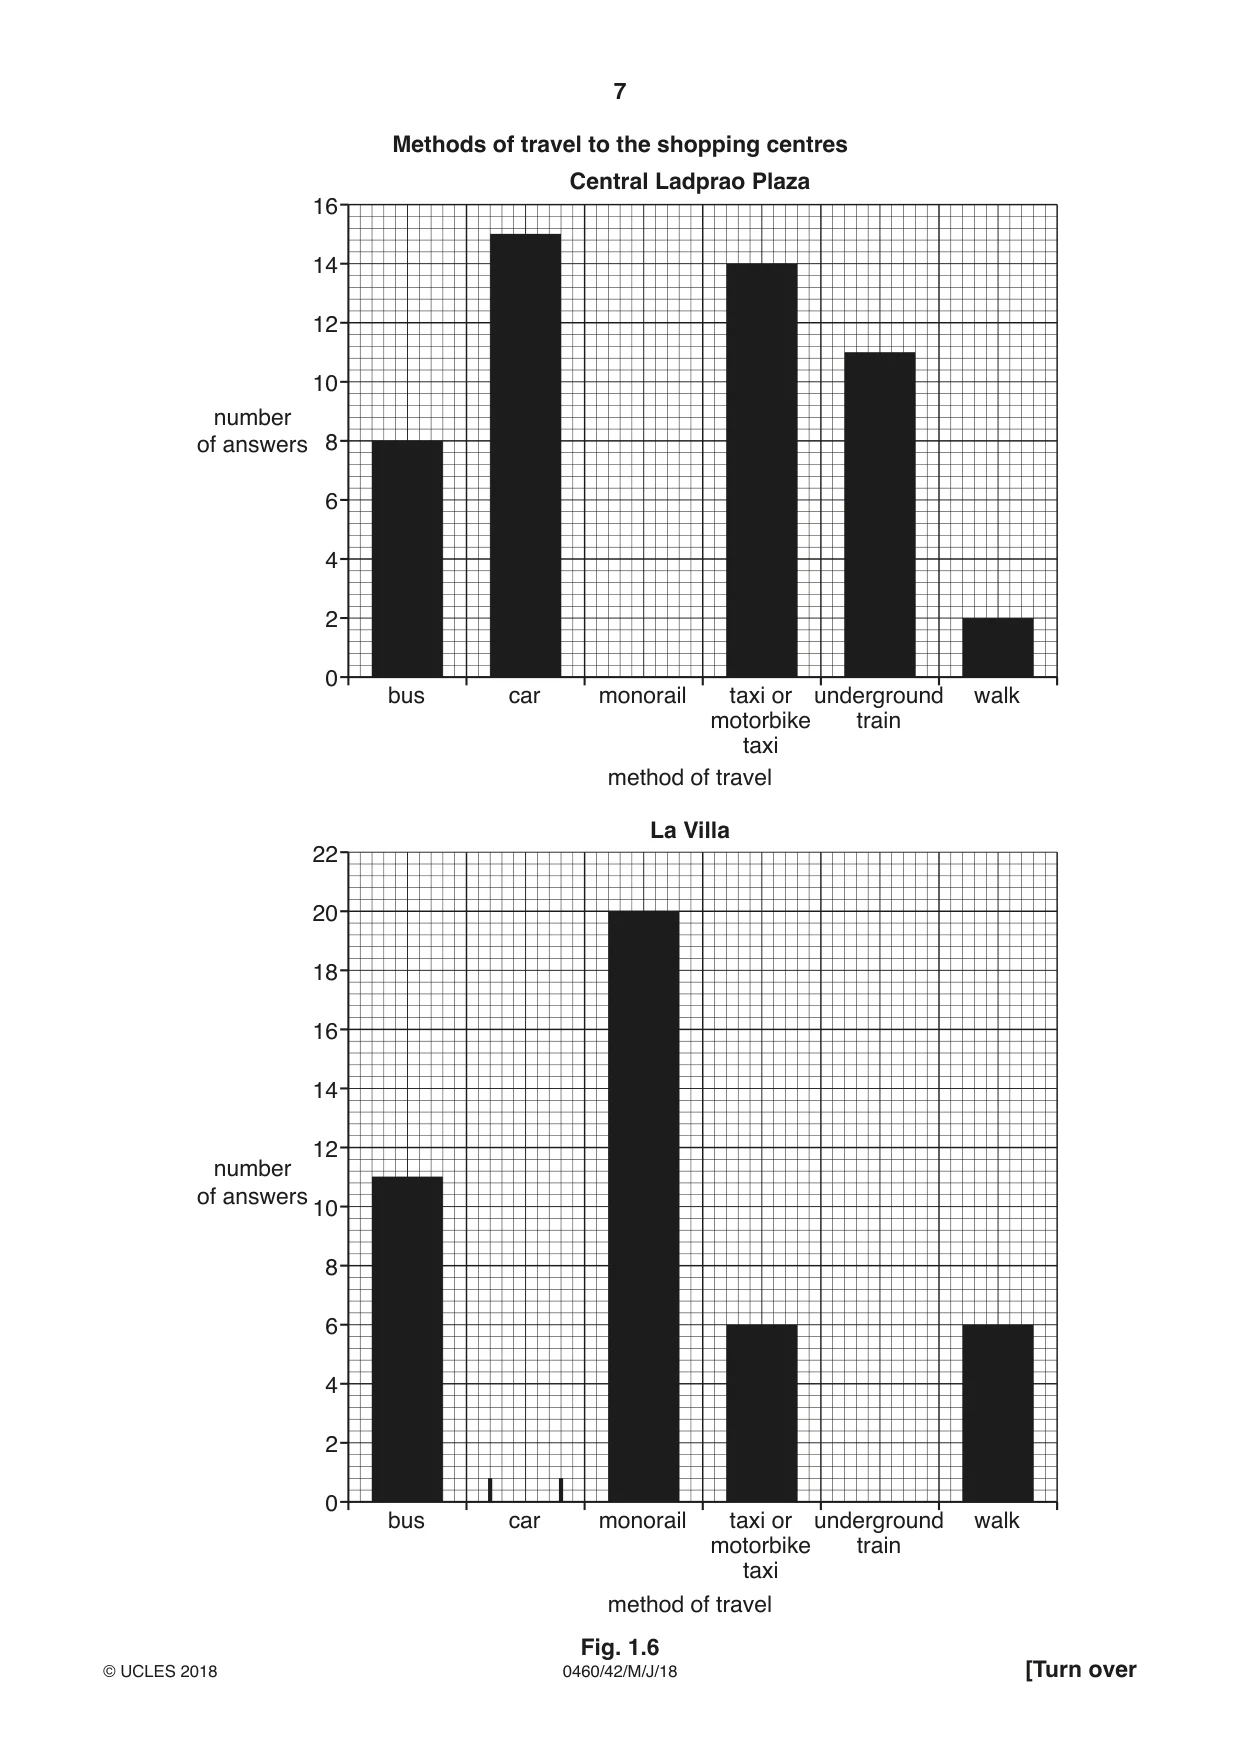
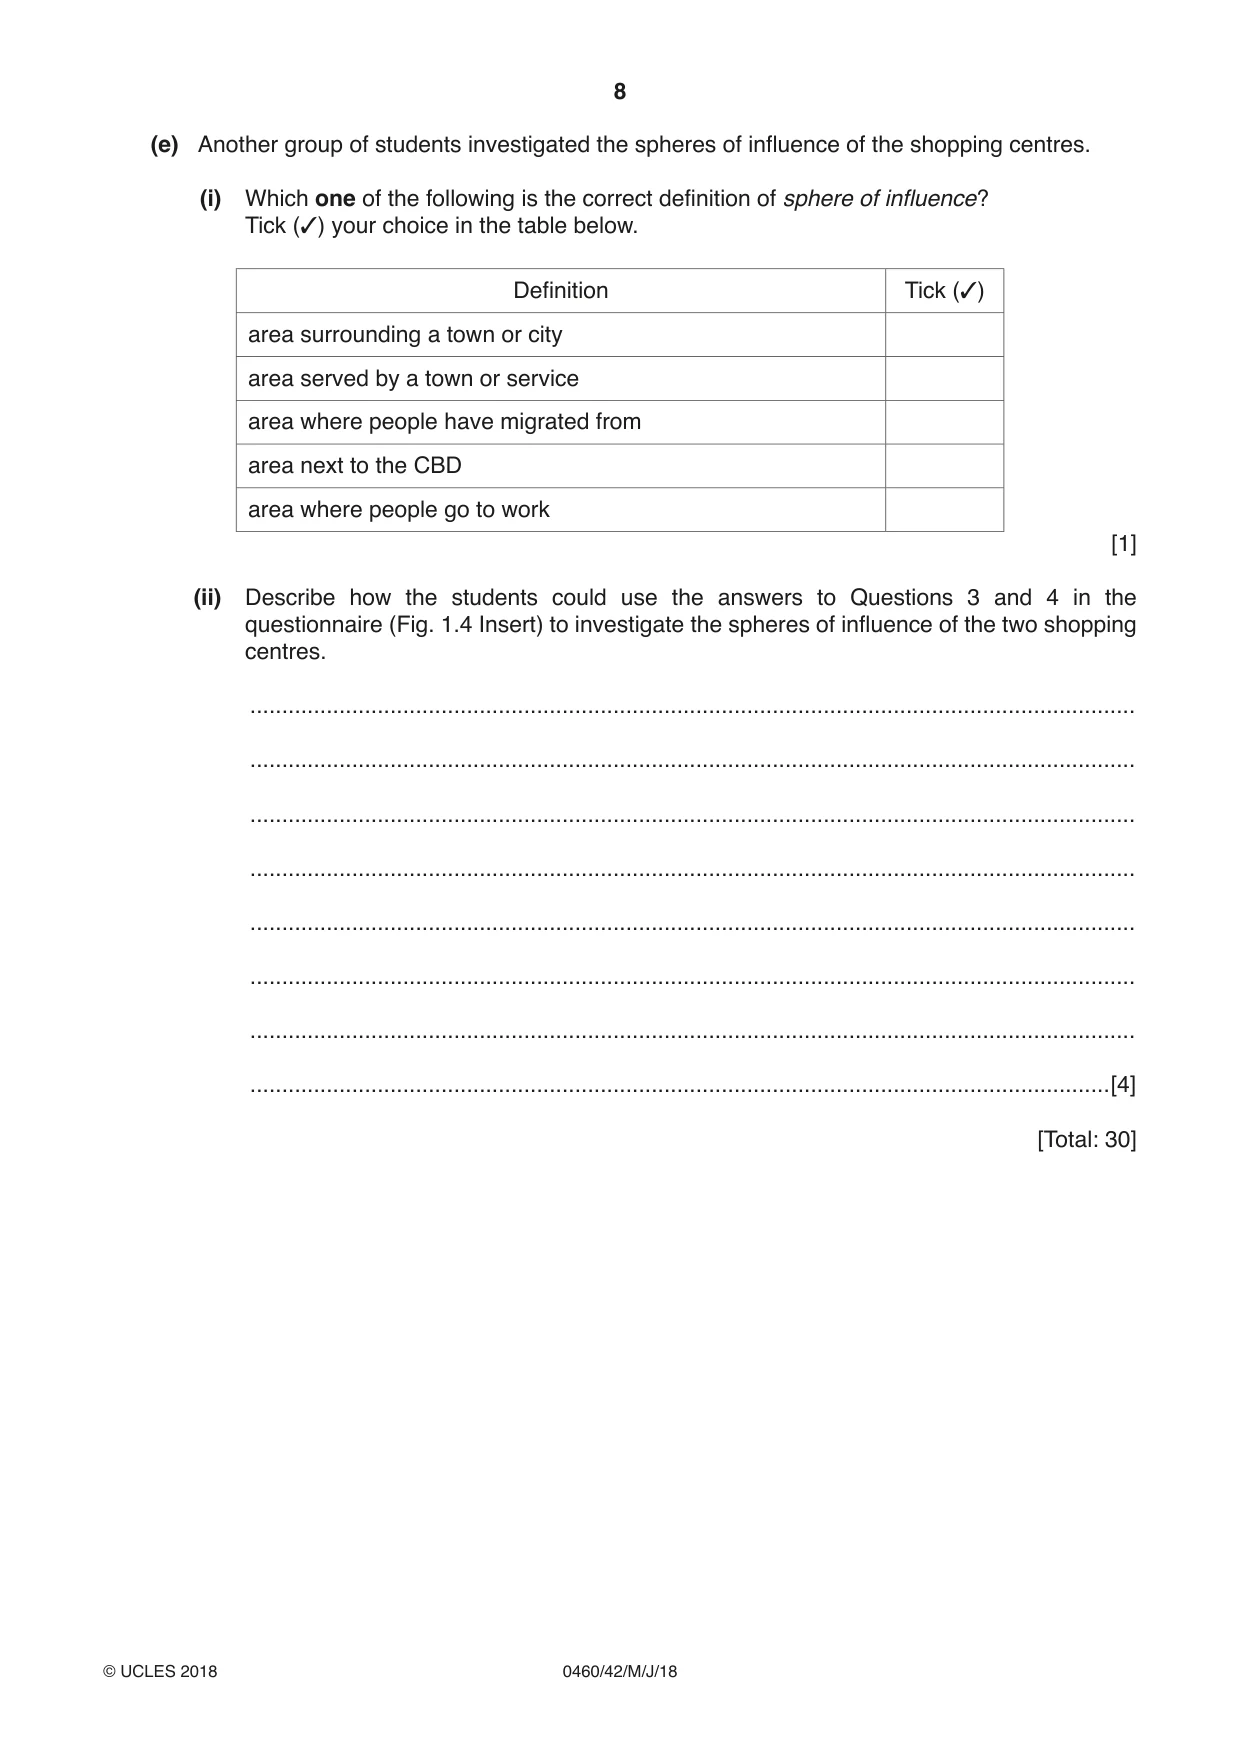
1 Students in Bangkok, Thailand investigated differences between two shopping centres in the north of the city. Central Ladprao Plaza is a larger shopping centre than La Villa and they are about 5 km apart. One group of students wanted to find out if there were differences between the shops and services in the two centres, and the different reasons people went to them. They decided to test the following hypotheses: Hypothesis 1: There are differences between the numbers of high-, middle- and low-order shops and services in Central Ladprao Plaza and in La Villa. Hypothesis 2: The main reasons for people going to shop in Central Ladprao Plaza and La Villa vary in importance. (a) Before they began their fieldwork the class of students made a summary table of the differences between high-, middle- and low-order goods and services. This is shown in Fig. 1.1 below. Complete Fig. 1.1 to show the differences between high- and low-order goods and services. [3] Goods and services Order How often they Average price Distance people Examples of goods are bought of goods are willing to travel and services High jewellery ................................... ................................... ................................... ‘designer’ fashions ................................... ................................... ................................... Middle moderate moderate medium clothes frequency price distance shoes Low food ................................... ................................... ................................... hairdressers ................................... ................................... ................................... Fig. 1.1 (b) To investigate Hypothesis 1 the students did fieldwork in the two shopping centres. One student’s fieldwork notes describe their method in Fig. 1.2 below. Extract from a student’s fieldwork notes Method My group got a map which showed the different shops in Central Ladprao Plaza. We walked round the shopping centre and checked that the shops were still the same as on the map. We then used a tally chart and classified the shops as high-, middle- or low-order. We then went to La Villa and walked round the shopping centre classifying the shops on a tally chart in the same way. Fig. 1.2 (i) The results of this fieldwork are shown in Table 1.1 (Insert). Use these results to draw the divided bar graph for La Villa in Fig. 1.3 below. [3] Number of shops selling goods and services Central Ladprao Plaza 0 25 50 75 100 125 150 175 200 225 250 275 300 325 350 375 400 La Villa 0 25 50 Key high-order goods and services middle-order goods and services low-order goods and services Fig. 1.3 (ii) Do the results of the students’ fieldwork support Hypothesis 1: There are differences between the numbers of high-, middle- and low-order shops and services in Central Ladprao Plaza and in La Villa? Support your conclusion with evidence from Fig. 1.3 and Table 1.1. ........................................................................................................................................... ........................................................................................................................................... ........................................................................................................................................... ........................................................................................................................................... ........................................................................................................................................... ........................................................................................................................................... ........................................................................................................................................... .......................................................................................................................................[4] (c) To get some information to test Hypothesis 2: The main reasons for people going to shop in Central Ladprao Plaza and La Villa vary in importance, the students used a questionnaire with people in the two shopping centres. This questionnaire is shown in Fig. 1.4 (Insert). (i) The students and teacher agreed the questions they would use in the questionnaire. Suggest three pieces of advice their teacher gave them about using the questionnaire with people who are shopping. 1 ........................................................................................................................................ ........................................................................................................................................... 2 ........................................................................................................................................ ........................................................................................................................................... 3 ........................................................................................................................................ .......................................................................................................................................[3] (ii) Table 1.2 (Insert) shows the results of Question 1 in the questionnaire. Use the results from Table 1.2 to complete the pie graph for La Villa in Fig. 1.5 below. [2] Answers to Question 1 in the questionnaire: What is the main reason you are shopping here today? Central Ladprao Plaza 0% 90 10 80 20 70 30 Key large variety of shops and services 60 40 near work 50 large department stores attractive indoor shopping environment La Villa 0% good parking 90 10 near home good value for money 80 20 70 30 60 40 50 Fig. 1.5 (iii) What conclusion would the students make about Hypothesis 2: The main reasons for people going to shop in Central Ladprao Plaza and La Villa vary in importance? Use evidence from Fig. 1.5 and Table 1.2 to support your answer. ........................................................................................................................................... ........................................................................................................................................... ........................................................................................................................................... ........................................................................................................................................... ........................................................................................................................................... ........................................................................................................................................... ........................................................................................................................................... .......................................................................................................................................[4] (d) One student used the answers to Question 2 in the questionnaire (How did you travel here today?) to plot the graphs in Fig. 1.6 opposite. (i) Use the results shown in Table 1.3 (Insert) to plot the number of people who went to La Villa by car in Fig. 1.6 opposite. [1] (ii) Using Table 1.3 and Fig. 1.6, identify two differences between the methods of travel used to go to the two shopping centres. 1 ........................................................................................................................................ ........................................................................................................................................... 2 ........................................................................................................................................ .......................................................................................................................................[2] (iii) Suggest three factors which may affect people’s method of travel to the shopping centres. 1 ........................................................................................................................................ ........................................................................................................................................... 2 ........................................................................................................................................ ........................................................................................................................................... 3 ........................................................................................................................................ .......................................................................................................................................[3] Methods of travel to the shopping centres Central Ladprao Plaza 16 14 12 10 number of answers 8 6 4 2 0 bus car monorail taxi or underground walk motorbike train taxi method of travel La Villa 22 20 18 16 14 12 number of answers 10 8 6 4 2 0 bus car monorail taxi or underground walk motorbike train taxi method of travel (e) Another group of students investigated the spheres of influence of the shopping centres. (i) Which one of the following is the correct definition of sphere of influence? Tick (✓) your choice in the table below. Definition Tick (✓) area surrounding a town or city area served by a town or service area where people have migrated from area next to the CBD area where people go to work [1] (ii) Describe how the students could use the answers to Questions 3 and 4 in the questionnaire (Fig. 1.4 Insert) to investigate the spheres of influence of the two shopping centres. ........................................................................................................................................... ........................................................................................................................................... ........................................................................................................................................... ........................................................................................................................................... ........................................................................................................................................... ........................................................................................................................................... ........................................................................................................................................... .......................................................................................................................................[4] [Total: 30]
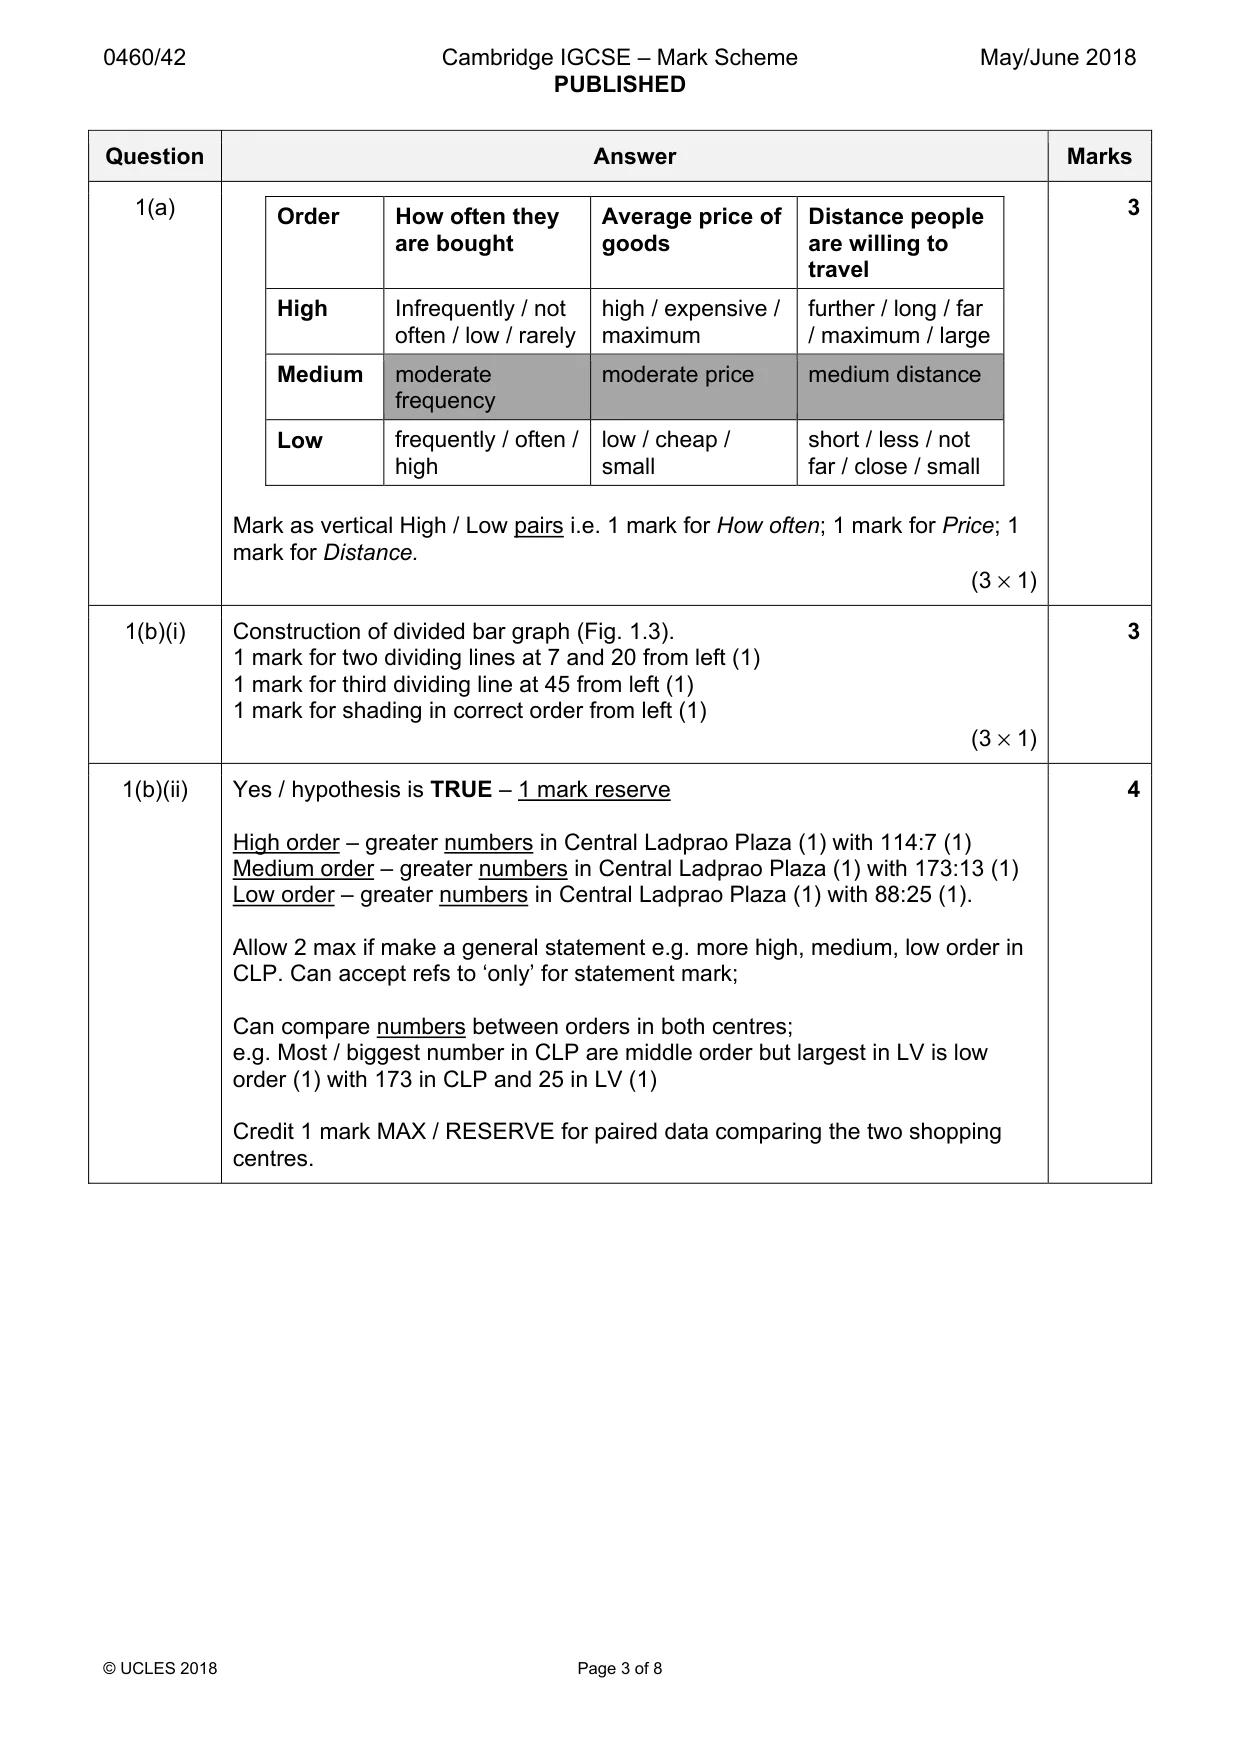
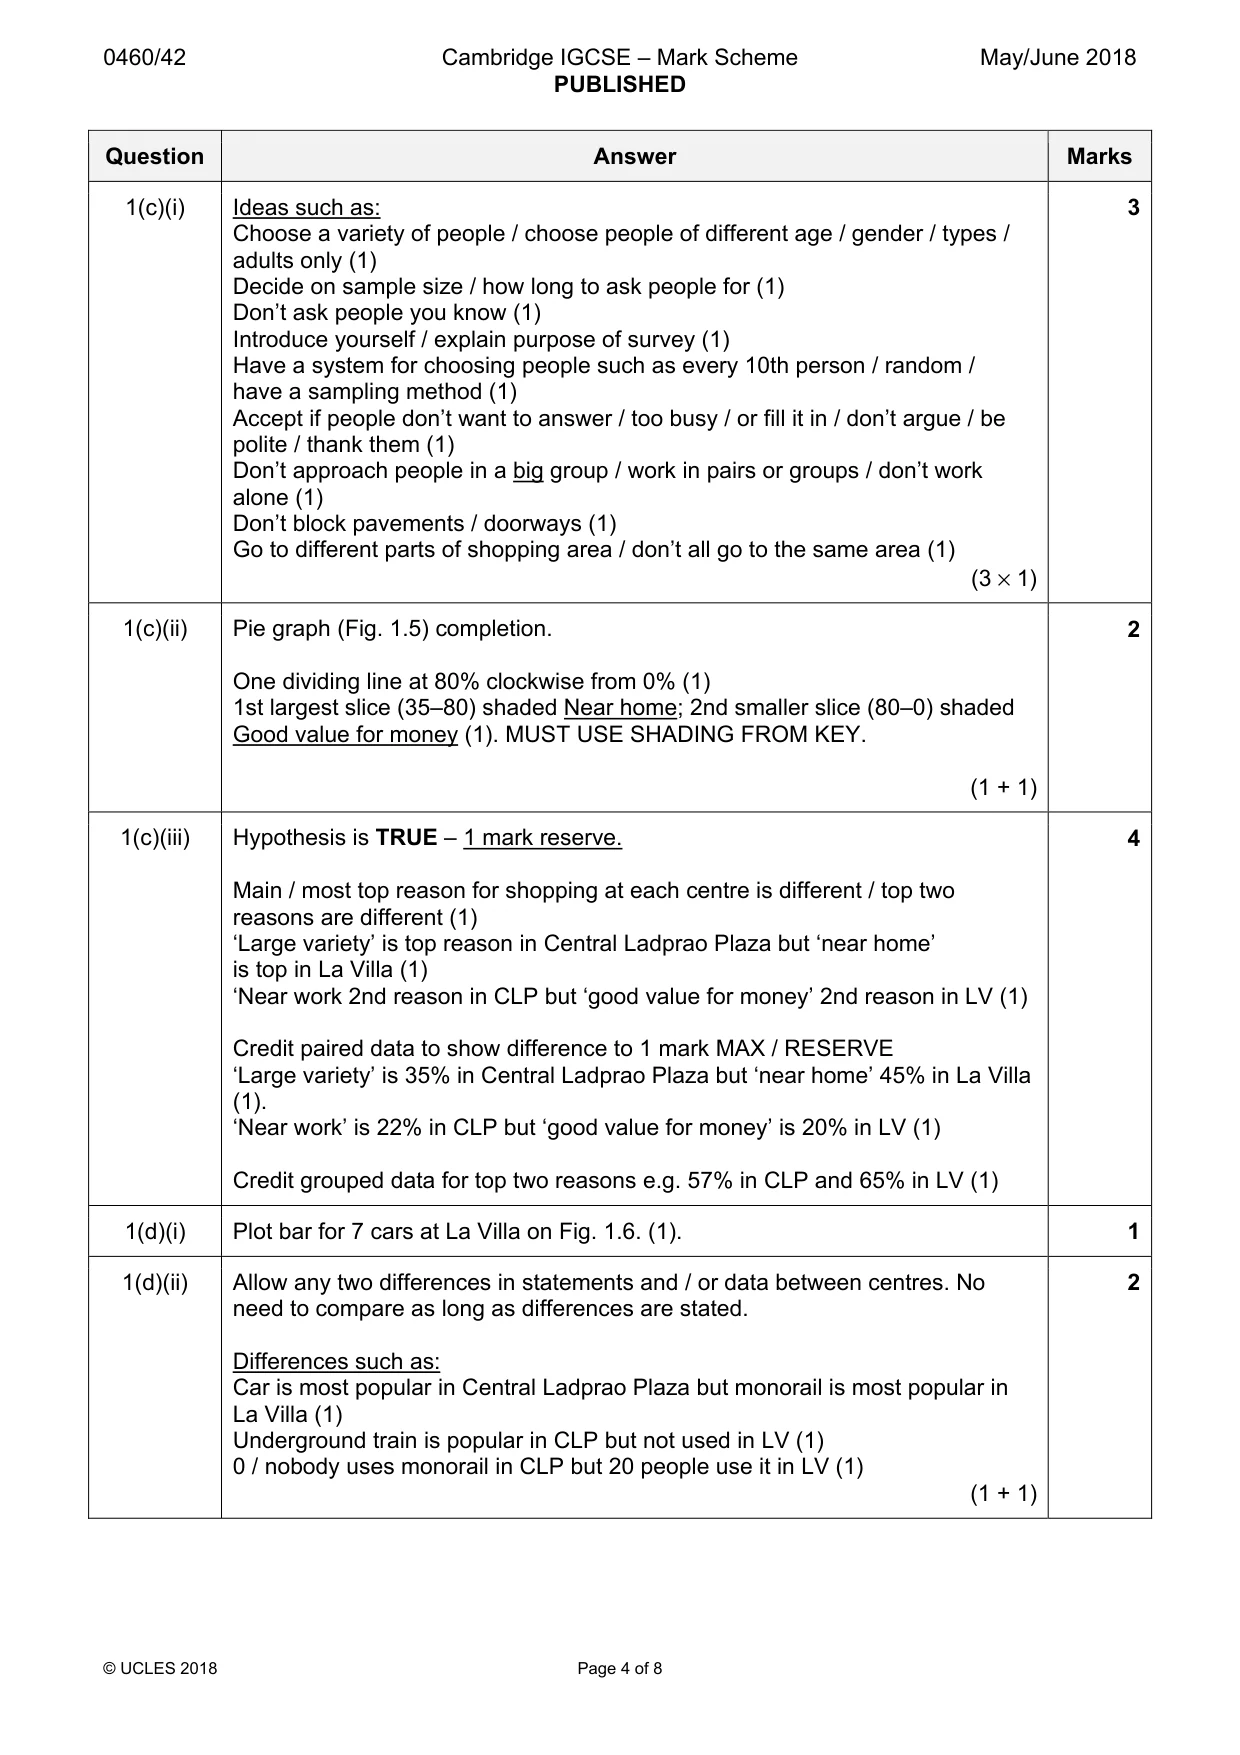
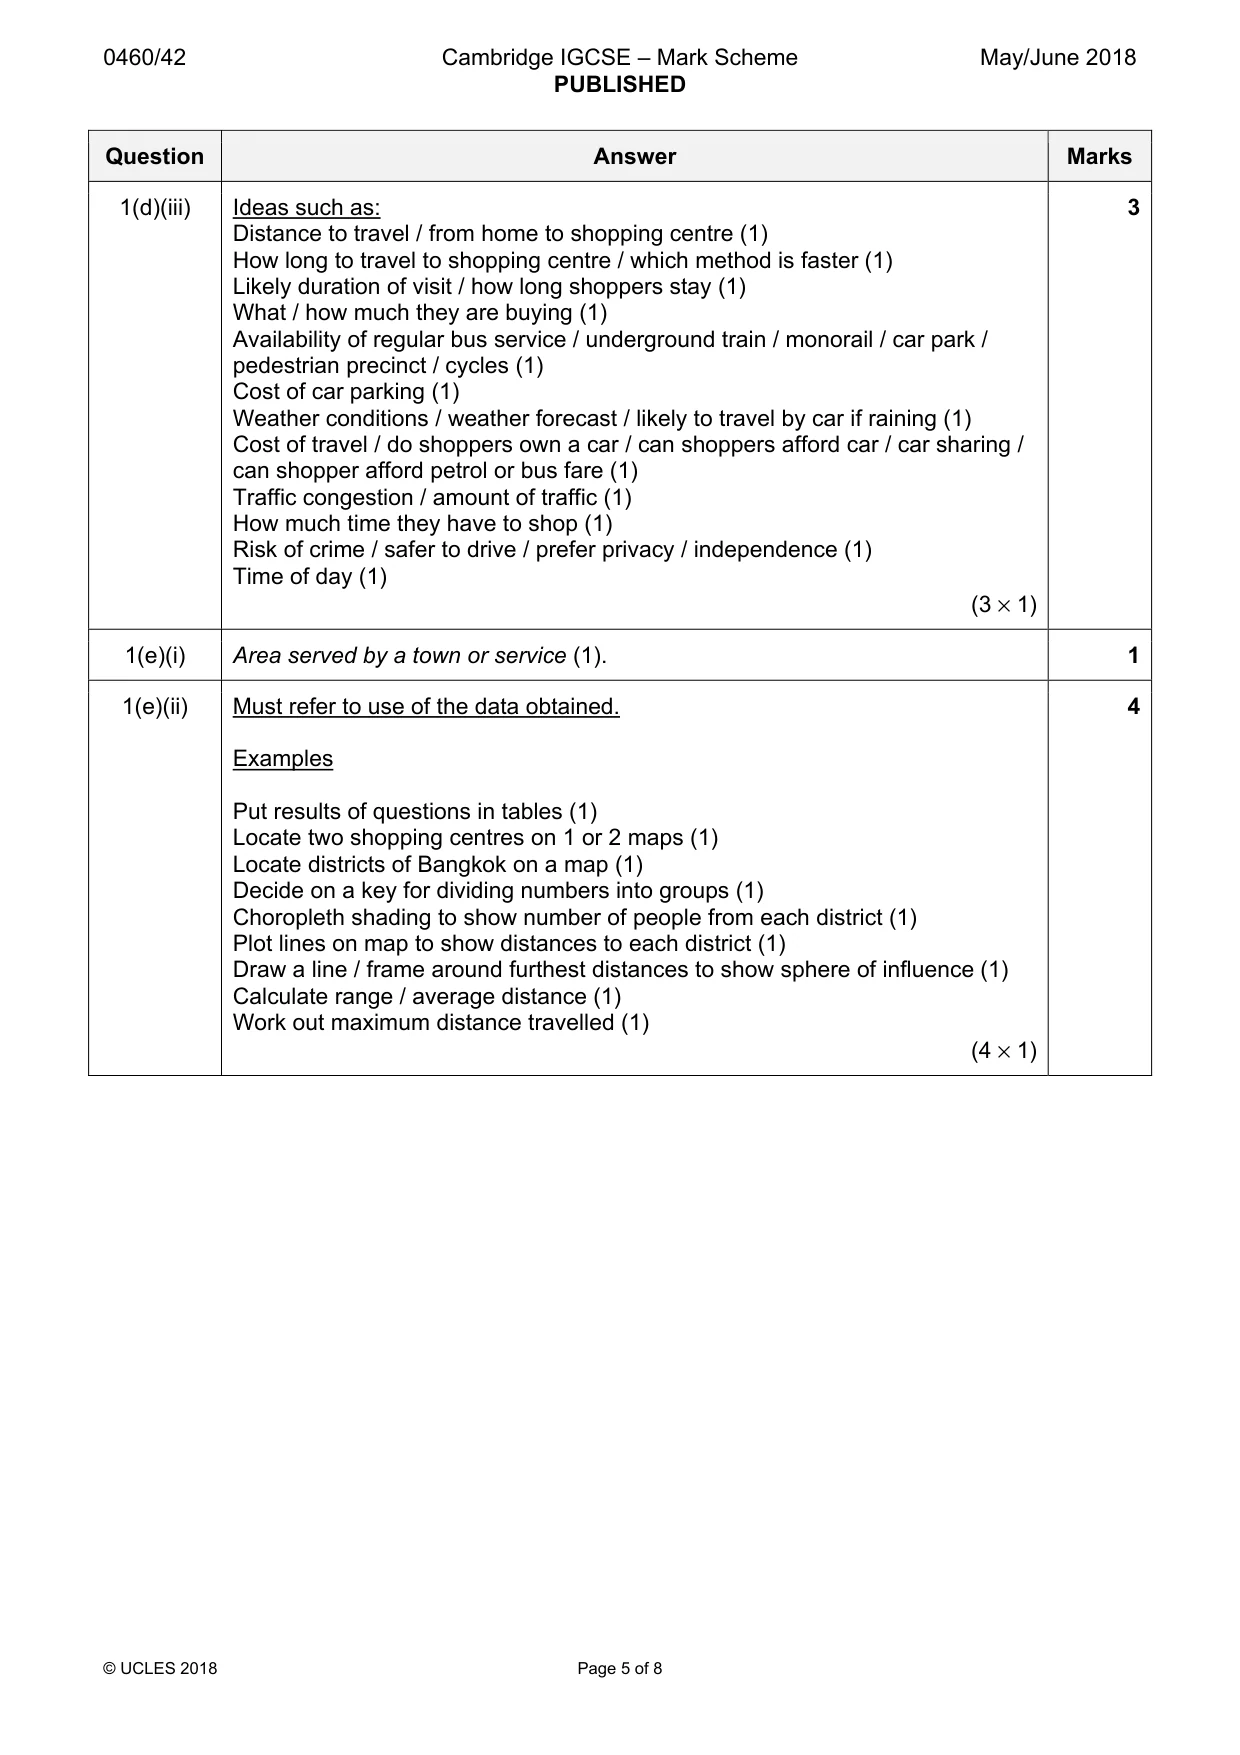
Mark scheme: Question Answer Marks 1(a) 3 Order How often they Average price of Distance people are bought goods are willing to travel High Infrequently / not high / expensive / further / long / far often / low / rarely maximum / maximum / large Medium moderate moderate price medium distance frequency Low frequently / often / low / cheap / short / less / not high small far / close / small Mark as vertical High / Low pairs i.e. 1 mark for How often; 1 mark for Price; 1 mark for Distance. (3 × 1) 1(b)(i) Construction of divided bar graph (Fig. 1.3). 3 1 mark for two dividing lines at 7 and 20 from left (1) 1 mark for third dividing line at 45 from left (1) 1 mark for shading in correct order from left (1) (3 × 1) 1(b)(ii) Yes / hypothesis is TRUE – 1 mark reserve 4 High order – greater numbers in Central Ladprao Plaza (1) with 114:7 (1) Medium order – greater numbers in Central Ladprao Plaza (1) with 173:13 (1) Low order – greater numbers in Central Ladprao Plaza (1) with 88:25 (1). Allow 2 max if make a general statement e.g. more high, medium, low order in CLP. Can accept refs to ‘only’ for statement mark; Can compare numbers between orders in both centres; e.g. Most / biggest number in CLP are middle order but largest in LV is low order (1) with 173 in CLP and 25 in LV (1) Credit 1 mark MAX / RESERVE for paired data comparing the two shopping centres. 1(c)(i) Ideas such as: 3 Choose a variety of people / choose people of different age / gender / types / adults only (1) Decide on sample size / how long to ask people for (1) Don’t ask people you know (1) Introduce yourself / explain purpose of survey (1) Have a system for choosing people such as every 10th person / random / have a sampling method (1) Accept if people don’t want to answer / too busy / or fill it in / don’t argue / be polite / thank them (1) Don’t approach people in a big group / work in pairs or groups / don’t work alone (1) Don’t block pavements / doorways (1) Go to different parts of shopping area / don’t all go to the same area (1) (3 × 1) 1(c)(ii) Pie graph (Fig. 1.5) completion. 2 One dividing line at 80% clockwise from 0% (1) 1st largest slice (35–80) shaded Near home; 2nd smaller slice (80–0) shaded Good value for money (1). MUST USE SHADING FROM KEY. (1 + 1) 1(c)(iii) Hypothesis is TRUE – 1 mark reserve. 4 Main / most top reason for shopping at each centre is different / top two reasons are different (1) ‘Large variety’ is top reason in Central Ladprao Plaza but ‘near home’ is top in La Villa (1) ‘Near work 2nd reason in CLP but ‘good value for money’ 2nd reason in LV (1) Credit paired data to show difference to 1 mark MAX / RESERVE ‘Large variety’ is 35% in Central Ladprao Plaza but ‘near home’ 45% in La Villa (1). ‘Near work’ is 22% in CLP but ‘good value for money’ is 20% in LV (1) Credit grouped data for top two reasons e.g. 57% in CLP and 65% in LV (1) 1(d)(i) Plot bar for 7 cars at La Villa on Fig. 1.6. (1). 1 1(d)(ii) Allow any two differences in statements and / or data between centres. No 2 need to compare as long as differences are stated. Differences such as: Car is most popular in Central Ladprao Plaza but monorail is most popular in La Villa (1) Underground train is popular in CLP but not used in LV (1) 0 / nobody uses monorail in CLP but 20 people use it in LV (1) (1 + 1) 1(d)(iii) Ideas such as: 3 Distance to travel / from home to shopping centre (1) How long to travel to shopping centre / which method is faster (1) Likely duration of visit / how long shoppers stay (1) What / how much they are buying (1) Availability of regular bus service / underground train / monorail / car park / pedestrian precinct / cycles (1) Cost of car parking (1) Weather conditions / weather forecast / likely to travel by car if raining (1) Cost of travel / do shoppers own a car / can shoppers afford car / car sharing / can shopper afford petrol or bus fare (1) Traffic congestion / amount of traffic (1) How much time they have to shop (1) Risk of crime / safer to drive / prefer privacy / independence (1) Time of day (1) (3 × 1) 1(e)(i) Area served by a town or service (1). 1 1(e)(ii) Must refer to use of the data obtained. 4 Examples Put results of questions in tables (1) Locate two shopping centres on 1 or 2 maps (1) Locate districts of Bangkok on a map (1) Decide on a key for dividing numbers into groups (1) Choropleth shading to show number of people from each district (1) Plot lines on map to show distances to each district (1) Draw a line / frame around furthest distances to show sphere of influence (1) Calculate range / average distance (1) Work out maximum distance travelled (1) (4 × 1)
More questions on Settlements (rural and urban) and service provision
Q2 · Students at a school in England did fieldwork on a local river
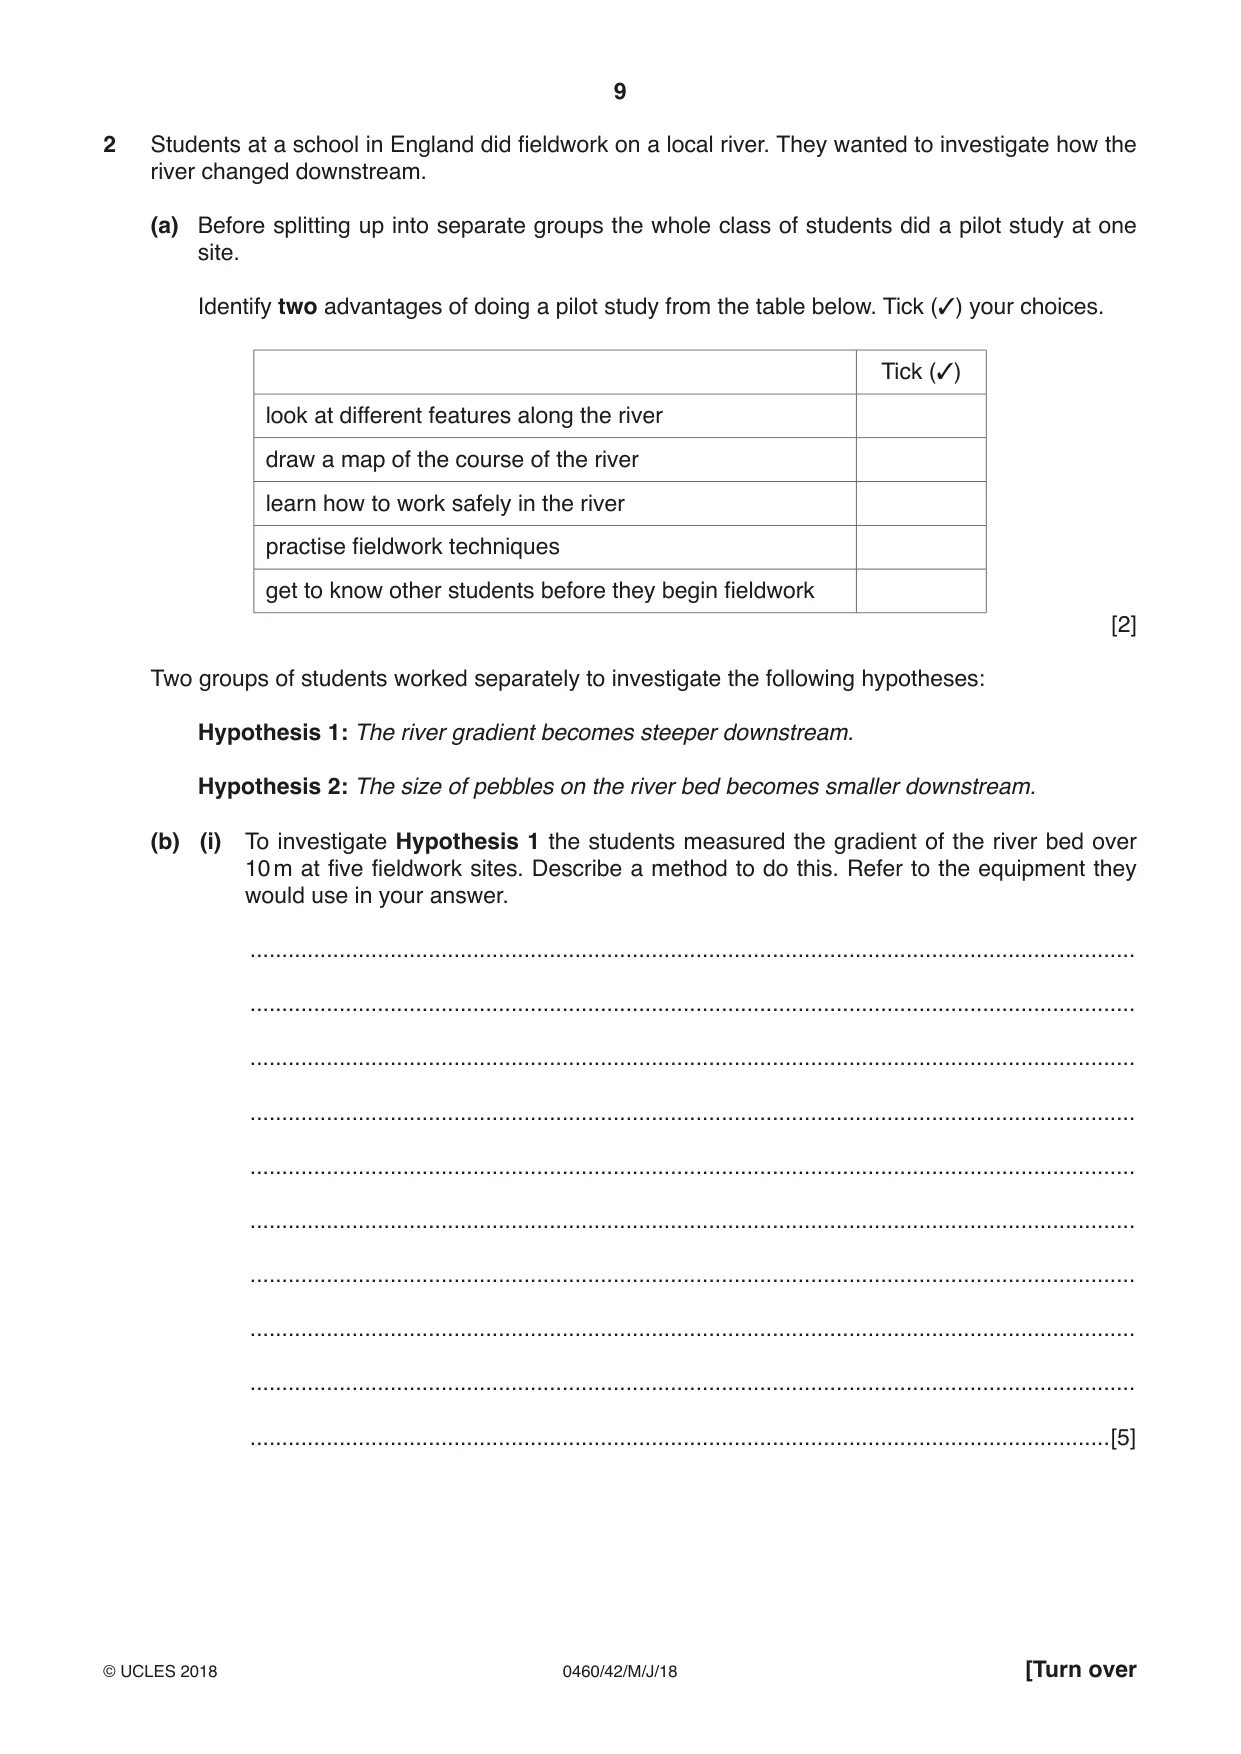
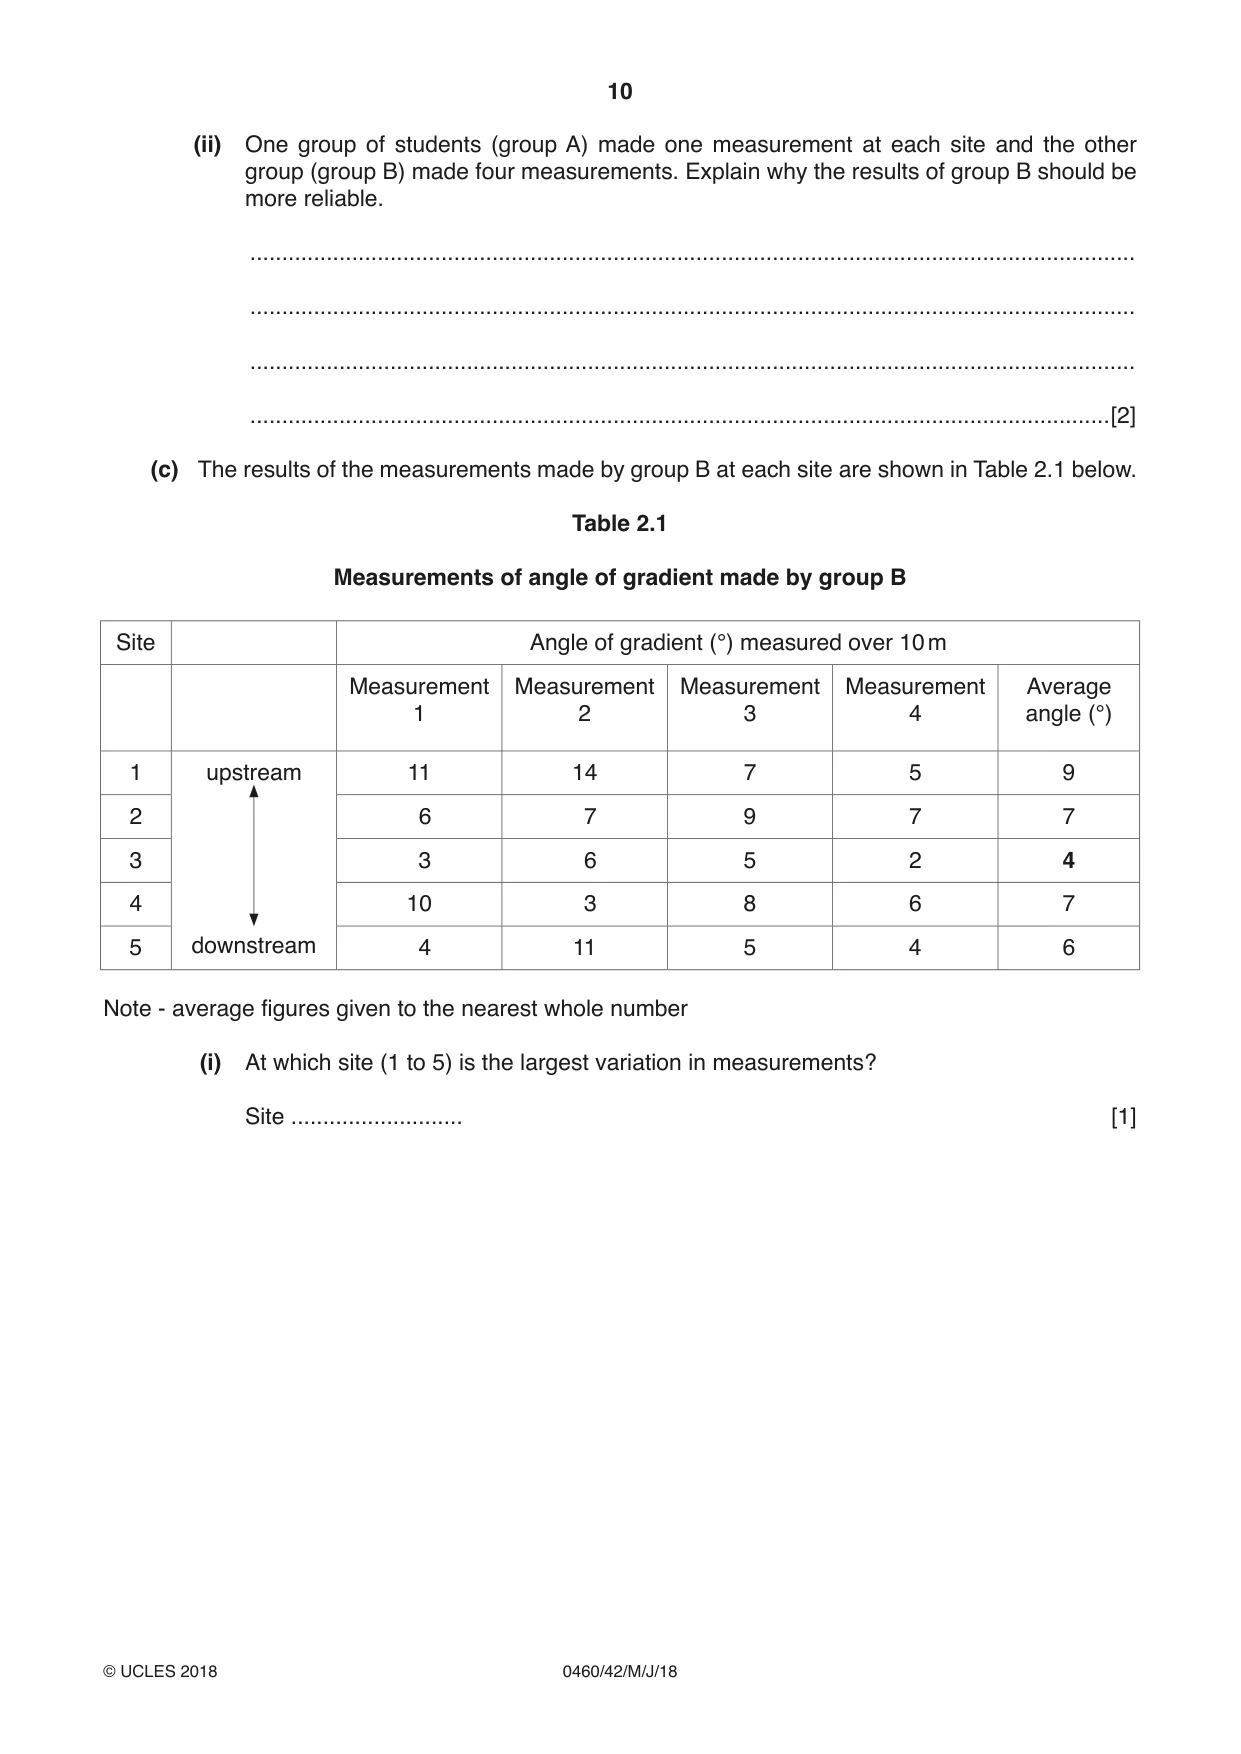
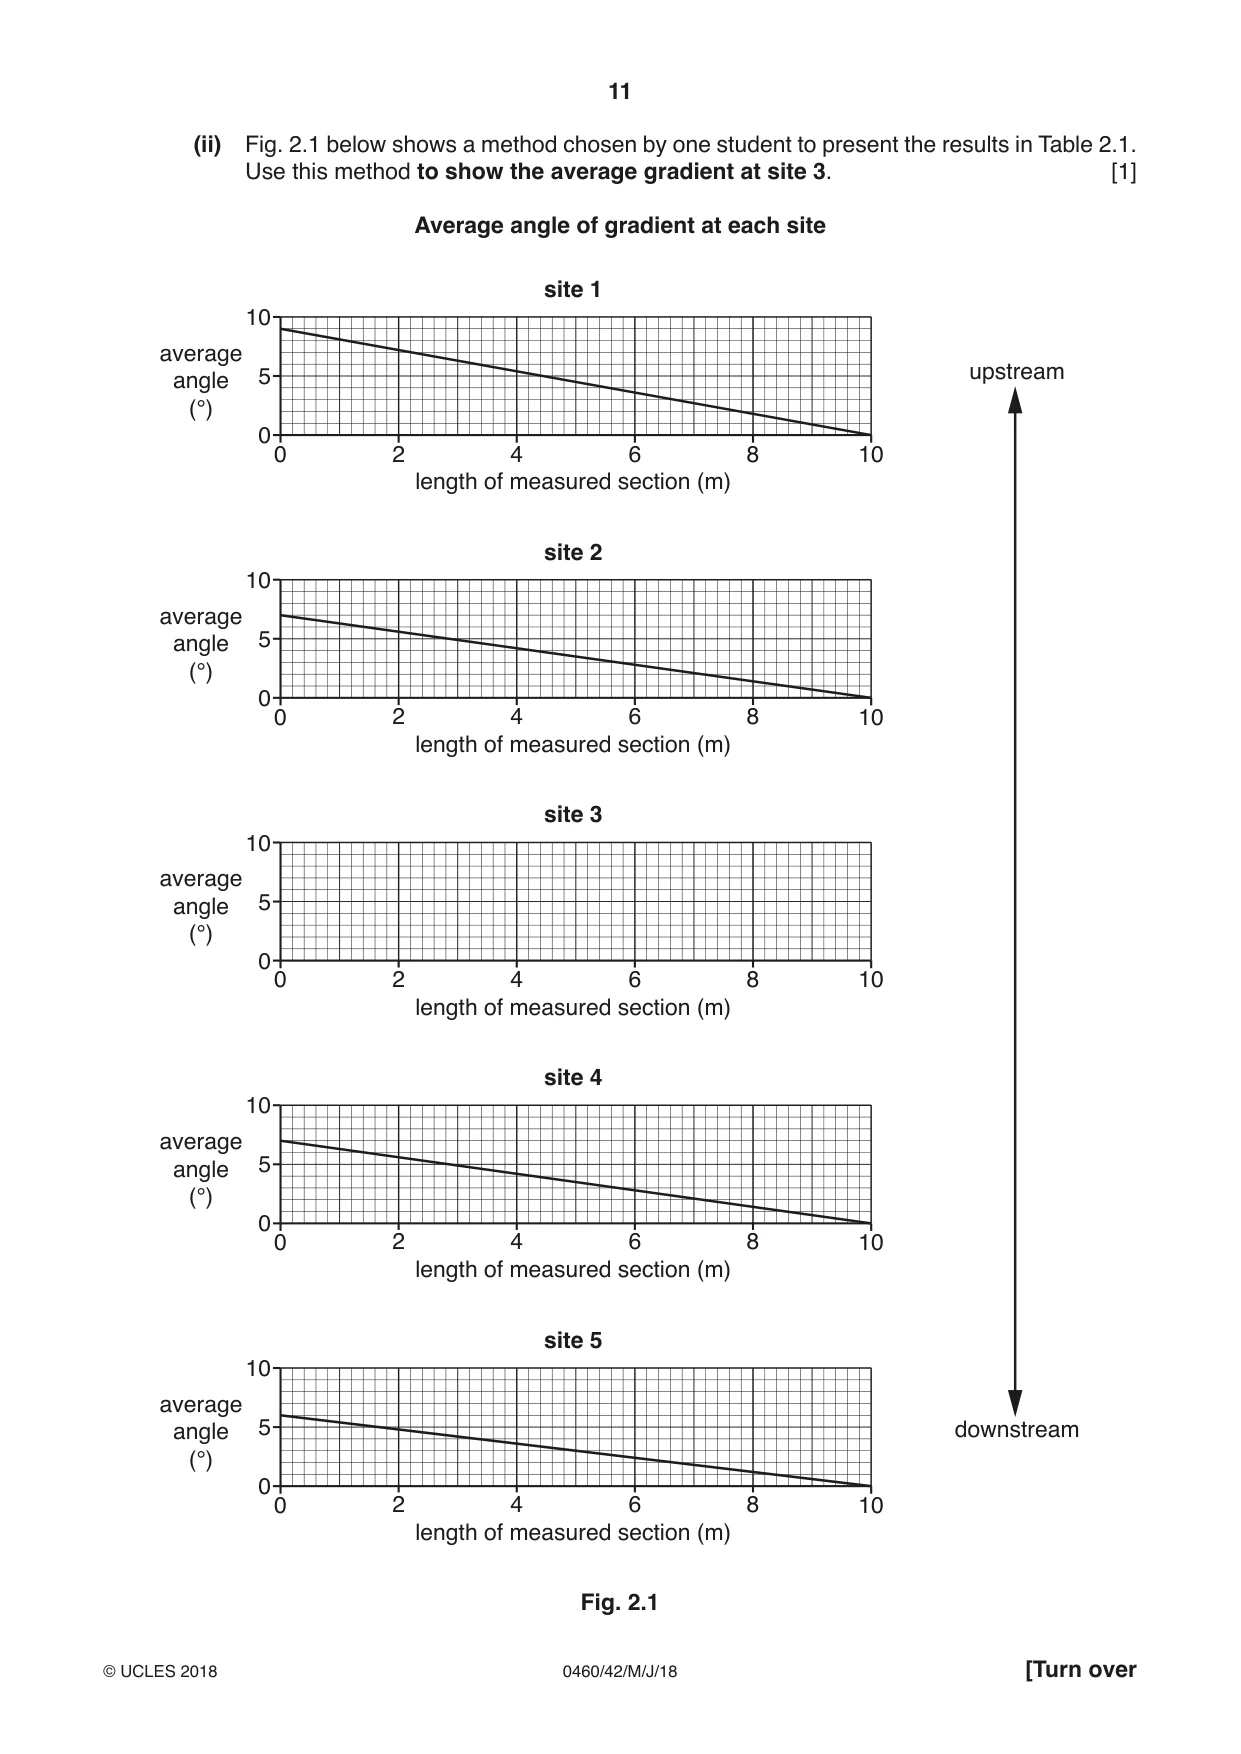
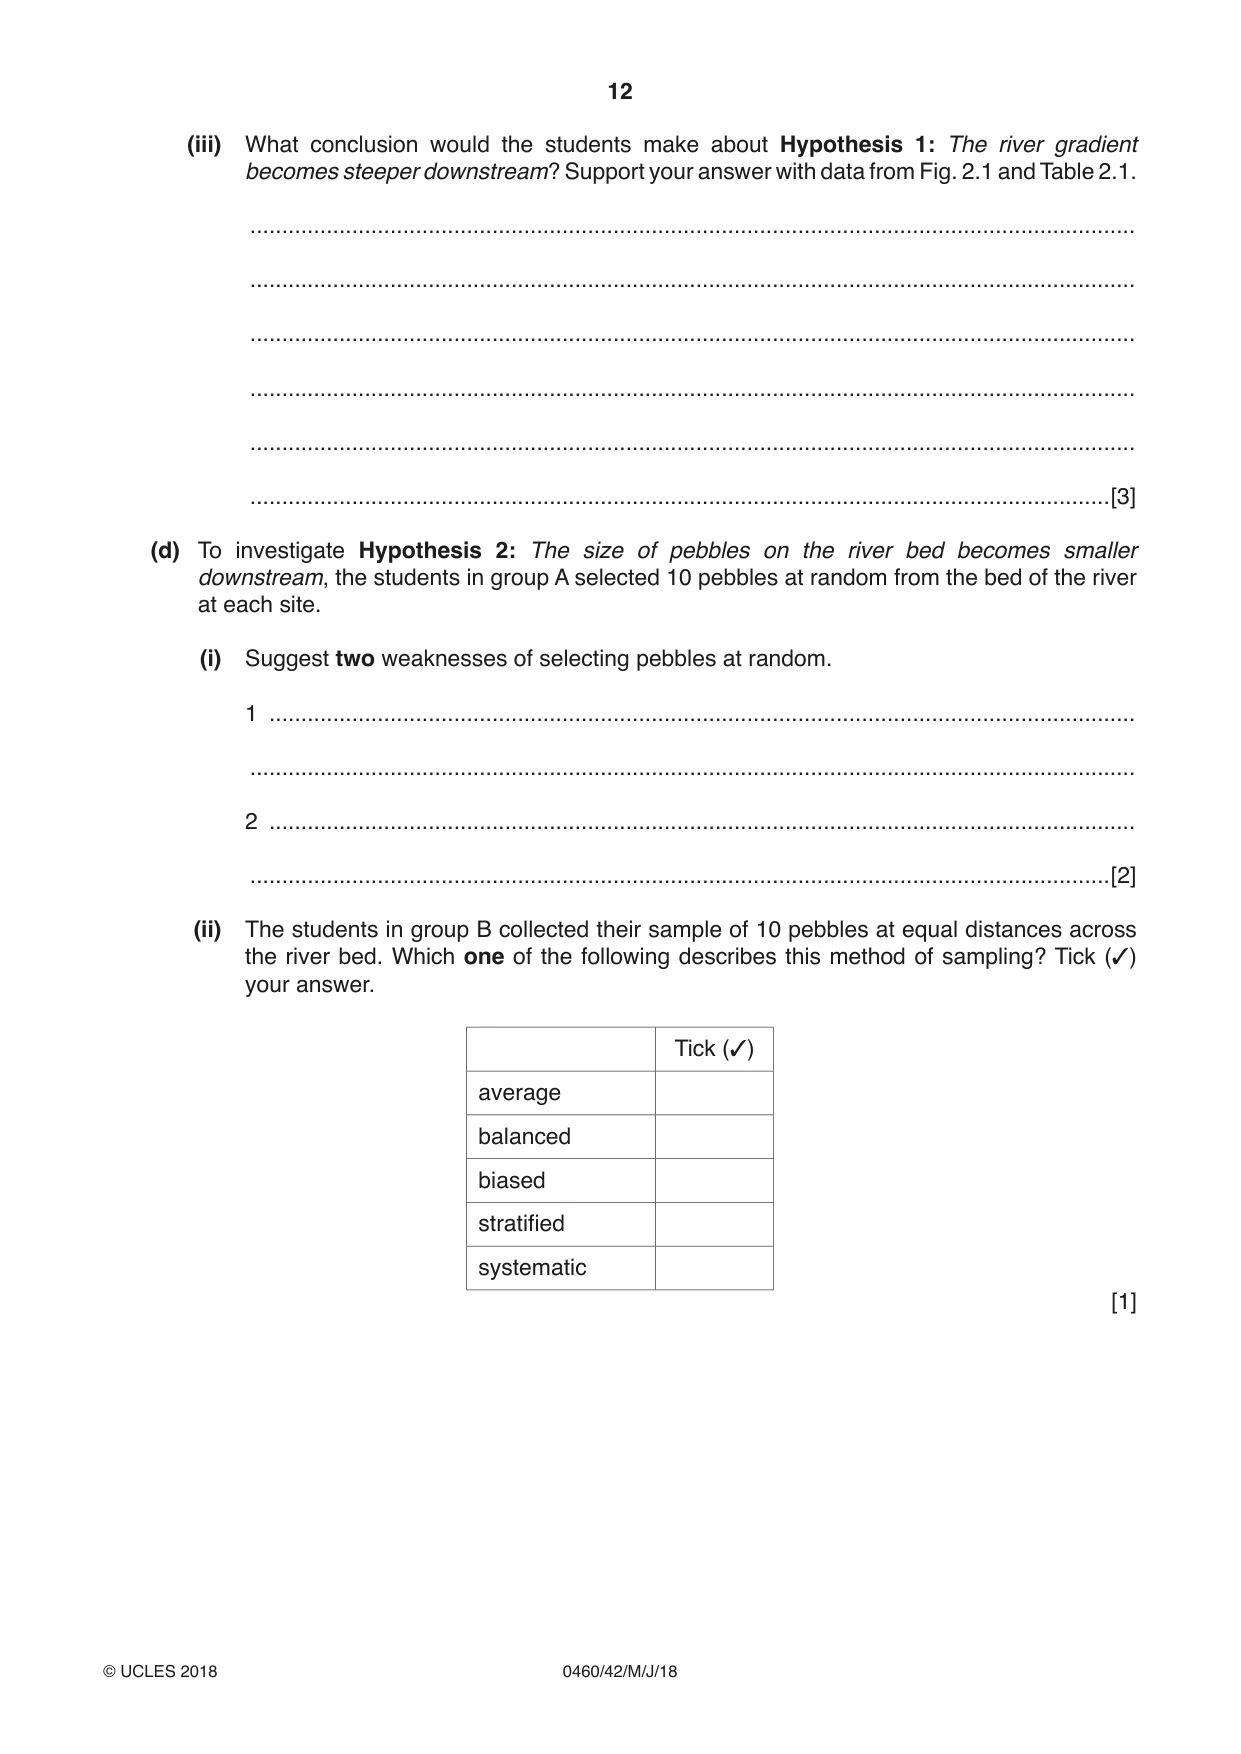
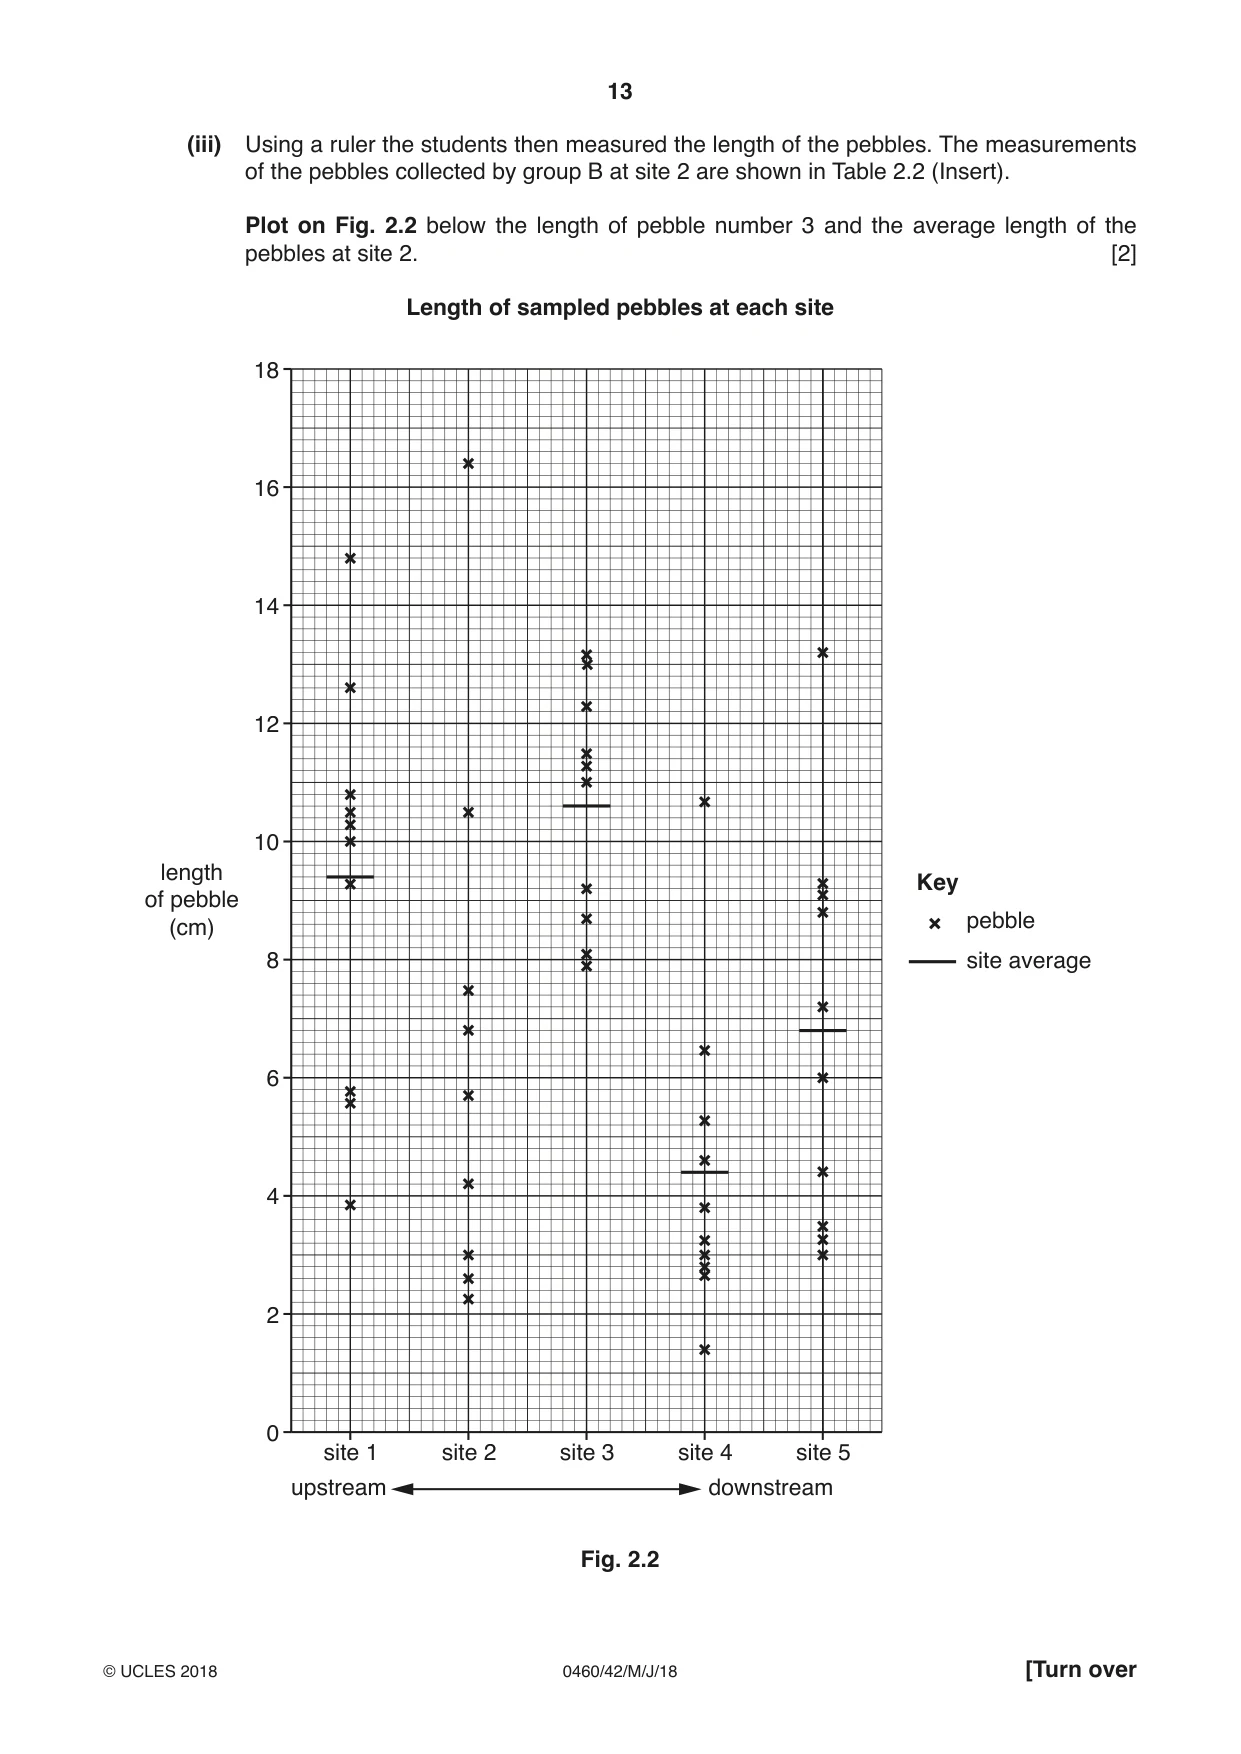
2 Students at a school in England did fieldwork on a local river. They wanted to investigate how the river changed downstream. (a) Before splitting up into separate groups the whole class of students did a pilot study at one site. Identify two advantages of doing a pilot study from the table below. Tick (✓) your choices. Tick (✓) look at different features along the river draw a map of the course of the river learn how to work safely in the river practise fieldwork techniques get to know other students before they begin fieldwork [2] Two groups of students worked separately to investigate the following hypotheses: Hypothesis 1: The river gradient becomes steeper downstream. Hypothesis 2: The size of pebbles on the river bed becomes smaller downstream. (b) (i) To investigate Hypothesis 1 the students measured the gradient of the river bed over 10 m at five fieldwork sites. Describe a method to do this. Refer to the equipment they would use in your answer. ........................................................................................................................................... ........................................................................................................................................... ........................................................................................................................................... ........................................................................................................................................... ........................................................................................................................................... ........................................................................................................................................... ........................................................................................................................................... ........................................................................................................................................... ........................................................................................................................................... .......................................................................................................................................[5] (ii) One group of students (group A) made one measurement at each site and the other group (group B) made four measurements. Explain why the results of group B should be more reliable. ........................................................................................................................................... ........................................................................................................................................... ........................................................................................................................................... .......................................................................................................................................[2] (c) The results of the measurements made by group B at each site are shown in Table 2.1 below. Table 2.1 Measurements of angle of gradient made by group B Site Angle of gradient (°) measured over 10 m Measurement Measurement Measurement Measurement Average 1 2 3 4 angle (°) 1 upstream 11 14 7 5 9 2 6 7 9 7 7 3 3 6 5 2 4 4 10 3 8 6 7 5 downstream 4 11 5 4 6 Note - average figures given to the nearest whole number (i) At which site (1 to 5) is the largest variation in measurements? Site ........................... [1] (ii) Fig. 2.1 below shows a method chosen by one student to present the results in Table 2.1. Use this method to show the average gradient at site 3. [1] Average angle of gradient at each site site 1 10 average angle 5 upstream (°) 0 0 2 4 6 8 10 length of measured section (m) site 2 10 average angle 5 (°) 0 0 2 4 6 8 10 length of measured section (m) site 3 10 average angle 5 (°) 0 0 2 4 6 8 10 length of measured section (m) site 4 10 average angle 5 (°) 0 0 2 4 6 8 10 length of measured section (m) site 5 10 average angle 5 downstream (°) 0 0 2 4 6 8 10 length of measured section (m) Fig. 2.1
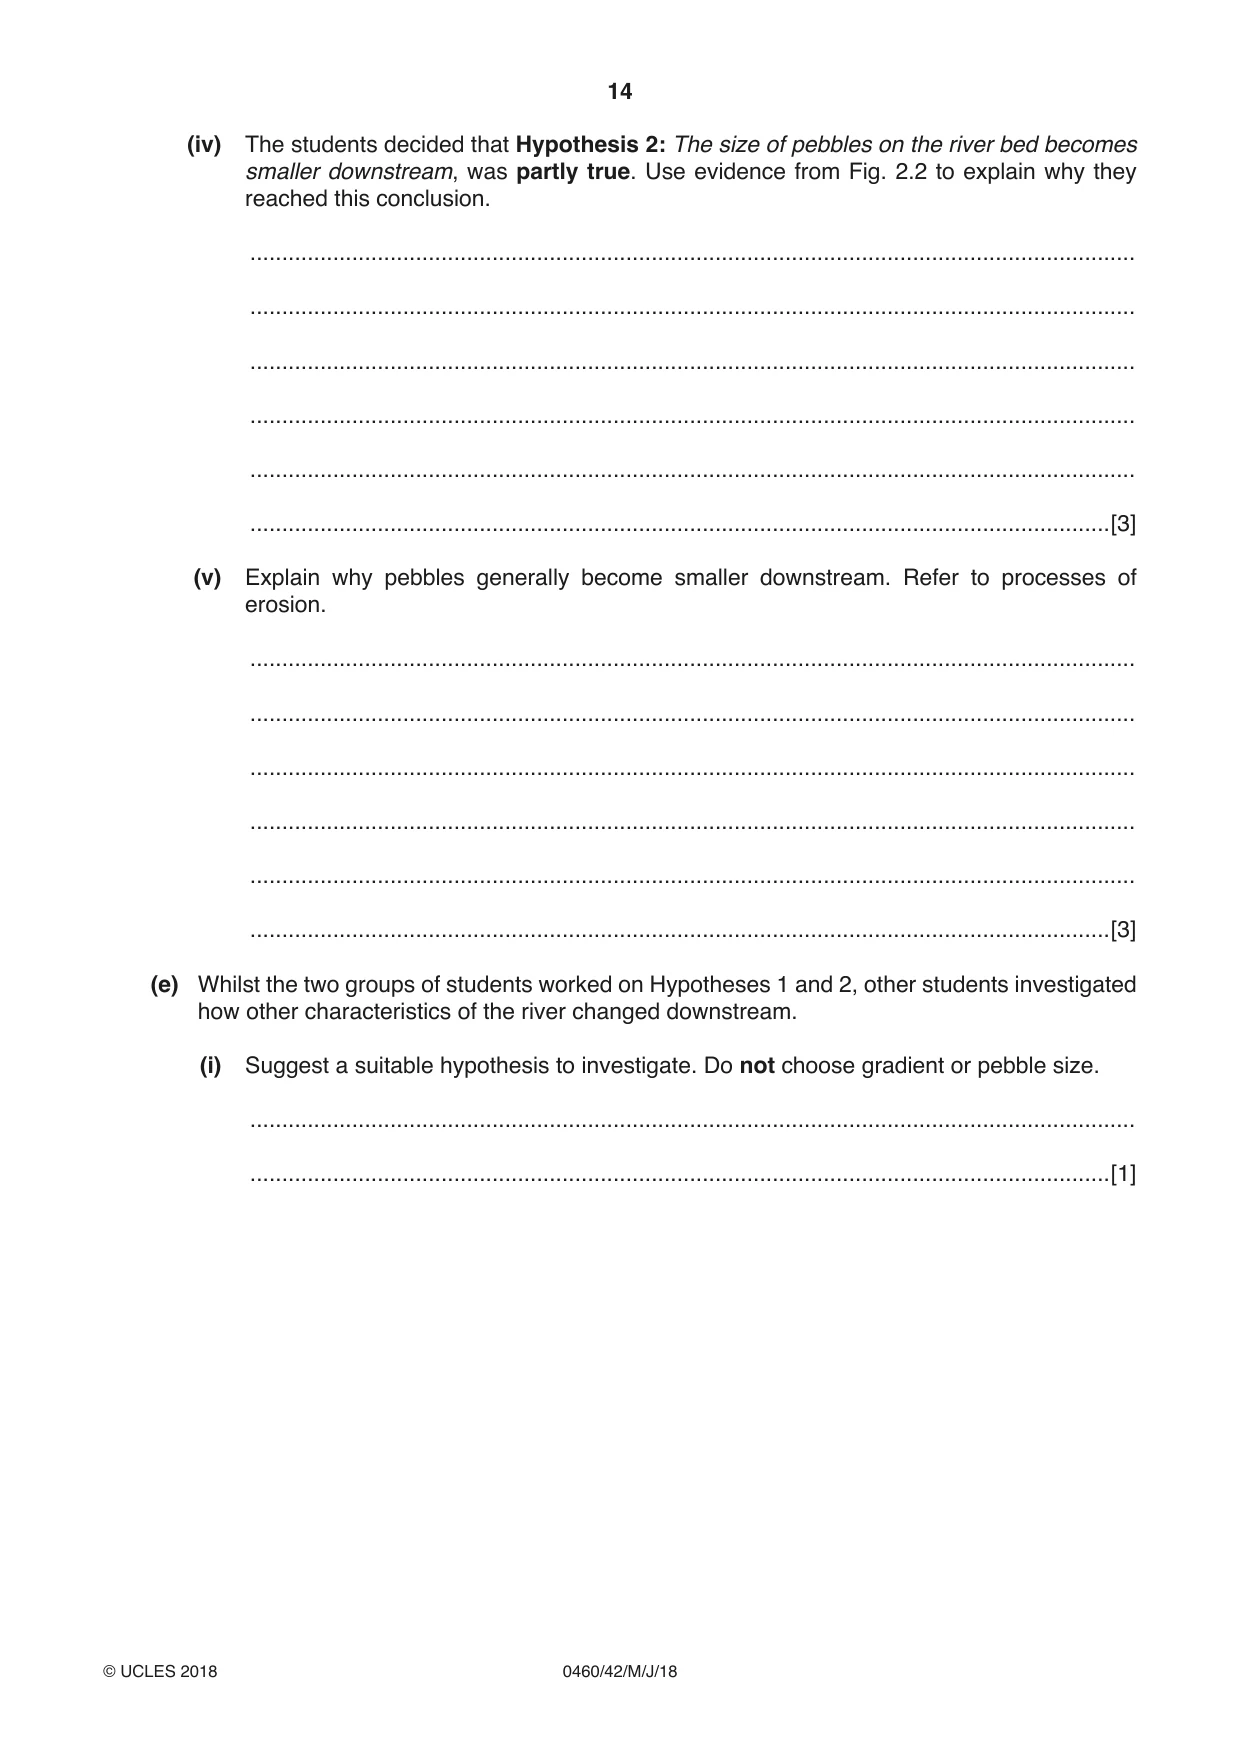
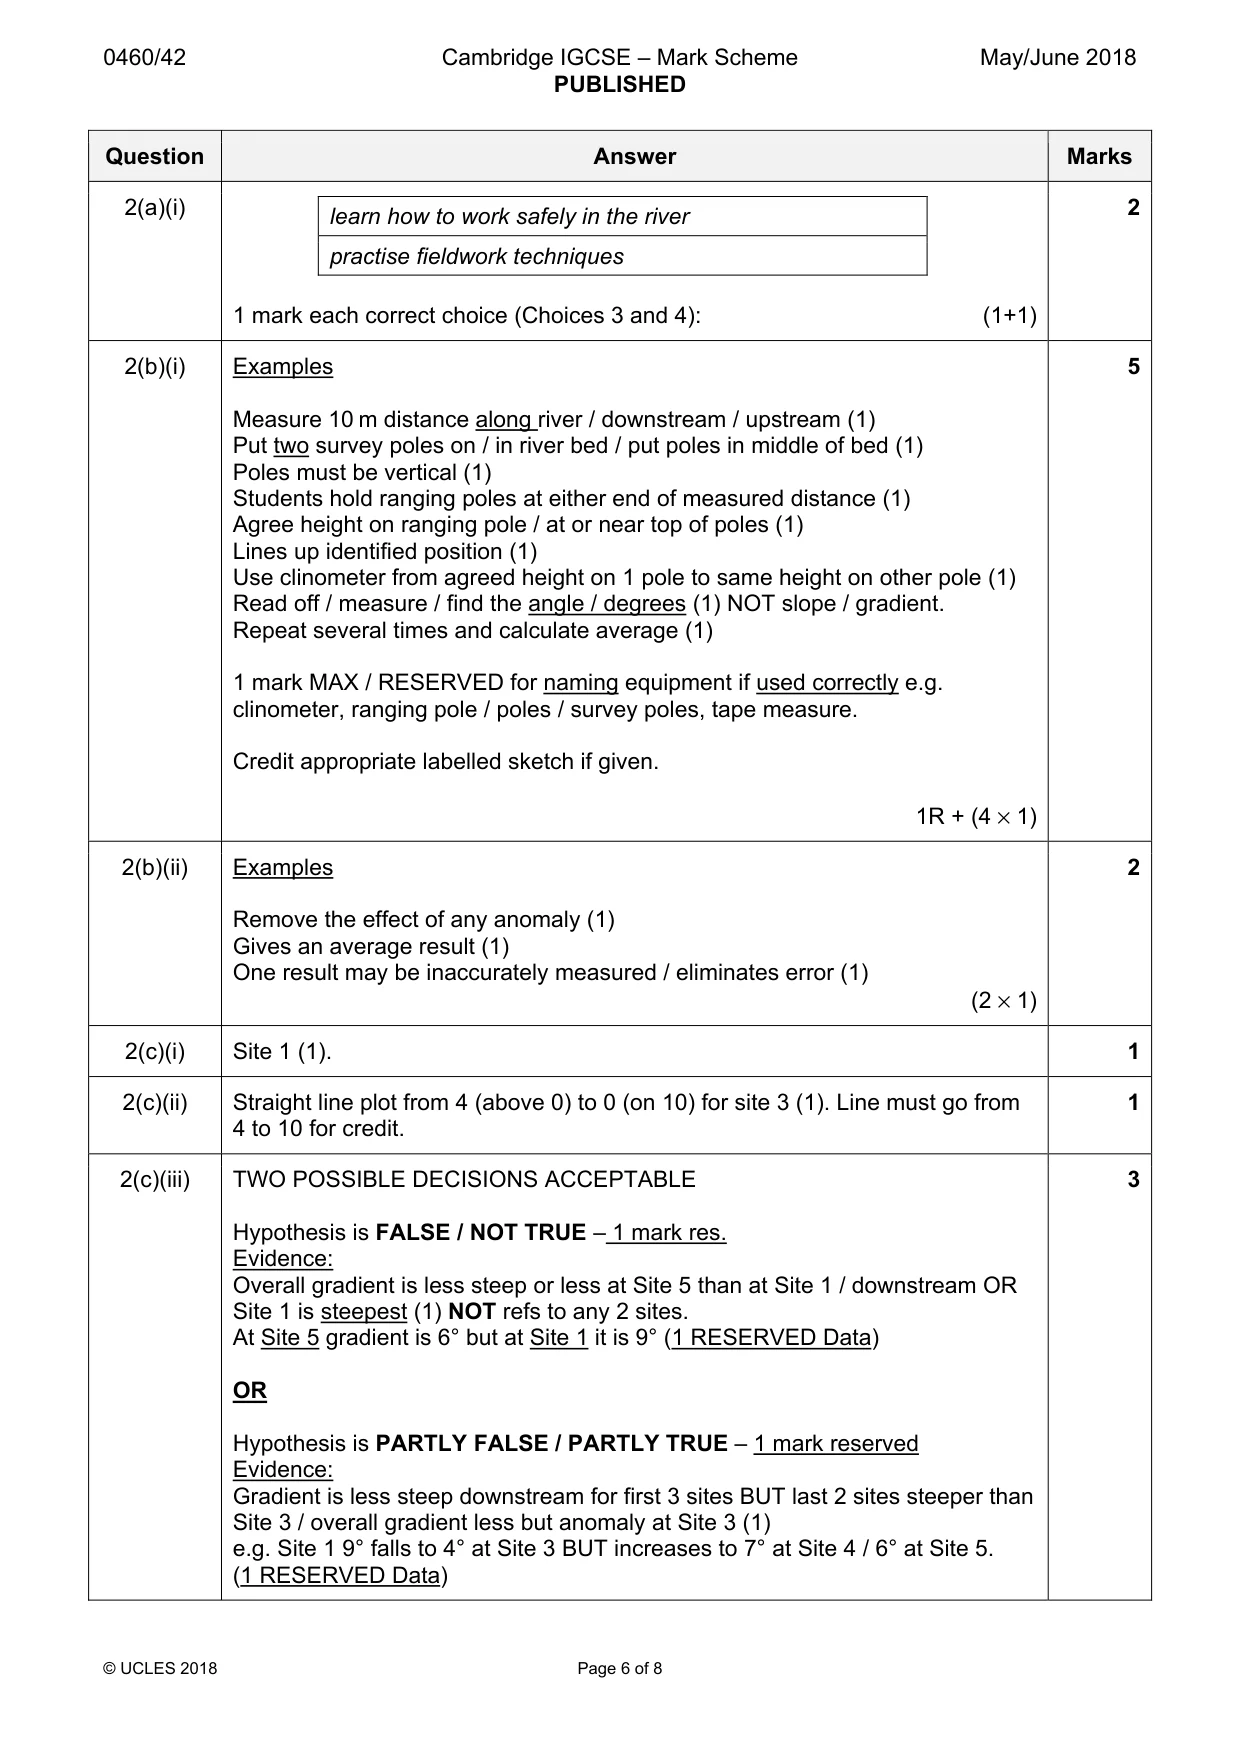
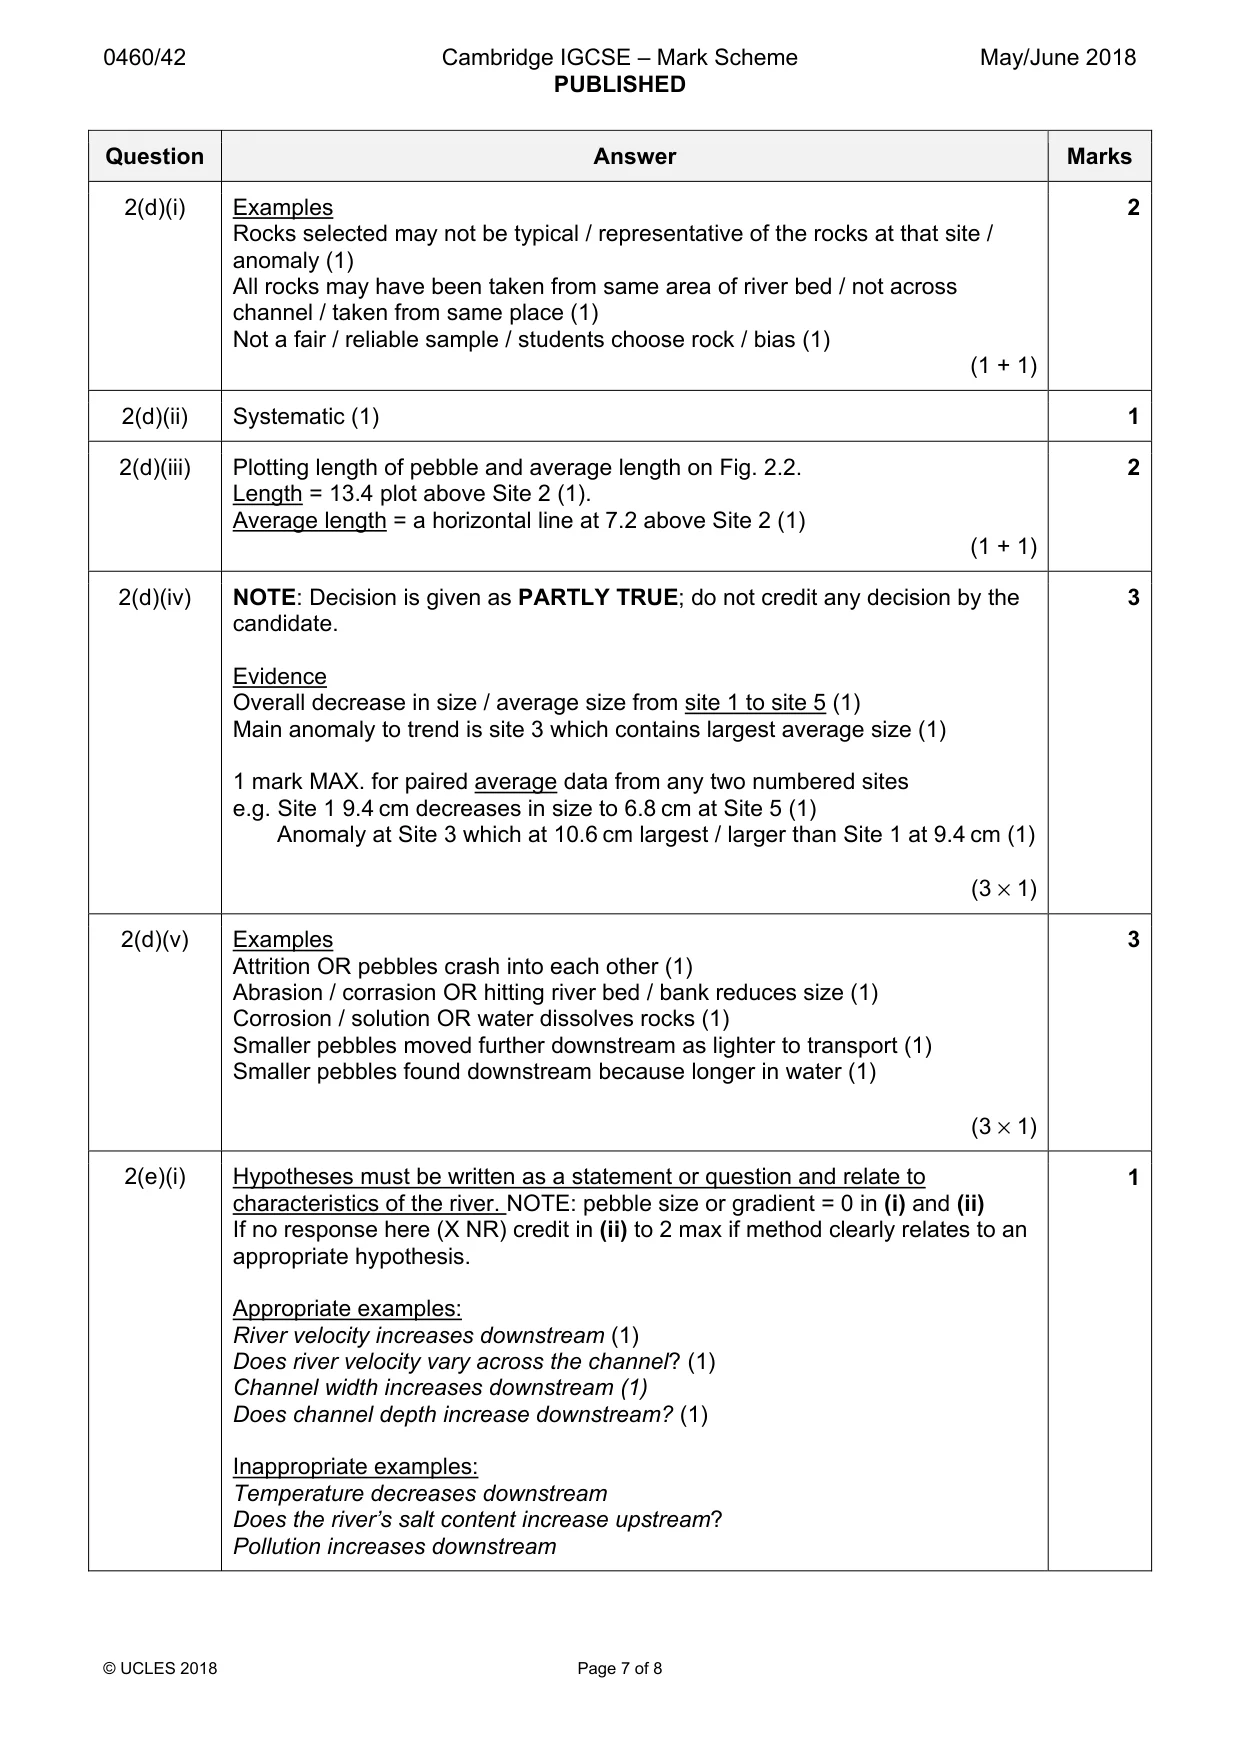
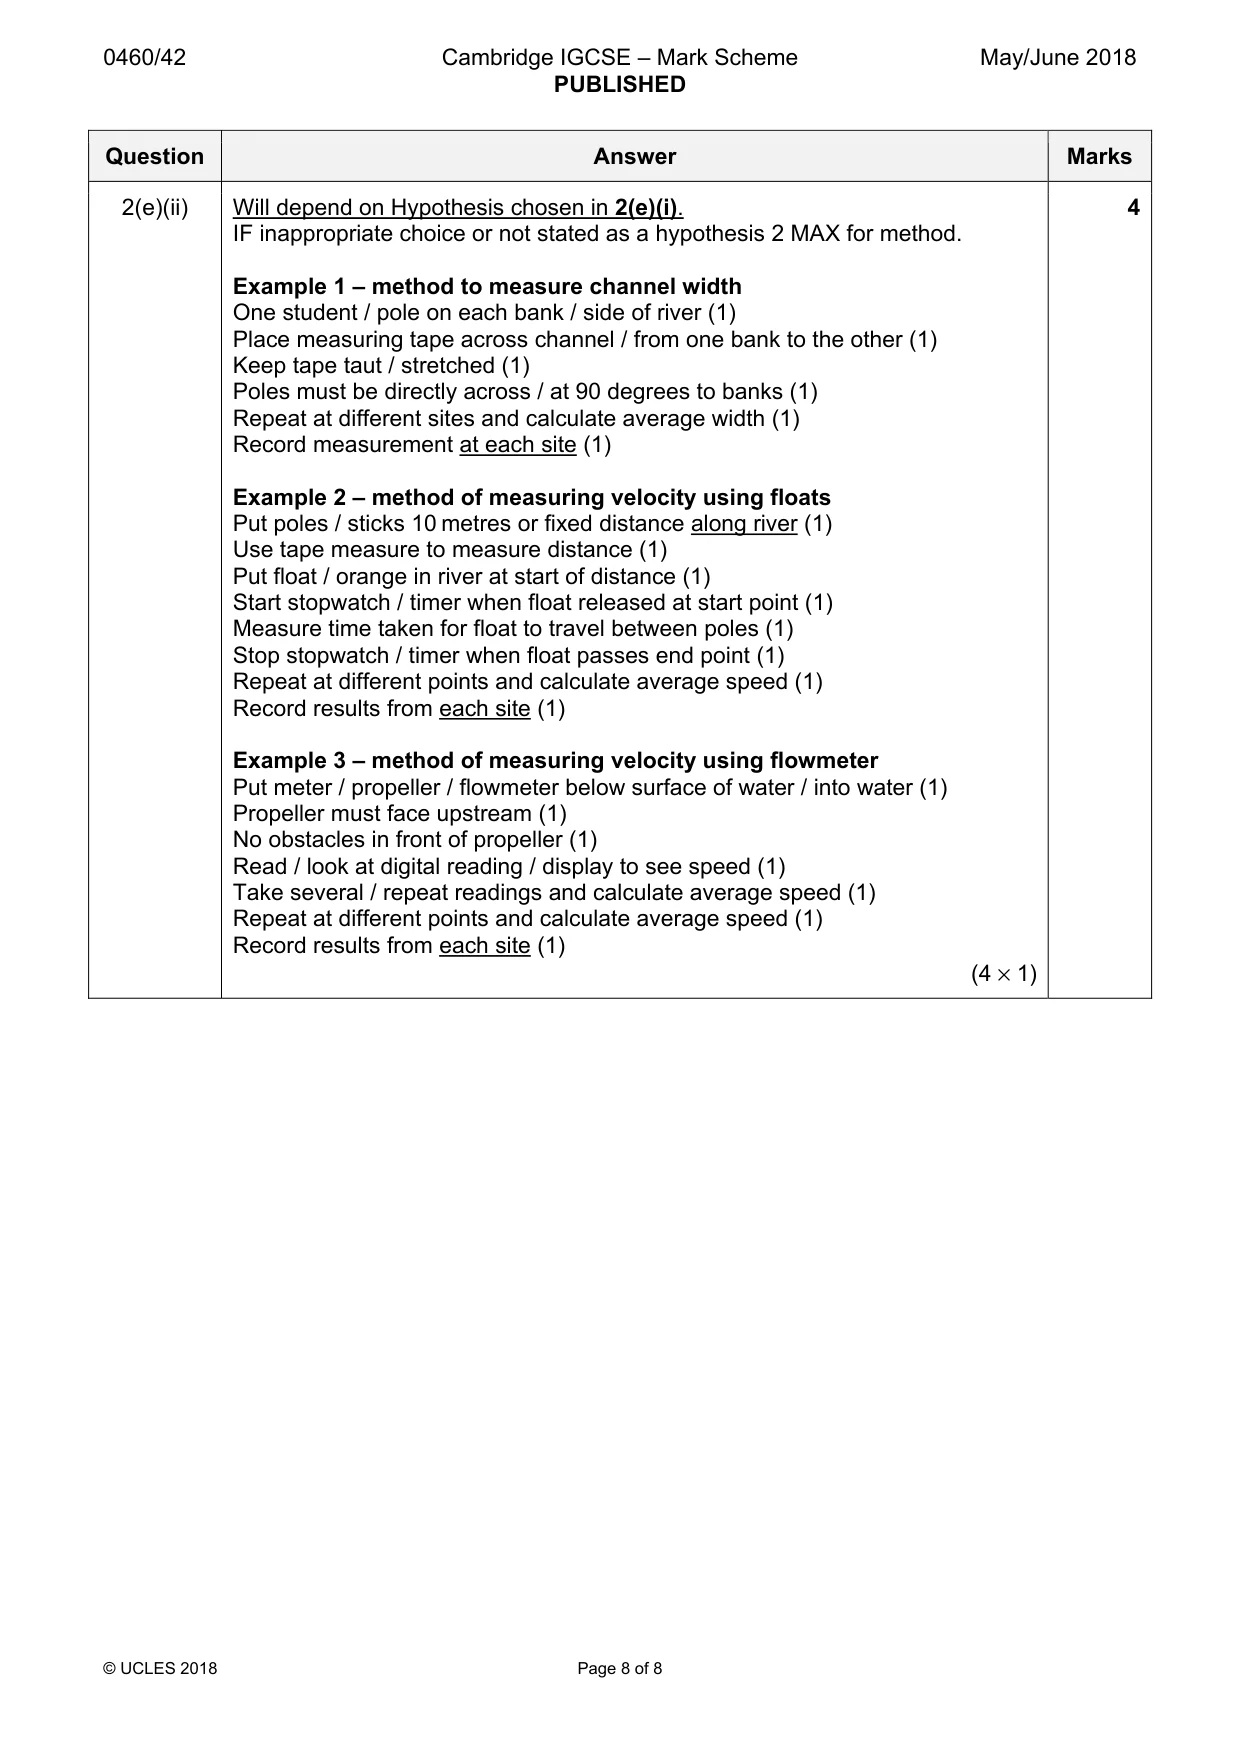
Mark scheme: 2(a)(i) 2 learn how to work safely in the river practise fieldwork techniques 1 mark each correct choice (Choices 3 and 4): (1+1) 2(b)(i) Examples 5 Measure 10 m distance along river / downstream / upstream (1) Put two survey poles on / in river bed / put poles in middle of bed (1) Poles must be vertical (1) Students hold ranging poles at either end of measured distance (1) Agree height on ranging pole / at or near top of poles (1) Lines up identified position (1) Use clinometer from agreed height on 1 pole to same height on other pole (1) Read off / measure / find the angle / degrees (1) NOT slope / gradient. Repeat several times and calculate average (1) 1 mark MAX / RESERVED for naming equipment if used correctly e.g. clinometer, ranging pole / poles / survey poles, tape measure. Credit appropriate labelled sketch if given. 1R + (4 × 1) 2(b)(ii) Examples 2 Remove the effect of any anomaly (1) Gives an average result (1) One result may be inaccurately measured / eliminates error (1) (2 × 1) 2(c)(i) Site 1 (1). 1 2(c)(ii) Straight line plot from 4 (above 0) to 0 (on 10) for site 3 (1). Line must go from 1 4 to 10 for credit. 2(c)(iii) TWO POSSIBLE DECISIONS ACCEPTABLE 3 Hypothesis is FALSE / NOT TRUE – 1 mark res. Evidence: Overall gradient is less steep or less at Site 5 than at Site 1 / downstream OR Site 1 is steepest (1) NOT refs to any 2 sites. At Site 5 gradient is 6° but at Site 1 it is 9° (1 RESERVED Data) OR Hypothesis is PARTLY FALSE / PARTLY TRUE – 1 mark reserved Evidence: Gradient is less steep downstream for first 3 sites BUT last 2 sites steeper than Site 3 / overall gradient less but anomaly at Site 3 (1) e.g. Site 1 9° falls to 4° at Site 3 BUT increases to 7° at Site 4 / 6° at Site 5. (1 RESERVED Data) 2(d)(i) Examples 2 Rocks selected may not be typical / representative of the rocks at that site / anomaly (1) All rocks may have been taken from same area of river bed / not across channel / taken from same place (1) Not a fair / reliable sample / students choose rock / bias (1) (1 + 1) 2(d)(ii) Systematic (1) 1 2(d)(iii) Plotting length of pebble and average length on Fig. 2.2. 2 Length = 13.4 plot above Site 2 (1). Average length = a horizontal line at 7.2 above Site 2 (1) (1 + 1) 2(d)(iv) NOTE: Decision is given as PARTLY TRUE; do not credit any decision by the 3 candidate. Evidence Overall decrease in size / average size from site 1 to site 5 (1) Main anomaly to trend is site 3 which contains largest average size (1) 1 mark MAX. for paired average data from any two numbered sites e.g. Site 1 9.4 cm decreases in size to 6.8 cm at Site 5 (1) Anomaly at Site 3 which at 10.6 cm largest / larger than Site 1 at 9.4 cm (1) (3 × 1) 2(d)(v) Examples 3 Attrition OR pebbles crash into each other (1) Abrasion / corrasion OR hitting river bed / bank reduces size (1) Corrosion / solution OR water dissolves rocks (1) Smaller pebbles moved further downstream as lighter to transport (1) Smaller pebbles found downstream because longer in water (1) (3 × 1) 2(e)(i) Hypotheses must be written as a statement or question and relate to 1 characteristics of the river. NOTE: pebble size or gradient = 0 in (i) and (ii) If no response here (X NR) credit in (ii) to 2 max if method clearly relates to an appropriate hypothesis. Appropriate examples: River velocity increases downstream (1) Does river velocity vary across the channel? (1) Channel width increases downstream (1) Does channel depth increase downstream? (1) Inappropriate examples: Temperature decreases downstream Does the river’s salt content increase upstream? Pollution increases downstream 2(e)(ii) Will depend on Hypothesis chosen in 2(e)(i). 4 IF inappropriate choice or not stated as a hypothesis 2 MAX for method. Example 1 – method to measure channel width One student / pole on each bank / side of river (1) Place measuring tape across channel / from one bank to the other (1) Keep tape taut / stretched (1) Poles must be directly across / at 90 degrees to banks (1) Repeat at different sites and calculate average width (1) Record measurement at each site (1) Example 2 – method of measuring velocity using floats Put poles / sticks 10 metres or fixed distance along river (1) Use tape measure to measure distance (1) Put float / orange in river at start of distance (1) Start stopwatch / timer when float released at start point (1) Measure time taken for float to travel between poles (1) Stop stopwatch / timer when float passes end point (1) Repeat at different points and calculate average speed (1) Record results from each site (1) Example 3 – method of measuring velocity using flowmeter Put meter / propeller / flowmeter below surface of water / into water (1) Propeller must face upstream (1) No obstacles in front of propeller (1) Read / look at digital reading / display to see speed (1) Take several / repeat readings and calculate average speed (1) Repeat at different points and calculate average speed (1) Record results from each site (1) (4 × 1)
What was in this paper
The subtopics covered by these 2 questions, and how many questions each got. Open one in a new tab to see every Cambridge question on it.
What you needed in this session
Cambridge’s own grade thresholds for 2018 May/June, Paper 4 · Variant 2. A higher threshold means an easier paper — the bar moves with how the cohort did.